WO2022044335A1 - モデル生成プログラム、モデル生成方法及びモデル生成装置 - Google Patents
モデル生成プログラム、モデル生成方法及びモデル生成装置 Download PDFInfo
- Publication number
- WO2022044335A1 WO2022044335A1 PCT/JP2020/032941 JP2020032941W WO2022044335A1 WO 2022044335 A1 WO2022044335 A1 WO 2022044335A1 JP 2020032941 W JP2020032941 W JP 2020032941W WO 2022044335 A1 WO2022044335 A1 WO 2022044335A1
- Authority
- WO
- WIPO (PCT)
- Prior art keywords
- data
- model
- threshold value
- values
- machine learning
- Prior art date
- Legal status (The legal status is an assumption and is not a legal conclusion. Google has not performed a legal analysis and makes no representation as to the accuracy of the status listed.)
- Ceased
Links
Images


Classifications
-
- G—PHYSICS
- G06—COMPUTING OR CALCULATING; COUNTING
- G06N—COMPUTING ARRANGEMENTS BASED ON SPECIFIC COMPUTATIONAL MODELS
- G06N3/00—Computing arrangements based on biological models
- G06N3/02—Neural networks
- G06N3/08—Learning methods
-
- G—PHYSICS
- G06—COMPUTING OR CALCULATING; COUNTING
- G06F—ELECTRIC DIGITAL DATA PROCESSING
- G06F40/00—Handling natural language data
- G06F40/40—Processing or translation of natural language
- G06F40/55—Rule-based translation
- G06F40/56—Natural language generation
-
- G—PHYSICS
- G06—COMPUTING OR CALCULATING; COUNTING
- G06N—COMPUTING ARRANGEMENTS BASED ON SPECIFIC COMPUTATIONAL MODELS
- G06N20/00—Machine learning
-
- G—PHYSICS
- G06—COMPUTING OR CALCULATING; COUNTING
- G06N—COMPUTING ARRANGEMENTS BASED ON SPECIFIC COMPUTATIONAL MODELS
- G06N3/00—Computing arrangements based on biological models
- G06N3/02—Neural networks
- G06N3/04—Architecture, e.g. interconnection topology
-
- G—PHYSICS
- G06—COMPUTING OR CALCULATING; COUNTING
- G06N—COMPUTING ARRANGEMENTS BASED ON SPECIFIC COMPUTATIONAL MODELS
- G06N3/00—Computing arrangements based on biological models
- G06N3/02—Neural networks
- G06N3/08—Learning methods
- G06N3/082—Learning methods modifying the architecture, e.g. adding, deleting or silencing nodes or connections
-
- G—PHYSICS
- G06—COMPUTING OR CALCULATING; COUNTING
- G06N—COMPUTING ARRANGEMENTS BASED ON SPECIFIC COMPUTATIONAL MODELS
- G06N5/00—Computing arrangements using knowledge-based models
- G06N5/01—Dynamic search techniques; Heuristics; Dynamic trees; Branch-and-bound
-
- G—PHYSICS
- G06—COMPUTING OR CALCULATING; COUNTING
- G06N—COMPUTING ARRANGEMENTS BASED ON SPECIFIC COMPUTATIONAL MODELS
- G06N5/00—Computing arrangements using knowledge-based models
- G06N5/04—Inference or reasoning models
- G06N5/045—Explanation of inference; Explainable artificial intelligence [XAI]; Interpretable artificial intelligence
-
- G—PHYSICS
- G06—COMPUTING OR CALCULATING; COUNTING
- G06N—COMPUTING ARRANGEMENTS BASED ON SPECIFIC COMPUTATIONAL MODELS
- G06N7/00—Computing arrangements based on specific mathematical models
- G06N7/01—Probabilistic graphical models, e.g. probabilistic networks
-
- G—PHYSICS
- G06—COMPUTING OR CALCULATING; COUNTING
- G06N—COMPUTING ARRANGEMENTS BASED ON SPECIFIC COMPUTATIONAL MODELS
- G06N20/00—Machine learning
- G06N20/10—Machine learning using kernel methods, e.g. support vector machines [SVM]
Definitions
- the present invention relates to a model generation technique.
- a linear regression model g when explaining the classification result output by the machine learning model f to which the data x is input, a linear regression model g whose output locally approximates the output of the machine learning model f in the vicinity of the data x is used.
- the machine learning model f is generated as an interpretable model.
- the neighborhood data z obtained by varying a part of the feature amount of the data x is used.
- One aspect is to provide a model generation program, a model generation method, and a model generation device for generating a linear regression model using neighborhood data uniformly distributed with respect to the original data.
- the model generation program of one aspect modifies the first data to generate a plurality of data, calculates a plurality of values indicating the distance between the first data and each of the plurality of data, and calculates the plurality of values. Based on the value, it is determined whether or not the value indicating the uniformity of the distribution of the distance between the first data and each of the plurality of data is equal to or greater than the threshold value, and the value indicating the uniformity is equal to or greater than the threshold value. If it is determined that the data is, the result obtained by inputting the plurality of data into the machine learning model is used as the objective variable, and the plurality of data are used as the explanatory variables to generate a linear regression model. Let me.
- FIG. 1 is a block diagram showing an example of a functional configuration of the server device according to the first embodiment.
- FIG. 2 is a diagram schematically showing the algorithm of LIME.
- FIG. 3 is a diagram showing an example of neighborhood data.
- FIG. 4 is a diagram showing an example of neighborhood data.
- FIG. 5 is a diagram showing an example of the distribution of neighborhood data.
- FIG. 6 is a diagram showing an example of the distribution of neighborhood data.
- FIG. 7 is a flowchart (1) showing a procedure of the model generation process according to the first embodiment.
- FIG. 8 is a flowchart (2) showing the procedure of the model generation process according to the first embodiment.
- FIG. 9 is a diagram showing an example of the distribution of neighborhood data.
- FIG. 10 is a diagram showing an example of the distribution of neighborhood data.
- FIG. 11 is a diagram showing an example of a computer hardware configuration.
- model generation program, model generation method, and model generation device will be described below with reference to the attached drawings. It should be noted that this embodiment does not limit the disclosed technology. Then, each embodiment can be appropriately combined as long as the processing contents do not contradict each other.
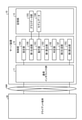
- FIG. 1 is a block diagram showing an example of the functional configuration of the server device 10 according to the first embodiment.
- the system 1 shown in FIG. 1 provides a model generation function for generating a linear regression model of LIME from the original graph data to be explained.
- FIG. 1 shows an example in which the above model generation function is provided by the client-server system, the present invention is not limited to this example, and the above data generation function may be provided standalone.
- the system 1 may include a server device 10 and a client terminal 30.
- the server device 10 and the client terminal 30 are communicably connected via the network NW.
- the network NW may be any kind of communication network such as the Internet or LAN (Local Area Network) regardless of whether it is wired or wireless.
- the server device 10 is an example of a computer that provides the above model generation function.
- the server device 10 may correspond to an example of a model generation device.
- the server device 10 can be implemented by installing a data generation program that realizes the above model generation function on an arbitrary computer.
- the server device 10 can be implemented as a server that provides the above model generation function on-premises.
- the server device 10 may provide the above model generation function as a cloud service by implementing it as a SaaS (Software as a Service) type application.
- SaaS Software as a Service
- the client terminal 30 is an example of a computer provided with the above model generation function.
- the client terminal 30 may be supported by a desktop computer such as a personal computer.
- a desktop computer such as a personal computer.
- the client terminal 30 may be any computer such as a laptop computer, a mobile terminal device, or a wearable terminal.
- the output of the machine learning model f is explained according to the procedure from step S1 below to step S6 below.
- the neighborhood data z is generated on a specific number of samples, for example, 100 to 10000 (step S1). ).
- the output of the machine learning model f is obtained by inputting the neighborhood data z thus generated to the machine learning model f to be explained (step S2).
- the distance D is obtained by inputting the original data x and the neighborhood data z into the distance function D (x, z) (step S3).
- the input to the machine learning model f is text data, the cos similarity or the like is used, or if the input to the machine learning model f is image data, the L2 norm or the like is used. Can be done.
- the objective function ⁇ (x) for finding the linear regression model g that minimizes the sum with ⁇ (g) is solved. Then, by calculating the partial regression coefficient of the linear regression model g, the contribution of the feature amount to the output of the machine learning model f is output (step S6).
- the contribution of the feature amount output in step S6 is useful in analyzing the reason and grounds for the output of the machine learning model. For example, it is possible to identify whether or not the trained machine learning model obtained by executing machine learning is a poor machine learning model generated partly due to a bias in training data or the like. This can prevent poor machine learning models from being used in mission-critical areas. In addition, if there is an error in the output of the trained machine learning model, the reason and grounds for the error can be presented. As another aspect, the contribution of the feature amount output in step S6 is useful in that machine learning models, data formats, or machine learning models having different structures can be compared by the same rule. .. For example, it is possible to select a machine learning model such as which trained machine learning model is inherently superior among a plurality of trained machine learning models prepared for the same task.
- LIME has an aspect that it is difficult to apply it to graph data. That is, in LIME, as a data format that can generate neighborhood data, only API (Application Programming Interface) of a library that supports data in formats such as tables, images, and texts is open to the public.
- API Application Programming Interface
- neighborhood data that is unevenly distributed with respect to the original graph data may be generated. Even if such neighborhood data is used, it is difficult to generate a linear regression model that approximates the machine learning model to be explained. Become.
- GNN Graph Neural Network
- graph kernel functions can be mentioned as examples of machine learning models that input graph data, but it is difficult to apply LIME to these GNN models and graph kernel models.
- GNNExpliner Graph Neural Network
- GNNExpliner is a technology specialized for GNN models, it is difficult to apply it to graph kernel models and other machine learning models.
- the GNN Expliner whose applicable tasks are limited cannot be the standard.
- the model generation function according to this embodiment is uniformly distributed with respect to the original graph data from the aspect of realizing the extension of LIME that can be applied to the machine learning model that inputs the graph data. Realize the generation of neighborhood data.
- FIG. 3 and 4 are diagrams showing an example of neighborhood data.
- 3 and 4 show the two-dimensional feature space shown in FIG.
- FIG. 3 shows the neighborhood data z desirable for the generation of the linear regression model g
- FIG. 4 shows the neighborhood data z desirable for the generation of the linear regression model g.
- the neighborhood data z shown in FIG. 3 is data that the machine learning model f is supposed to input, for example, data in which similar training data used at the time of training of the machine learning model f exists.
- the ratio of the neighborhood data z distributed in the vicinity of the original data x is also high.
- Such neighborhood data z is suitable for generating a linear regression model g because it is easy to distinguish between class A and class B discrimination boundaries in the vicinity of the original data x.
- the neighborhood data z shown in FIG. 4 is data that the machine learning model f does not assume input, for example, training data used at the time of training of the machine learning model f, as exemplified by the neighborhood data z1, z2, and z3. Contains data for which there is no similar thing. Further, the ratio of the neighborhood data z distributed in the vicinity of the original data x is also low. Such neighborhood data z is unsuitable for generating a linear regression model g because it is difficult to distinguish between class A and class B discrimination boundaries in the vicinity of the original data x.
- FIGS. 5 and 6 are diagrams showing an example of the distribution of neighborhood data.
- the vertical axis of the graphs shown in FIGS. 5 and 6 indicates the number of nearby data, and the horizontal axis of the graph indicates the distance D between the original data and the neighboring data.
- FIG. 5 when the neighborhood data is distributed uniformly in the vicinity of the original data with little bias, a linear regression model that approximates the machine learning model to be explained can be generated.
- FIG. 6 when the neighborhood data is not uniform in the vicinity of the original data and is unevenly distributed in a part of the neighborhood, the variation of the neighborhood data used for generating the linear regression model tends to be insufficient. Therefore, it is difficult to generate a linear regression model that approximates the machine learning model to be explained. In this case, the accuracy of calculating the contribution of the feature amount to the output of the machine learning model f is lowered.
- FIG. 1 schematically shows a block corresponding to a function of the server device 10.
- the server device 10 has a communication interface unit 11, a storage unit 13, and a control unit 15.
- FIG. 1 only shows an excerpt of the functional parts related to the above model generation function, and the functional parts other than those shown in the figure, for example, the functional parts that the existing computer is equipped with by default or as an option are servers. It may be provided in the device 10.
- the communication interface unit 11 corresponds to an example of a communication control unit that controls communication with another device, for example, a client terminal 30.
- the communication interface unit 11 is realized by a network interface card such as a LAN card.
- the communication interface unit 11 receives a request for executing the LIMIT algorithm from the client terminal 30. Further, the communication interface unit 11 outputs the contribution of the feature amount, which is the execution result of the LIME algorithm, to the client terminal 30.
- the storage unit 13 is a functional unit that stores various types of data.
- the storage unit 13 is realized by storage, for example, internal, external or auxiliary storage.
- the storage unit 13 stores the graph data group 13G and the model data 13M.
- the storage unit 13 can store various data such as account information of the user who receives the above-mentioned model generation function.
- the graph data group 13G is a set of data including a plurality of nodes and a plurality of edges connecting the plurality of nodes.
- the graph data included in the graph data group 13G may be training data used when training a machine learning model, or may be input data input to a trained machine learning model.
- the graph data included in the graph data group 13G may be in any format such as an adjacency matrix or a tensor.
- Model data 13M is data related to a machine learning model.
- the model data 13M includes the layer structure of the machine learning model such as neurons and synapses of the input layer, the hidden layer, and the output layer forming the machine learning model, and each layer.
- Machine learning model parameters such as weights and biases can be included.
- the parameters initially set by random numbers are stored, while in the stage after the machine learning of the model is executed. , Trained parameters are saved.
- the control unit 15 is a processing unit that controls the entire server device 10.
- the control unit 15 is realized by a hardware processor.
- the control unit 15 includes a setting unit 15A, a first generation unit 15B, an operation unit 15C, a first calculation unit 15D, a determination unit 15E, a second generation unit 15F, and a second. It has a calculation unit 15G.
- the setting unit 15A accepts various settings related to the execution of the LIMIT algorithm.
- the setting unit 15A can start the process when the request regarding the execution of the LIMIT algorithm is received from the client terminal 30.
- the setting unit 15A can accept the designation of the original graph data x and the machine learning model f to be explained via the client terminal 30.
- the setting unit 15A can automatically select the output of the trained or trained machine learning model, for example, training data or input data in which labels and numerical values are incorrect.
- the setting unit 15A sets the original graph data x and model data 13M to be acquired from the graph data group 13G stored in the storage unit 13. Of these, the machine learning model f for income is acquired.
- the setting unit 15A sets the distance function D (x, z) and the kernel width ⁇ used by the LIME algorithm.
- the system settings made by the developer of the model generation function described above may be automatically applied to the distance function D (x, z) and the kernel width ⁇ , or the user settings are accepted from the client terminal 30. It may be that.
- a distance function D (x, z) a distance function for graph data such as a graph kernel can be set. For example, the distance based on the graph division, the editing distance of the adjacency matrix / connection matrix, the distance based on the cos similarity, and the like can be mentioned.
- Random walk kernels shortest path
- graphlet kernels Weisfeiler-Lehmen kernels
- GraphHopper kernels Graph convolutional networks
- Neural message passing GraphSAGE, SplineCNN, k-GNN and the like.
- the first generation unit 15B generates neighborhood data z from the original graph data x.
- any method can be applied to the generation of neighborhood data, but as an example, the first generation unit 15B uses the API of LIME that publishes a library that generates neighborhood data for table data. Can generate neighborhood data.
- the first generation unit 15B gives an example of a case where an adjacency matrix is used as an example of a method of expressing graph data.
- the API of LIMIT for table data is applied by regarding the elements of the adjacency matrix as features. Specifically, an adjacency matrix different from the original adjacency matrix is created by randomly inverting the values of 0 or 1 of the elements of the adjacency matrix.
- the generation of such neighborhood data is repeated until the following conditions are satisfied.
- the number of neighborhood data whose output of the machine learning model f corresponds to a positive example and the output of the machine learning model f are negative examples.
- the first generation unit 15B determines whether or not the difference between the number of neighboring data of the positive example and the negative example is equal to or less than the threshold value. At this time, if the difference between the number of neighboring data of the positive example and the negative example is not equal to or less than the threshold value, it can be identified that the positive example and the negative example are not equal.
- the first generation unit 15B determines whether or not the total number of neighboring data reaches a threshold value, for example, N max or more. Then, when the total number of neighborhood data does not reach the threshold value N max , it can be identified that the total number of neighborhood data is insufficient for generating a linear regression model. In this case, the first generation unit 15B repeats the generation of neighborhood data. On the other hand, when the total number of neighborhood data reaches the threshold N max , it can be identified that the total number of neighborhood data is sufficient to generate a linear regression model. In this case, the generation of neighborhood data ends.
- a threshold value for example, N max or more.
- the determination unit 15E determines whether or not the value indicating the uniformity of the distribution of the plurality of distances is equal to or more than the threshold value based on the distribution of the distances between the original graph data x and the plurality of neighboring data z. For example, a chi-square test or the like can be used as an example of determining the uniformity of distance. In addition, instead of the above-mentioned value indicating the degree of uniformity, a value indicating the degree of bias or the degree of variation can be used for the determination.
- the second generation unit 15F generates a linear regression model using the result obtained by inputting a plurality of neighborhood data into the machine learning model f as an objective variable and a plurality of neighborhood data as explanatory variables.
- the second generation unit 15F can generate a linear regression model g according to the objective function ⁇ (x) exemplified by the above equation (2).
- the setting unit 15A accepts the designation of the original graph data x and the machine learning model f to be explained via the client terminal 30 (step S101). Subsequently, the setting unit 15A acquires the original graph data x and the machine learning model f to be explained for which the designation is accepted in step S101 (step S102).
- the operation unit 15C obtains an output from the machine learning model f by inputting the neighborhood data z generated in step S104 into the machine learning model f (step S105).
- the first calculation unit 15D inputs the original graph data x acquired in step S102 and the neighborhood data z generated in step S104 into the distance function D (x, z) set in step S103.
- the distance D is calculated by (step S106).
- the model generation function controls whether or not to generate a linear regression model depending on whether or not the difference between the number of neighboring data of the positive example and the negative example is equal to or less than the threshold value.
- 9 and 10 are diagrams showing an example of the distribution of neighborhood data.
- the vertical axis of the graphs shown in FIGS. 9 and 10 indicates ⁇ x (Z).
- the horizontal axis of the graph indicates the distance D (x, z).
- the distance D of the neighborhood data z whose output of the machine learning model f is a positive example and the distance D of the neighborhood data z whose output of the machine learning model f is a negative example divide the vertical axis of the graph symmetrically. It is plotted. For example, as shown in FIG.
- each component of each of the illustrated devices does not necessarily have to be physically configured as shown in the figure. That is, the specific form of distribution / integration of each device is not limited to the one shown in the figure, and all or part of them may be functionally or physically distributed / physically in any unit according to various loads and usage conditions. Can be integrated and configured.
- the setting unit 15A, the first generation unit 15B, the operation unit 15C, the first calculation unit 15D, the determination unit 15E, the second generation unit 15F, or the second calculation unit 15G are connected via a network as an external device of the server device 10. You may do so.
- the various processes described in the first and second embodiments can be realized by executing a program prepared in advance on a computer such as a personal computer or a workstation. Therefore, in the following, an example of a computer that executes a model generation program having the same functions as those of the first and second embodiments will be described with reference to FIG.
- the HDD 170 includes the setting unit 15A, the first generation unit 15B, the operation unit 15C, the first calculation unit 15D, the determination unit 15E, the second generation unit 15F, and the second generation unit 15F shown in the first embodiment.
- a model generation program 170a that exhibits the same function as the calculation unit 15G is stored.
- This model generation program 170a has each configuration of the setting unit 15A, the first generation unit 15B, the operation unit 15C, the first calculation unit 15D, the determination unit 15E, the second generation unit 15F, and the second calculation unit 15G shown in FIG. Like the elements, they may be integrated or separated. That is, not all the data shown in the first embodiment may be stored in the HDD 170, and the data used for processing may be stored in the HDD 170.
- each program is stored in a "portable physical medium" such as a flexible disk inserted into the computer 100, a so-called FD, a CD-ROM, a DVD disk, a magneto-optical disk, or an IC card. Then, the computer 100 may acquire and execute each program from these portable physical media. Further, each program is stored in another computer or server device connected to the computer 100 via a public line, the Internet, a LAN, a WAN, or the like, and the computer 100 acquires and executes each program from these. You may do it.
- a "portable physical medium” such as a flexible disk inserted into the computer 100, a so-called FD, a CD-ROM, a DVD disk, a magneto-optical disk, or an IC card.
- the computer 100 may acquire and execute each program from these portable physical media.
- each program is stored in another computer or server device connected to the computer 100 via a public line, the Internet, a LAN, a WAN, or the like, and the computer
Landscapes
- Engineering & Computer Science (AREA)
- Theoretical Computer Science (AREA)
- Physics & Mathematics (AREA)
- General Physics & Mathematics (AREA)
- Software Systems (AREA)
- Artificial Intelligence (AREA)
- General Engineering & Computer Science (AREA)
- Computing Systems (AREA)
- Mathematical Physics (AREA)
- Data Mining & Analysis (AREA)
- Evolutionary Computation (AREA)
- Computational Linguistics (AREA)
- General Health & Medical Sciences (AREA)
- Health & Medical Sciences (AREA)
- Molecular Biology (AREA)
- Biophysics (AREA)
- Biomedical Technology (AREA)
- Life Sciences & Earth Sciences (AREA)
- Medical Informatics (AREA)
- Computer Vision & Pattern Recognition (AREA)
- Audiology, Speech & Language Pathology (AREA)
- Probability & Statistics with Applications (AREA)
- Algebra (AREA)
- Computational Mathematics (AREA)
- Mathematical Analysis (AREA)
- Mathematical Optimization (AREA)
- Pure & Applied Mathematics (AREA)
- Information Retrieval, Db Structures And Fs Structures Therefor (AREA)
Priority Applications (4)
| Application Number | Priority Date | Filing Date | Title |
|---|---|---|---|
| EP20951584.0A EP4207006A4 (en) | 2020-08-31 | 2020-08-31 | MODEL GENERATION PROGRAM, MODEL GENERATION METHOD AND MODEL GENERATION APPARATUS |
| JP2022545266A JP7396505B2 (ja) | 2020-08-31 | 2020-08-31 | モデル生成プログラム、モデル生成方法及びモデル生成装置 |
| PCT/JP2020/032941 WO2022044335A1 (ja) | 2020-08-31 | 2020-08-31 | モデル生成プログラム、モデル生成方法及びモデル生成装置 |
| US18/172,419 US20230196109A1 (en) | 2020-08-31 | 2023-02-22 | Non-transitory computer-readable recording medium for storing model generation program, model generation method, and model generation device |
Applications Claiming Priority (1)
| Application Number | Priority Date | Filing Date | Title |
|---|---|---|---|
| PCT/JP2020/032941 WO2022044335A1 (ja) | 2020-08-31 | 2020-08-31 | モデル生成プログラム、モデル生成方法及びモデル生成装置 |
Related Child Applications (1)
| Application Number | Title | Priority Date | Filing Date |
|---|---|---|---|
| US18/172,419 Continuation US20230196109A1 (en) | 2020-08-31 | 2023-02-22 | Non-transitory computer-readable recording medium for storing model generation program, model generation method, and model generation device |
Publications (1)
| Publication Number | Publication Date |
|---|---|
| WO2022044335A1 true WO2022044335A1 (ja) | 2022-03-03 |
Family
ID=80354990
Family Applications (1)
| Application Number | Title | Priority Date | Filing Date |
|---|---|---|---|
| PCT/JP2020/032941 Ceased WO2022044335A1 (ja) | 2020-08-31 | 2020-08-31 | モデル生成プログラム、モデル生成方法及びモデル生成装置 |
Country Status (4)
| Country | Link |
|---|---|
| US (1) | US20230196109A1 (https=) |
| EP (1) | EP4207006A4 (https=) |
| JP (1) | JP7396505B2 (https=) |
| WO (1) | WO2022044335A1 (https=) |
Cited By (2)
| Publication number | Priority date | Publication date | Assignee | Title |
|---|---|---|---|---|
| WO2024009902A1 (ja) * | 2022-07-04 | 2024-01-11 | 東京エレクトロン株式会社 | 情報処理方法、コンピュータプログラム及び情報処理装置 |
| US20240303536A1 (en) * | 2023-03-07 | 2024-09-12 | International Business Machines Corporation | Machine Learning with Data Driven Optimization Using Iterative Neighborhood Selection |
Families Citing this family (3)
| Publication number | Priority date | Publication date | Assignee | Title |
|---|---|---|---|---|
| US12536151B2 (en) * | 2022-11-22 | 2026-01-27 | International Business Machines Corporation | Accurate and query-efficient model agnostic explanations |
| KR102772661B1 (ko) * | 2024-04-03 | 2025-02-26 | 한화에어로스페이스 주식회사 | 탱크 수위 감시 소프트웨어 제작방법, 탱크 수위 감시 소프트웨어 제작장치, 및 탱크 수위 감시 시스템 |
| CN118332515B (zh) * | 2024-04-17 | 2026-01-30 | 中航信移动科技股份有限公司 | 虚假飞行轨迹点数据确定方法、电子设备及存储介质 |
Citations (1)
| Publication number | Priority date | Publication date | Assignee | Title |
|---|---|---|---|---|
| JP2020129222A (ja) * | 2019-02-07 | 2020-08-27 | 富士通株式会社 | モデル出力プログラム、モデル出力方法及びモデル出力装置 |
-
2020
- 2020-08-31 EP EP20951584.0A patent/EP4207006A4/en not_active Withdrawn
- 2020-08-31 WO PCT/JP2020/032941 patent/WO2022044335A1/ja not_active Ceased
- 2020-08-31 JP JP2022545266A patent/JP7396505B2/ja active Active
-
2023
- 2023-02-22 US US18/172,419 patent/US20230196109A1/en active Pending
Patent Citations (1)
| Publication number | Priority date | Publication date | Assignee | Title |
|---|---|---|---|---|
| JP2020129222A (ja) * | 2019-02-07 | 2020-08-27 | 富士通株式会社 | モデル出力プログラム、モデル出力方法及びモデル出力装置 |
Non-Patent Citations (3)
| Title |
|---|
| MARCO TULIO RIBEIROSAMEER SINGHCARLOS GUESTRIN: "Why Should I Trust You?", EXPLAINING THE PREDICTIONS OF ANY CLASSIFIER |
| MAXIM S. KOVALEV; LEV V. UTKIN; ERNEST M. KASIMOV: "SurvLIME: A method for explaining machine learning survival models", ARXIV.ORG, CORNELL UNIVERSITY LIBRARY, 201 OLIN LIBRARY CORNELL UNIVERSITY ITHACA, NY 14853, 18 March 2020 (2020-03-18), 201 Olin Library Cornell University Ithaca, NY 14853 , XP081624196 * |
| See also references of EP4207006A4 |
Cited By (2)
| Publication number | Priority date | Publication date | Assignee | Title |
|---|---|---|---|---|
| WO2024009902A1 (ja) * | 2022-07-04 | 2024-01-11 | 東京エレクトロン株式会社 | 情報処理方法、コンピュータプログラム及び情報処理装置 |
| US20240303536A1 (en) * | 2023-03-07 | 2024-09-12 | International Business Machines Corporation | Machine Learning with Data Driven Optimization Using Iterative Neighborhood Selection |
Also Published As
| Publication number | Publication date |
|---|---|
| JP7396505B2 (ja) | 2023-12-12 |
| EP4207006A1 (en) | 2023-07-05 |
| JPWO2022044335A1 (https=) | 2022-03-03 |
| EP4207006A4 (en) | 2023-09-27 |
| US20230196109A1 (en) | 2023-06-22 |
Similar Documents
| Publication | Publication Date | Title |
|---|---|---|
| JP7396505B2 (ja) | モデル生成プログラム、モデル生成方法及びモデル生成装置 | |
| US11734433B2 (en) | Open source vulnerability remediation tool | |
| CN112199189B (zh) | 深度学习模型对资源受限边缘设备的适应 | |
| US20210142169A1 (en) | Prediction interpretation | |
| EP4179467B1 (en) | Training a model to perform a task on medical data | |
| US12223432B2 (en) | Using disentangled learning to train an interpretable deep learning model | |
| WO2018157752A1 (en) | Approximate random number generator by empirical cumulative distribution function | |
| EP3923208A1 (en) | Automated hardware resource optimization | |
| EP3382609A1 (en) | Risk assessment method, risk assessment program, and information processing device | |
| RU2743898C1 (ru) | Способ выполнения задач | |
| CN118865009A (zh) | 半监督目标检测模型的训练、目标检测方法及装置 | |
| US10248527B1 (en) | Automated device-specific dynamic operation modifications | |
| JP6767312B2 (ja) | 検知システム、検知方法及び検知プログラム | |
| Cepero-Perez et al. | A proactive approach for random forest: N. Cepero-Pérez et al. | |
| US20250238797A1 (en) | Parsing event data for clustering and classification | |
| US20250273007A1 (en) | Rapid image classifier creation and quality assessment | |
| Farhad et al. | Keep your distance: determining sampling and distance thresholds in machine learning monitoring | |
| Neydorf et al. | Monochrome multitone image approximation on lowered dimension palette with sub-optimization method based on genetic algorithm | |
| JP7670165B2 (ja) | 支援装置、支援方法、および支援プログラム | |
| CN118096291A (zh) | 产品推荐方法、装置、设备及存储介质 | |
| WO2022044336A1 (ja) | データ生成プログラム、方法及び装置 | |
| Nyarko et al. | AI/ML systems engineering workbench framework | |
| US20220391732A1 (en) | Continuous optimization of human-algorithm collaboration performance | |
| US20220318619A1 (en) | Game theoretic deep neural networks for global optimization of machine learning model generation | |
| CN113469932A (zh) | 信息处理的方法、电子设备和介质 |
Legal Events
| Date | Code | Title | Description |
|---|---|---|---|
| 121 | Ep: the epo has been informed by wipo that ep was designated in this application |
Ref document number: 20951584 Country of ref document: EP Kind code of ref document: A1 |
|
| ENP | Entry into the national phase |
Ref document number: 2022545266 Country of ref document: JP Kind code of ref document: A |
|
| NENP | Non-entry into the national phase |
Ref country code: DE |
|
| ENP | Entry into the national phase |
Ref document number: 2020951584 Country of ref document: EP Effective date: 20230331 |
|
| WWW | Wipo information: withdrawn in national office |
Ref document number: 2020951584 Country of ref document: EP |