WO2022034652A1 - 表面解析装置 - Google Patents
表面解析装置 Download PDFInfo
- Publication number
- WO2022034652A1 WO2022034652A1 PCT/JP2020/030669 JP2020030669W WO2022034652A1 WO 2022034652 A1 WO2022034652 A1 WO 2022034652A1 JP 2020030669 W JP2020030669 W JP 2020030669W WO 2022034652 A1 WO2022034652 A1 WO 2022034652A1
- Authority
- WO
- WIPO (PCT)
- Prior art keywords
- sample
- computer system
- atmospheric pressure
- signal
- afm2
- Prior art date
- Legal status (The legal status is an assumption and is not a legal conclusion. Google has not performed a legal analysis and makes no representation as to the accuracy of the status listed.)
- Ceased
Links
Images





Classifications
-
- G—PHYSICS
- G01—MEASURING; TESTING
- G01Q—SCANNING-PROBE TECHNIQUES OR APPARATUS; APPLICATIONS OF SCANNING-PROBE TECHNIQUES, e.g. SCANNING PROBE MICROSCOPY [SPM]
- G01Q30/00—Auxiliary means serving to assist or improve the scanning probe techniques or apparatus, e.g. display or data processing devices
- G01Q30/04—Display or data processing devices
-
- G—PHYSICS
- G01—MEASURING; TESTING
- G01Q—SCANNING-PROBE TECHNIQUES OR APPARATUS; APPLICATIONS OF SCANNING-PROBE TECHNIQUES, e.g. SCANNING PROBE MICROSCOPY [SPM]
- G01Q10/00—Scanning or positioning arrangements, i.e. arrangements for actively controlling the movement or position of the probe
- G01Q10/04—Fine scanning or positioning
- G01Q10/06—Circuits or algorithms therefor
-
- G—PHYSICS
- G01—MEASURING; TESTING
- G01Q—SCANNING-PROBE TECHNIQUES OR APPARATUS; APPLICATIONS OF SCANNING-PROBE TECHNIQUES, e.g. SCANNING PROBE MICROSCOPY [SPM]
- G01Q30/00—Auxiliary means serving to assist or improve the scanning probe techniques or apparatus, e.g. display or data processing devices
- G01Q30/08—Means for establishing or regulating a desired environmental condition within a sample chamber
- G01Q30/16—Vacuum environment
-
- G—PHYSICS
- G01—MEASURING; TESTING
- G01Q—SCANNING-PROBE TECHNIQUES OR APPARATUS; APPLICATIONS OF SCANNING-PROBE TECHNIQUES, e.g. SCANNING PROBE MICROSCOPY [SPM]
- G01Q30/00—Auxiliary means serving to assist or improve the scanning probe techniques or apparatus, e.g. display or data processing devices
- G01Q30/20—Sample handling devices or methods
-
- G—PHYSICS
- G01—MEASURING; TESTING
- G01Q—SCANNING-PROBE TECHNIQUES OR APPARATUS; APPLICATIONS OF SCANNING-PROBE TECHNIQUES, e.g. SCANNING PROBE MICROSCOPY [SPM]
- G01Q40/00—Calibration, e.g. of probes
-
- G—PHYSICS
- G01—MEASURING; TESTING
- G01Q—SCANNING-PROBE TECHNIQUES OR APPARATUS; APPLICATIONS OF SCANNING-PROBE TECHNIQUES, e.g. SCANNING PROBE MICROSCOPY [SPM]
- G01Q60/00—Particular types of SPM [Scanning Probe Microscopy] or microscopes; Essential components thereof
- G01Q60/24—AFM [Atomic Force Microscopy] or apparatus therefor, e.g. AFM probes
-
- G—PHYSICS
- G01—MEASURING; TESTING
- G01Q—SCANNING-PROBE TECHNIQUES OR APPARATUS; APPLICATIONS OF SCANNING-PROBE TECHNIQUES, e.g. SCANNING PROBE MICROSCOPY [SPM]
- G01Q30/00—Auxiliary means serving to assist or improve the scanning probe techniques or apparatus, e.g. display or data processing devices
- G01Q30/02—Non-SPM analysing devices, e.g. SEM [Scanning Electron Microscope], spectrometer or optical microscope
Definitions
- the present invention relates to a technique such as a surface analysis device.
- the surface analysis device has a function of three-dimensionally measuring or observing the fine shape formed on the sample surface by scanning the sample surface with a probe.
- a scanning probe microscope SPM
- SPM obtains information on the shape and physical properties of the sample surface by detecting some interaction between the probe with an extremely sharp tip and the sample surface.
- a scanning tunneling microscope STM
- Atomic Force Microscope AFM
- the STM uses tunneling current as the interaction.
- AFM uses an atomic force as an interaction.
- the surface analyzer can output an image showing the three-dimensional shape of the sample surface from the scanning position and height information.
- a scanning electron microscope SEM
- the SEM can detect secondary electrons and the like from the sample surface based on the irradiation of the sample surface with an electron beam and output it as an image showing the sample surface.
- Patent Document 1 describes, as a "scanning probe microscope and a surface shape measuring method using the scanning probe microscope", a high-precision displacement for measuring the vertical movement of the sample stage in the non-driving direction during horizontal scanning on the back side of the sample stage. It is described that a meter is provided and that the result of measuring the sample surface shape by the probe is corrected by this result.
- the element structure is becoming more complicated in the height direction.
- manufacturing process control not only conventional planar structure dimensional measurement but also height direction dimensional measurement is becoming more important. Therefore, the adoption of SPM, which can measure in the height direction, is being considered.
- SPM typically AFM
- the device provided with the vacuum chamber includes, for example, a process device for film formation and a charged particle beam device such as SEM.
- the amount of displacement due to disturbance, device characteristics, etc. may be added as a deviation to the height information obtained by measurement in SPM.
- An airtight tank such as a vacuum tank is affected by minute atmospheric pressure fluctuations in the space where the device is installed, usually a clean room. Due to this atmospheric pressure fluctuation, mechanical deformation, for example, distortion occurs on the wall surface or the like constituting the airtight tank, and displacement occurs in a direction including the height direction.
- the SPM fixed to the wall surface and the like also undergoes displacement in the direction including the height direction.
- the amount of displacement at this time affects the height information of the SPM measurement result as a deviation.
- Such a height deviation is not desirable because it reduces the accuracy and quality of measurement and analysis in SPM and surface analysis. Such a height deviation cannot be dealt with by the prior art example as in Patent Document 1.
- An object of the present disclosure is to improve the accuracy and quality of measurement and analysis of the surface analysis device even if the height information of the SPM measurement result is locally deviated due to the atmospheric pressure fluctuation with respect to the airtight tank. Is to provide the technology that can be done.
- the surface analyzer is a scanning type that is fixed to an airtight tank that can reduce the pressure or pressurize the inside, a stage that holds the sample in the airtight tank, and a structure that constitutes the airtight tank, and measures the surface of the sample.
- a probe microscope, a sensor arranged outside the airtight tank and measuring atmospheric pressure, a first signal for measurement of the scanning probe microscope, and a second signal for measurement by the sensor are used to obtain the sample. It is equipped with a computer system that analyzes the surface.
- the measurement can be performed.
- the accuracy and quality of analysis can be improved.
- Embodiment 2 It is a figure which shows the relationship of various signals in Embodiment 2. It is a figure which shows the structure of the surface analysis apparatus of Embodiment 3 of this disclosure. It is a figure which shows the structure of the surface analysis apparatus of Embodiment 4 of this disclosure.
- the surface analysis apparatus is a device provided with an AFM as an SPM in the vacuum chamber, and has a function of correcting the height information of the AFM measurement based on the detection of the atmospheric pressure fluctuation with respect to the vacuum chamber.
- the surface analysis device 1 (particularly the computer system CS2) of FIG. 1 corrects the height information of the surface of the sample 5 in the signal S2 measured by the AFM2 so as to eliminate the influence of the displacement of the vacuum chamber 10 in response to the atmospheric pressure fluctuation. do.
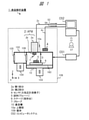
- FIG. 1 shows the configuration of the surface analysis device 1 of the first embodiment.
- the surface analysis device 1 of the first embodiment includes a vacuum chamber 10, an AFM2 SPM, a sensor 4, a housing 109, a computer system CS1, a computer system CS2, and the like.
- the user U1 who is an operator operates the computer system CS2 and the like to use the surface analysis device 1.
- Sample 5 is, for example, a silicon wafer.
- the control function of the surface analysis device 1 is configured by connecting and linking two systems, the computer system CS1 and the computer system CS2.
- the computer system CS1 is mainly a system for driving control of a mechanism such as a vacuum chamber 10.
- the computer system CS2 is a system for controlling the AFM2.
- Each computer system is composed of a computer (for example, a PC, an electronic circuit board, etc.), an input device, an output device, and the like.
- the parts of the surface analysis device 1 other than the computer systems CS1 and CS2 are housed in the housing 109.
- the space portion inside the housing 109 and outside the vacuum chamber 10 communicates with the outside of the housing 109 and has an atmospheric pressure.
- the surface analysis device 1 is installed in a clean room.
- (X, Y, Z) may be used as an explanatory direction or an expression of the coordinate system.
- the X and Y directions are two orthogonal directions constituting the horizontal plane and correspond to the planes of the stage 6 and the sample 5.
- the Z direction is a height direction and a vertical direction perpendicular to the X and Y directions.
- the target of correction is at least displacement / displacement in the Z direction.
- the vacuum tank 10 is an airtight tank capable of depressurizing or pressurizing the inside.
- the vacuum chamber 10 is evacuated during the manufacturing process.
- the vacuum tank 10 is an airtight tank in which the internal pressure during operation is 1 ⁇ 10 ⁇ 2 Pa (Pascal) or less.
- the vacuum chamber 10 is a rectangular parallelepiped structure, but the vacuum chamber 10 is not limited to this.
- the vacuum chamber 10 may be a structure having an axisymmetric shape such as a cylinder.
- AFM2 is provided on the wall surface of the vacuum chamber 10.
- the AFM2 is fixed to the upper wall portion 10a (in other words, the lid) of the vacuum chamber 10.
- the vacuum chamber 10 has a stage 6 which is a holding table for holding the sample 5.
- the stage 6 can be moved, for example, in the horizontal plane direction (X, Y direction) while the sample 5 is placed and fixed by the stage moving mechanism 160.
- the computer system CS1 is connected to the mechanism such as the vacuum chamber 10.
- the computer system CS1 controls, for example, the state of pressure in the vacuum chamber 10 and also drives and controls the stage moving mechanism 160. As a result, the stage 6 can be moved to a designated position in the vacuum chamber 10, and the sample 5 on the stage 6 can be placed at the designated position.
- the surface analysis device 1 includes a load lock chamber 102, a gate valve 105 and a gate valve 106, and a vacuum pump system 103 and a vacuum pump system 104 for the vacuum tank 10.
- the load lock chamber 102 is a preliminary disposal chamber for introducing the sample 5 into the vacuum chamber 10.
- a mechanism such as a robot for transporting the sample 5 is installed outside the load lock chamber 102.
- a mechanism for transporting the sample 5, a rotation mechanism for keeping the orientation of the sample 5 constant, and the like are installed inside the load lock chamber 102.
- the gate valve 105 communicates the load lock chamber 102 with an external atmospheric pressure portion.
- the gate valve 106 connects the load lock chamber 102 and the vacuum chamber 10.
- the vacuum pump system 103 is a vacuum pump system for depressurizing and exhausting the vacuum tank 10.
- the vacuum pump system 104 is a vacuum pump system for depressurizing and exhausting the load lock chamber 102.
- the vacuum pump system 103 and the vacuum pump system 104 are composed of a series of pump groups having a turbo molecular pump as the final stage capable of exhausting to a state of low vibration and ultra-high vacuum.
- the ultra-high vacuum state is, for example, about 1 ⁇ 10-5 Pa.
- the AFM2 physically scans the surface of the sample 5 on the stage 6 using the probe 7, measures the height of the target portion on the surface of the sample 5, and is an image showing the three-dimensional shape of the surface of the sample 5. It is a device that can obtain.
- the AFM2 has a first portion 2a and a second portion 2b as portions constituting the apparatus.
- the first portion 2a is a portion arranged outside the vacuum chamber 10, and is arranged in the atmosphere above the upper wall portion 10a of the vacuum chamber 10.
- the second portion 2b is a portion arranged inside the vacuum chamber 10, and is arranged in a vacuum below the upper wall portion 10a of the vacuum chamber 10.
- the first portion 2a and the second portion 2b are connected by penetrating a part of the wall surface of the vacuum chamber 10, particularly the upper wall portion 10a.
- the penetrating portion is kept airtight by parts and mechanisms such as an O-ring (not shown).
- a part of the first portion 2a is fixed to the upper wall portion 10a.
- a part of the second portion 2b is fixed to the upper wall portion 10a. Since the AFM2 is fixed to a part of the wall surface of the vacuum chamber 10, particularly the upper wall portion 10a, the AFM2 is affected by the deformation / displacement of the upper wall portion 10a.
- the second part 2b of AFM2 is provided with a probe 7.
- AFM2 measures the height of the surface of the sample 5 by scanning the target portion of the surface of the sample 5 held on the stage 6 with the probe 7, and obtains an image showing the three-dimensional shape of the surface of the sample 5. .. In other words, this image is measurement information having a scanning position in the horizontal direction and height information at each time point.
- a computer system CS2 is connected to the AFM2 through a signal line 2c.
- the AFM2 outputs a signal S2 such as an image as a measurement result to the computer system CS2 through the signal line 2c.
- the computer system CS2 inputs and processes the measurement result signal S2 from the AFM2.
- the surface analysis device 1 analyzes the shape of the surface of the sample 5 based on the processing result of the AFM2.
- the sensor 4 is provided at a predetermined position outside the vacuum chamber 10, for example, in the vicinity of the upper wall portion 10a which is not in contact with the upper surface.
- the sensor 4 is an atmospheric pressure measuring element that measures the atmospheric pressure outside the vacuum chamber 10.
- the sensor 4 is an element capable of measuring the pressure applied to the upper wall portion 10a of the vacuum chamber 10.
- the sensor 4 outputs a signal S4 of a measured value of atmospheric pressure.
- the sensor 4 is connected to the computer system CS2 through the signal line 4c.
- the computer system CS2 inputs and processes the signal S4 from the sensor 4.
- the computer system CS2 calculates the atmospheric pressure fluctuation amount based on, for example, the signal S4.
- the sensor 4 may be an element capable of measuring minute fluctuations in atmospheric pressure. There are several types of elements that can measure minute fluctuations in atmospheric pressure, and any type of element can be applied as the sensor 4.
- the arrangement of the sensor 4 is not limited to this example.
- the sensor 4 is arranged inside the housing 109, but is not limited to this, and may be arranged outside the housing 109.
- the sensor 4 may be fixedly arranged in the vacuum chamber 10 or the housing 109 or the like.
- an "absolute pressure detection type” atmospheric pressure measuring element is applied as the sensor 4.
- the “absolute pressure detection type” sensor as an element structure, a sealing space maintained at a reference pressure and an atmospheric pressure space are separated by a partition wall (in other words, a membrane).
- the atmospheric pressure space communicates with the outside (that is, the place where the sensor 4 is installed).
- This type of sensor electrically detects the fluctuation of the differential pressure between the two spaces as the displacement of the partition wall (in other words, the change in the amount of strain) by a semiconductor piezo gauge or the like.
- the output signal S4 from the sensor 4 is a voltage signal representing an atmospheric pressure measurement value outside the vacuum chamber 10, and is a signal having a voltage value at each time point on the time series.
- the senor 4 can be applied with a "relative pressure detection type" atmospheric pressure measuring element.
- a "relative pressure detection type” atmospheric pressure measuring element As an element structure, one atmospheric pressure space communicates with the installation location of the sensor 4 as in the "absolute pressure detection type”. The other space through the bulkhead leads through a line to a remote outside, such as the outside of the cream room. This sensor can measure the relative differential pressure fluctuation between the two spaces as the displacement of the partition wall.
- FIG. 1 An example of the procedure for analyzing the surface of the sample 5 using the surface analysis device 1, particularly AFM2, is as follows. First, the surface analysis device 1 puts the load lock chamber 102 in an atmospheric pressure state, opens the gate valve 105, and transfers the sample 5 into the load lock chamber 102. The surface analysis device 1 closes the gate valve 105 and exhausts the inside of the load lock chamber 102 by the vacuum pump system 104 until a vacuum state of about 1 ⁇ 10 -3 Pa is obtained. The surface analyzer 1 then opens the gate valve 106 and moves the sample 5 onto the stage 6 in the vacuum chamber 10. The sample 5 is adsorbed and held on the stage 6.
- the vacuum tank 10 is exhausted by the vacuum pump system 103 and is maintained in a vacuum state of about 1 ⁇ 10 -4 Pa.
- the user U1 operates the computer system CS2 or the like to move the stage 6 on which the sample 5 is placed to a position directly under the AFM2 so that the analysis target portion on the surface of the sample 5 comes directly under the probe 7.
- the user U1 instructs the execution of the surface analysis and the target range on the computer system CS2.
- the computer system CS2 controls the AFM2, scans the probe 7 within the specified range of the surface of the sample 5, and lowers the probe 7 toward the target location.
- the tip of the probe 7 and the target location approach each other until they start interacting with each other due to the intramolecular force.
- the AFM2 measures the distance between the tip of the probe 7 and the target location based on the interaction at that time, and obtains the height information of the surface of the sample 5.
- the AFM2 similarly scans the probe 7 within a specified range to obtain height information.
- the AFM2 sends a signal S2 representing the shape of the surface of the sample 5 to the computer system CS2.
- the computer system CS2 inputs and processes the signal S2 from the AFM2, creates an image showing the three-dimensional shape of the surface of the sample 5 as a sample surface image, and displays it on the screen of the display device.
- the surface analysis device 1 analyzes the surface of the sample 5 by using the signal S4 obtained by the sensor 4 and the signal S2 of the measurement result of the AFM2.
- the surface analysis device 1 analyzes the surface shape of the sample 5 in consideration of the state of atmospheric pressure outside the vacuum chamber 10.
- the computer system CS2 corrects the height information in the signal S2 according to the fluctuation of the atmospheric pressure indicated by the signal S4.
- the computer system CS2 calculates the displacement amount of the vacuum chamber 10 and the AFM2 (particularly the probe 7) according to the atmospheric pressure fluctuation amount.
- the computer system CS2 corrects the height information according to the displacement amount so as to eliminate the deviation due to the influence of the atmospheric pressure.
- the surface analysis device 1 corrects the signal S2 of the AFM2 so as to correct the displacement of an object such as the probe 7 due to atmospheric pressure.
- the computer system CS2 stores and outputs the corrected information.
- the computer system CS2 calculates the distance fluctuation amount with respect to the distance D in FIG. 1 according to the atmospheric pressure fluctuation amount based on the signal S4.
- the distance D is the distance to the upper wall portion 10a of the vacuum chamber 10 in the Z direction with the upper surface of the stage 6 as a reference position.
- the computer system CS2 calculates the displacement amount of the AFM2, particularly with respect to the height position of the probe 7, according to the distance fluctuation amount.
- the computer system CS2 uses the displacement amount to correct the height information in the signal S2 of the measurement result so as to remove the deviation caused by the atmospheric pressure fluctuation.
- the surface analysis device 1 of the first embodiment even if the height information of the measurement result of the AFM2 is locally deviated due to the atmospheric pressure fluctuation with respect to the vacuum chamber 10, the measurement can be performed. The accuracy and quality of analysis can be improved. According to the surface analysis device 1 of the first embodiment, high-precision height information can be obtained by removing the deviation in the height direction by correction. According to the surface analysis device 1 of the first embodiment, it is possible to acquire a highly accurate image excluding the amount of local height deviation due to atmospheric pressure fluctuation in the observation image of the sample surface shape acquired by AFM2.
- the surface analysis apparatus of the second embodiment of the present disclosure will be described with reference to FIGS. 2 to 9.
- the basic configuration of the second embodiment is the same as that of the first embodiment.
- the components different from those of the first embodiment in the second embodiment will be mainly described.
- the vacuum chamber 10 is equipped with SEM3 as an example of a charged particle beam apparatus and an electron microscope in addition to the above-mentioned AFM2. That is, the surface analysis device 1 of the second embodiment is a device having a function by combining and integrating AFM2 and SEM3.
- FIG. 2 shows an overall schematic configuration of the surface analysis apparatus 1 of the second embodiment.
- the surface analysis apparatus 1 of the second embodiment includes a vacuum chamber 10, an SPM AFM2, an SEM3, a sensor 4, a housing 109, a computer system CS1, a computer system CS2, a computer system CS3, and the like.
- the user U1 who is an operator operates the computer system CS2, the computer system CS3, or the like to use the surface analysis device 1.
- Sample 5 is, for example, a silicon wafer on which an LSI is formed.
- the surface analysis device 1 of the second embodiment is configured as an inspection device for an LSI manufacturing factory.
- the control function of the surface analysis device 1 is configured by connecting and coordinating the three systems of the computer system CS1, the computer system CS2, and the computer system CS3.
- the computer system CS3 is a system for controlling the SEM3.
- the parts of the surface analysis apparatus 1 other than the computer systems CS1, CS2, and CS3 are housed in the housing 109.
- SEM3 is connected to the computer system CS3 through the signal line 3c.
- the computer system CS3 is interconnected with the computer system CS1 and the computer system CS2.
- the computer system CS2 controls AFM2.
- the computer system CS3 controls SEM3.
- the SEM3 outputs the signal S3 of the observation result of the sample 5 on the stage 6 to the computer system CS3 through the signal line 3c.
- the computer system CS3 processes the signal S3, constitutes, for example, an image of the observation result, and displays it on the display screen.
- the computer system CS3 of SEM3 corresponds to the main control system
- the computer system CS2 of AFM2 corresponds to the sub control system.
- the computer system CS3 controls the computer system CS2 and the computer system CS1.
- the user U1 mainly operates the computer system CS3.
- the computer system is not limited to such a configuration example.
- the computer system CS2 of the AFM2 may be used as the main control system, and the user U1 may mainly operate the computer system CS2.
- the computer system CS2 and the computer system CS3 may be integrated as one computer system.
- a computer system that performs main control may be further provided above the computer system CS2 and the computer system CS3.
- the computer system CS1 may be used as a computer system that performs higher-level main control.
- the AFM2 and the SEM3 are installed at two different positions on the upper wall portion 10a of the vacuum chamber 10.
- the AFM2 is roughly installed at the position L2 and the SEM3 is installed at the position L3 in the X and Y directions.
- Most of the SEM3 is arranged on the outer side of the upper wall portion 10a and on the upper side in the Z direction.
- the bottom portion of the SEM 3 penetrates a part of the upper wall portion 10a and leads into the vacuum chamber 10. The penetrating part is kept airtight.
- the SEM3 includes an electron source 110, an electron optical system 111, and a detector 113.
- the SEM3 irradiates the electron beam 112 generated by the electron source 110 so as to converge and scan the target portion on the surface of the sample 5 by the electron optical system 111.
- the SEM3 detects secondary electrons or backscattered electrons emitted from the surface of the sample 5 by irradiation with the detector 113 to obtain an image of the surface of the sample 5.
- the SEM3 sends the signal S3 of the obtained image to the computer system CS3 through the signal line 3c.
- the vacuum chamber 10 includes a stage 6 and a stage moving mechanism 160.
- the stage 6 in the second embodiment can be moved in the horizontal direction (X, Y direction) by the stage moving mechanism 160.
- the computer system CS1 moves the stage 6 holding the sample 5 to a designated position by the drive control of the stage moving mechanism 160.
- FIG. 2 shows a case where the stage 6 is located at the position L2 or the position L3 as an example of the position of the stage 6.
- the position L2 is a position substantially directly below the AFM2, which is used in the case of measurement by the AFM2.
- the case where the stage 6 and the sample 5 are arranged at the position L2 is shown by a solid line.
- the position L3 is a position substantially directly below the SEM3, which is used in the case of observation with the SEM3.
- the case where the stage 6 (6a) and the sample 5 (5a) are arranged at the position L3 is shown by a broken line.
- the computer system CS1 moves the stage 6 to the position L3 when observing the sample 5 in the SEM3 based on the control from the computer system CS3.
- the computer system CS1 moves the stage 6 to the position L2 when the sample 5 is measured by the AFM2 based on the control from the computer system CS3 and the computer system CS2.
- the user U1 can also move the stage 6 to a desired position within the range by operating the computer system CS3 or the computer system CS2. Further, the user U1 can be set to the computer system CS3 or the computer system CS2 in advance so that the stage 6 can be automatically moved or measured.
- the computer system CS3 and the computer system CS2 control the automatic movement of the stage 6 and the like by controlling the computer system CS1 based on the functions and settings.
- the position of the stage 6 in the vacuum chamber 10 in the Z direction (reference position described later) is defined as a fixed position in advance, and the heights at the position L2 and the position L3 are the same.
- the stage 6 is not displaced in the Z direction due to an external factor (for example, vibration).
- a configuration in which the stage 6 can be moved in the Z direction by the stage moving mechanism 160 may be used. Further, the configuration may be such that the displacement of the stage 6 in the Z direction due to an external factor is also taken into consideration and corrected.
- the vacuum chamber 10 is provided with a mechanism capable of detecting the position and displacement of the stage 6 in the Z direction.
- the computer system CS2 may similarly perform correction according to the atmospheric pressure by using the position in the Z direction of the stage 6 detected by using the mechanism as a reference position.
- a configuration may be configured in which the sample 5 can be measured and observed from both the AFM2 and the SEM3 at the position of the predetermined stage 6 in the vacuum chamber 10.
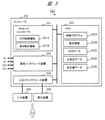
- FIG. 3 shows a configuration example of the computer system CS2 for AFM2.
- the computer system CS2 includes a computer 200 and an input device 205 and a display device 206 connected to the computer 200.
- the computer 200 includes a processor 201, a memory 202, a communication interface device 203, an input / output interface device 204, a bus connecting them to each other, and the like.
- An input device 205 such as a keyboard or a mouse and a display device 206 such as a liquid crystal display are connected to the input / output interface device 204.
- the communication interface device 203 is connected to the signal line 2c of the AFM2 and the signal line 4c of the sensor 4, and inputs and outputs signals to and from each of them. Further, the communication interface device 203 is connected to the computer system CS3 or the computer system CS1 by a predetermined communication interface (for example, a wired LAN), and performs communication processing between them.
- a predetermined communication interface for example, a wired
- the processor 201 is composed of, for example, a CPU, ROM, RAM, etc., and constitutes a controller of the computer system CS2.
- the processor 201 realizes a function including an AFM control function 201A and a height correction function 201B of the computer system CS2 based on software program processing.
- the AFM control function 201A is a function for controlling the measurement of the AFM2.
- the height correction function 201B is a function for correcting the deviation of the height information according to the displacement of the AFM2 (specifically, the probe 7) due to the influence of the atmospheric pressure.
- the memory 202 is composed of a non-volatile storage device or the like, and stores various data and information used by the processor 201 and the like.
- the memory 202 stores the control program 202A, the setting information 202B, the AFM data 202C, the atmospheric pressure data 202D, the calibration line data 202E, and the like.
- the control program 202A is a program for realizing each function.
- the setting information 202B is the setting information of the control program 202A and the user U1.
- the AFM data 202C is data such as data of the signal S2 obtained as a measurement result from AFM2 and data such as an image showing the surface shape of the sample 5 obtained as a result of processing based on the signal S2.
- the atmospheric pressure data 202D is the data of the signal S4 obtained from the sensor 4 and the data obtained as a result of processing the signal S4.
- the calibration line data 202E is setting information used for correction by the height correction function 201B.
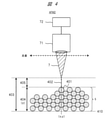
- FIG. 4 shows a schematic conceptual diagram of height detection using interaction 402 between probe 7 and atom 401 on the surface of sample 5 in AFM2.
- the reference position 410 indicates a horizontal plane and a position as a reference for measuring the height in the Z direction corresponding to the upper surface of the stage 6.
- the atom 401 be the measurement target point at a certain scanning position.
- the probe 7 is scanned in the X and Y directions and is at a scan position (x, y) in FIG.
- the height 403 is the height from the reference position 410 to the tip of the probe 7 corresponding to the position of the probe 7.
- the height 404 is the height from the reference position 410 to the atom 401, which corresponds to the height (z) of the measurement target location.
- the distance 405 is the distance from the atom 401 of the measurement target location to the tip of the probe 7.
- the AFM2 measures the distance 405 based on the interaction 402, the intramolecular force.
- the AFM2 obtains the height 404 of the atom 401 at the measurement target location by conversion based on the height 403 (position including the height) of the probe 7 and the distance 405.
- the AFM2 obtains information representing the shape of the surface of the sample 5, including the scanning position (x, y) and the height (z), as the signal S2.
- the AFM2 includes the probe 7, the drive mechanism 71, and the control mechanism 72 of FIG.
- the probe 7 is made of, for example, a silicon material, and has a tip diameter of 10 nm or less.
- the probe 7 is supported by a drive mechanism 71.
- the drive mechanism 71 includes, for example, a support rod or a holder that supports the probe 7.
- the drive mechanism 71 is a mechanism that can drive the probe 7 in the X, Y and Z directions.
- the drive mechanism 71 is connected to the control mechanism 72.
- the control mechanism 72 controls the drive mechanism 71 and realizes measurement.
- the drive mechanism 71 and the control mechanism 72 are arranged in the first portion 2a or the second portion 2b in FIG.
- the detection of the position including the height 403 of the probe 7 can be realized by detecting the position including the height of the drive mechanism 71.
- the drive mechanism 71 or the control mechanism 72 includes a mechanism for detecting a position including the height of the drive mechanism 71.
- Examples of the mechanism include a mechanism for irradiating a mirror provided in the drive mechanism 71 with light to detect the position of the reflected light.
- the control mechanism 72 includes a mechanism for driving and controlling the movement of the probe 7 and a mechanism for detecting the position including the height 403 of the probe 7. Further, the control mechanism 72 calculates the height 404 of the surface of the sample 5 based on the detection of the distance 405 according to the interaction 402, and stores and outputs the information (signal S2) representing the shape of the surface of the sample 5.
- Examples of the component of the drive mechanism 71 include a piezoelectric element and the like, but the present invention is not particularly limited.
- the piezoelectric element is an element whose length changes according to the application
- the probe 7 is scanned and driven in the horizontal direction (X, Y direction) by the drive mechanism 71, and is positioned at the target location on the surface of the sample 5 on the stage 6.
- the probe 7 is arranged on the upper side in the Z direction so as to face the target portion (for example, atom 401) on the surface of the sample 5 on the stage 6.
- the probe 7 is driven by the drive mechanism 71 so as to be close to or in contact with a target portion on the surface of the sample 5 in the Z direction.
- the drive is, for example, vibration by a piezoelectric element.
- the control mechanism 72 detects the distance 405 based on the intramolecular force which is the interaction 402 between the tip of the probe 7 and the target portion of the sample 5.
- the control mechanism 72 detects the scanning position (x, y) in the X and Y directions and the position (height 403) in the Z direction of the probe 7. Then, the control mechanism 72 obtains the height 404 of the target portion on the surface of the sample 5 by conversion from the height 403 and the distance 405.
- SPM including AFM requires measurement accuracy on the order of atomic level (for example, resolution of 0.1 nm). Therefore, high accuracy is required for the position including the height of the probe 7.
- the surface analysis device 1 of the second embodiment can correct the height information of the measurement result by the correction function even when the position including the height of the probe 7 is displaced according to the atmospheric pressure.
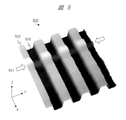
- FIG. 5 shows an image 500 showing the shape of the surface of the sample 5 in the example of the measurement result of AFM2.
- This example shows a specific example of the deviation of the height information of the AFM measurement result due to the displacement of the vacuum chamber according to the atmospheric pressure fluctuation, which was also described in the problem.
- the surface of the sample 5 has a pattern shape in which the difference in height is repeated like unevenness in the Y direction.
- This pattern shape is a line-and-space pattern that is common in LSIs.
- the portion 502 has a first height and the portion 503 has a second height lower than the first height.
- the AFM2 has a function of displaying the image 500 three-dimensionally in this way.
- a part of the pattern shape is raised as a deviation in the height direction (in other words, a height fluctuation amount) as shown by an arrow, and a band-like portion 501.
- the deviation portion 501 is caused by a minute fluctuation (for example, a decrease of about 10 Pa) in the atmospheric pressure in the clean room during a short time (for example, about several seconds to a dozen seconds) in which the probe 7 is scanning the portion 501. ing.
- a minute atmospheric pressure fluctuation of about 10 Pa may occur typically in a short time of about several seconds to about ten and several seconds.
- the vacuum chamber 10 expands slightly, the wall surface is displaced in the Z direction, and in particular, the upper wall portion 10a is displaced upward in the Z direction.
- the distance between the upper surface of the stage 6 and the upper wall portion 10a is slightly increased.
- the distance between the surface of the sample 5 and the target portion as seen from the probe 7 is slightly increased, and it appears as a height deviation.
- This height deviation reaches about 40 nm in this example.
- it is desirable that the deformation / displacement such as this portion 501 is not observed because it is not the original shape of the surface of the sample 5.
- the surface analysis device 1 corrects such a height deviation as a correction target.
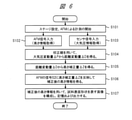
- FIG. 6 shows the main processing flow of the surface analysis device 1, particularly the computer system CS2.
- the flow of FIG. 6 has steps S101 to S107.
- step S101 the computer system CS2 starts the measurement by the AFM2 based on the operation of the user U1.
- the computer system CS2 controls the computer system CS1 so that the stage 6 on which the target sample 5 is placed comes to the position L2 directly below the AFM2.
- step S102 the computer system CS2 drives and controls the AFM2 to measure the sample 5.
- the AFM2 sequentially scans the probe 7 with respect to the surface of the sample 5, obtains information on the scanning position (x, y) and height (z) at each time point (t), and uses it as a signal S2.
- the computer system CS2 inputs the signal S2 from the AFM2.
- step S103 at the same time as step S2, the computer system CS2 inputs the signal S4 from the sensor 4 and acquires the measured value of the atmospheric pressure.
- step S104 the computer system CS2 first calculates the atmospheric pressure fluctuation amount ⁇ P based on the signal S4 among the two types of signals S2 and S4.
- the computer system CS2 obtains a distance fluctuation amount ⁇ D corresponding to the atmospheric pressure fluctuation amount ⁇ P by using a preset calibration line (calibration line data 202E in FIG. 3).
- the distance fluctuation amount ⁇ D is a fluctuation amount with respect to the distance D (FIG. 2) between the reference position on the upper surface of the stage 6 and the upper wall portion 10a of the vacuum chamber 10.
- the upper wall portion 10a is a portion where displacement according to atmospheric pressure occurs.
- step S105 the computer system CS2 obtains the height correction amount ⁇ Z from the distance fluctuation amount ⁇ D by conversion.
- the height correction amount ⁇ Z is a correction amount to be reflected in the height information (height 404 in FIG. 4) of the measurement result. Since the distance D and the height 403 of the probe 7 (FIG. 4) have a predetermined relationship, such conversion is possible.
- the relationship between the distance fluctuation amount ⁇ D and the height correction amount ⁇ Z may be set in advance. That is, the calibration line may be configured so that the height correction amount ⁇ Z can be obtained from the atmospheric pressure fluctuation amount ⁇ P.
- step S106 the computer system CS2 corrects the height information (for example, the height 404 in FIG. 4) obtained by the signal S2 from the AFM2 by performing a correction operation that reflects the height correction amount ⁇ Z, for example, addition. Get later height information.
- step S107 the computer system CS2 configures, stores, and outputs an image showing the sample surface shape using the corrected height information.
- the computer system CS2 corrects the uncorrected image as shown in FIG. 5 using the corrected height information to obtain the corrected image.
- the computer system CS2 displays the corrected image on the screen of the display device 206 (FIG. 3).
- FIG. 7 is an explanatory diagram showing a change in height due to the influence of atmospheric pressure.
- the AFM2 is fixed to the upper wall portion 10a.
- Atmospheric pressure 701 is applied to the upper surface of the upper wall portion 10a.
- the atmospheric pressure 701 is a standard predetermined atmospheric pressure.
- a predetermined atmospheric pressure is usually applied to the wall surface of the upper wall portion 10a or the like of the vacuum chamber 10 in which the inside is in a vacuum state as the atmospheric pressure 701.
- the surface analysis apparatus 1 uses a reference atmospheric pressure (referred to as PS), which is a preset standard predetermined atmospheric pressure.
- PS reference atmospheric pressure
- the distance D is taken at the center position 711 of the upper wall portion 10a in the X and Y directions.
- the AFM2 is provided with a reference position in the X and Y directions at a position 712 having a predetermined distance 713 from the center position 711 in the X and Y directions.
- the surface analysis device 1 handles the atmospheric pressure fluctuation amount (referred to as ⁇ P) with respect to the atmospheric pressure.
- the atmospheric pressure fluctuation amount ⁇ P is a fluctuation amount with respect to the reference atmospheric pressure PS, in other words, a difference between time points.
- (B) exaggerates the case where the atmospheric pressure 701 temporarily increases from the state of (A) and the upper wall portion 10a is pushed downward inside the vacuum chamber 10, that is, in the Z direction, for easy understanding. ..
- the atmospheric pressure fluctuates during the scanning time of the probe 7 the displacement amount and the strain amount of the wall surface of the vacuum chamber 10 change.
- the upper wall portion 10a is distorted so as to bend downward in the Z direction.
- the distance D is changed so as to decrease to the distance D2 (D2 ⁇ D1).
- the distance variation amount ⁇ D is (D2-D1).
- the typical fluctuation amount of the distance D is about several nm / Pa.
- AFM2 is also displaced downward in the Z direction due to fluctuations in the distance D such as bending of the upper wall portion 10a.
- the height position 703 with respect to the probe 7 is also changed to, for example, a lower height position.
- the displacement amount 706 is the difference between the changes in the height position 703 of the probe 7.
- the height information of the measurement result of AFM2 is deviated.
- the force applied to the upper surface of the upper wall portion 10a of the vacuum chamber 10 becomes larger, and the upper surface thereof is pushed toward the inside of the vacuum chamber 10, that is, downward in the Z direction.
- the distance D is reduced and the probe 7 is also closer to stage 6.
- the surface of the sample 5 seen from the probe 7 as a measurement of the AFM2 looks lower. Therefore, in the image of the measurement result, there is a deviation portion such that the height becomes low.
- the distance D increases, and the surface of the sample 5 as measured by the AFM2 looks higher. Therefore, in the image of the measurement result, as in the example of FIG. 5, there is a deviation portion such that the height becomes high.
- the distance D at the center position 711 in the horizontal plane and the height position 703 of the probe 7 at the position 712 of the AFM2 have a predetermined correspondence relationship. Based on experiments or geometric calculations in advance, it is possible to obtain data on the correspondence between the atmospheric pressure, the distance D, and the height position 703. Based on this, a calibration line (calibration line data 202E in FIG. 3) as shown in the example of FIG. 8 below can be set.
- the surface analyzer 1 obtains the distance fluctuation amount ⁇ D from the atmospheric pressure fluctuation amount ⁇ P based on the calibration line reflecting such a relationship, and the height of the probe 7 is obtained from the distance fluctuation amount ⁇ D.
- the displacement amount 706 of the position 703 is obtained and reflected as the height correction amount ⁇ Z.
- the example of (B) is the case of contraction of the vacuum chamber 10 due to the increase in atmospheric pressure, but the expansion of the vacuum chamber 10 due to the decrease in atmospheric pressure can be similarly corrected.
- the correction calculation may be simplified by assuming that the position 712 of the AFM2 in the X and Y directions is substantially the same as the center position 711. That is, the distance fluctuation amount ⁇ D may be directly set as the height correction amount ⁇ Z. In the calibration line in this case, the relationship between the atmospheric pressure fluctuation amount ⁇ P and the height correction amount ⁇ Z is defined.
- the position 712 of the AFM2 installation in the vacuum chamber 10 in the X and Y directions is not limited.
- the position 712 in the X and Y directions of AFM2 is also taken into consideration. That is, as described above, the height position 703 of the probe 7 is set by using the calibration line in which the relationship between the distance D at the center position 711 and the height position 703 of the probe 7 at the position 712 of the AFM2 is set.
- the height correction amount ⁇ Z corresponding to the above can be determined.
- the portion where the AFM2 is fixed to the vacuum chamber 10 is not limited to the upper wall portion 10a. Even in the case where the AFM2 is fixed to a part other than the upper wall portion 10a, the displacement amount of the position of the probe 7 of the AFM2 according to the atmospheric pressure fluctuation amount ⁇ P can be similarly specified, and the correction regarding the measured value of the AFM2 can be performed. It is possible.
- FIG. 8 shows an example of a calibration line (calibration line data 202E in FIG. 3) which is setting information for correction.
- This calibration line is a calibration line diagram for use in correcting the displacement of the wall surface of the vacuum chamber 10 in response to the atmospheric pressure fluctuation.
- the horizontal axis of the graph in FIG. 8 is the atmospheric pressure fluctuation amount ⁇ P [Pa] (Barometric Pressure Variance), which is the difference from the standard predetermined atmospheric pressure (reference atmospheric pressure PS), and is a positive or negative value centered on 0. Take.
- the vertical axis is the amount of distance variation ⁇ D [nm] (Relative Displacement) with respect to the distance D in FIGS. 2 and 7.
- the line 801 is a calibration line that defines the relationship between the atmospheric pressure fluctuation amount ⁇ P and the distance fluctuation amount ⁇ D.
- the black dots are the measured values in the experiment. For example, when the atmospheric pressure fluctuation amount ⁇ P is +10 Pa, the distance fluctuation amount ⁇ D is about ⁇ 33 nm.
- the height correction amount ⁇ Z is obtained in terms of a value close to that of ⁇ 33 nm.
- the surface analysis device 1 can set a calibration line created in advance based on an experiment or the like.
- the surface analysis device 1 is not limited to such a calibration line configuration, and may perform correction using a conversion formula, a conversion table, or the like.
- the calibration line can be set by the user.
- the computer system CS2 displays the calibration line as shown in FIG. 8 on the screen of the display device 206 and accepts the user setting.
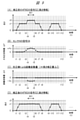
- FIG. 9 shows an example of a time-series correspondence relationship for various signals and the like.
- the horizontal axis of FIG. 9 is time (represented by time point t).
- (A) is an example of the data of the signal S2 from the AFM2 before the correction, that is, the height information.
- the vertical axis corresponds to the height of the surface of the sample 5 (height 404 in FIG. 4, height 704 in FIG. 7), and the unit is, for example, nm.
- Time points t1 to t12 are shown as examples of time points on the horizontal axis. For example, each time point t1 to t12 corresponds to a scanning position in the X direction.
- the time point t at the signal S4 is used as a reference for the time in each process.
- the height information in (A) represents the shape such as unevenness on the surface of the sample 5.
- the shape is 0 at time points t1 and height z1 at time points t2 to t3.
- the height is z2 (z2> z1).
- the height is z1 at the time points t6 to t7, 0 at the time points t8 to t9, the height z1 at the time points t10 to t11, and 0 at the time points t12.
- the portion of the height z2 at the time 901 from the time points t4 to t5 is an example of the deviation according to the atmospheric pressure fluctuation, which is different from the actual shape.
- (B) shows the atmospheric pressure measurement value by the signal S4 of the sensor 4, particularly the atmospheric pressure fluctuation amount ⁇ P.
- the vertical axis is the atmospheric pressure fluctuation amount ⁇ P with the reference atmospheric pressure PS at the position of 0.
- the atmospheric pressure is temporarily increasing, and it is approximately + Px.
- the surface analysis device 1 measures the atmospheric pressure by the sensor 4 at the same time as the measurement by the AFM2 (in other words, during the image acquisition).
- the computer system CS2 of the surface analysis apparatus 1 acquires the height information of the signal S2 of the AFM2 in synchronization with the measured value of the atmospheric pressure of the signal S4. Synchronization means that the time series of each information corresponds to each other.
- (C) shows the distance fluctuation amount ⁇ D calculated from the atmospheric pressure fluctuation amount ⁇ P of (B) using the calibration line.
- the vertical axis is the distance fluctuation amount ⁇ D, where 0 is the case where the upper wall portion 10a of the vacuum chamber 10 is in a standard position ((A) in FIG. 7).
- the height position of the probe 7 of the AFM2 is temporarily lowered due to the upper wall portion 10a being pushed downward due to the influence of the increase in atmospheric pressure in (B), and the distance fluctuation amount ⁇ D is approximate. It is -Dx.
- (D) shows an example of the corrected AFM2 signal S2, that is, the corrected height information, using the distance correction amount ⁇ Z corresponding to the distance fluctuation amount ⁇ D of (C).
- the height value of the original signal S2 reflects the distance correction amount ⁇ Z having a minus corresponding to ⁇ Dx in (C).
- the corrected height information the height is approximately z1 at time 901. In this way, the portion of the height deviation at time 901 in (A) is corrected as in (D).
- Each of the information (A) to (D) is information that has a correspondence relationship at the time point t with respect to the time point t of the signal S2 of (A).
- the computer system CS2 corrects the height information by using the signal S4 of the sensor 4 with reference to the time point t based on the input of the signal S2 from the AFM2.
- the surface analysis device 1 may display each graph as shown in FIG. 9 on the screen of the display device 206 (FIG. 3) of the computer system CS2. User U1 can confirm the information.
- the surface analysis apparatus 1 having a configuration in which the SPMs AFM2 and SEM3 are combined has, for example, the following advantages and functions corresponding thereto.
- (B) Details regarding (B) are as follows.
- the sample 5 is placed on the stage 6 in the vacuum chamber 10 by the transfer mechanism from the load lock chamber 102 side of FIG. 2, for example, it is predetermined at a predetermined position on the stage 6 according to a mark on the stage 6 or the like.
- the sample 5 is adsorbed and held in the direction of. After this installation, the position may be displaced in the X and Y directions.
- the surface analysis device 1 moves the stage 6 holding the sample 5 to the position L3 directly below the SEM 3 before the measurement by the AFM 2.
- the surface analyzer 1 confirms whether the position of the sample 5a on the stage 6a is accurate by observing the sample 5a, the mark, etc. on the stage 6a at the position L3 by the SEM3 (particularly the microscope function thereof).
- the surface analysis device 1 corrects the deviation of the position of the sample 5 on the stage 6 by driving the mechanism by the computer system CS1. This enables highly accurate positioning of the position of the sample 5 on the stage 6. After that, the surface analysis device 1 controls the stage moving mechanism 160 to move the stage 6 to the position L2 directly below the AFM2. Then, the surface analysis device 1 performs measurement by the AFM2 at the position L2. This enables highly accurate surface analysis of the sample 5.
- AFM2 and SEM3 The function of the combination of AFM2 and SEM3 is an example, and various other functions related to surface analysis can be provided.
- SEM3 in FIG. 2 is a device that uses, for example, an electrostatic lens or an electromagnetic lens as an electron optical system 111 to converge an electron beam 112 on the surface of a sample 5, in other words, to focus.
- the so-called depth of focus is relatively deep, and in SEM3 in the second embodiment, the order of the depth of focus is ⁇ m.
- the probe 7 is a device capable of contacting the surface of the sample 5, and the accuracy of nm order is required, and there is no concept of depth of focus. Therefore, when the AFM2 is displaced by, for example, about several tens of nm due to the influence of atmospheric pressure, the influence is large from the viewpoint of measurement accuracy. Therefore, in the second embodiment, the AFM2 is provided with a correction function.
- the AFM2 is fixed in the upper wall portion 10a of the vacuum chamber 10.
- the position and mode in which the AFM2 is fixed are not limited to this. Even when the AFM is fixed to the side wall portion or the lower wall portion of the vacuum chamber 10, it is conceivable that displacement in a predetermined direction (not limited to the Z direction) may occur according to the atmospheric pressure fluctuation. Even in that case, a mechanism for correcting the displacement in that direction can be similarly provided. Further, for example, in the structure of the vacuum chamber 10, even if there is a portion that continuously protrudes from the main wall surface to the inside and the AFM2 is fixed to that portion, the displacement of the wall surface affects the AFM2 through the portion. Therefore, even in the case of such a structure, the correction function can be applied in the same manner.
- the surface analysis device 1 of the second embodiment As described above, according to the surface analysis device 1 of the second embodiment, as the same effect as that of the first embodiment, due to the atmospheric pressure fluctuation with respect to the vacuum chamber 10, the height information of the measurement result of the AFM2 is locally expressed. Even if there is a deviation, the accuracy and quality of measurement and analysis can be improved. According to the surface analysis device 1 of the second embodiment, high-precision surface analysis can be realized by utilizing the function of the combination of AFM2 and SEM3.
- the third embodiment is a modification of the first embodiment, and can be similarly applied to the second embodiment.
- the above-mentioned height correction may be realized by program processing or may be realized by a dedicated circuit.
- the third embodiment an implementation example in which the height correction process is performed in real time by a dedicated circuit is shown.
- FIG. 10 shows the configuration of a main part in the surface analysis device 1 of the third embodiment.
- the surface analysis device 1 of the third embodiment has a correction circuit 1100 between the AFM2 and the sensor 4 and the computer system CS2.
- the correction circuit 1100 may be implemented using a dedicated hardware circuit such as FPGA or ASIC.
- the correction circuit 1100 includes an analog-to-digital conversion circuit (ADC) 1101 and a correction calculation circuit 1102.
- the ADC 1101 inputs the signal S4 from the signal line 4c of the sensor 4, performs AD conversion, and outputs a digital signal related to the atmospheric pressure measurement value.
- the correction calculation circuit 1102 inputs the signal S2 from the signal line 2c of the AFM2, and performs a predetermined height correction calculation using the digital signal from the ADC 1101.
- the signal S2 includes information (x (t), y (t)) regarding the scanning position in the X and Y directions as information for each time point (t) and the height at that position. Includes information z (t).
- the signal S4 includes an atmospheric pressure measurement value p (t) at each time point t.
- the correction calculation of the correction calculation circuit 1101 is expressed as "z (t) -k ⁇ p (t)".
- this correction operation for example, the product of the atmospheric pressure measurement value p (t) and the correction coefficient k obtained based on the above-mentioned calibration line is subtracted from the height information z (t) in the signal S2. It is an operation.
- the output signal S11 of the correction calculation circuit 1101 is input to the computer system CS2 and processed.
- Such a correction circuit 1100 may be arranged in the vicinity of the AFM2 and the sensor 4 in the housing 109, or may be arranged in the vicinity of the computer system CS2 outside the housing 109.
- the correction circuit 1100 may be integrally provided in the computer system CS2.
- the correction circuit 1100 may be provided integrally with the sensor 4.
- the height information can be corrected at high speed in real time by the correction circuit 1100 along with the measurement by the AFM2.
- the program processing in the computer system CS2 can be reduced.
- the fourth embodiment is a modification of the first embodiment, and can be similarly applied to the second embodiment.
- an implementation example in which the height correction process can be realized not in real time but as a batch process after the fact is shown.
- FIG. 11 shows the configuration of a main part of the surface analysis device 1 of the fourth embodiment.
- the correction processing unit 1200 is provided in the computer system CS2.
- the correction processing unit 1200 may include a dedicated circuit such as an ADC 1201 in a part thereof.
- the correction processing unit 1200 has an ADC 1201, an atmospheric pressure data storage unit 1202, an AFM data storage unit 1203, a correction calculation unit 1204, and a correction result storage unit 1205.
- the ADC 1201 converts the signal S4 from the sensor 4 into a digital signal.
- the digital signal (for example, p (t) as in FIG. 10) is stored in the atmospheric pressure data storage unit 1202 and is held for at least a certain period of time.
- the data of the signal S4 from the AFM2 (for example, x (t), y (t), z (t) as in FIG. 10) is stored in the AFM data storage unit 1203 and held for at least a certain period of time.
- the atmospheric pressure data storage unit 1202 and the AFM data storage unit 1203 are composed of the memory 202 of FIG. 2, an external storage device of the computer system CS2, a database (DB), and the like.
- the correction calculation unit 1204 is realized by program processing by the processor 201 of FIG.
- the correction calculation unit 1204 reads the data of the atmospheric pressure measurement value p (t) from the atmospheric pressure data storage unit 1202 at a predetermined timing in a predetermined time unit, and reads the data of the atmospheric pressure measurement value p (t) from the AFM data storage unit 1203 in the same time unit.
- the data of the signal S2 is read out and expanded on the memory.
- the predetermined timing may be a timing in which the user U1 instructs the correction execution based on the operation, or may be a timing determined in advance by the user U1 in the user setting.
- the correction calculation unit 1204 Based on the calibration line data 202E of FIG. 2, the correction calculation unit 1204 collectively executes height correction processing for those data in predetermined time units, and obtains height correction processing result data. It is stored in the correction result storage unit 1205. This height correction processing result data corresponds to the corrected image of the height information.
- the height information can be corrected collectively by the correction processing unit 1200.
- real-time correction is not possible, but it is not necessary to provide a dedicated circuit.
- the embodiments of the present disclosure are not limited to the above, and can be variously changed without departing from the gist.
- the device to be mounted can be applied as long as it is a device capable of acquiring information representing the sample surface shape, such as an SPM limited to AFM and an optical surface shape acquisition device.
Landscapes
- Physics & Mathematics (AREA)
- Health & Medical Sciences (AREA)
- General Health & Medical Sciences (AREA)
- General Physics & Mathematics (AREA)
- Nuclear Medicine, Radiotherapy & Molecular Imaging (AREA)
- Radiology & Medical Imaging (AREA)
- Length Measuring Devices With Unspecified Measuring Means (AREA)
- Analysing Materials By The Use Of Radiation (AREA)
Abstract
Description
図1を用いて、本開示の実施の形態1の表面解析装置について説明する。実施の形態1の表面解析装置は、真空槽にSPMとしてAFMを備える装置であり、真空槽に対する大気圧変動の検出に基づいて、AFMの計測の高さ情報を補正する機能を備える。図1の表面解析装置1(特にコンピュータシステムCS2)は、大気圧変動に応じた真空槽10の変位の影響を除くように、AFM2の計測の信号S2における試料5の表面の高さ情報を補正する。
図1は、実施の形態1の表面解析装置1の構成を示す。実施の形態1の表面解析装置1は、真空槽10、SPMであるAFM2、センサ4、筐体109、コンピュータシステムCS1、およびコンピュータシステムCS2等を備える。操作者であるユーザU1は、コンピュータシステムCS2等を操作して表面解析装置1を利用する。試料5は例えばシリコンウェーハである。コンピュータシステムCS1とコンピュータシステムCS2との2つのシステムの接続・連携によって、表面解析装置1の制御機能が構成されている。コンピュータシステムCS1は、主に真空槽10等の機構の駆動制御用のシステムである。コンピュータシステムCS2は、AFM2の制御用のシステムである。各コンピュータシステムは、コンピュータ(例えばPCや電子回路基板等)、入力装置および出力装置等から構成される。表面解析装置1におけるコンピュータシステムCS1,CS2以外の部分は、筐体109内に収容されている。筐体109内部で真空槽10外部である空間部分は、筐体109外部と通じており、大気圧を有する。表面解析装置1は、クリーンルーム内に設置される。
表面解析装置1、特にAFM2を用いて、試料5の表面を解析する際の手順の例は以下の通りである。表面解析装置1は、まず、ロードロック室102を大気圧状態にし、ゲートバルブ105を開いて、試料5をロードロック室102内に移送する。表面解析装置1は、ゲートバルブ105を閉じ、真空ポンプ系104によりロードロック室102内部を1×10⁻³Pa程度の真空状態となるまで排気する。表面解析装置1は、その後、ゲートバルブ106を開き、試料5を真空槽10内のステージ6上に移す。試料5はステージ6上に吸着保持される。表面解析装置1がゲートバルブ106を閉じると、真空槽10は、真空ポンプ系103により排気され、1×10⁻⁴Pa程度の真空状態に保たれる。これらの一連の動作は、コンピュータシステムCS1およびコンピュータシステムCS2によって自動的に遂行される。
表面解析装置1は、センサ4による信号S4と、AFM2の計測結果の信号S2とを用いて、試料5の表面を解析する。表面解析装置1は、真空槽10外の大気圧の状態を考慮して、試料5の表面形状を解析する。コンピュータシステムCS2は、信号S4で示す大気圧の変動に応じて、信号S2における高さ情報を補正する。コンピュータシステムCS2は、大気圧変動量に応じて、真空槽10およびAFM2(特にプローブ7)の変位量を計算する。コンピュータシステムCS2は、その変位量に応じて、大気圧の影響によるズレを除くように、高さ情報を補正する。言い換えると、表面解析装置1は、大気圧によるプローブ7等の物体の変位を補正するように、AFM2の信号S2を補正する。コンピュータシステムCS2は、補正後の情報を記憶および出力する。
上記のように、実施の形態1の表面解析装置1によれば、真空槽10に対する大気圧変動を原因として、AFM2の計測結果の高さ情報に、局所的なズレが生じる場合でも、計測や解析の精度や品質を高めることができる。実施の形態1の表面解析装置1によれば、高さ方向のズレを補正によって除いた、高精度の高さ情報を取得できる。実施の形態1の表面解析装置1によれば、AFM2によって取得した試料表面形状の観察画像において、大気圧変動による局所的な高さズレ量を除いた高精度の画像が取得できる。
図2~図9を用いて、本開示の実施の形態2の表面解析装置について説明する。実施の形態2の基本的な構成は実施の形態1と共通である。以下では、主に実施の形態2における実施の形態1とは異なる構成部分について説明する。図2等に示す実施の形態2の表面解析装置1は、真空槽10に対し、前述のAFM2に加え、荷電粒子線装置および電子顕微鏡の例としてSEM3が搭載されている。すなわち、実施の形態2の表面解析装置1は、AFM2とSEM3との組み合わせおよび統合による機能を有する装置である。
図2は、実施の形態2の表面解析装置1の全体概略構成を示す。実施の形態2の表面解析装置1は、真空槽10、SPMであるAFM2、SEM3、センサ4、筐体109、コンピュータシステムCS1、コンピュータシステムCS2、およびコンピュータシステムCS3等を備える。操作者であるユーザU1は、コンピュータシステムCS2またはコンピュータシステムCS3等を操作して表面解析装置1を利用する。試料5は、例えばLSIが形成されたシリコンウェーハである。実施の形態2の表面解析装置1は、LSI製造工場向け検査装置として構成されている。コンピュータシステムCS1とコンピュータシステムCS2とコンピュータシステムCS3との3つのシステムの接続・連携によって、表面解析装置1の制御機能が構成されている。コンピュータシステムCS3は、SEM3の制御用のシステムである。表面解析装置1におけるコンピュータシステムCS1,CS2,CS3以外の部分は、筐体109内に収容されている。
図3は、AFM2用のコンピュータシステムCS2の構成例を示す。コンピュータシステムCS2は、コンピュータ200と、コンピュータ200に接続される入力装置205や表示装置206とで構成されている。コンピュータ200は、プロセッサ201、メモリ202、通信インタフェース装置203、入出力インタフェース装置204、およびそれらを相互に接続するバス等で構成されている。入出力インタフェース装置204には、例えばキーボードやマウス等の入力装置205や、液晶ディスプレイ等の表示装置206が接続されている。通信インタフェース装置203は、AFM2の信号線2cやセンサ4の信号線4cが接続されており、それぞれとの間で信号の入出力を行う。また、通信インタフェース装置203は、コンピュータシステムCS3やコンピュータシステムCS1と所定の通信インタフェース(例えば有線LAN)で接続されており、それらとの間で通信処理を行う。
図4は、AFM2におけるプローブ7と試料5の表面の原子401との間の相互作用402を利用した高さの検出についての模式的概念図を示す。ステージ6の上面に対応する、Z方向での高さの計測に係る基準となる水平面および位置を、基準位置410で示す。ある走査位置での計測対象箇所を例えば原子401とする。プローブ7は、X,Y方向で走査され、図4ではある走査位置(x,y)にある。高さ403は、プローブ7の位置に対応する、基準位置410からのプローブ7の先端までの高さである。高さ404は、計測対象箇所の高さ(z)に対応する、基準位置410からの原子401までの高さである。距離405は、計測対象箇所の原子401からプローブ7の先端までの距離である。AFM2は、相互作用402、すなわち原子間力に基づいて、距離405を計測する。AFM2は、プローブ7の高さ403(高さを含む位置)と距離405とに基づいて、換算によって、計測対象箇所の原子401の高さ404を得る。これにより、AFM2は、走査位置(x,y)と高さ(z)とを含む、試料5の表面の形状を表す情報を、信号S2として得る。
AFM2の構成例を以下に説明する。AFM2は、図4のプローブ7、駆動機構71、および制御機構72を備える。プローブ7は、例えばシリコン材料から構成され、先端の径が10nm以下に加工されている。プローブ7は、駆動機構71で支持されている。駆動機構71は、例えばプローブ7を支持する支持棒やホルダー等を含む。駆動機構71は、プローブ7をX,Y方向およびZ方向に駆動できる機構である。駆動機構71は、制御機構72と接続されている。制御機構72は、駆動機構71を制御し、計測を実現する。駆動機構71および制御機構72は、図2の第1部分2aまたは第2部分2bに配置されている。プローブ7の高さ403を含む位置の検出は、駆動機構71の高さを含む位置の検出によって実現できる。駆動機構71または制御機構72は、駆動機構71の高さを含む位置を検出する機構を含む。その機構は、例えば、駆動機構71に備えるミラーに光を照射して反射光の位置を検出する機構が挙げられる。制御機構72は、プローブ7の移動を駆動制御する機構や、プローブ7の高さ403を含む位置を検出する機構を含む。また、制御機構72は、相互作用402に応じた距離405の検出に基づいて、試料5の表面の高さ404を計算し、試料5の表面の形状を表す情報(信号S2)を記憶および出力する機構、等を含む。駆動機構71の構成要素としては、圧電素子等が挙げられるが、特に限定されない。圧電素子は、電圧印加に応じて長さが変化する素子である。
図5は、AFM2の計測結果の例における、試料5の表面の形状を表す画像500を示す。本例は、課題でも述べた、大気圧変動に応じた真空槽の変位によるAFM計測結果の高さ情報のズレについての具体例を示す。本例では、試料5の表面は、図示のように、Y方向において高さの違いが凹凸のように繰り返されるパターン形状を有する。このパターン形状は、LSIでは一般的なライン・アンド・スペース・パターンである。例えば部分502は第1高さを持ち、部分503は第1高さよりも低い第2高さを持つ。AFM2は、このように画像500を3次元的に表示する機能を有する。
図6は、表面解析装置1、特にコンピュータシステムCS2の主な処理のフローを示す。図6のフローは、ステップS101~S107を有する。ステップS101で、コンピュータシステムCS2は、ユーザU1の操作に基づいて、AFM2による計測を開始する。この際、コンピュータシステムCS2は、対象の試料5を乗せたステージ6がAFM2の直下の位置L2に来るように、コンピュータシステムCS1を制御する。
図7は、大気圧の影響による高さの変動について示す説明図である。AFM2を備える真空槽10において、上壁部10aにAFM2が固定されている。上壁部10aの上面に対し、大気圧701がかかる。例えば、大気圧が1010hPaの場合、壁面には、10.1N/cm2程度の力がかかる。(A)は、大気圧701が標準的な所定の大気圧の場合である。内部が真空状態である真空槽10の上壁部10a等の壁面には、通常、大気圧701として、所定の大気圧がかかる。表面解析装置1は、予め設定された標準的な所定の大気圧である基準大気圧(PSとする)を用いる。基準大気圧PSは、例えば、1気圧=1035.25hPa(=103525Pa)とする。距離Dは、高さ方向であるZ方向において、ステージ6の上面を基準位置(Z=0)として、その基準位置と、上壁部10aの位置(例えば下面)との距離である。(A)での距離Dは、基準大気圧PSに対応した標準的な距離D1であるとする。
ここで、AFM2のX,Y方向の位置712については、概略的に中心位置711と同じとみなすことで、補正計算を簡略化してもよい。すなわち、距離変動量ΔDを直接的に高さ補正量ΔZとしてもよい。この場合の校正線は、大気圧変動量ΔPとその高さ補正量ΔZとの関係が規定される。真空槽10におけるAFM2の設置のX,Y方向の位置712については限定されない。
図8は、補正用の設定情報である校正線(図3の校正線データ202E)の例を示す。この校正線は、大気圧変動に応じた真空槽10の壁面の変位に関する補正に用いるための校正線図である。図8のグラフの横軸は大気圧変動量ΔP[Pa](Barometric Pressure Variance)であり、標準的な所定の大気圧(基準大気圧PS)との差分であり、0を中心として正負の値をとる。縦軸は図2や図7の距離Dに関する距離変動量ΔD[nm](Relative Displacement)である。線801は、大気圧変動量ΔPと距離変動量ΔDとの関係を規定する校正線である。黒点は、実験での実測値である。例えば大気圧変動量ΔPが+10Paの場合、距離変動量ΔDが-33nm程度となる。高さ補正量ΔZは、その-33nmと近い値として換算で得られる。
図9は、各種の信号等についての時系列での対応関係の例を示す。図9の横軸は時間(時点tで表される)である。(A)は、補正前のAFM2からの信号S2のデータ、すなわち高さ情報の例である。縦軸は試料5の表面の高さ(図4での高さ404、図7での高さ704)に対応し、単位は例えばnmである。横軸の時点の例として時点t1~t12を示す。例えば、各時点t1~t12は、X方向の走査位置に対応する。なお、例えば信号S4での時点tが、各処理での時間の基準とされる。(A)の高さ情報は、試料5の表面における凹凸等の形状を表している。本例では、形状は、時点t1では0、時点t2~t3では高さz1である。時点t4~t5では高さz2(z2>z1)となっている。時点t6~t7では高さz1、時点t8~t9では0、時点t10~t11では高さz1、時点t12では0、となっている。時点t4~t5の時間901における高さz2の部分は、実際の形状とは異なる、大気圧変動に応じたズレの例である。
実施の形態2のように、SPMであるAFM2とSEM3とを組み合わせた構成の表面解析装置1には、例えば以下のような優位点、およびそれに対応する機能がある。
なお、実施の形態2では、真空槽10の上壁部10aにおいてSEM3とAFM2との2つの装置が固定されている。大気圧の影響について、AFM2については、前述のように補正機能で対策するが、SEM3については殆ど考慮しなくてもよい。この理由は以下の通りである。図2のSEM3は、電子光学系111として、例えば静電レンズないし電磁レンズを使用して、電子線112を試料5の表面に収束させる、言い換えると焦点を合わせる装置である。電子線112の場合、いわゆる焦点深度(Depth of Focus)が比較的深く、実施の形態2でのSEM3では、その焦点深度のオーダはμmである。そのため、SEM3に大気圧の影響によって例えば数十nm程度の変位が生じたとしても、測定精度の観点では殆ど影響が無い。それに対し、AFM2の場合には、プローブ7という実物が試料5の表面に接触し得る装置であり、nmオーダの精度が要求されており、焦点深度の概念は無い。そのため、AFM2に大気圧の影響によって例えば数十nm程度の変位が生じた場合、計測精度の観点で影響が大きい。したがって、実施の形態2では、AFM2に補正機能を設けている。
実施の形態1,2では、真空槽10の上壁部10aにおいてAFM2が固定されている。AFM2が固定される位置や態様は、これに限られない。真空槽10の側壁部や下壁部にAFMが固定されている場合でも、大気圧変動に応じて所定の方向(Z方向に限らない)での変位が生じる場合が考えられる。その場合でも、その方向での変位を補正する機構を同様に設けることができる。また、例えば、真空槽10の構造において主な壁面から連続して内部に出る部分がある場合で、その部分にAFM2が固定されている構成でも、壁面の変位がその部分を通じてAFM2に影響する。よって、このような構造の場合でも、同様に補正機能を適用可能である。
上記のように、実施の形態2の表面解析装置1によれば、実施の形態1と同様の効果として、真空槽10に対する大気圧変動を原因として、AFM2の計測結果の高さ情報に、局所的なズレが生じる場合でも、計測や解析の精度や品質を高めることができる。実施の形態2の表面解析装置1によれば、AFM2とSEM3との組み合わせの機能を利用して、高精度の表面解析が実現できる。
実施の形態3は、実施の形態1の変形例であり、実施の形態2にも同様に適用できる。前述の高さ補正は、プログラム処理で実現されてもよいし、専用の回路で実現されてもよい。実施の形態3では、専用の回路でリアルタイムに高さ補正処理を行う実装例を示す。
実施の形態4は、実施の形態1の変形例であり、実施の形態2にも同様に適用できる。実施の形態4では、高さ補正処理を、リアルタイムではなく、事後的な一括処理として実現できる実装例を示す。
Claims (9)
- 内部を減圧または与圧可能な気密槽と、
前記気密槽内で試料を保持するステージと、
前記気密槽を構成する構造体に固定され、前記試料の表面を計測する走査型プローブ顕微鏡と、
前記気密槽の外側に配置され、大気圧を計測するセンサと、
前記走査型プローブ顕微鏡の計測の第1信号と、前記センサの計測の第2信号とを用いて、前記試料の表面を解析するコンピュータシステムと、
を備える、表面解析装置。 - 請求項1記載の表面解析装置において、
前記走査型プローブ顕微鏡は、前記気密槽の前記構造体のうち壁面に固定されており、
前記コンピュータシステムは、前記第2信号を用いて、前記第1信号のうち、前記試料の表面の高さ情報を補正する、
表面解析装置。 - 請求項1記載の表面解析装置において、
前記走査型プローブ顕微鏡は、前記気密槽の前記構造体のうち上壁部に固定されており、前記上壁部の外部に配置されている第1部分と、前記上壁部の内部に配置されているプローブを含む第2部分と、を有する、
表面解析装置。 - 請求項1記載の表面解析装置において、
前記コンピュータシステムは、前記第2信号から大気圧の変動量を計算し、前記大気圧の変動量に応じて、前記気密槽の変位量を計算し、前記気密槽の変位量に応じて、前記第1信号の値を補正する、
表面解析装置。 - 請求項1記載の表面解析装置において、
前記コンピュータシステムは、前記気密槽外の大気圧の変動量と、前記気密槽の変位量との関係を表す校正線に基づいて、前記第1信号の値を補正する、
表面解析装置。 - 請求項1記載の表面解析装置において、
前記走査型プローブ顕微鏡は、原子間力顕微鏡であり、
前記第1信号は、前記原子間力顕微鏡の計測の信号として、前記試料の表面の高さ情報を含み、
前記コンピュータシステムは、前記第2信号を用いて、前記第1信号のうち、前記試料の表面の高さ情報を補正する、
表面解析装置。 - 請求項1記載の表面解析装置において、
さらに、前記気密槽の前記構造体に固定されている、前記試料を観察するための荷電粒子線装置を備える、
表面解析装置。 - 請求項7記載の表面解析装置において、
前記気密槽内で前記ステージを移動させるステージ移動機構を備え、
前記ステージ移動機構は、前記ステージの位置を、前記走査型プローブ顕微鏡による計測のための第1位置と、前記荷電粒子線装置による観察のための第2位置との間で移動させる、
表面解析装置。 - 請求項8記載の表面解析装置において、
前記ステージを前記第2位置に移動させて、前記荷電粒子線装置による観察に基づいて、前記ステージ上の前記試料の位置を位置決めした後、前記ステージを前記第1位置に移動させて、前記走査型プローブ顕微鏡による計測を行う、
表面解析装置。
Priority Applications (4)
| Application Number | Priority Date | Filing Date | Title |
|---|---|---|---|
| US18/018,613 US12379392B2 (en) | 2020-08-12 | 2020-08-12 | Surface analysis device |
| KR1020237001416A KR102887597B1 (ko) | 2020-08-12 | 2020-08-12 | 표면 해석 장치 |
| PCT/JP2020/030669 WO2022034652A1 (ja) | 2020-08-12 | 2020-08-12 | 表面解析装置 |
| DE112020007290.8T DE112020007290T5 (de) | 2020-08-12 | 2020-08-12 | Oberflächenanalysevorrichtung |
Applications Claiming Priority (1)
| Application Number | Priority Date | Filing Date | Title |
|---|---|---|---|
| PCT/JP2020/030669 WO2022034652A1 (ja) | 2020-08-12 | 2020-08-12 | 表面解析装置 |
Publications (1)
| Publication Number | Publication Date |
|---|---|
| WO2022034652A1 true WO2022034652A1 (ja) | 2022-02-17 |
Family
ID=80247044
Family Applications (1)
| Application Number | Title | Priority Date | Filing Date |
|---|---|---|---|
| PCT/JP2020/030669 Ceased WO2022034652A1 (ja) | 2020-08-12 | 2020-08-12 | 表面解析装置 |
Country Status (4)
| Country | Link |
|---|---|
| US (1) | US12379392B2 (ja) |
| KR (1) | KR102887597B1 (ja) |
| DE (1) | DE112020007290T5 (ja) |
| WO (1) | WO2022034652A1 (ja) |
Citations (8)
| Publication number | Priority date | Publication date | Assignee | Title |
|---|---|---|---|---|
| JPH10164866A (ja) * | 1996-11-27 | 1998-06-19 | Olympus Optical Co Ltd | 圧電体サーボステージ |
| JPH11271335A (ja) * | 1998-03-23 | 1999-10-08 | Olympus Optical Co Ltd | 走査型プローブ顕微鏡 |
| JP2000090871A (ja) * | 1998-09-16 | 2000-03-31 | Seiko Epson Corp | ドーピング方法およびその装置 |
| US6051825A (en) * | 1998-06-19 | 2000-04-18 | Molecular Imaging Corporation | Conducting scanning probe microscope with environmental control |
| JP2004055300A (ja) * | 2002-07-18 | 2004-02-19 | Jeol Ltd | 顕微作業装置 |
| JP2005083852A (ja) * | 2003-09-08 | 2005-03-31 | Jeol Ltd | 走査形プローブ顕微鏡 |
| JP2006234500A (ja) * | 2005-02-23 | 2006-09-07 | Sii Nanotechnology Inc | 表面情報計測装置及び表面情報計測方法 |
| JP2012063158A (ja) * | 2010-09-14 | 2012-03-29 | Hitachi Ltd | 走査プローブ顕微鏡及びそれを用いた表面形状計測方法 |
Family Cites Families (3)
| Publication number | Priority date | Publication date | Assignee | Title |
|---|---|---|---|---|
| JPH0756443B2 (ja) * | 1990-12-20 | 1995-06-14 | 株式会社島津製作所 | 生体試料観察用走査型トンネル顕微鏡 |
| JP6516569B2 (ja) * | 2015-06-02 | 2019-05-22 | 株式会社日立ハイテクサイエンス | 走査プローブ顕微鏡 |
| JP7218262B2 (ja) * | 2019-09-12 | 2023-02-06 | 株式会社日立ハイテク | パターン高さ情報補正システム及びパターン高さ情報の補正方法 |
-
2020
- 2020-08-12 DE DE112020007290.8T patent/DE112020007290T5/de active Pending
- 2020-08-12 KR KR1020237001416A patent/KR102887597B1/ko active Active
- 2020-08-12 WO PCT/JP2020/030669 patent/WO2022034652A1/ja not_active Ceased
- 2020-08-12 US US18/018,613 patent/US12379392B2/en active Active
Patent Citations (8)
| Publication number | Priority date | Publication date | Assignee | Title |
|---|---|---|---|---|
| JPH10164866A (ja) * | 1996-11-27 | 1998-06-19 | Olympus Optical Co Ltd | 圧電体サーボステージ |
| JPH11271335A (ja) * | 1998-03-23 | 1999-10-08 | Olympus Optical Co Ltd | 走査型プローブ顕微鏡 |
| US6051825A (en) * | 1998-06-19 | 2000-04-18 | Molecular Imaging Corporation | Conducting scanning probe microscope with environmental control |
| JP2000090871A (ja) * | 1998-09-16 | 2000-03-31 | Seiko Epson Corp | ドーピング方法およびその装置 |
| JP2004055300A (ja) * | 2002-07-18 | 2004-02-19 | Jeol Ltd | 顕微作業装置 |
| JP2005083852A (ja) * | 2003-09-08 | 2005-03-31 | Jeol Ltd | 走査形プローブ顕微鏡 |
| JP2006234500A (ja) * | 2005-02-23 | 2006-09-07 | Sii Nanotechnology Inc | 表面情報計測装置及び表面情報計測方法 |
| JP2012063158A (ja) * | 2010-09-14 | 2012-03-29 | Hitachi Ltd | 走査プローブ顕微鏡及びそれを用いた表面形状計測方法 |
Also Published As
| Publication number | Publication date |
|---|---|
| US12379392B2 (en) | 2025-08-05 |
| US20230296644A1 (en) | 2023-09-21 |
| KR20230021752A (ko) | 2023-02-14 |
| DE112020007290T5 (de) | 2023-04-20 |
| KR102887597B1 (ko) | 2025-11-18 |
Similar Documents
| Publication | Publication Date | Title |
|---|---|---|
| US20230245851A1 (en) | Method for calibrating a scanning charged particle microscope | |
| KR102492492B1 (ko) | 하전 입자선 장치, 하전 입자선 장치의 시료 얼라이먼트 방법 | |
| KR102538927B1 (ko) | 패턴 높이 정보 보정 시스템 및 패턴 높이 정보의 보정 방법 | |
| KR101187957B1 (ko) | 하전 입자선 장치 | |
| JPS61502486A (ja) | 精密sem測定のための方法と装置 | |
| EP0843175B1 (en) | Scanning probe microscope and signal processing apparatus | |
| US7249002B1 (en) | Direct relative motion measurement for vibration induced noise and drift cancellation | |
| KR20030030869A (ko) | 전자빔 노광방법 및 노광장치 | |
| WO2022034652A1 (ja) | 表面解析装置 | |
| JP2024526642A (ja) | リアルタイムドリフト補正を用いたafmイメージング | |
| JP4607624B2 (ja) | 走査型電子顕微鏡 | |
| US9793091B1 (en) | Image generation apparatus | |
| WO2019068601A1 (en) | INTERFEROMETRIC PLATE PLATFORM POSITIONING APPARATUS | |
| KR102830512B1 (ko) | 넓은 면적의 고속 원자력 프로파일 | |
| JP7763861B2 (ja) | クリープ補正を備えるafmイメージング | |
| JPH08254540A (ja) | 走査型プローブ顕微鏡 | |
| JP6138471B2 (ja) | 荷電粒子線装置 | |
| JPH0225702A (ja) | 走査型トンネルマイクロスコープ並びに走査型トンネルスペクトロスコープ | |
| JP2008173728A (ja) | 原子間力顕微鏡微細加工装置及び原子間力顕微鏡を用いた微細加工方法 | |
| JPH08227680A (ja) | ビ−ム装置 |
Legal Events
| Date | Code | Title | Description |
|---|---|---|---|
| 121 | Ep: the epo has been informed by wipo that ep was designated in this application |
Ref document number: 20949514 Country of ref document: EP Kind code of ref document: A1 |
|
| ENP | Entry into the national phase |
Ref document number: 20237001416 Country of ref document: KR Kind code of ref document: A |
|
| 122 | Ep: pct application non-entry in european phase |
Ref document number: 20949514 Country of ref document: EP Kind code of ref document: A1 |
|
| NENP | Non-entry into the national phase |
Ref country code: JP |
|
| WWG | Wipo information: grant in national office |
Ref document number: 18018613 Country of ref document: US |