WO2021241721A1 - Method for treating cell population and method for analyzing genes included in cell population - Google Patents
Method for treating cell population and method for analyzing genes included in cell population Download PDFInfo
- Publication number
- WO2021241721A1 WO2021241721A1 PCT/JP2021/020338 JP2021020338W WO2021241721A1 WO 2021241721 A1 WO2021241721 A1 WO 2021241721A1 JP 2021020338 W JP2021020338 W JP 2021020338W WO 2021241721 A1 WO2021241721 A1 WO 2021241721A1
- Authority
- WO
- WIPO (PCT)
- Prior art keywords
- cell
- sequence
- cell population
- cotu
- cells
- Prior art date
Links
Images


Classifications
-
- C—CHEMISTRY; METALLURGY
- C12—BIOCHEMISTRY; BEER; SPIRITS; WINE; VINEGAR; MICROBIOLOGY; ENZYMOLOGY; MUTATION OR GENETIC ENGINEERING
- C12Q—MEASURING OR TESTING PROCESSES INVOLVING ENZYMES, NUCLEIC ACIDS OR MICROORGANISMS; COMPOSITIONS OR TEST PAPERS THEREFOR; PROCESSES OF PREPARING SUCH COMPOSITIONS; CONDITION-RESPONSIVE CONTROL IN MICROBIOLOGICAL OR ENZYMOLOGICAL PROCESSES
- C12Q1/00—Measuring or testing processes involving enzymes, nucleic acids or microorganisms; Compositions therefor; Processes of preparing such compositions
- C12Q1/68—Measuring or testing processes involving enzymes, nucleic acids or microorganisms; Compositions therefor; Processes of preparing such compositions involving nucleic acids
- C12Q1/6876—Nucleic acid products used in the analysis of nucleic acids, e.g. primers or probes
- C12Q1/6888—Nucleic acid products used in the analysis of nucleic acids, e.g. primers or probes for detection or identification of organisms
- C12Q1/689—Nucleic acid products used in the analysis of nucleic acids, e.g. primers or probes for detection or identification of organisms for bacteria
-
- C—CHEMISTRY; METALLURGY
- C12—BIOCHEMISTRY; BEER; SPIRITS; WINE; VINEGAR; MICROBIOLOGY; ENZYMOLOGY; MUTATION OR GENETIC ENGINEERING
- C12Q—MEASURING OR TESTING PROCESSES INVOLVING ENZYMES, NUCLEIC ACIDS OR MICROORGANISMS; COMPOSITIONS OR TEST PAPERS THEREFOR; PROCESSES OF PREPARING SUCH COMPOSITIONS; CONDITION-RESPONSIVE CONTROL IN MICROBIOLOGICAL OR ENZYMOLOGICAL PROCESSES
- C12Q1/00—Measuring or testing processes involving enzymes, nucleic acids or microorganisms; Compositions therefor; Processes of preparing such compositions
- C12Q1/68—Measuring or testing processes involving enzymes, nucleic acids or microorganisms; Compositions therefor; Processes of preparing such compositions involving nucleic acids
- C12Q1/6806—Preparing nucleic acids for analysis, e.g. for polymerase chain reaction [PCR] assay
-
- C—CHEMISTRY; METALLURGY
- C12—BIOCHEMISTRY; BEER; SPIRITS; WINE; VINEGAR; MICROBIOLOGY; ENZYMOLOGY; MUTATION OR GENETIC ENGINEERING
- C12Q—MEASURING OR TESTING PROCESSES INVOLVING ENZYMES, NUCLEIC ACIDS OR MICROORGANISMS; COMPOSITIONS OR TEST PAPERS THEREFOR; PROCESSES OF PREPARING SUCH COMPOSITIONS; CONDITION-RESPONSIVE CONTROL IN MICROBIOLOGICAL OR ENZYMOLOGICAL PROCESSES
- C12Q1/00—Measuring or testing processes involving enzymes, nucleic acids or microorganisms; Compositions therefor; Processes of preparing such compositions
- C12Q1/68—Measuring or testing processes involving enzymes, nucleic acids or microorganisms; Compositions therefor; Processes of preparing such compositions involving nucleic acids
- C12Q1/6844—Nucleic acid amplification reactions
-
- C—CHEMISTRY; METALLURGY
- C12—BIOCHEMISTRY; BEER; SPIRITS; WINE; VINEGAR; MICROBIOLOGY; ENZYMOLOGY; MUTATION OR GENETIC ENGINEERING
- C12Q—MEASURING OR TESTING PROCESSES INVOLVING ENZYMES, NUCLEIC ACIDS OR MICROORGANISMS; COMPOSITIONS OR TEST PAPERS THEREFOR; PROCESSES OF PREPARING SUCH COMPOSITIONS; CONDITION-RESPONSIVE CONTROL IN MICROBIOLOGICAL OR ENZYMOLOGICAL PROCESSES
- C12Q2600/00—Oligonucleotides characterized by their use
- C12Q2600/16—Primer sets for multiplex assays
Definitions
- the present invention relates to a method for treating a cell population and a method for analyzing a gene contained in the cell population.
- the composition of the symbiotic microbial flora contributes to the health 1 and 2 of the host, simply because the cell is the basic and physical unit of the microbial flora 3-5, the microorganism
- the flora should be defined at the cellular level. However, it is difficult with the latest technology at present 6-8 .
- Patent Document 4 proposes a method for eliminating an error and correcting a count number in consideration of the nature of an error during nucleic acid amplification and a read error during sequencing.
- the current technology 6-8 it was difficult to measure the microbial phase composition at the cellular level.
- the microflora consists of a huge number of bacteria by a number of bacterial species 17.
- a high-throughput cell quantification method with high taxonomic resolution has not been developed so far.
- the present invention provides a method for treating a cell population and a method for analyzing a gene contained in the cell population.
- the present inventors have developed a new method for quantifying the cell type of the bacterial microflora and the cell concentration for each cell type by a high throughput method.
- cOTU cell-based operational classification unit
- a method for treating a cell population (A) From a dispersion of cells containing an isolated cell population, a droplet population containing aqueous droplets, each of which at least a portion of the droplet is a cell and a molecule of cell. A method comprising obtaining a droplet population containing a bar code. [2] A method for analyzing the base sequence of a gene contained in a cell population. (A) From a dispersion of cells containing an isolated cell population, a droplet population containing aqueous droplets, each of which at least a portion of the droplet is a cell and a molecule of cell.
- a droplet population containing a bar code (B) In each of the obtained droplets, an amplification product of a cell barcode and an amplification product of a predetermined gene are obtained, and further, a linkage containing the cell barcode and the base sequence of all or a part of the predetermined gene. Obtaining a product, recovering the obtained conjugate from a droplet into an aqueous solution, and sequencing the obtained conjugate to determine the base sequence of a predetermined gene and the base sequence of a cell barcode. Including, method. [3] In the above (B), the cell barcode amplification product has a first region derived from the first primer, and the amplification product of a predetermined gene has a second region derived from the second primer.
- the first region and the second region have complementary sequence portions that can hybridize with each other, and the first primer and the second primer each link one or more tag molecules.
- the tag molecule is not included in the conjugate and
- the above-mentioned [B] further comprises removing the amplification product having a tag molecule from the conjugate recovered in the aqueous solution by using a column or beads carrying a molecule having an affinity for the tag molecule. 2] The method described in. [4] (C-1) The above-mentioned [2] or [2], which further comprises clustering the determined base sequence based on the base sequence of the determined cell barcode to obtain a plurality of first clusters. 3] The method described in.
- the above-mentioned [4] further includes estimating the number of cells contained in the cell population or the number of cells having a specific predetermined gene from the number of the first clusters obtained.
- the method described. [6] (C-2) The above-mentioned [2] or [2], which further comprises clustering the determined base sequence based on the base sequence of the determined predetermined gene to obtain a plurality of second clusters.
- the method described in. [7] (D-2) The method according to [6] above, further comprising estimating the number of cell types contained in the cell population from the number of second clusters obtained.
- the number of cells contained in is estimated, and (i) the number of cOTUs estimated for the first cell population and / or (ii) the number of cells contained in a particular cOTU is estimated for the second cell population.
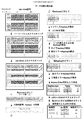
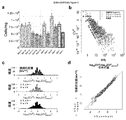
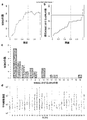
- BarBIQ BarBIQ and its effectiveness.
- a Schematic diagram of BarBIQ. After suspending the sample in the solution, it was vortexed to destroy the bacterial mass.
- b Effectiveness of BarBIQ by simulated cell population.
- Levenstein distance 29 defined as the minimum number of edit distances, substitutions, insertions and deletions; San sequence, 16S rRNA sequence identified by Sanger sequence; ATCC / JCM / DSM- ⁇ number>, strain ID; A, B , Or C, San sequence for each strain; Bar sequence-MK-XX (01-16), sequence identified by BarBIQ (Bar sequence); COTU-MK-XX (01-10), cell-based operational classification.
- cOTU BarBIQ [C] BarBIQ and microscope image [C] microscope ( Comparison of cell concentrations of 10 strains in the simulated cell population measured according to the data in Tables 1 and 2).
- b Sequence identity profile of Bar sequences; Identity, identity between each Bar sequence and its closest 16S rRNA sequence in the three common public databases GreenGene (GG), Ribosome Database Project (RDP), and Silva. sex. Three, a combination of all three databases.
- c Comparison of cell concentrations of cOTU between technical iterations (other iterations are Figure 16). Theoretical Confidence Interval of Sampling Noise Based on Magenta Lines, Poisson Distribution and Normalization by Total Concentration (99.9%); Light Blue Lines, Double Changes; Blue Dots, COTUs Showing Different Concentrations; Inserted Numbers, Blue And the number of gray dots; Ma, Mb, Mc, mouse; dist and prox, position; 1, 2, and 3, technical repetition.
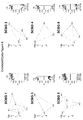
- Correlated bacterial network An example of correlation based on the abundance of a, cOTU pairs. Dots, 6 sample (Ma dist 1, Ma prox 1 , Mb dist, Mb prox, Mc dist, Mc prox) cell concentration of (cells / mg); r, Pearson coefficient. b, Definition of a strongly correlated bacterial group (SCBG).
- a dendrogram with cOTU names and IDs for all SCBGs is shown in FIG. c, cOTU network of SCBG7 and SCBG26 visualized by Force-directed layout 39, respectively.
- FIGS. 12a-f. d SCBG network visualized by Force-directed layout. Edge color Interrelationship between SCBGs between two SCBGs R inter . Schematic diagram including sequence information, purification and sequencing of library generation in BarBIQ. Primers I, II, III, IV were named and designed as P5-index-R1P-barcode-R, Biotin-Link-barcode-F, Biotin-link-805R, P7-R2P-341F; Index (XXXXXXXX).
- BCluster clusters clustered by bar code
- SCluster subclusters clustered by the sequence of 16S rRNA in each BCluster
- Shifted RepSeq RepSeq resulting from insertion or deletion in the primer portion of the read
- 1 RepSeq of one insertion or deletion RepSeq caused by an error of insertion or deletion of one base in the rest of the read after trimming
- Chimera RepSeq RepSeq that can be obtained by PCR chimera
- Rare error RepSeq read after trimming RepSeq caused by one indel (insertion or deletion) and one substitution, one indel and two substitutions, or two indel errors in the rest
- RepSeq type RepSeq sequence type; low count RepSeq, low number Type of RepSeq detected in BClaster; 1-base error RepSeq, type of RepSeq having 1 base difference from other RepSeq, number of RepSeq detected between the former and the latter types of RepSeq is less than
- Bar sequence sequence identified by BarBIQ
- cOTU a cell-based operational classification unit.
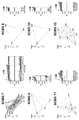
- the total concentration used to calculate the absolute cell concentration of each cOTU and the sampling noise of each cOTU in the BarBIQ measurement.
- a Total bacterial concentration of each sample measured by droplet digital PCR (see item of BarBIQ method in Examples).
- Ma, Mb, Mc, Md (Md is not sequenced), mouse; dust and prox, position (see Figure 2a); 1, 2, and 3, technical iterations. Error bar, standard deviation (n 5).
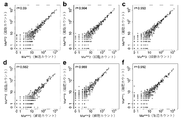
- b as a function of the average of the count, Ma count in technical replicates three dist CV 2 (CV, coefficient of variation) for each COTU; obtained based simulations 1 and 2, as well as the theoretical values to the Poisson distribution.
- c distribution of log 10 (CV 2 ) -log 10 (CV Poisson 2 ); CV of each CV, CV of cOTU; theoretical CV based on CV Poisson, Poisson distribution.
- d Q-Q plot 45 of the distribution of log 10 (CV 2 ) -log 10 (CV Poisson 2 ) between the measurement of Ma dust and simulation 1 and between simulation 1 and simulation 2.
- FDR False Discovery Rate
- a function p. adjust 46 determined by (R package stat); Ma dist / Ma prox , the average cell concentration of Ma dist against mean cell density in Ma prox ratio; dashed line, Ma dist a total concentration ratio of Ma prox.
- CV coefficient of variation
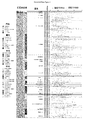
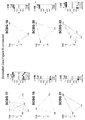
- Left classification from gate to genus.
- the top row shows the distribution of ⁇ r ⁇ between a given cOTU and all other cOTUs, where ⁇ r ⁇ is the absolute Pearson correlation coefficient; cOTU is the ⁇ r ⁇ r of each cOTU along the horizontal axis. Lined up by the average (cyan line). Bottom, distribution of ⁇ r ⁇ for each cOTU indicated by relative frequency; for each row in the figure above, the numbers are normalized by their minimum (as 0) and maximum (as 1) (ie, horizontal). Normalization along the axis).
- This analysis makes it possible to find "master bacteria", which are bacteria (ie, cOTUs) that are highly correlated with most others in the bacterial correlation network. Analysis of strongly correlated bacterial populations (SCBG).
- a Number of SCBGs as a function of the height threshold of the dendrogram (FIG. 4b). Red dotted line, threshold 0.6. b, the number of cOTUs in the SCBG containing the most cOTUs as a function of the threshold. c, distribution of the number of cOTUs in SCBG when the threshold is 0.6. d, Ma dist 1 of the sample at each SCBG, Ma prox 1, Mb dist , Mb prox, the average cell concentration of cOTU for Mc dist, and Mc prox; black spots, all cOTU in SCBG is positively correlated; Purple and light blue dots all showed a positive correlation of cOTUs, while different subgroups of cOTUs showed a negative correlation.
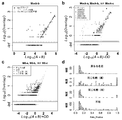
- a Distribution of fluorescence intensity of droplets measured by ddPCR of cecal cell samples using primers F1-Fw / F1-Rv. Same measurements as b, a, but with different primers 341F / 805R.
- c a mixed sum of four Gaussian distributions and four Gaussian distributions, each fitted to the fluorescence intensity distribution of b.
- d the percentage of positive droplets calculated based on the fitting as a function of the number of fitted Gaussian distributions.
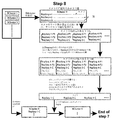
- the logical diagram of step 5. Distribution of 16S rRNA gene lengths in the V3-V4 region registered in the Silva database. Only 16S rRNA genes matching primers 341F and 805R were used (86.4% of the total). Length, number of bases from the first base matching 341R to the last base matching 805R. The total total length of the corresponding 16S rRNA gene is in the range of 400-500.
- Base differences the number of base differences between the RepSeq type and the closest San sequence in each group (with the San sequence as the ID group).
- b The highest average count of RepSeq types with a different base of 1 base to the ratio of the average count to the average count of RepSeq types matched in each group.
- Sky blue label group ID.
- Clustering of Bar sequences to cOTU. a log 10 for log 10 (A ⁇ B) based on the data of the Mock-b (Overlap). All possible pairs of dots, Bar sequences; Overlap, A and B are the number of BClasters containing Bar sequence, BS_A only, and BS_B only (BS_A and BS_B are the two Bar sequences in the pair). ..
- the data was based on the data for M0-a, M0-b, and M0-c.
- the name of each Bar array is based on the Silver database. Different names; the mapped names of the pair of Bar arrays are different; the same names (family), the mapped names of the pair of Bar arrays are the same, only the names of the families or higher classifications are determined. Not; same name (genus), the mapped name of a pair of Bar sequences is the same, only the name of the genus or a higher classification name is determined; unknown, of the pair of Bar sequences One or both of them are not registered in the database.
- d Distribution of Radio_Positive (see step 12).
- b A comparison of the abundance of cells and ecDNA after filtration as measured by ddPCR and microscopic images. Abundance, total number of copies measured by ddPCR, or total number of bright spots measured by fluorescence imaging.
- c Comparison of ecDNA and cell separation using filtration and centrifugation. Abundance, same as a. Cellular and extracellular DNA of cecal samples.
- c and d a comparison of the total concentration of cells and ecDNA each cOTU concentration, the non-filtered sample concentration of the sample Ma dist and Ma prox.
- the red dots are cOTUs in which ecDNA was detected, and the black dots are cOTUs in which ecDNA was not detected.
- Each of the three repeated filtrations was compared. Dependence on the random number of bases designed for the barcode of the number of clusters (unique barcode). The result of sequence run 1 is shown.
- the color box that surrounds the name from the gate to the family level represents its ownership.
- the subdivision of a mouse large intestine sample using a brain slicer is shown. On panels a to f, mouse colon samples are placed on a brain slicer (panel a), embedded (panel b), frozen (panel c), cut (panels d and e), and cut (subdivided). It is shown that a sample (panel f) was obtained (panel f).
- the region division from the cecum (Cecal side) to the anus (Anal side) is shown.
- the C area was further subdivided into a central portion and a peripheral portion (panel g).
- the concentration of the barcode sequence of each sample is shown.
- "-Cell” indicates the result in the absence of cells, and "+ Cell” indicates the result in the presence of cells.
- the relationship between the number of cycles of the third stage of ddPCR and the fluorescence intensity of the droplet (panel a) and the ratio of the positive droplet to the total droplet (panel b) is shown.
- the relationship between the reaction time of the third stage of ddPCR and the ratio of positive droplets to all droplets is shown.
- the "object” is an organism, an animal and a plant.
- Subjects are, for example, vertebrates, eg, mammals, fish, birds, amphibians, reptiles, such as humans, chimpanzees, gorillas, orangoutans, monkeys, primates such as marmosets and bonobos, pigs, rats, mice. , Cows, sheep, goats, horses, cats and dogs, and can be quadrupeds (eg, meat, evening hornobos, bonobos and rodents).
- a "cell” is a cell of an organism and can be a cell of a bacterium, a protozoa, a chromista, an animal, a plant, and a fungus.
- the term "unified cell” means a cell having a separate existence form. That is, the solution containing unified cells is a solution containing one or more cells, and each cell has a separate existence form.
- a solution containing unified cells is preferably a solution that exhibits a form in which all or most of the contained cells are separated one by one, but as long as the unified cells are contained, the solution is a solution. May include a cell mass formed by adhesion of two or more cells.
- a "cell population” is a composition containing a plurality of cells.
- a cell population generally comprises a plurality of types of cells, and each type may contain a plurality of cells, respectively.
- the form of the composition can be liquid or solid.
- the "microbial flora” is a group of microorganisms. In nature, there are various microbial flora. For example, soil, water (sea, river, swamp, pond), air, animal epidermis, hair, oral cavity, nasal cavity, gastrointestinal tract (esophagus, stomach, small intestine, large intestine, cecum, etc.), and genital organs; and plant coat. , And the nasal flora is present in the roots and the like. The microbial flora in an animal may reflect or affect the health of the animal.
- the microbial flora may include 10 or more, 20 or more, 30 or more, 40 or more, 50 or more, 60 or more, 70 or more, 80 or more, 90 or more, or 100 or more types of microorganisms.
- the microbial flora can contain unknown microorganisms. Unknown microorganisms in the microbial flora can be 10% or more, 20% or more, 30% or more, or 40% or more of the types of microorganisms contained.
- a "cell barcode” is a nucleic acid having a unique base sequence assigned to each cell.
- Each cell can be associated with a cell barcode having a different base sequence (ie, a base sequence unique to the cell). Therefore, the number of cell barcodes can indicate the number of cells. By doing so, it is possible to convert the number of cells, which has been quantitatively measured in the past, into a number of base sequences that can be qualitatively evaluated. Sufficient types of cell barcodes can be prepared for the total number of cells present.
- Isolation means separating the object from others. Isolation may include concentrating or purifying the desired product after separation.
- amplification product refers to nucleic acid obtained by amplification by gene amplification (for example, polymerase chain reaction (PCR)).
- PCR polymerase chain reaction
- the primer can be a single-stranded nucleic acid having a sequence that hybridizes to the site to be amplified in the DNA, but the 5'end of the nucleic acid has an additional base sequence (eg, an adapter, an index sequence unique to the sample). And restriction enzyme recognition sites, etc.) may be linked.
- paralog refers to two genes generated by gene duplication on the genome.
- ortholog refers to a gene having a homologous function that exists in different organisms.
- a method for treating a cell population is a method for treating a cell population.
- A From a dispersion of cells containing an isolated cell population, a droplet population containing aqueous droplets, each of which at least a portion of the droplet is a cell and a molecule of cell.
- Methods are provided that include obtaining a droplet population containing a bar code.
- a droplet population includes aqueous droplets, each of which at least a portion of the droplets comprises one cell and one molecule of cell bar code.
- the cell can be a cell that has constituted an isolated cell population (eg, a microbiota).
- the cell dispersion of (A) above can be obtained by dispersing the cells contained in the isolated cell population in an aqueous solution.
- the cells can be dispersed in the solution by a water stream, for example, shear stress by water due to shaking, pipetting or the like.
- dispenser is meant dissociating a cell mass containing a plurality of cells into a plurality of single cells in an aqueous solution, and preferably suspending the single cells in the aqueous solution.
- the method of the present invention may comprise dispersing the cells contained in an isolated cell population in an aqueous solution.
- the cell population can be a microbial flora.
- a natural microbial flora can be preferably used as the microbial flora.
- Microbial flora includes, for example, soil, water (sea, river, swamp, pond), air, animal epidermis, hair, oral cavity, nasal cavity, gastrointestinal tract (esophagus, stomach, small intestine, large intestine, cecum, etc.), and genital organs;
- the microbial flora present in the hull and root of the plant can be used, for example, the microbial flora of the gastrointestinal tract can be used.
- the microbial flora examples include the microbial flora in the oral cavity, the esophagus, the stomach, the duodenum, the small intestine (eg, in the jejunum or ileum), and the colon.
- Natural microbiota is preferably analyzed without culturing, but it may be acceptable to analyze after culturing.
- the microbial flora comprises an unknown microorganism.
- the type of unknown microorganism can be 10% or more, 20% or more, 30% or more, or 40% or more of the type of microorganism contained in the microflora.
- the cell population may comprise extracellular DNA. Extracellular DNA may contain certain genes. Extracellular DNA may be removed prior to processing the cell population. The removal of extracellular DNA can be performed by filter filtration or centrifugation as described later. The extracellular DNA may be included in the cell population to be treated.
- Cell population isolation is performed by acquiring a cell population. Isolation of a cell population may further comprise separating the acquired cell population from one or more components other than cells. Separation of a cell population from one or more components other than cells can be performed by filter filtration or centrifugation. Filter filtration can be performed, for example, using a filter with a sub ⁇ m pore size (eg 0.22 ⁇ m) and the cell population can be recovered from the residue on the filter.
- a sub ⁇ m pore size eg 0.22 ⁇ m
- cells contained in an isolated cell population can be dispersed in an aqueous solution before forming droplets.
- "dispersing" means that each cell is separated and exists. Dispersion can be achieved by breaking the cell mass by pipetting so as not to destroy the cell.
- the aqueous solution is not particularly limited as long as it does not destroy the cells, but water, physiological saline and the like can be used.
- the isolated cell population can be dispersed in pure water, physiological saline, a reaction solution for gene amplification, or the like.
- the droplets can be created in oil. Therefore, in this aspect, the droplet group obtained in (A) contains water-based droplets (water droplets) in the oil. That is, the droplet group obtained in (A) can be water-in-oil droplet-type particles (a water-based droplet group dispersed in oil).
- the particle size of the water droplet may be, for example, a numerical value having a lower limit value in the range of 10 ⁇ m to 100 ⁇ m and a numerical value having an upper limit value of 50 ⁇ m to 1000 ⁇ m.
- the particle size of the water droplets is, for example, 10 ⁇ m to 1000 ⁇ m, for example, 20 ⁇ m to 900 ⁇ m, 30 ⁇ m to 800 ⁇ m, 40 ⁇ m to 700 ⁇ m, 50 ⁇ m to 600 ⁇ m, 50 ⁇ m to 500 ⁇ m, 50 ⁇ m to 400 ⁇ m, 50 ⁇ m to 300 ⁇ m, 50 ⁇ m to 200 ⁇ m, 50 ⁇ m to 150 ⁇ m. Or, for example, it can be about 100 ⁇ m.
- Such a droplet population can be appropriately produced by those skilled in the art using, for example, a microfluidic device. Such a droplet population can also be produced using a commercially available droplet making machine. As a commercially available droplet manufacturing machine, for example, a QX200 Droplet Generator manufactured by BIO-RAD can be used.
- the method for treating a cell population of the present invention is a droplet population containing an aqueous droplet, and the droplet has one cell and one kind of base sequence unique to the cell. It is possible to obtain a droplet population containing an aqueous droplet containing one molecule of a cell barcode (eg, DNA). More specifically, in the method for treating a cell population of the present invention, for example, an aqueous solution containing a plurality of dispersed cells and an aqueous solution containing a cell barcode having a different base sequence for each molecule are mixed in oil. By doing so, a droplet population containing an aqueous droplet containing one cell and a single type of cell barcode unique to each cell is obtained.
- a cell barcode eg, DNA
- cell barcodes having another type of base sequence unique to the cell.
- Cells can be included in 50% or less, 40% or less, 35% or less, 30% or less, 25% or less, or 20% or less (eg, 20%) of all droplets. By doing so, the probability that one droplet will contain multiple cells can be reduced, and in theory, assuming that 20% of the droplets contain cells, the cells. For example, the number of cells contained in 90% or more of the droplets containing the above is 1.
- Cell barcodes may also be included in 50% or less, 40% or less, 35% or less, 30% or less, 25% or less, or 20% or less (eg, 20%) of all droplets. can.
- the number of cell barcodes contained in the droplets containing the cell barcodes can be set to 1.
- a droplet containing one cell and one molecule of cell barcode is obtained, and the droplet is 1 to 10%, 2 to 6%, 3 to 5%, or, for example, 4 of all the droplets. It can be about%.
- the proportion of droplets containing cells to all droplets is 30% or less (preferably about 20%) and the proportion of droplets containing cell barcode to all droplets is 30% or less (preferably about 20%). It can be about 20%).
- the proportion of droplets containing two or more cells and one cell barcode can be, for example, 0.5% or less, 0.4% or less, or 0.3% or less. For example, it can be 0.3% to 0.5%.
- the proportion of droplets containing one cell and two or more cell barcodes can be, for example, 0.5% or less, 0.4% or less, or 0.3% or less. For example, it can be 0.3% to 0.5%.
- the proportion of droplets containing two or more cells and two or more cell barcodes is, for example, 0.05% or less, 0.04% or less, or 0.03% or less. Obtained, for example, 0.03% to 0.05%.
- a droplet containing two or more cells or cell barcodes is preferred as it is less, but it is permissible for such droplets to occur.
- the aqueous droplet may further contain a primer and a gene amplification reagent in addition to one cell and one molecule of cell barcode.
- the reagent does not need to contain a detergent, as the cells are destroyed during the gene amplification reaction.
- the aqueous droplet may be an aqueous solution suitable for the gene amplification reaction (for example, a gene amplification reaction solution).
- the oil can be any oil that is stable and inert under the environment of gene amplification reaction (60 ° C to 100 ° C).
- oils include, but are not limited to, mineral oils (eg, light oils), silicone oils, fluorinated oils or other commercially available oils, or combinations thereof.
- a droplet population including aqueous droplets, each of at least a portion of said droplets.
- a droplet population containing one of the obtained cells and one molecule of cell bar code can be obtained. More specifically, a gene amplification reaction solution containing cells, cell barcodes, primers, and a reagent for gene amplification can be prepared, and a droplet population can be obtained from the solution as described above.
- a method for determining (or analyzing) the gene sequence contained in a cell population From a dispersion of cells containing an isolated cell population, a droplet population containing aqueous droplets, each of which at least a portion of the droplet is a cell and a molecule of cell. To obtain a droplet population containing a bar code, (B) In each of the obtained droplets, an amplification product of a cell barcode and an amplification product of a predetermined gene are obtained, and further, a linkage containing the cell barcode and the base sequence of all or a part of the predetermined gene.
- a method hereinafter referred to as the sequencing method of the present invention
- the sequencing method of the present invention comprising obtaining a product and sequencing the obtained linkage to determine the base sequence of a predetermined gene and the base sequence of a cell barcode. Will be done.
- components other than the templates required for PCR such as primer sets for amplification of cell barcodes and amplification of predetermined genes in cells, dNTPs, and heat-resistant DNA polymerase, are added to the solution.
- the elements necessary for gene amplification can be introduced into each droplet.
- the liquid containing the droplet population can be transferred to a tube for PCR, and the amplification reaction of DNA can be induced in each droplet by PCR.
- gene amplification in each droplet an amplification product of a predetermined gene in the cell and an amplification product of a cell barcode can be obtained in each droplet.
- Amplification may include, for example, 25 cycles, preferably 30 or more cycles.
- the amplification product of a predetermined gene in the cell and the amplification product of the cell barcode can be linked (see, for example, FIG. 5).
- the ligation is an amplification reaction (eg, a PCR reaction) by designing, for example, one of the cell barcode primers and one of the primers of a given gene to have complementary sequence moieties that are hybridizable with each other. ) (See, for example, SEQ ID NOs: 4 and 5 in FIG. 5). By doing so, one kind of cell barcode can be imparted to each molecule of the amplification product of a predetermined gene derived from one cell.
- the cell barcode has a base sequence unique to the cell in the center ⁇ however, the base sequence of a specific number may be the same sequence between the sequences ⁇ , and the base sequence for hybridizing amplification primers at both ends. Can have.
- the base sequence for the amplification primer to hybridize can be a common sequence between cell barcodes.
- the primer for amplifying the cell barcode can have an adapter sequence for sequencing and a base sequence capable of hybridizing with one end of the cell barcode in a gene amplification environment.
- the primer that amplifies the cell barcode may further have an index sequence for identifying the type of sample.
- Another primer that amplifies the cell barcode has a linker sequence for linking to a predetermined gene and a base sequence that can hybridize with another end of the cell barcode in a gene amplification environment. Can be.
- the primer that amplifies a predetermined gene is a base sequence for hybridizing with a linker sequence contained in a primer that amplifies a cell bar code, and a base for hybridizing to a site where a predetermined gene is amplified in a gene amplification environment.
- Another primer that amplifies a given gene may include a base sequence for hybridizing in a gene amplification environment and an adapter sequence for sequencing at the site where the given gene is amplified.
- Another primer that amplifies the given gene may further have a sample-specific index sequence for identifying the sample type.
- the cell barcode amplification product and the predetermined gene amplification product have the same linker sequence, and therefore, during gene amplification, the amplification product of the linkage between the cell barcode amplification product and the predetermined gene amplification product is produced. Can be obtained.
- the adapter sequence for sequencing may contain sequences for bridge PCR before sequencing at both ends.
- the sequence adapter sequence may include the binding site of the sequence primer.
- the adapter sequence for the sequence may contain a sample-specific index sequence to identify the sample type.
- bridge PCR two types of immobilized oligo DNA are hybridized with DNA to be sequenced and having a sequence capable of hybridizing to each of the above two types of oligo DNA at both ends. In that state, it is a technique for amplifying DNA on the surface of a solid phase by PCR.
- an aqueous droplet is contained, and the droplet contains an amplification product of a predetermined gene derived from one cell, and for each molecule of the predetermined gene, one type unique to the cell.
- a droplet population to which the cell barcodes of the cells are linked is also provided.
- each droplet has a predetermined gene derived from one different cell and one type of cell barcode unique to that cell ⁇ that is, each droplet contains a different cell barcode ⁇ .
- the conjugate in which one type of cell barcode unique to the cell is linked to each molecule of a predetermined gene derived from one cell is an adapter sequence for sequencing, a cell barcode sequence, and a linker.
- a sequence, a base sequence of all or part of a given gene, and an adapter sequence for sequencing may be included in this order.
- This linkage may further include an index sequence having a base sequence unique to the sample.
- the index sequence can be contained between any two of an adapter sequence for sequencing, a cell barcode sequence, a linker sequence, a base sequence of all or part of a given gene, and an adapter sequence for sequencing.
- the index sequence may be optionally or additionally included in the adapter sequence for the sequence.
- the predetermined gene is preferably one type, but is not limited to one type, and may be a plurality of types. It is preferable that there is only one type of cell barcode for each cell.
- the base sequence of a predetermined gene and the base sequence of a cell barcode determined for a certain linkage are linked and managed. Based on this association, a given gene to which the same cell barcode is linked can be presumed to be derived from the same cell. Therefore, the sequencing method of the present invention may further include obtaining a combination of a determined base sequence of a predetermined gene and a base sequence containing a cell barcode base sequence for each linkage.
- sequencing method of the present invention may further include presuming that a predetermined gene to which the same cell barcode is linked is derived from the same cell.
- the predetermined gene may be an endogenous gene of a microorganism, preferably a gene that is evolutionarily shared by a wide variety of species, such as a housekeeping gene.
- Housekeeping genes are genes essential for energy metabolism and cell function and are genes that are or will be expressed in any cell.
- the housekeeping gene is not particularly limited, but is, for example, ribosomal RNA (rRNA, for example, 16S rRNA and 23S rRNA), ribosomal intergenic transferred spacers (ITS) existing between 16S rRNA and 23S rRNA, and estimated ABC trans.
- the sequences of these genes can be used in the analysis of the microbiota.
- 18S rRNA can also be used in the analysis of fungi.
- a predetermined gene is two or more kinds of genes, an amplification reaction is carried out under appropriate primers and reaction conditions so that each gene is linked to a cell barcode.
- the predetermined gene can be a gene encoding 16S rRNA.
- the base sequence of a given gene can be the full length of the gene or a partial sequence thereof.
- the sequence does not have to be the full length, but may be a part thereof.
- a part of 16S rRNA can be a V3 region and a V4 region.
- the predetermined gene may be two or more different genes (or two or more genes that are non-homologous to each other).
- the sequence can be performed by breaking the droplets and mixing the solutions contained in all the droplets.
- the sequence can be carried out using a method well known to those skilled in the art.
- the sequence can be performed in parallel using a next-generation sequencer (for example, MiSeq or HiSeq of Illumina).
- a next-generation sequencer for example, MiSeq or HiSeq of Illumina.
- the sequencing method of the present invention may further comprise recovering the DNA of the solution prior to sequencing.
- the recovery of DNA can be performed by recovering the aqueous phase contained separately in each droplet.
- DNA recovery involves using the resulting droplet population as an organic solvent (eg, chloroform, etc.), and preferably a further aqueous solution (eg, buffer, eg, a divalent metal ion killer (eg, Ca 2+ killer) and A Tris buffer containing (eg, ethylenediaminetetraacetic acid (EDTA)), a Tris-EDTA buffer or TE solution) of Mg 2+ is added and stirred well to separate the aqueous and organic phases. , Can be done by recovering the aqueous phase.
- an organic solvent eg, chloroform, etc.
- a further aqueous solution eg, buffer, eg, a divalent metal ion killer (eg, Ca 2+ killer) and A Tris buffer containing (eg, ethylenedi
- the sequencing method of the present invention may further include purifying the DNA prior to sequencing.
- Purification of DNA can be performed by gel filtration of the aqueous solution obtained by the above recovery step. Gel filtration is performed by a method commonly used to separate DNA amplification products and other components in solution (eg, unlinked barcode amplification products, primers that were not used for amplification, etc.). This can be done using a column or the like. As the gel filtration column, for example, a gel filtration column for DNA purification can be used.
- the sequencing method of the present invention may further include purifying the DNA contained in the solution with a column or beads expressing a carboxyl group.
- the dehydrated DNA can be specifically adsorbed to the column or beads expressing the carboxyl group via a salt, and then the DNA can be detached from the column by hydration.
- the beads expressing the carboxyl group for example, Agencourt AMPure XP (Beckman Coulter) or the like can be used.
- the DNA amplification product is a tag (for example, biotin). It is combined.
- tagged DNA amplification products can be concentrated or removed by a column or bead linked to a tag-binding molecule (eg, a tag-binding molecule such as avidin, streptavidin, and neutralvidin).
- the sequencing method of the present invention may preferably include removing a product in which a cell barcode and a predetermined gene are linked to each other.
- one of the primers that amplifies the cell barcode and one of the primers that amplifies a predetermined gene can be used as a primer having a tag and can be designed to have a complementary sequence. That is, only each primer designed to have a complementary sequence can be tagged.
- the cell barcode amplification product and the amplification product of a given gene can be linked to each other in the region corresponding to the tagged primer moiety.
- one of two primers that amplifies a cell barcode and one of two primers that amplifies a predetermined gene has a tag molecule.
- the tag molecule is lost from the link between the cell barcode and the predetermined gene during the amplification of the cell barcode and the predetermined gene, and the tag molecule remains only in the amplified product that fails to link. Therefore, the amplified product that fails to be linked can be removed by affinity using a column or beads to which the tag-binding molecule is bound, whereby the amplified product of the linked product can be purified with higher purity.
- the sequencing method of the present invention is:
- the cell barcode amplification product has a first region derived from the first primer
- the amplification product of a predetermined gene has a second region derived from the second primer.
- the first region and the second region have complementary sequence moieties capable of hybridizing with each other
- the first primer and the second primer each have one or more tag molecules linked to each other.
- the tag molecule is not included in the conjugate and
- the above (B) further comprises removing the amplification product having a tag molecule from the conjugate recovered in the aqueous solution using a column or beads carrying a molecule having an affinity for the tag molecule. good. This makes it possible to separate the failedly linked amplification product with the tag molecule from the desired linkage.
- the sequencing method of the present invention may include deleting a region of a base sequence having low sequence quality.
- the sequencing method of the present invention (C-1) It may further include clustering the determined base sequence based on the base sequence of the cell barcode to obtain a plurality of first clusters.
- the "determined base sequence” may be a combination of a determined base sequence of a predetermined gene and a base sequence including a cell barcode base sequence.
- Clustering the determined base sequence based on the determined base sequence of the cell barcode is not only clustering based on whether or not the base sequence of the cell barcode is exactly the same, but also somewhat. It may include clustering sequences with differences in the same cluster. The reason for clustering sequences with slight differences in the same cluster is that, experimentally, an error occurs in the amplification reaction or sequence of the cell barcode, and the decoded base sequence may be different from the original base sequence. Is. However, errors that occur in amplification reactions and sequences are well known empirically, and in order to prevent the same sequence from being distinguished as different sequences by the corresponding error, sequences with slight differences should be placed in the same cluster. Clustering is effective.
- the base sequence derived from one cell is It will be clustered correctly in one cluster. Therefore, there is no problem in such a case.
- clustering is performed on the basis that the base sequences of the determined cell barcodes are completely the same (distance 0), if there is an amplification error or a sequence error, it is derived from one cell.
- the base sequence can be erroneously clustered into two or more clusters as being derived from different cells.
- sequences with additions, deletions, deletions, or insertions (especially indels) of n bases are also clustered into the same cluster (distance n, where n is a natural number from 1 to 5).
- n is a natural number from 1 to 5
- the base sequence derived from one cell is combined into one cluster. It will be clustered correctly.
- a person skilled in the art can appropriately set n based on the error rate and the sequence error rate in the amplification reaction.
- the cell barcode can be designed so that it is always different from n bases for each cell.
- n can be 1. In another aspect of the invention, n can be 2, and in yet another aspect of the invention, n can be 3.
- the base sequence of the determined cell barcode to be a sequence that differs greatly from cell to cell, when addition, deletion, deletion, or insertion (especially indel) of up to n bases occurs. Also, it is possible to determine which cell barcode the base sequence having the error is derived from. Clustering can be expected to have the effect of reducing the effects of such experimental errors. Clustering can be carried out with reference to WO2018 / 235938, which is incorporated herein by reference in its entirety.
- the cell barcode is a unique sequence for each cell, a conjugate containing the same cell barcode should theoretically be linked only to a given gene derived from the same cell. be. Therefore, by clustering the determined base sequence (including the cell barcode and the amplification product of the predetermined gene) based on the base sequence of the same cell barcode, a predetermined gene derived from the same cell can be determined. .. When only one predetermined gene is present in the cell, theoretically, only one sequence is detected for the predetermined gene in the first cluster obtained in (C-1) above. On the other hand, when a plurality of predetermined genes are present in the cell, theoretically, the first cluster obtained in (C-1) above contains two or more sequences (paralogs) with respect to the predetermined gene. obtain. Therefore, in the method for analyzing a cell population of the present invention further including the above (C-1), it is possible to detect the presence of cells having a predetermined gene duplication (copy, paralog, etc.) in the cell population.
- the number of cells is theoretically equal to the number of cell barcode types or the number of clusters obtained based on the cell barcode base sequence. Therefore, there is an advantage that duplication of a predetermined gene in one cell does not affect the accuracy of the calculated cell number.
- the method for determining the gene sequence contained in the cell population of the present invention is (D-1) It may further include estimating the number of cells contained in the cell population or the number of cells having a specific predetermined gene from the number of the first clusters obtained.
- the method for analyzing a cell population of the present invention can include clustering a determined base sequence based on a determined base sequence of a predetermined gene.
- the method for analyzing the cell population of the present invention is (C-2) It may further include clustering the determined base sequence based on the base sequence of the determined predetermined gene to obtain a plurality of second clusters.
- Clustering the determined base sequence based on the base sequence of a predetermined gene to obtain a plurality of second clusters is not only clustered depending on whether or not they are completely the same sequence, but also somewhat. It may include clustering sequences with differences in the same cluster. The reason for clustering sequences with slight differences into the same cluster is that, experimentally, sequence errors can occur in cell barcode amplification reactions and sequences.
- a criterion (distance n, where n is 1 to 5) is that sequences having additions, deletions, deletions, or insertions (particularly indels) of n bases are also clustered into the same cluster. In (which can be a natural number), even if up to n bases are added, deleted, deleted, or inserted (especially indel) due to amplification error or sequence error, those derived from one type of gene are the same cluster.
- n can be 1.
- n can be 2, and in yet another aspect of the invention, n can be 3.
- a person skilled in the art can appropriately set n.
- the number of clusters obtained corresponds to the number of predetermined gene types.
- the sequence of a predetermined gene is not known in all microorganisms.
- the cell population may contain unknown microorganisms. This is because the unknown microorganism can be treated as different from the known microorganism as long as it has a predetermined gene having a base sequence that can be distinguished from other microorganisms.
- the unknown gene and the known gene are inherently different. Even if they have different base sequences, they will be clustered in the same cluster, and it may be presumed that they are derived from the same gene.
- the above (C-2) is a further step: (C-2 ⁇ )
- a cluster contains different base sequences for a given gene, determining the most abundant base at one position of the different base sequence and the second richest.
- Radio2nd is greater than or equal to a predetermined value, it may further include clustering the base sequence having the most abundant base and the base sequence having the second most abundant base into another cluster.
- the step (C-2 ⁇ ) can be continued for all nucleotide sequence differences until Radio2nd is less than a predetermined value.
- the predetermined value can be, for example, a number of 0.6 or more, 0.65 or more, 0.7 or more, 0.75 or more, or 0.8 or more. This is because if it is a base sequence that really exists, it should be contained in multiple cells and will be detected so as to occupy a certain ratio. On the other hand, since errors are infrequent, this evaluation can distinguish between errors and inherently existing sequences.
- the number of reads may be weighted according to the quality score for the base sequence of a predetermined gene.
- the quality score can be, for example, a score that can be determined based on the Phred algorithm, such as a Phred quality score, or, for example, a Q score. If the quality score is less than a predetermined value, it is weighted low (eg, 0), and if the quality score is greater than or equal to a predetermined value, it is weighted high (eg, depending on the numerical value of the score). May be good. As described in step 3.2 of the embodiment.
- the base sequence having the most abundant base is designated as the "representative base sequence” (RepSeq) in the cluster.
- the base sequence detected only in a single read may be further included to be excluded as an error.
- the sequence may be a truly existing sequence. Therefore, by carrying out the step (C-1) and the step (C-2) in combination, the accuracy of determining the base sequence is further improved. Further, by combining the step (C-1) and the step (C-2), it is possible to determine whether or not a plurality of predetermined genes are present in one cell.
- the method for determining the gene sequence contained in the cell population of the present invention is (C-3) Based on the base sequence of the determined cell barcode, the determined base sequence is clustered to obtain a plurality of first clusters, and based on the base sequence of the determined predetermined gene. It may further include clustering the determined base sequence to obtain a plurality of second clusters.
- a second cluster may be formed for each of the first clusters, or a first cluster may be formed for each of the second clusters.
- the method for determining the gene sequence contained in the cell population of the present invention is (D-3) Based on the information of the combination of the base sequence of the obtained cell bar code and the base sequence of the predetermined gene, it is linked to the base sequence of the predetermined gene classified into at least one second cluster.
- the first cluster in which the base sequence of the predetermined gene is classified is determined from the base sequence of the cell barcode, and the number of the first cluster in which the cell barcode is classified is assigned to the second cluster. It may further include estimating the number of classified cells.
- the base sequence classified into more first clusters is the mother (that is, the base sequence detected in a larger number of cells is the mother), and the lesser one is 1-indel.
- the number of first clusters with more mother leads than 1-Indel (No mother ) and the number of first clusters with less mother leads than 1-Indel (No 1-Indel ) If the No mother is larger than the No 1 -Indel, then a pair of the mother and the 1-Indel can be left.
- the ratio of No 1-Indel to the number of first clusters containing both mother and 1-Indel is less than a given value (eg, (No 1-Indel- 3) / No 1-Indel).
- a pair of mother and 1-indel can be left.
- 1-indel can be deleted and the 1-indel lead count can be added to the mother lead count.
- the number of leads can be added to the mothers found in more first clusters.
- the number of leads of 1-indel can be used as the number of leads of the mother in that cluster. As described in step 7 of the embodiment.
- a chimeric molecule in which one amplification product is linked to another amplification product is generated.
- the method of the present invention produces a very low rate of chimeric molecule, but the method of the present invention may further include identifying the chimeric molecule.
- the chimeric molecule can be specified as follows. For example, the ratio (N_d / Total_N) of the number of first clusters containing a chimeric molecule to the number of first clusters (N_d) containing only a chimeric molecule (Total_N) and not containing a parent is less than a certain value of 1 or less. If so, this chimeric molecule can be excluded from RepSeq as being caused by an error. As described in step 8 of the embodiment.
- the method of the present invention can be used. It may further include creating a cell-based operational classification unit (cOTU).
- cOTU cell-based operational classification unit
- the number and type of microorganisms contained in the cell population are unknown, and in the presence of unknown microorganisms, the gene sequence of the cell population can be determined only from the known gene sequence information registered in the database. The analysis will be inadequate.
- OTU operation upper class unit
- the number of the microbial species is n times the original number. It will be counted as something and will cause an error.
- cOTU is created from the information of RepSeq.
- the cOTU is theoretically a classification unit of microorganisms that can be classified by the base sequence of a predetermined gene, and is a technical means for classifying microorganisms that could be classified only by a higher classification group in more detail. .. This is useful in the analysis of cell populations containing microorganisms that have not been specifically classified or have not been identified. If classification is possible, it is advantageous to be able to compare differences between cell populations based on this.
- cOTU The creation of cOTU can be done as follows. That is, as in the conventional method, one second cluster can be regarded as one cOTU. However, in the present invention, considering that the same cell contains two or more second clusters, a plurality of second clusters linked with the same cell barcode are classified into one cOTU. Further can be included.
- the method of the present invention is, for example, in addition to the above (C-3).
- C-4 When a sequence classified into the same first cluster is classified into a different second cluster, the second cluster is classified into the same cell-based operational classification unit (cOTU, that is, the same cell). Classification) may be further included.
- cOTU cell-based operational classification unit
- an experimental error for example, two cells are contained in one droplet and analyzed, so that one first cluster contains the base sequence of a predetermined gene derived from two cells. It may further include excluding (to be detected).
- the probability that two cells are mixed in one droplet theoretically follows the Poisson distribution. Since the above error type A is considered to be an error depending on the concentration of cells at the time of droplet preparation, dilute the concentration at the time of droplet preparation (in the example, 20% of the droplets contain cells). It is considered that the frequency of this error can be reduced by using a high concentration). Also, when two base sequences are present in different cells, the probability of being contained within one droplet during the operation theoretically follows the Poisson distribution.
- RepSeq may be a sequence after various error elimination in the above step, it is preferable
- all of them are picked up.
- the number of droplets containing two RepSeq is expressed as (Overlap).
- the probability that one droplet contains two RepSeq from different cells is expressed as (A ⁇ B ⁇ ⁇ ) / total number of droplets ⁇ where the total number of cells includes the cell barcode.
- the total number of droplets, A is the number of droplets containing one RepSeq
- B is the number of droplets containing the other RepSeq
- ⁇ is the PCR amplification efficiency, sequence depth effect, etc.
- Log 10 (Poission_Overlap) can be calculated assuming various integers for A and B. If the actual log 10 (Overlap) value is outside the calculated confidence interval for log 10 (Poission_Overlap), it can be inferred that the two base sequences were contained within one cell. Further, when it is inside the confidence interval of log 10 (Poission_Overlap), it can be inferred that the two base sequences were contained in different cells.
- a one-sided confidence interval for example, a confidence interval of 95% or more, 98% or more, 99% or more, or 99.9% or more
- the two base sequences were contained in one cell when the Poisson distribution cannot be statistically explained.
- the Poisson distribution it can be inferred that the two base sequences were present in different cells.
- the results of RepSeq in the same microorganism are considered to be the same in different samples. Therefore, even in different samples, when reproduced, a plurality of different cell population samples are measured, and the value of log 10 (Overlap) with respect to the number of samples containing two RepSeq is a confidence interval of log 10 (Poission_Overlap).
- the ratio of the number of samples outside of can be determined, and if this ratio is greater than a certain value (eg, the constant value can be a number greater than or equal to 0.4), then two RepSeqs are derived from one cell. Then it can be estimated.
- a prediction classification group having the highest score is created by classifying using the RDP classification or by machine learning the training set of 16s rRNA in the RDP classification.
- this can be referred to as cOTU.
- the RDP classification is a tool for discriminating microbial species from the base sequence of 16S rRNA developed by the Ribosome Database Project.
- the method of the present invention may further include correcting (or standardizing) the total number of cells calculated by the method of the present invention by the total number of cells estimated from the count by an optical microscope or the like.
- correcting (or standardizing) the total number of cells calculated by the method of the present invention it is possible to improve the prediction accuracy of the number of cells (for example, the number of cells in a specific cluster or the number of cells in a specific cOTU). ..
- the method of the invention can be used to make comparisons between two different cell populations.
- the method of the present invention (E) For each of the first cell population and the second cell population different from the first cell population, (i) the number of cOTUs contained in the cell population and / or (ii) included in a particular cOTU. The number of cells was estimated and (i) the number of cOTUs estimated for the first cell population and / or (ii) the number of cells contained in a particular cOTU was estimated for the second cell population (i). ) It may further include comparing with the number of cOTUs and / or (ii) the number of cells contained in a particular cOTU.
- the number of cells in the cell population to be compared can be kept equal.
- the characteristics of each cell population can also be described from the viewpoint of cOTU by comparing the number of cOTUs and the number of cells contained in each cOTU between two different cell populations.
- the two cell populations can be, for example, cell populations isolated from the same site of the same subject at different times, cell populations isolated from different sites of the same subject at the same time, and the same of different subjects. It can be a cell population isolated from the site at the same time.
- the method of the present invention (F) Estimated number of cOTUs for the first cell population and (ii') number of cells contained in a particular cOTU, and (i) number of cOTUs estimated for the second cell population and (Ii') may further include comparing with the number of cells contained in a particular cOTU.
- cell populations (this cell population includes multiple cOTU taxa, and the number of cells is determined for each cOTU taxon) using various indicators of similarity between groups. Can be compared).
- the similarity between the first cell population and the second cell population can be determined as the root mean square (cf Euclidean distance) of the difference in the number of cells contained in each cOTU.
- the degree of similarity between the first cell population and the second cell population can be obtained as the sum of the absolute values of the differences in the number of cells contained in each cOTU (cf Manhattan distance). The larger the numbers, the more dissimilar they are, and 0 if they are exactly the same.
- Bray-Curtis dissimilarity is a standardized version of Manhattan distance.
- the cell composition of the first cell population is (X 11 , ..., X 1n ) and the cell composition of the second cell population is (X 21 , ..., X 2n )
- Bray- The Curtis index is calculated by the following formula.
- the Bray-Curtis index is 1 when the two groups are completely different, and 0 when they are exactly the same. In this way, it is sometimes called dissimilarity because it is an exponent designed to be large in different cases.
- the Bray-Curtis index can be calculated using a statistical processing program (eg, a function of R's package vegan, eg, a vedist function).
- the similarity can be evaluated by evaluation indexes often used in the field of crowd biology, such as Morishita index, Jaccard index, and Chao index.
- the standard deviation and confidence interval of the estimated similarity can be evaluated by the bootstrap method or the like.
- the method of the present invention may further include performing hierarchical clustering between cOTUs.
- Hierarchical clustering can be performed by a method well known to those skilled in the art, for example, based on the strength of the correlation between cOTUs (for example, Spearman's correlation coefficient r).
- Hierarchical clustering may also be performed by a method well known to those skilled in the art based on the distance between cOTUs calculated from r. The distance can be calculated, for example, by 1-minimum ( ⁇ r' ⁇ ) [r' ⁇ (r-OCI, r + OCI)] ⁇ where OCI means a 90% one-sided confidence interval for each r ⁇ .
- the results of hierarchical clustering can be displayed as a phylogenetic tree. This can be done, for example, with the R package hclust or heatmap. Further, a network of cOTUs having a Pearson correlation coefficient r of a threshold value (for example, 0.5 or more, 0.6 or more, etc.) or more can be illustrated using a package igraph. In this way, the correlation between cOTUs can be illustrated from the relationship of cOTUs in a plurality of cell populations.
- a threshold value for example, 0.5 or more, 0.6 or more, etc.
- the correlation between the known microorganisms can be clarified, but even if the cOTU corresponds to the unknown microorganism, the correlation between the cOTUs should be clarified. Can be done. If a cOTU corresponds to one of the known microorganisms, it may reveal a correlation with other microorganisms of the known microorganism (the other microorganism may be unknown or known). can. In addition, when the two correlated cOTUs correspond to two known microorganisms, it can be used to find a new correlation between the two known microorganisms.
- the method of the present invention can be used to clarify the correlation between microorganisms by examining a plurality of cell populations (for example, a plurality of bacterial flora).
- the health status of a subject may correlate with the bacterial flora of the subject. Therefore, by further investigating the correlation between the health condition of the subject and a certain cOTU, even if the cOTU itself is an unknown microorganism, it is possible to predict the health condition of the subject from the cOTU corresponding to the unknown microorganism.
- the analysis has been performed on the premise that one microorganism has only one predetermined gene, whereas in the present invention, one microorganism has a plurality of predetermined genes. If there is, it provides a way to describe it by the concept of a new group called cOTU. Furthermore, by qualitatively counting the number of cells for each cOTU using a cell barcode, it is possible to accurately count the cells contained in each cOTU. By analyzing the cell population to be analyzed by the method of the present invention, the type of endogenous cOTU and the number of cells contained in each cOTU can be determined.
- the present invention has the advantage that the analysis accuracy does not decrease even when the number of copies of the gene differs depending on the cell. That is, even if the microorganisms are of the same species, the number of gene copies in the cells may differ from cell to cell. In such cases, with conventional methods, the number of copies of the gene could affect the cell count.
- the number of cells since the number of cells is qualitatively counted using a cell barcode, the number of cells can be counted without being affected by the number of copies of the intracellular gene.
- Some microorganisms release substances that affect the environment (eg, toxins, growth factors, etc.). Accurately measuring the number of cells makes it possible to estimate the amount of released substance more accurately, which can open the way for mathematical modeling based on the amount of released substance.
- the genes to be sequenced may be one specific gene or a plurality of genes. In the method of the invention, the genes to be sequenced need not be whole genome.
- the base sequences of the genes encoding all 16S rRNA contained in the cell population are sequenced, and the obtained base sequences are classified based on the threshold value.
- the threshold value for example, 97% was set for the identity, and those having 97% or more identity were regarded as the same gene and analyzed.
- microorganisms that should belong to essentially biologically different taxa such as different species, different genera, and different families were recognized as one group.
- the same sequence found in multiple cells may be a sequence that originally existed, which can be confirmed by a cell barcode.
- the method of the present invention can be an evaluation method that is not affected by the similarity of the base sequences if the base sequences are different.
- a simulated bacterial flora (here referred to as a "simulated cell population") composed of known bacteria of known concentrations was created to validate the measurement system and then the actual bacterial flora (here the cecum). Bacterial flora) was examined.
- JCM10188 was cultured on GAM agar (Nissui), bacterial colonies were collected and suspended in PBS by vortexing at 3,200 rpm for 1 minute (VORTEX GENE 2, Scientific Industries). Ten strains were diluted with PBS and mixed according to the concentration set in a Class II biosafety cabinet (Table 1). Following each step of dilution or mixing, vortexing was performed at 3,200 rpm for 1 minute. This mixed 10 strains is called a "simulated cell population". The simulated cell population was stored at -80 ° C until the experiment.
- Bacterial concentration measurement by microscopic image The concentration of each strain was measured by fluorescence imaging under a microscope. Fluorescently stained bacteria were measured using a polystyrene microsphere (Bacteria Counting Kit, Thermo Fisher Scientific). Bacteria were stained by heating with Propidium iodide (Thermo Fisher Scientific) at 70 ° C. for 5 minutes. Volume was calculated based on the concentration of microspheres measured using a bacterial counting chamber (SLGC). Five independent measurements were performed for each strain; the mean and standard deviations (as error bars) of these five measurements were used to calculate the concentration of each strain in the simulated cell population.
- SLGC bacterial counting chamber
- a, b, and c are based on three sampling iterations. Absolute concentrations were obtained by normalizing raw counts determined from the sequence using the total concentration of simulated cell populations (94,400 cells / ⁇ l) measured by droplet digital PCR (ddPCR).
- Sequence method of 16S rRNA Briefly, bacteria of a simulated cell population were suspended in PBS and continuously subjected to lysozyme, achromopeptidase, and proteinase K for cytolysis. DNA was then recovered by phenol-chloroform extraction. The V3-V4 region of the 16S rRNA gene was amplified using region-specific primers containing the Illumina adapter nucleotide sequence (CONV341F and CONV805R in Table 3). Amplified products were purified using AMPure XP magnetic beads (Beckman Coulter) and indexed using Nextera XT Index Kit v2 (Illumina).
- mice Male mice were purchased from CLEA Japan and maintained in the RIKEN facility for 3 days by feeding the same cage with CE-2 feed (CLEA Japan) prior to sampling.
- mice cecum contents The murine cecum was surgically removed within 10 minutes after cervical spine dislocation under sevoflurane anesthesia. Cecal contents at different sites (FIG. 2a) were sampled by slicing with sterile scissors. The sampling process was performed within 10 minutes after surgery in a Class II biosafety cabinet. Samples of each site of each mouse were collected on a DNA Lobind Tube (Eppendorf). In the control, two blank test tubes were used. Sample weights were measured immediately after collection on a DNA Lobind Tube (range 8.57 to 19.82 mg for all samples). Next, each sample was dispersed in added PBS (50 ⁇ l / mg) and mixed by vortexing at 3,200 rpm for 1 minute. Suspended samples were stored at 4 ° C until subsequent experiments.
- PBS 50 ⁇ l / mg
- the extracellular DNA contained in the suspended sample and the filter-passing solution was stored at 4 ° C. until subsequent measurements.
- the appropriateness of DNA separation using a 0.22 ⁇ m filter is such that the amount of extracellular DNA in the filter-passing fluid is almost the same as that in the case of using a filter having a pore size of 0.1 ⁇ m, and the amount of extracellular DNA in the filter-passing fluid is almost the same. It was confirmed that no cells were detected in the cells, that the amount of bacteria recovered from the filter after filter filtration was equal, and that the amount of bacteria recovered from the filter correlated with the number of bacteria collected by digital PCR (Fig.). 31).
- the mixture was encapsulated in droplets with a Bio-Rad droplet generator, and 30 ⁇ l of the mixture and 80 ⁇ l of Droplet Generation Oil for Probe (Bio-Rad) were added to each channel on a DG8 TM cartridge. Loaded (32 channels were used for each sample). Approximately 600,000 cells for simulated cell population measurement, 2400 ⁇ L containing approximately 600,000 copies of cell barcodes, 320 units of Sample Taq, and primers, dNTPs, ddPCR TM Supermix for Solutions (No dUTP). After vortexing, the mixed solution was encapsulated in droplets using 80 channels per sample.
- the library generated by the droplet amplification technique was recovered using chloroform and 80 ⁇ l TE buffer (Invitrogen) and 280 ⁇ l chloroform (Sigma) were collected from each DG8 TM cartridge (8 wells). It was mixed with the droplets, then pipeted 10 times and vortexed until the water and organic phases were separated; after centrifugation (21,900 g, 10 minutes), the solution of the aqueous phase containing the library was extracted.
- Non-target DNA such as unlinked barcode amplifications, residual primers, and by-products in the recovery solution were then purified by bead purification using AMPure XP and gel purification using 2% E-Gel TM EX Agarose Gels (Thermo Fisher Scientific). Was removed. Then, the biotinylated 16S rRNA amplification product was removed with streptavidin magnetic beads (NEB), and the unbinding 16S rRNA amplification product was biotinylated with the primer Biotin-link-805R (FIG. 5). 28 . The purification steps using AMPure XP, gel, and streptavidin beads were each performed twice.
- the purified library was concentrated by DNA Clean and Concentrator Kit (Zymo Research).
- the quality of the library was confirmed by Agilent 2100 Bioanalyzer and the concentration was measured by qPCR (KAPA SYBR Fast qPCR kit, KAPA Biosystems) using primers P1_qPCR_Fw and P2_qPCR_Rv (Table 3).
- qPCR KAPA SYBR Fast qPCR kit, KAPA Biosystems
- the Illumina Index 1 sequencing primer was replaced with a custom primer named I1_primer (Table 3) to read the 16S rRNA sequence instead of the index.
- I1_primer Table 3
- the fluorescence intensity of the droplets is then measured by the QX200 Droplet Reader (Bio-Rad) and the number of positive and negative droplets is determined based on the threshold, which is the valley of the bimodal distribution of intensity by the software QuantaSoft (Bio-Rad). (Fig. 18a). Finally, the sample concentration was calculated based on the ratio of positive and negative droplets and the dilution of the sample.
- the proportion of positive and negative droplets was determined by Gaussian fitting due to the apparent obscure separation between the distribution of positive and negative droplets in the case of 341F / 805R (FIG. 18b). ..
- the function normalmixEM in the R package mixtool four Gaussian distributions were used to fit the peak of the intensity distribution (Fig. 18c).
- a fit with two Gaussian distributions can be sufficient, one for positive droplets and the other for negative droplets.
- the intensity distributions with different numbers of Gaussian distributions were fitted.
- a Gaussian distribution of 4 or more (tried 6 or less) was used, the proportion of positive droplets was found to be stable (FIG.
- the concentration of the cell barcode does not affect the concentration measurement in BarBIQ because it does not allow it. However, higher concentrations of cell barcodes produce more junk amplicon, which may affect the identification of 16S rRNA sequences. On the other hand, low cell barcodes will reduce the efficiency of bacterial detection.
- the detection rate of bacterial cells at these concentrations was in the range of 3% to 11%.
- the detection rates of different samples differed by about 3-fold even with the same concentration of cell barcodes, which may be due to the low concentration of instability of the cell barcode molecules.
- the detection rate basically affected the measurement of the proportional concentration of all detected cOTUs, as the cOTU count determined by the sequence showed a good correlation between repeated experiments showing different detection rates of cells. It was suggested not to do so (Fig. 15).
- Spike-in Controls for BarBIQ Sequences Spike-in controls designed to avoid imbalanced base types in sequencing are mixed with the library and simultaneously, as is often done with Phix in amplification product sequencing 54. Sequenced. The outline of the creation of the spike-in control is shown in FIG. First, two single-stranded DNA (ssDNA) StdTarget1 and StdTarget2 containing random bases of 174 and 176 were ligated overnight with T4 RNA ligase (NEB) at a concentration of 400 nM, then at 65 ° C. for 15 minutes. An enzyme denaturation step was performed.
- ssDNA single-stranded DNA
- NEB T4 RNA ligase
- RandomBar_std1, RandomBar_std2, RandomBar_std3 and RandomBar_std4; FIG. 16 and Table 3) designed separately from the linkages of StdTarget1 and 2.
- Barcode templets were prepared and extended from 90 ° C. to room temperature for 15 minutes using Klenow polymerase (NEB).
- indexing primers (Index_NSE501 for RandomBar_std2, Index_NSE502 for RandomBar_std3, Index_NSE505 for RandomBar_std4, Index_NSE505 for RandomBar_std4, Index_NSE50 for RandomBar_std1 and Table3d.
- Four types of DNA products were amplified from the elongated template prepared by the process. Products containing about 600 base pairs were purified by gel electrophoresis. Two more PCRs were performed with P1_qPCR_Fw and P2_qPCR_Rv primers to amplify more products; products from each round of PCR were purified by gel electrophoresis. Spike-in controls were made by mixing these four products in equal proportions based on the concentrations measured by qPCR using primers P1_qPCR_Fw and P2_qPCR_Rv.
- the unique RepSeq sequence type was named the Bar sequence. Bar sequences were then clustered into cOTUs based on their co-detection frequency in the same droplet. If more than one Bar sequence was frequently detected in the same droplet, they were considered multiple 16S rRNA genes from the same bacterium and clustered into a single cOTU. The number of cells for each cOTU was then counted by the number of unique cell barcodes (ie, barcode clusters).
- the absolute cell concentration of each cOTU was determined by standardizing the cells counted in the cOTU sequence using the total concentration of the sample measured by ddPCR. In addition, contaminated cOTUs during sampling and / or measurement were identified by controls. Most of the pipeline was written in Perl (version 5.22.1), and the others were implemented in software. R (version 3.5.1), nucleotide sequence cluster riser (version 0.0.7) 25 , bwa (version 0.7.15) 49 . The Perl modules and R packages used in this pipeline are listed in Table 4.
- R1 (30 bases) is a cell barcode
- I1 (295 bases) and R2 (bases) are 16S rRNA sequences
- I2 (8 bases) makes each sample unique. It was an index to label. Table 4 summarizes all three sequence operations.
- Step 1 Cell Barcode-Based Clustering
- Cell barcode (R1) reads were sequence-based clustered as previously reported (WO2018 / 235938A), except for the deletion of the original low quality read. ..
- low quality R1 reads (whose average score is less than 15) containing at least one window of 47, 4 consecutive bases were excluded.
- the percentages of leads in Sequence Runs 1, 2, and 3 were 0.23%, 0.05%, and 0.06%, respectively, and were excluded by this process.
- R1 reads matching the last four fixed bases of the designed cell barcode were selected for the next step.
- R1 reads with all distance 2 parameters from the same sequence run, including both samples and spike-in controls, were clustered using software, nucleotide sequence-cluster riser 25. Reads that were indexed differently but clustered in the same cluster were excluded. The resulting cluster was named BClaster. Each read had two 16S rRNA sequences (I1 and R2) and a cell barcode (R1) (FIG. 6).
- Step 2 Trimming based on low quality ends and primer parts of leads I1 and R2
- the ends of all leads were trimmed in place based on the quality of the leads and their primer parts.
- the quality of the read base in the MiSeq sequence is generally reduced at the ends of the leads, causing more errors at the ends 50 .
- the lead lengths need to be kept the same, so we applied uniform thresholds and trimmed the ends of all leads in a single sequence operation.
- the trimming position of the sequence run was determined based on the average quality of all leads; the rule for selecting the trimming position was that the average quality of the average quality of the two consecutive positions was lower than 25 (the average quality of the two consecutive positions).
- Step 3 Clustering with 16S rRNA sequences (I1 and R2) At this stage, two substeps were performed to cluster the reads within each BClaster based on the 16S rRNA sequences (I1 and R2).
- Step 3.1 Clustering by substitution distance
- reads I1 and R2 are clustered with a parameter of distance 3 based on the substitution distance between them using a software nucleotide sequence cluster riser to obtain the same MiSeq ID.
- the leads I1 and R2 having were considered as a single lead by physically connecting them.
- Step 3.2 Single-position-based clustering of reads Step 3.1 integrated a very similar sequence that may be a true 16S rRNA sequence rather than an error, so an additional clustering step was used. ..
- the reads were reclustered based on the specific location of the reads (all reads were aligned with the first base).
- a logical diagram of this process is shown in FIG. The number of reads containing the type of base (A, T, C, G) is counted for each read position, and the ratio of the number of reads containing the second most abundant base to the number of reads containing the first abundant base (the ratio of the number of reads containing the second most abundant base). (Named Ratio2nd) was calculated.
- the count for each read was weighted by the quality score of the sequence of bases at this position; the rule weighted as 0 if the score was less than 15, while the score was 15 or more.
- the highest Ratio2nd of all positions was then selected and compared to a threshold of 0.75; if Ratio2nd ⁇ 0.75, the second most abundant base-containing read would be the original subcluster as a new subcluster.
- Both new spawned subclusters were then reclustered by the same strategy and repeated clustering was performed until Radio2nd at all positions of all subclusters was below 0.75.
- the last subcluster was named Scruster (Fig. 6).
- Step 4 Create a representative sequence (RepSeq) for each SC cluster
- a representative sequence (RepSeq) for both reads I1 and R2 the sequence quality score of each base and the proportion of each type of base. Generated based on both.
- the ratio of each type of base the number of reads was weighted by quality score for each type of base. If the quality score was less than 15, it was weighted as 0; if the score was 15 or more, it was weighted as a score divided by 41. For each position, the most abundant base type was used as a representative base (Fig. 6).
- RepSeq generated from SC clusters with a single read has a high risk of error
- RepSeq with a single read was also removed at this stage.
- the number of reads for each SClaster was used in the next step as important information to distinguish between incorrect RepSeq including errors and correct RepSeq.
- Step 5 Removal of Shifted RepSeq Error types due to insertions or deletions (indels) occurring at the head of the read (21 bases for I1 and 17 bases for R2) excluded as primer moieties in step 2 at this stage.
- RepSeq was removed.
- BClaster x contains reads of 16S rRNA sequences, some of which have two deletions in the head, then two types of reads (RepSeq i and j (reads)) after cutting off the primer portion. There are two deletions)), and RepSeq j should be shifted by 2 bases from left to right of i (FIG. 21). This error type was named the shifted RepSeq.
- the logical diagram of step 5 is shown in FIG.
- Step 6 Concatenation of RepSeq of I1 and R2
- I1 RepSeq and R2 RepSeq were ligated based on their overlapping sequences at their ends. Since the length distribution of the 16S rRNA gene in the V3-V4 region is approximately (> 99.9%) in the range of 400 bp to 500 bp depending on the Silva database (v123.1) (FIG. 22), I1 and A sequence of 295 bases for both reads of R2 can essentially achieve more than 90 overlapping bases between the ends of each pair of reads of I1 and R2.
- the few bases at the ends of both I1 and R2 RepSeq can happen to be the same. Therefore, it was considered that the threshold values of 5 or more identical bases at the ends of both I1 RepSeq and R2 RepSeq were used as overlaps to avoid false overlap.
- the possibility of accidental duplication is (1/4) b , where b is the number of duplicated bases and the possibility of accidental duplication of 5 bases is (1/4) 5 ⁇ 0.00098.
- all accidental duplications were ⁇ 5 bases (no duplications found because short reads were used).
- Step 7 Removal of one insertion and deletion (1-indel) RepSeq
- one insertion or deletion ⁇ not in the head of the lead ie, the primer portion, see step 5
- the error type RepSeq caused by the loss (1-indel) error was removed. Since the clustering in step 3 was based solely on the substitutions described above, all false reads, including indels, were isolated and individual RepSeqs were created. In general, indels that occur in the middle of sequence reads are very rare (Schimmer M et al., BMC Bioinformatics 2016; 17: 125), not only 1-indel at this stage, but also 2 bases with substitutions in step 9.
- step 7 The logical diagram of step 7 is shown in FIG.
- the strategy is as follows. a) In each BClaster, we have found all possible pairs of RepSeq types with 1-indel differences. b) For each 1-indel pair of RepSeq types (A and B), the RepSeq type identified by more BClasters is the mother, and the others are 1-indels, as the errors are generally less than the correct ones. I thought. c) For each pair of mother and 1-indel, we counted the number of BClusters with more mother leads than 1-indel (No mother) and vice versa (No 1-indel ); both mother and 1-indel. Only BCruster containing was used.
- Step 8 Removal of Chimera
- the error-type RepSeq chimera generated by the chimera amplification was removed. Chimeras always occur during PCR, complicating the product more complexly. Particularly RepSeq chimeras measurement of 16S rRNA amplification product occurs very well 27.
- the logical diagram for removing the chimera is shown in FIG. 24, and the strategy is as follows. a) In each BClaster, chimeras of all possible sequences of RepSeq types (A, B, C) were checked; the head of A is the same as the head of B and the other parts of A (B).
- A is considered to be a chimera and B and C are considered to be parents of this chimera if) is identical to the terminal portion of C and the number of reads of A is not the largest of the three.
- Radio_d N_d / Total_No
- Radio_d ⁇ 1 / Total_No the chimera candidates were excluded from RepSeqs.
- BarBIQ has only 1-5% chimera, which is much lower than the conventional method ( ⁇ 70%) 27, indicating that the chimera could be removed by this step.
- the reason that BarBIQ produced very few chimeras was that the bar code and sequence adapter were attached to the 16S rRNA gene from a single bacterium by one-step amplification in the isolated space (ie, droplets). This means that 16S rRNA amplifications from different bacteria were not mixed.
- This approach is a recent study of high-throughput 16S rRNA gene sequences using droplets and barcodes (Borgstrom E et al., Nat Commun 2015; 6: 7173 and Sheth RU et al., Nat Biotechnol 2019; 37 (8). ): Not even 877-883).
- Step 9 Removal of Rare Error Repseq
- this step like RepSeq with 1 indel and 1 substitution error (named CaseA), 1 indel and 2 substitutions (named CaseB), and 2 indels (named CaseC).
- High-level errors have been eliminated.
- the high level errors considered here include indels, since only indel errors can be caused by our clustering method in step 3.
- more complex errors occur very rarely and are removed in step 10.
- the logical diagram of step 9 is shown in FIG. 25, and the strategy is as follows.
- Step 10 Removal of low-count RepSeq Even after most of the errors were removed in the above steps, unknown RepSeq (different from the San sequence) still remained in the simulated cell population data. However, all were few. Therefore, the number of BClasters was counted for each type of remaining RepSeqs. Since the variability due to the low count was large, the average count based on sampling iterations (sequence of the same sample with different samplings) was used for each RepSeq type. For each iteration, the count of each RepSeq type was normalized by the total count of all RepSeq types for the highest total count of all iterations. The average count for each RepSeq type was then calculated from all iterative experiments.
- Step 11 Removal of 1-base error RepSeq
- a single nucleotide error of the RepSeq type that seems to have been caused by PCR was removed.
- the remaining RepSeq types having a difference of 1 base or zero base from each San sequence were classified into groups (for this analysis, the low count RepSeq type was maintained, step 10). See).
- the distribution of the average counts of all RepSeq types in each group is plotted and the ratio of the highest average counts of RepSeq types with one base different to the average counts of San-sequence matching RepSeq types in the same group (Fig. 26a). The highest ratio) was calculated (Fig. 26b).
- category 1 is a group with a San-sequence match type RepSeq type of 1,000 counts or more
- category 2 is a group with a San-sequence match type RepSeq type of 1,000 counts. Found less than a group.
- category 1 the maximum average number of RepSeq types with different bases was greater than 2, and their maximum ratio was consistent among the different groups.
- these single nucleotide polymorphisms are probably errors caused by PCR. This is because the ratio of the number of other actual 16S rRNA sequences to the actual 16S rRNA sequence is usually different for each type of 16S rRNA sequence.
- the central 6mer of JCM5824-A / B is the same as the 3'end of the forward primer used to amplify the 16S rRNA gene, and this strange sequence is JCM5824-A and / or JCM5824-in the same droplet.
- This strange RepSeq type is a 16S rRNA from JCM5824, as it was always co-detected with the full length V3-V4 region of B and its count was always very rare (2/4/1 in 3 iterations). It was interpreted as a non-specific amplification product of the gene. However, since short amplification products of this type were not found in cecal specimens, our final pipeline did not include any steps to detect these short amplification products. After all the above steps, the remaining RepSeq types (unique RepSeqs) were named BarBIQ identification sequences (Bar sequences) and labeled with their ID numbers.
- Step 12 Clustering of Bar sequences to cOTU Taking advantage of BarBIQ, multiple 16S rRNA sequences were identified from the same bacterium based on the cell barcode at this stage.
- Poission_Overlap (A ⁇ B ⁇ ⁇ ) / Total number of droplets ⁇
- the total number of droplets is the total number of droplets including the cell barcode;
- ⁇ is a constant, and the PCR amplification efficiency, sequence depth effect, etc.
- the Bar sequences are of the same bacterium, the number of droplets in which both Bar sequences are detected will not follow the Poisson distribution.
- log 10 (Poission_Overlap) log 10 (A ⁇ B) -log 10 (total number of droplets / ⁇ )
- the median running of log 10 (Overlap) is the median in the area of window a of a certain size and the area is further shifted by the overlap b of a certain size.
- the median running of log 10 (Overlap) was determined based on log 10 (A ⁇ B) with a window of 0.4 and an overlap of 0.2, and only the median above 0 was used (red in FIG. 27a). White circle).
- Step 13 Number of count cells for each cOTU RepSeq detected in the same BClaster was considered as a single cell if it belonged to the same cOTU. The number of cells in each cOTU was then counted based on the cell barcode (number of BClasters). The data processed with parameter 0.75 in step 3.2 was used to count the number of cells.
- Step 14 Removal of foreign matter-contaminated cOTU
- foreign matter-contaminated cOTU was removed based on the control. Measured under the same conditions within similar time (several days) using a control sample M0 of a simulated cell population or a blank test tube control of a mouse Ma, Mb and Mc cecal sample to identify a foreign body-contaminated cOTU. bottom.
- the strategy for detecting foreign-contaminated cOTUs was as follows: For each control, count the number of BClasters of the cOTUs identified in the sample, and count the number of each cOTU in the control for the same cOTU in the sample. Compared to the count number.
- different numbers of droplets were used to prepare the simulated cell population and the library of M0 samples, so the count was also normalized by the estimated total number of droplets.
- the control was an empty tube and the same number of droplets were used in all experiments, so no standardization was applied to the count.
- Category I is that the control-to-sample cross-contamination or environmental contamination bacteria are the same as the bacteria in the control (because we used the actual sample as a control for simulated cell population measurements), and in addition, this cOTU.
- the sequence was very different from the Bar sequence ( ⁇ 86% identity) consistent with the San sequence in the sample and could not be described as a chimera. This suggests that this cOTU is not an error resulting from the chimera.
- Category II can be described as foreign body contamination from the environment for both samples and controls. Because their numbers were similar in different samples and controls. For both Category I and Category II, we removed cOTU from the sample. That is because they were probably foreign material contamination from the environment or other samples.
- Category III may have cross-foreign contamination, but the contamination from the sample to the control, or by chance, from the environment, was the same as the bacteria in the sample. In this case, the value obtained by subtracting the count of this cOTU in the control from the count of this cOTU in the sample was used as the final number of cells of this cOTU in the sample. The possibility of cross-foreign matter contamination occurred only when the cOTU concentration in the sample was high, but those counts in the foreign matter-contaminated sample were very rare.
- the number of cells of cOTU mixed with foreign substances was about 0.5% of the total number of cells detected by the measurement of the simulated cell population, and about 4% by the measurement of cell samples of Ma, Mb, and Mc.
- Step 15 Calculation of Cell Concentration
- the absolute cell concentration of each cOTU was calculated by normalizing the count obtained in step 13 using the total concentration measured by droplet digital PCR.
- Taxonomic predictions by RDP classification The phylum-to-genus classification of the identified cOTUs was predicted based on their Bar sequence by RDP classification with a bootstrap cutoff of 50% 36. RDP classification was trained by 16S rRNA training set 11 (https://rdp.cme.mus.edu/classifier/classifier.jsp). The predictive taxon with the highest score was selected for cOTUs containing multiple Bar sequences.
- Bray-Curtis Dissimilarity The Bray-Curtis dissimilarity between each pair of samples based on cell concentration was calculated using the Vegdist function of the R package vegan. Subsequent analyzes were performed using R (version 3.5.1) and JupiterLab (version 0.34.9).
- Noise cOTU in technology repeated samples Ma dist measured by estimation BarBIQ art noise, by comparing the simulated noise and cOTU art noise obtained from Poisson distribution was confirmed primarily sampling noise.
- the cell number in each repeat was standardized to the minimum total cell number in the repeat by subsampling with functional dilution in the R package vegan. ..
- the noise of the cOTU is quantified by CV 2 , where the CV indicates the variation of the coefficients calculated based on the normalized cell number of the cOTU in 3 technical iterations 52,53 .
- the simulated Poisson noise for each cOTU is calculated based on three randomly generated numbers (to mimic three technical iterations) from the Poisson distribution, which is the average number of cells in a given coOTU in the sample. Then, two simulations (1 and 2) were performed. Next, 52, 53 calculated the theoretical average corrected residuals of CV 2 for each cOTU.
- R mc log 10 (CV 2 ) -log 10 (CV Poisson 2 );
- CV Poisson is a theoretical CV for a given cOTU based on a Poisson distribution. Distribution of all R mc samples Ma dist is consistent with the distribution of the simulation, technical noise BarBIQ measurements suggested is due primarily sampled (Fig. 7c, d).
- each cOTU mouse dependent CV by simulation, three mice (Ma dist 1, Mb dist, Mc dist or Ma prox 1, Mb prox, Mc prox) cell concentration in the distal or proximal position of The 95% confidence interval for the CV was estimated.
- the simulation process was repeated 1,000 times to obtain CVs from 3 simulated cell concentrations for a given cOTU for each time.
- Each simulated concentration is obtained by random number generated from the Poisson distribution, the average is given of the sequence determination cell number cOTU in the sample (i.e., Ma dist 1, Mb dist, Mc dist or Ma Prox 1, Mb prox , one of Mc prox ), and then normalized using the estimated total concentration of this sample.
- Modified Bacterial Network Hierarchical clustering was performed by the function hclust in the statistical package (heatmap was drawn using package heatmap).
- the distance used for clustering is defined as 1-minimum ( ⁇ r' ⁇ ) [r' ⁇ (r-OCI, r + OCI)], where OCI means the 90% one-sided confidence interval for each r.
- a phylogenetic tree of hierarchical clustering was obtained by the complete connection method. Specifically, the Pearson correlation coefficient r between all the included cOTUs was obtained. Then, the distance between one microorganism and another was determined based on the above formula, and cOTU was clustered based on the distance. The possible distance of cOTU pairs within the branch after clustering was lower than the height of the branch.
- the OCI of each r was obtained by simulation.
- the simulation process repeated 1,000 times, each time, the cell concentration of each COTU, sample Ma dist 1, Ma prox 1, Mb dist, Mb prox, Mc dist and Mc prox (this process, the above CV confidence interval Randomly generated for each cOTU pair), and Pearson's r was calculated for each cOTU pair.
- the OCI was then obtained from the distribution of 1,000 simulated simulators.
- the network of cOTUs for each SCBG obtained with a threshold of 0.6 is visualized by force-directed layout 39 using the igraf of the package, and the layout of the nodes (ie, cOTUs) in the network is larger than 0.9. All r between cOTUs were lined up by color gradient using the package RCcolorBrewer.
- the SCBG network (R inter ) based on the SCBG correlation between each possible pair of SCBGs was visualized by force-directed layout using the package igraph.
- SCBG layout is determined based on the greater than 0.7 R inter, all R inter between SCBG drew a line by the color gradient using package RColorBrewer.
- the Kruskal-Wallis test for comparison of R inter-means is described in Kruskal. It was carried out using the test.
- Example 1 Single cell indexing and single RNA bar coding of bacteria contained in the bacterial flora, as well as cell unit and molecular count counting by sequencing.
- the interaction between the microbial fauna and the host is associated with host homeostasis and many diseases 13-16.
- commonly available units such as concentration measurements based on the number of cells per weight and / or the number of molecules per volume, are needed.
- concentration measurements based on the number of cells per weight and / or the number of molecules per volume
- the microflora consists of large number of bacteria from a number of bacterial species 17. Therefore, a high-throughput cell quantification method having high taxonomic resolution is desired.
- amplified barcodes and sequence adapters were ligated with the amplified 16S rRNA gene (V3-V4 region, approximately 450 bases) in the droplet by single-step amplification 28 (FIG. 5).
- the droplets were cleaved, the library (linked amplicon) was purified, and both the cellular barcodes and 16S rRNA sequences of the individual amplification molecules were sequenced using the high throughput sequencer MiSeq.
- BarBIQ The essential difference between BarBIQ and conventional methods is the unit for defining the composition of the microbial phase.
- the unit is an operational taxonomy unit (OTU), which is basically a similar 16S rRNA sequence obtained by clustering based on the identity of the sequences obtained from bulk sampling. 30 showing a group of.
- OTU operational taxonomy unit
- BarBIQ uses cell types that are classified based on the 16S rRNA sequences identified from each barcoded cell.
- the classification unit obtained here was named "cell-based operational classification unit (cOTU)".
- BarBIQ acts on a simulated cell population containing 10 cultured human gut bacterial strains (Table 1). It was found that 16 sequences (Bar sequences) derived from a simulated cell population containing two pairs of Bar sequences identified by BarBIQ each had one base difference (FIG. 1b).
- BarBIQ has a single base accuracy. Since it was revealed by a simulated cell population that it had, it was concluded that BarBIQ could identify an unknown 16S rRNA sequence.
- consistent bacterial identification may be essential if one wants to describe the differences between healthy and diseased mice.
- SCBG Branches below the threshold and containing 3 or more cOTUs were defined as SCBG (FIGS. 4b and 17).
- the characteristics of the obtained SCBG were characterized.
- the number of cOTUs in SCBG varies from 3 to 19 (FIG. 11c), more than half (16/31) include positive and negative correlated cOTUs (FIGS. 4c and 12a-f), and cOTUs in each SCBG.
- the average abundance of abundance is widely distributed (FIGS. 4c and 11d), the highest difference in abundance in SCBG is 230 times, observed in SCBG12 (FIG. 11d), and the classification of each cOTG (similar to FIG. 3c).
- the scholarly predictions (FIG. 4c) were heterogeneous (FIGS. 4c and 13).
- the number of SCBGs and the number of cOTUs in each SCBG vary as a function of the threshold (FIGS. 11a and 11b), and the threshold 0.6 used here appears to be a transition point to the number of SCBGs (FIG. 11a and 11b). 11a). Different thresholds may be selected to define the SCBG so that specific features are found in a given sample.
- Correlation between SCBGs was investigated using all possible pairs of SCBGs to assess the characteristics of the bacterial microbial flora at the entire network level.
- Correlation R inter between SCBG between two SCBG was defined as the average of the calculated ⁇ r ⁇ s for all possible cOTU pair two cOTU of one pair is derived from a different SCBG ( Figure 4d) .
- All of the R inter, correlation within SCBG which is defined as the average of the calculated ⁇ r ⁇ s for all possible cOTU pairs in each SCBG, it was confirmed that essentially lower than R inner (Fig. 14a). It was then found that each SCBG showed a relatively high correlation with a small number of SCBGs.
- SNA-15GB central portion
- SNA-15GB 15-gauge sterilized metal needle
- CO area peripheral part
- the solid contents of the large intestine could be divided into areas A, B, CC, CO, D, and E (panel g in FIG. 39) (however, B or D may be missing due to the above reason). there were).
- ddPCR was performed by the following steps. 1st stage; 95 ° C. 5 minutes 2nd stage; 95 ° C. 45 seconds and 60 ° C. 150 seconds repetition for 6 cycles 3rd stage; 95 ° C. 25 seconds and 60 ° C. 80 seconds repetition for 39 cycles 4th stage; 4 ° C. After 5 minutes and 90 ° C. for 5 minutes, the bar code concentration was measured by QX200 Droplet Reader (BioRad, # 1864003JA).
- ddPCR is the above experiment except for the third stage. It was carried out under the same cycle conditions as above. The third stage changed the number of cycles to 0, 10, 20, 30, 39, or 49. The fluorescence intensity of the droplets was then measured by the QX200 Droplet Reader and positive and negative droplets were determined based on the threshold, which is the valley of the bimodal distribution of intensity by the software QuantaSoft (BioRad, # 1864011JA).
- ddPCR is performed in the above experiment except for the first stage. It was carried out under the same cycle conditions as above. The first stage changed the time to 0, 5, or 10 minutes. The fluorescence intensity of the droplet was then measured by the QX200 Droplet Reader and positive and negative droplets were determined based on the threshold, which is the valley of the bimodal distribution of intensity by the software QuantaSoft.
- BarBIQ fluorescence in situ hybridization
Abstract
Description
[1]細胞集団の処理方法であって、
(A)単離された細胞集団を含む細胞の分散液から、液滴集団であって、水性の液滴を含み、前記液滴の少なくとも一部のそれぞれが、1つの細胞と1分子の細胞バーコードとを含む液滴集団を得ること
を含む、方法。
[2]細胞集団に含まれる遺伝子の塩基配列を分析する方法であって、
(A)単離された細胞集団を含む細胞の分散液から、液滴集団であって、水性の液滴を含み、前記液滴の少なくとも一部のそれぞれが、1つの細胞と1分子の細胞バーコードとを含む液滴集団を得ることと、
(B)得られたそれぞれの液滴中で、細胞バーコードの増幅産物と所定の遺伝子の増幅産物を得て、さらに、細胞バーコードと所定の遺伝子の全部または一部の塩基配列を含む連結物を得ることと、得られた連結物を液滴から水溶液中に回収して、得られた連結物をシークエンスして所定の遺伝子の塩基配列と細胞バーコードの塩基配列を決定することとを含む、方法。
[3]前記(B)において、細胞バーコードの増幅産物は、第一のプライマーに由来する第一の領域を有し、所定の遺伝子の増幅産物は、第二プライマーに由来する第二の領域を有し、第一の領域と第二の領域は、互いにハイブリダイズ可能な相補的な配列部分を有し、前記第一のプライマーおよび第二のプライマーはそれぞれ、1以上のタグ分子を連結しており、当該タグ分子は、前記連結物には含まれず、かつ、
前記(B)において、水溶液中に回収された連結物から、タグ分子を有する増幅産物を当該タグ分子に親和性を有する分子を担持したカラムまたはビーズを用いて除去することをさらに含む、上記[2]に記載の方法。
[4](C-1)決定された細胞バーコードの塩基配列に基づいて、決定された塩基配列をクラスタリングして、複数の第一のクラスターを得ること
をさらに含む、上記[2]または[3]に記載の方法。
[5](D-1)得られた第一のクラスターの数から細胞集団に含まれる細胞の数または特定の所定の遺伝子を有する細胞の数を推定すること
をさらに含む、上記[4]に記載の方法。
[6](C-2)決定された所定の遺伝子の塩基配列に基づいて、決定された塩基配列をクラスタリングして、複数の第二のクラスターを得ること
をさらに含む、上記[2]または[3]に記載の方法。
[7](D-2)得られた第二のクラスターの数から細胞集団に含まれる細胞の種類の数を推定することをさらに含む、上記[6]に記載の方法。
[8](C-3)決定された細胞バーコードの塩基配列に基づいて、決定された塩基配列をクラスタリングして、複数の第一のクラスターを得ることと、決定された所定の遺伝子の塩基配列に基づいて、決定された塩基配列をクラスタリングして、複数の第二のクラスターを得ること
をさらに含む、上記[2]または[3]に記載の方法。
[9](D-3)得られた細胞バーコードの塩基配列と所定の遺伝子の塩基配列の組合せの情報に基づいて、少なくとも1つのある第二のクラスターに分類された所定の遺伝子の塩基配列と連結している細胞バーコードの塩基配列から当該所定の遺伝子の塩基配列が分類された第一のクラスターを決定し、当該細胞バーコードが分類された第一のクラスターの数から、当該第二のクラスターに分類された細胞の数を推定すること
をさらに含む、上記[8]に記載の方法。
[10](C-4)同一の第一のクラスターに分類された配列が異なる第二のクラスターに分類される場合、当該第二のクラスターを同一の細胞ベースの操作上分類単位(cOTU)に分類することをさらに含む、上記[8]に記載の方法。
[11](E)第一の細胞集団と、第一の細胞集団とは異なる第二の細胞集団のそれぞれに関して、細胞集団に含まれる(i)cOTUの数および/または(ii)特定のcOTUに含まれる細胞の数を推定し、第一の細胞集団に関して推定された(i)cOTUの数および/または(ii)特定のcOTUに含まれる細胞の数を、第二の細胞集団に関して推定された(i)cOTUの数および/または(ii)特定のcOTUに含まれる細胞の数とそれぞれ比較することをさらに含む、上記[10]に記載の方法。
[12](F)第一の細胞集団に関して推定された(i)cOTUの数および(ii’)特定のcOTUに含まれる細胞の数と、第二の細胞集団に関して推定された(i)cOTUの数および(ii’)特定のcOTUに含まれる細胞の数を比較することを含む、上記[11]に記載の方法。
[13]細胞集団が、微生物叢である、上記[1]~[12]のいずれかに記載の方法。[14]微生物叢が、体内または体表の微生物叢である、上記[13]に記載の方法。
[15]微生物叢が、消化管内の微生物叢である、上記[13]に記載の方法。
[16]第一の細胞集団と第二の細胞集団が、同一対象の異なる部位から取得された微生物叢である、上記[11]または[12]に記載の方法。
[17]第一の細胞集団と第二の細胞集団が、異なる対象の同一の部位から取得された微生物叢である、上記[11]または[12]に記載の方法。
[18]第一の細胞集団と第二の細胞集団が、同一対象の同一の部位から異なる時間に取得された微生物叢である、上記[11]または[12]に記載の方法。
[19]細胞集団が、未知の細胞を含む、上記[1]~[18]のいずれかに記載の方法。 According to the present invention, the following inventions are provided.
[1] A method for treating a cell population.
(A) From a dispersion of cells containing an isolated cell population, a droplet population containing aqueous droplets, each of which at least a portion of the droplet is a cell and a molecule of cell. A method comprising obtaining a droplet population containing a bar code.
[2] A method for analyzing the base sequence of a gene contained in a cell population.
(A) From a dispersion of cells containing an isolated cell population, a droplet population containing aqueous droplets, each of which at least a portion of the droplet is a cell and a molecule of cell. To obtain a droplet population containing a bar code,
(B) In each of the obtained droplets, an amplification product of a cell barcode and an amplification product of a predetermined gene are obtained, and further, a linkage containing the cell barcode and the base sequence of all or a part of the predetermined gene. Obtaining a product, recovering the obtained conjugate from a droplet into an aqueous solution, and sequencing the obtained conjugate to determine the base sequence of a predetermined gene and the base sequence of a cell barcode. Including, method.
[3] In the above (B), the cell barcode amplification product has a first region derived from the first primer, and the amplification product of a predetermined gene has a second region derived from the second primer. The first region and the second region have complementary sequence portions that can hybridize with each other, and the first primer and the second primer each link one or more tag molecules. The tag molecule is not included in the conjugate and
In (B) above, the above-mentioned [B] further comprises removing the amplification product having a tag molecule from the conjugate recovered in the aqueous solution by using a column or beads carrying a molecule having an affinity for the tag molecule. 2] The method described in.
[4] (C-1) The above-mentioned [2] or [2], which further comprises clustering the determined base sequence based on the base sequence of the determined cell barcode to obtain a plurality of first clusters. 3] The method described in.
[5] (D-1) The above-mentioned [4] further includes estimating the number of cells contained in the cell population or the number of cells having a specific predetermined gene from the number of the first clusters obtained. The method described.
[6] (C-2) The above-mentioned [2] or [2], which further comprises clustering the determined base sequence based on the base sequence of the determined predetermined gene to obtain a plurality of second clusters. 3] The method described in.
[7] (D-2) The method according to [6] above, further comprising estimating the number of cell types contained in the cell population from the number of second clusters obtained.
[8] (C-3) Based on the base sequence of the determined cell barcode, the determined base sequence is clustered to obtain a plurality of first clusters, and the base of the determined predetermined gene is obtained. The method according to [2] or [3] above, further comprising clustering the determined base sequence based on the sequence to obtain a plurality of second clusters.
[9] (D-3) Based on the information of the combination of the base sequence of the obtained cell bar code and the base sequence of the predetermined gene, the base sequence of the predetermined gene classified into at least one second cluster. The first cluster in which the base sequence of the predetermined gene is classified is determined from the base sequence of the cell barcode linked to, and the second cluster is classified from the number of the first cluster in which the cell barcode is classified. The method according to [8] above, further comprising estimating the number of cells classified into the cluster of.
[10] (C-4) When a sequence classified into the same first cluster is classified into a different second cluster, the second cluster is divided into the same cell-based operational classification unit (cOTU). The method according to [8] above, further comprising classification.
[11] (e) For each of the first cell population and the second cell population different from the first cell population, (i) the number of cOTUs contained in the cell population and / or (ii) a specific cOTU. The number of cells contained in is estimated, and (i) the number of cOTUs estimated for the first cell population and / or (ii) the number of cells contained in a particular cOTU is estimated for the second cell population. The method according to [10] above, further comprising (i) comparing with the number of cOTUs and / or (ii) the number of cells contained in a particular cOTU, respectively.
[12] (F) Estimated number of cOTUs for the first cell population and (ii') number of cells contained in a particular cOTU, and (i) cOTU estimated for the second cell population. The method according to [11] above, comprising comparing the number of cells and (ii') the number of cells contained in a particular cOTU.
[13] The method according to any one of the above [1] to [12], wherein the cell population is a microbial flora. [14] The method according to the above [13], wherein the microbial flora is a microbial flora in the body or on the surface of the body.
[15] The method according to the above [13], wherein the microbial flora is a microbial flora in the digestive tract.
[16] The method according to [11] or [12] above, wherein the first cell population and the second cell population are microbial flora obtained from different sites of the same subject.
[17] The method according to [11] or [12] above, wherein the first cell population and the second cell population are microbial flora obtained from the same site of different subjects.
[18] The method according to [11] or [12] above, wherein the first cell population and the second cell population are microbial flora acquired from the same site of the same subject at different times.
[19] The method according to any one of the above [1] to [18], wherein the cell population contains an unknown cell.
(A)単離された細胞集団を含む細胞の分散液から、液滴集団であって、水性の液滴を含み、前記液滴の少なくとも一部のそれぞれが、1つの細胞と1分子の細胞バーコードと
を含む液滴集団を得ること
を含む方法が提供される。 According to the present invention, it is a method for treating a cell population.
(A) From a dispersion of cells containing an isolated cell population, a droplet population containing aqueous droplets, each of which at least a portion of the droplet is a cell and a molecule of cell. Methods are provided that include obtaining a droplet population containing a bar code.
液滴集団であって、水性の液滴を含み、前記液滴の少なくとも一部のそれぞれが、1つの細胞と1分子の細胞バーコードとを含む液滴集団が提供される。この態様において、細胞は、単離された細胞集団(例えば、微生物叢)を構成していた細胞であり得る。 Also according to the present invention
A droplet population is provided that includes aqueous droplets, each of which at least a portion of the droplets comprises one cell and one molecule of cell bar code. In this embodiment, the cell can be a cell that has constituted an isolated cell population (eg, a microbiota).
細胞集団に含まれる遺伝子配列を決定(または分析)する方法であって、
(A)単離された細胞集団を含む細胞の分散液から、液滴集団であって、水性の液滴を含み、前記液滴の少なくとも一部のそれぞれが、1つの細胞と1分子の細胞バーコードと
を含む液滴集団を得ることと、
(B)得られたそれぞれの液滴中で、細胞バーコードの増幅産物と所定の遺伝子の増幅産物を得て、さらに、細胞バーコードと所定の遺伝子の全部または一部の塩基配列を含む連結物を得ることと、得られた連結物をシークエンスして所定の遺伝子の塩基配列と細胞バーコードの塩基配列を決定することと
を含む、方法(以下、本発明の配列決定方法という)が提供される。 Also according to the present invention
A method for determining (or analyzing) the gene sequence contained in a cell population.
(A) From a dispersion of cells containing an isolated cell population, a droplet population containing aqueous droplets, each of which at least a portion of the droplet is a cell and a molecule of cell. To obtain a droplet population containing a bar code,
(B) In each of the obtained droplets, an amplification product of a cell barcode and an amplification product of a predetermined gene are obtained, and further, a linkage containing the cell barcode and the base sequence of all or a part of the predetermined gene. Provided is a method (hereinafter referred to as the sequencing method of the present invention) comprising obtaining a product and sequencing the obtained linkage to determine the base sequence of a predetermined gene and the base sequence of a cell barcode. Will be done.
したがって、本発明の配列決定方法は、
前記(B)において、細胞バーコードの増幅産物は、第一のプライマーに由来する第一の領域を有し、所定の遺伝子の増幅産物は、第二プライマーに由来する第二の領域を有し、第一の領域と第二の領域は、互いにハイブリダイズ可能な相補的な配列部分を有し、前記第一のプライマーおよび第二のプライマーはそれぞれ、1以上のタグ分子を連結しており、当該タグ分子は、前記連結物には含まれず、かつ、
前記(B)において、水溶液中に回収された連結物から、タグ分子を有する増幅産物を当該タグ分子に親和性を有する分子を担持したカラムまたはビーズを用いて除去することをさらに含んでいてもよい。これにより、所望の連結物から、タグ分子を有する連結し損ねた増幅産物を分離することができる。 Furthermore, when the DNA amplification reaction is carried out using a tagged primer having a tag (for example, a biotinylated primer) in the step of DNA amplification, the DNA amplification product is a tag (for example, biotin). It is combined. Such tagged DNA amplification products can be concentrated or removed by a column or bead linked to a tag-binding molecule (eg, a tag-binding molecule such as avidin, streptavidin, and neutralvidin). In particular, the sequencing method of the present invention may preferably include removing a product in which a cell barcode and a predetermined gene are linked to each other. That is, one of the primers that amplifies the cell barcode and one of the primers that amplifies a predetermined gene can be used as a primer having a tag and can be designed to have a complementary sequence. That is, only each primer designed to have a complementary sequence can be tagged. In this way, as shown in FIG. 5, the cell barcode amplification product and the amplification product of a given gene can be linked to each other in the region corresponding to the tagged primer moiety. When the obtained conjugate is further amplified by gene amplification, the amplified product of the conjugate does not contain a tag, whereas the amplified product that fails to be linked has a tag derived from a primer at the end thereof. Thus, in one embodiment, in (B) above, one of two primers that amplifies a cell barcode and one of two primers that amplifies a predetermined gene (the one is a tag). A primer having a sequence complementary to (having a molecule) has a tag molecule. The tag molecule is lost from the link between the cell barcode and the predetermined gene during the amplification of the cell barcode and the predetermined gene, and the tag molecule remains only in the amplified product that fails to link. Therefore, the amplified product that fails to be linked can be removed by affinity using a column or beads to which the tag-binding molecule is bound, whereby the amplified product of the linked product can be purified with higher purity.
Therefore, the sequencing method of the present invention is:
In (B) above, the cell barcode amplification product has a first region derived from the first primer, and the amplification product of a predetermined gene has a second region derived from the second primer. , The first region and the second region have complementary sequence moieties capable of hybridizing with each other, and the first primer and the second primer each have one or more tag molecules linked to each other. The tag molecule is not included in the conjugate and
The above (B) further comprises removing the amplification product having a tag molecule from the conjugate recovered in the aqueous solution using a column or beads carrying a molecule having an affinity for the tag molecule. good. This makes it possible to separate the failedly linked amplification product with the tag molecule from the desired linkage.
(C-1)細胞バーコードの塩基配列に基づいて、決定された塩基配列をクラスタリングして、複数の第一のクラスターを得ること
をさらに含んでいてもよい。 The sequencing method of the present invention
(C-1) It may further include clustering the determined base sequence based on the base sequence of the cell barcode to obtain a plurality of first clusters.
(D-1)得られた第一のクラスターの数から細胞集団に含まれる細胞の数または特定の所定の遺伝子を有する細胞の数を推定すること
をさらに含んでいてもよい。 Therefore, the method for determining the gene sequence contained in the cell population of the present invention is
(D-1) It may further include estimating the number of cells contained in the cell population or the number of cells having a specific predetermined gene from the number of the first clusters obtained.
(C-2)決定された所定の遺伝子の塩基配列に基づいて、決定された塩基配列をクラスタリングして、複数の第二のクラスターを得ること
をさらに含んでいてもよい。 That is, the method for analyzing the cell population of the present invention is
(C-2) It may further include clustering the determined base sequence based on the base sequence of the determined predetermined gene to obtain a plurality of second clusters.
(C-2α)あるクラスターにおいて、所定の遺伝子に関して相違する塩基配列が含まれている場合に、当該相違する塩基配列の1つの位置において、最も豊富な塩基を決定することと、二番目に豊富な塩基を決定することと、当該位置において、最も豊富な塩基を有する塩基配列の数(すなわち、リード数)に対する二番目に豊富な塩基を有する塩基配列の数(すなわち、リード数)の比(Ratio2nd)が所定の値以上である場合には、最も豊富な塩基を有する塩基配列と、二番目に豊富な塩基を有する塩基配列とを別のクラスターにクラスタリングすること
をさらに含み得る。これによって、同一クラスターに分類された塩基配列のうち、本来的に異なる遺伝子に由来するものを異なるものとして処理することができ、これにより、(c-2)の工程によって、異なる遺伝子が同一と評価される頻度を低減することができる。 Therefore, the above (C-2) is a further step:
(C-2α) When a cluster contains different base sequences for a given gene, determining the most abundant base at one position of the different base sequence and the second richest. The ratio of the number of base sequences having the second most abundant base (ie, the number of reads) to the number of base sequences having the most abundant bases (ie, the number of reads) at the position (that is, the number of reads). When Radio2nd) is greater than or equal to a predetermined value, it may further include clustering the base sequence having the most abundant base and the base sequence having the second most abundant base into another cluster. As a result, among the base sequences classified into the same cluster, those originally derived from different genes can be treated as different ones, whereby different genes can be treated as the same by the step (c-2). The frequency of evaluation can be reduced.
(D-2)得られた第二のクラスターの数から細胞集団に含まれる細胞の種類の数(何種類の細胞が細胞集団に含まれるか)を推定すること
ができる。 Thereby, in the present invention,
(D-2) From the number of the obtained second clusters, the number of cell types contained in the cell population (how many types of cells are contained in the cell population) can be estimated.
(C-3)決定された細胞バーコードの塩基配列に基づいて、決定された塩基配列をクラスタリングして、複数の第一のクラスターを得ることと、決定された所定の遺伝子の塩基配列に基づいて、決定された塩基配列をクラスタリングして、複数の第二のクラスターを得ることと
をさらに含んでいてもよい。 Therefore, the method for determining the gene sequence contained in the cell population of the present invention is
(C-3) Based on the base sequence of the determined cell barcode, the determined base sequence is clustered to obtain a plurality of first clusters, and based on the base sequence of the determined predetermined gene. It may further include clustering the determined base sequence to obtain a plurality of second clusters.
(D-3)得られた細胞バーコードの塩基配列と所定の遺伝子の塩基配列の組合せの情報に基づいて、少なくとも1つのある第二のクラスターに分類された所定の遺伝子の塩基配列と連結している細胞バーコードの塩基配列から当該所定の遺伝子の塩基配列が分類された第一のクラスターを決定し、当該細胞バーコードが分類された第一のクラスターの数から、当該第二のクラスターに分類された細胞の数を推定すること
をさらに含んでいてもよい。 The method for determining the gene sequence contained in the cell population of the present invention is
(D-3) Based on the information of the combination of the base sequence of the obtained cell bar code and the base sequence of the predetermined gene, it is linked to the base sequence of the predetermined gene classified into at least one second cluster. The first cluster in which the base sequence of the predetermined gene is classified is determined from the base sequence of the cell barcode, and the number of the first cluster in which the cell barcode is classified is assigned to the second cluster. It may further include estimating the number of classified cells.
細胞ベースの操作上分類単位(cOTU)を作成することをさらに含んでいてもよい。細胞集団に含まれる微生物数及び種類が不明であることが多く、さらには、未知の微生物が存在する場合には、データベースに登録された既知の遺伝子配列情報からのみでは、細胞集団の遺伝子配列の分析は不十分となる。特に、所定の遺伝子の塩基配列ベースで操作上部類単位(OTU)を形成させると、所定の遺伝子についてある微生物種でn個の重複を有する場合には、当該微生物種の数が本来のn倍あるものとしてカウントされて誤差を生じることになる。また、2つの異なる微生物種において、一方は塩基配列AとBとを有し、他方はAとCとを有する場合に、塩基配列ベースで操作上部類単位(OTU)を形成させると、OTUは、AとBとCそれぞれに対応して3つ形成され、Aのカウントの分だけ細胞数に誤差を生じることになる。そこで、(C-4)では、遺伝子重複を有する細胞が細胞集団に含まれるときのカウントの上記誤差を低減するために、RepSeqの情報からcOTUを作成する。なお、cOTUは、理論的には、所定の遺伝子の塩基配列で分類できる微生物の分類単位であり、これまで上位の分類群でしか分類できなかった微生物をさらに詳細に分類する技術的手段である。これは、特に詳細な分類がなされていない微生物や未同定の微生物を含む細胞集団の分析において有用である。分類ができれば、これを元にして細胞集団間での相違を比較することができ、有利である。 In addition to the above (C-2), the method of the present invention can be used.
It may further include creating a cell-based operational classification unit (cOTU). In many cases, the number and type of microorganisms contained in the cell population are unknown, and in the presence of unknown microorganisms, the gene sequence of the cell population can be determined only from the known gene sequence information registered in the database. The analysis will be inadequate. In particular, when an operation upper class unit (OTU) is formed based on the base sequence of a predetermined gene, if there are n duplications in a certain microbial species for a predetermined gene, the number of the microbial species is n times the original number. It will be counted as something and will cause an error. Further, in two different microbial species, when one has the base sequences A and B and the other has the base sequences A and C, when the operation upper class unit (OTU) is formed based on the base sequence, the OTU is formed. , A, B, and C are each formed in three, and an error occurs in the number of cells by the count of A. Therefore, in (C-4), in order to reduce the above error in counting when cells having gene duplication are included in the cell population, cOTU is created from the information of RepSeq. The cOTU is theoretically a classification unit of microorganisms that can be classified by the base sequence of a predetermined gene, and is a technical means for classifying microorganisms that could be classified only by a higher classification group in more detail. .. This is useful in the analysis of cell populations containing microorganisms that have not been specifically classified or have not been identified. If classification is possible, it is advantageous to be able to compare differences between cell populations based on this.
(C-4)同一の第一のクラスターに分類された配列が異なる第二のクラスターに分類される場合、当該第二のクラスターを同一の細胞ベースの操作上分類単位(cOTU、すなわち同一の細胞分類)に分類すること
をさらに含んでいてもよい。 That is, the method of the present invention is, for example, in addition to the above (C-3).
(C-4) When a sequence classified into the same first cluster is classified into a different second cluster, the second cluster is classified into the same cell-based operational classification unit (cOTU, that is, the same cell). Classification) may be further included.
式:(Poission_Overlap)=(A×B×μ)/液滴総数は、
log10(Poission_Overlap)=log10{(A×B×μ)/液滴総数}
に変換することができる。さらに上記式は、
log10(Poission_Overlap)
=log10(A×B)-log10(液滴総数/μ)
変換することができる。ここで、AおよびBは実験的に測定でき、log10(液滴総数/μ)は実験毎に一定の定数とすることができる。従って、log10(液滴総数/μ)を定数ODとすると、上記式は、
log10(Poission_Overlap)=log10(A×B)-OD
に変換できる。これは、y=x-ODで直線近似することができる。AとBについて様々な整数を想定してlog10(Poission_Overlap)を算出することができる。現実のlog10(Overlap)の値が、計算されるlog10(Poission_Overlap)の信頼区間の外である場合、2つの塩基配列は1つの細胞内に含まれていたと推測することができる。また、log10(Poission_Overlap)の信頼区間の内部である場合、2つの塩基配列はそれぞれ異なる細胞に含まれていたと推測することができる。信頼区間としては、例えば、片側信頼区間(例えば、95%以上、98%以上、99%以上、または99.9%もしくはそれ以上の信頼区間とすることができる)を用いることができる。このようにして、統計学的にポワソン分布では説明ができない場合に、2つの塩基配列は1つの細胞内に含まれていたと推定することができる。あるいは、統計学的にポワソン分布で説明できるときには、2つの塩基配列は異なる細胞に存在したと推定することができる。 If there are a plurality of RepSeqs to which one cell barcode is attached (RepSeq may be a sequence after various error elimination in the above step, it is preferable), all of them are picked up. The number of droplets containing two RepSeq is expressed as (Overlap). The probability that one droplet contains two RepSeq from different cells (Poission_Overlap) is expressed as (A × B × μ) / total number of droplets {where the total number of cells includes the cell barcode. The total number of droplets, A is the number of droplets containing one RepSeq, B is the number of droplets containing the other RepSeq, and μ is the PCR amplification efficiency, sequence depth effect, etc. It is an integrated parameter for detection efficiency in the resulting droplets}. here,
Formula: (Poission_Overlap) = (A × B × μ) / Total number of droplets is
log 10 (Poission_Overlap) = log 10 {(A × B × μ) / total number of droplets}
Can be converted to. Furthermore, the above formula
log 10 (Poission_Overlap)
= Log 10 (A × B) -log 10 (total number of droplets / μ)
Can be converted. Here, A and B can be measured experimentally, and log 10 (total number of droplets / μ) can be a constant constant for each experiment. Therefore, assuming that log 10 (total number of droplets / μ) is a constant OD, the above equation is:
log 10 (Poission_Overlap) = log 10 (A × B) -OD
Can be converted to. This can be linearly approximated by y = x-OD. Log 10 (Poission_Overlap) can be calculated assuming various integers for A and B. If the actual log 10 (Overlap) value is outside the calculated confidence interval for log 10 (Poission_Overlap), it can be inferred that the two base sequences were contained within one cell. Further, when it is inside the confidence interval of log 10 (Poission_Overlap), it can be inferred that the two base sequences were contained in different cells. As the confidence interval, for example, a one-sided confidence interval (for example, a confidence interval of 95% or more, 98% or more, 99% or more, or 99.9% or more) can be used. In this way, it can be presumed that the two base sequences were contained in one cell when the Poisson distribution cannot be statistically explained. Alternatively, when statistically explained by the Poisson distribution, it can be inferred that the two base sequences were present in different cells.
(E)第一の細胞集団と、第一の細胞集団とは異なる第二の細胞集団のそれぞれに関して、細胞集団に含まれる(i)cOTUの数および/または(ii)特定のcOTUに含まれる細胞の数を推定し、第一の細胞集団に関して推定された(i)cOTUの数および/または(ii)特定のcOTUに含まれる細胞の数を、第二の細胞集団に関して推定された(i)cOTUの数および/または(ii)特定のcOTU含まれる細胞の数と比較すること
をさらに含んでいてもよい。 The method of the invention can be used to make comparisons between two different cell populations. And the method of the present invention
(E) For each of the first cell population and the second cell population different from the first cell population, (i) the number of cOTUs contained in the cell population and / or (ii) included in a particular cOTU. The number of cells was estimated and (i) the number of cOTUs estimated for the first cell population and / or (ii) the number of cells contained in a particular cOTU was estimated for the second cell population (i). ) It may further include comparing with the number of cOTUs and / or (ii) the number of cells contained in a particular cOTU.
(F)第一の細胞集団に関して推定された(i)cOTUの数および(ii’)特定のcOTUに含まれる細胞の数と、第二の細胞集団に関して推定された(i)cOTUの数および(ii’)特定のcOTUに含まれる細胞の数とを比較すること
をさらに含んでいてもよい。 The method of the present invention
(F) Estimated number of cOTUs for the first cell population and (ii') number of cells contained in a particular cOTU, and (i) number of cOTUs estimated for the second cell population and (Ii') may further include comparing with the number of cells contained in a particular cOTU.

(G)cOTU間の階層的クラスタリングを実施することをさらに含み得る。
階層クラスタリングは、例えば、cOTU間の相関の強度(例えば、スピアマンの相関係数r)に基づいて、当業者に周知の方法により行うことができる。階層クラスタリングは、また、rから算出されるcOTU間の距離に基づいて、当業者に周知の方法により行ってもよい。距離は例えば、1-最小(│r’│)[r’∈(r - OCI, r+OCI)]{ここで、OCIは各rの90%片側信頼区間を意味する}により算出され得る。階層的クラスタリングの結果は、系統樹として表示することができる。これは、例えば、Rのパッケージhclustまたはpheatmapにより行うことができる。また、ピアソンの相関係数rが閾値(例えば、0.5以上、または0.6以上など)以上となるcOTUのネットワークをパッケージigraphを用いて図示することができる。このようにして、複数の細胞集団におけるcOTUの関係性から、cOTU間の相関を図示することができる。 The method of the present invention
(G) It may further include performing hierarchical clustering between cOTUs.
Hierarchical clustering can be performed by a method well known to those skilled in the art, for example, based on the strength of the correlation between cOTUs (for example, Spearman's correlation coefficient r). Hierarchical clustering may also be performed by a method well known to those skilled in the art based on the distance between cOTUs calculated from r. The distance can be calculated, for example, by 1-minimum (│ r'│) [r'∈ (r-OCI, r + OCI)] {where OCI means a 90% one-sided confidence interval for each r}. The results of hierarchical clustering can be displayed as a phylogenetic tree. This can be done, for example, with the R package hclust or heatmap. Further, a network of cOTUs having a Pearson correlation coefficient r of a threshold value (for example, 0.5 or more, 0.6 or more, etc.) or more can be illustrated using a package igraph. In this way, the correlation between cOTUs can be illustrated from the relationship of cOTUs in a plurality of cell populations.
模擬細胞集団の準備
ヒト腸内細菌株(ATCC29098、ATCC700926、DSM14469、JCM1297、JCM5824、JCM5827、JCM9498、JCM10188、JCM14656、およびJCM17463)からなる模擬細胞集団を調製した9。これらの株の名称、供給源、培地および培養条件を表1に示す。培養菌を10%グリセロールで元の培地に保存するか、リン酸緩衝生理食塩水(PBS)中で、実験まで-80℃で保存した(表1)。JCM14656およびDSM14469は、培養後に遠心分離を用いてPBSによって1回洗浄された。JCM10188をGAM寒天(ニッスイ)上で培養し、細菌コロニーを収集し、3,200rpmで1分間ボルテックスすることによりPBSに懸濁した(VORTEX GENE 2、Scientific Industries)。
10株をPBSで希釈し、クラスIIのバイオセーフティキャビネット内で設定された濃度に従って混合した(表1)。希釈または混合の各工程に続いて、3,200rpmで1分間ボルテックスした。この混合10株の「模擬細胞集団」と呼ぶ。模擬細胞集団は実験まで-80℃で保存した。 [Method]
Preparation of Simulated Cell Population A simulated cell population consisting of human gut bacterial strains (ATCC29098, ATCC720226, DSM14469, JCM1297, JCM5824, JCM5827, JCM9498, JCM10188, JCM14656, and JCM17463) was prepared 9 . Table 1 shows the names, sources, media and culture conditions of these strains. Cultures were stored in the original medium with 10% glycerol or in phosphate buffered saline (PBS) at −80 ° C. until experiment (Table 1). JCM14656 and DSM14469 were washed once with PBS using centrifugation after culturing. JCM10188 was cultured on GAM agar (Nissui), bacterial colonies were collected and suspended in PBS by vortexing at 3,200 rpm for 1 minute (
Ten strains were diluted with PBS and mixed according to the concentration set in a Class II biosafety cabinet (Table 1). Following each step of dilution or mixing, vortexing was performed at 3,200 rpm for 1 minute. This mixed 10 strains is called a "simulated cell population". The simulated cell population was stored at -80 ° C until the experiment.

*顕微鏡画像により測定された模擬細胞集団形成における添加濃度 (mean ± s.d., n=5, cells/μl)。
** “+”: グラム陽性; “-”: グラム陰性.
# -80℃で10%グリセロール下で培地中に保存された.
## -80℃でリン酸緩衝生理食塩水(PBS)中に保存された.
GAM、Gifu Anaerobic Medium (ニッスイ).
GAM Agar、Modified GAM Agar (ニッスイ)
LB、Luria-Bertani (Nacalai Tesque).
PYG、Peptone Yeast Glucose, DSMZ medium 104.
ATCC medium 1249、Modified Baar’s medium for sulfate reducers. The symbols in the above table are as follows.
* Addition concentration in simulated cell population formation measured by microscopic images (mean ± s. D., n = 5, cells / μl).
** “+”: Gram-positive; “-”: Gram-negative.
# Stored in medium at -80 ° C under 10% glycerol.
## Stored in phosphate buffered saline (PBS) at -80 ° C.
GAM, Gifu Anaerobic Medium (Nissui).
GAM Agar, Modified GAM Agar (Nissui)
LB, Luria-Bertani (Nacalai Tesque).
PYG, Peptone Yeast Glucose,
ATCC medium 1249, Modified Baar's medium for sulfate reducers.
顕微鏡下蛍光イメージングにより各株の濃度を測定した。蛍光染色した細菌を、ポリスチレンミクロスフェア(Bacteria Counting Kit、Thermo Fisher Scientific)を用いて測定した。ヨウ化プロピジウム(Thermo Fisher Scientific)を用い、70℃で5分間加熱して細菌を染色した。体積は、細菌計数チャンバー(SLGC)を用いて測定したマイクロスフェアの濃度に基づいて計算した。各菌株について、5つの独立した測定を実施した;これらの5つの測定の平均濃度および標準偏差(誤差バーとして)を、模擬細胞集団における各菌株の濃度を計算するために使用した。 Bacterial concentration measurement by microscopic image The concentration of each strain was measured by fluorescence imaging under a microscope. Fluorescently stained bacteria were measured using a polystyrene microsphere (Bacteria Counting Kit, Thermo Fisher Scientific). Bacteria were stained by heating with Propidium iodide (Thermo Fisher Scientific) at 70 ° C. for 5 minutes. Volume was calculated based on the concentration of microspheres measured using a bacterial counting chamber (SLGC). Five independent measurements were performed for each strain; the mean and standard deviations (as error bars) of these five measurements were used to calculate the concentration of each strain in the simulated cell population.

絶対濃度は、液滴デジタルPCR(ddPCR)によって測定された模擬細胞集団の総濃度(94,400細胞/μl)を用いて、シークエンスから決まった生のカウント値を正規化して得られた。
Absolute concentrations were obtained by normalizing raw counts determined from the sequence using the total concentration of simulated cell populations (94,400 cells / μl) measured by droplet digital PCR (ddPCR).
各株の16S rRNA遺伝子を、2×KAPA HiFi Hot start ready mix(Roche)およびプライマーF1-full-Fw/F3-full-Rv(表3)を用いて増幅した。次に、増幅した16S rRNA遺伝子をpCR-Blunt II-TOPOベクターにクローン化し、Zero Blunt TOPO PCR Cloning Kit (Thermo Fisher Scientific)を用いてE. coliで増幅した。次に、T7-プロモーターおよびSP6-プロモーターをプライマーとして、E. coliの単一コロニーからそれぞれ16S rRNA遺伝子を増幅した(表3)。最後に、各コロニーから増幅した16S rRNA遺伝子のV3-V4領域を、F2-Rvプライマー(表3)を用いてサンガーシークエンス(FASMAC)によりシークエンスした。 Sanger Sequence of 16S rRNA Genes The 16S rRNA genes of each strain were amplified using 2 × KAPA HiFi Hot start ready mix (Roche) and primers F1-full-Fw / F3-full-Rv (Table 3). Next, the amplified 16S rRNA gene was cloned into a pCR-Blunt II-TOPO vector, and E. coli was used in the Zero Blunt TOPO PCR Cloning Kit (Thermo Fisher Scientific). Amplified with colli. Next, using the T7-promoter and SP6-promoter as primers,

簡単に述べると、模擬細胞集団の細菌をPBSに懸濁し、細胞溶解のためにリゾチーム、アクロモペプチダーゼ、およびプロテイナーゼKに連続的に供した。次いで、フェノール-クロロホルム抽出によりDNAを回収した。Illumina adapter overhang nucleotide sequence(表3のCONV341FおよびCONV805R)を含む領域特異的プライマーを用いて、16S rRNA遺伝子のV3-V4領域を増幅した。増幅産物を、AMPure XP磁気ビーズ(Beckman Coulter)を用いて精製し、Nextera XT Index Kit v2(Illumina)を用いてインデックス化した。AMPure XPを用いた精製後、プールしたライブラリーをTapeStation(Agilent)およびKAPA Library Quantification Kit for Illumina (Kapa Biosystems)により定性および定量した。20%PhiX control v3(Illumina)をスパイクした変性ライブラリーを、MiSeqプラットフォーム(Illumina、2×300bp paired-end reads)でシークエンスした。配列データを質について確認し、Trimmomatic version 0.3847を用いてトリミングした。OTUはMothurバージョン1.35.148を用いて97%の同一性閾値でクラスター化した。各OTUで最も豊富に存在する配列は、OTUの代表的な配列として選択された(図1b)。 Sequence method of 16S rRNA Briefly, bacteria of a simulated cell population were suspended in PBS and continuously subjected to lysozyme, achromopeptidase, and proteinase K for cytolysis. DNA was then recovered by phenol-chloroform extraction. The V3-V4 region of the 16S rRNA gene was amplified using region-specific primers containing the Illumina adapter nucleotide sequence (CONV341F and CONV805R in Table 3). Amplified products were purified using AMPure XP magnetic beads (Beckman Coulter) and indexed using Nextera XT Index Kit v2 (Illumina). After purification with AMPure XP, the pooled libraries were qualitatively and quantified by TapeStation (Agilent) and KAPA Library Quantification Kit for Illumina (Kapa Biosystems). A denatured library spiked with 20% PhiX control v3 (Illumina) was sequenced on the MiSeq platform (Illumina, 2x300 bp paired-end reads). The sequence data was checked for quality and trimmed using Trimmomatic version 0.38 47. OTUs were clustered with a Motur version 1.35.1 48 with a 97% identity threshold. The most abundant sequence in each OTU was selected as the representative sequence of the OTU (Fig. 1b).
マウスの処置はすべて、理研の施設内動物実験委員会が承認したプロトコールに基づき、研究所の倫理指針に準拠して実施した。状態を維持しているマウスは以下のとおりであった。6週齢のC57BL6/J雄マウスをCLEA Japanから購入し、サンプリング前に同じケージにCE-2飼料(CLEA Japan)を給餌することにより理研施設で3日間維持した。 Mouse Preparation All mouse procedures were performed in accordance with the Institute's ethical guidelines, based on a protocol approved by RIKEN's Institutional Animal Care and Use Committee. The mice that maintained the state were as follows. Six-week-old C57BL6 / J male mice were purchased from CLEA Japan and maintained in the RIKEN facility for 3 days by feeding the same cage with CE-2 feed (CLEA Japan) prior to sampling.
ネズミ盲腸は、セボフルラン麻酔下で頚椎脱臼後10分以内に手術により外に出した。異なる部位の盲腸内容物(図2a)を、滅菌済みはさみを用いてスライスすることによりサンプリングした。サンプリングプロセスは、クラスIIのバイオセーフティキャビネット内で手術後10分以内に行われた。各マウスの各部位のサンプルを、DNA Lobind Tube(Eppendorf)に採取した。対照では、2本の空試験管を用いた。サンプルの重量は、DNA Lobind Tube(全サンプルについて8.57~19.82mgの範囲)に採取した直後に測定した。次に、各試料を添加したPBS(1mg当たり50μl)に分散させ、3,200rpmで1分間ボルテックスすることにより混合した。懸濁試料は、その後の実験まで4℃で保存した。 Collection of mouse cecum contents The murine cecum was surgically removed within 10 minutes after cervical spine dislocation under sevoflurane anesthesia. Cecal contents at different sites (FIG. 2a) were sampled by slicing with sterile scissors. The sampling process was performed within 10 minutes after surgery in a Class II biosafety cabinet. Samples of each site of each mouse were collected on a DNA Lobind Tube (Eppendorf). In the control, two blank test tubes were used. Sample weights were measured immediately after collection on a DNA Lobind Tube (range 8.57 to 19.82 mg for all samples). Next, each sample was dispersed in added PBS (50 μl / mg) and mixed by vortexing at 3,200 rpm for 1 minute. Suspended samples were stored at 4 ° C until subsequent experiments.
マウス盲腸試料を、1mgの盲腸内容物当たり1mlのPBSに希釈し、その後、3,200rpmで1分間ボルテックスした。対照では、空のチューブにPBSを添加した。次いで、0.22μmの孔径のUltrafree-MC Centrifugal Filter(Merck)を用いて、希釈した試料400μlを遠心分離(10,000g、10分、4℃)により濾過した。メンブラン上に残った試料に400μlの新鮮なPBSを添加し、ピペッティングにより懸濁した後、全量を新しいDNA Lobind Tube中に写した。次いで、懸濁した試料を、3,200rpmで1分間ボルテックスした。懸濁試料およびフィルター通過液に含まれる細胞外DNAは、その後の測定まで4℃で保存した。なお、0.22μmのフィルターによるDNA分離の適切性は、0.1μmの孔径のフィルターを用いた場合と比較して、フィルター通過液中の細胞外DNAの量がほぼ一致し、フィルター通過液中に細胞が検出されなかったこと、フィロターろ過後のフィルター上から回収された細菌量が等しいこと、および、フィルターから回収された細菌量がデジタルPCRによる細菌数と相関することから確認された(図31参照)。 Filtering extracellular DNA Mouse cecal samples were diluted to 1 ml PBS per 1 mg cecal content and then vortexed at 3,200 rpm for 1 minute. In controls, PBS was added to an empty tube. Then, 400 μl of the diluted sample was filtered by centrifugation (10,000 g, 10 minutes, 4 ° C.) using an Ultrafree-MC Centrifugal Filter (Merck) having a pore size of 0.22 μm. 400 μl of fresh PBS was added to the sample remaining on the membrane, suspended by pipetting, and then the entire amount was transferred into a new DNA Robin Tube. The suspended sample was then vortexed at 3,200 rpm for 1 minute. The extracellular DNA contained in the suspended sample and the filter-passing solution was stored at 4 ° C. until subsequent measurements. The appropriateness of DNA separation using a 0.22 μm filter is such that the amount of extracellular DNA in the filter-passing fluid is almost the same as that in the case of using a filter having a pore size of 0.1 μm, and the amount of extracellular DNA in the filter-passing fluid is almost the same. It was confirmed that no cells were detected in the cells, that the amount of bacteria recovered from the filter after filter filtration was equal, and that the amount of bacteria recovered from the filter correlated with the number of bacteria collected by digital PCR (Fig.). 31).
総濃度測定
細胞または細胞外16S rRNA遺伝子の総濃度は、プライマーF1-FwおよびF1-Rv(表3)を用いて、Droplet DigitalTM PCR(ddPCR)(Bio-Rad)により測定した。等モル混合した4つの細胞バーコードテンプレート(表3; 24個のランダム塩基を含有する各テンプレートは、我々の以前の文献25に従って設計され、ランダム塩基の数は、単一のMiSeqシークエンス作業において測定された個々の細胞を区別するのに十分であった)の濃度も、プライマーNoBiotin-Link-barcode-FおよびP5-index-R1P-barcode-R(表3)を用いたddPCRによって測定した。ddPCRは、QX200TM ddPCRTM EvaGreen(商標) Supermix(Bio-Rad)のユーザーマニュアルに従って実施した。 Total Concentration Measurement by BarBIQ Method The total concentration of cellular or extracellular 16S rRNA genes was measured by Droplet Digital TM PCR (ddPCR) (Bio-Rad) using primers F1-Fw and F1-Rv (Table 3). Four cell barcode templates with equimolar mixing (Table 3; each template containing 24 random bases was designed according to our previous literature 25 , and the number of random bases was measured in a single MiSeq sequence operation. Concentrations (which were sufficient to distinguish the individual cells) were also measured by ddPCR using the templates NoBiotin-Link-barcode-F and P5-index-R1P-barcode-R (Table 3). The ddPCR was performed according to the user manual of QX200 TM ddPCR TM EvaGreen ™ Supermix (Bio-Rad).
シークエンスライブラリーを作製するために、合計約240,000個の細胞(または細胞外の16S rRNA遺伝子の20,000コピー)を、等モル混合細胞バーコード、プライマー(400 nM P7-R2P-341F、400 nM P5-index-R1P-R、10 nM Biotin-link-805R、および10 nM Biotin-Link-F)、ddPCRTM Supermix for Probes (No dUTP)(Bio-Rad)、128ユニットのPlatinum Taq (Invitrogen)、および100 nM NTPを含む溶液960μLと混合した。3,200rpmで1分間ボルテックス後、混合溶液をBio-Rad droplet generatorにより液滴に封入し、30μlの混合溶液および80μlのDroplet Generation Oil for Probe (Bio-Rad)をDG8TMカートリッジ上の各チャネルにロードした(各試料について32チャネルを使用した)。模擬細胞集団測定のために、約600,000個の細胞を、細胞バーコードの約600,000コピー、320ユニットのPlatimum Taq、およびプライマー、dNTP、ddPCRTM Supermix for Probes (No dUTP)を含む2400μLの溶液と混合し;次いで、ボルテックス後、混合溶液を、試料あたり80チャンネルを使用して液滴に封入した。Miseqシークエンスのためのライブラリーを、液滴中におけるワンステップPCRによって生成した(95℃の5分間;94℃の45秒間および60℃の150秒間の6サイクル;94℃の25秒間および60℃の80秒間の49サイクル;98℃の10分間)。 To create a one-step droplet amplification sequence library, a total of approximately 240,000 cells (or 20,000 copies of extracellular 16S rRNA genes) were subjected to equimolar mixed cell barcodes, primers (400 nM). P7-R2P-341F, 400 nM P5-index-R1P-R, 10 nM Biotin-link-805R, and 10 nM Biotin-Link-F), ddPCR TM Supermix for Probes (No dUTP) (Bio) The unit was mixed with Primer Taq (Invitrogen) and 960 μL of solution containing 100 nM NTP. After vortexing at 3,200 rpm for 1 minute, the mixture was encapsulated in droplets with a Bio-Rad droplet generator, and 30 μl of the mixture and 80 μl of Droplet Generation Oil for Probe (Bio-Rad) were added to each channel on a DG8 TM cartridge. Loaded (32 channels were used for each sample). Approximately 600,000 cells for simulated cell population measurement, 2400 μL containing approximately 600,000 copies of cell barcodes, 320 units of Sample Taq, and primers, dNTPs, ddPCR TM Supermix for Solutions (No dUTP). After vortexing, the mixed solution was encapsulated in droplets using 80 channels per sample. Libraries for Misseq sequences were generated by one-step PCR in droplets (95 ° C. for 5 minutes; 94 ° C. for 45 seconds and 60 ° C. for 150 seconds, 6 cycles; 94 ° C. for 25 seconds and 60 ° C.). 49 cycles for 80 seconds; 10 minutes at 98 ° C.).
液滴増幅技術により生成したライブラリーをクロロホルムを用いて回収し、80μlのTEバッファー(Invitrogen)および280μlのクロロホルム(Sigma)を、各DG8TMカートリッジ(8ウェル)から収集した液滴と混合し、その後10回ピペッティングし、水および有機相が分離されるまでボルテックスし;遠心後(21,900g、10分)、ライブラリーを含む水相の溶液を抽出した。次いで、AMPure XPを用いたビーズ精製および2%E-GelTM EX Agarose Gels (ThermoFisher Scienctific)を用いたゲル精製により、未連結バーコード増幅物、残存プライマー、回収溶液中の副産物などの非標的DNAを除去した。その後、ビオチン化された結合していない16S rRNA増幅物をストレプトアビジン磁気ビーズ(NEB)により除去し、結合していない16S rRNA増幅物をプライマーのBiotin-link-805R(図5)によりビオチン化した28。AMPure XP、ゲル、およびストレプトアビジンビーズを用いた精製工程は、それぞれ2回実施した。最後に、精製したライブラリーをDNA Clean and Concentrator Kit(Zymo Research)により濃縮した。ライブラリーの品質をAgilent 2100 Bioanalyzerにより確認し、プライマーP1_qPCR_FwおよびP2_qPCR_Rv(表3)を用いてqPCR(KAPA SYBR Fast qPCR kit, KAPA Biosystems)により濃度を測定した。AMPure XP、ゲル、およびストレプトアビジンビーズを使用する精製工程の詳細なプロトコールを、各製品のユーザー指示に従って実施した。 Library Recovery and Purification The library generated by the droplet amplification technique was recovered using chloroform and 80 μl TE buffer (Invitrogen) and 280 μl chloroform (Sigma) were collected from each DG8 TM cartridge (8 wells). It was mixed with the droplets, then pipeted 10 times and vortexed until the water and organic phases were separated; after centrifugation (21,900 g, 10 minutes), the solution of the aqueous phase containing the library was extracted. Non-target DNA such as unlinked barcode amplifications, residual primers, and by-products in the recovery solution were then purified by bead purification using AMPure XP and gel purification using 2% E-Gel TM EX Agarose Gels (Thermo Fisher Scientific). Was removed. Then, the biotinylated 16S rRNA amplification product was removed with streptavidin magnetic beads (NEB), and the unbinding 16S rRNA amplification product was biotinylated with the primer Biotin-link-805R (FIG. 5). 28 . The purification steps using AMPure XP, gel, and streptavidin beads were each performed twice. Finally, the purified library was concentrated by DNA Clean and Concentrator Kit (Zymo Research). The quality of the library was confirmed by Agilent 2100 Bioanalyzer and the concentration was measured by qPCR (KAPA SYBR Fast qPCR kit, KAPA Biosystems) using primers P1_qPCR_Fw and P2_qPCR_Rv (Table 3). A detailed protocol for the purification process using AMPure XP, gel, and streptavidin beads was performed according to the user instructions for each product.
サンプルのライブラリーを、MiSeq platform (MiSeq Reagent Kit v3、600サイクル、Illumina)上で、Read 1については30サイクル、Index 1については295サイクル、Index 2については8サイクル、Read 2については295サイクルを割り当ててペアエンドのシークエンスをした(図5)。Illumina Index 1シークエンシングプライマーを、インデックスの代わりに16S rRNA配列を読み取るためにI1_primer(表3)と命名されたカスタムプライマーに置き換えた。シークエンスのための配列の不均一性を維持するために、別途作製したスパイクインコントロールを試料と共にシークエンスした(図18および19)。より具体的には、細菌、細胞外のDNA、または細胞バーコードの総濃度は、QX200TM ddPCR EvaGreenTM Supermix(Bio-Rad)の指示に従い、Droplet DigitalTM PCR(ddPCR)により測定した。細菌および細胞外DNA試料については、16S rRNA遺伝子のV1-V2領域を標的とするプライマー、F1-FwおよびF1-Rv、または16S rRNA遺伝子のV3-V4領域を標的とする341Fおよび805Rを用いた(表3)。細胞バーコードには、プライマーであるBiotin-Link-barcode-FおよびP5-index-R1P-barcode-R(index GTACTGAC含有)を用いた(表3)。QX200TM ddPCRTM EvaGreenTM Supermix、1μMプライマー、1μM dNTP、およびサンプル(多重希釈、1分間3,200rpmのボルテックス)を30μlの容量で混合し、混合のためにピペットで分注した。次に、Droplet Generation Oil for EvaGreen(Bio-Rad)、DG8TMカートリッジ(Bio-Rad)、およびDroplet Generator (Bio-Rad)を用いて、混合溶液を液滴に封入した。液滴PCRは、以下のステップにより実施した。初期変性には95℃が5分;変性には95℃45秒、アニーリングと伸長には60℃150秒の6サイクル;変性には95℃25秒とアニーリングと伸長には60℃80秒の39サイクル(F1-FwとF1-Rv)または95℃25秒とアニーリングと伸長には60℃80秒の34サイクル(プライマー341F/805R);シグナル安定化には4℃5分間および90℃5分間。その後、液滴の蛍光強度をQX200 Droplet Reader (Bio-Rad)により測定し、ソフトウェアQuantaSoft(Bio-Rad)による強度の二峰性分布の谷である閾値に基づいて陽性および陰性液滴数を決定した(図18a)。最後に、サンプルの濃度は、陽性および陰性液滴の比率およびサンプルの希釈率に基づいて算出した。 A library of MiSeq sequencing samples on the MiSeq Reagent Kit v3, 600 cycles, Illumina, 30 cycles for
液滴生成のために、濃度250細胞/μlの細菌を使用した。この濃度は、1つの液滴の体積が約0.8nlであるので、約20%の液滴が細菌を含有することとなる。この条件下では、ポアソン分布に従い、細菌を含有する液滴の90%以上は1つの細菌のみを含み、他のものは2つ以上の細菌を含むこととなる。
理論的には、BarBIQは、シークエンスにより決定された各cOTUの比例濃度を総濃度を用いて正規化することによってcOTUの絶対濃度を測定し、異なる細胞バーコード濃度は各cOTUの比例濃度を変化させないことから、細胞バーコードの濃度はBarBIQにおける濃度測定に影響しない。しかしながら、より高濃度の細胞バーコードは、より多くのジャンクアンプリコンを生成し、これは16S rRNA配列の同定に影響するかもしれない。一方、低濃度の細胞バーコードは、細菌の検出効率を低下させるであろう。われわれは、BarBIQ測定のために100~250分子/μlの範囲の細胞バーコードを使用し、その結果、8~20%の液滴がバーコードを含むこととなった。細胞とバーコードの両方が含まれた液滴のみがシークエンスされるため、最終的に3%~11%がシークエンスされると予測された。 Adjustment of Bacterial Concentration and Barcode Concentration During Droplet Preparation Bacteria at a concentration of 250 cells / μl were used for droplet generation. At this concentration, the volume of one droplet is about 0.8 nl, so that about 20% of the droplets contain bacteria. Under this condition, according to the Poisson distribution, 90% or more of the droplets containing bacteria will contain only one bacterium, and the others will contain two or more bacteria.
Theoretically, BarBIQ measures the absolute concentration of cOTU by normalizing the proportional concentration of each cOTU determined by the sequence with the total concentration, and different cell barcode concentrations change the proportional concentration of each cOTU. The concentration of the cell barcode does not affect the concentration measurement in BarBIQ because it does not allow it. However, higher concentrations of cell barcodes produce more junk amplicon, which may affect the identification of 16S rRNA sequences. On the other hand, low cell barcodes will reduce the efficiency of bacterial detection. We used cell barcodes in the range of 100-250 molecules / μl for BarBIQ measurements, resulting in 8-20% droplets containing barcodes. Only droplets containing both cells and barcodes were sequenced, so it was predicted that 3% to 11% would eventually be sequenced.
増幅物シークエンシング54においてPhixを用いてしばしば行われるように、シークエンシングにおける不均衡な塩基型を回避するために、設計されたスパイクインコントロールをライブラリーと混合し、同時にシークエンスした。スパイクインコントロールの作成の概略を図20に示す。最初に、174および176のランダム塩基を含む2つの一本鎖DNA(ssDNA)StdTarget1およびStdTarget2を、400nMの濃度で一晩、T4 RNAリガーゼ(NEB)により連結し、次いで65℃下で15分間、酵素の変性工程を行った。次に、StdTarget1および2の連結産物から別個の設計されたランダムバーコード(RandomBar_std1、RandomBar_std2、RandomBar_std3およびRandomBar_std4;図16および表3)を含む4種類の異なるプライマーを用いて、伸長によって4種類のランダムバーコードテンプレットを作成し、15分間の90℃から室温へのアニーリング工程の後、Klenowポリメラーゼ(NEB)を用いて伸長を行った。カラム精製後、4つの異なるインデックス化プライマー(RandomBar_std2についてはIndex_NSE501、RandomBar_std3についてはIndex_NSE502、RandomBar_std4についてはIndex_NSE505、RandomBar_std1についてはIndex_NSE506、図16および表3)および他の末端にcommon primer std_R2を用い、最後の工程によって作製した伸長したテンプレートから4種類のDNA産物を増幅した。約600塩基対を含む産物をゲル電気泳動で精製した。P1_qPCR_FwおよびP2_qPCR_Rvプライマーを用いてさらに2回PCRを行い、より多くの産物を増幅した;PCRの各ラウンドからの産物をゲル電気泳動により精製した。スパイクインコントロールは、プライマーP1_qPCR_FwおよびP2_qPCR_Rvを用いてqPCRにより測定した濃度に基づいて、これらの4種類の産物を等しい割合で混合することによって作製した。 Spike-in Controls for BarBIQ Sequences Spike-in controls designed to avoid imbalanced base types in sequencing are mixed with the library and simultaneously, as is often done with Phix in amplification product sequencing 54. Sequenced. The outline of the creation of the spike-in control is shown in FIG. First, two single-stranded DNA (ssDNA) StdTarget1 and StdTarget2 containing random bases of 174 and 176 were ligated overnight with T4 RNA ligase (NEB) at a concentration of 400 nM, then at 65 ° C. for 15 minutes. An enzyme denaturation step was performed. Next, four random types by extension are used, using four different primers including four random barcodes (RandomBar_std1, RandomBar_std2, RandomBar_std3 and RandomBar_std4; FIG. 16 and Table 3) designed separately from the linkages of StdTarget1 and 2. Barcode templets were prepared and extended from 90 ° C. to room temperature for 15 minutes using Klenow polymerase (NEB). After column purification, four different indexing primers (Index_NSE501 for RandomBar_std2, Index_NSE502 for RandomBar_std3, Index_NSE505 for RandomBar_std4, Index_NSE505 for RandomBar_std4, Index_NSE50 for RandomBar_std1 and Table3d. Four types of DNA products were amplified from the elongated template prepared by the process. Products containing about 600 base pairs were purified by gel electrophoresis. Two more PCRs were performed with P1_qPCR_Fw and P2_qPCR_Rv primers to amplify more products; products from each round of PCR were purified by gel electrophoresis. Spike-in controls were made by mixing these four products in equal proportions based on the concentrations measured by qPCR using primers P1_qPCR_Fw and P2_qPCR_Rv.
Bar配列とcOTU(細胞型)を同定し、各cOTUを定量するシークエンスにより得られたデータを処理するためのパイプラインを開発した。パイプラインの主な戦略は図6に示し、各ステップの詳細はWO2018/235938Aおよび以下に記載される通りであった。原則として、MiSeqからのリードは、まず細胞バーコード(Read R1)25を用いてクラスター化した。次に、同じ細胞バーコードに連結された16S rRNA配列(Read I1およびR2)を、それらの配列同一性に基づいてさらにクラスター化した。各クラスター化16S rRNA配列グループに対する代表的な配列(RepSeq)を、各配列タイプに対するリード数とそれらのシークエンス品質の両方に基づいて生成した。各RepSeqのリード数とRepSeqの各配列型に対するRepSeqの数の両方に応じて、考えられる誤ったRepSeqを複数のステップでさらに除去した(WO2018/235938Aおよび図6参照)。独特のRepSeq配列型をBar配列と名付けた。次いで、Bar配列を、同じ液滴におけるそれらの共検出頻度に基づいてcOTUにクラスター化した。もし2つ以上のBar配列が同じ液滴で頻繁に検出されたならば、それらは同じ細菌由来の複数の16S rRNA遺伝子とみなし、それらを単一のcOTUにクラスター化した。次に、各cOTUに対する細胞数を、固有の細胞バーコードの数(すなわち、バーコードクラスター)によってカウントした。各cOTUの絶対細胞濃度は、ddPCRにより測定した試料の総濃度を用いて、cOTUのシークエンスで計数された細胞を標準化することによって決定した。さらに、サンプリングおよび/または測定中にコンタミしたcOTUを対照により同定した。
パイプラインの大部分はPerl(バージョン5.22.1)で書かれており、その他はソフトウェアで実施されていた。R(バージョン3.5.1)、ヌクレオチド配列クラスタライザー(バージョン0.0.7)25、bwa(バージョン0.7.15)49。本パイプラインで使用されているPerlのモジュールおよびRのパッケージは表4に列挙されている。 Data processing pipeline We have identified a Bar sequence and cOTU (cell type) and developed a pipeline for processing the data obtained by a sequence that quantifies each cOTU. The main strategy of the pipeline is shown in FIG. 6 and the details of each step are as described in WO2018 / 235938A and below. In principle, reads from MiSeq were first clustered using cell barcode (Read R1) 25. The 16S rRNA sequences (Read I1 and R2) linked to the same cell barcode were then further clustered based on their sequence identity. Representative sequences (RepSeq) for each clustered 16S rRNA sequence group were generated based on both the number of reads for each sequence type and their sequence quality. Depending on both the number of reads for each RepSeq and the number of RepSeq for each sequence type of RepSeq, possible false RepSeq was further removed in multiple steps (see WO2018 / 235938A and FIG. 6). The unique RepSeq sequence type was named the Bar sequence. Bar sequences were then clustered into cOTUs based on their co-detection frequency in the same droplet. If more than one Bar sequence was frequently detected in the same droplet, they were considered multiple 16S rRNA genes from the same bacterium and clustered into a single cOTU. The number of cells for each cOTU was then counted by the number of unique cell barcodes (ie, barcode clusters). The absolute cell concentration of each cOTU was determined by standardizing the cells counted in the cOTU sequence using the total concentration of the sample measured by ddPCR. In addition, contaminated cOTUs during sampling and / or measurement were identified by controls.
Most of the pipeline was written in Perl (version 5.22.1), and the others were implemented in software. R (version 3.5.1), nucleotide sequence cluster riser (version 0.0.7) 25 , bwa (version 0.7.15) 49 . The Perl modules and R packages used in this pipeline are listed in Table 4.


我々のシークエンスにおいて、R1(30塩基)は細胞バーコードであり、I1(295塩基)およびR2(塩基)は16S rRNA配列であり、I2(8塩基)は各試料をユニークに標識するインデックスであった。3回のシークエンス作業をすべて表4にまとめた。 Details of BarBIQ data processing In our sequence, R1 (30 bases) is a cell barcode, I1 (295 bases) and R2 (bases) are 16S rRNA sequences, and I2 (8 bases) makes each sample unique. It was an index to label. Table 4 summarizes all three sequence operations.
細胞バーコード(R1)のリードは、当初の低品質リードの欠失を除き、以前の報告(WO2018/235938A)の通り、配列に基づいてクラスター化した。まず、広く実施されているように47、4つの連続した塩基からなる少なくとも1つのウインドウを含む低品質のR1リード(その平均スコアは15より小さい)を除外した。シークエンスラン1、2、および3のリードの割合はそれぞれ、0.23%、0.05%および0.06%であり、このプロセスによって除外された。次に、設計された細胞バーコードの最後の4つの固定塩基と一致するR1リードを次のステップのために選択した。サンプルとスパイクインコントロールの両方を含む同一シークエンスランに由来するすべての距離2のパラメータを有するR1リードを、ソフトウェア、ヌクレオチド配列-クラスタライザー25を用いてクラスター化した。異なるインデックスがなされたが、同じクラスターにクラスター化されたリードは除外された。得られたクラスターをBClusterと名付けた。各リードは、2つの16S rRNA配列(I1とR2)と細胞バーコード(R1)を有した(図6)。 Step 1: Cell Barcode-Based Clustering Cell barcode (R1) reads were sequence-based clustered as previously reported (WO2018 / 235938A), except for the deletion of the original low quality read. .. First, as is widely practiced, low quality R1 reads (whose average score is less than 15) containing at least one window of 47, 4 consecutive bases were excluded. The percentages of leads in
この段階では、すべてのリードの末端を、リードの質およびそれらのプライマー部分に基づいて、一定の位置でトリミングした。MiSeqシークエンスにおけるリードの塩基の品質は、一般に、リードの末端において減少し、末端においてより多くのエラーを生じさせる50。データ処理の次の段階では、リードの長さは同じに保つ必要があるので、われわれは均一な閾値を適用し、1回のシークエンス作業ですべてのリードの末端をトリミングした。全リードの平均品質に基づいて、シークエンスランのトリミング位置を決定した;トリミング位置を選択する規則は、連続する2つの位置の平均品質の平均が25より低く(連続する2つの位置の平均品質の平均を使用して、シークエンスの品質の偶発的な変動を回避できる)始めたとき、リードの頭部から最初の位置を選ぶことであった。シークエンスラン1にはトリミング位置231(I1)と194(R2)、シークエンスラン2には294(I1)と267(R2)、シークエンスラン3には271(I1)と237(R2)を用いた。さらに、各リードのプライマー部分は、I1については21塩基、R2については17塩基である設計されたプライマーの長さに依存して直接トリミングされた。 Step 2: Trimming based on low quality ends and primer parts of leads I1 and R2 At this stage, the ends of all leads were trimmed in place based on the quality of the leads and their primer parts. The quality of the read base in the MiSeq sequence is generally reduced at the ends of the leads, causing more errors at the ends 50 . In the next stage of data processing, the lead lengths need to be kept the same, so we applied uniform thresholds and trimmed the ends of all leads in a single sequence operation. The trimming position of the sequence run was determined based on the average quality of all leads; the rule for selecting the trimming position was that the average quality of the average quality of the two consecutive positions was lower than 25 (the average quality of the two consecutive positions). The average could be used to avoid accidental fluctuations in sequence quality), which was to pick the first position from the lead's head. Trimming positions 231 (I1) and 194 (R2) were used for
この段階では、16S rRNA配列(I1およびR2)に基づいて各BCluster内のリードをクラスター化する2つのサブステップを実施した。 Step 3: Clustering with 16S rRNA sequences (I1 and R2) At this stage, two substeps were performed to cluster the reads within each BClaster based on the 16S rRNA sequences (I1 and R2).
ステップ3.1において、ソフトウェアヌクレオチド配列クラスタライザーを用いて、リードI1およびR2をそれらの間の置換距離に基づいて距離3のパラメータでクラスター化し、同じMiSeq IDを有するリードI1およびR2を、物理的に連結することによって単一のリードとして考えた。 Step 3.1: Clustering by substitution distance In step 3.1, reads I1 and R2 are clustered with a parameter of
ステップ3.1は、エラーではなく真の16S rRNA配列であるかもしれない非常に類似した配列を統合したため、追加のクラスター化ステップが用いられた。ステップ3.1によって生成された各サブクラスターについて、リードは、リードの特定の位置に基づいて再びクラスター化された(すべてのリードは、第一の塩基によって整列された)。この過程の論理図を図20に示す。リード位置ごとに、塩基 (A、T、C、G) の種類を含むリード数をカウントし、1番目に豊富な塩基を含むリード数に対する、2番目に豊富な塩基を含むリード数の比(Ratio2ndと命名)を算出した。さらに、各リードのカウントは、この位置での塩基のシークエンスの品質スコアによって重み付けされた;規則は、スコアが15未満の場合は0として重み付けし、一方スコアが15以上である場合は、当該スコアを41で割ったスコアとして重み付けした。その後、全ての位置の中で最も高いRatio2ndを選択し、閾値0.75と比較した;Ratio2nd≧0.75の場合、2番目に豊富な塩基を含むリードは、新しいサブクラスターとして元のサブクラスターから分離された。その後、両方の新しい生成サブクラスターが同じ戦略によって再度クラスター化され、全てのサブクラスターの全ての位置のRatio2ndが0.75より低くなるまで繰り返しクラスタリングが実施された。最後のサブクラスターをSClusterと名付けた(図6)。液滴中の16S rRNA配列(同じ細菌からの複数の16S rRNA配列)の増幅効率はしばしば偏りがあった。したがって、この場合のRatio2ndは0.75未満かもしれないが、両方とも真の16S rRNA配列である。幸いなことに、同一の細菌由来のこれらの異なるタイプの配列(例えば、AおよびB)の増幅バイアスはランダムに起きた。例えば、時には配列Aがより多くのリードを有し、時として配列Bがより多くのリードを有したので、これら2つの配列型の両方が異なる液滴から同定されたかもしれず、増幅バイアスは、細胞計数に影響を及ぼさなかった。しかしながら、両方の配列型を検出した液滴の数は、より低い閾値を使用した場合と比較して閾値0.75を使用した場合に減少した。このことは、同じ細菌から2つの配列を同定するのに用いたステップに影響を与えるかもしれない(ステップ12参照)。他方、0.75より低い閾値を使用すると、誤った配列のみを含むサブクラスターを生成し得、次のプロセスに問題を生じる。従って、閾値0.75を用いて16S rRNA配列を同定したが、同じ細菌由来の両方の配列が同じ液滴で検出された場合には別の閾値0.1を用いて検出した。閾値0.1によって生成されたデータは同じ細菌由来の複数の16S rRNA配列を検出するためにのみ使用され、閾値0.75によっても同定された16S rRNA配列が使用された。なお、ステップ3では置換ミスを考慮したのみであるため、挿入ミスおよび欠失ミスはすべてSClusterとしてクラスター化したが、このパイプラインの副作用は次のステップで解決した。 Step 3.2: Single-position-based clustering of reads Step 3.1 integrated a very similar sequence that may be a true 16S rRNA sequence rather than an error, so an additional clustering step was used. .. For each subcluster generated by step 3.1, the reads were reclustered based on the specific location of the reads (all reads were aligned with the first base). A logical diagram of this process is shown in FIG. The number of reads containing the type of base (A, T, C, G) is counted for each read position, and the ratio of the number of reads containing the second most abundant base to the number of reads containing the first abundant base (the ratio of the number of reads containing the second most abundant base). (Named Ratio2nd) was calculated. In addition, the count for each read was weighted by the quality score of the sequence of bases at this position; the rule weighted as 0 if the score was less than 15, while the score was 15 or more. Was weighted as a score divided by 41. The highest Ratio2nd of all positions was then selected and compared to a threshold of 0.75; if Ratio2nd ≥ 0.75, the second most abundant base-containing read would be the original subcluster as a new subcluster. Was isolated from. Both new spawned subclusters were then reclustered by the same strategy and repeated clustering was performed until Radio2nd at all positions of all subclusters was below 0.75. The last subcluster was named Scruster (Fig. 6). The amplification efficiency of 16S rRNA sequences in droplets (multiple 16S rRNA sequences from the same bacterium) was often biased. Thus, Radio2nd in this case may be less than 0.75, but both are true 16S rRNA sequences. Fortunately, amplification biases for these different types of sequences from the same bacterium (eg, A and B) occurred randomly. For example, both of these two sequence types may have been identified from different droplets because sometimes sequence A had more reads and sometimes sequence B had more reads, and the amplification bias was. It did not affect cell counting. However, the number of droplets that detected both array types was reduced when the threshold 0.75 was used compared to when the lower threshold was used. This may affect the steps used to identify the two sequences from the same bacterium (see step 12). On the other hand, using thresholds below 0.75 can generate subclusters containing only the wrong sequences, causing problems for the next process. Therefore, 16S rRNA sequences were identified using a threshold of 0.75, but if both sequences from the same bacterium were detected in the same droplet, they were detected using a different threshold of 0.1. The data generated by threshold 0.1 was used only to detect multiple 16S rRNA sequences from the same bacterium, and the 16S rRNA sequences also identified by threshold 0.75 were used. Since only the substitution error was taken into consideration in
各SClusterについて、リードI1およびR2の両方に対する代表的な配列(RepSeq)を、各塩基のシークエンス品質スコアおよび各タイプの塩基の割合の両方に基づいて生成した。各タイプの塩基の比率を計算するために、各タイプの塩基についてリード数を品質スコアで重み付けした。品質スコアが15未満の場合には0として重み付けし;スコアが15以上の場合には、41で除したスコアとして重み付けした。それぞれの位置について、1番目に豊富な塩基型を代表的な塩基として用いた(図6)。単一リードによるSCクラスターから生成されたRepSeqはエラーのリスクが高いため、この段階では単一リードによるRepSeqも除去した。各SClusterのリード数は、エラーを含む誤ったRepSeqと正しいRepSeqを区別する重要な情報として次の段階では使用された。 Step 4: Create a representative sequence (RepSeq) for each SC cluster For each SClaster, a representative sequence (RepSeq) for both reads I1 and R2, the sequence quality score of each base and the proportion of each type of base. Generated based on both. To calculate the ratio of each type of base, the number of reads was weighted by quality score for each type of base. If the quality score was less than 15, it was weighted as 0; if the score was 15 or more, it was weighted as a score divided by 41. For each position, the most abundant base type was used as a representative base (Fig. 6). Since RepSeq generated from SC clusters with a single read has a high risk of error, RepSeq with a single read was also removed at this stage. The number of reads for each SClaster was used in the next step as important information to distinguish between incorrect RepSeq including errors and correct RepSeq.
この段階で、ステップ2でプライマー部分として除外したリードの頭部(I1は21塩基、R2は17塩基)で生じた挿入または欠失(indels)に起因するエラー型のRepSeqを除去した。たとえば、BCluster xが16S rRNA配列のリードを含むと仮定し、そのうちのいくつかは頭部に2個の欠失をもつ場合、プライマー部分を切り取った後に2種類のリード(RepSeq iとj(リードには2個の欠失がある))が生じ、RepSeq jがiの左から右へ2塩基シフトしているはずである(図21)。このエラー型をシフトしたRepSeqと名付けた。
ステップ5の論理図を図21に示すが、戦略は以下の通りである。a)各BClusterで考えられるすべてのRepSeqs型ペアを見出し、1つのRepSeq型はもう1つのRepSeq型のシフト配列でり、そのシフトが8個未満であるRepSeq型のペアのみを選択した。b)シフトしたRepSeqタイプ(AおよびB)の各ペアについて、より多くのBClusterで同定されたRepSeqタイプを母親(mother)とし、他は可能な限りシフトと考えた。なぜなら、一般にエラーは正しいものより少ないからである。c)母親とシフトの各組について、母親のリードがシフトより多いBClusterの数(Nomother)およびその反対の事例(Noshift)をカウントした;母親とシフトの両方を含むBClusterのみを使用した;d)次に、エラーは正しいものより少ないので、NomotherがNoshiftより大きい時に、母親とシフトを保存した。e) 母親を伴うBClusterの中にこのシフトが存在する場合、このBClusterのシフトを削除し、母親にこのシフトのリード数(次のステップで母親に関するリード総数を使用した)を加え、母親を伴わないBClusterの中にシフトがある場合は、母親をシフトで置き換え(もし同一のシフトに関して2以上の母親が存在する場合には、より多くのBClusterで同定された母親を選ぶ)、シフトのリード数を置き換えられた母親に関するリード数として用いるという規則を用いて、d)において保存された母親とシフトのペアに基づいてシフトを除去した。I1およびR2RepSeqは独立して処理された。 Step 5: Removal of Shifted RepSeq Error types due to insertions or deletions (indels) occurring at the head of the read (21 bases for I1 and 17 bases for R2) excluded as primer moieties in
The logical diagram of
このステップで、I1 RepSeqおよびR2 RepSeqは、それらの末端におけるそれらのオーバーラップした配列に基づいて連結された。V3-V4領域における16S rRNA遺伝子の長さの分布は、Silvaのデータベース(v123.1)に依存してほぼ(>99.9%)400bp~500bpの範囲であるため(図22)、I1とR2の両方のリードのための295塩基のシークエンスは、基本的に、I1とR2のリードの各対の末端の間で90以上の重複塩基を達成することができる。しかしながら、各リードの末端における低いシークエンス品質(ステップ2参照)のため、実施されたシークエンスランの最良の経験に基づいて、データ処理のために用いることができるのは、I1の約294塩基およびR2の約267塩基のみである。それでも、60以上の重複塩基を検出することができる。したがって、V3-V4領域における16S rRNA遺伝子の全長を得るために、I1 RepSeqとR2 RepSeqとの間の重複配列を見出し、それらを単一のRepSeqとして連結するステップを実施した。しかし、シークエンスの質が良くなかったため、シークエンスラン1ではI1では231塩基、R2では194塩基のみが用いられ、したがって、オーバーラップした配列は検出されず、I1とR2のRepSeqは連結されなかった。
一般に、I1とR2の両方のRepSeqの末端にある数個の塩基は、偶然に同じであり得る。従って、I1 RepSeqとR2 RepSeqの両方の末端における5個以上の同一塩基の閾値を、偽のオーバーラップを回避するために重なりとして使用したためと考えた。理論的には、偶発的な重複の可能性は(1/4)bであり、ここで、bは重複した塩基の数であり、5塩基の事故重複の可能性は(1/4)5≦0.00098である。
さらに、模擬細胞集団およびM0のデータでは、すべての偶発的な重複が<5塩基であった(短いリードが使用されたため、重複は見出せない)。
重複部分のI1 RepSeqとR2 RepSeq間の置換の違いが、リード末端部分の品質が相対的に低かったために、稀であっても起こるかもしれない。従って、これらのエラーを除去するためにもう一つのプロセスを適用した。この戦略は、a)上述の連結プロセスの後、連結していないRepSeqを発見した。b)次に、同一のBCluster内の他のRepSeq(それぞれI1およびR2 RepSeqを直接比較)で各RepSeqを比較し、その1つの塩基が異なるRepSeqを見つけた。c) 1塩基相違のRepSeqを連結した場合、連結されていないRepSeqを削除し、連結されたRepSeqにそのリードを追加した。 Step 6: Concatenation of RepSeq of I1 and R2 In this step, I1 RepSeq and R2 RepSeq were ligated based on their overlapping sequences at their ends. Since the length distribution of the 16S rRNA gene in the V3-V4 region is approximately (> 99.9%) in the range of 400 bp to 500 bp depending on the Silva database (v123.1) (FIG. 22), I1 and A sequence of 295 bases for both reads of R2 can essentially achieve more than 90 overlapping bases between the ends of each pair of reads of I1 and R2. However, due to the low sequence quality at the ends of each read (see step 2), based on the best experience of sequence runs performed, only about 294 bases of I1 and R2 can be used for data processing. Only about 267 bases. Nevertheless, more than 60 overlapping bases can be detected. Therefore, in order to obtain the full length of the 16S rRNA gene in the V3-V4 region, a step of finding overlapping sequences between I1 RepSeq and R2 RepSeq and linking them as a single RepSeq was performed. However, due to poor sequence quality, only 231 bases were used for I1 and 194 bases for R2 in
In general, the few bases at the ends of both I1 and R2 RepSeq can happen to be the same. Therefore, it was considered that the threshold values of 5 or more identical bases at the ends of both I1 RepSeq and R2 RepSeq were used as overlaps to avoid false overlap. Theoretically, the possibility of accidental duplication is (1/4) b , where b is the number of duplicated bases and the possibility of accidental duplication of 5 bases is (1/4) 5 ≤0.00098.
In addition, in the simulated cell population and M0 data, all accidental duplications were <5 bases (no duplications found because short reads were used).
Differences in substitution between I1 RepSeq and R2 RepSeq in the overlap may occur, even in rare cases, due to the relatively low quality of the read end. Therefore, another process was applied to eliminate these errors. This strategy a) discovered unconnected RepSeq after the above-mentioned consolidation process. b) Next, each RepSeq was compared with another RepSeq (directly comparing I1 and R2 RepSeq, respectively) in the same BClaster to find RepSeq with different bases. c) When RepSeq with a difference of 1 base was concatenated, the unlinked RepSeq was deleted and the read was added to the concatenated RepSeq.
このステップでは、リードの主要部分における{リードの頭部(すなわち、プライマー部分、ステップ5参照)においてではない}1つの挿入または欠失(1-indel)エラーに起因して生じたエラータイプのRepSeqを除去した。ステップ3におけるクラスタリングは上述した置換のみに基づいていたため、インデルを含む誤ったリードをすべて分離し、個々のRepSeqを作成した。一般に、シークエンスのリードの中ごろに起こるインデルは非常にまれであるので(Schirmer M et al., BMC Bioinformatics 2016; 17:125)この段階では1-indelだけでなく、ステップ9で置換を伴う2塩基インデルと1-indelだけを考えた(後述)。
ステップ7の論理図を図23に示す。戦略は以下の通りである。a)各BClusterにおいて、1-indelの差異を持つRepSeqタイプの可能なペアをすべて見出した。b) エラーは一般に正しいものより少ないので、RepSeqタイプ(AおよびB)の各1-indel対について、より多くのBClusterで同定されるRepSeqタイプを母親とし、および他のものは1-indelであると考えた。c)母親と1-indelの各ペアについて、母親のリードが1-indel(Nomother)より多いBCluster数と、その反対の事例(No1-indel)を計数した;母親と1-indelの両方を含むBClusterのみを使用した。d)われわれは、NomotherがNo1-indelより大きいときにその母親と1-indelのペアだけを残した。なぜなら、エラーのリードは一般に正しいものより少ないからである。e)可能性のある1-indel及びその可能性のある母親を含むBClusterの数と可能な1-indelを含む全てのBClusterの数(No1-indel)との比(Rs)を計算し、条件付き文言Rs≦(No1-indel-3)/ No1-indelが真である場合、可能な母親と1-indelのペアを選択した。f)選択された母親と1-indelのペアに基づき、母親とBClusterの中に1-indelが存在する場合は、このBClusterでは1-indelを削除し、母親に1-indelのリード数を加え(次のステップでは、母親としてリード総数を用いる)、もし、母親を伴わないBClusterに1-indelが存在する場合には、1-indelのリード数を母親に置き換え(同じ1-indelに対して母親が2以上ある場合は、より多くのBClusterにおいて同定された母親を選択する)、1-indelのリード数を置き換えられた母親に関するリード数として用いる。 Step 7: Removal of one insertion and deletion (1-indel) RepSeq In this step, one insertion or deletion {not in the head of the lead (ie, the primer portion, see step 5) in the main part of the lead}. The error type RepSeq caused by the loss (1-indel) error was removed. Since the clustering in
The logical diagram of
この段階で、キメラ増幅により生じたエラー型のRepSeqキメラを除去した。キメラは常にPCR中に起こり、産物をより複雑にする。特に16S rRNA増幅物の測定ではRepSeqキメラは非常によく起こる27。
キメラを除去する論理図は図24に示し、その戦略は以下の通りであった。a)各BClusterにおいて、RepSeqタイプ(A、B、C)のすべての可能な順序のキメラをチェックした;Aの頭部がBの頭部部分と同じであり、Aの他の部分(Bを伴う)がCの末端部分と同一であり、かつ、Aのリード数が3つ中最大では無い場合、Aはキメラと考えられ、BとCはこのキメラの親であると考えられた。b)同定されたキメラそれぞれについて、キメラを含むBClusterの数(Total_No)およびキメラのみを含むが親は含まないBClusterの数(No_d)を計数した。c)条件付き文言Ratio_d(= N_d/Total_No)≦0.1、かつ、Ratio_d≦1/Total_Noが真のとき、RepSeqsからキメラ候補を除外した。
BarBIQはキメラを1~5%しか持たず、これは従来の方法によるもの(~70%)27よりはるかに低く、この工程によりキメラを除去することができたことがわかる。BarBIQでキメラがほとんど生成されなかった理由は、バーコードおよびシークエンスアダプターが、分離された空間(すなわち、液滴)におけるワンステップ増幅によって、単一の細菌由来の16S rRNA遺伝子に付着したことであり、これは、異なる細菌由来の16S rRNA増幅物が混合されなかったことを意味する。このアプローチは、液滴およびバーコードを用いたハイスループット16S rRNA遺伝子シークエンスに関する最近の研究(Borgstrom E et al., Nat Commun 2015; 6: 7173およびSheth RU et al., Nat Biotechnol 2019; 37(8): 877-883)でさえ実施されていない。 Step 8: Removal of Chimera At this stage, the error-type RepSeq chimera generated by the chimera amplification was removed. Chimeras always occur during PCR, complicating the product more complexly. Particularly RepSeq chimeras measurement of 16S rRNA amplification product occurs very well 27.
The logical diagram for removing the chimera is shown in FIG. 24, and the strategy is as follows. a) In each BClaster, chimeras of all possible sequences of RepSeq types (A, B, C) were checked; the head of A is the same as the head of B and the other parts of A (B). A is considered to be a chimera and B and C are considered to be parents of this chimera if) is identical to the terminal portion of C and the number of reads of A is not the largest of the three. b) For each of the identified chimeras, the number of BClusters containing the chimera (Total_No) and the number of BClusters containing only the chimera but not the parent (No_d) were counted. c) When the conditional wording Radio_d (= N_d / Total_No) ≤0.1 and Radio_d≤1 / Total_No is true, the chimera candidates were excluded from RepSeqs.
BarBIQ has only 1-5% chimera, which is much lower than the conventional method (~ 70%) 27, indicating that the chimera could be removed by this step. The reason that BarBIQ produced very few chimeras was that the bar code and sequence adapter were attached to the 16S rRNA gene from a single bacterium by one-step amplification in the isolated space (ie, droplets). This means that 16S rRNA amplifications from different bacteria were not mixed. This approach is a recent study of high-
このステップでは、1インデルおよび1置換エラー(CaseAと命名)、1インデルおよび2置換(CaseBと命名)、ならびに2インデル(CaseCと命名)を有するRepSeqのような高レベルのエラーは除去された。すでに述べたように、インデルのエラーのみが、ステップ3における我々のクラスタリング方法によって生じ得るので、ここで考察する高レベルのエラーは、インデルを含む。一方、もっと複雑なエラーはきわめてまれに起こり、ステップ10で取り除かれる。
ステップ9の論理図を図25に示し、戦略は以下の通りである。a)上記相違(Case A、B、C)の何れかを有する各BClusterのRepSeqタイプの可能なペアをすべて同定し、b)各同定ペアのRepSeqのリード数を比較した。RepSeq(小型/大型)間のリード数の比が閾値0.2よりも低ければ、リード数の少ないRepSeqを除外し、リード数を他のペアに追加した。 Step 9: Removal of Rare Error Repseq In this step, like RepSeq with 1 indel and 1 substitution error (named CaseA), 1 indel and 2 substitutions (named CaseB), and 2 indels (named CaseC). High-level errors have been eliminated. As already mentioned, the high level errors considered here include indels, since only indel errors can be caused by our clustering method in
The logical diagram of
大半のエラーが上記のステップで除去された後も、未知のRepSeq(San配列とは異なる)は依然として模擬細胞集団のデータに残っていた。しかし、いずれも少数であった。そこで、残ったRepSeqsの種類ごとにBCluster数をカウントした。低カウントを原因とするばらつきが大きかったため、RepSeqタイプごとにサンプリングの反復(異なるサンプリングによる同一サンプルのシークエンス)に基づく平均カウントを用いた。各反復について、各RepSeqタイプのカウントついては、すべての反復の中で最高の総カウントに対するすべてのRepSeqタイプの総カウントによって正規化した。次いで、各RepSeqタイプの平均カウントを、全ての反復実験から計算した。模擬細胞集団に対して3回のサンプリングを行い、3回の反復実験から平均カウントを得た。最後に、平均カウントが2未満の場合、RepSeqタイプを除外した。
このステップの後、模擬細胞集団のデータについては、San配列が一致するRepSeqsタイプを除き、残ったRepSeqタイプはすべて、PCRによる1塩基エラー(ステップ11参照)またはコンタミネーション(ステップ14参照)として合理的に説明することができる。
1反復のみまたは2反復を用いても試験し、閾値<6(1反復)または閾値<3(2反復)が模擬細胞集団データに対して機能することを見出した。しかし、無作為性のため、1回と2回のサンプリングは、3回のサンプリングよりもリスクが高い可能性があるため、1回と2回のサンプリングを盲腸サンプルに用いた場合の閾値としてそれぞれ<10と<5を使用することとした。 Step 10: Removal of low-count RepSeq Even after most of the errors were removed in the above steps, unknown RepSeq (different from the San sequence) still remained in the simulated cell population data. However, all were few. Therefore, the number of BClasters was counted for each type of remaining RepSeqs. Since the variability due to the low count was large, the average count based on sampling iterations (sequence of the same sample with different samplings) was used for each RepSeq type. For each iteration, the count of each RepSeq type was normalized by the total count of all RepSeq types for the highest total count of all iterations. The average count for each RepSeq type was then calculated from all iterative experiments. Three samplings were performed on the simulated cell population and average counts were obtained from the three repeated experiments. Finally, if the average count was less than 2, the RepSeq type was excluded.
After this step, for simulated cell population data, all remaining RepSeq types are rationalized as single nucleotide errors (see step 11) or contamination (see step 14) by PCR, except for RepSeqs types with matching San sequences. Can be explained in a specific manner.
We also tested with only one or two iterations and found that threshold <6 (1 iteration) or threshold <3 (2 iterations) worked for simulated cell population data. However, due to randomness, one and two samplings may be at higher risk than three samplings, so one and two samplings are used as thresholds for cecal samples, respectively. It was decided to use <10 and <5.
この段階で、PCRによって生じたと思われるRepSeqタイプの一塩基エラーを除去した。このRepSeqの特徴を明らかにするため、まず、各San配列と1塩基またはゼロ塩基の差異を有する残存するRepSeqタイプをグループに分類した(この分析に関しては、低カウントRepSeqタイプを維持した、ステップ10を参照)。次に、各グループにおける全RepSeqタイプの平均カウントの分布(図26a)をプロットし、同一グループ内のSan-配列一致型RepSeqタイプの平均カウントに対する1塩基の異なるRepSeqタイプの最高平均カウントの比(最高比率)を算出した(図26b)。我々は、2つのカテゴリー(図26bのカテゴリー1と2):カテゴリー1はSan-配列一致型 RepSeq typeが1,000カウント以上のグループ、カテゴリー2はSan-配列一致型 RepSeq typeが1,000カウント未満のグループを見出した。カテゴリー1に関して、1塩基の異なるRepSeqタイプの最高平均数は2より大きく、それらの最高比率は異なるグループ間で一貫していた。これらの1塩基の異なるRepSeq型は、おそらくPCRによって生じた誤りであると結論づけた。それは、実際の16S rRNA配列に対する他の実際の16S rRNA配列の数の比は通常、16S rRNA配列の各タイプで異なるからである。そこで、San-配列一致型 RepSeqタイプのカウントに対する1塩基の異なるRepSeq型のカウントの比が1/400未満であるという閾値を用いて、これらのRepSeq型を除去するプロセスを適用した(図26b)。1反復のみが実施された場合は、データに対して1/100の閾値を使用した。カテゴリー2では、1塩基の異なるRepSeqタイプの最高平均カウントは異なるグループ間で類似しており、<2であったが、これはこれらの16S rRNA配列の低濃度に起因する可能性があり、エラーはランダムに発生し、全てのエラー配列は一致しなかった。RepSeqsの低カウントのリスクが高いため、ステップ10でRepSeqを除外した。模擬細胞集団データにおいて、1塩基の差のみを示す2つのRepSeqタイプのカウント数の間の比が1/50以上であれば、両方のRepSeqタイプがSan配列と一致することを確認した。しかし、この比率が1/400~1/50の範囲にある例は見つからなかった。さらに、我々の模擬細胞集団のデータでは、1つの奇妙なRepSeqタイプが検出された。この配列を確認することにより、それはサン配列JCM5824-AおよびJCM5824-Bの中央に一致するが、JCM5824-A/BのV3-V4領域の全長よりもはるかに短いことを見出した。JCM5824-A/Bの中央の6merは、16S rRNA遺伝子を増幅するために使用したフォワードプライマーの3’末端と同じであり、この奇妙な配列は同一液滴中のJCM5824-Aおよび/またはJCM5824-Bの全長V3-V4領域と常に同時検出され、そのカウントは常に非常に稀であった(3回の反復において2/4/1)ことから、この奇妙なRepSeq型は、JCM5824からの16S rRNA遺伝子の非特異的増幅産物であると解釈した。しかし、この種の短い増幅産物は盲腸検体では見つからなかったため、我々の最終パイプラインにはこれらの短い増幅産物を検出するためのいかなるステップも含めなかった。上記の全ステップ後、残ったRepSeqタイプ(固有RepSeqs)をBarBIQ同定配列(Bar配列)と名付け、各々ID番号でラベルした。 Step 11: Removal of 1-base error RepSeq At this stage, a single nucleotide error of the RepSeq type that seems to have been caused by PCR was removed. To clarify the characteristics of this RepSeq, first, the remaining RepSeq types having a difference of 1 base or zero base from each San sequence were classified into groups (for this analysis, the low count RepSeq type was maintained, step 10). See). Next, the distribution of the average counts of all RepSeq types in each group (FIG. 26a) is plotted and the ratio of the highest average counts of RepSeq types with one base different to the average counts of San-sequence matching RepSeq types in the same group (Fig. 26a). The highest ratio) was calculated (Fig. 26b). We have two categories (
BarBIQの大きな利点を生かし、この段階での細胞バーコードに基づいて、同じ細菌から複数の16S rRNA配列を同定した。 Step 12: Clustering of Bar sequences to cOTU Taking advantage of BarBIQ, multiple 16S rRNA sequences were identified from the same bacterium based on the cell barcode at this stage.
Poission_Overlap=(A×B×μ)/液滴総数
{ここで、液滴総数は、細胞バーコードを含む液滴の総数であり;μは、定数であり、PCR増幅効率、シークエンス深度効果などを含み得る液滴における検出効率のための統合パラメータである}。他方、もしBar配列が同一細菌由来であれば、両方のBar配列が検出される液滴の数はポアソン分布に従わないであろう。 Theoretically, if one pair of Bar sequences are from different bacteria, the number of droplets in which both Bar sequences are detected should follow the Poisson distribution, and the estimated number of simultaneously detected droplets (Poission_Overlap). Can be calculated as follows:
Poission_Overlap = (A × B × μ) / Total number of droplets {Here, the total number of droplets is the total number of droplets including the cell barcode; μ is a constant, and the PCR amplification efficiency, sequence depth effect, etc. An integrated parameter for detection efficiency in potentially contained droplets}. On the other hand, if the Bar sequences are of the same bacterium, the number of droplets in which both Bar sequences are detected will not follow the Poisson distribution.
log10 (Poission_Overlap)= log10 (A×B) - log10 (液滴総数/μ) The parameters were then divided into two terms using the log 10 transformation.
log 10 (Poission_Overlap) = log 10 (A × B) -log 10 (total number of droplets / μ)
同一のBClusterで検出されたRepSeqは、同一のcOTUに属する場合、単一細胞とみなした。次いで、各cOTUの細胞数を、細胞バーコード(BClusterの数)に基づいて計数した。ステップ3.2でパラメータ0.75で処理したデータを細胞数の計数に用いた。 Step 13: Number of count cells for each cOTU RepSeq detected in the same BClaster was considered as a single cell if it belonged to the same cOTU. The number of cells in each cOTU was then counted based on the cell barcode (number of BClasters). The data processed with parameter 0.75 in step 3.2 was used to count the number of cells.
この段階で、コントロールに基づいて異物混入したcOTUを除去した。異物混入したcOTUを同定するために、模擬細胞集団の対照サンプルM0またはマウスMa、MbおよびMcの盲腸サンプルの空試験管対照を用いて、同様の時間(数日間)内に同じ条件下で測定した。 Step 14: Removal of foreign matter-contaminated cOTU At this stage, foreign matter-contaminated cOTU was removed based on the control. Measured under the same conditions within similar time (several days) using a control sample M0 of a simulated cell population or a blank test tube control of a mouse Ma, Mb and Mc cecal sample to identify a foreign body-contaminated cOTU. bottom.
各cOTUの絶対細胞濃度は、液滴デジタルPCRによって測定した総濃度を用いて、ステップ13で得られたカウントを正規化することによって算出した。 Step 15: Calculation of Cell Concentration The absolute cell concentration of each cOTU was calculated by normalizing the count obtained in
3種類の公的データベース、GreenGene(リリース13_5)10、Ribosomal Database Project(リリース11.5)11、およびSilva(リリース131.1)12において同定されたBar配列と最も近い(すなわち、最も高い同一性)16S rRNA遺伝子の間の配列同一性は、NCBI blast(バージョン2.7.1)51を用いて算出した。 Comparison with 16S rRNA gene database Closest to the Bar sequence identified in three public databases, GreenGene (Release 13_5) 10 , Ribosomal Database Project (Release 11.5) 11 , and Silva (Release 131.1) 12. (Ie, the highest identity) Sequence identity between 16S rRNA genes was calculated using NCBI blast (version 2.7.1) 51.
同定されたcOTUの門から属への分類を、ブートストラップカットオフ50%36を用いたRDP分類によるそれらのBar配列に基づいて予測した。RDP分類は16S rRNAトレーニングセット11(https://rdp.cme.msu.edu/classifier/classifier.jsp)によりトレーニングされた。複数のBar配列を含むcOTUに対して、最も高いスコアを有する予測分類群を選択した。 Taxonomic predictions by RDP classification The phylum-to-genus classification of the identified cOTUs was predicted based on their Bar sequence by RDP classification with a bootstrap cutoff of 50% 36. RDP classification was trained by 16S rRNA training set 11 (https://rdp.cme.mus.edu/classifier/classifier.jsp). The predictive taxon with the highest score was selected for cOTUs containing multiple Bar sequences.
Rパッケージveganのvegdist関数を用いて、細胞濃度に基づく各ペアのサンプル間のbray-Curtisの非類似度を算出した。以降の分析は、R(バージョン3.5.1)およびJupyterLab(バージョン0.34.9)を用いて実施した。 Bray-Curtis Dissimilarity The Bray-Curtis dissimilarity between each pair of samples based on cell concentration was calculated using the Vegdist function of the R package vegan. Subsequent analyzes were performed using R (version 3.5.1) and JupiterLab (version 0.34.9).
BarBIQで測定した試料Madistの技術反復中のcOTUのノイズは,Poisson分布から得た模擬ノイズとcOTU技術ノイズを比較することにより、主としてサンプリングノイズから確認した。技術反復における異なる検出総細胞数からのバイアスを排除するために、Rパッケージveganにおける機能希薄化を用いたサブサンプリングにより、各反復の細胞数を、反復中の最小総細胞数に対して標準化した。cOTUのノイズは、CV2によって定量され、ここで、CVは、3回の技術反復におけるcOTUの正規化細胞数に基づいて計算された係数の変動を示す52,53。各cOTUについてのシミュレートされたPoissonノイズを、試料中の与えられたcOTUの平均細胞数であるPoisson分布からランダムに生成された3つの数字(3つの技術反復を模倣するため)に基づいて計算し、2つのシミュレーション(1および2)を行った。次に、各cOTUについてCV2の理論平均補正後残差を算出した52,53。
Rmc =log10 (CV2)-log10 (CVPoisson 2);
ここで、CVPoissonは、ポアソン分布に基づく所定のcOTUに対する理論的CVである。試料Madistの全Rmcの分布はシミュレーションの分布と一致しており、BarBIQ測定の技術的ノイズは主としてサンプリングによるものであることが示唆された(図7c,d)。 Noise cOTU in technology repeated samples Ma dist measured by estimation BarBIQ art noise, by comparing the simulated noise and cOTU art noise obtained from Poisson distribution was confirmed primarily sampling noise. In order to eliminate the bias from the different detected total cell numbers in the technique repeat, the cell number in each repeat was standardized to the minimum total cell number in the repeat by subsampling with functional dilution in the R package vegan. .. The noise of the cOTU is quantified by CV 2 , where the CV indicates the variation of the coefficients calculated based on the normalized cell number of the cOTU in 3 technical iterations 52,53 . The simulated Poisson noise for each cOTU is calculated based on three randomly generated numbers (to mimic three technical iterations) from the Poisson distribution, which is the average number of cells in a given coOTU in the sample. Then, two simulations (1 and 2) were performed. Next, 52, 53 calculated the theoretical average corrected residuals of CV 2 for each cOTU.
R mc = log 10 (CV 2 ) -log 10 (CV Poisson 2 );
Here, CV Poisson is a theoretical CV for a given cOTU based on a Poisson distribution. Distribution of all R mc samples Ma dist is consistent with the distribution of the simulation, technical noise BarBIQ measurements suggested is due primarily sampled (Fig. 7c, d).
各cOTUについて、シミュレーションにより、3匹のマウス(Madist1、Mbdist、McdistまたはMaprox1、Mbprox、Mcprox)の遠位または近位位置における細胞濃度のCVの95%信頼区間を推定した。シミュレーションプロセスを1,000回繰り返し、各時間について、所与のcOTUについて3つのシミュレートされた細胞濃度からCVを得た。各シミュレートされた濃度は、Poisson分布から生成されたランダム数により得られ、その平均は、試料中の所与のcOTUのシークエンス決定細胞数(すなわち、Madist1、Mbdist、McdistまたはMaprox1、Mbprox、Mcproxの1つ)であり、その後、この試料の推定総濃度を用いて正規化した。この推定総濃度は、その平均がこのサンプルの測定叢濃度であり、その標準偏差が平均の10.1%である正規分布からランダムに生成した(10.1%は、反復フィルタリングに関する5つの独立した実験の中で、平均によって標準化された最大標準偏差(10.1%)であった(図18))。各CVの95%信頼区間は、1,000回のシミュレーションCVの分布から得た。 For confidence interval estimate each cOTU mouse dependent CV, by simulation, three mice (Ma dist 1, Mb dist, Mc dist or Ma prox 1, Mb prox, Mc prox) cell concentration in the distal or proximal position of The 95% confidence interval for the CV was estimated. The simulation process was repeated 1,000 times to obtain CVs from 3 simulated cell concentrations for a given cOTU for each time. Each simulated concentration is obtained by random number generated from the Poisson distribution, the average is given of the sequence determination cell number cOTU in the sample (i.e., Ma dist 1, Mb dist, Mc dist or
階層的クラスタリングを、統計パッケージ中の機能hclustにより実施した(パッケージpheatmapを用いてヒートマップを描いた)。クラスタリングに用いられる距離は、1-最小(│r’│)[r’∈(r - OCI, r+OCI)]と定義され、ここで、OCIは各rの90%片側信頼区間を意味する。階層的クラスタリングの系統樹を完全連結法により得た。具体的には、含まれるすべてのcOTU間のピアソンの相関係数rを求めた。その後、ある微生物と他の微生物の距離を上記式に基づいて決定し、距離に基づいてcOTUをクラスタリングした。クラスタリング後の枝内の可能なcOTUペアの距離は枝の高さより低かった。各rのOCIは、シミュレーションにより得た。シミュレーションプロセスを1,000回繰り返し、各時間について、各cOTUの細胞濃度を、試料Madist1、Maprox1、Mbdist、Mbprox、McdistおよびMcprox(このプロセスは、上記のCV信頼区間のシミュレーションと同じである)についてランダムに生成し、各cOTU対についてピアソンのrを計算した。その後、OCIは、1,000回のシミュレーションされたシミュレータの分布から得られた。 Modified Bacterial Network Hierarchical clustering was performed by the function hclust in the statistical package (heatmap was drawn using package heatmap). The distance used for clustering is defined as 1-minimum (│ r'│) [r'∈ (r-OCI, r + OCI)], where OCI means the 90% one-sided confidence interval for each r. A phylogenetic tree of hierarchical clustering was obtained by the complete connection method. Specifically, the Pearson correlation coefficient r between all the included cOTUs was obtained. Then, the distance between one microorganism and another was determined based on the above formula, and cOTU was clustered based on the distance. The possible distance of cOTU pairs within the branch after clustering was lower than the height of the branch. The OCI of each r was obtained by simulation. The simulation process repeated 1,000 times, each time, the cell concentration of each COTU, sample Ma dist 1, Ma prox 1, Mb dist, Mb prox, Mc dist and Mc prox (this process, the above CV confidence interval Randomly generated for each cOTU pair), and Pearson's r was calculated for each cOTU pair. The OCI was then obtained from the distribution of 1,000 simulated simulators.
1)異なる種はゲノム上に16S rRNA遺伝子の異なるコピー数を有し、大部分の種のコピー数は不明であるため、細胞数を測定し、異なる種の細胞数を比較するのは困難である;
2)16S rRNA配列の同定は、シークエンスおよび増幅エラーのために正確ではなく、低分類学的分解能をもたらす。
実際、シークエンスエラーは、分子バーコード24-26を用いて修正されたが、主に配列増幅時に生じるキメラ生成に由来する増幅エラーは、未だ十分に除去できていない27。 High-throughput methods based on 16S rRNA gene amplification product sequencing using next-generation sequencing technology have contributed to the study of bacterial diversity in a given cell population over the years 22,23 . However, the conventional method amplifies the 16S rRNA gene from the purified bulk bacterial genome and measures the number of amplified molecules, and thus basically has the following limitations.
1) Since different species have different copies of the 16S rRNA gene on the genome and the copy numbers of most species are unknown, it is difficult to measure cell numbers and compare cell numbers of different species. be;
2) Identification of 16S rRNA sequences is inaccurate due to sequencing and amplification errors and results in low taxonomic resolution.
In fact, sequence error has been corrected by using a molecular bar code 24-26, amplification errors derived from the chimeric product occurring mainly during sequence amplification is not possible yet sufficiently removed 27.
次に、各部位のcOTUに対する変動係数(CV、3匹の細胞濃度の標準偏差をそれらの平均値で除したCV)を算出することにより、3匹のマウスにおける細胞濃度の一貫性を定量した(図3a)。著者らは、各cOTUについて遠位と近位の位置の間のCVを比較し(図9aおよび9b)、大部分のcOTUのCVは、シミュレートされた信頼区間に基づいて異ならないことを見出した。興味深いことに、同一属のcOTUsの一貫性(すなわちCV)は、しばしば異なっていた(図9aおよび9b)(公的データベースからの情報が限られているため、分類はRDP分類36を用いて各cOTUのBar-sequenceにより予測されたことに注目)。例えば、Clostridium XIVa属のcOTUのCVは、両方の場所で0.05~1.70の範囲で変化した(図3b)。興味深いことに、この属のある種は、盲腸31の主要な機能であるブチレート37のような短鎖脂肪酸を生成することが報告されている。この知見は、細菌の生理学的役割の更なる理解のためには、属レベルより細かいレベルの細胞の定量、特に、cOTUレベルの細胞の定量が必要であることを示唆した37,38。 In addition, for each of the 240 cOTUs, both position-dependent (dependence on the location of the collection site (ie, distal and proximal)) and mouse-dependent concentration differences were examined. First, the cOTU concentrations between different positions of the same mouse were statistically compared by three repeated experiments for each position of Ma. The 13 cOTU (5% of 240 cOTU) was significantly different (FDR <0.05 and magnification change> 2) (Fig. 8), and the maximum magnification change (based on the mean concentration of repeated experiments) was 4.1. ..
Next, the consistency of cell concentrations in the three mice was quantified by calculating the coefficient of variation for cOTU at each site (CV, CV obtained by dividing the standard deviation of the cell concentrations of the three mice by their average value). (Fig. 3a). The authors compared the CVs between the distal and proximal positions for each cOTU (FIGS. 9a and 9b) and found that the CVs of most cOTUs did not differ based on simulated confidence intervals. rice field. Interestingly, the coherence (ie CV) of coTUs of the same genus was often different (FIGS. 9a and 9b) (due to the limited information from public databases, classifications are each using RDP classification 36. Note that it was predicted by bar-sequence of cOTU). For example, the CV of cOTU of the genus Clostridium XIVa varied in the range of 0.05 to 1.70 at both locations (FIG. 3b). Interestingly, certain species of this genus have been reported to produce short-chain fatty acids such as butyrate 37 , which is a major function of the cecum 31. This finding suggests that a finer level of cell quantification than the genus level, especially cOTU level cell quantification, is needed for a better understanding of the physiological role of bacteria 37,38 .
実験1. 大腸試料の細分化
大腸を細分化し、かつ細分化されたそれぞれの断片の位置情報を識別可能な状態で分析することを試みた。具体的には、マウスを屠殺した直後に大腸全体を摘出して直線状になるように広げ、それぞれの大腸固形内容物の位置関係を撮影記録した。一つの大腸固形内容物を腸壁に包まれた状態のまま滅菌済みハサミと滅菌済みピンセットを用いて取り出し、ブレインスライサ(室町機械、MK-RC-01)の穴の中央に盲腸側を左側にして置いた(図39のパネルa)。このとき、盲腸側(A)と肛門側(E)が識別できるように、ブレインスライサに予め印をつけた。 Furthermore, the following studies were conducted.
細菌細胞を含む、または含まない条件において、等モル混合した4つの細胞バーコードテンプレート(以下、等モル混合細胞バーコード)の濃度を、ddPCRを用いて測定した。具体的には、まず、QX200TM ddPCRTM EvaGreen Supermix(BioRad、#1864034)、1μMプライマー(NoBiotin-Link-barcode-FおよびP5-index-R1P-barcode-R)、0.1μM dNTP(New England BioLabs、N0447)、Platinum Taq DNA Polymerase(Thermo Fisher Scientific、10966034)、およびサンプル(等モル混合細胞バーコードとマウス盲腸より採取した細菌細胞、あるいは等モル混合細胞バーコードのみ)を30μlの容量で混合し、DG8カートリッジ(BioRad、#1864008)に分注した。次に、Droplet Generation Oil for EvaGreen(BioRad、#1864006)およびDroplet Generator(BioRad、#1864002JA)を用いて混合溶液を液滴に封入した。
第一ステージ;95℃5分
第二ステージ;95℃45秒と60℃150秒の繰り返しを6サイクル
第三ステージ;95℃25秒と60℃80秒の繰り返しを39サイクル
第四ステージ;4℃5分と90℃5分
その後、QX200 Droplet Reader (BioRad、#1864003JA)によりバーコードの濃度を測定した。 ddPCR was performed by the following steps.
1st stage; 95 ° C. 5 minutes 2nd stage; 95 ° C. 45 seconds and 60 ° C. 150 seconds repetition for 6 cycles 3rd stage; 95 ° C. 25 seconds and 60 ° C. 80 seconds repetition for 39 cycles 4th stage; 4 ° C. After 5 minutes and 90 ° C. for 5 minutes, the bar code concentration was measured by QX200 Droplet Reader (BioRad, # 1864003JA).
BarBIQ法のシークエンスライブラリー作製のためのPCRサイクル数が、液滴に含まれる細菌細胞の16S rRNA配列を増幅させるのに十分であることを確かめた。具体的には、まず、QX200TM ddPCRTM EvaGreen Supermix、1μMプライマー(F1-FwおよびF1-Rv)、0.1μM dNTP、およびサンプル(マウス盲腸より採取した細菌細胞)を30μlの容量で混合し、DG8カートリッジに分注した。
次に、Droplet Generation Oil for EvaGreenおよび Droplet Generatorを用いて、混合溶液を液滴に封入した。ddPCRは、第三ステージを除き、上記実験2.と同様のサイクル条件で実施した。第三ステージは、サイクル数を0、10、20、30、39、あるいは49に変えた。その後、液滴の蛍光強度をQX200 Droplet Readerにより測定し、ソフトウェア QuantaSoft(BioRad、#1864011JA)による強度の二峰性分布の谷である閾値に基づいて陽性および陰性液滴を決定した。
The mixed solution was then encapsulated in the droplets using the Droplet Generation Oil for Eva Green and the Droplet Generator. ddPCR is the above experiment except for the third stage. It was carried out under the same cycle conditions as above. The third stage changed the number of cycles to 0, 10, 20, 30, 39, or 49. The fluorescence intensity of the droplets was then measured by the QX200 Droplet Reader and positive and negative droplets were determined based on the threshold, which is the valley of the bimodal distribution of intensity by the software QuantaSoft (BioRad, # 1864011JA).
BarBIQ法のシークエンスライブラリー作製のための初期変性の時間が、液滴に含まれる細菌細胞の16S rRNA配列を増幅させるのに十分であることを確かめた。具体的には、まず、QX200TM ddPCRTM EvaGreen Supermix、1μMプライマー (F1-FwおよびF1-Rv)、0.1μM dNTP、およびサンプル(マウス盲腸より採取した細菌細胞)を30μlの容量で混合し、DG8カートリッジに分注した。次に、Droplet Generation Oil for EvaGreenおよびDroplet Generator を用いて、混合溶液を液滴に封入した。ddPCRは、第一ステージを除き、上記実験2.と同様のサイクル条件で実施した。第一ステージは、時間を0、5、あるいは10分間に変えた。その後、液滴の蛍光強度をQX200 Droplet Readerにより測定し、ソフトウェア QuantaSoftによる強度の二峰性分布の谷である閾値に基づいて陽性および陰性液滴を決定した。
Claims (19)
- 細胞集団の処理方法であって、
(A)単離された細胞集団を含む細胞の分散液から、液滴集団であって、水性の液滴を含み、前記液滴の少なくとも一部のそれぞれが、1つの細胞と1分子の細胞バーコードと
を含む液滴集団を得ること
を含む、方法。 It is a method of processing cell populations.
(A) From a dispersion of cells containing an isolated cell population, a droplet population containing aqueous droplets, each of which at least a portion of the droplet is a cell and a molecule of cell. A method comprising obtaining a droplet population containing a bar code. - 細胞集団に含まれる遺伝子の塩基配列を分析する方法であって、
(A)単離された細胞集団を含む細胞の分散液から、液滴集団であって、水性の液滴を含み、前記液滴の少なくとも一部のそれぞれが、1つの細胞と1分子の細胞バーコードと
を含む液滴集団を得ることと、
(B)得られたそれぞれの液滴中で、細胞バーコードの増幅産物と所定の遺伝子の増幅産物を得て、さらに、細胞バーコードと所定の遺伝子の全部または一部の塩基配列を含む連結物を得ることと、得られた連結物を液滴から水溶液中に回収して、得られた連結物をシークエンスして所定の遺伝子の塩基配列と細胞バーコードの塩基配列を決定することとを含む、方法。 It is a method to analyze the base sequence of a gene contained in a cell population.
(A) From a dispersion of cells containing an isolated cell population, a droplet population containing aqueous droplets, each of which at least a portion of the droplet is a cell and a molecule of cell. To obtain a droplet population containing a bar code,
(B) In each of the obtained droplets, an amplification product of a cell barcode and an amplification product of a predetermined gene are obtained, and further, a linkage containing the cell barcode and the base sequence of all or a part of the predetermined gene. Obtaining a product, recovering the obtained conjugate from a droplet into an aqueous solution, and sequencing the obtained conjugate to determine the base sequence of a predetermined gene and the base sequence of a cell barcode. Including, method. - 前記(B)において、細胞バーコードの増幅産物は、第一のプライマーに由来する第一の領域を有し、所定の遺伝子の増幅産物は、第二プライマーに由来する第二の領域を有し、第一の領域と第二の領域は、互いにハイブリダイズ可能な相補的な配列部分を有し、前記第一のプライマーおよび第二のプライマーはそれぞれ、1以上のタグ分子を連結しており、当該タグ分子は、前記連結物には含まれず、かつ、
前記(B)において、水溶液中に回収された連結物から、タグ分子を有する増幅産物を当該タグ分子に親和性を有する分子を担持したカラムまたはビーズを用いて除去することをさらに含む、請求項2に記載の方法。 In (B) above, the cell barcode amplification product has a first region derived from the first primer, and the amplification product of a predetermined gene has a second region derived from the second primer. , The first region and the second region have complementary sequence moieties capable of hybridizing with each other, and the first primer and the second primer each have one or more tag molecules linked to each other. The tag molecule is not included in the conjugate and
The claim further comprises removing the amplification product having a tag molecule from the conjugate recovered in the aqueous solution by using a column or beads carrying a molecule having an affinity for the tag molecule in the above (B). The method according to 2. - (C-1)決定された細胞バーコードの塩基配列に基づいて、決定された塩基配列をクラスタリングして、複数の第一のクラスターを得ること
をさらに含む、請求項2または3に記載の方法。 (C-1) The method according to claim 2 or 3, further comprising clustering the determined base sequence based on the base sequence of the determined cell barcode to obtain a plurality of first clusters. .. - (D-1)得られた第一のクラスターの数から細胞集団に含まれる細胞の数または特定の所定の遺伝子を有する細胞の数を推定すること
をさらに含む、請求項4に記載の方法。 (D-1) The method according to claim 4, further comprising estimating the number of cells contained in a cell population or the number of cells having a specific predetermined gene from the number of first clusters obtained. - (C-2)決定された所定の遺伝子の塩基配列に基づいて、決定された塩基配列をクラスタリングして、複数の第二のクラスターを得ること
をさらに含む、請求項2または3に記載の方法。 (C-2) The method according to claim 2 or 3, further comprising clustering the determined base sequence based on the base sequence of the determined predetermined gene to obtain a plurality of second clusters. .. - (D-2)得られた第二のクラスターの数から細胞集団に含まれる細胞の種類の数を推定することをさらに含む、請求項6に記載の方法。 (D-2) The method according to claim 6, further comprising estimating the number of cell types contained in the cell population from the number of second clusters obtained.
- (C-3)決定された細胞バーコードの塩基配列に基づいて、決定された塩基配列をクラスタリングして、複数の第一のクラスターを得ることと、決定された所定の遺伝子の塩基配列に基づいて、決定された塩基配列をクラスタリングして、複数の第二のクラスターを得ること
をさらに含む、請求項2または3に記載の方法。 (C-3) Based on the base sequence of the determined cell barcode, the determined base sequence is clustered to obtain a plurality of first clusters, and based on the base sequence of the determined predetermined gene. The method according to claim 2 or 3, further comprising clustering the determined base sequence to obtain a plurality of second clusters. - (D-3)得られた細胞バーコードの塩基配列と所定の遺伝子の塩基配列の組合せの情報に基づいて、少なくとも1つのある第二のクラスターに分類された所定の遺伝子の塩基配列と連結している細胞バーコードの塩基配列から当該所定の遺伝子の塩基配列が分類された第一のクラスターを決定し、当該細胞バーコードが分類された第一のクラスターの数から、当該第二のクラスターに分類された細胞の数を推定すること
をさらに含む、請求項8に記載の方法。 (D-3) Based on the information of the combination of the base sequence of the obtained cell bar code and the base sequence of the predetermined gene, it is linked to the base sequence of the predetermined gene classified into at least one second cluster. The first cluster in which the base sequence of the predetermined gene is classified is determined from the base sequence of the cell barcode, and the number of the first cluster in which the cell barcode is classified is assigned to the second cluster. The method of claim 8, further comprising estimating the number of classified cells. - (C-4)同一の第一のクラスターに分類された配列が異なる第二のクラスターに分類される場合、当該第二のクラスターを同一の細胞ベースの操作上分類単位(cOTU)に分類することをさらに含む、請求項8に記載の方法。 (C-4) When a sequence classified into the same first cluster is classified into a different second cluster, the second cluster is classified into the same cell-based operational classification unit (cOTU). The method according to claim 8, further comprising.
- (E)第一の細胞集団と、第一の細胞集団とは異なる第二の細胞集団のそれぞれに関して、細胞集団に含まれる(i)cOTUの数および/または(ii)特定のcOTUに含まれる細胞の数を推定し、第一の細胞集団に関して推定された(i)cOTUの数および/または(ii)特定のcOTUに含まれる細胞の数を、第二の細胞集団に関して推定された(i)cOTUの数および/または(ii)特定のcOTUに含まれる細胞の数とそれぞれ比較することをさらに含む、請求項10に記載の方法。 (E) For each of the first cell population and the second cell population different from the first cell population, (i) the number of cOTUs contained in the cell population and / or (ii) included in a particular cOTU. The number of cells was estimated and (i) the number of cOTUs estimated for the first cell population and / or (ii) the number of cells contained in a particular cOTU was estimated for the second cell population (i). The method of claim 10, further comprising comparing the number of cOTUs and / or the number of cells contained in a particular cOTU, respectively.
- (F)第一の細胞集団に関して推定された(i)cOTUの数および(ii’)特定のcOTUに含まれる細胞の数と、第二の細胞集団に関して推定された(i)cOTUの数および(ii’)特定のcOTUに含まれる細胞の数を比較することを含む、請求項11に記載の方法。 (F) Estimated number of cOTUs for the first cell population and (ii') number of cells contained in a particular cOTU, and (i) number of cOTUs estimated for the second cell population and (Ii') The method of claim 11, comprising comparing the number of cells contained in a particular cOTU.
- 細胞集団が、微生物叢である、請求項1~12のいずれか一項に記載の方法。 The method according to any one of claims 1 to 12, wherein the cell population is a microbial flora.
- 微生物叢が、体内または体表の微生物叢である、請求項13に記載の方法。 The method according to claim 13, wherein the microbial flora is a microbial flora in the body or on the surface of the body.
- 微生物叢が、消化管内の微生物叢である、請求項13に記載の方法。 The method according to claim 13, wherein the microbial flora is a microbial flora in the digestive tract.
- 第一の細胞集団と第二の細胞集団が、同一対象の異なる部位から取得された微生物叢である、請求項11または12に記載の方法。 The method according to claim 11 or 12, wherein the first cell population and the second cell population are microbial flora obtained from different sites of the same subject.
- 第一の細胞集団と第二の細胞集団が、異なる対象の同一の部位から取得された微生物叢である、請求項11または12に記載の方法。 The method according to claim 11 or 12, wherein the first cell population and the second cell population are microbial flora obtained from the same site of different subjects.
- 第一の細胞集団と第二の細胞集団が、同一対象の同一の部位から異なる時間に取得された微生物叢である、請求項11または12に記載の方法。 The method according to claim 11 or 12, wherein the first cell population and the second cell population are microbial flora acquired from the same site of the same subject at different times.
- 細胞集団が、未知の細胞を含む、請求項1~18のいずれか一項に記載の方法。 The method according to any one of claims 1 to 18, wherein the cell population contains an unknown cell.
Priority Applications (5)
| Application Number | Priority Date | Filing Date | Title |
|---|---|---|---|
| US17/928,184 US20230203600A1 (en) | 2020-05-29 | 2021-05-28 | Method for treating cell population and method for analyzing genes included in cell population |
| EP21812570.6A EP4159873A1 (en) | 2020-05-29 | 2021-05-28 | Method for treating cell population and method for analyzing genes included in cell population |
| CA3185619A CA3185619A1 (en) | 2020-05-29 | 2021-05-28 | Method for treating cell population and method for analyzing genes included in cell population |
| JP2022526658A JP7423101B2 (en) | 2020-05-29 | 2021-05-28 | Methods for processing cell populations and methods for analyzing genes contained in cell populations |
| CN202180038544.5A CN115867676A (en) | 2020-05-29 | 2021-05-28 | Method for treating cell population and method for analyzing gene contained in cell population |
Applications Claiming Priority (2)
| Application Number | Priority Date | Filing Date | Title |
|---|---|---|---|
| JP2020094141 | 2020-05-29 | ||
| JP2020-094141 | 2020-05-29 |
Publications (1)
| Publication Number | Publication Date |
|---|---|
| WO2021241721A1 true WO2021241721A1 (en) | 2021-12-02 |
Family
ID=78744799
Family Applications (1)
| Application Number | Title | Priority Date | Filing Date |
|---|---|---|---|
| PCT/JP2021/020338 WO2021241721A1 (en) | 2020-05-29 | 2021-05-28 | Method for treating cell population and method for analyzing genes included in cell population |
Country Status (6)
| Country | Link |
|---|---|
| US (1) | US20230203600A1 (en) |
| EP (1) | EP4159873A1 (en) |
| JP (1) | JP7423101B2 (en) |
| CN (1) | CN115867676A (en) |
| CA (1) | CA3185619A1 (en) |
| WO (1) | WO2021241721A1 (en) |
Cited By (1)
| Publication number | Priority date | Publication date | Assignee | Title |
|---|---|---|---|---|
| CN114642684A (en) * | 2022-03-21 | 2022-06-21 | 北京航空航天大学 | Eubacterium rectal for preventing and treating anxiety and depression |
Citations (5)
| Publication number | Priority date | Publication date | Assignee | Title |
|---|---|---|---|---|
| US9260753B2 (en) | 2011-03-24 | 2016-02-16 | President And Fellows Of Harvard College | Single cell nucleic acid detection and analysis |
| JP2018508198A (en) * | 2015-02-04 | 2018-03-29 | ザ リージェンツ オブ ザ ユニバーシティ オブ カリフォルニア | Nucleic acid sequencing by barcode addition in separate entities |
| WO2018235938A1 (en) | 2017-06-23 | 2018-12-27 | 国立研究開発法人理化学研究所 | Methods for sequencing and analyzing nucleic acids |
| US20190300968A1 (en) * | 2018-03-27 | 2019-10-03 | The Trustees Of Columbia University In The City Of New York | Spatial Metagenomic Characterization of Microbial Biogeography |
| JP2019531730A (en) * | 2016-09-28 | 2019-11-07 | ジェネラル オートメーション ラボ テクノロジーズ インコーポレイテッド | Bacterial community relationship determination and other high-throughput microbiology applied high resolution systems, kits, devices, and methods |
Family Cites Families (4)
| Publication number | Priority date | Publication date | Assignee | Title |
|---|---|---|---|---|
| WO2012083225A2 (en) | 2010-12-16 | 2012-06-21 | Gigagen, Inc. | System and methods for massively parallel analysis of nycleic acids in single cells |
| EP3353550A1 (en) | 2015-09-25 | 2018-08-01 | AbVitro LLC | High throughput process for t cell receptor target identification of natively-paired t cell receptor sequences |
| EP3371309B1 (en) | 2015-11-04 | 2023-07-05 | Atreca, Inc. | Combinatorial sets of nucleic acid barcodes for analysis of nucleic acids associated with single cells |
| EP3631012B1 (en) | 2017-05-26 | 2022-06-08 | AbVitro LLC | High-throughput polynucleotide library sequencing and transcriptome analysis |
-
2021
- 2021-05-28 JP JP2022526658A patent/JP7423101B2/en active Active
- 2021-05-28 CA CA3185619A patent/CA3185619A1/en active Pending
- 2021-05-28 US US17/928,184 patent/US20230203600A1/en active Pending
- 2021-05-28 CN CN202180038544.5A patent/CN115867676A/en active Pending
- 2021-05-28 EP EP21812570.6A patent/EP4159873A1/en active Pending
- 2021-05-28 WO PCT/JP2021/020338 patent/WO2021241721A1/en unknown
Patent Citations (7)
| Publication number | Priority date | Publication date | Assignee | Title |
|---|---|---|---|---|
| US9260753B2 (en) | 2011-03-24 | 2016-02-16 | President And Fellows Of Harvard College | Single cell nucleic acid detection and analysis |
| US10287630B2 (en) | 2011-03-24 | 2019-05-14 | President And Fellows Of Harvard College | Single cell nucleic acid detection and analysis |
| US10584382B2 (en) | 2011-03-24 | 2020-03-10 | President And Fellows Of Harvard College | Single cell nucleic acid detection and analysis |
| JP2018508198A (en) * | 2015-02-04 | 2018-03-29 | ザ リージェンツ オブ ザ ユニバーシティ オブ カリフォルニア | Nucleic acid sequencing by barcode addition in separate entities |
| JP2019531730A (en) * | 2016-09-28 | 2019-11-07 | ジェネラル オートメーション ラボ テクノロジーズ インコーポレイテッド | Bacterial community relationship determination and other high-throughput microbiology applied high resolution systems, kits, devices, and methods |
| WO2018235938A1 (en) | 2017-06-23 | 2018-12-27 | 国立研究開発法人理化学研究所 | Methods for sequencing and analyzing nucleic acids |
| US20190300968A1 (en) * | 2018-03-27 | 2019-10-03 | The Trustees Of Columbia University In The City Of New York | Spatial Metagenomic Characterization of Microbial Biogeography |
Non-Patent Citations (5)
| Title |
|---|
| BORGSTROM E ET AL., NAT COMMUN, vol. 6, 2015, pages 7173 |
| EWING ET AL., GENOME RES., vol. 8, no. 3, 1998, pages 186 - 194 |
| MAIDEN ET AL., PNAS, vol. 95, 1998, pages 3140 - 3145 |
| SCHIRMER M ET AL., BMC BIOINFORMATICS, vol. 17, 2016, pages 125 |
| SHETH RU ET AL., NAT BIOTECHNOL, vol. 37, no. 8, 2019, pages 877 - 883 |
Cited By (1)
| Publication number | Priority date | Publication date | Assignee | Title |
|---|---|---|---|---|
| CN114642684A (en) * | 2022-03-21 | 2022-06-21 | 北京航空航天大学 | Eubacterium rectal for preventing and treating anxiety and depression |
Also Published As
| Publication number | Publication date |
|---|---|
| JPWO2021241721A1 (en) | 2021-12-02 |
| EP4159873A1 (en) | 2023-04-05 |
| US20230203600A1 (en) | 2023-06-29 |
| CA3185619A1 (en) | 2021-12-02 |
| JP7423101B2 (en) | 2024-01-29 |
| CN115867676A (en) | 2023-03-28 |
Similar Documents
| Publication | Publication Date | Title |
|---|---|---|
| AU2021202149B2 (en) | Detecting repeat expansions with short read sequencing data | |
| AU2016256351B2 (en) | Error suppression in sequenced DNA fragments using redundant reads with unique molecular indices (UMIs) | |
| AU2015289414B2 (en) | Non-invasive prenatal diagnosis of fetal genetic condition using cellular DNA and cell free DNA | |
| US20220246234A1 (en) | Using cell-free dna fragment size to detect tumor-associated variant | |
| CN108138230A (en) | For capturing the lock nucleic acid of fusion | |
| US20230074210A1 (en) | Methods for removal of adaptor dimers from nucleic acid sequencing preparations | |
| CN112203648A (en) | Method, apparatus and system for deep learning based prenatal examination | |
| JP2020530261A (en) | Methods for Accurate Computational Degradation of DNA Mixtures from Contributors of Unknown Genotypes | |
| WO2021241721A1 (en) | Method for treating cell population and method for analyzing genes included in cell population | |
| CN105838720B (en) | PTPRQ gene mutation body and its application | |
| EP3409788B1 (en) | Method and system for nucleic acid sequencing | |
| Chevignon et al. | De novo transcriptome assembly and analysis of the flat oyster pathogenic protozoa Bonamia ostreae | |
| CN114736970B (en) | Method for identifying different crowds | |
| CN113637782B (en) | Microbial marker related to progression of acute pancreatitis course and application thereof | |
| Barbaro | Overview of NGS platforms and technological advancements for forensic applications | |
| Bajaj et al. | MICROBIAL GENOMICS |
Legal Events
| Date | Code | Title | Description |
|---|---|---|---|
| 121 | Ep: the epo has been informed by wipo that ep was designated in this application |
Ref document number: 21812570 Country of ref document: EP Kind code of ref document: A1 |
|
| ENP | Entry into the national phase |
Ref document number: 2022526658 Country of ref document: JP Kind code of ref document: A |
|
| ENP | Entry into the national phase |
Ref document number: 3185619 Country of ref document: CA |
|
| NENP | Non-entry into the national phase |
Ref country code: DE |
|
| ENP | Entry into the national phase |
Ref document number: 2021812570 Country of ref document: EP Effective date: 20230102 |