EP4159873A1 - Method for treating cell population and method for analyzing genes included in cell population - Google Patents
Method for treating cell population and method for analyzing genes included in cell population Download PDFInfo
- Publication number
- EP4159873A1 EP4159873A1 EP21812570.6A EP21812570A EP4159873A1 EP 4159873 A1 EP4159873 A1 EP 4159873A1 EP 21812570 A EP21812570 A EP 21812570A EP 4159873 A1 EP4159873 A1 EP 4159873A1
- Authority
- EP
- European Patent Office
- Prior art keywords
- cell population
- cell
- cells
- cotu
- sequence
- Prior art date
- Legal status (The legal status is an assumption and is not a legal conclusion. Google has not performed a legal analysis and makes no representation as to the accuracy of the status listed.)
- Pending
Links
- 238000000034 method Methods 0.000 title claims abstract description 136
- 108090000623 proteins and genes Proteins 0.000 title claims description 186
- 230000001413 cellular effect Effects 0.000 claims abstract description 158
- 241000736262 Microbiota Species 0.000 claims abstract description 84
- 239000006185 dispersion Substances 0.000 claims abstract description 10
- 239000002773 nucleotide Substances 0.000 claims description 174
- 125000003729 nucleotide group Chemical group 0.000 claims description 150
- 230000003321 amplification Effects 0.000 claims description 104
- 238000003199 nucleic acid amplification method Methods 0.000 claims description 104
- 238000012163 sequencing technique Methods 0.000 claims description 102
- 108091028043 Nucleic acid sequence Proteins 0.000 claims description 80
- 239000007864 aqueous solution Substances 0.000 claims description 19
- 239000011324 bead Substances 0.000 claims description 13
- 230000000295 complement effect Effects 0.000 claims description 7
- 210000001035 gastrointestinal tract Anatomy 0.000 claims description 5
- 210000004027 cell Anatomy 0.000 description 477
- 239000013615 primer Substances 0.000 description 101
- 239000000523 sample Substances 0.000 description 98
- 108020004465 16S ribosomal RNA Proteins 0.000 description 90
- 239000000047 product Substances 0.000 description 88
- 241000894006 Bacteria Species 0.000 description 81
- 238000009826 distribution Methods 0.000 description 73
- 244000005700 microbiome Species 0.000 description 55
- 108020004414 DNA Proteins 0.000 description 46
- 230000001580 bacterial effect Effects 0.000 description 40
- 238000002474 experimental method Methods 0.000 description 33
- 239000000243 solution Substances 0.000 description 33
- 238000005259 measurement Methods 0.000 description 32
- 238000005070 sampling Methods 0.000 description 32
- 230000004544 DNA amplification Effects 0.000 description 27
- 238000004458 analytical method Methods 0.000 description 26
- 238000011304 droplet digital PCR Methods 0.000 description 25
- 241000699670 Mus sp. Species 0.000 description 24
- 239000000203 mixture Substances 0.000 description 24
- 238000003752 polymerase chain reaction Methods 0.000 description 24
- 230000006870 function Effects 0.000 description 21
- 238000004088 simulation Methods 0.000 description 21
- 210000002429 large intestine Anatomy 0.000 description 20
- 238000012217 deletion Methods 0.000 description 18
- 230000037430 deletion Effects 0.000 description 18
- 239000003921 oil Substances 0.000 description 17
- 239000000126 substance Substances 0.000 description 17
- 238000006243 chemical reaction Methods 0.000 description 15
- 238000010586 diagram Methods 0.000 description 14
- 238000003780 insertion Methods 0.000 description 14
- 230000037431 insertion Effects 0.000 description 14
- 210000004534 cecum Anatomy 0.000 description 13
- 241000894007 species Species 0.000 description 13
- 241000699666 Mus <mouse, genus> Species 0.000 description 12
- 230000008859 change Effects 0.000 description 12
- 241001529936 Murinae Species 0.000 description 11
- 238000007796 conventional method Methods 0.000 description 11
- 230000002596 correlated effect Effects 0.000 description 11
- 238000000746 purification Methods 0.000 description 11
- 238000006467 substitution reaction Methods 0.000 description 11
- 238000001914 filtration Methods 0.000 description 10
- 230000036541 health Effects 0.000 description 10
- 241001465754 Metazoa Species 0.000 description 9
- 210000004556 brain Anatomy 0.000 description 9
- 238000001514 detection method Methods 0.000 description 9
- 238000011002 quantification Methods 0.000 description 9
- 239000007787 solid Substances 0.000 description 9
- 239000003153 chemical reaction reagent Substances 0.000 description 8
- 150000007523 nucleic acids Chemical class 0.000 description 8
- 238000002360 preparation method Methods 0.000 description 8
- 238000012545 processing Methods 0.000 description 8
- 230000000875 corresponding effect Effects 0.000 description 7
- 238000004925 denaturation Methods 0.000 description 7
- 230000036425 denaturation Effects 0.000 description 7
- 238000003384 imaging method Methods 0.000 description 7
- 108020004707 nucleic acids Proteins 0.000 description 7
- 102000039446 nucleic acids Human genes 0.000 description 7
- 239000002987 primer (paints) Substances 0.000 description 7
- 238000009966 trimming Methods 0.000 description 7
- XLYOFNOQVPJJNP-UHFFFAOYSA-N water Substances O XLYOFNOQVPJJNP-UHFFFAOYSA-N 0.000 description 7
- HEDRZPFGACZZDS-UHFFFAOYSA-N Chloroform Chemical compound ClC(Cl)Cl HEDRZPFGACZZDS-UHFFFAOYSA-N 0.000 description 6
- PEDCQBHIVMGVHV-UHFFFAOYSA-N Glycerine Chemical compound OCC(O)CO PEDCQBHIVMGVHV-UHFFFAOYSA-N 0.000 description 6
- 230000001419 dependent effect Effects 0.000 description 6
- 201000010099 disease Diseases 0.000 description 6
- 208000037265 diseases, disorders, signs and symptoms Diseases 0.000 description 6
- 230000008030 elimination Effects 0.000 description 6
- 238000003379 elimination reaction Methods 0.000 description 6
- 238000002156 mixing Methods 0.000 description 6
- BASFCYQUMIYNBI-UHFFFAOYSA-N platinum Chemical group [Pt] BASFCYQUMIYNBI-UHFFFAOYSA-N 0.000 description 6
- 230000008569 process Effects 0.000 description 6
- 238000011160 research Methods 0.000 description 6
- 241000566145 Otus Species 0.000 description 5
- 238000007792 addition Methods 0.000 description 5
- 239000008346 aqueous phase Substances 0.000 description 5
- 238000005119 centrifugation Methods 0.000 description 5
- 239000003086 colorant Substances 0.000 description 5
- 230000000694 effects Effects 0.000 description 5
- 238000002523 gelfiltration Methods 0.000 description 5
- 230000003993 interaction Effects 0.000 description 5
- 210000003705 ribosome Anatomy 0.000 description 5
- 238000007480 sanger sequencing Methods 0.000 description 5
- 238000012360 testing method Methods 0.000 description 5
- GUAHPAJOXVYFON-ZETCQYMHSA-N (8S)-8-amino-7-oxononanoic acid zwitterion Chemical compound C[C@H](N)C(=O)CCCCCC(O)=O GUAHPAJOXVYFON-ZETCQYMHSA-N 0.000 description 4
- 241000196324 Embryophyta Species 0.000 description 4
- 241000588724 Escherichia coli Species 0.000 description 4
- 241000192125 Firmicutes Species 0.000 description 4
- 108010090804 Streptavidin Proteins 0.000 description 4
- 238000000137 annealing Methods 0.000 description 4
- 230000002902 bimodal effect Effects 0.000 description 4
- 230000015572 biosynthetic process Effects 0.000 description 4
- 238000010790 dilution Methods 0.000 description 4
- 239000012895 dilution Substances 0.000 description 4
- 239000012530 fluid Substances 0.000 description 4
- 239000000499 gel Substances 0.000 description 4
- 230000000968 intestinal effect Effects 0.000 description 4
- 238000002955 isolation Methods 0.000 description 4
- 230000007246 mechanism Effects 0.000 description 4
- 238000000386 microscopy Methods 0.000 description 4
- 239000002245 particle Substances 0.000 description 4
- 239000011148 porous material Substances 0.000 description 4
- 238000000926 separation method Methods 0.000 description 4
- 238000003260 vortexing Methods 0.000 description 4
- 108091093088 Amplicon Proteins 0.000 description 3
- 241000605059 Bacteroidetes Species 0.000 description 3
- 102000053602 DNA Human genes 0.000 description 3
- 108700039887 Essential Genes Proteins 0.000 description 3
- 238000011529 RT qPCR Methods 0.000 description 3
- 230000008901 benefit Effects 0.000 description 3
- 230000027455 binding Effects 0.000 description 3
- 238000004364 calculation method Methods 0.000 description 3
- 125000003178 carboxy group Chemical group [H]OC(*)=O 0.000 description 3
- 239000002738 chelating agent Substances 0.000 description 3
- 210000003238 esophagus Anatomy 0.000 description 3
- 239000012634 fragment Substances 0.000 description 3
- 239000007788 liquid Substances 0.000 description 3
- 239000012528 membrane Substances 0.000 description 3
- 238000002705 metabolomic analysis Methods 0.000 description 3
- 230000001431 metabolomic effect Effects 0.000 description 3
- 239000004005 microsphere Substances 0.000 description 3
- 210000000214 mouth Anatomy 0.000 description 3
- 210000000056 organ Anatomy 0.000 description 3
- 229910052697 platinum Inorganic materials 0.000 description 3
- 210000000813 small intestine Anatomy 0.000 description 3
- 210000002784 stomach Anatomy 0.000 description 3
- YBJHBAHKTGYVGT-ZKWXMUAHSA-N (+)-Biotin Chemical compound N1C(=O)N[C@@H]2[C@H](CCCCC(=O)O)SC[C@@H]21 YBJHBAHKTGYVGT-ZKWXMUAHSA-N 0.000 description 2
- 241000725101 Clea Species 0.000 description 2
- 241000193403 Clostridium Species 0.000 description 2
- 108010014303 DNA-directed DNA polymerase Proteins 0.000 description 2
- 102000016928 DNA-directed DNA polymerase Human genes 0.000 description 2
- AHCYMLUZIRLXAA-SHYZEUOFSA-N Deoxyuridine 5'-triphosphate Chemical compound O1[C@H](COP(O)(=O)OP(O)(=O)OP(O)(O)=O)[C@@H](O)C[C@@H]1N1C(=O)NC(=O)C=C1 AHCYMLUZIRLXAA-SHYZEUOFSA-N 0.000 description 2
- KCXVZYZYPLLWCC-UHFFFAOYSA-N EDTA Chemical compound OC(=O)CN(CC(O)=O)CCN(CC(O)=O)CC(O)=O KCXVZYZYPLLWCC-UHFFFAOYSA-N 0.000 description 2
- 241000233866 Fungi Species 0.000 description 2
- 241000282412 Homo Species 0.000 description 2
- 238000012313 Kruskal-Wallis test Methods 0.000 description 2
- 108091034117 Oligonucleotide Proteins 0.000 description 2
- 238000012408 PCR amplification Methods 0.000 description 2
- 241000192142 Proteobacteria Species 0.000 description 2
- 108020004682 Single-Stranded DNA Proteins 0.000 description 2
- 239000007984 Tris EDTA buffer Substances 0.000 description 2
- 239000011543 agarose gel Substances 0.000 description 2
- 238000013459 approach Methods 0.000 description 2
- 239000007853 buffer solution Substances 0.000 description 2
- 238000004422 calculation algorithm Methods 0.000 description 2
- 238000012937 correction Methods 0.000 description 2
- 238000007405 data analysis Methods 0.000 description 2
- 210000002615 epidermis Anatomy 0.000 description 2
- 230000002349 favourable effect Effects 0.000 description 2
- 238000000799 fluorescence microscopy Methods 0.000 description 2
- 238000001502 gel electrophoresis Methods 0.000 description 2
- 210000004209 hair Anatomy 0.000 description 2
- 230000013632 homeostatic process Effects 0.000 description 2
- 238000002372 labelling Methods 0.000 description 2
- 238000013507 mapping Methods 0.000 description 2
- 239000011159 matrix material Substances 0.000 description 2
- 210000003928 nasal cavity Anatomy 0.000 description 2
- 238000007481 next generation sequencing Methods 0.000 description 2
- 238000010606 normalization Methods 0.000 description 2
- 239000012074 organic phase Substances 0.000 description 2
- 230000002093 peripheral effect Effects 0.000 description 2
- 239000012071 phase Substances 0.000 description 2
- XEBWQGVWTUSTLN-UHFFFAOYSA-M phenylmercury acetate Chemical compound CC(=O)O[Hg]C1=CC=CC=C1 XEBWQGVWTUSTLN-UHFFFAOYSA-M 0.000 description 2
- 239000002504 physiological saline solution Substances 0.000 description 2
- 239000011541 reaction mixture Substances 0.000 description 2
- 230000001850 reproductive effect Effects 0.000 description 2
- 210000003491 skin Anatomy 0.000 description 2
- 239000002689 soil Substances 0.000 description 2
- 239000007790 solid phase Substances 0.000 description 2
- 239000000725 suspension Substances 0.000 description 2
- 238000012353 t test Methods 0.000 description 2
- 239000013076 target substance Substances 0.000 description 2
- 230000008685 targeting Effects 0.000 description 2
- 238000012549 training Methods 0.000 description 2
- 230000007704 transition Effects 0.000 description 2
- 238000011282 treatment Methods 0.000 description 2
- 108091032973 (ribonucleotides)n+m Proteins 0.000 description 1
- 108020004463 18S ribosomal RNA Proteins 0.000 description 1
- 102100031126 6-phosphogluconolactonase Human genes 0.000 description 1
- 108010029731 6-phosphogluconolactonase Proteins 0.000 description 1
- 102100033094 ATP-binding cassette sub-family G member 4 Human genes 0.000 description 1
- 241001156739 Actinobacteria <phylum> Species 0.000 description 1
- 241000251468 Actinopterygii Species 0.000 description 1
- 108020000543 Adenylate kinase Proteins 0.000 description 1
- 102000002281 Adenylate kinase Human genes 0.000 description 1
- 206010067484 Adverse reaction Diseases 0.000 description 1
- 229920001817 Agar Polymers 0.000 description 1
- 229920000936 Agarose Polymers 0.000 description 1
- 101100163490 Alkalihalobacillus halodurans (strain ATCC BAA-125 / DSM 18197 / FERM 7344 / JCM 9153 / C-125) aroA1 gene Proteins 0.000 description 1
- 206010002091 Anaesthesia Diseases 0.000 description 1
- 241000271566 Aves Species 0.000 description 1
- 108090001008 Avidin Proteins 0.000 description 1
- 108020000946 Bacterial DNA Proteins 0.000 description 1
- 241000217846 Bacteroides caccae Species 0.000 description 1
- 241001135228 Bacteroides ovatus Species 0.000 description 1
- 241000606123 Bacteroides thetaiotaomicron Species 0.000 description 1
- 241000520742 Blautia hydrogenotrophica Species 0.000 description 1
- 241000283690 Bos taurus Species 0.000 description 1
- BMTAFVWTTFSTOG-UHFFFAOYSA-N Butylate Chemical compound CCSC(=O)N(CC(C)C)CC(C)C BMTAFVWTTFSTOG-UHFFFAOYSA-N 0.000 description 1
- 241000282472 Canis lupus familiaris Species 0.000 description 1
- 241000283707 Capra Species 0.000 description 1
- 241001466804 Carnivora Species 0.000 description 1
- 206010057248 Cell death Diseases 0.000 description 1
- 241000282693 Cercopithecidae Species 0.000 description 1
- 241000961092 Collinsella aerofaciens ATCC 25986 Species 0.000 description 1
- 241000938605 Crocodylia Species 0.000 description 1
- 108020001019 DNA Primers Proteins 0.000 description 1
- 238000007399 DNA isolation Methods 0.000 description 1
- 239000003155 DNA primer Substances 0.000 description 1
- 101710088194 Dehydrogenase Proteins 0.000 description 1
- 241000962964 Desulfovibrio piger ATCC 29098 Species 0.000 description 1
- 108010067770 Endopeptidase K Proteins 0.000 description 1
- 102000004190 Enzymes Human genes 0.000 description 1
- 108090000790 Enzymes Proteins 0.000 description 1
- 241000283086 Equidae Species 0.000 description 1
- 241000282326 Felis catus Species 0.000 description 1
- 108010000916 Fimbriae Proteins Proteins 0.000 description 1
- KRHYYFGTRYWZRS-UHFFFAOYSA-M Fluoride anion Chemical compound [F-] KRHYYFGTRYWZRS-UHFFFAOYSA-M 0.000 description 1
- 108010018962 Glucosephosphate Dehydrogenase Proteins 0.000 description 1
- 241000282575 Gorilla Species 0.000 description 1
- 101000800393 Homo sapiens ATP-binding cassette sub-family G member 4 Proteins 0.000 description 1
- 108010053229 Lysyl endopeptidase Proteins 0.000 description 1
- 241000124008 Mammalia Species 0.000 description 1
- 241001579457 Marvinbryantia formatexigens DSM 14469 Species 0.000 description 1
- 102000016943 Muramidase Human genes 0.000 description 1
- 108010014251 Muramidase Proteins 0.000 description 1
- 101100381816 Mycobacterium tuberculosis (strain ATCC 25618 / H37Rv) bkdC gene Proteins 0.000 description 1
- 108010062010 N-Acetylmuramoyl-L-alanine Amidase Proteins 0.000 description 1
- 241000282579 Pan Species 0.000 description 1
- 241000282576 Pan paniscus Species 0.000 description 1
- 241001494479 Pecora Species 0.000 description 1
- 108010022923 Peptidoglycan Glycosyltransferase Proteins 0.000 description 1
- 241000283089 Perissodactyla Species 0.000 description 1
- 102000009569 Phosphoglucomutase Human genes 0.000 description 1
- 241000425347 Phyla <beetle> Species 0.000 description 1
- 241001377010 Pila Species 0.000 description 1
- 239000004793 Polystyrene Substances 0.000 description 1
- 241000282405 Pongo abelii Species 0.000 description 1
- 241000288906 Primates Species 0.000 description 1
- 101710086015 RNA ligase Proteins 0.000 description 1
- 241000700159 Rattus Species 0.000 description 1
- 241000283984 Rodentia Species 0.000 description 1
- 108050008280 Shikimate dehydrogenase Proteins 0.000 description 1
- FAPWRFPIFSIZLT-UHFFFAOYSA-M Sodium chloride Chemical compound [Na+].[Cl-] FAPWRFPIFSIZLT-UHFFFAOYSA-M 0.000 description 1
- 241000282887 Suidae Species 0.000 description 1
- QAOWNCQODCNURD-UHFFFAOYSA-L Sulfate Chemical compound [O-]S([O-])(=O)=O QAOWNCQODCNURD-UHFFFAOYSA-L 0.000 description 1
- 108010006785 Taq Polymerase Proteins 0.000 description 1
- 239000007983 Tris buffer Substances 0.000 description 1
- 241000251539 Vertebrata <Metazoa> Species 0.000 description 1
- 241000193450 [Clostridium] symbiosum Species 0.000 description 1
- 241001531188 [Eubacterium] rectale Species 0.000 description 1
- 230000006838 adverse reaction Effects 0.000 description 1
- 239000008272 agar Substances 0.000 description 1
- 230000037005 anaesthesia Effects 0.000 description 1
- 210000000436 anus Anatomy 0.000 description 1
- 101150037081 aroA gene Proteins 0.000 description 1
- 101150040872 aroE gene Proteins 0.000 description 1
- 210000001815 ascending colon Anatomy 0.000 description 1
- 238000003556 assay Methods 0.000 description 1
- 230000002238 attenuated effect Effects 0.000 description 1
- UUQMNUMQCIQDMZ-UHFFFAOYSA-N betahistine Chemical compound CNCCC1=CC=CC=N1 UUQMNUMQCIQDMZ-UHFFFAOYSA-N 0.000 description 1
- 229960002685 biotin Drugs 0.000 description 1
- 235000020958 biotin Nutrition 0.000 description 1
- 239000011616 biotin Substances 0.000 description 1
- -1 butylate Chemical class 0.000 description 1
- 239000006227 byproduct Substances 0.000 description 1
- 230000003915 cell function Effects 0.000 description 1
- 238000012512 characterization method Methods 0.000 description 1
- 239000003638 chemical reducing agent Substances 0.000 description 1
- 238000010367 cloning Methods 0.000 description 1
- 238000011109 contamination Methods 0.000 description 1
- 239000013068 control sample Substances 0.000 description 1
- 238000012258 culturing Methods 0.000 description 1
- 230000009089 cytolysis Effects 0.000 description 1
- 210000001731 descending colon Anatomy 0.000 description 1
- 238000007847 digital PCR Methods 0.000 description 1
- 239000012470 diluted sample Substances 0.000 description 1
- LOKCTEFSRHRXRJ-UHFFFAOYSA-I dipotassium trisodium dihydrogen phosphate hydrogen phosphate dichloride Chemical compound P(=O)(O)(O)[O-].[K+].P(=O)(O)([O-])[O-].[Na+].[Na+].[Cl-].[K+].[Cl-].[Na+] LOKCTEFSRHRXRJ-UHFFFAOYSA-I 0.000 description 1
- 210000001198 duodenum Anatomy 0.000 description 1
- 230000037149 energy metabolism Effects 0.000 description 1
- 229940088598 enzyme Drugs 0.000 description 1
- 238000000855 fermentation Methods 0.000 description 1
- 230000004151 fermentation Effects 0.000 description 1
- 239000000706 filtrate Substances 0.000 description 1
- 239000003102 growth factor Substances 0.000 description 1
- 244000005709 gut microbiome Species 0.000 description 1
- 210000003128 head Anatomy 0.000 description 1
- 238000012165 high-throughput sequencing Methods 0.000 description 1
- 230000036571 hydration Effects 0.000 description 1
- 238000006703 hydration reaction Methods 0.000 description 1
- 210000003405 ileum Anatomy 0.000 description 1
- 238000005286 illumination Methods 0.000 description 1
- 238000007901 in situ hybridization Methods 0.000 description 1
- 238000011835 investigation Methods 0.000 description 1
- 210000001630 jejunum Anatomy 0.000 description 1
- 229960000274 lysozyme Drugs 0.000 description 1
- 235000010335 lysozyme Nutrition 0.000 description 1
- 239000004325 lysozyme Substances 0.000 description 1
- 238000010801 machine learning Methods 0.000 description 1
- 241001515942 marmosets Species 0.000 description 1
- 229910052751 metal Inorganic materials 0.000 description 1
- 239000002184 metal Substances 0.000 description 1
- 229910021645 metal ion Inorganic materials 0.000 description 1
- 239000002480 mineral oil Substances 0.000 description 1
- 235000010446 mineral oil Nutrition 0.000 description 1
- 230000009149 molecular binding Effects 0.000 description 1
- 108010087904 neutravidin Proteins 0.000 description 1
- 238000000399 optical microscopy Methods 0.000 description 1
- 239000003960 organic solvent Substances 0.000 description 1
- 235000012736 patent blue V Nutrition 0.000 description 1
- 101150086832 pdhC gene Proteins 0.000 description 1
- 238000002205 phenol-chloroform extraction Methods 0.000 description 1
- 239000008363 phosphate buffer Substances 0.000 description 1
- 239000002953 phosphate buffered saline Substances 0.000 description 1
- 108091000115 phosphomannomutase Proteins 0.000 description 1
- 230000026731 phosphorylation Effects 0.000 description 1
- 238000006366 phosphorylation reaction Methods 0.000 description 1
- 102000030592 phosphoserine aminotransferase Human genes 0.000 description 1
- 108010088694 phosphoserine aminotransferase Proteins 0.000 description 1
- 231100000614 poison Toxicity 0.000 description 1
- 108020000161 polyphosphate kinase Proteins 0.000 description 1
- 229920002223 polystyrene Polymers 0.000 description 1
- 238000004321 preservation Methods 0.000 description 1
- 108010017378 prolyl aminopeptidase Proteins 0.000 description 1
- XJMOSONTPMZWPB-UHFFFAOYSA-M propidium iodide Chemical compound [I-].[I-].C12=CC(N)=CC=C2C2=CC=C(N)C=C2[N+](CCC[N+](C)(CC)CC)=C1C1=CC=CC=C1 XJMOSONTPMZWPB-UHFFFAOYSA-M 0.000 description 1
- 238000004445 quantitative analysis Methods 0.000 description 1
- 230000035484 reaction time Effects 0.000 description 1
- 210000000664 rectum Anatomy 0.000 description 1
- 108091008146 restriction endonucleases Proteins 0.000 description 1
- 108020004418 ribosomal RNA Proteins 0.000 description 1
- 150000003839 salts Chemical class 0.000 description 1
- 229920006395 saturated elastomer Polymers 0.000 description 1
- 101150003830 serC gene Proteins 0.000 description 1
- DFEYYRMXOJXZRJ-UHFFFAOYSA-N sevoflurane Chemical compound FCOC(C(F)(F)F)C(F)(F)F DFEYYRMXOJXZRJ-UHFFFAOYSA-N 0.000 description 1
- 229960002078 sevoflurane Drugs 0.000 description 1
- 150000004666 short chain fatty acids Chemical class 0.000 description 1
- 210000001599 sigmoid colon Anatomy 0.000 description 1
- 229920002545 silicone oil Polymers 0.000 description 1
- 239000011780 sodium chloride Substances 0.000 description 1
- 125000006850 spacer group Chemical group 0.000 description 1
- VNFWTIYUKDMAOP-UHFFFAOYSA-N sphos Chemical compound COC1=CC=CC(OC)=C1C1=CC=CC=C1P(C1CCCCC1)C1CCCCC1 VNFWTIYUKDMAOP-UHFFFAOYSA-N 0.000 description 1
- 230000006641 stabilisation Effects 0.000 description 1
- 238000011105 stabilization Methods 0.000 description 1
- 230000001954 sterilising effect Effects 0.000 description 1
- 238000004659 sterilization and disinfection Methods 0.000 description 1
- 238000003756 stirring Methods 0.000 description 1
- CCEKAJIANROZEO-UHFFFAOYSA-N sulfluramid Chemical group CCNS(=O)(=O)C(F)(F)C(F)(F)C(F)(F)C(F)(F)C(F)(F)C(F)(F)C(F)(F)C(F)(F)F CCEKAJIANROZEO-UHFFFAOYSA-N 0.000 description 1
- 239000004094 surface-active agent Substances 0.000 description 1
- 238000003786 synthesis reaction Methods 0.000 description 1
- 239000003440 toxic substance Substances 0.000 description 1
- 210000003384 transverse colon Anatomy 0.000 description 1
- LENZDBCJOHFCAS-UHFFFAOYSA-N tris Chemical compound OCC(N)(CO)CO LENZDBCJOHFCAS-UHFFFAOYSA-N 0.000 description 1
- 230000000007 visual effect Effects 0.000 description 1
- 238000012800 visualization Methods 0.000 description 1
Images


Classifications
-
- C—CHEMISTRY; METALLURGY
- C12—BIOCHEMISTRY; BEER; SPIRITS; WINE; VINEGAR; MICROBIOLOGY; ENZYMOLOGY; MUTATION OR GENETIC ENGINEERING
- C12Q—MEASURING OR TESTING PROCESSES INVOLVING ENZYMES, NUCLEIC ACIDS OR MICROORGANISMS; COMPOSITIONS OR TEST PAPERS THEREFOR; PROCESSES OF PREPARING SUCH COMPOSITIONS; CONDITION-RESPONSIVE CONTROL IN MICROBIOLOGICAL OR ENZYMOLOGICAL PROCESSES
- C12Q1/00—Measuring or testing processes involving enzymes, nucleic acids or microorganisms; Compositions therefor; Processes of preparing such compositions
- C12Q1/68—Measuring or testing processes involving enzymes, nucleic acids or microorganisms; Compositions therefor; Processes of preparing such compositions involving nucleic acids
- C12Q1/6876—Nucleic acid products used in the analysis of nucleic acids, e.g. primers or probes
- C12Q1/6888—Nucleic acid products used in the analysis of nucleic acids, e.g. primers or probes for detection or identification of organisms
- C12Q1/689—Nucleic acid products used in the analysis of nucleic acids, e.g. primers or probes for detection or identification of organisms for bacteria
-
- C—CHEMISTRY; METALLURGY
- C12—BIOCHEMISTRY; BEER; SPIRITS; WINE; VINEGAR; MICROBIOLOGY; ENZYMOLOGY; MUTATION OR GENETIC ENGINEERING
- C12Q—MEASURING OR TESTING PROCESSES INVOLVING ENZYMES, NUCLEIC ACIDS OR MICROORGANISMS; COMPOSITIONS OR TEST PAPERS THEREFOR; PROCESSES OF PREPARING SUCH COMPOSITIONS; CONDITION-RESPONSIVE CONTROL IN MICROBIOLOGICAL OR ENZYMOLOGICAL PROCESSES
- C12Q1/00—Measuring or testing processes involving enzymes, nucleic acids or microorganisms; Compositions therefor; Processes of preparing such compositions
- C12Q1/68—Measuring or testing processes involving enzymes, nucleic acids or microorganisms; Compositions therefor; Processes of preparing such compositions involving nucleic acids
- C12Q1/6806—Preparing nucleic acids for analysis, e.g. for polymerase chain reaction [PCR] assay
-
- C—CHEMISTRY; METALLURGY
- C12—BIOCHEMISTRY; BEER; SPIRITS; WINE; VINEGAR; MICROBIOLOGY; ENZYMOLOGY; MUTATION OR GENETIC ENGINEERING
- C12Q—MEASURING OR TESTING PROCESSES INVOLVING ENZYMES, NUCLEIC ACIDS OR MICROORGANISMS; COMPOSITIONS OR TEST PAPERS THEREFOR; PROCESSES OF PREPARING SUCH COMPOSITIONS; CONDITION-RESPONSIVE CONTROL IN MICROBIOLOGICAL OR ENZYMOLOGICAL PROCESSES
- C12Q1/00—Measuring or testing processes involving enzymes, nucleic acids or microorganisms; Compositions therefor; Processes of preparing such compositions
- C12Q1/68—Measuring or testing processes involving enzymes, nucleic acids or microorganisms; Compositions therefor; Processes of preparing such compositions involving nucleic acids
- C12Q1/6844—Nucleic acid amplification reactions
-
- C—CHEMISTRY; METALLURGY
- C12—BIOCHEMISTRY; BEER; SPIRITS; WINE; VINEGAR; MICROBIOLOGY; ENZYMOLOGY; MUTATION OR GENETIC ENGINEERING
- C12Q—MEASURING OR TESTING PROCESSES INVOLVING ENZYMES, NUCLEIC ACIDS OR MICROORGANISMS; COMPOSITIONS OR TEST PAPERS THEREFOR; PROCESSES OF PREPARING SUCH COMPOSITIONS; CONDITION-RESPONSIVE CONTROL IN MICROBIOLOGICAL OR ENZYMOLOGICAL PROCESSES
- C12Q2600/00—Oligonucleotides characterized by their use
- C12Q2600/16—Primer sets for multiplex assays
Definitions
- the present invention relates to a method for treating a cell population and a method for analyzing genes included in a cell population.
- the microbiota should be simply defined at a cell level because a cell is a fundamental physical unit of a microbiota. 3-5 However, such a definition is difficult with the current leading-edge techniques. 6-8
- Patent Literature 4 has proposed a method of removing errors and correcting the counted number in consideration of the natures of errors occurring during amplification of nucleic acids and reading errors occurring during sequencing.
- a microbiota comprises an enormous number of bacteria of a large number of bacterial species. 17
- a high throughput cell quantification method with a high taxonomic resolution ability has not been developed so far.
- the present invention provides a method for treating a cell population and a method for analyzing genes included in a cell population.
- the present inventors developed a novel method for quantifying cell types in a bacterial microbiota and the cell concentration for each cell type using a high throughput method.
- the present inventors also found a method that addresses a state in which genes to be analyzed exist in multiplicate in one cell.
- the method enables fine classification of unknown cells (e.g., microorganisms) having gene multiplication and estimates the numbers of the cells by classifying gene groups to be analyzed into cell-based operational taxonomic units (cOTUs).
- the term "subject” refers to a living organism, that is, an animal or a plant.
- subjects can include vertebrates: for example, mammals, fish, birds, amphibians, and reptiles, such as, for example, primates such as humans, chimpanzees, gorillas, orangutans, monkeys, marmosets, and bonobos and four-legged animals such as pigs, rats, mice, cows, sheep, goats, horses, cats, and dogs (e.g., carnivores, cloven-hoofed animals, odd-toed ungulates, and rodents).
- vertebrates for example, mammals, fish, birds, amphibians, and reptiles, such as, for example, primates such as humans, chimpanzees, gorillas, orangutans, monkeys, marmosets, and bonobos and four-legged animals such as pigs, rats, mice, cows, sheep, goats, horses, cats, and dogs (e.
- the term "cell” refers to a cell of a living organism and can be a cell of a bacterium, protozoa, chromista, animal, plant, and fungus.
- the term "singulated cells” means cells that exist in a form of being separated into individual cells. Therefore, a solution containing singulated cells means a solution containing one or more cells each of which exists separately. The solution containing singulated cells is preferably a solution in which all or most contained cells exist in a form of being separated into individual cells, but may contain a cell aggregate comprising two or more adhered cells as long as singulated cells are contained.
- the term "cell population” is a composition comprising a plurality of cells.
- the cell population generally comprises cells of a plurality of types, and each type can include a plurality of cells.
- the form of the composition can be a liquid or a solid.
- microbiota means a population of microorganisms.
- various microbiotas exist.
- microbiotas exist in soil, water (ocean, river, swamp, pond), air, and the epidermis, body hair, oral cavity, nasal cavity, gastrointestinal tract (e.g., the esophagus, stomach, small intestine, large intestine, cecum), and reproductive organ of animals; and outer skin and root of plants.
- the microbiota in an animal reflects or affects the health condition of the animal.
- a microbiota can comprise 10 or more types, 20 or more types, 30 or more types, 40 or more types, 50 or more types, 60 or more types, 70 or more types, 80 or more types, 90 or more types, or 100 or more types of microorganisms.
- a microbiota can include unknown microorganisms. Unknown microorganisms can be 10% or more, 20% or more, 30% or more, or 40% or more of the microorganism types included in a microbiota.
- cellular barcode means a nucleic acid having a unique nucleotide sequence allocated for each cell.
- Each cell can be linked to a cellular barcode having a different nucleotide sequence (i.e., a nucleotide sequence unique to the cell). Therefore, the number of cellular barcodes can represent the number of cells.
- the number of cells which has been conventionally measured in quantitative manner, can be measured by converting numbers of nucleotide sequences to qualitatively assessable numbers. A sufficient number of different cellular barcodes can be prepared for the total number of cells present.
- Isolation means separating a target substance from others. Isolation can include concentration or purification of the target substance after isolation.
- the "amplification product” means a nucleic acid obtained by amplification of a gene (e.g., polymerase chain reaction (PCR)).
- PCR polymerase chain reaction
- two primers are designed to flank a DNA site to be amplified, and the portion flanked by the two primers is amplified by allowing to react with DNA polymerase under a predetermined condition.
- a primer can be a nucleic acid in the form of a single chain having a sequence that hybridizes with the DNA site to be amplified, but an additional nucleotide sequence (e.g., an adapter, an index sequence unique to the sample, a restriction enzyme recognition site) may be linked to the nucleic acid at the 5' end thereof.
- the term “paralog” means two genes arising from gene multiplication on the genome.
- the term “ortholog” means genes that exist in different organisms and have a homologous function.
- a method for treating a cell population comprising
- a droplet population comprising aqueous droplets, at least some of which each comprise one cell and one-molecule cellular barcode is provided.
- cells can be cells constituting an isolated cell population (e.g., a microbiota).
- the cell dispersion of the above (A) can be obtained by dispersing cells included in the isolated cell population in an aqueous solution.
- Cells can be dispersed in a solution utilizing a shear stress of water caused by water flow, for example, by shaking, pipetting, or the like.
- the term "to disperse” means to disassemble a cell aggregate composed of a plurality of cells in an aqueous solution in order to obtain a plurality of single cells and, preferably, to suspend single cells in the aqueous solution.
- the method of the present invention can comprise dispersing cells included in an isolated cell population in an aqueous solution.
- a cell population can be a microbiota.
- a natural microbiota can be preferably used as the microbiota.
- microbiotas include soil, water (ocean, rivers, swamps, pond), air, and the epidermis, body hair, oral cavity, nasal cavity, gastrointestinal tract (e.g., esophagus, stomach, small intestine, large intestine, cecum), and reproductive organs of animals.
- Microbiotas present in the outer skin and roots of plants can also be used.
- a microbiota in the gastrointestinal tract can be used.
- such a microbiota can be a microbiota in the oral cavity, a microbiota in the esophagus, a microbiota in the stomach, a microbiota in the duodenum, a microbiota in the small intestine (e.g., the jejunum or the ileum), a microbiota in the cecum, or a microbiotas in the large intestine (e.g., the ascending colon, transverse colon, descending colon, sigmoid colon, rectum).
- a natural microbiota is preferably analyzed without being cultured, but analyzing after culturing the natural microbiota can be acceptable.
- a microbiota includes unknown microorganisms.
- the types of unknown microorganisms can account for 10% or more, 20% or more, 30% or more, or 40% or more of microorganism types included in a microbiota.
- a cell population can include extracellular DNA. Extracellular DNA can include predetermined genes. Extracellular DNA may be removed before the cell population is treated. Extracellular DNA can be removed by filtration or centrifugation as described later. Extracellular DNA may be included in a cell population to be treated.
- a cell population is isolated by obtaining a cell population. Isolation of a cell population may further comprise separating the obtained cell population from one or more components that are not cells.
- the cell population can be separated from one or more components that are not cells by filtration or centrifugation.
- the filtration can be performed by using, for example, a filter having a pore size of submicrometers (e.g., 0.22 ⁇ m), and the cell population can be collected from residues on the filter.
- cells included in an isolated cell population can be dispersed in an aqueous solution before droplets are prepared.
- the term "to disperse” means to allow individual cells to exist separately. Dispersion can be achieved by disintegrating a cell aggregate by pipetting without destroying cells. Aqueous solutions are not particularly limited as long as cells are not destroyed, and water, physiological saline, and the like can be used.
- the isolated cell population can be dispersed in pure water, physiological saline, a reaction mixture for gene amplification, or the like.
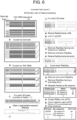
- droplets can be prepared in oil. Therefore, in this embodiment, the droplet population obtained in (A) comprises aqueous droplets (water droplets) in oil. In other words, the droplet population obtained in (A) can be water-in-oil droplet type particles (a population of aqueous droplets dispersed in oil) .
- the particle size of the above-mentioned aqueous droplets can range from 10 ⁇ m to 100 ⁇ m as the lower limit and from 50 ⁇ m to 1,000 ⁇ m as the upper limit.
- the particle size of aqueous droplets can range, for example, from 10 ⁇ m to 1,000 ⁇ m, for example, 20 ⁇ m to 900 ⁇ m, 30 ⁇ m to 800 ⁇ m, 40 ⁇ m to 700 ⁇ m, 50 ⁇ m to 600 ⁇ m, 50 ⁇ m to 500 ⁇ m, 50 ⁇ m to 400 ⁇ m, 50 ⁇ m to 300 ⁇ m, 50 ⁇ m to 200 ⁇ m, or 50 ⁇ m to 150 ⁇ m, or, for example, approximately 100 ⁇ m.
- Such a droplet population can be suitably prepared by those skilled in the art using, for example, a microfluid device.
- a droplet population can also be prepared using a commercially available droplet generator.
- the commercially available droplet generator for example, QX200 Droplet Generator of BIO-RAD Laboratories, Inc. can be used.
- a droplet population comprising aqueous droplets which include aqueous droplets comprising one cell and one molecule of a cellular barcode (e.g., DNA) having one type of a nucleotide sequence unique to the cell can be obtained.
- a droplet population comprising aqueous droplets which comprise one cell and a single type of a cellular barcode unique to each cell can be obtained by mixing an aqueous solution containing a plurality of dispersed cells and an aqueous solution containing cellular barcodes having a nucleotide sequence different for each one molecule in oil.
- another cell is included in aqueous droplets comprising a cellular barcode having another one type of a nucleotide sequence unique to the cell.
- the cell can be included in 50% or less, 40% or less, 35% or less, 30% or less, 25% or less, or 20% or less (e.g., 20%) of all droplets.
- the probability of a plurality of cells being contained in one droplet can be reduced by doing this.
- the number of cells contained in, for example, 90% or more of cell-containing droplets is 1.
- cellular barcodes can also be contained in 50% or less, 40% or less, 35% or less, 30% or less, 25% or less, or 20% or less (e.g., 20%) of all droplets.
- the number of cellular barcodes contained in, for example, 90% or more of cellular barcode-containing droplets can be 1.
- droplets containing one cell and one molecule of a cellular barcode can be obtained, and the droplets can account for 1% to 10%, 2% to 6%, 3% to 5%, or, for example, approximately 4% of all droplets.
- the proportion of cell-containing droplets to all droplets can be made 30% or less (preferably, approximately 20%), and the proportion of cellular barcode-containing droplets to all droplets can be made 30% or less (preferably, approximately 20%).
- the proportion of droplets containing a cell and a cellular barcode to all droplets can be reduced or eliminated.
- the existence of droplets containing only one or neither of a cell and a cellular barcode does not affect the subsequent steps after sequencing a product of linking of a predetermined gene and a cellular barcode in a cell.
- the proportion of droplets containing two or more cells and one cellular barcode can be, for example, 0.5% or less, 0.4% or less, or 0.3% or less and can be, for example, 0.3% to 0.5%.
- the proportion of droplets containing one cell and two or more cellular barcodes can be, for example, 0.5% or less, 0.4% or less, or 0.3% or less and can be, for example, 0.3% to 0.5%.
- the proportion of droplets containing two or more cells and two or more cellular barcode can be, for example, 0.05% or less, 0.04% or less, or 0.03% or less and can be, for example, 0.03% to 0.05%.
- a smaller number of droplets containing two or more cells or cellular barcodes are more preferred, but occurrence of such droplets is acceptable.
- Aqueous droplets may further contain primers and reagents for gene amplification in addition to one cell and one molecule of a cellular barcode. Since cells are destroyed during the gene amplification reaction, the reagents do not need to include a surfactant. Additionally, aqueous droplets can be an aqueous solution suitable for a gene amplification reaction (e.g., a gene amplification reaction solution).
- oils can be used as long as they are stable and inactive under an environment of a gene amplification reaction (60°C to 100°C).
- oils include mineral oil (e.g., light oil), silicone oil, fluoride oil, and other commercially available oils, and combinations thereof, but are not limited to these examples.
- a droplet population comprising aqueous droplets, at least some of which each comprise one of the obtained cells and one molecule of a cellular barcode can be obtained from an aqueous solution containing cells, cellular barcodes, primers, and reagents for gene amplification. More specifically, a gene amplification reaction mixture containing cells, cellular barcodes, primers, and reagents for gene amplification can be prepared to obtain a droplet population from this solution as described above.
- a method for determining (or analyzing) a gene sequence included in a cell population comprising
- components required for gene amplification can be introduced into each droplet beforehand by mixing necessary components for PCR, excluding a template, such as a primer set for amplification of the cellular barcode and amplification of the predetermined gene in the cell, dNTPs, and thermostable DNA polymerase in a solution (e.g., a cellular barcode solution). Then, a liquid containing a droplet population is transferred into a tube for PCR, and a DNA amplification reaction can be induced in each droplet by PCR. The amplification product of the predetermined gene in the cell and the amplification product of the cellular barcode can be obtained in each droplet by gene amplification in each droplet.
- a template such as a primer set for amplification of the cellular barcode and amplification of the predetermined gene in the cell
- dNTPs e.g., a cellular barcode solution
- Amplification can include amplification cycles of, for example, 25 cycles, preferably, 30 or more cycles.
- the amplification product of the predetermined gene in the cell and the amplification product of the cellular barcode can be linked in each droplet (for example, see Figure 5 ).
- Linking can be performed in a step of an amplification reaction (e.g., a PCR reaction) by, for example, designing one of primers for the cellular barcode and one of primers for the predetermined gene so that they have complementary sequence portions that are hybridizable with each other (for example, see SEQ ID NOS: 4 and 5 in Figure 5 ).
- an amplification reaction e.g., a PCR reaction
- one type of a cellular barcode can be attached to each molecule of the amplification product of the predetermined gene derived from one cell.
- a cellular barcode has a nucleotide sequence unique to the cell in the center thereof (however, nucleotide sequences with a specific position can be designed to be the same sequences among the sequences) and can have a nucleotide sequence at either end to hybridize with an amplification primer.
- the nucleotide sequence to hybridize with an amplification primer can be a common sequence among cellular barcodes.
- the primers for amplification of the cellular barcode can have nucleotide sequences hybridizable with an adapter sequence for sequencing and one end of the cellular barcode under a gene amplification environment.
- a primer for amplification of the cellular barcode can further have an index sequence for identifying the type of a sample.
- the other primer for amplification of the cellular barcode can have a linker sequence for linking to the predetermined gene and a nucleotide sequence hybridizable with the other end of the cellular barcode under a gene amplification environment.
- a primer for amplification of the predetermined gene can have a nucleotide sequence to hybridize with a linker sequence contained in a primer for amplification of the cellular barcode and a nucleotide sequence to hybridize with a nucleotide sequence of the predetermined gene at the amplification site under a gene amplification environment.
- the other primer for amplification of the predetermined gene can contain a nucleotide sequence to hybridize with a nucleotide sequence of the predetermined gene at the amplification site under a gene amplification environment and a sequencing adapter sequence.
- the other primer for amplification of the predetermined gene can further have an index sequence unique to the sample to identify the type of the sample.
- the amplification product of the cellular barcode and the amplification product of the predetermined gene have the same linker sequence. Therefore, an amplification product of a linked product of the amplification product of the cellular barcode and the amplification product of the predetermined gene can be obtained during the gene amplification.
- a sequencing adapter sequence can contain a sequence for bridging PCR before sequencing at both ends.
- the sequencing adapter sequence can contain a site of binding to a sequencing primer.
- the sequencing adapter sequence can contain an index sequence unique to the sample to identify the type of the sample.
- the bridging PCR is a technique to hybridize DNA subjected to sequencing which has a sequence hybridizable with each of two types of solid-phase oligo DNA at either end and amplifying the DNA on a solid-phase surface by PCR in this state.
- the present invention also provides a droplet population including aqueous droplets which comprise the amplification product of a predetermined gene derived from one cell, wherein one type of a cellular barcode unique to the cell is linked to each molecule of the predetermined gene.
- each droplet comprises the predetermined gene derived from one different cell and one type of a cellular barcode unique to the cell (that is, a different cellular barcode is contained in each droplet).
- a linked product linked to one type of a cellular barcode unique to the cell can comprise a sequencing adapter sequence, a cellular barcode sequence, a linker sequence, all or some of the nucleotide sequences of the predetermined genes, and a sequencing adapter sequence in this order, as described above.
- This linked product may further contain an index sequence having a nucleotide sequence unique to the sample.
- the index sequence can be flanked by any two of the sequencing adapter sequence, the cellular barcode sequence, the linker sequence, all or some of the nucleotide sequences of the predetermined genes, and the sequencing adapter sequence.
- the index sequence may be contained instead of a sequencing adapter sequence or in addition to the sequencing adapter sequence.
- a linked product of each molecule of the amplification product of the predetermined gene derived from one cell and the amplification product of one type of a cellular barcode unique to each cell can be prepared.
- the predetermined gene is preferably of one type, but not limited to one type and can be of a plurality of types.
- the cellular barcode is preferably of one type for each cell.
- the determined nucleotide sequence of the predetermined gene and the nucleotide sequence of the cellular barcode are linked and managed for a certain linked product. It is estimated based on this link that the predetermined genes to which the identical cellular barcode is linked are derived from the identical cell. Therefore, the sequencing method of the present invention can further comprise obtaining a combination of nucleotide sequences comprising the determined nucleotide sequence of the predetermined gene and the nucleotide sequence of the cellular barcode for each linked product.
- sequencing method of the present invention can further comprise estimating that the predetermined genes to which the identical cellular barcode is linked are derived from the identical cell.
- the predetermined gene is an endogenous gene of a microorganism and can be preferably a gene widely shared by various species evolutionally, such as, for example, a housekeeping gene.
- the housekeeping gene is a gene which is essential for energy metabolism and cell function and expressed or may be expressed in every cell.
- Housekeeping genes are not particularly limited, but examples thereof include ribosomal RNA (rRNA for example, 16S rRNA and 23S rRNA), ribosomal intergenic transcribed spacer (ITS), which exist between 16S rRNA and 23S rRNA, putative ABC transporter (abcZ), adenylate kinase (adk), shikimate dehydrogenase (aroE), glucose-6-phosphate dehydrogenase (gdh), single-function peptidoglycan transglycosylase (mtg), putative dehydrogenase subunit (pdhC), phosphoglucomutase (pgm), regulator of pilin synthesis(pilA), proline iminopeptidase (pip), polyphosphate kinase (ppk), and 3-phosphoserine aminotransferase (serC) (refer to Maiden et al., PNAS, Vol.95, 3140-3145, 1998 ).
- the sequences of these genes can be used in analyses of microbiotas. Further, 18S rRNA can also be used in analyses of fungi. If two or more types of genes are predetermined, an amplification reaction is performed using suitable primers and reaction conditions, so that each gene is linked to the cellular barcode. Since a cell population is analyzed based on the nucleotide sequence of the predetermined gene in the method of the present invention, it is advantageous to use a gene found in as many cells as possible as the predetermined gene.
- the predetermined gene can be the gene coding for 16S rRNA.
- the nucleotide sequence of the predetermined gene can be a full-length or partial sequence of the gene. For example, in the case of 16S rRNA, the sequence to be determined does not have to be a full length and may be a portion thereof.
- the V3 region and the V4 region can be used as a portion of 16S rRNA.
- the predetermined gene may be two or more types of different genes (or a group of two or more genes that are non-homologous to each other).
- sequencing can be performed by destroying droplets and mixing solutions contained in all droplets.
- sequencing can be performed using methods known to those skilled in the art.
- sequencing can be performed in parallel using a next-generation sequencer (e.g., MiSeq and HiSeq of Illumina, Inc.).
- a next-generation sequencer e.g., MiSeq and HiSeq of Illumina, Inc.
- the sequencing method of the present invention may further comprise collecting DNA in solutions before sequencing.
- DNA can be collected by collecting the aqueous phase separately contained in each droplet.
- DNA can be collected by adding the obtained droplet population to an organic solvent (e.g., chloroform) and preferably further an aqueous solution (for example, buffer solutions, e.g., a Tris buffer solution containing a divalent metal ion chelator (e.g., Ca 2+ chelator and Mg 2+ chelator, for example, ethylenediamine tetraacetic acid (EDTA)) (i.e., Tris-EDTA buffer solution or TE solution)), stirring the mixture well, separating the aqueous phase and the organic phase, and collecting the aqueous phase.
- aqueous solution for example, buffer solutions, e.g., a Tris buffer solution containing a divalent metal ion chelator (e.g., Ca 2+ chelator and Mg 2+ chelator, for
- target DNA i.e., the linked product
- target DNA discretely present in each compartment of a droplet in water-in-oil droplet type particles
- aqueous solution thus obtained, all linked products derived from the contained droplets are mixed in the solution (a solution not divided into compartments by oil) (in other words, a state in which linked products discretely present in each droplet compartment exist in one solution compartment). Since nucleotide sequences of a large number of gene fragments can be decoded in parallel in sequencing as described above, a solution in which a large number of DNA are mixed is suitable for sequencing.
- the sequencing method of the present invention may further comprise purifying DNA before sequencing.
- DNA can be purified by gel filtration of the aqueous solution obtained by the above-described collection step. Gel filtration can be performed by techniques usually used to separate the DNA amplification product and other components in the solution (e.g., an unlinked barcode amplification product, primers not used for amplification, others) using gel filtration columns or the like. For example, gel filtration columns for DNA purification can be used as gel filtration columns.
- the sequencing method of the present invention may further comprise purifying DNA contained in a solution by using columns or beads coated with a carboxyl group.
- Dehydrated DNA can be adsorbed specifically to the columns or beads coated with a carboxyl group via a salt, and then can remove DNA from the columns by hydration.
- Agencourt AMPure XP (Beckman Coulter, Inc.) or the like can be used as the beads coated with a carboxyl group.
- a tag e.g., biotin
- a tagged DNA amplification product can be concentrated or removed using columns or beads to which a molecule binding to the tag (e.g., tag-binding molecules such as avidin, streptavidin, and NeutrAvidin) is linked.
- the sequencing method of the present invention can preferably comprise removing cellular barcodes and predetermined genes that have failed to be linked.
- one primer for amplification of a cellular barcode and one primer for amplification of a predetermined gene can be designed so that they have a tag and a complementary sequences.
- a tag can be attached to only each of the primers designed to have complementary sequences.
- one of two primers for amplification of a cellular barcode which has a sequence complementary to one of two primers for amplification of a predetermined gene (this one primer has a tag molecule) has a tag molecule.
- the tag molecule is lost from the linked product of the cellular barcode and the predetermined gene during amplification of the cellular barcode and the predetermined gene, and the tag molecule is to remain in only amplification products that have failed to be linked. Therefore, the amplification products that have failed to be linked can be removed by affinity using columns and beads to which a tag-binding molecule binds, and the amplification product of the linked product can be thereby purified in higher purity.
- the sequencing method of the present invention may comprise eliminating a nucleotide sequence region with low sequencing quality.
- the sequencing method of the present invention may further comprise (C-1) clustering the determined nucleotide sequences based on nucleotide sequence of the cellular barcode to obtain a plurality of first clusters.
- the "determined nucleotide sequences” can be a combination of nucleotide sequences comprising the determined nucleotide sequence of the predetermined gene and the nucleotide sequence of the cellular barcode.
- Clustering the determined nucleotide sequences based on the determined nucleotide sequence of the cellular barcode can include not only clustering the nucleotide sequences of the cellular barcodes according to whether they are completely identical sequences, but also clustering sequences having some difference into the same cluster.
- sequences having some difference are clustered into the same cluster.
- errors that occur during the amplification reaction or sequencing are empirically well known. It is effective to cluster sequences having some difference into the same cluster not to distinguish identical sequences as different sequences because of the errors corresponding to such errors.
- nucleotide sequences derived from one cell are clustered correctly into one cluster if neither amplification error nor sequencing error exists. Therefore, there is no problem in such a case.
- nucleotide sequences derived from one cell can be incorrectly clustered into two or more clusters as those derived from different cells, when clustering is performed according to the criterion that the determined nucleotide sequences of the cellular barcodes are completely identical (distance 0).
- nucleotide sequences derived from one cell are to be correctly clustered into one cluster even if an addition, elimination, deletion, or insertion (in particular, indel) of up to n nucleotides arises from an amplification error or a sequencing error.
- n can be a natural number of 1 to 5
- nucleotide sequences derived from one cell are to be correctly clustered into one cluster even if an addition, elimination, deletion, or insertion (in particular, indel) of up to n nucleotides arises from an amplification error or a sequencing error.
- n can be a natural number of 1 to 5
- n When n is set to be large, the cellular barcodes can be designed to be always different for each cell by more than n nucleotides. In one embodiment of the present invention, n can be set as 1. In another embodiment of the present invention, n can be set as 2. In yet another embodiment of the present invention, n can be set as 3. Even if an addition, elimination, deletion, or insertion (in particular, indel) of up to n nucleotides occurs, the cellular barcode from which a nucleotide sequence having such an error is derived can be determined by designing the determined nucleotide sequences of the cellular barcodes so that the sequences are very different for each cell. Clustering can be expected to have an effect of reducing such impacts of experimental errors. Clustering can be performed with reference to WO 2018/235938 , which is incorporated into the present specification as a whole.
- the predetermined genes derived from the identical cell can be determined by clustering the determined nucleotide sequences (including amplification products of the cellular barcodes and the predetermined genes) based on the nucleotide sequence of the identical cellular barcode. If only one predetermined gene exists in a cell, in theory, only one sequence is detected for the predetermined gene in the first cluster obtained in the above (C-1).
- the first cluster obtained in the above (C-1) can include two or more sequences (paralogs) for the predetermined gene. Therefore, in the method for analyzing a cell population of the present invention further comprising the above (C-1), the existence of cells having a multiplication(copy, paralog, or the like) of the predetermined gene can be detected in the cell population.
- the number of cells is, in theory, equal to the number of cellular barcode types or the number of clusters obtained based on the nucleotide sequence of the cellular barcode. Therefore, there is an advantage that the multiplication of the predetermined gene in one cell would not affect the accuracy of the number of cells to be calculated.
- the method for determining the gene sequences included in the cell population of the present invention may further comprise (D-1) estimating the number of cells included in the cell population or the number of cells having a specific predetermined gene from the obtained number of the first clusters.
- the determined nucleotide sequences were clustered based on the nucleotide sequence of the cellular barcode to obtain a plurality of first clusters.
- the method for analyzing a cell population of the present invention can comprise clustering the nucleotide sequences determined based on the determined nucleotide sequence of the predetermined gene.
- the method for analyzing a cell population of the present invention may further comprise (C-2) clustering the nucleotide sequences determined based on the determined nucleotide sequence of the predetermined gene to obtain a plurality of second clusters.
- Clustering nucleotide sequences determined based on the nucleotide sequence of the predetermined gene to obtain a plurality of second clusters can comprise not only clustering sequences according to whether they are completely identical, but also clustering sequences having some difference into the same cluster.
- the reason for clustering sequences having some difference into the same cluster is that errors can occur in sequences during the amplification reaction or sequencing of the cellular barcode in experiments.
- the nucleotide sequences derived from one cell are clustered correctly into one cluster if neither amplification error nor sequencing error exists.
- n can be a natural number of 1 to 5
- nucleotide sequences derived from one type of a gene are to be clustered into the same cluster even if the addition, elimination, deletion, or insertion (in particular, indel) of up to n nucleotides arises from an amplification error or a sequencing error.
- n can be set as 1.
- n can be set as 2.
- n can be set as 3.
- n can be suitably selected by those skilled in the art.
- the number of the obtained clusters corresponds to the number of the types of the predetermined genes.
- the sequences of predetermined genes are not understood for all microorganisms.
- the cell population may include unknown microorganisms. This is because the unknown microorganisms can be treated as different microorganisms from known microorganisms as long as the unknown microorganisms have a predetermined gene having a nucleotide sequence that can distinguish them from other microorganisms.
- the nucleotide sequence of the predetermined gene in an unknown microorganism is different from the sequence of a known predetermined gene only by a distance of n or less, it is possible in the above-mentioned method that the unknown gene and the known gene may be clustered into the same cluster and may be estimated to be derived from the identical gene even if they have essentially different nucleotide sequences.
- the above (C-2) can further comprise a further step: (C-2 ⁇ ) determining the most abundant nucleotide and determining the second most abundant nucleotide at one position of different nucleotide sequences when different nucleotide sequences of the predetermined genes are included in one cluster, and clustering nucleotide sequences having the most abundant nucleotide and nucleotide sequences having the second most abundant nucleotide into separate clusters when the ratio (Ratio2nd) of the number of nucleotide sequences (i.e., the number of reads) having the second most abundant nucleotide to the number of nucleotide sequence (i.e., the number of reads) having the most abundant nucleotide at the position is a predetermined value or higher.
- Step (C-2 ⁇ ) can be continued until Ratio2nd, a difference in nucleotide sequences, becomes lower than a predetermined value for all nucleotide sequences.
- the predetermined value can be a number of, for example, 0.6 or higher, 0.65 or higher, 0.7 or higher, 0.75 or higher, or 0.8 or higher. This is because, if the nucleotide sequence really exists, it should be contained in a plurality of cells and would be detected with a certain proportion. Meanwhile, since errors occur in low frequency, errors and originally existing sequences can be distinguished by this assessment.
- the above-mentioned number of reads may be weighted by the quality score for the nucleotide sequence of the predetermined gene.
- the quality score can be a score determined based on, for example, the Phred algorithm, for example, a Phred quality score, or, for example, Q score.
- the quality score is lower than the predetermined value, the number of reads may be weighted with a low value (for example, 0).
- the quality score is higher than the predetermined value, the number of reads may be weighted with a high value (for example, depending on the value of the score). This is as described in Step 3.2 in the Examples.
- nucleotide sequence having the most abundant nucleotide is designated as a "representative nucleotide sequence" (RepSeq) of the cluster.
- a shift of nucleotides is found for different RepSeqs (in other words, two nucleotide sequences match when the nucleotide sequences are shifted)
- a RepSeq found in more first clusters is designated as Mother
- a RepSeq found in less first clusters is designated as Shift.
- the clusters have the nucleotide sequence of Mother.
- the count (number of reads) of the shifted nucleotide sequences can be added to the number of reads in the Mother RepSeq. This is done as described in Step 5 in the Examples.
- Step (C-2 ⁇ ) may further comprise excluding nucleotide sequences detected only with a single read as an error.
- the present invention can (D-2) estimate the number of types of cells included in a cell population (how many types of cells are included in a cell population) from the number of the obtained second clusters.
- the method for determining gene sequences included in a cell population of the present invention may further comprise (C-3) clustering the determined nucleotide sequences based on the determined nucleotide sequence of the cellular barcode to obtain a plurality of first clusters, and clustering the determined nucleotide sequences based on the determined nucleotide sequence of the predetermined gene to obtain a plurality of second clusters.
- a second cluster may be formed for each first cluster, or a first cluster may be formed for each second cluster.
- the method for determining gene sequences included in a cell population of the present invention may further comprise (D-3) determining a first cluster into which the nucleotide sequence of the predetermined gene is classified from the nucleotide sequence of the cellular barcode linked to nucleotide sequence of the predetermined gene classified into at least one second cluster based on information about a combination of the obtained nucleotide sequence of the cellular barcode and the nucleotide sequence of the predetermined gene, and estimating the number of cells classified into the second cluster from the number of the first clusters into which the cellular barcode is classified.
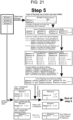
- the nucleotide sequences of the predetermined genes were classified: out of two nucleotide sequences with a distance of n (e.g., two nucleotide sequences having a difference of one loss or deletion (i.e., 1-indel) in the central portion of the sequence), a nucleotide sequence classified into more first clusters is designated as Mother (that is, a nucleotide sequence detected in more cells is designated as Mother), and the other one classified into less first clusters is designated as 1-Indel.
- n e.g., two nucleotide sequences having a difference of one loss or deletion (i.e., 1-indel) in the central portion of the sequence
- a nucleotide sequence classified into more first clusters is designated as Mother (that is, a nucleotide sequence detected in more cells is designated as Mother)
- the other one classified into less first clusters is designated as 1-Indel.
- the number of first clusters in which the number of reads in Mother is more than the number of reads in 1-Indel (No Mother ) and the number of first clusters in which the number of reads in Mother is less than the number of reads in 1-Indel (No 1-Indel ) are compared. If No Mother is larger than No 1-Indel , the pair of Mother and 1-Indel can be kept. Further, if the ratio of No 1-Indel to the number of first clusters including both Mother and 1-Indel is smaller than a predetermined value (e.g., (No 1-Indel - 3) /No 1-Indel ), the pair of Mother and 1-Indel can be kept.
- a predetermined value e.g., (No 1-Indel - 3) /No 1-Indel
- the number of reads in 1-Indel can be added to the number of reads in Mother. Further, if two different Mothers exist for the same 1-Indel, the number of reads can be added to Mother found in more first clusters. Further, if there is a first cluster in which 1-Indel alone is detected without Mother, the number of reads in 1-Indel can be assumed as the number of reads in Mother in the cluster. This is done as described in Step 7 in the Examples.
- one amplification product may be linked to another amplification product during the process of gene amplification, and the resulting occurrence of a chimeric molecule can be a problem.
- the method of the present invention can further comprise identifying the chimeric molecules.
- Chimeric molecules can be identified as follows. For example, if the ratio (N_d/Total_N) of the number of first clusters including only chimeric molecules and not including Parents (N_d) to the number of first clusters including a chimeric molecules (Total_N) is a certain value or lower which is lower than 1, these chimeric molecules are considered to have arisen from errors and can be excluded from RepSeqs. This is done as described in Step 8 in the Examples.
- the method of the present invention may further comprise creating a cell-based operational taxonomic unit (cOTU).
- cOTU cell-based operational taxonomic unit
- the numbers and types of microorganisms included in a cell population are often unknown. Further, when unknown microorganisms exist, analyses of gene sequences in the cell population would be insufficient with information about known gene sequences registered in databases alone.
- OTU operational taxonomic unit
- an error occurs because the count of the microorganism species would be n times more than the correct count.
- cOTUs are formed from the information of RepSeqs to reduce the above-mentioned error in the count obtained when cells having a gene multiplication are included in the cell population.
- cOTU is a classification unit for microorganisms classified by the nucleotide sequence of the predetermined gene and a technical means for more detailed classification of microorganisms that was able to be classified only into high-order taxa so far.
- This technique is particularly useful for analyzing a cell population including microorganisms that have not been classified in details or unidentified microorganisms. If classification is possible, it would be advantageous because differences between cell populations can be compared based on the classification.
- a cOTU can be formed as follows. Specifically, as in conventional methods, one second cluster can be assumed as one cOTU. In consideration that two or more second clusters are included in one cell, however, the present invention can further comprise classifying a plurality of second clusters linked to the identical cellular barcode into one cOTU.
- the method of the present invention may further comprise, for example, (C-4) classifying second clusters into an identical cell-based operational taxonomic unit (cOTU, i.e., an identical cell type) when sequences classified into an identical first cluster are classified into different second clusters.
- COTU cell-based operational taxonomic unit
- This formation of cOTUs may further comprise excluding experimental errors (for example, when two cells are contained in one droplet and analyzed, the nucleotide sequences of the predetermined gene derived from two cells are thereby detected in one first cluster).
- the probability that two cells get mixed in one droplet follows the Poisson distribution. Since the above-mentioned error type A appears to be an error that depends on the cell concentration during the preparation of droplets, it is considered that the error frequency can be reduced by reducing the cell concentration during preparation of droplets (a concentration at which cells are contained in 20% of droplets was used in the Examples). Additionally, the probability that two nucleotide sequences exist in different cells but are contained in one droplet during the operation, in theory, follows the Poisson distribution.
- RepSeqs labeled with one cellular barcode (RepSeqs may be sequences after elimination of various errors in the above-described steps, which is preferred) exist, all these RepSeqs are picked up.
- the number of droplets containing two RepSeqs is expressed as (Overlap).
- the probability that two RepSeqs derived from different cells are contained in one droplet can be expressed as (A ⁇ B ⁇ ⁇ )/total number of droplets, wherein the total number of cells is the total number of droplets containing the cellular barcode, A is the number of droplets containing one RepSeq, B is the number of droplets containing the other RepSeq, and ⁇ is an integrated parameter for detection efficiency in droplets that can include PCR amplification efficiency, sequencing depth effect, and the like.
- the results of RepSeqs for the same microorganism are considered the same in different samples. Therefore, even if it is reproduced in different samples, a plurality of different cell population samples can be measured to obtain the ratio of the number of samples for which the value of log 10 (Overlap) to the number of samples including two RepSeqs is outside the confidence interval of log 10 (Poission_Overlap). If this ratio is larger than a certain value (for example, a certain value can be a number of 0.4 or more), it can be estimated that two RepSeqs are derived from one cell.
- a certain value for example, a certain value can be a number of 0.4 or more
- the predetermined gene is 16s rRNA
- a predicted taxon having the highest score can be created by classification using the RDP classifier or machine learning using a training set of 16s rRNA in the RDP classification, and this taxon can be used as a cOTU.
- the RDP classifier is a tool for determining a microorganism species from the nucleotide sequence of 16S rRNA developed by the Ribosomal Database Project.
- the method of the present invention may further comprise correcting (or standardizing) the total number of cells calculated by the method of the present invention using the total number of cells estimated from the count obtained by optical microscopy or the like.
- the precision of predicting the number of cells e.g., the number of cells in a specific cluster or the number of cells in a specific cOTU) calculated by the method of the present invention can be improved by correcting (or standardizing) the total number of cells.
- the method of the present invention can be used for a comparison of two different cell populations. Further, the method of the present invention can further comprise (E) for each of a first cell population and a second cell population that is different from the first cell population, estimating (i) the number of cOTUs and/or (ii) the number of cells included in a specific cOTU included in the cell population, and comparing (i) the number of cOTUs and/or (ii) the number of cells included in the specific cOTU estimated for the first cell population with (i) the number of cOTUs and/or (ii) the number of cells included in the specific cOTU estimated for the second cell population.
- the numbers of cells in the cell populations to be compared can be made equal beforehand.
- the characteristics of each cell population can be described in view of cOTUs by comparing the number of cOTUs and the number of cells included in each cOTU between two different cell populations.
- Two cell populations can be, for example, cell populations isolated from an identical site of an identical subject at different timepoints, can be cell populations isolated from different sites of an identical subject at an identical timepoint, or can be cell populations isolated from an identical site of different subjects at an identical timepoint.
- cell populations isolated from an identical site of different subjects at an identical timepoint are compared by the above-described (E), differences associated with the subjects (e.g., health condition, sex, region, race) are to be described in view of cOTUs.
- the method of the present invention may further comprise (F) comparing (i) the number of cOTUs and (ii') the number of cells included in a specific cOTU which are estimated for the first cell population with (i) the number of cOTUs and (ii') the number of cells included in a specific cOTU which are estimated for the second cell population.
- a correlation between the number of cOTUs estimated for the first cell population and the number of cOTUs estimated for the second population can be determined.
- one or more specific cOTUs estimated for the first cell population and one or more cOTUs estimated for the second cell population which correspond to the one or more cOTUs can be compared.
- whether a cOTU estimated from one cell population corresponds to a cOTU estimated from another cell population can be checked by confirming whether all nucleotide sequences (or nucleotide sequences after correction of errors) included in the cOTU are identical.
- whether an increase or decrease in the number of cells included in each cOTU correlates positively or negatively or does not correlate (weakly correlate) with an increase or decrease in the number of cells included in other cOTUs can be determined. By doing this, the network between cOTUs can be estimated.
- cell populations (these cell populations include a plurality of cOTU taxa, and the number of cells has been determined for each cOTU taxon) can be compared using various indices which serve as indices for similarity between groups.
- the similarity between the first cell population and the second cell population can be obtained as the root mean square of a difference in the number of cells included in each cOTU (c.f., Euclidean distance).
- the similarity between the first cell population and the second cell population can also be obtained as the sum of absolute values of a difference in the number of cells included in each cOTU (c.f., Manhattan distance).
- the cell populations are shown to be more dissimilar as these numerical values are larger.
- Bray-Curtis dissimilarity is a standardized Manhattan distance.
- the Bray-Curtis index is 1 when two groups are completely different and 0 when they completely match.
- the Bray-Curtis index may be referred to as dissimilarity because this index has been designed to become larger when the groups are more different.
- the Bray-Curtis index can be calculated using a statistical processing program (e.g., R package vegan function such as, for example, vedist function).
- R package vegan function such as, for example, vedist function
- similarity can be assessed using assessment indices commonly used in the field of synecology, such as Morishita index, Jaccard index, and Chao index.
- the standard deviation and the confidence interval of the estimated similarity can be assessed by the bootstrap method and the like.
- the method of the present invention can further comprise (G) performing hierarchical clustering for cOTUs.
- Hierarchical clustering can be performed by methods known to those skilled in the art based on, for example, the intensity of correlation between cOTUs (e.g., Spearman correlation coefficient r).
- Hierarchical clustering may be performed by methods known to those skilled in the art based on the distance between cOTUs calculated from r. The distance can be calculated by, for example, 1 - minimum (
- the results of hierarchical clustering can be expressed as evolutionary trees. This can be performed by, for example, R package hclust or Pheatmap.
- a network of cOTUs with a Pearson correlation coefficient r being a threshold or higher can be illustrated using a package igraph.
- correlations between cOTUs can be illustrated based on the relationship of cOTUs in a plurality of cell populations.
- cOTUs correspond to known microorganisms
- correlations between known microorganisms can be characterized. Even if cOTUs correspond to unknown microorganisms, correlations between cOTUs can be characterized.
- one cOTU corresponds to one known microorganism
- a correlation between the known microorganism and another microorganism (this another microorganism may be unknown or known) can be characterized.
- two correlating cOTUs correspond to two known microorganisms, they can be used to find a new correlation between two known microorganisms and the like.
- the method of the present invention can be used to characterize correlations between microorganisms by investigating a plurality of cell populations (e.g., a plurality of microbiota).
- the health condition of a subject may correlate with the microbiota in the subject. Therefore, by further investigating a correlation between the health condition of a subject and one cOTU, the health condition of the subject can be predicted from a cOTU corresponding to an unknown microorganism even if the cOTU itself is the unknown microorganism (it should be noted that the cOTUs themselves are common among different samples).
- the precision of predicting the health condition of the subject from cOTUs can be improved by further investigating a correlation of the cOTU with another correlating cOTU.
- the present invention provides a method for describing a microorganism using a new group concept of cOTU even if one microorganism has a plurality of predetermined genes. Further, the number of cells included in each cOTU can be accurately counted by counting the number of cells using a cellular barcode qualitatively for each cOTU.
- the type of cOTUs included therein and the number of cells included in each cOTU can be obtained.
- a cell population including unknown microorganisms can also be analyzed in further detail using information of the unknown microorganisms by analyzing the obtained cell population, types of cOTUs, and the number of cells included each cOTU.
- the present invention has an advantage that analytical precision is not deteriorated even if the gene copy number varies depending on the cell.
- the gene copy number in a cell may vary in an identical microorganisms.
- the gene copy number might affect the cell count in conventional methods. Since the number of cells is counted qualitatively using the cellular barcode in the method of the present invention, cells can be counted without being affected by gene copy numbers in the cell. Some microorganisms release substances that affect the environment (e.g., toxic substances and growth factors). Measuring the number of cells accurately enables more accurate estimation of the amount of the released substances and can pave the way for developing a mathematical modeling based on the volume of the released substances.
- the gene to be sequenced may be one specific type of a gene or a plurality of types of genes. In the method of the present invention, the gene to be sequenced does not need to be the whole genome.
- nucleotide sequences of all the genes coding for 16S rRNA included in the cell population are sequenced in the analysis of 16S rRNA, and the obtained nucleotide sequences are classified based on a threshold. For example, 97% is selected as a threshold for identity, and analyses are performed assuming that genes with identity of 97% or higher are the same gene. In such analyses, however, microorganisms that should belong to biologically different taxa by nature, such as different species, different genera, or different families, were to be recognized as one group. However, the method of the present invention can determine whether a new 16S rRNA is truly new or arises from an experimental error.
- an identical sequence found in a plurality of cells can be a sequence that exists by nature, and it can be confirmed using a cellular barcode.
- the method of the present invention can be an assessment method that is not affected by the similarity of nucleotide sequences when the nucleotide sequences are different.
- a mock microbiota composed of known bacteria at known concentrations (herein referred to as "a mock cell population”) was prepared to verify the assay system, and then an actual microbiota (here the cecal microbiota) was investigated.
- a mock cell population comprising human intestinal bacterial strains (ATCC29098, ATCC700926, DSM14469, JCM1297, JCM5824, JCM5827, JCM9498, JCM10188, JCM14656, and JCM17463) was prepared.
- Table 1 lists the names, supply sources, media, and culture conditions of these strains.
- Cultured bacteria were preserved in the original medium with 10% glycerol or in phosphatebuffered saline (PBS) at -80°C until experiments (Table 1). After cultured, JCM14656 and DSM14469 were centrifuged and washed once with PBS.
- JCM10188 was cultured on GAM agar (Nissui), and bacterial colonies were collected and vortexed at 3,200 rpm for 1 minute to suspend the bacterial cells in PBS (VORTEX GENE 2; Scientific Industries).
- mice Ten strains were diluted with PBS and mixed at prespecified concentrations in a class II biosafety cabinet (Table 1). Following each step of dilution and mixing, the mixture was vortexed at 3,200 rpm for 1 minute. This mixture of 10 strains is referred to as a "mock cell population.” The mock cell population was preserved at - 80°C until experiments.
- Table 1 Names, supply sources, media, and culture conditions of bacterial strains Bacterial name Strain ID Supply source Medium Culture condition Wash Preservation Concentration* Phylum Gram positive/ negative** Collinsella aerofaciens JCM 10188 RIKEN BRC GAM Agar Anaerobic condition - ## 7.8 ⁇ 2.7 ⁇ 10 2 Actinobacteria + Bacteroides caccae JCM9498 RIKEN BRC GAM Anaerobic condition - # 3.7 ⁇ 1.1 ⁇ 10 4 Bacteroidetes - Bacteroides ovatus JCM5824 RIKEN BRC GAM Anaerobic condition - # 3.3 ⁇ 1.3 ⁇ 10 2 Bacteroidetes - Bacteroides thetaiotaomicron JCM5827 RIKEN BRC GAM Anaerobic condition - # 3.8 ⁇ 1.1 ⁇ 10 4 Bacteroidetes - Blautia hydrogenotrophica JCM 14656 RIKEN BRC GAM Anaerobic condition PBS ## 1.3 ⁇ 0.5 ⁇
- the concentration of each strain was measured by fluorescence imaging under a microscope. Fluorescencestained bacteria were measured using polystyrene microspheres (Bacteria Counting Kit; Thermo Fisher Scientific). Bacterial cells were heated at 70°C for 5 minutes and stained using propidium iodide (Thermo Fisher Scientific). The volume was calculated based on the microsphere concentration measured using a bacteria cell counting chamber (SomaLogic, Inc.). Five independent measurements were performed for each bacterial strain. The mean concentration and the standard deviation (as an error bar) of these five measurements were used to calculate the concentration of each bacterial strain in the mock cell population.
- Table 2 Designing cell counts and absolute concentrations for the mock cell population Lineage ID cOTU ID Number of cells (a) Number of cells (b) Number of cells (c) Mean Standard deviation Absolute concentration (cells/ ⁇ L) Standard deviation ATCC700926 COTU-MK-01 4815: 4918 4855 4863 52 1.63E+04 2E+02 JCM9498 CCTU MK-02 9639 10181 10353 10058 372 3.36E+04 1.2E+03 JCM5827 COTU-MK-03 7712 7461 7459 7544 145 2.52E+04 5E+02 JCM17463 COTU-MK-04 5185 4773 4796 4918 232 1.64E+04 8E+02 ATCC29098 COTU-MK-05 517 555 477 516 39 1.73E+03 1.3E+02 JCM 10188 COTU-MK-06 132; 138 125 132 6 4.40E+02 2.2E+01 DSM14469 COTU-MK-07 21
- the 16S rRNA gene of each strain was amplified using 2 ⁇ KAPA HiFi HotStart ReadyMix (Roche) and primers F1-full-Fw and F3-full-Rv (Table 3). Subsequently, the amplified 16S rRNA gene was cloned in a pCR-Blunt II-TOPO vector and amplified with E. coli using Zero Blunt TOPO PCR Cloning Kit (Thermo Fisher Scientific). Subsequently, the 16S rRNA gene was amplified from each single colony of E. coli using T7-Promoter and SP6-Promoter as primers (Table 3). Finally, the V3-V4 region of the 16S rRNA gene amplified from each colony was sequenced by Sanger sequencing (Fasmac Co., Ltd.) using the F2-Rv primer (Table 3).
- mice All treatments of mice were conducted in accordance with the protocol approved by the Animal Experiments Committee of Institute of Physical and Chemical Research and the institute's ethical guideline. Mice which maintained the condition were as follows: Six-week-old male C57BL6/J mice were purchased from CLEA Japan and maintained in the same cage at Institute of Physical and Chemical Research for 3 days by feeding CE-2 feed (CLEA Japan) before sampling.
- the murine cecum was removed out of the body by an operation within 10 minutes after cervical dislocation under anesthesia with sevoflurane.
- the cecal content from different sites ( Figure 2a ) was sliced with sterilized scissors for sampling.
- the sampling step was performed in a class II biosafety cabinet within 10 minutes after the operation.
- a sample from each site of each mouse was collected into a DNA LoBind Tube (Eppendorf).
- Eppendorf DNA LoBind Tube
- two empty test tubes were used.
- the weight of the sample was measured (ranged from 8.57 to 19.82 mg for all samples) immediately after collection into the DNA LoBind Tube.
- each sample was dispersed in added PBS (50 ⁇ L per mg), and the dispersion was vortexed at 3,200 rpm for 1 minute to mix.
- the suspended sample was preserved at 4°C until subsequent experiments.
- the murine cecal sample was diluted in 1 mL of PBS per mg of the cecal content, and then the mixture was vortexed at 3,200 rpm for 1 minute.
- PBS was added to an empty tube.
- 400 ⁇ L of the diluted sample was filtered by centrifugation (10,000 g, 10 minutes, 4°C) using Ultrafree-MC Centrifugal Filter (Merck) having a pore size of 0.22 ⁇ m.
- a volume of 400 ⁇ L of fresh PBS was added to the sample remaining on the membrane, the sample was suspended by pipetting, and the total volume was transferred to a fresh DNA LoBind Tube. Subsequently, the sample suspension was vortexed at 3,200 rpm for 1 minute.
- Extracellular DNA contained in the sample suspension and the fluid that passed through the filter were preserved at 4°C until subsequent measurements.
- the appropriateness of DNA isolation using a 0.22- ⁇ m filter was confirmed because the amount of extracellular DNA in the fluid that passed through the filter was virtually equal, with no cells detected in the fluid that passed through the filter, and the amounts of bacteria collected from the top of the filter after filtration were equal as compared with use of a filter having a pore size of 0.1 ⁇ m, and the amount of bacteria collected from the filter correlated to the number of bacteria obtained by digital PCR (see Figure 31 ) .
- the total concentration of cellular or extracellular 16S rRNA genes was measured by Droplet Digital TM PCR (ddPCR) (Bio-Rad) using primers F1-Fw and F1-Rv (Table 3).
- the concentration of four equimolar mixed cellular barcode templates (Table 3; each template containing 24 random nucleotides was designed according to our previous publication, 25 and the number of random nucleotides was sufficient to distinguish individual cells measured in a single MiSeq sequencing operation) was also measured by ddPCR using primers NoBiotin-Link-barcode-F and P5-index-R1P-barcode-R (Table 3).
- ddPCR was performed in accordance with the user manual of QX200 TM ddPCR TM EvaGreen (trademark) Supermix (Bio-Rad).
- a total of approximately 240,000 cells (or 20,000 copies of extracellular 16S rRNA gene) were mixed with 960 ⁇ L of a solution containing equimolar mixed cellular barcodes, primers (400 nM P7-R2P-341F, 400 nM P5-index-R1P-R, 10 nM Biotin-link-805R, and 10 nM Biotin-Link-F), ddPCR TM Supermix for Probes (No dUTP) (Bio-Rad), 128 units of Platinum Taq (Invitrogen), and 100 nM NTP.
- primers 400 nM P7-R2P-341F, 400 nM P5-index-R1P-R, 10 nM Biotin-link-805R, and 10 nM Biotin-Link-F
- ddPCR TM Supermix for Probes No dUTP
- Bio-Rad Bio-Rad
- 128 units of Platinum Taq Invitrogen
- the mixture solution was vortexed at 3,200 rpm for 1 minute and then encapsulated into droplets by a Bio-Rad droplet generator, and 30 ⁇ L of the mixture solution and 80 ⁇ L of Droplet Generation Oil for Probe (Bio-Rad) were loaded in each channel of the DG8 TM Cartridge (32 channels were used for each sample).
- Bio-Rad Droplet Generation Oil for Probe
- To measure the mock cell population approximately 600,000 cells were mixed with 2,400 ⁇ L of a solution containing approximately 600,000 copies of the cellular barcodes, 320 units of Platinum Taq, and primers, dNTPs, and ddPCR TM Supermix for Probes (No dUTP); subsequently, the mixture solution was vortexed and then encapsulated into droplets using 80 channels per sample.
- a library for MiSeq sequencing was generated by one-step PCR in droplets (at 95°C for 5 minutes; six cycles at 94°C for 45 seconds and at 60°C for 150 seconds; 49 cycles at 94°C for 25 seconds and 60°C for 80 seconds; at 98°C for 10 minutes).
- the library generated by the droplet amplification technique was collected using chloroform, 80 ⁇ L of TE buffer (Invitrogen) and 280 ⁇ L of chloroform (Sigma) were mixed with droplets collected from each DG8 TM Cartridge (eight wells), then the mixture was pipetted 10 times and vortexed until aqueous and organic phases were separated; and, after centrifugation (at 21,900 g for 10 minutes), an aqueous-phase solution containing the library was extracted.
- TE buffer Invitrogen
- 280 ⁇ L of chloroform Sigma
- off-target DNA molecules such as unlinked barcode amplification products, remaining primers, and byproducts in the collected solution were removed by bead purification using AMPure XP and gel purification using 2% E-Gel TM EX Agarose Gels (Thermo Fisher Scientific Inc.).
- biotinylated and unbound 16S rRNA amplification products were removed using streptavidin magnetic beads (NEB), and unbound 16S rRNA amplification products were biotinylated with a primer Biotin-link-805R ( Figure 5 ). 28
- the purification steps using AMPure XP, gel, and streptavidin beads were performed twice each.
- the purified library was concentrated using DNA Clean and Concentrator Kit (Zymo Research).
- the quality of the library was examined using Agilent 2100 Bioanalyzer, and the concentration was measured by qPCR (KAPA SYBR Fast qPCR kit; KAPA Biosystems) using primers P1_qPCR_Fw and P2_qPCR_Rv (Table 3).
- the detailed protocol for the purification steps using AMPure XP, gel, and streptavidin beads was followed in accordance with the user manual for each product.
- Pair-end sequencing was performed for the library of the samples on the MiSeq platform (MiSeq Reagent Kit v3, 600 cycles; Illumina), allocating 30 cycles for Read 1, 295 cycles for Index 1, eight cycles for Index 2, and 295 cycles for Read 2 ( Figure 5 ).
- the primer for sequencing Illumina Index 1 was replaced with a custom primer designated as I1_primer (Table 3), to read the 16S rRNA sequences instead of indices.
- I1_primer I1_primer
- the total concentration of bacteria, extracellular DNA, or cellular barcodes was measured by Droplet Digital TM PCR (ddPCR) in accordance with the instruction of QX200TM ddPCR EvaGreen TM Supermix (Bio-Rad).
- ddPCR Droplet Digital TM PCR
- F1-Fw and F1-Rv which were primers targeting the V1-V2 region of the 16S rRNA gene, or 341F and 805R, which are primers targeting the V3-V4 region of the 16S rRNA gene, were used (Table 3).
- primers Biotin-Link-barcode-F and P5-index-R1P-barcode-R (containing an index GTACTGAC) were used (Table 3).
- Droplet PCR was performed with the following steps: the initial denaturation at 95°C for 5 minutes; denaturation at 95°C for 45 seconds, annealing and elongation with six cycles at 60°C for 150 seconds; denaturation at 95°C for 25 seconds, and annealing and elongation with 39 cycles at 60°C for 80 seconds (primers F1-Fw and F1-Rv) or denaturation at 95°C for 25 seconds and annealing and elongation with 34 cycles at 60°C for 80 seconds (primers 341F and 805R); and signal stabilization at 4°C for 5 minutes and at 90°C for 5 minutes.
- the fluorescence intensity of droplets was measured using QX200 Droplet Reader (Bio-Rad), and the numbers of positive and negative droplets were determined based on a threshold which is the trough of the bimodal distribution of the intensity obtained using a software QuantaSoft (Bio-Rad) ( Figure 18a ). Finally, the concentration of the sample was calculated based on the ratio of positive and negative droplets and the dilution rate of the sample.
- the ratio of positive and negative droplets was determined by Gaussian fitting because of the clearly ill-defined separation between the distributions of positive and negative droplets when 341F and 805R were used ( Figure 18b ).
- the ratio was fitted to the peak of the intensity distribution by a function normalmixEM in the R package mixtools using four Gaussian distributions ( Figure 18c ).
- fitting by two Gaussian distributions, of which one is for positive droplets and the other is for negative droplets can be sufficient.
- the data clearly showed that there were two or more Gaussian distributions. Therefore, the intensity distributions by different numbers of Gaussian distributions were fitted.
- the proportion of positive droplets was found to be stable when four or more Gaussian distributions (six or less were tried) were used ( Figure 18d ). This suggests that four Gaussian distributions is sufficient to explain the intensity distributions.
- a Gaussian distribution fitted to positive droplets was assumed when the mean of these Gaussian distributions was larger than the apparent trough of the intensity bimodal distribution, and it was opposite for negative droplets.
- the proportions of positive droplets were compared between the results obtained using two primer sets, and it was found that basically these proportions did not differ for either the bacterial cell sample or the extracellular DNA sample ( Figure 18e ).
- primers F1-Fw and F1-Rv were selected for BarBIQ.
- Bacteria were used at a concentration of 250 cells/ ⁇ L to generate droplets. Given that the volume of one droplet was approximately 0.8 nL, approximately 20% of droplets were to contain bacteria with this concentration. Following the Poisson distribution, 90% or more of droplets containing bacteria contain only one bacterium, and others contain two or more bacteria under this condition.
- BarBIQ normalizes the proportional concentration of each cOTU determined by sequencing using the total concentration to obtain the absolute concentration of the cOTU, and different cellular barcode concentrations do not change the proportional concentration of each cOTU. Therefore, the concentration of the cellular barcode does not affect the concentration measurement in BarBIQ. However, the cellular barcode with a higher concentration generates more junk amplicons, which may affect identification of the 16S rRNA sequence. Meanwhile, the cellular barcode with a lower concentration would reduce the efficiency of detecting bacteria.
- the detection rates of bacteria cells at these concentrations ranged from 3% to 11%. Approximately three-fold differences in the detection rates were observed for different samples even when cellular barcodes were used at the same concentration, and the differences seem to be attributed to instability at lower concentrations of the cellular barcode molecules. Since the cOTU count determined by sequencing showed a favorable correlation between repeated experiments for showing different cell detection rates, it was indicated that, basically, the detection rate did not affect measurement of proportional concentrations of all detected cOTUs ( Figure 15 ).
- FIG. 20 A schematic view of preparation of the spike-in control is provided in Figure 20 .
- StdTarget1 and StdTarget2 two single-stranded DNA (ssDNA) containing 174 and 176 random nucleotides, respectively, were linked by T4 RNA ligase (NEB) overnight at a concentration of 400 nM, and then a denaturation step using enzymes was performed at 65°C for 15 minutes.
- ssDNA single-stranded DNA
- RandomBar_std1, RandomBar_std2, RandomBar_std3, and RandomBar_std4; Figure 16 and Table 3) separately designed from the linked products of StdTarget 1 and StdTarget 2, followed by an annealing step at 90°C to room temperature over 15 minutes, and elongation was performed using Klenow polymerase (NEB).
- Products from each round of PCR were purified by gel electrophoresis.
- the spike-in control was prepared by mixing these four different products in equal ratios based on the concentrations measured by qPCR using primers P1_qPCR_Fw and P2_qPCR_Rv.
- a pipeline for identifying the bar sequence and cOTU (cell type) and processing the data obtained by sequencing to quantify each cOTU was developed.
- the primary strategy of the pipeline is shown in Figure 6 , and details of each step were as described in WO 2018/235938A and as follows.
- the reads from MiSeq were first clustered using the cellular barcode (Read R1). 25 Subsequently, 16S rRNA sequences (Reads I1 and R2) linked to the same cellular barcode were further clustered based on the identity of these sequences.
- a representative sequence (RepSeq) for each group of clustered 16S rRNA sequences was generated based on both the number of reads and the sequencing quality for each sequence type.
- Conceivable erroneous RepSeq sequences were removed at a plurality of steps, depending on both the number of reads for each RepSeq and the number of RepSeqs for each RepSeq sequence type, (refer to WO 2018/235938A and see Figure 6 ).
- a unique RepSeq sequence type was designated as Bar sequence.
- Bar sequences were clustered into a cOTU based on their co-detection frequency in the same droplet. If two or more Bar sequences were detected in the same droplet frequently, they were considered to be a plurality of 16S rRNA genes derived from the same bacterium and clustered into a single cOTU.
- each cOTU was counted by the number of unique cellular barcodes (i.e., barcode cluster).
- the absolute cell concentration of each cOTU was determined by normalizing cells counted by the sequencing of the cOTU using the total concentration of the sample measured by ddPCR. Further, cOTUs contaminated during sampling and/or measurement were identified using the control.
- Table 4 Perl modules and R packages used for data analyses Name Type Citations ape R package Paradis E. & Schliep K. 2019.
- ape 5.0 an environment for modern phylogenetic and evolutionary analyses in R. Bioinformatics, 35, 3, 526-528 .
- R1 (30 nucleotides) was a cellular barcode
- I1 (295 nucleotides) and R2 (nucleotides) were 16S rRNA sequences
- I2 8 nucleotides was an index for labeling each sample uniquely. All three sequencing operations are summarized in Table 4.
- Step 1 Clustering based on cellular barcode
- the reads of the cellular barcode (R1) were clustered based on the sequence as reported previously ( WO 2018/235938A ), excluding the initial deletion of low-quality reads.
- 47 low-quality R1 reads (the mean score ⁇ 15) containing at least one window consisting of four consecutive nucleotides were excluded.
- the proportions of reads of Sequence Runs 1, 2, and 3 were 0.23%, 0.05%, and 0.06%, respectively, and they were excluded by this process.
- an R1 read that matches the last four fixed nucleotides of the designed cellular barcode was selected for the next step.
- Step 2 Trimming based on low-quality ends and primer portions of reads I1 and R2
- the ends of all reads were trimmed at specific positions based on the quality of reads and primer portions thereof.
- the quality of read nucleotides in MiSeq sequencing is generally reduced at the ends of a read, resulting in more errors at the ends. 50 Since maintaining the same read length is necessary at the next stage of data processing, we applied uniform thresholds and trimmed the ends of all reads with one sequencing operation.
- the trimming position of sequence runs were determined based on the average quality of all reads. The rule of selecting trimming positions was as follows: when the starting average quality of two sequential positions was lower than 25 (incidental changes in the quality during sequencing can be avoided using the average quality at two sequential positions), the position was selected from the head of the read as the first position.
- Step 3 Clustering by 16S rRNA sequences (I1 and R2)
- Step 3.1 Clustering by substitution distance
- step 3.1 the reads I1 and R2 were clustered by a parameter of distance 3 based on the substitution distance between the reads using a nucleotide sequence clusterizer software, and the reads I1 and R2 having the same MiSeq ID were by physically linked and considered as a single read.
- Step 3.2 Clustering based on a single position in a read
- Step 3.1 Since very similar sequences that might be a true 16S rRNA sequence, not an erroneous sequence, were integrated in Step 3.1, an additional clustering step was used. For each subcluster generated by Step 3.1, reads were re-clustered based on a specific position of the read (all reads were aligned according to a first nucleotide). The logic diagram of this step is shown in Figure 20 . For each read position, the number of reads containing each kind of nucleotides (A, T, C, and G) was counted, and the ratio (designated as Ratio2nd) of the number of reads containing the second most abundant nucleotide to the number of reads containing the most abundant nucleotide was calculated.
- Ratio2nd the ratio
- the count of each read was weighted by the quality score of the nucleotide sequence at this position.
- the rule was as follows: the count was weighted by 0 if the score was lower than 15 and by a score obtained by dividing the score by 41 if the score was 15 or higher. Then, the highest Ratio2nd was selected among all positions and compared with the threshold of 0.75. If the Ratio2nd was 0.75 or higher, reads containing the second most abundant nucleotide were separated into a new subcluster from the original subcluster.
- Sequence A had more reads at times, and Sequence B had more reads at other times. Therefore, both these two sequence types may have been identified from different droplets, and the amplification bias did not affect cell counting.
- the number of droplets in which both sequence types were detected was reduced when the threshold of 0.75 was used, compared with cases where a lower threshold was used. This may affect the step used to identify two sequences from the same bacterium (see Step 12). Meanwhile, when a threshold lower than 0.75 is used, a subcluster containing erroneous sequences alone can be generated, resulting in a problem in the next step. Therefore, the 16S rRNA sequences were identified using the threshold of 0.75.
- Step 4 Preparation of representative sequence (RepSeq) for each SCluster
- RepSeqs having an error type due to insertion or deletion (indel) which occurred in the head portion (21 nucleotides in I1 and 17 nucleotides in R2) of the read excluded as a primer portion in Step 2 were removed.
- indel insertion or deletion
- two types of reads RepSeqs i and j (two deletions in the reads)
- RepSeq j should have shifted by two nucleotides from left towards right compared with RepSeq i ( Figure 21 ).
- a RepSeq having this error type was designated as a shifted
- Step 5 The logic diagram of Step 5 is shown in Figure 21 .
- the strategy was as follows. a) Pairs of all RepSeq types conceivable for each BCluster were found. One RepSeq type was a sequence shifted from another RepSeq type, and only pairs of RepSeq types having a shift of less than eight nucleotides were selected. b) For each pair of the shifted RepSeq types (A and B), a RepSeq type identified in more BClusters was designated as Mother, and the other was considered as Shift wherever possible. This is because, in general, there are less erroneous sequences than correct sequences.
- the RepSeq I1 and the RepSeq R2 were linked based on overlapped sequences at the ends thereof.
- the lengths of the 16S rRNA gene in the V3-V4 region depended on the Silva database (version 123.1) and were distributed in a range from almost (> 99.9%) 400 to 500 bp ( Figure 22 ). Therefore, sequencing of 295 nucleotides of reads for both I1 and R2 can basically achieve 90 or more overlapped nucleotides between the ends of each read pair of I1 and R2.
- Step 7 Removal of RepSeq having one insertion or deletion (1-indel)
- Step 5 RepSeqs having an error type arising from one insertion or deletion (1-indel) error in the main portion of the read (not in the head portion of the read (i.e., the primer portion; see Step 5)) were removed. Since clustering in Step 3 was based only on substitution as described above, all erroneous reads containing an indel were separated to prepare individual RepSeqs. In general, an indel error very rarely occurs around the center of the read in sequencing ( Schirmer M et al., BMC Bioinformatics 2016; 17:125 ). Therefore, at the stage, not only a 1-indel, but also two-nucleotide indel having substitution and a 1-indel were considered in Step 9 (described later).
- Step 7 The logic diagram of Step 7 is shown in Figure 23 .
- the strategy is as follows. a) All pairs of RepSeq types that had a 1-indel difference were found in each BCluster. b) Since there are generally less erroneous sequences than correct sequences, the RepSeq type identified in more BClusters was designated as Mother for each pair of RepSeq types having a 1-indel (A and B), and the other was considered as 1-Indel. c) For each pair of Mother and 1-Indel, the number of BClusters having more reads of Mother than those of 1-Indel (No Mother ) and the number of BClusters in the opposite case (No 1-Indel ) were counted. Only BClusters including both Mother and 1-Indel were used.
- Step 8 Removal of chimera
- the logic diagram for removing chimeras is provided in Figure 24 .
- Step 9 Removal of rare erroneous RepSeqs
- Step 9 The logic diagram of Step 9 is shown in Figure 25 .
- the strategy is as follows. a) All possible pairs of RepSeq types in each BCluster having any of the above-described differences (Cases A, B, and C) were identified. b) The numbers of RepSeq reads for each identified pair were compared. If the ratio of the numbers of reads between RepSeqs (small and large) was lower than a threshold of 0.2, RepSeqs having a small number of reads were excluded, and the number of reads was added to other pairs.
- Step 11 Removal of RepSeqs having a one-nucleotide error
- Category 1 was a group with 1,000 or higher counts of San-sequence-matching RepSeq types
- Category 2 was a group with less than 1,000 counts of San-sequence-matching RepSeq types.
- the highest mean number of RepSeq types having a one-nucleotide difference was larger than 2, and the highest ratios for these RepSeq types were consistent between the different groups. It was concluded that these RepSeq types having a one-nucleotide difference probably had errors arising from PCR.
- Step 12 Clustering Bar sequences into a cOTU
- Poission_Overlap A ⁇ B ⁇ ⁇ / total number of droplets , wherein the total number of droplets is the total number of droplets containing cellular barcodes; ⁇ is a constant and an integrated parameter for detection efficiency in droplets that can include PCR amplification efficiency, sequencing depth effect, and the like.
- the Bar sequences are derived from an identical bacterium, the number of droplets in which both the Bar sequences are detected would not follow the Poisson distribution.
- log 10 Poission _ Overlap log 10 A ⁇ B ⁇ log 10 total number of droplets / ⁇
- the running median of log 10 was imitated using the running median of log 10 (Overlap) (here, a running median is a group consisting of median values in a region of window a of a specific size, median values further obtained by shifting the region by overlap b of a specific size, and further median values obtained by repeating this operation, and a is > b).
- the running median of log 10 (Overlap) was obtained with a window of 0.4 and an overlap of 0.2 based on log 10 (A ⁇ B), and only medians exceeding 0 were used (red, white circles in Figure 27a ).
- the ratio rather than the number of samples, is used because some Bar sequences are detected in only some samples, the number of samples that can be used for each Bar sequence pair can vary. To secure reliability, only Bar sequence pairs detected in at least two samples were used. Further, some samples were found to have poor OD fitting, only samples with a standard error of OD by fitting being lower than 0.08 were selected. All Bar sequence pairs mapped to different names based on mapping names of Bar sequences had a low Ratio_Positive ( Figure 27d ), and the distribution was exponentially attenuated, indicating that such sequences occur with a low possibility. Therefore, Bar sequence pairs derived from an identical bacterium were identified using a threshold of Ratio_Positive > 0.5.
- Bar sequences were classified into groups based on the identified Bar sequence pairs derived from an identical bacterium. Each group can have one Bar sequence or a plurality of Bar sequences. We designated these groups as cell-based operational taxonomic units (cOTUs).
- cOTUs cell-based operational taxonomic units
- the strategy for this classification was to classify the Bar sequences into one group if the Bar sequence and at least one of the plurality of Bar sequence are derived from the same bacterium.
- Some Bar sequence pairs in some cOTUs could not be detected by the above-described process. This may be because detection efficiency was low when a droplet contains two or more sequences.
- Step 13 Counting the number of cells in each cOTU
- Step 14 Removal of cOTUs contaminated with foreign substances
- cOTUs contaminated with foreign substances were removed based on the control.
- measurement was performed for a similar time period (several days) under the same condition using a control sample M0 of the mock cell population or an empty test tube control of the cecal samples of mice Ma, Mb, and Mc.
- the strategy for detecting cOTUs contaminated with foreign substances was as follows. The number of BClusters in a cOTU identified in the sample was counted for each control, and the count of each cOTU in the control was compared with the count of identical cOTUs in the sample. In an experiment of the mock cell population, the counts were also normalized by the estimated total number of droplets because a different number of droplets were used to prepare the libraries of the mock cell population and the M0 sample. In another experiment, standardization of the counts was not applied because the control was an empty tube, and the same number of droplets was used in all experiments.
- Category I could not be explained as a chimera because bacteria cross-mixed in from the control to the sample or mixed in from the environment were the same as bacteria in the control (because we used an actual sample as the control for measurement of the mock cell population), and, further, this cOTU sequence was very different from the Bar sequence ( ⁇ 86% identity) that matched the San sequence in the sample. This result indicates that this cOTU does not have an error arising from a chimera.
- Category II can be explained as foreign substances mixed in from the environment for both the sample and the control. This is because their numbers were similar in the different samples and the control. We removed cOTUs from the samples for both Category I and Category II. This is because they were probably foreign substances mixed in from the environment or other samples.
- bacteria mixed in from the sample to the control or incidentally mixed in from the environment were the same bacteria in the sample although there was a possibility that foreign substances were cross-mixed in.
- the value obtained by subtracting the count of this cOTU in the control from the count of this cOTU in the sample was used as the final number of cells in this cOTU in the sample.
- mice Ma, Mb, and Mc Since only one measurement was performed for each sample for data of mice Ma, Mb, and Mc, the square root of the count was used as an error bar based on the Poisson sampling noise instead of a repeat SD.
- mice Ma, Mb, and Mc two empty test tubes were used as controls. In this case, the two test tubes were experimental repeats rather than sampling of repeats, and do not follow the Poisson distribution. Further, to avoid an accident due to a small number of repeats, 3.27 ⁇ SD was used as an error bar against the controls. Further, if 3.27 ⁇ SD is smaller than 10% of the mean count, 10% of the mean was used as an error bar.
- the rule of removing cOTUs contaminated with foreign substances from these samples was as follows. If the count in the control + the error bar was higher than the count in the sample - the error bar, this cOTU was removed from the sample. If the count in the control + the error bar was lower than the count in the sample - the error bar, the count in the sample - the count in the control was used as the final count of the cOTUs in the sample.
- the number of cells in the cOTU contaminated with foreign substances was approximately 0.5% of the number of all cells detected in measurement of the mock cell population, and approximately 4% in measurements of the cell samples from Ma, Mb, and Mc.
- the absolute cell concentration in each cOTU was calculated by normalizing by the count obtained in Step 13 using the total concentration measured by droplet digital PCR.
- Classification of the identified cOTUs from the phylum to the genus was predicted based on their Bar sequences by a RDP classifier using the bootstrap cutoff of 50%. 36
- the RDP classifier was trained using the 16S rRNA training set 11 (https://rdp.cme.msu.edu/classifier/classifier.jsp). A predicted taxon having the highest score was selected for the cOTU including a plurality of Bar sequences.
- bray-Curtis dissimilarity between the samples of each pair based on the cell concentrations was calculated using the vegdist function of vegan R package. Subsequent analyses were performed using R (version 3.5.1) and JupyterLab (version 0.34.9).
- Noises in the cOTU in the technical replicates of a sample Ma dist measured by BarBIQ were examined mainly from the sampling noises by comparing the mock noises obtained from the Poisson distribution and the technical noises of the cOTU.
- the number of cells for each replicate was standardized for the minimum total number of cells in the replicate by subsampling using dilution of a function in the vegan R package.
- the noises in the cOTU were quantified by CV 2 .
- the CV represents a change in the coefficient calculated based on the normalized numbers of cells in cOTUs in three technical replicates.
- the CV Poisson is a theoretical CV for a predetermined cOTU based on the Poisson distribution.
- the distribution of all R mc in the sample of Ma dist matches the distribution of the simulation, indicating that technical noises in the BarBIQ measurement were mainly due to sampling ( Figures 7c and 7d ).
- Hierarchical clustering was performed by a function hclust in a statistical package (a heat map was generated using the Pheatmap package).
- the distance used for clustering is defined as 1 - minimum (
- Evolutionary trees of hierarchical clustering were obtained by the complete linking method. Specifically, a Pearson correlation coefficient r between all included cOTUs was obtained. Then, a distance between one microorganism and another microorganism was determined based on the above-mentioned expression, and cOTUs were clustered based on the distance.
- the distance between possible cOTU pairs within a branch after clustering was lower than the height of the branch.
- the OCI of each r was obtained by simulation. The simulation process was repeated 1,000 times, the cell concentration in each cOTU was randomly generated for each time for the samples Ma dist 1, Ma prox 1, Mb dist , Mb prox , Mc dist , and Mc prox (this process is the same as the above-described simulation of the confidence interval of the CV) to calculate Pearson's r for each cOTU pair. Then, the OCI was obtained from the distribution of simulators simulated 1,000 times.
- a network of cOTUs for each SCBG obtained using a threshold of 0.6 was visualized by a force-directed layout 39 using the igraph of the package, and the layout of nodes (i.e., cOTUs) in the network was created using r which is larger than 0.9, and all r between cOTUs were displayed with color gradients using the RColorBrewer package.
- the network of SCBGs based on the correlation between SCBGs for each possible pair of SCBGs was visualized by a force-directed layout using the igraph package.
- the layout of SCBGs was determined based on R inter that is larger than 0.7, and all R inter between SCBGs were drawn by lines with color gradients using the RColorBrewer package.
- Kruskal-Wallis test for a comparison of the means of R inter was performed using the function Kruskal.test in the R package stats.
- Example 1 Attaching indices (indexing) to single bacterial cells included in microbiota, allocating single RNA barcodes (Barcoding), and counting the numbers of cell units and molecules by sequence decoding
- a cell quantification method associated with accurate identification of the 16S rRNA genes and BarBIQ ( Figures 1a and 29 ) was developed.
- a sample was prepared in a buffer solution, and the aggregates were broken by vortex.
- the bacterial sample was mixed with a solution containing cellular barcodes, 25,26 primers, and reagents for DNA amplification, and the mixture was encapsulated into droplets with a size of 100 ⁇ m.
- the ratio of single cells and single cellular barcodes i.e., DNA molecules
- the amplified barcode and sequencing adapter were linked to the 16S rRNA gene amplified in the droplet by single-step amplification (approximately 450 nucleotides in the V3-V4 region) 28 ( Figure 5 ). After amplification, droplets were cut, the library (linked amplicons) was purified, and both the cellular barcodes and the 16S rRNA sequences of the individual amplified molecules were sequenced using a high throughput sequencer MiSeq.
- BarBIQ The essential difference between BarBIQ and conventional methods is the unit for defining the composition of a microbiota.
- the unit is an operational taxonomic unit (OTU), and this essentially represents a group of similar obtained 16S rRNA sequences by clustering based on the identity of sequences obtained from bulk sampling. 30
- OTU operational taxonomic unit
- BarBIQ uses cell types classified based on the 16S rRNA sequence identified from each barcoded cell.
- the classification unit obtained herein was designated as "cell-based operational taxonomic unit (cOTU)."
- BarBIQ acted on the mock cell population including 10 types of cultured human intestinal bacterial strains (Table 1). It was found that each of 16 sequences (Bar sequences) derived from the mock cell population including two pairs of Bar sequences identified by BarBIQ had a one-nucleotide difference ( Figure 1b ).
- the cell concentration was quantified for each cOTU identified in the sample as described above.
- technical replicates of the identical sample had high reproducibility (Pearson's r ⁇ 0.982; Figure 15 ), and that noises for quantification including the filtration step were mainly due to sampling ( Figure 7b to 7d ).
- the cell concentrations were compared between the samples, using 240 cOTUs detected in all samples. We found that the concentrations of 10 to 97 cOTUs ( Figures 2d, 2e , and 16a to 16c ) of each sample pair (i.e., different positions and/or different mice) were different.
- SCBG was defined as a branch which was lower than the threshold and included three or more cOTUs ( Figures 4b and 17 ).
- the obtained SCBGs were characterized.
- the number of cOTUs in an SCBG varied from 3 to 19 ( Figure 11c ), and more than half (16/31) of SCBGs included positively and negatively correlated cOTUs ( Figures 4c and 12a to 12f ).
- the mean abundances of cOTUs in each SCBG were widely distributed ( Figures 4c and 11d), and the highest difference in abundance between the SCBGs was 230 times, which was observed in SCBG12 ( Figure 11d).
- taxonomic prediction ( Figure 4c ) of each cOTG was different species ( Figures 4c and 13 ).
- the large intestine was subdivided, and an analysis of each subdivided fragment was attempted in a state in which position information could be identified. Specifically, immediately after a mouse was slaughtered, the entire large intestine was removed and spread to make it linear, and the positional relationships of the solid contents in the large intestine were photographed. One solid content in the large intestine was removed in a state wrapped in the intestinal wall using sterilized scissors and sterilized tweezers and placed in the center of the hole of a brain slicer (Muromachi Kikai Co., Ltd., MK-RC-01) with the cecal side on the left (Panel a of Figure 39 ). At this time, the brain slicer had been marked beforehand so that the cecal side (A) and the anal side (E) could be distinguished.
- the brain slicer was removed from a freezer set at -20°C, and a sterilized razor blade (Muromachi Kikai Co., Ltd., TCB-100) was inserted into a groove of the brain slicer positioned approximately 1 mm left from the center of the solid large intestine content and the second groove positioned to the right thereof (Panel d of Figure 39 ). Since the grooves of the brain slicer used in this experiment had a width of 1 mm, the central portion having a thickness of 2 mm (hereinafter, Area C) was separated from the large intestine content by this operation.
- Area C the central portion having a thickness of 2 mm
- a razor blade was inserted into each of the grooves positioned at 2 mm or more and 3 mm or less inside from the left and right ends of the solid large intestine contents (Panel e of Figure 39 ) to separate the cecal side end portion (hereinafter, Area A) and the anal side end portion (hereinafter, Area E).
- the widths of Area B (between Area A and Area C) and Area D (between Area C and Area E) varied depending on the length of the entire solid large intestine content. Further, in some intestinal samples, the length of the entire content was short, and either Area B or Area D was missing.
- a razor blade was inserted into each of the grooves positioned 1 mm or more outside from the left and right ends of the solid large intestine content.
- the solid large intestine contents could be divided into areas of A, B, CC, CO, D, and E (Panel g of Figure 39 ) (however, Area B or D might be missing for the above-mentioned reasons).
- equimolar mixed cellular barcodes concentration of an equimolar mixed four cellular barcode template (hereinafter, equimolar mixed cellular barcodes) was measured by ddPCR. Specifically, first, QX200 TM ddPCR TM EvaGreen Supermix (Bio-Rad, #1864034), 1 ⁇ M primers (NoBiotin-Link-barcode-F and P5-index-R1P-barcode-R), 0.1 ⁇ M dNTPs (New England BioLabs Inc., N0447), Platinum Taq DNA Polymerase (Thermo Fisher Scientific, 10966034), and a sample (equimolar mixed cellular barcodes and bacteria cells collected from the murine cecum, or equimolar mixed cellular barcodes alone) were mixed to make a volume of 30 ⁇ L and divided into DG8 Cartridge (Bio-Rad, #1864008). Subsequently, the mixture solution was encapsulated into droplets using Droplet Generation
- ddPCR was performed by the following steps:
- This experiment examined whether the number of PCR cycles for preparing a sequence library by the BarBIQ method was sufficient to amplify 16S rRNA sequences in bacteria cells contained in a droplet. Specifically, first, QX200 TM ddPCR TM EvaGreen Supermix, 1 ⁇ M primers (F1-Fw and F1-Rv), 0.1 ⁇ M dNTPs, and a sample (bacteria cells collected from the murine cecum) were mixed to make a volume of 30 ⁇ L and divided into DG8 Cartridge.
- the mixture solution was encapsulated into droplets using Droplet Generation Oil for EvaGreen and Droplet Generator.
- ddPCR was performed under the same cycle condition as in the above Experiment 2, excluding the third stage. In the third stage, the number of cycles was changed to 0, 10, 20, 30, 39, or 49. Then, the fluorescence intensity of droplets was measured using QX200 Droplet Reader, and positive and negative droplets were determined based on a threshold which is the trough of a bimodal distribution of the intensity, using a software QuantaSoft (Bio-Rad, #1864011JA).
- This experiment examined whether the initial denaturation time for preparing a sequence library by the BarBIQ method was sufficient to amplify 16S rRNA sequences of bacteria cells contained in a droplet. Specifically, first, QX200 TM ddPCR TM EvaGreen Supermix, 1 ⁇ M primers (F1-Fw and F1-Rv), 0.1 ⁇ M dNTPs, and a sample (bacteria cells collected from the murine cecum) were mixed to make a volume of 30 ⁇ L and divided into DG8 Cartridge. Subsequently, the mixture solution was encapsulated into droplets using Droplet Generation Oil for EvaGreen and Droplet Generator. ddPCR was performed under the same cycle conditions as in the above Experiment 2, excluding the first stage.
- the time was changed to 0, 5, or 10 minutes. Then, the fluorescence intensity of droplets was measured using QX200 Droplet Reader, and positive and negative droplets were determined based on a threshold which is the trough of a bimodal distribution of intensity, using a software QuantaSoft.
- microbiota should be defined at a cell level.
- BarBIQ which are cell-based and not dependent on taxa, evolve microbiota studies from the current association research to necessary mechanism research.
Landscapes
- Chemical & Material Sciences (AREA)
- Life Sciences & Earth Sciences (AREA)
- Organic Chemistry (AREA)
- Analytical Chemistry (AREA)
- Proteomics, Peptides & Aminoacids (AREA)
- Zoology (AREA)
- Wood Science & Technology (AREA)
- Health & Medical Sciences (AREA)
- Engineering & Computer Science (AREA)
- Biophysics (AREA)
- Immunology (AREA)
- Microbiology (AREA)
- Molecular Biology (AREA)
- Biotechnology (AREA)
- Physics & Mathematics (AREA)
- Biochemistry (AREA)
- Bioinformatics & Cheminformatics (AREA)
- General Engineering & Computer Science (AREA)
- General Health & Medical Sciences (AREA)
- Genetics & Genomics (AREA)
- Chemical Kinetics & Catalysis (AREA)
- Measuring Or Testing Involving Enzymes Or Micro-Organisms (AREA)
Abstract
Description
- The present invention relates to a method for treating a cell population and a method for analyzing genes included in a cell population.
- To essentially understand how the composition of a commensal microbiota contributes to the health of a host,1,2 the microbiota should be simply defined at a cell level because a cell is a fundamental physical unit of a microbiota.3-5 However, such a definition is difficult with the current leading-edge techniques.6-8
- Interactions between a microbiota and a host thereof are associated with homeostasis and many diseases of the host.13-16 To further understand the mechanism of the microbiota-host interactions in an integrated manner, it is important not only to study the microbiota, but also to link compositional analyses of the microbiota to other analyses, such as metabolomics and/or transcriptomics for both the microbiota and the host.5 Achieving this purpose requires measurement of concentrations based on a commonly usable unit such as, for example, the number of cells per weight and/or the number of molecules per volume. In relation to this point, techniques to count the number of nucleic acid molecules present in a cell have been developed (
Patent Literatures 1 to 3). With these counting techniques, the number of molecules is estimated by labeling each molecule with a unique nucleic acid sequence (barcode) and counting the number of barcode types. InPatent Literatures 1 to 3, errors occurring during amplification of nucleic acids or reading errors occurring during sequencing can cause errors in the counted number of molecules. A technique to reduce these errors has also been developed (Patent Literature 4).Patent Literature 4 has proposed a method of removing errors and correcting the counted number in consideration of the natures of errors occurring during amplification of nucleic acids and reading errors occurring during sequencing. However, it has been difficult to measure the microbiota composition at a cell level with the current techniques.6-8 Additionally, a microbiota comprises an enormous number of bacteria of a large number of bacterial species.17 However, a high throughput cell quantification method with a high taxonomic resolution ability has not been developed so far. - High throughput methods based on sequencing of 16S rRNA gene amplicons using next-generation sequencing techniques have contributed to studies on bacterial diversity.22,23 However, conventional methods have the following fundamental limitations because they amplify the 16S rRNA genes from a purified bulk bacterial genome and measure the number of amplified molecules. 1) Since a different species has a different copy number of the 16S rRNA gene on the genome, and the copy number is unknown for the majority of species, it is difficult to measure the numbers of cells and compare the numbers of cells of different species. 2) Identification of 16S rRNA sequences is not accurate because of sequencing and amplification errors, resulting in a low taxonomic resolution ability. In fact, sequencing errors have been corrected using molecular barcodes,24-26 but mainly amplification errors due to chimera generation cannot be sufficiently removed.27
-
- Patent Literature 1:
U.S. Patent No. 9260753B - Patent Literature 2:
U.S. Patent No. 10287630B - Patent Literature 3:
U.S. Patent No. 10584382B - Patent Literature 4: International Publication No.
WO 2018/235938 - The present invention provides a method for treating a cell population and a method for analyzing genes included in a cell population.
- The present inventors developed a novel method for quantifying cell types in a bacterial microbiota and the cell concentration for each cell type using a high throughput method. The present inventors also found a method that addresses a state in which genes to be analyzed exist in multiplicate in one cell. The method enables fine classification of unknown cells (e.g., microorganisms) having gene multiplication and estimates the numbers of the cells by classifying gene groups to be analyzed into cell-based operational taxonomic units (cOTUs).
- According to the present invention, the following inventions are provided:
- [1] A method for treating a cell population, the method comprising
- (A) obtaining a droplet population from a cell dispersion comprising an isolated cell population, the droplet population comprising aqueous droplets, at least some of which each comprise one cell and one-molecule cellular barcode.
- [2] A method for analyzing nucleotide sequences of genes included in a cell population, the method comprising
- (A) obtaining a droplet population from a cell dispersion comprising an isolated cell population, the droplet population comprising aqueous droplets, at least some of which each comprise one cell and one-molecule cellular barcode; and
- (B) obtaining an amplification product of the cellular barcode and an amplification product of a predetermined gene in each obtained droplet, further obtaining a linked product comprising nucleotide sequences of the cellular barcode and all or some of the predetermined gene, and collecting the obtained linked product from the droplets into an aqueous solution and sequencing the obtained linked product to determine the nucleotide sequence of the predetermined gene and the nucleotide sequences of the cellular barcode.
- [3] The method according to [2], wherein, in the (B), the amplification product of the cellular barcode has a first region derived from a first primer, the amplification product of the predetermined gene has a second region derived from a second primer, the first region and the second region have complementary sequence portions hybridizable with each other, the first primer and the second primer each have one or more tag molecules linked thereto, and the tag molecule is not included in the linked product; and
the method further comprising removing the amplification product having a tag molecule from the linked products collected into the aqueous solution using a column or bead carrying a molecule having an affinity for the tag molecule in the (B). - [4] The method according to [2] or [3], further comprising
(C-1) clustering the determined nucleotide sequences based on the determined nucleotide sequence of the cellular barcode to obtain a plurality of first clusters. - [5] The method according to [4], further comprising
(D-1) estimating the number of cells included in the cell population or the number of cells having a specific predetermined gene from the number of the obtained first clusters. - [6] The method according to [2] or [3], further comprising
(C-2) clustering the determined nucleotide sequences based on the determined nucleotide sequence of the predetermined gene to obtain a plurality of second clusters. - [7] The method according to [6], further comprising
(D-2) estimating the number of cell types included in the cell population from the number of the obtained second clusters. - [8] The method according to [2] or [3], further comprising
(C-3) clustering the determined nucleotide sequences based on the determined nucleotide sequence of the cellular barcode to obtain a plurality of first clusters, and clustering the determined nucleotide sequences based on the determined nucleotide sequence of the predetermined gene to obtain a plurality of second clusters. - [9] The method according to [8], further comprising
(D-3) determining the first cluster into which the nucleotide sequence of the predetermined gene is classified from the nucleotide sequence of a cellular barcode linked to the nucleotide sequence of the predetermined gene classified into at least one second cluster based on information on combinations of the obtained nucleotide sequence of the cellular barcode and the obtained nucleotide sequence of the predetermined gene, and estimating the number of cells classified into the second cluster from the number of the first clusters into which the cellular barcode is classified. - [10] The method according to [8], further comprising
(C-4) when sequences classified into one identical first cluster are classified into different second clusters, classifying the second clusters into one identical cell-based operational taxonomic unit (cOTU). - [11] The method according to [10], further comprising
(E) estimating (i) the number of cOTUs included in the cell population and/or (ii) the number of cells included in a specific cOTU for each of a first cell population and a second cell population different from the first cell population, and comparing (i) the number of cOTUs and/or (ii) the number of cells included in the specific cOTU estimated for the first cell population with (i) the number of cOTUs and/or (ii) the number of cells included in the specific cOTU estimated for the second cell population. - [12] The method according to [11], comprising
(F) comparing (i) the number of cOTUs and (ii') the number of cells included in the specific cOTU estimated for the first cell population with (i) the number of cOTUs and (ii') the number of cells included in the specific cOTU estimated for the second cell population. - [13] The method according to any of [1] to [12], wherein the cell population is a microbiota.
- [14] The method according to [13], wherein the microbiota is a microbiota in the body or on the body surface.
- [15] The method according to [13], wherein the microbiota is a microbiota in the gastrointestinal tract.
- [16] The method according to [11] or [12], wherein the first cell population and the second cell population are microbiotas obtained from different sites of an identical subject.
- [17] The method according to [11] or [12], wherein the first cell population and the second cell population are microbiotas obtained from an identical site of different subjects.
- [18] The method according to [11] or [12], wherein the first cell population and the second cell population are microbiotas obtained from an identical site of an identical subject at different time point.
- [19] The method according to any of [1] to [18], wherein the cell population includes unknown cells.
-
- [
Figure 1] Figure 1 illustrates BarBIQ and efficacy thereof.Figure 1a is a schematic view of BarBIQ. A sample was suspended in a solution, and then the mixture was vortexed to break bacterial aggregates. Cellular barcode, a DNA molecule that comprises nucleotides unique to a cell (a nucleotide sequence different for each one molecule) and a prime site for amplification; primers, DNA primers for amplifying each of the 16S rRNA gene and the cellular barcode, for linking the amplification products of both, and for attaching a sequencing adapter; reagents, reagents for DNA amplification. SeeFigure 5 for a schematic view for details of library generation, purification, and sequencing. SeeFigure 6 for details of data processing.Figure 1b shows efficacy of BarBIQ using a mock cell population. Edit distance, Levenshtein distance29 defined as a minimum number of substitutions, insertions, and deletions; San sequence, 16S rRNA sequence identified by Sanger sequencing; ATCC/JCM/DSM-<number>, strain ID; A, B, or C, San sequence for each strain; Bar sequence-MK-XX (01-16), a sequence identified by BarBIQ (Bar sequence); COTU-MK-XX (01-10), cell-based operational taxonomic unit (cOTU); red asterisk symbol, a Bar sequence having a one-nucleotide difference; OTU-RepSeq-MK-XX (01-12), a sequence representing an OUT.Figure 1c shows a comparison of cell concentrations of 10 strains in the mock cell population measured by BarBIQ ([C]BarBIQ) and a microscopic imaging ([C]Microscopy) (data from Tables 1 and 2). Blue line, a fitting line with a slope fixed at 1 on a logarithmic scale; r, Pearson coefficient; R2, a coefficient of determination. Error bar, a standard deviation (n = 3 for [C]BarBIQ; n = 5 for [C]Microscopy). - [
Figure 2] Figure 2 shows comprehensive analyses of the murine cecal microbiota.Figure 2a shows distal (dist) and proximal (prox) sampling positions in the murine cecum.Figure 2b shows sequence identity profiles of Bar sequences. Identity, each Bar sequence and identity between the closest 16S rRNA sequence in three common public databases, GreenGene (GG), Ribosomal Database Project (RDP), and Silva; Three, a combination of all three databases.Figure 2c shows a comparison of cell concentrations in cOTUs between technical replicates (seeFigure 16 for other replicates). Magenta line, the Poisson distribution and a theoretical confidence interval of sampling noises based on normalization by the total concentration (99.9%); light blue line, two-fold change; blue dot, a cOTU showing a different concentration; inserted number, the number of blue or grey dots; Ma, Mb, and Mc, mice; dist and prox, positions; 1, 2, and 3, technical replicates.Figures 2d and 2e show the same comparisons for different samples as shown inFigure 2c with examples of different minimum (Figure 2d ) and maximum (Figure 2e ) numbers of cOTUs (blue dots). SeeFigure 16 for comparisons of other samples.Figure 2f shows Bray-Curtis dissimilarity in microorganisms between samples. The labels have the same meanings as inFigures 2c to 2e . - [
Figure 3] Figure 3 shows variations in cell concentrations for individual cOTUs among mice.Figure 3a shows examples of cell concentrations in a cOTU at distal (red solid line) and proximal (light blue broken line) positions in three mice (Ma, Mb, and Mc). CV, coefficient of variation.Figure 3b shows CV for the cOTU of the genus Clostridium XIVa (all detected genera are shown inFigures 9a and9b ). COTU-CM-<number>, cOTU ID; distal and proximal, positions; error bar, 95% confidence interval of CV for each cOTU obtained by a simulation assuming sampling noises and technical errors in measurement of total concentrations. - [
Figure 4] Figure 4 shows bacterial correlation networks.Figure 4a shows examples of correlations based on richness of cOTU pairs. Dot, cell concentration (cells/mg) for six samples (Ma dist1,Ma prox1, Mbdist, Mbprox, Mcdist, and Mcprox); r, Pearson coefficient.Figure 4b shows definitions of strongly correlated bacteria groups (SCBGs). Dendrogram, hierarchical clustering of 296 cOTUs detected commonly in all six samples based on the defined distance, 1 - minimum (|r'|) [r' ∈ (r - OCI, r + OCI)]; red broken line, a threshold of 0.6; heat map, r for all cOTUs; white gap in the heat map, an interval showing separation of branches lower than the threshold of 0.6 in both vertical and horizontal directions; number at the bottom, SCBG ID. A dendrogram having names and IDs of cOTUs for all SCBGs is shown inFigure 17 .Figure 4c shows the cOTU networks in SCBG7 and SCBG26 visualized using a force-directed layout.39 Node, cOTU; Node size, the mean cell concentration for a cOTU in six samples as shown inFigure 4a ; edge color, r between cOTUs linked at the end. The visualized networks in all SCBGs are shown inFigures 12a to 12f .Figure 4d shows a network of SCBGs visualized using a force-directed layout. Edge color, Rinter, an interrelationship between two SCBGs. - [
Figure 5] Figure 5 is a schematic view including sequence information for library generation, purification, and sequencing in BarBIQ. I, II, III, and IV, designed primers designated as P5-index-R1P-barcode-R, Biotin-Link-barcode-F, Biotin-link-805R, and P7-R2P-341F; Index (XXXXXXXX), eight designed nucleotides; barcode, random and fixed nucleotides (other three kinds of barcodes are shown in Table 3); N, A, C, G, or T in the sequence; I2, R1, and R2, Illumina sequencing primers for MiSeq; I1, a customized sequencing primer. - [
Figure 6] Figure 6 is a schematic view of BarBIQ data processing. Black arrow, a processing step; red arrow, description of an operand at a next step; barcode, a cellular barcode; R1, a read of R1; I1 and R2, I1 and R2 reads that obtained by trimming low-quality ends and the primer portions; BCluster, a cluster obtained by clustering by barcode; SCluster, a subcluster obtained by clustering by 16S rRNA sequence in each BCluster; shifted RepSeq, RepSeq resulting from an insertion or deletion that occurred in the primer portion of a read; RepSeq having one insertion or deletion, RepSeq resulting from an error of one-nucleotide insertion or deletion that occurred in the remaining portion of the read after trimming; chimeric RepSeq, RepSeq that can occur from PCR chimera formation; RepSeq having rare errors, RepSeq resulting from errors of one indel (insertion or deletion) and one substitution, one indel and two substitutions, or two indels in the remaining portion of the read after trimming; RepSeq type, sequence type of RepSeq; low-count RepSeq, RepSeq type detected in a small number of BClusters; RepSeq having a one-nucleotide error, RepSeq type having a one-nucleotide difference from another RepSeq, with the number of RepSeqs detected between the former and latter RepSeq types being smaller than a threshold; Bar sequence, a sequence identified by BarBIQ; cOTU, cell-based operational taxonomic unit. - [
Figure 7] Figure 7 shows absolute cell concentrations for each cOTU and total concentrations used to calculate sampling noises in each cOTU during BarBIQ measurement.Figure 7a shows the total bacterial concentrations in each sample measured by droplet digital PCR (see the BarBIQ method section in the Examples). Ma, Mb, Mc, and Md (not sequenced for Md), mice; dist and prox, positions (seeFigure 2a );1 ,2 , and3 , technical replicates; error bar, standard deviation (n = 5).Figure 7b shows CV2 (CV, coefficient of variation) of counts for each cOTU in three technical replicates in Madist as a function of mean counts.Simulations Figure 7c shows distributions of log10(CV2) - log10 (CVPoisson 2). CV, CV of each cOTU; CVPoisson, theoretical CV based on the Poisson distribution.Figure 7d shows a Q-Q plot45 of distributions of log10(CV2) - log10(CVPoisson 2) between the measurement for Madist andSimulation 1 and betweenSimulation 1 andSimulation 2. The distributions of log10(CV2) - log10 (CVPoisson 2) were comparable between the measurement and the simulations, indicating that the noises in each detected cOTU were mainly due to sampling. - [
Figure 8] Figure 8 shows comparisons between position-dependent cell concentrations in each cOTU in mouse Ma.Figure 8a shows a comparison of the mean cell concentrations in each cOTU for three technical replicates between the distal position (Madist) and the proximal position (Maprox) in mouse Ma. Error bar, standard deviation (n = 3); red dot, with FDR < 0.05 and the mean change factor of > 2 (seeFigure 8b ); broken line, with the change factor = 2.Figure 8b is a Volcano plot that shows differences in cell concentrations in cOTUs between the distal and proximal positions in Ma. The false discovery rate (FDR) was determined by a function p.adjust (R package: stats) using the BH method based on the p value of all 240 cOTUs calculated by function t test (R package: stats) using two-sided two-group t test (n = 3)46; Madist/Maprox, a ratio of the mean cell concentration in Madist to the mean cell concentration in Maprox; broken line, the ratio of the total concentrations in Madist and Maprox. - [
Figure 9a] Figure 9a shows CVs (coefficient of variations) for taxa of all cOTUs. Left, classification from phylum to genus. Right, CV for each cOTU at the distal and proximal position. COTU-CM-<number>, cOTU ID; error bar, 95% confidence interval obtained in simulation on the assumption of sampling noises and technical errors in measurement of total concentrations. - [
Figure 9b ] Same as above. - [
Figure 10] Figure 10 shows characteristics of correlations of each cOTU to other cOTUs in the whole network. The upper column shows distributions of |r| between a given cOTU and all the other cOTUs, and |r| is an absolute Pearson correlation coefficient. cOTUs were aligned by the mean |r| for each cOTU along the horizontal axis (cyan line). The lower column shows distributions of |r| for each cOTU shown by relative frequency. The values in each line of the upper diagram were normalized by the minimum value (as 0) and the maximum value (as 1) thereof (i.e., normalization along the horizontal axis). This analysis enables finding of the "master bacteria," which are bacteria (i.e., cOTUs) highly correlated to the majority of other bacteria in the bacterial correlation network. - [
Figure 11] Figure 11 shows an analysis of strongly correlated bacteria groups (SCBGs).Figure 11a shows the number of SCBGs as a function of thresholds of heights of the dendrogram (Figure 4b ). Red dotted line, a threshold of 0.6.Figure 11b shows the number of cOTUs in the SCBG including the largest number of cOTUs as a function of the thresholds.Figure 11c shows distribution of numbers of cOTUs in the SCBGs when the threshold was 0.6. Figure 11d shows the mean cell concentrations in cOTUs in each SCBG for thesamples Ma dist1,Ma prox1, Mbdist, Mbprox, Mcdist, and Mcprox. Black dots indicate that all cOTUs in the SCBGs positively correlated. Purple dots and light blue dots indicate that all cOTUs positively correlated. cOTUs in different subgroups showed a negative correlation. - [
Figure 12a] Figure 12a shows networks and r distributions indicating the intensity of relative correlations between each cOTU and other cOTUs in each SCBG. Left diagrams show networks of SCBGs visualized using a force-directed layout.39 Node, a cOTU; node number, cOTU ID; edge color, r between linked cOTUs; ID colors, the same meanings as dot colors in Figure 11d. Right graphs show distributions of r between a given cOTU and all the other cOTUs in the SCBG. First, cOTUs were divided into subgroups (ID colors), and then each cOTU in each subgroup was aligned along the mean of all positive r (blue line). - [
Figure 12b ] Same as above. - [
Figure 12c ] Same as above. - [
Figure 12d ] Same as above. - [
Figure 12e ] Same as above. - [
Figure 12f ] Same as above. - [
Figure 13] Figure 13 shows classification of cOTUs in SCBGs from phylum to genus. Colors of dots, the same meanings as the colors of dots in Figure 11d. All SCBGs include a plurality of genera, and > 60% (19/31) of SCBGs include even a plurality of phyla, indicating SCBGs do not much correlate to taxa. Meanwhile, the present inventors found cOTUs from a plurality of SCBGs in all detected genera including ≥ 2 cOTUs, indicating that analyses at a level lower than the genus level, actually at a cOTU level, are important to understand the bacterial networks in the microbiota. - [
Figure 14] Figure 14 shows correlations among SCBGs.Figure 14a shows distributions of Rinner and Rinter. Row, distributions of Rinter between given SCBGs and all other SCBGs. SCBGs were aligned according to distributions of the mean (blue line) along the horizontal axis. - [
Figure 15] Figure 15 shows comparisons between technical replicates for two samples Madist and Maprox based on each cOTU count obtained by sequencing. Ma, a mouse; dist and prox, positions; 1, 2, and 3, technical replicates; r, Pearson coefficient. - [
Figure 16a] Figure 16a shows comparisons of the cell concentrations for each cOTU between technical replicates and between samples. Three examples Madist1-Ma dist3, Madist3-Ma prox2, and Mbdist-Mcprox (red asterisk symbols) are shown inFigure 16c . Ma, Mb, and Mc, mice; dist and prox, positions; 1, 2, and 3, technical replicates. Dot, a cOTU; magenta line, theoretical confidence interval (99.9%) of normalized sampling noises based on the Poisson distribution; light blue line, 2-fold change; blue dot, a cOTU showing a different concentration; insertion number for each, number of blue or grey dots. - [
Figure 16b ] Same as above. - [
Figure 16c ] Same as above. - [
Figure 17] Figure 17 shows SCBG IDs. The upper diagram shows trees of the same dendrogram as inFigure 4d and have cOTU IDs. In the lower diagram: positions of red squares, positions of SCBGs in the heat map shown inFigure 4d ; blue number, ID of each SCBG. - [
Figure 18] Figure 18 shows comparisons of ddPCR measurements using primer sets F1-Fw/F1-Rv and 341F/805R for the same sample.Figure 18a shows a distribution of fluorescence intensity of droplets measured by ddPCR of the cecal cell sample using primers F1-Fw and F1-Rv.Figure 18b shows the same measurements as inFigure 18a , except for usingdifferent primers Figure 18c shows four different Gaussian distributions corresponding to the distributions of fluorescence intensity ofFigure 18b and the sum of the mixed four Gaussian distributions.Figure 18d shows the proportion of positive droplets calculated based on fitting as a function of the number of fitted Gaussian distributions. Light blue, a cell sample subjected to amplification using primers F1-Fw and F1-Rv; blue, the same cell sample as used for light blue, except for usingprimers primers Figure 18e shows a comparison of ddPCR measurements between using primers F1-Fw/F1-Rv and usingprimers 341F/805R for the same sample; Proportion of positive droplets, calculated based on the fitting using 4 Gaussian distributions; Cells, the cellular sample; error bars, standard deviations, n=4d. - [
Figure 19] Figure 19 is a schematic view including the sequence information for preparation of a spike-in control. StdTarget1, StdTarget2, RandomBar_std1, Std_R2, P2_qPCR_Rv, and P1_qPCR_Fw, synthesized DNA oligonucleotide; "5Phos" in StdTarget2, phosphorylation at the 5' end of the oligonucleotide; index, eight nucleotides; N in the sequence, A, C, G, or T. - [
Figure 20] Figure 20 is a logic diagram of Step 3.2. - [
Figure 21] Figure 21 is a logic diagram ofStep 5. - [
Figure 22] Figure 22 shows distributions of lengths of the 16S rRNA genes in the V3-V4 region registered in the Silva database. Only the 16S rRNA genes matching theprimers - [
Figure 23] Figure 23 is a logic diagram ofStep 7. - [
Figure 24] Figure 24 is a logic diagram ofStep 8. - [
Figure 25] Figure 25 is a logic diagram ofStep 9. - [
Figure 26] Figure 26 shows characterization of RepSeq types with one-nucleotide difference by San sequencing.Figure 26a shows the mean counts of RepSeq types grouped based on San sequence (based on the Mock-a, Mock-b, and Mock-c data). Nucleotide differences, the number of nucleotide differences between RepSeq types and the closest San sequence (San sequence as ID group) in each group.Figure 26b shows the highest mean count of RepSeq types with one-nucleotide difference for the ratio of the mean count to the mean counts of matching RepSeq types in each group. Sky blue label, group ID. - [
Figure 27] Figure 27 shows clustering of Bar sequences into cOTUs.Figure 27a shows log10(Overlap) for log10(A × B) based on the Mock-b data. Dot, all possible Bar sequence pairs; overlap, A, and B, the numbers of BClusters including Bar sequences, only BS_A, and only BS_B, respectively (BS_A and BS_B are two Bar sequences in the pair). Blue broken line, 95% confidence interval of fitting.Figure 27b shows log10(Overlap) for log10(A × B) + OD based on the Mock-a, Mock-b, and Mock-c data. Dot, all possible Bar sequence pairs by three samplings (three dots for the identical Bar sequence pair); different strain, Bar sequence of the pair matching the San sequence identified from a different strain; JCM/ATCC number, Bar sequence of the pair matching the San sequence identified from a predetermined strain; green line, a one-sided 99.9% confidence interval of distributions of log10 (Overlap) obtained by simulation; yellow line, x = y; OD, log10(Droplets/µ) estimated by fitting inFigure 27a . It should be noted that Bar sequences contaminated with foreign substances were excluded from this plot (see Step 14). InFigure 27c , data were based on the M0-a, M0-b, and M0-c data as inFigure 27b . The name of each Bar sequence is based on the Silva database. Different name, different mapped names for Bar sequences of one pair; identical name (family), the same mapped name for Bar sequences of one pair. Only the names of the family or higher order taxa have been determined. Identical name (genus), the same mapped name for Bar sequences of one pair. Only the names of the genus or higher order taxa have been determined. Unknown, only one or neither of Bar sequences of one pair is registered in the database.Figure 27d shows distributions of Ratio_Positive (see Step 12). The results of specimens Madist1-3, Maprox1-3, Mbdist, Mbprox, Mcdist, and Mcprox. - [
Figure 28] Figure 28 shows comparisons of the mean counts (of three repeated measurements) of detected cOTUs between the mock cell population and M0. cOTUs not detected in M0 are not shown. JCM/ATCC, cOTUs matching the predetermined strain; cOTU <number>, cOTUs not matching any designed strain; I, II, and III, three categories (see Step 14). - [
Figure 29] Figure 29 shows breaking of bacterial agglutinates.Figure 29a shows JCM10188 bacterial aggregates before vortexing.Figure 29b shows examples of spots including one dot or a plurality of dots after vortexing.Figure 29c shows distributions of the number of dots per spot for each bacterial strain and the cecal sample after vortexing.Figure 29d shows the mean number of dots per spot for each bacterial strain and the cecal sample after vortexing. Figure 29f shows all spots including a plurality of dots among a total of 208 identified spots in the cecal sample. Yellow arrow, only this example seems to have two different shape dots in the identical spot. - [
Figure 30] Figure 30 shows measurements of bacteria by microscopic imaging.Figure 30a shows a comparison of phase difference light and fluorescent light (PI) of Escherichia coli (DH5α) in the visual field.Figure 30b shows an overview of the number of bacteria obtained by microscopic imaging.Figure 30c shows the ATCC700926 strain illuminated with fluorescence and phase difference and stained with PI. The threshold for removing the background is shown in Figure 30e. Red arrow, microspheres also observed by phase-difference illumination.Figure 30d shows enlarged images of A to E inFigure 30c . Color line, line profile used for measurement of brightness using ImageJ; number, a number for a bright spot (i.e., bacterium) shown in Figure 30e. Figure 30e shows brightness (gray values) measured along the line profile inFigure 30d . Broken line, threshold for removing the background (seeFigure 30c ). - [
Figure 31] Figure 31 shows controlled separations of ecDNA and cells.Figure 31a shows a comparison of different filtrates obtained by using Ultrafree (trademark)-MC centrifugal filters with a pore size of 0.1 µm, 0.22 µm, or 0.45 µm. Residues on the filter, samples that remained on the filter membrane; fluid that passed through the filter, liquid that passed through the filter membrane; abundance, total copy number measured by ddPCR.Figure 31b shows a comparison of the abundances of cells and ecDNA after filtration between measured by ddPCR and microscopic imaging. Abundance, the total number of copies measured by ddPCR or the total number of bright spots measured by fluorescence imaging.Figure 31c shows a comparison of separated ecDNA and cells using filtration and centrifugation. Abundance, same as inFigure 31a . - [
Figure 32] Figure 32 shows extracellular DNA and cells in the cecal sample.Figure 32a shows the ratio of the cell and ecDNA concentrations normalized by the total concentration. The total (100%) was defined as the sum of the cell and ecDNA concentrations. Error bar, propagation error calculated from the standard deviation of the cell and ecDNA concentrations based on calculation (n = 5).Figure 32b shows the ratio of the total concentration of isolated cells and ecDNA to the total concentration of unfiltered samples. Error bar, propagation standard deviation (n = 5). c and d, comparisons of the total cell and ecDNA concentrations and the unfiltered sample concentrations of Madist and Maprox at each cOTU concentration. Red dots are cOTUs in which ecDNA was detected, and black dots are cOTUs in which ecDNA was not detected. The results were compared for each of filtrations repeated three times. - [
Figure 33] Figure 33 shows dependence of the number of clusters (unique barcodes) on the random number of nucleotides designed for barcodes. The results ofSequence Run 1 are shown. - [
Figure 34] Figure 34 shows dependence of the number of cOTUs allowed to match 10 lines of San sequences for the mean value of reads per unique barcode. The data of Mock-b are shown. - [
Figure 35] Figure 35 shows the richness of cOTUs. InFigure 35a ,6 ,075 cells were subsampled for each sample. InFigure 35b , 3,000 cells were subsampled. Ma, Mb, and Mc, mice; dist and prox, positions; 1a, 2, and 3, technical replicates; error bar, standard error. - [
Figure 36] Figure 36 shows Bray-Curtis dissimilarity of the microbiota between the samples measured using the proportional abundance of cOTUs. Ma, Mb, and Mc, mice; dist and prox, positions; 1, 2, and 3, technical replicates. - [
Figure 37] Figure 37 shows a distribution (violin plot) of r of cOTU pairs (dots) from the same taxon. The color box surrounding the names at levels from phylum to family represents the ownership thereof. - [
Figure 38] Figure 38 shows dependence of the ratio of the mean concentrations between cOTUs on r. Dot, a cOTU pair; ratio, a value obtained by dividing a higher concentration by a lower concentration in the pair; yellow line, quantitative contour line (10% interval). - [
Figure 39] Figure 39 shows how the murine large intestine sample was subdivided using a brain slicer. Panels a to f show how a murine large intestine sample was placed on a brain slicer (Panel a), embedded (Panel b), frozen (Panel c), and sliced (Panels d and e) to obtain a sliced (subdivided) sample (Panel f). Panel g illustrates division into regions from the cecum (cecal side) towards the anus (anal side). Area C was further subdivided into the central portion and the peripheral portion (Panel g). - [
Figure 40] Figure 40 shows concentrations of barcode sequences in each sample. "-Cell" indicates the results in the absence of cells, and "+Cell" indicates the results in the presence of cells. The error bar represents a standard deviation (n = 4). - [
Figure 41] Figure 41 shows the relationships of the number of cycles in the third stage of ddPCR with the fluorescence intensity of droplets (Panel a) and with the proportion of positive droplets in all droplets (Panel b). The error bar represents a standard deviation (n = 4) . - [
Figure 42] Figure 42 shows the relationship between the reaction time at the third stage of ddPCR and the proportion of positive droplets in all droplets. The error bar represents a standard deviation (n = 4). - In the present specification, the term "subject" refers to a living organism, that is, an animal or a plant. Examples of subjects can include vertebrates: for example, mammals, fish, birds, amphibians, and reptiles, such as, for example, primates such as humans, chimpanzees, gorillas, orangutans, monkeys, marmosets, and bonobos and four-legged animals such as pigs, rats, mice, cows, sheep, goats, horses, cats, and dogs (e.g., carnivores, cloven-hoofed animals, odd-toed ungulates, and rodents).
- In the present specification, the term "cell" refers to a cell of a living organism and can be a cell of a bacterium, protozoa, chromista, animal, plant, and fungus. In the present specification, the term "singulated cells" means cells that exist in a form of being separated into individual cells. Therefore, a solution containing singulated cells means a solution containing one or more cells each of which exists separately. The solution containing singulated cells is preferably a solution in which all or most contained cells exist in a form of being separated into individual cells, but may contain a cell aggregate comprising two or more adhered cells as long as singulated cells are contained.
- In the present specification, the term "cell population" is a composition comprising a plurality of cells. The cell population generally comprises cells of a plurality of types, and each type can include a plurality of cells. The form of the composition can be a liquid or a solid.
- In the present specification, the term "microbiota" means a population of microorganisms. Naturally, various microbiotas exist. For example, microbiotas exist in soil, water (ocean, river, swamp, pond), air, and the epidermis, body hair, oral cavity, nasal cavity, gastrointestinal tract (e.g., the esophagus, stomach, small intestine, large intestine, cecum), and reproductive organ of animals; and outer skin and root of plants. The microbiota in an animal reflects or affects the health condition of the animal. A microbiota can comprise 10 or more types, 20 or more types, 30 or more types, 40 or more types, 50 or more types, 60 or more types, 70 or more types, 80 or more types, 90 or more types, or 100 or more types of microorganisms. A microbiota can include unknown microorganisms. Unknown microorganisms can be 10% or more, 20% or more, 30% or more, or 40% or more of the microorganism types included in a microbiota.
- In the present specification, the term "cellular barcode" means a nucleic acid having a unique nucleotide sequence allocated for each cell. Each cell can be linked to a cellular barcode having a different nucleotide sequence (i.e., a nucleotide sequence unique to the cell). Therefore, the number of cellular barcodes can represent the number of cells. Thus, the number of cells, which has been conventionally measured in quantitative manner, can be measured by converting numbers of nucleotide sequences to qualitatively assessable numbers. A sufficient number of different cellular barcodes can be prepared for the total number of cells present.
- In the present specification, the term "isolation" means separating a target substance from others. Isolation can include concentration or purification of the target substance after isolation.
- In the present specification, the "amplification product" means a nucleic acid obtained by amplification of a gene (e.g., polymerase chain reaction (PCR)). In PCR, two primers are designed to flank a DNA site to be amplified, and the portion flanked by the two primers is amplified by allowing to react with DNA polymerase under a predetermined condition. A primer can be a nucleic acid in the form of a single chain having a sequence that hybridizes with the DNA site to be amplified, but an additional nucleotide sequence (e.g., an adapter, an index sequence unique to the sample, a restriction enzyme recognition site) may be linked to the nucleic acid at the 5' end thereof.
- In the present specification, the term "paralog" means two genes arising from gene multiplication on the genome. In the present specification, the term "ortholog" means genes that exist in different organisms and have a homologous function.
- According to the present invention, a method for treating a cell population, the method comprising
- (A) obtaining a droplet population from a cell dispersion comprising an isolated cell population, the droplet population comprising aqueous droplets, at least some of which each comprise one cell and one-molecule cellular barcode
is provided. - According to the present invention,
a droplet population comprising aqueous droplets, at least some of which each comprise one cell and one-molecule cellular barcode is provided. In this embodiment, cells can be cells constituting an isolated cell population (e.g., a microbiota). - The cell dispersion of the above (A) can be obtained by dispersing cells included in the isolated cell population in an aqueous solution. Cells can be dispersed in a solution utilizing a shear stress of water caused by water flow, for example, by shaking, pipetting, or the like. The term "to disperse" means to disassemble a cell aggregate composed of a plurality of cells in an aqueous solution in order to obtain a plurality of single cells and, preferably, to suspend single cells in the aqueous solution. The method of the present invention can comprise dispersing cells included in an isolated cell population in an aqueous solution.
- In one embodiment, a cell population can be a microbiota. In this embodiment, a natural microbiota can be preferably used as the microbiota. Examples of microbiotas include soil, water (ocean, rivers, swamps, pond), air, and the epidermis, body hair, oral cavity, nasal cavity, gastrointestinal tract (e.g., esophagus, stomach, small intestine, large intestine, cecum), and reproductive organs of animals. Microbiotas present in the outer skin and roots of plants can also be used. For example, a microbiota in the gastrointestinal tract can be used. For example, such a microbiota can be a microbiota in the oral cavity, a microbiota in the esophagus, a microbiota in the stomach, a microbiota in the duodenum, a microbiota in the small intestine (e.g., the jejunum or the ileum), a microbiota in the cecum, or a microbiotas in the large intestine (e.g., the ascending colon, transverse colon, descending colon, sigmoid colon, rectum). A natural microbiota is preferably analyzed without being cultured, but analyzing after culturing the natural microbiota can be acceptable. In one preferred embodiment, a microbiota includes unknown microorganisms. In one preferable subject, the types of unknown microorganisms can account for 10% or more, 20% or more, 30% or more, or 40% or more of microorganism types included in a microbiota. In one embodiment, a cell population can include extracellular DNA. Extracellular DNA can include predetermined genes. Extracellular DNA may be removed before the cell population is treated. Extracellular DNA can be removed by filtration or centrifugation as described later. Extracellular DNA may be included in a cell population to be treated.
- A cell population is isolated by obtaining a cell population. Isolation of a cell population may further comprise separating the obtained cell population from one or more components that are not cells. The cell population can be separated from one or more components that are not cells by filtration or centrifugation. The filtration can be performed by using, for example, a filter having a pore size of submicrometers (e.g., 0.22 µm), and the cell population can be collected from residues on the filter.
- In the present invention, cells included in an isolated cell population can be dispersed in an aqueous solution before droplets are prepared. Here, the term "to disperse" means to allow individual cells to exist separately. Dispersion can be achieved by disintegrating a cell aggregate by pipetting without destroying cells. Aqueous solutions are not particularly limited as long as cells are not destroyed, and water, physiological saline, and the like can be used. The isolated cell population can be dispersed in pure water, physiological saline, a reaction mixture for gene amplification, or the like.
- In one embodiment, droplets can be prepared in oil. Therefore, in this embodiment, the droplet population obtained in (A) comprises aqueous droplets (water droplets) in oil. In other words, the droplet population obtained in (A) can be water-in-oil droplet type particles (a population of aqueous droplets dispersed in oil) .
- The particle size of the above-mentioned aqueous droplets can range from 10 µm to 100 µm as the lower limit and from 50 µm to 1,000 µm as the upper limit. The particle size of aqueous droplets can range, for example, from 10 µm to 1,000 µm, for example, 20 µm to 900 µm, 30 µm to 800 µm, 40 µm to 700 µm, 50 µm to 600 µm, 50 µm to 500 µm, 50 µm to 400 µm, 50 µm to 300µm, 50 µm to 200 µm, or 50 µm to 150 µm, or, for example, approximately 100 µm. Such a droplet population can be suitably prepared by those skilled in the art using, for example, a microfluid device. Such a droplet population can also be prepared using a commercially available droplet generator. As the commercially available droplet generator, for example, QX200 Droplet Generator of BIO-RAD Laboratories, Inc. can be used.
- According to the method for treating a cell population of the present invention, a droplet population comprising aqueous droplets which include aqueous droplets comprising one cell and one molecule of a cellular barcode (e.g., DNA) having one type of a nucleotide sequence unique to the cell can be obtained. More specifically, in the method for treating a cell population of the present invention, for example, a droplet population comprising aqueous droplets which comprise one cell and a single type of a cellular barcode unique to each cell can be obtained by mixing an aqueous solution containing a plurality of dispersed cells and an aqueous solution containing cellular barcodes having a nucleotide sequence different for each one molecule in oil.
- According to the method for treating a cell population of the present invention, another cell is included in aqueous droplets comprising a cellular barcode having another one type of a nucleotide sequence unique to the cell. The cell can be included in 50% or less, 40% or less, 35% or less, 30% or less, 25% or less, or 20% or less (e.g., 20%) of all droplets. The probability of a plurality of cells being contained in one droplet can be reduced by doing this. When it is assumed that cells are contained in 20% of droplets, in theory, the number of cells contained in, for example, 90% or more of cell-containing droplets is 1. Furthermore, cellular barcodes can also be contained in 50% or less, 40% or less, 35% or less, 30% or less, 25% or less, or 20% or less (e.g., 20%) of all droplets. By doing this, the number of cellular barcodes contained in, for example, 90% or more of cellular barcode-containing droplets can be 1. By doing this, droplets containing one cell and one molecule of a cellular barcode can be obtained, and the droplets can account for 1% to 10%, 2% to 6%, 3% to 5%, or, for example, approximately 4% of all droplets. In one embodiment, the proportion of cell-containing droplets to all droplets can be made 30% or less (preferably, approximately 20%), and the proportion of cellular barcode-containing droplets to all droplets can be made 30% or less (preferably, approximately 20%). Thus, by reducing the proportion of droplets containing a cell and a cellular barcode to all droplets, the possibility that two or more cells are mixed into one droplet and the possibility that two or more molecules of cellular barcodes are mixed into one droplet can be reduced or eliminated. Of note, the existence of droplets containing only one or neither of a cell and a cellular barcode does not affect the subsequent steps after sequencing a product of linking of a predetermined gene and a cellular barcode in a cell.
- In the obtained droplet population, the proportion of droplets containing two or more cells and one cellular barcode can be, for example, 0.5% or less, 0.4% or less, or 0.3% or less and can be, for example, 0.3% to 0.5%. In the obtained droplet population, the proportion of droplets containing one cell and two or more cellular barcodes can be, for example, 0.5% or less, 0.4% or less, or 0.3% or less and can be, for example, 0.3% to 0.5%. In the obtained droplet population, the proportion of droplets containing two or more cells and two or more cellular barcode can be, for example, 0.05% or less, 0.04% or less, or 0.03% or less and can be, for example, 0.03% to 0.05%. Here, a smaller number of droplets containing two or more cells or cellular barcodes are more preferred, but occurrence of such droplets is acceptable.
- Aqueous droplets may further contain primers and reagents for gene amplification in addition to one cell and one molecule of a cellular barcode. Since cells are destroyed during the gene amplification reaction, the reagents do not need to include a surfactant. Additionally, aqueous droplets can be an aqueous solution suitable for a gene amplification reaction (e.g., a gene amplification reaction solution).
- Any oils can be used as long as they are stable and inactive under an environment of a gene amplification reaction (60°C to 100°C). Examples of such oils include mineral oil (e.g., light oil), silicone oil, fluoride oil, and other commercially available oils, and combinations thereof, but are not limited to these examples.
- Under such a condition, a droplet population comprising aqueous droplets, at least some of which each comprise one of the obtained cells and one molecule of a cellular barcode can be obtained from an aqueous solution containing cells, cellular barcodes, primers, and reagents for gene amplification. More specifically, a gene amplification reaction mixture containing cells, cellular barcodes, primers, and reagents for gene amplification can be prepared to obtain a droplet population from this solution as described above.
- According to the present invention,
a method for determining (or analyzing) a gene sequence included in a cell population, comprising - (A) obtaining a droplet population from a cell dispersion comprising an isolated cell population, the droplet population comprising aqueous droplets, at least some of which each comprise one cell and one-molecule cellular barcode, and
- (B) obtaining an amplification product of the cellular barcode and an amplification product of a predetermined gene in each obtained droplet, further obtaining a linked product of nucleotide sequences of the cellular barcode and all or some of the predetermined genes, and sequencing the obtained linked product to determine the nucleotide sequences of the predetermined genes and the nucleotide sequences of the cellular barcodes
(hereinafter referred to as the sequencing method of the present invention) is also provided. - When droplets are formed, components required for gene amplification can be introduced into each droplet beforehand by mixing necessary components for PCR, excluding a template, such as a primer set for amplification of the cellular barcode and amplification of the predetermined gene in the cell, dNTPs, and thermostable DNA polymerase in a solution (e.g., a cellular barcode solution). Then, a liquid containing a droplet population is transferred into a tube for PCR, and a DNA amplification reaction can be induced in each droplet by PCR. The amplification product of the predetermined gene in the cell and the amplification product of the cellular barcode can be obtained in each droplet by gene amplification in each droplet. Amplification can include amplification cycles of, for example, 25 cycles, preferably, 30 or more cycles. Subsequently, the amplification product of the predetermined gene in the cell and the amplification product of the cellular barcode can be linked in each droplet (for example, see
Figure 5 ). Linking can be performed in a step of an amplification reaction (e.g., a PCR reaction) by, for example, designing one of primers for the cellular barcode and one of primers for the predetermined gene so that they have complementary sequence portions that are hybridizable with each other (for example, see SEQ ID NOS: 4 and 5 inFigure 5 ). By doing this, one type of a cellular barcode can be attached to each molecule of the amplification product of the predetermined gene derived from one cell. - A cellular barcode has a nucleotide sequence unique to the cell in the center thereof (however, nucleotide sequences with a specific position can be designed to be the same sequences among the sequences) and can have a nucleotide sequence at either end to hybridize with an amplification primer. In one embodiment, the nucleotide sequence to hybridize with an amplification primer can be a common sequence among cellular barcodes. The primers for amplification of the cellular barcode can have nucleotide sequences hybridizable with an adapter sequence for sequencing and one end of the cellular barcode under a gene amplification environment. A primer for amplification of the cellular barcode can further have an index sequence for identifying the type of a sample. The other primer for amplification of the cellular barcode can have a linker sequence for linking to the predetermined gene and a nucleotide sequence hybridizable with the other end of the cellular barcode under a gene amplification environment.
- A primer for amplification of the predetermined gene can have a nucleotide sequence to hybridize with a linker sequence contained in a primer for amplification of the cellular barcode and a nucleotide sequence to hybridize with a nucleotide sequence of the predetermined gene at the amplification site under a gene amplification environment. The other primer for amplification of the predetermined gene can contain a nucleotide sequence to hybridize with a nucleotide sequence of the predetermined gene at the amplification site under a gene amplification environment and a sequencing adapter sequence. The other primer for amplification of the predetermined gene can further have an index sequence unique to the sample to identify the type of the sample.
- The amplification product of the cellular barcode and the amplification product of the predetermined gene have the same linker sequence. Therefore, an amplification product of a linked product of the amplification product of the cellular barcode and the amplification product of the predetermined gene can be obtained during the gene amplification.
- A sequencing adapter sequence can contain a sequence for bridging PCR before sequencing at both ends. The sequencing adapter sequence can contain a site of binding to a sequencing primer. The sequencing adapter sequence can contain an index sequence unique to the sample to identify the type of the sample. The bridging PCR is a technique to hybridize DNA subjected to sequencing which has a sequence hybridizable with each of two types of solid-phase oligo DNA at either end and amplifying the DNA on a solid-phase surface by PCR in this state.
- Therefore, the present invention also provides a droplet population including aqueous droplets which comprise the amplification product of a predetermined gene derived from one cell, wherein one type of a cellular barcode unique to the cell is linked to each molecule of the predetermined gene. In this droplet population, each droplet comprises the predetermined gene derived from one different cell and one type of a cellular barcode unique to the cell (that is, a different cellular barcode is contained in each droplet).
- For each one molecule of the predetermined gene derived from one cell, a linked product linked to one type of a cellular barcode unique to the cell can comprise a sequencing adapter sequence, a cellular barcode sequence, a linker sequence, all or some of the nucleotide sequences of the predetermined genes, and a sequencing adapter sequence in this order, as described above. This linked product may further contain an index sequence having a nucleotide sequence unique to the sample. The index sequence can be flanked by any two of the sequencing adapter sequence, the cellular barcode sequence, the linker sequence, all or some of the nucleotide sequences of the predetermined genes, and the sequencing adapter sequence. The index sequence may be contained instead of a sequencing adapter sequence or in addition to the sequencing adapter sequence.
- In the present invention, a linked product of each molecule of the amplification product of the predetermined gene derived from one cell and the amplification product of one type of a cellular barcode unique to each cell can be prepared. Here, the predetermined gene is preferably of one type, but not limited to one type and can be of a plurality of types. The cellular barcode is preferably of one type for each cell.
- In the present invention, the determined nucleotide sequence of the predetermined gene and the nucleotide sequence of the cellular barcode are linked and managed for a certain linked product. It is estimated based on this link that the predetermined genes to which the identical cellular barcode is linked are derived from the identical cell. Therefore, the sequencing method of the present invention can further comprise obtaining a combination of nucleotide sequences comprising the determined nucleotide sequence of the predetermined gene and the nucleotide sequence of the cellular barcode for each linked product.
- Further, the sequencing method of the present invention can further comprise estimating that the predetermined genes to which the identical cellular barcode is linked are derived from the identical cell.
- In one embodiment of the present invention, the predetermined gene is an endogenous gene of a microorganism and can be preferably a gene widely shared by various species evolutionally, such as, for example, a housekeeping gene. The housekeeping gene is a gene which is essential for energy metabolism and cell function and expressed or may be expressed in every cell. Housekeeping genes are not particularly limited, but examples thereof include ribosomal RNA (rRNA for example, 16S rRNA and 23S rRNA), ribosomal intergenic transcribed spacer (ITS), which exist between 16S rRNA and 23S rRNA, putative ABC transporter (abcZ), adenylate kinase (adk), shikimate dehydrogenase (aroE), glucose-6-phosphate dehydrogenase (gdh), single-function peptidoglycan transglycosylase (mtg), putative dehydrogenase subunit (pdhC), phosphoglucomutase (pgm), regulator of pilin synthesis(pilA), proline iminopeptidase (pip), polyphosphate kinase (ppk), and 3-phosphoserine aminotransferase (serC) (refer to Maiden et al., PNAS, Vol.95, 3140-3145, 1998). The sequences of these genes can be used in analyses of microbiotas. Further, 18S rRNA can also be used in analyses of fungi. If two or more types of genes are predetermined, an amplification reaction is performed using suitable primers and reaction conditions, so that each gene is linked to the cellular barcode. Since a cell population is analyzed based on the nucleotide sequence of the predetermined gene in the method of the present invention, it is advantageous to use a gene found in as many cells as possible as the predetermined gene. In one embodiment of the present invention, the predetermined gene can be the gene coding for 16S rRNA. The nucleotide sequence of the predetermined gene can be a full-length or partial sequence of the gene. For example, in the case of 16S rRNA, the sequence to be determined does not have to be a full length and may be a portion thereof. The V3 region and the V4 region can be used as a portion of 16S rRNA.
- In the present invention, it is sufficient to use only one type of a gene (or a group of homologous genes) as the predetermined gene, and two or more types of different genes (or a group of two or more genes that are non-homologous to each other) do not need to be used. However, the predetermined gene may be two or more types of different genes (or a group of two or more genes that are non-homologous to each other).
- In the sequencing method of the present invention, sequencing can be performed by destroying droplets and mixing solutions contained in all droplets. In the sequencing method of the present invention, sequencing can be performed using methods known to those skilled in the art. For example, sequencing can be performed in parallel using a next-generation sequencer (e.g., MiSeq and HiSeq of Illumina, Inc.). By using such a sequencer that decodes sequences in parallel, several tens of thousands to several hundreds of millions of gene fragments can be analyzed rapidly. In this case, those skilled in the art can add a sequencing adapter to the linked product, if required for sequencing, and this step is known to those skilled in the art.
- The sequencing method of the present invention may further comprise collecting DNA in solutions before sequencing. DNA can be collected by collecting the aqueous phase separately contained in each droplet. For example, DNA can be collected by adding the obtained droplet population to an organic solvent (e.g., chloroform) and preferably further an aqueous solution (for example, buffer solutions, e.g., a Tris buffer solution containing a divalent metal ion chelator (e.g., Ca2+ chelator and Mg2+ chelator, for example, ethylenediamine tetraacetic acid (EDTA)) (i.e., Tris-EDTA buffer solution or TE solution)), stirring the mixture well, separating the aqueous phase and the organic phase, and collecting the aqueous phase. By doing this, target DNA (i.e., the linked product) discretely present in each compartment of a droplet in water-in-oil droplet type particles can be collected into the aqueous solution. In the aqueous solution thus obtained, all linked products derived from the contained droplets are mixed in the solution (a solution not divided into compartments by oil) (in other words, a state in which linked products discretely present in each droplet compartment exist in one solution compartment). Since nucleotide sequences of a large number of gene fragments can be decoded in parallel in sequencing as described above, a solution in which a large number of DNA are mixed is suitable for sequencing.
- Additionally, the sequencing method of the present invention may further comprise purifying DNA before sequencing. DNA can be purified by gel filtration of the aqueous solution obtained by the above-described collection step. Gel filtration can be performed by techniques usually used to separate the DNA amplification product and other components in the solution (e.g., an unlinked barcode amplification product, primers not used for amplification, others) using gel filtration columns or the like. For example, gel filtration columns for DNA purification can be used as gel filtration columns. Additionally, the sequencing method of the present invention may further comprise purifying DNA contained in a solution by using columns or beads coated with a carboxyl group. Dehydrated DNA can be adsorbed specifically to the columns or beads coated with a carboxyl group via a salt, and then can remove DNA from the columns by hydration. For example, Agencourt AMPure XP (Beckman Coulter, Inc.) or the like can be used as the beads coated with a carboxyl group.
- Further, when an amplification reaction of DNA is performed in the step of DNA amplification using tagged primers (e.g., biotinylated primers), which have a tag, a tag (e.g., biotin) has linked to the DNA amplification product. Such a tagged DNA amplification product can be concentrated or removed using columns or beads to which a molecule binding to the tag (e.g., tag-binding molecules such as avidin, streptavidin, and NeutrAvidin) is linked. In particular, when a linked product of the cellular barcode and the predetermined gene is obtained, the sequencing method of the present invention can preferably comprise removing cellular barcodes and predetermined genes that have failed to be linked. Specifically, one primer for amplification of a cellular barcode and one primer for amplification of a predetermined gene can be designed so that they have a tag and a complementary sequences. Specifically, a tag can be attached to only each of the primers designed to have complementary sequences. By doing this, as shown in
Figure 5 , the amplification product of the cellular barcode and the amplification product of the predetermined gene can be linked to each other in a region corresponding to the tagged primer portion. When the obtained linked product is further amplified by gene amplification, the amplification product of the linked product does not contain a tag, whereas an amplification product of the products that have failed to be linked has a tag derived from the primer at an end thereof. Thus, in one embodiment, in the above (B), one of two primers for amplification of a cellular barcode which has a sequence complementary to one of two primers for amplification of a predetermined gene (this one primer has a tag molecule) has a tag molecule. The tag molecule is lost from the linked product of the cellular barcode and the predetermined gene during amplification of the cellular barcode and the predetermined gene, and the tag molecule is to remain in only amplification products that have failed to be linked. Therefore, the amplification products that have failed to be linked can be removed by affinity using columns and beads to which a tag-binding molecule binds, and the amplification product of the linked product can be thereby purified in higher purity. - Therefore, in the sequencing method of the present invention,
- the amplification product of the cellular barcode has a first region derived from a first primer, the amplification product of the predetermined gene has a second region derived from a second primer, the first region and the second region have complementary sequence portions hybridizable with each other, the first primer and second primer each have one or more tag molecules linked thereto, and the tag molecule is not contained in the linked product in the (B), and the sequencing method of the present invention may further comprise
- removing amplification products having a tag molecule from the linked products collected in the aqueous solution, using columns or beads that carry a molecule having an affinity for the tag molecule in the (B). By doing this, amplification products having a tag molecule that have failed to be linked can be separated from the intended linked products.
- The sequencing method of the present invention may comprise eliminating a nucleotide sequence region with low sequencing quality. Sequencing quality can be assessed by, for example, using a quality score based on the Phred algorithm (e.g., Phred quality score such as, for example, Q score (Q = -10 log10(e), wherein e is an estimate of the probability of the basecall being incorrect)) (see Ewing et al., Genome Res., 8(3): 175-185, 1998 and Ewing and Green, Genome Res., 8(3): 186-194, 1998). As widely performed by those skilled in the art to reduce decoding errors in sequencing, sequences with a quality score being a certain threshold or lower can be excluded from the analysis. For example, sequences with a Q score of 20 or lower, 15 or lower, or 10 or lower can be excluded from the analysis.
- The sequencing method of the present invention may further comprise
(C-1) clustering the determined nucleotide sequences based on nucleotide sequence of the cellular barcode to obtain a plurality of first clusters. - In the above (C-1), the "determined nucleotide sequences" can be a combination of nucleotide sequences comprising the determined nucleotide sequence of the predetermined gene and the nucleotide sequence of the cellular barcode.
- Clustering the determined nucleotide sequences based on the determined nucleotide sequence of the cellular barcode can include not only clustering the nucleotide sequences of the cellular barcodes according to whether they are completely identical sequences, but also clustering sequences having some difference into the same cluster. The reason why sequences having some difference are clustered into the same cluster is that, in experiments, errors occur during the amplification reaction or sequencing of cellular barcodes, and the decoded nucleotide sequences can become different sequences from the original nucleotide sequences. However, errors that occur during the amplification reaction or sequencing are empirically well known. It is effective to cluster sequences having some difference into the same cluster not to distinguish identical sequences as different sequences because of the errors corresponding to such errors.
- For example, when clustering is performed according to a criterion that the determined nucleotide sequences of the cellular barcodes are completely identical (distance 0), the nucleotide sequences derived from one cell are clustered correctly into one cluster if neither amplification error nor sequencing error exists. Therefore, there is no problem in such a case. In contrast, if any amplification error or sequencing error exists, nucleotide sequences derived from one cell can be incorrectly clustered into two or more clusters as those derived from different cells, when clustering is performed according to the criterion that the determined nucleotide sequences of the cellular barcodes are completely identical (distance 0).
- In theory, with a criterion that sequences having an addition, elimination, deletion, or insertion (in particular, indel) of n nucleotides are also clustered into the identical cluster (distance n; n can be a natural number of 1 to 5), nucleotide sequences derived from one cell are to be correctly clustered into one cluster even if an addition, elimination, deletion, or insertion (in particular, indel) of up to n nucleotides arises from an amplification error or a sequencing error. Here, those skilled in the art can suitably select n based on the error rate in the amplification reaction or the sequencing error rate. When n is set to be large, the cellular barcodes can be designed to be always different for each cell by more than n nucleotides. In one embodiment of the present invention, n can be set as 1. In another embodiment of the present invention, n can be set as 2. In yet another embodiment of the present invention, n can be set as 3. Even if an addition, elimination, deletion, or insertion (in particular, indel) of up to n nucleotides occurs, the cellular barcode from which a nucleotide sequence having such an error is derived can be determined by designing the determined nucleotide sequences of the cellular barcodes so that the sequences are very different for each cell. Clustering can be expected to have an effect of reducing such impacts of experimental errors. Clustering can be performed with reference to
WO 2018/235938 , which is incorporated into the present specification as a whole. - Given that the cellular barcode is a sequence unique to each cell, in theory, a linked product including the identical cellular barcode should be linked to only the predetermined gene derived from the identical cell. Therefore, the predetermined genes derived from the identical cell can be determined by clustering the determined nucleotide sequences (including amplification products of the cellular barcodes and the predetermined genes) based on the nucleotide sequence of the identical cellular barcode. If only one predetermined gene exists in a cell, in theory, only one sequence is detected for the predetermined gene in the first cluster obtained in the above (C-1). In contrast, if a plurality of predetermined genes exists in a cell, in theory, the first cluster obtained in the above (C-1) can include two or more sequences (paralogs) for the predetermined gene. Therefore, in the method for analyzing a cell population of the present invention further comprising the above (C-1), the existence of cells having a multiplication(copy, paralog, or the like) of the predetermined gene can be detected in the cell population.
- Further, in the above description, it can be estimated in the method of the present invention that the number of cells is, in theory, equal to the number of cellular barcode types or the number of clusters obtained based on the nucleotide sequence of the cellular barcode. Therefore, there is an advantage that the multiplication of the predetermined gene in one cell would not affect the accuracy of the number of cells to be calculated.
- Therefore, the method for determining the gene sequences included in the cell population of the present invention may further comprise
(D-1) estimating the number of cells included in the cell population or the number of cells having a specific predetermined gene from the obtained number of the first clusters. - Further, in the above description, the determined nucleotide sequences were clustered based on the nucleotide sequence of the cellular barcode to obtain a plurality of first clusters. In contrast, in the following embodiments, the method for analyzing a cell population of the present invention can comprise clustering the nucleotide sequences determined based on the determined nucleotide sequence of the predetermined gene.
- Specifically, the method for analyzing a cell population of the present invention may further comprise
(C-2) clustering the nucleotide sequences determined based on the determined nucleotide sequence of the predetermined gene to obtain a plurality of second clusters. - Clustering nucleotide sequences determined based on the nucleotide sequence of the predetermined gene to obtain a plurality of second clusters can comprise not only clustering sequences according to whether they are completely identical, but also clustering sequences having some difference into the same cluster. The reason for clustering sequences having some difference into the same cluster is that errors can occur in sequences during the amplification reaction or sequencing of the cellular barcode in experiments.
- For example, when clustering is performed according to a criterion that the determined nucleotide sequences of the predetermined gene are completely identical (distance 0), the nucleotide sequences derived from one cell are clustered correctly into one cluster if neither amplification error nor sequencing error exists. Meanwhile, in theory, with a criterion that sequences having an addition, elimination, deletion, or insertion (in particular, indel) of n nucleotides are also clustered into the identical cluster (distance n; n can be a natural number of 1 to 5), nucleotide sequences derived from one type of a gene are to be clustered into the same cluster even if the addition, elimination, deletion, or insertion (in particular, indel) of up to n nucleotides arises from an amplification error or a sequencing error. In one embodiment of the present invention, n can be set as 1. In another embodiment of the present invention, n can be set as 2. In yet another embodiment of the present invention, n can be set as 3. Here, n can be suitably selected by those skilled in the art. The number of the obtained clusters corresponds to the number of the types of the predetermined genes.
- The sequences of predetermined genes are not understood for all microorganisms. However, in the sequencing method of the present invention, the cell population may include unknown microorganisms. This is because the unknown microorganisms can be treated as different microorganisms from known microorganisms as long as the unknown microorganisms have a predetermined gene having a nucleotide sequence that can distinguish them from other microorganisms.
- By the way, if the nucleotide sequence of the predetermined gene in an unknown microorganism is different from the sequence of a known predetermined gene only by a distance of n or less, it is possible in the above-mentioned method that the unknown gene and the known gene may be clustered into the same cluster and may be estimated to be derived from the identical gene even if they have essentially different nucleotide sequences.
- Therefore, the above (C-2) can further comprise a further step:
(C-2α) determining the most abundant nucleotide and determining the second most abundant nucleotide at one position of different nucleotide sequences when different nucleotide sequences of the predetermined genes are included in one cluster, and clustering nucleotide sequences having the most abundant nucleotide and nucleotide sequences having the second most abundant nucleotide into separate clusters when the ratio (Ratio2nd) of the number of nucleotide sequences (i.e., the number of reads) having the second most abundant nucleotide to the number of nucleotide sequence (i.e., the number of reads) having the most abundant nucleotide at the position is a predetermined value or higher. By doing this, different sequences derived from an essentially different gene among nucleotide sequences classified into the identical cluster can be treated as different sequences. By doing this, the frequency of assessing a different gene as identical by Step (C-2) can be reduced. - Step (C-2α) can be continued until Ratio2nd, a difference in nucleotide sequences, becomes lower than a predetermined value for all nucleotide sequences. The predetermined value can be a number of, for example, 0.6 or higher, 0.65 or higher, 0.7 or higher, 0.75 or higher, or 0.8 or higher. This is because, if the nucleotide sequence really exists, it should be contained in a plurality of cells and would be detected with a certain proportion. Meanwhile, since errors occur in low frequency, errors and originally existing sequences can be distinguished by this assessment.
- In Step (C-2α), the above-mentioned number of reads may be weighted by the quality score for the nucleotide sequence of the predetermined gene. The quality score can be a score determined based on, for example, the Phred algorithm, for example, a Phred quality score, or, for example, Q score. When the quality score is lower than the predetermined value, the number of reads may be weighted with a low value (for example, 0). When the quality score is higher than the predetermined value, the number of reads may be weighted with a high value (for example, depending on the value of the score). This is as described in Step 3.2 in the Examples.
- By this step, a nucleotide sequence having the most abundant nucleotide is designated as a "representative nucleotide sequence" (RepSeq) of the cluster.
- When a shift of nucleotides is found for different RepSeqs (in other words, two nucleotide sequences match when the nucleotide sequences are shifted), a RepSeq found in more first clusters is designated as Mother, and a RepSeq found in less first clusters is designated as Shift. When the shifted nucleotide sequences are eliminated, it can be assumed that the clusters have the nucleotide sequence of Mother. At this time, the count (number of reads) of the shifted nucleotide sequences can be added to the number of reads in the Mother RepSeq. This is done as described in
Step 5 in the Examples. - Step (C-2α) may further comprise excluding nucleotide sequences detected only with a single read as an error.
- If the same sequence is detected in a plurality of first clusters, it is possible that the sequence has truly existed. Therefore, the precision of determining the nucleotide sequence is increased by performing Step (C-1) and Step (C-2) in combination. Additionally, whether a plurality of predetermined genes have existed in one cell can be determined by performing Step (C-1) and Step (C-2) in combination.
- By doing this, the present invention can
(D-2) estimate the number of types of cells included in a cell population (how many types of cells are included in a cell population) from the number of the obtained second clusters. - Therefore, the method for determining gene sequences included in a cell population of the present invention may further comprise
(C-3) clustering the determined nucleotide sequences based on the determined nucleotide sequence of the cellular barcode to obtain a plurality of first clusters, and clustering the determined nucleotide sequences based on the determined nucleotide sequence of the predetermined gene to obtain a plurality of second clusters. - The details and effects of the clustering step described herein are as described in the above (C-1) and (C-2). In the above (C-3), a second cluster may be formed for each first cluster, or a first cluster may be formed for each second cluster.
- The method for determining gene sequences included in a cell population of the present invention may further comprise
(D-3) determining a first cluster into which the nucleotide sequence of the predetermined gene is classified from the nucleotide sequence of the cellular barcode linked to nucleotide sequence of the predetermined gene classified into at least one second cluster based on information about a combination of the obtained nucleotide sequence of the cellular barcode and the nucleotide sequence of the predetermined gene, and estimating the number of cells classified into the second cluster from the number of the first clusters into which the cellular barcode is classified. - Here, the nucleotide sequences of the predetermined genes were classified: out of two nucleotide sequences with a distance of n (e.g., two nucleotide sequences having a difference of one loss or deletion (i.e., 1-indel) in the central portion of the sequence), a nucleotide sequence classified into more first clusters is designated as Mother (that is, a nucleotide sequence detected in more cells is designated as Mother), and the other one classified into less first clusters is designated as 1-Indel. The number of first clusters in which the number of reads in Mother is more than the number of reads in 1-Indel (NoMother) and the number of first clusters in which the number of reads in Mother is less than the number of reads in 1-Indel (No1-Indel) are compared. If NoMother is larger than No1-Indel, the pair of Mother and 1-Indel can be kept. Further, if the ratio of No1-Indel to the number of first clusters including both Mother and 1-Indel is smaller than a predetermined value (e.g., (No1-Indel - 3) /No1-Indel), the pair of Mother and 1-Indel can be kept. After a 1-indel is deleted from the remaining pairs of Mother and 1-Indel, the number of reads in 1-Indel can be added to the number of reads in Mother. Further, if two different Mothers exist for the same 1-Indel, the number of reads can be added to Mother found in more first clusters. Further, if there is a first cluster in which 1-Indel alone is detected without Mother, the number of reads in 1-Indel can be assumed as the number of reads in Mother in the cluster. This is done as described in
Step 7 in the Examples. - Further, one amplification product may be linked to another amplification product during the process of gene amplification, and the resulting occurrence of a chimeric molecule can be a problem. Although the Examples show that the frequency of generation of chimeric molecules is clearly very low in the method of the present invention, the method of the present invention can further comprise identifying the chimeric molecules. Chimeric molecules can be identified as follows. For example, if the ratio (N_d/Total_N) of the number of first clusters including only chimeric molecules and not including Parents (N_d) to the number of first clusters including a chimeric molecules (Total_N) is a certain value or lower which is lower than 1, these chimeric molecules are considered to have arisen from errors and can be excluded from RepSeqs. This is done as described in
Step 8 in the Examples. - In addition to the above-described (C-2), the method of the present invention may further comprise creating a cell-based operational taxonomic unit (cOTU). The numbers and types of microorganisms included in a cell population are often unknown. Further, when unknown microorganisms exist, analyses of gene sequences in the cell population would be insufficient with information about known gene sequences registered in databases alone. In particular, when an operational taxonomic unit (OTU) is formed based on the nucleotide sequence of a predetermined gene, and one microorganism species has n multiplications for the predetermined gene, an error occurs because the count of the microorganism species would be n times more than the correct count. Additionally, if one of two different microorganism species has nucleotide sequences A and B, and the other one has A and C, and an operational taxonomic unit (OTU) is formed based on the nucleotide sequence, three OTUs corresponding to A, B, and C would be formed, and the number of cells would have an error by the count of A. Accordingly, in (C-4), cOTUs are formed from the information of RepSeqs to reduce the above-mentioned error in the count obtained when cells having a gene multiplication are included in the cell population. Of note, in theory, cOTU is a classification unit for microorganisms classified by the nucleotide sequence of the predetermined gene and a technical means for more detailed classification of microorganisms that was able to be classified only into high-order taxa so far. This technique is particularly useful for analyzing a cell population including microorganisms that have not been classified in details or unidentified microorganisms. If classification is possible, it would be advantageous because differences between cell populations can be compared based on the classification.
- A cOTU can be formed as follows. Specifically, as in conventional methods, one second cluster can be assumed as one cOTU. In consideration that two or more second clusters are included in one cell, however, the present invention can further comprise classifying a plurality of second clusters linked to the identical cellular barcode into one cOTU.
- In other words, in addition to the above-described (C-3), the method of the present invention may further comprise, for example,
(C-4) classifying second clusters into an identical cell-based operational taxonomic unit (cOTU, i.e., an identical cell type) when sequences classified into an identical first cluster are classified into different second clusters. - This formation of cOTUs may further comprise excluding experimental errors (for example, when two cells are contained in one droplet and analyzed, the nucleotide sequences of the predetermined gene derived from two cells are thereby detected in one first cluster).
- If two nucleotide sequences of the predetermined gene linked to one cellular barcode sequence exist, the probability that two cells get mixed in one droplet, in theory, follows the Poisson distribution. Since the above-mentioned error type A appears to be an error that depends on the cell concentration during the preparation of droplets, it is considered that the error frequency can be reduced by reducing the cell concentration during preparation of droplets (a concentration at which cells are contained in 20% of droplets was used in the Examples). Additionally, the probability that two nucleotide sequences exist in different cells but are contained in one droplet during the operation, in theory, follows the Poisson distribution.
- If a plurality of RepSeqs labeled with one cellular barcode (RepSeqs may be sequences after elimination of various errors in the above-described steps, which is preferred) exist, all these RepSeqs are picked up. The number of droplets containing two RepSeqs is expressed as (Overlap). The probability that two RepSeqs derived from different cells are contained in one droplet (Poission_Overlap) can be expressed as (A × B × µ)/total number of droplets, wherein the total number of cells is the total number of droplets containing the cellular barcode, A is the number of droplets containing one RepSeq, B is the number of droplets containing the other RepSeq, and µ is an integrated parameter for detection efficiency in droplets that can include PCR amplification efficiency, sequencing depth effect, and the like. Here, the expression,
- (Poission_Overlap) = (A × B × µ)/total number of droplets, can be converted to
- log10(Poission_Overlap) = log10{(A × B × µ)/total number of droplets}.
- Further, in theory, the results of RepSeqs for the same microorganism are considered the same in different samples. Therefore, even if it is reproduced in different samples, a plurality of different cell population samples can be measured to obtain the ratio of the number of samples for which the value of log10 (Overlap) to the number of samples including two RepSeqs is outside the confidence interval of log10 (Poission_Overlap). If this ratio is larger than a certain value (for example, a certain value can be a number of 0.4 or more), it can be estimated that two RepSeqs are derived from one cell.
- Further, two RepSeqs classified into the same first cluster are found to exist in the identical cell, and these two RepSeqs can be therefore classified into a cOTU. Thus, the second cluster can be re-classified as cOTU.
- Or, if the predetermined gene is 16s rRNA, a predicted taxon having the highest score can be created by classification using the RDP classifier or machine learning using a training set of 16s rRNA in the RDP classification, and this taxon can be used as a cOTU. Of note, the RDP classifier is a tool for determining a microorganism species from the nucleotide sequence of 16S rRNA developed by the Ribosomal Database Project.
- Further, the method of the present invention may further comprise correcting (or standardizing) the total number of cells calculated by the method of the present invention using the total number of cells estimated from the count obtained by optical microscopy or the like. The precision of predicting the number of cells (e.g., the number of cells in a specific cluster or the number of cells in a specific cOTU) calculated by the method of the present invention can be improved by correcting (or standardizing) the total number of cells.
- The method of the present invention can be used for a comparison of two different cell populations. Further, the method of the present invention can further comprise
(E) for each of a first cell population and a second cell population that is different from the first cell population, estimating (i) the number of cOTUs and/or (ii) the number of cells included in a specific cOTU included in the cell population, and comparing (i) the number of cOTUs and/or (ii) the number of cells included in the specific cOTU estimated for the first cell population with (i) the number of cOTUs and/or (ii) the number of cells included in the specific cOTU estimated for the second cell population. - In the above-described (E), the numbers of cells in the cell populations to be compared can be made equal beforehand. In the above-described (E), the characteristics of each cell population can be described in view of cOTUs by comparing the number of cOTUs and the number of cells included in each cOTU between two different cell populations.
- Two cell populations can be, for example, cell populations isolated from an identical site of an identical subject at different timepoints, can be cell populations isolated from different sites of an identical subject at an identical timepoint, or can be cell populations isolated from an identical site of different subjects at an identical timepoint.
- When cell populations isolated from an identical site of an identical subject at different timepoints are compared by the above-described (E), differences associated with the sampling times (e.g., changes with time in a health condition, differences in a health condition before and after a treatment, onset or progression of a disease or a condition) are to be described in view of cOTUs. Further, when cell populations isolated from different sites of an identical subject at an identical timepoint are compared by the above-described (E), differences associated with the sampling sites (e.g., differences of microbiota for each organ) are to be described in view of cOTUs. Further, cell populations isolated from an identical site of different subjects at an identical timepoint are compared by the above-described (E), differences associated with the subjects (e.g., health condition, sex, region, race) are to be described in view of cOTUs.
- The method of the present invention may further comprise
(F) comparing (i) the number of cOTUs and (ii') the number of cells included in a specific cOTU which are estimated for the first cell population with (i) the number of cOTUs and (ii') the number of cells included in a specific cOTU which are estimated for the second cell population. - In the above-described (F), a correlation between the number of cOTUs estimated for the first cell population and the number of cOTUs estimated for the second population can be determined.
- In the above-described (F), one or more specific cOTUs estimated for the first cell population and one or more cOTUs estimated for the second cell population which correspond to the one or more cOTUs can be compared. Here, whether a cOTU estimated from one cell population corresponds to a cOTU estimated from another cell population can be checked by confirming whether all nucleotide sequences (or nucleotide sequences after correction of errors) included in the cOTU are identical. In the above-described (F), in particular, whether an increase or decrease in the number of cells included in each cOTU correlates positively or negatively or does not correlate (weakly correlate) with an increase or decrease in the number of cells included in other cOTUs can be determined. By doing this, the network between cOTUs can be estimated.
- Or, in the field of synecology, cell populations (these cell populations include a plurality of cOTU taxa, and the number of cells has been determined for each cOTU taxon) can be compared using various indices which serve as indices for similarity between groups. For example, the similarity between the first cell population and the second cell population can be obtained as the root mean square of a difference in the number of cells included in each cOTU (c.f., Euclidean distance). Further, the similarity between the first cell population and the second cell population can also be obtained as the sum of absolute values of a difference in the number of cells included in each cOTU (c.f., Manhattan distance). The cell populations are shown to be more dissimilar as these numerical values are larger. If the cell populations are completely identical, the numerical value is 0. Bray-Curtis dissimilarity (index) is a standardized Manhattan distance. When the cell composition of the first cell population is assumed as (X11, ..., X1n), and the cell composition of the second cell population is assumed as (X21, ..., X2n), the Bray-Curtis index can be obtained by the following expression:

- The Bray-Curtis index is 1 when two groups are completely different and 0 when they completely match. Thus, the Bray-Curtis index may be referred to as dissimilarity because this index has been designed to become larger when the groups are more different. The Bray-Curtis index can be calculated using a statistical processing program (e.g., R package vegan function such as, for example, vedist function). In addition, similarity can be assessed using assessment indices commonly used in the field of synecology, such as Morishita index, Jaccard index, and Chao index. The standard deviation and the confidence interval of the estimated similarity can be assessed by the bootstrap method and the like.
- The method of the present invention can further comprise
(G) performing hierarchical clustering for cOTUs. - Hierarchical clustering can be performed by methods known to those skilled in the art based on, for example, the intensity of correlation between cOTUs (e.g., Spearman correlation coefficient r). Hierarchical clustering may be performed by methods known to those skilled in the art based on the distance between cOTUs calculated from r. The distance can be calculated by, for example, 1 - minimum (|r'|) [r' ∈ (r - OCI, r + OCI)], wherein OCI represents a one-sided 90% confidence interval of each r. The results of hierarchical clustering can be expressed as evolutionary trees. This can be performed by, for example, R package hclust or Pheatmap. Further, a network of cOTUs with a Pearson correlation coefficient r being a threshold or higher (e.g., 0.5 or higher, 0.6 or higher) can be illustrated using a package igraph. Thus, correlations between cOTUs can be illustrated based on the relationship of cOTUs in a plurality of cell populations.
- When cOTUs correspond to known microorganisms, correlations between known microorganisms can be characterized. Even if cOTUs correspond to unknown microorganisms, correlations between cOTUs can be characterized. When one cOTU corresponds to one known microorganism, a correlation between the known microorganism and another microorganism (this another microorganism may be unknown or known) can be characterized. Further, when two correlating cOTUs correspond to two known microorganisms, they can be used to find a new correlation between two known microorganisms and the like. Thus, when n correlating cOTUs correspond to n types of known microorganisms, new correlations between n types of known microorganisms can be found. Thus, the method of the present invention can be used to characterize correlations between microorganisms by investigating a plurality of cell populations (e.g., a plurality of microbiota). The health condition of a subject may correlate with the microbiota in the subject. Therefore, by further investigating a correlation between the health condition of a subject and one cOTU, the health condition of the subject can be predicted from a cOTU corresponding to an unknown microorganism even if the cOTU itself is the unknown microorganism (it should be noted that the cOTUs themselves are common among different samples). Further, in addition to the correlation between the health condition of the subject and one cOTU, the precision of predicting the health condition of the subject from cOTUs can be improved by further investigating a correlation of the cOTU with another correlating cOTU.
- Thus, while previous analyses have been based on the precondition that one microorganism has one predetermined gene, the present invention provides a method for describing a microorganism using a new group concept of cOTU even if one microorganism has a plurality of predetermined genes. Further, the number of cells included in each cOTU can be accurately counted by counting the number of cells using a cellular barcode qualitatively for each cOTU. When the cell population to be analyzed is analyzed by the method of the present invention, the type of cOTUs included therein and the number of cells included in each cOTU can be obtained. A cell population including unknown microorganisms can also be analyzed in further detail using information of the unknown microorganisms by analyzing the obtained cell population, types of cOTUs, and the number of cells included each cOTU.
- Further, the present invention has an advantage that analytical precision is not deteriorated even if the gene copy number varies depending on the cell. In other words, the gene copy number in a cell may vary in an identical microorganisms. In such a case, the gene copy number might affect the cell count in conventional methods. Since the number of cells is counted qualitatively using the cellular barcode in the method of the present invention, cells can be counted without being affected by gene copy numbers in the cell. Some microorganisms release substances that affect the environment (e.g., toxic substances and growth factors). Measuring the number of cells accurately enables more accurate estimation of the amount of the released substances and can pave the way for developing a mathematical modeling based on the volume of the released substances.
- In the method of the present invention, the gene to be sequenced may be one specific type of a gene or a plurality of types of genes. In the method of the present invention, the gene to be sequenced does not need to be the whole genome.
- Furthermore, in conventional methods, for example, nucleotide sequences of all the genes coding for 16S rRNA included in the cell population are sequenced in the analysis of 16S rRNA, and the obtained nucleotide sequences are classified based on a threshold. For example, 97% is selected as a threshold for identity, and analyses are performed assuming that genes with identity of 97% or higher are the same gene. In such analyses, however, microorganisms that should belong to biologically different taxa by nature, such as different species, different genera, or different families, were to be recognized as one group. However, the method of the present invention can determine whether a new 16S rRNA is truly new or arises from an experimental error. For example, an identical sequence found in a plurality of cells can be a sequence that exists by nature, and it can be confirmed using a cellular barcode. Thus, the method of the present invention can be an assessment method that is not affected by the similarity of nucleotide sequences when the nucleotide sequences are different.
- In the Examples, a mock microbiota composed of known bacteria at known concentrations (herein referred to as "a mock cell population") was prepared to verify the assay system, and then an actual microbiota (here the cecal microbiota) was investigated.
- A mock cell population comprising human intestinal bacterial strains (ATCC29098, ATCC700926, DSM14469, JCM1297, JCM5824, JCM5827, JCM9498, JCM10188, JCM14656, and JCM17463) was prepared.9 Table 1 lists the names, supply sources, media, and culture conditions of these strains. Cultured bacteria were preserved in the original medium with 10% glycerol or in phosphatebuffered saline (PBS) at -80°C until experiments (Table 1). After cultured, JCM14656 and DSM14469 were centrifuged and washed once with PBS. JCM10188 was cultured on GAM agar (Nissui), and bacterial colonies were collected and vortexed at 3,200 rpm for 1 minute to suspend the bacterial cells in PBS (
VORTEX GENE 2; Scientific Industries). - Ten strains were diluted with PBS and mixed at prespecified concentrations in a class II biosafety cabinet (Table 1). Following each step of dilution and mixing, the mixture was vortexed at 3,200 rpm for 1 minute. This mixture of 10 strains is referred to as a "mock cell population." The mock cell population was preserved at - 80°C until experiments.
-
Table 1: Names, supply sources, media, and culture conditions of bacterial strains Bacterial name Strain ID Supply source Medium Culture condition Wash Preservation Concentration* Phylum Gram positive/ negative** Collinsella aerofaciens JCM 10188 RIKEN BRC GAM Agar Anaerobic condition - ## 7.8±2.7×10² Actinobacteria + Bacteroides caccae JCM9498 RIKEN BRC GAM Anaerobic condition - # 3.7±1.1×10⁴ Bacteroidetes - Bacteroides ovatus JCM5824 RIKEN BRC GAM Anaerobic condition - # 3.3±1.3×10² Bacteroidetes - Bacteroides thetaiotaomicron JCM5827 RIKEN BRC GAM Anaerobic condition - # 3.8±1.1×10⁴ Bacteroidetes - Blautia hydrogenotrophica JCM 14656 RIKEN BRC GAM Anaerobic condition PBS ## 1.3±0.5×10² Firmicutes + Clostridium symbiosum JCM1297 RIKEN BRC GAM Anaerobic condition - # 5.5±2.3×10² Firmicutes + Eubacterium rectale JCM 17463 RIKEN BRC GAM Anaerobic condition - # 7.2 ±2.9×10³ Firmicutes + Marvinbryantia formatexigens DSM 14469 DSMZ PYG Anaerobic condition PBS ## 1.6±0.7×10² Firmicutes + Desulfovibrio piger ATCC29098 ATCC ATCC medium 1249 Anaerobic condition - # 1.6±0.5×10³ Proteobacteria - Escherichia coli ATCC700926 ATCC LB Aerobic condition - # 1.0±0.2×10⁴ Proteobacteria - - The symbols in the above table are as follows:
- * Concentration of added cells that was measured by microscopic imaging for formation of the mock cell population (mean ± S.D., n = 5, cells/µL)
- ** +, Gram-positive; -, Gram-negative
- # Preserved in a medium with 10% glycerol at -80°C.
- ## Preserved in phosphate buffer saline (PBS) at -80°C. GAM, Gifu Anaerobic Medium (Nissui).
- GAM Agar, Modified GAM Agar (Nissui)
- LB, Luria-Bertani (Nacalai Tesque).
- PYG, Peptone Yeast Glucose,
DSMZ medium 104. - ATCC medium 1249, Modified Baar's medium for sulfate reducers.
- The concentration of each strain was measured by fluorescence imaging under a microscope. Fluorescencestained bacteria were measured using polystyrene microspheres (Bacteria Counting Kit; Thermo Fisher Scientific). Bacterial cells were heated at 70°C for 5 minutes and stained using propidium iodide (Thermo Fisher Scientific). The volume was calculated based on the microsphere concentration measured using a bacteria cell counting chamber (SomaLogic, Inc.). Five independent measurements were performed for each bacterial strain. The mean concentration and the standard deviation (as an error bar) of these five measurements were used to calculate the concentration of each bacterial strain in the mock cell population.
-
Table 2: Designing cell counts and absolute concentrations for the mock cell population Lineage ID cOTU ID Number of cells (a) Number of cells (b) Number of cells (c) Mean Standard deviation Absolute concentration (cells/µL) Standard deviation ATCC700926 COTU-MK-01 4815: 4918 4855 4863 52 1.63E+04 2E+02 JCM9498 CCTU MK-02 9639 10181 10353 10058 372 3.36E+04 1.2E+03 JCM5827 COTU-MK-03 7712 7461 7459 7544 145 2.52E+04 5E+02 JCM17463 COTU-MK-04 5185 4773 4796 4918 232 1.64E+04 8E+02 ATCC29098 COTU-MK-05 517 555 477 516 39 1.73E+03 1.3E+02 JCM 10188 COTU-MK-06 132; 138 125 132 6 4.40E+02 2.2E+01 DSM14469 COTU-MK-07 21 20 14 18 4 6.1E+01 1.3E+01 JCM1297 COTU-MK-08 78 111 108 99 18 3.3E+02 6E+01 JCM5824 COTU-MK-09 73 60 44 59 15 2.0E+02 5E+01 JCM14656 COTU-MK-10 39 31 34 35 4 1.2E+02 1E+01
The absolute concentration was obtained by normalizing a raw count value determined by sequencing by the total concentration (94,400 cells/µL) of the mock cell population measured by droplet digital PCR (ddPCR). - The 16S rRNA gene of each strain was amplified using 2 × KAPA HiFi HotStart ReadyMix (Roche) and primers F1-full-Fw and F3-full-Rv (Table 3). Subsequently, the amplified 16S rRNA gene was cloned in a pCR-Blunt II-TOPO vector and amplified with E. coli using Zero Blunt TOPO PCR Cloning Kit (Thermo Fisher Scientific).
Subsequently, the 16S rRNA gene was amplified from each single colony of E. coli using T7-Promoter and SP6-Promoter as primers (Table 3). Finally, the V3-V4 region of the 16S rRNA gene amplified from each colony was sequenced by Sanger sequencing (Fasmac Co., Ltd.) using the F2-Rv primer (Table 3). -
Table 3: Sequences of primers and barcodes Primer name Nucleotide sequence 341F 5'-CCTACGGGNGGCWGCAG-3' 805R 5'-GACTACHVGGGTATCTAATCC-3' P7-R2P-341F 
Biotin-link-805R 
Biotin-Link-barcode-F 
P5-index-RIP-barcode-R 
NoBiotin-Link-barcode-F 5'-CGACTACGATCCGAACGCAGGAGCTCAGCCTCGACAGTCCAGTG-3' F1-Fw 5'-AGRGTTTGATYMTGGCTCAG-3' F1-Rv 5'-CTGGCACGDAGTTAGCC-3' F1-full-Fw 
F3-full-Rv 5'-GCTCCTGCGTTCGGATCGTAGTCG TACGGYTACCTTGTTACGACTT-3' T7-Promoter 5'-TAATACGACTCACTATAG-3' SP6-Promoter 5'-ATTTAGGTGACACTATAG-3' F2-Rv 5'-CTTGTGCGGGCCCCCGTCAATTC-3' Barcode-1 
Barcode-2 
Barcode-3 
Barcode-4 
P1_qPCR_Fw 5'-AATGATACGGCGCACCACCGA-3' P2_qPCR_Rv 5'-CAAGCAGAAGACGGCATACGA-3' StdTarget1 5'-GAGTTCCTTGGCACCCGAGAATTCCA-174N-3' StdTarget2 5'-/SPhos/-176N-CGACTACGATCCGAACGCAGGAGC-3' RandomBar_std1 
RandomBar_std2 
RandomBar_std3 
RandomBar_std4 
Index_NSE501 
Index_NSE502 
Index_NSE505 
Index_NSE506 
std_R2 
Il_primer 5'-CTGAGCTCCTGCGTTCGGATCGTAGTCG-3' CONV-341F 
CONV-806R 
- In brief, bacteria in the mock cell population were suspended in PBS and exposed sequentially to lysozyme, achromopeptidase, and proteinase K for cytolysis. Subsequently, DNA was collected by phenol-chloroform extraction. The V3-V4 region of the 16S rRNA gene was amplified using region-specific primers containing Illumina Adapter Overhang Nucleotide Sequences (CONV-341F and CONV-805R in Table 3). The amplification product was purified using AMPure XP magnetic beads (Beckman Coulter) and indexed using Nextera XT Index Kit v2 (Illumina). After purification using AMPure XP, the pooled libraries were analyzed qualitatively and quantitatively using TapeStation (Agilent) and KAPA Library Quantification Kit for Illumina (Kapa Biosystems). A denatured library spiked with 20% PhiX Control v3 (Illumina) was sequenced using a MiSeq platform (Illumina, 2 × 300 bp paired-end reads). The quality of the sequence data was checked, and sequences were trimmed using Trimmomatic version 0.38.47 OTUs were clustered using mothur version 1.35.148 with an identity threshold of 97%. The most abundant sequence in each OTU was selected as the representative sequence of the OTU (
Figure 1b ). - All treatments of mice were conducted in accordance with the protocol approved by the Animal Experiments Committee of Institute of Physical and Chemical Research and the institute's ethical guideline. Mice which maintained the condition were as follows: Six-week-old male C57BL6/J mice were purchased from CLEA Japan and maintained in the same cage at Institute of Physical and Chemical Research for 3 days by feeding CE-2 feed (CLEA Japan) before sampling.
- The murine cecum was removed out of the body by an operation within 10 minutes after cervical dislocation under anesthesia with sevoflurane. The cecal content from different sites (
Figure 2a ) was sliced with sterilized scissors for sampling. The sampling step was performed in a class II biosafety cabinet within 10 minutes after the operation. A sample from each site of each mouse was collected into a DNA LoBind Tube (Eppendorf). For controls, two empty test tubes were used. The weight of the sample was measured (ranged from 8.57 to 19.82 mg for all samples) immediately after collection into the DNA LoBind Tube. Subsequently, each sample was dispersed in added PBS (50 µL per mg), and the dispersion was vortexed at 3,200 rpm for 1 minute to mix. The suspended sample was preserved at 4°C until subsequent experiments. - The murine cecal sample was diluted in 1 mL of PBS per mg of the cecal content, and then the mixture was vortexed at 3,200 rpm for 1 minute. For a control, PBS was added to an empty tube. Subsequently, 400 µL of the diluted sample was filtered by centrifugation (10,000 g, 10 minutes, 4°C) using Ultrafree-MC Centrifugal Filter (Merck) having a pore size of 0.22 µm. A volume of 400 µL of fresh PBS was added to the sample remaining on the membrane, the sample was suspended by pipetting, and the total volume was transferred to a fresh DNA LoBind Tube. Subsequently, the sample suspension was vortexed at 3,200 rpm for 1 minute. Extracellular DNA contained in the sample suspension and the fluid that passed through the filter were preserved at 4°C until subsequent measurements. Of note, the appropriateness of DNA isolation using a 0.22-µm filter was confirmed because the amount of extracellular DNA in the fluid that passed through the filter was virtually equal, with no cells detected in the fluid that passed through the filter, and the amounts of bacteria collected from the top of the filter after filtration were equal as compared with use of a filter having a pore size of 0.1 µm, and the amount of bacteria collected from the filter correlated to the number of bacteria obtained by digital PCR (see
Figure 31 ) . - The total concentration of cellular or extracellular 16S rRNA genes was measured by Droplet Digital™ PCR (ddPCR) (Bio-Rad) using primers F1-Fw and F1-Rv (Table 3). The concentration of four equimolar mixed cellular barcode templates (Table 3; each template containing 24 random nucleotides was designed according to our previous publication,25 and the number of random nucleotides was sufficient to distinguish individual cells measured in a single MiSeq sequencing operation) was also measured by ddPCR using primers NoBiotin-Link-barcode-F and P5-index-R1P-barcode-R (Table 3). ddPCR was performed in accordance with the user manual of QX200™ ddPCR™ EvaGreen (trademark) Supermix (Bio-Rad).
- To prepare a sequence library, a total of approximately 240,000 cells (or 20,000 copies of extracellular 16S rRNA gene) were mixed with 960 µL of a solution containing equimolar mixed cellular barcodes, primers (400 nM P7-R2P-341F, 400 nM P5-index-R1P-R, 10 nM Biotin-link-805R, and 10 nM Biotin-Link-F), ddPCR™ Supermix for Probes (No dUTP) (Bio-Rad), 128 units of Platinum Taq (Invitrogen), and 100 nM NTP. The mixture solution was vortexed at 3,200 rpm for 1 minute and then encapsulated into droplets by a Bio-Rad droplet generator, and 30 µL of the mixture solution and 80 µL of Droplet Generation Oil for Probe (Bio-Rad) were loaded in each channel of the DG8™ Cartridge (32 channels were used for each sample). To measure the mock cell population, approximately 600,000 cells were mixed with 2,400 µL of a solution containing approximately 600,000 copies of the cellular barcodes, 320 units of Platinum Taq, and primers, dNTPs, and ddPCR™ Supermix for Probes (No dUTP); subsequently, the mixture solution was vortexed and then encapsulated into droplets using 80 channels per sample. A library for MiSeq sequencing was generated by one-step PCR in droplets (at 95°C for 5 minutes; six cycles at 94°C for 45 seconds and at 60°C for 150 seconds; 49 cycles at 94°C for 25 seconds and 60°C for 80 seconds; at 98°C for 10 minutes).
- The library generated by the droplet amplification technique was collected using chloroform, 80 µL of TE buffer (Invitrogen) and 280 µL of chloroform (Sigma) were mixed with droplets collected from each DG8™ Cartridge (eight wells), then the mixture was pipetted 10 times and vortexed until aqueous and organic phases were separated; and, after centrifugation (at 21,900 g for 10 minutes), an aqueous-phase solution containing the library was extracted. Subsequently, off-target DNA molecules such as unlinked barcode amplification products, remaining primers, and byproducts in the collected solution were removed by bead purification using AMPure XP and gel purification using 2% E-Gel™ EX Agarose Gels (Thermo Fisher Scientific Inc.). Subsequently, biotinylated and unbound 16S rRNA amplification products were removed using streptavidin magnetic beads (NEB), and unbound 16S rRNA amplification products were biotinylated with a primer Biotin-link-805R (
Figure 5 ).28 The purification steps using AMPure XP, gel, and streptavidin beads were performed twice each. Finally, the purified library was concentrated using DNA Clean and Concentrator Kit (Zymo Research). The quality of the library was examined using Agilent 2100 Bioanalyzer, and the concentration was measured by qPCR (KAPA SYBR Fast qPCR kit; KAPA Biosystems) using primers P1_qPCR_Fw and P2_qPCR_Rv (Table 3). The detailed protocol for the purification steps using AMPure XP, gel, and streptavidin beads was followed in accordance with the user manual for each product. - Pair-end sequencing was performed for the library of the samples on the MiSeq platform (MiSeq Reagent Kit v3, 600 cycles; Illumina), allocating 30 cycles for
Read 1, 295 cycles forIndex 1, eight cycles forIndex 2, and 295 cycles for Read 2 (Figure 5 ). The primer for sequencingIllumina Index 1 was replaced with a custom primer designated as I1_primer (Table 3), to read the 16S rRNA sequences instead of indices. To maintain heterogeneity of the sequences for sequencing, a separately prepared spike-in control was sequenced together with the samples (Figures 18 and19 ). More specifically, the total concentration of bacteria, extracellular DNA, or cellular barcodes was measured by Droplet Digital™ PCR (ddPCR) in accordance with the instruction of QX200TM ddPCR EvaGreen™ Supermix (Bio-Rad). For samples of bacteria and extracellular DNA, F1-Fw and F1-Rv, which were primers targeting the V1-V2 region of the 16S rRNA gene, or 341F and 805R, which are primers targeting the V3-V4 region of the 16S rRNA gene, were used (Table 3). For the cellular barcodes, primers Biotin-Link-barcode-F and P5-index-R1P-barcode-R (containing an index GTACTGAC) were used (Table 3). QX200TM ddPCR™ EvaGreen™ Supermix, 1 µM primers, 1 µM dNTPs, and the samples (subjected to multiple dilutions and vortexed at 3,200 rpm for 1 minute) were mixed to make a volume of 30 pL, and the mixture was pipetted to mix. Subsequently, the mixture solution was encapsulated into droplets using Droplet Generation Oil for EvaGreen (Bio-Rad), DG8™ Cartridge (Bio-Rad), and Droplet Generator (Bio-Rad). Droplet PCR was performed with the following steps: the initial denaturation at 95°C for 5 minutes; denaturation at 95°C for 45 seconds, annealing and elongation with six cycles at 60°C for 150 seconds; denaturation at 95°C for 25 seconds, and annealing and elongation with 39 cycles at 60°C for 80 seconds (primers F1-Fw and F1-Rv) or denaturation at 95°C for 25 seconds and annealing and elongation with 34 cycles at 60°C for 80 seconds (primers Figure 18a ). Finally, the concentration of the sample was calculated based on the ratio of positive and negative droplets and the dilution rate of the sample. - The sum of the concentrations of cells and extracellular DNA was obtained for an identical sample (a cecal sample obtained from a male C57BL6/J mouse) using both primer sets, F1-Fw/F1-Rv and 341F/805R, and it was confirmed that the concentrations measured using these primer sets were consistent. For the following reasons, primers F1-Fw and F1-Rv were used to measure the concentration of the bacterial sample by BarBIQ.
- For this comparison, the ratio of positive and negative droplets was determined by Gaussian fitting because of the clearly ill-defined separation between the distributions of positive and negative droplets when 341F and 805R were used (
Figure 18b ). The ratio was fitted to the peak of the intensity distribution by a function normalmixEM in the R package mixtools using four Gaussian distributions (Figure 18c ). In brief, fitting by two Gaussian distributions, of which one is for positive droplets and the other is for negative droplets, can be sufficient. However, the data clearly showed that there were two or more Gaussian distributions. Therefore, the intensity distributions by different numbers of Gaussian distributions were fitted. The proportion of positive droplets was found to be stable when four or more Gaussian distributions (six or less were tried) were used (Figure 18d ). This suggests that four Gaussian distributions is sufficient to explain the intensity distributions. To calculate the proportion of positive droplets, a Gaussian distribution fitted to positive droplets was assumed when the mean of these Gaussian distributions was larger than the apparent trough of the intensity bimodal distribution, and it was opposite for negative droplets. Finally, the proportions of positive droplets were compared between the results obtained using two primer sets, and it was found that basically these proportions did not differ for either the bacterial cell sample or the extracellular DNA sample (Figure 18e ). Since separation of positive droplets and negative droplets using primers F1-Fw and F1-Rv was much clearer than when 341F and 805R were used (Figures 18a and 18b ), the primers F1-Fw and F1-Rv were selected for BarBIQ. - Bacteria were used at a concentration of 250 cells/µL to generate droplets. Given that the volume of one droplet was approximately 0.8 nL, approximately 20% of droplets were to contain bacteria with this concentration. Following the Poisson distribution, 90% or more of droplets containing bacteria contain only one bacterium, and others contain two or more bacteria under this condition.
- In theory, BarBIQ normalizes the proportional concentration of each cOTU determined by sequencing using the total concentration to obtain the absolute concentration of the cOTU, and different cellular barcode concentrations do not change the proportional concentration of each cOTU. Therefore, the concentration of the cellular barcode does not affect the concentration measurement in BarBIQ. However, the cellular barcode with a higher concentration generates more junk amplicons, which may affect identification of the 16S rRNA sequence. Meanwhile, the cellular barcode with a lower concentration would reduce the efficiency of detecting bacteria. We used cellular barcodes in the range from 100 to 250 molecules/µL for BarBIQ measurement. As a result, 8% to 20% of droplets contained barcodes. Since only droplets containing both cells and barcodes are sequenced, it was predicted that 3% to 11% of droplets would be eventually sequenced.
- The detection rates of bacteria cells at these concentrations ranged from 3% to 11%. Approximately three-fold differences in the detection rates were observed for different samples even when cellular barcodes were used at the same concentration, and the differences seem to be attributed to instability at lower concentrations of the cellular barcode molecules. Since the cOTU count determined by sequencing showed a favorable correlation between repeated experiments for showing different cell detection rates, it was indicated that, basically, the detection rate did not affect measurement of proportional concentrations of all detected cOTUs (
Figure 15 ). - As often performed using PhiX in sequencing of amplification products,54 the designed spike-in control was mixed with the library and sequenced at the same time to avoid disproportionate nucleotide types in sequencing. A schematic view of preparation of the spike-in control is provided in
Figure 20 . First, StdTarget1 and StdTarget2, two single-stranded DNA (ssDNA) containing 174 and 176 random nucleotides, respectively, were linked by T4 RNA ligase (NEB) overnight at a concentration of 400 nM, and then a denaturation step using enzymes was performed at 65°C for 15 minutes. Subsequently, four different random barcode templates were prepared by elongation using four different primers containing random barcodes (RandomBar_std1, RandomBar_std2, RandomBar_std3, and RandomBar_std4;Figure 16 and Table 3) separately designed from the linked products ofStdTarget 1 andStdTarget 2, followed by an annealing step at 90°C to room temperature over 15 minutes, and elongation was performed using Klenow polymerase (NEB). After column purification, four different indexed primers (Index_NSE501 for RandomBar_std2, Index_NSE502 for RandomBar_std3, Index_NSE505 for RandomBar_std4, and Index_NSE506 for RandomBar_std1;Figure 16 and Table 3) were used, a common primer std_R2 was used for the other end, and four different DNA products were amplified from the elongated templates prepared at the final step. A product comprising approximately 600 nucleotide pairs was purified by gel electrophoresis. PCR was performed further two times using primers P1_qPCR_Fw and P2_qPCR_Rv to amplify more products. Products from each round of PCR were purified by gel electrophoresis. The spike-in control was prepared by mixing these four different products in equal ratios based on the concentrations measured by qPCR using primers P1_qPCR_Fw and P2_qPCR_Rv. - Given that, when the mean number of reads per unique barcode exceeds 60, each number of cOTUs are saturated, it was confirmed that the sequencing depth in all the sequencing experiments was sufficient for digital counting (
Figures 28 and34 ). - A pipeline for identifying the bar sequence and cOTU (cell type) and processing the data obtained by sequencing to quantify each cOTU was developed. The primary strategy of the pipeline is shown in
Figure 6 , and details of each step were as described inWO 2018/235938A and as follows. As a general rule, the reads from MiSeq were first clustered using the cellular barcode (Read R1).25 Subsequently, 16S rRNA sequences (Reads I1 and R2) linked to the same cellular barcode were further clustered based on the identity of these sequences. A representative sequence (RepSeq) for each group of clustered 16S rRNA sequences was generated based on both the number of reads and the sequencing quality for each sequence type. Conceivable erroneous RepSeq sequences were removed at a plurality of steps, depending on both the number of reads for each RepSeq and the number of RepSeqs for each RepSeq sequence type, (refer toWO 2018/235938A and seeFigure 6 ). A unique RepSeq sequence type was designated as Bar sequence. Subsequently, Bar sequences were clustered into a cOTU based on their co-detection frequency in the same droplet. If two or more Bar sequences were detected in the same droplet frequently, they were considered to be a plurality of 16S rRNA genes derived from the same bacterium and clustered into a single cOTU. Subsequently, the number of cells for each cOTU was counted by the number of unique cellular barcodes (i.e., barcode cluster). The absolute cell concentration of each cOTU was determined by normalizing cells counted by the sequencing of the cOTU using the total concentration of the sample measured by ddPCR. Further, cOTUs contaminated during sampling and/or measurement were identified using the control. - The most part of the pipeline was written in Perl (version 5.22.1), and others were performed by a software such as R (version 3.5.1), nucleotide sequence clusterizer (version 0.0.7),25 or bwa (version 0.7.15).49 The Perl modules and the R packages used for this pipeline are listed in Table 4.
-
Table 4: Perl modules and R packages used for data analyses Name Type Citations ape R package Paradis E. & Schliep K. 2019. ape 5.0: an environment for modern phylogenetic and evolutionary analyses in R. Bioinformatics, 35, 3, 526-528. dplyr R package Hadley Wickham, Romain Fran<U+00E7>ois, Lionel Henry and Kirill M<U+00FC>ller (2018). dplyr: A Grammar of Data Manipulation. R package version 0.7.6. https://CRAN.R-project.org/package=dplyr ggplot2 R package H. Wickham. ggplot2: Elegant Graphics for Data Analysis. Springer-Verlag New York, 2016. gridExtra R package Baptiste Auguie (2017), gridExtra: Miscellaneous Functions for "Grid" Graphics. R package version 2.3. https://CRAN.R-project.org/package=gridExtra igraph R package Csardi G, Nepusz T: The igraph software package for complex network research, InterJournal, Matrix R package Bates DM, Maechler M. Package 'Matrix'. R package version 1.2-12. 2017 pheatmap R package Raivo Kolde (2019), pheatmap: Pretty Heatmaps. R package version 1.0.12. https://CRAN.R-project.org/package=pheatmap plotrix R package Lemon, J. (2006) Plotrix: a package in the red light district of R. R-News, 6(4): 8-12. RColorBrewer R package Erich Neuwirth (2014), RColorBrewer: ColorBrewer Palettes, R package version 1.1-2. https://CRAN.R-project.org/package=RColorBrewer scales R package Hadley Wickham (2018), scales: Scale Functions for Visualization. R package version 1.0.0. https://CRAN.R-project.org/package=scales smacof R package Jan de Leeuw, Patrick Mair (2009). Multidimensional Scaling Using Majorization: SMACOF in R. Journal of Statistical Software, 31(3), 1-30. URL http://www.jstatsoft.org/v31/i03/ stats R package R Core Team (2018). R: A language and environment for statistical computing. R Foundation for Statistical Computing, Vienna, Austria. URL https://www.R-project.org/. vegan R package Jari Oksanen, F. Guillaume Blanchet, Michael Friendly, Roeland Kindt, Pierre Legendre, Dan McGlinn, Peter R. Minchin, R. B. O'Hara, Gavin L. Simpson, Peter Solymos, M. Henry H. Stevens, Eduard Szoecs and Helene Wagner (2019). vegan: Community Ecology Package. R package version 2.5-4. https://CRAN.R-project.org/package=vegan IPC::System::Simple Perl module Paul Fenwick Bio::SeqIO Perl module Christopher Fields Bio::Seq Perl module Christopher Fields Text::Levenshtein::X S Perl module Nick Logan List::Util Perl module Graham Barr, Paul Evans Statistics::Basic Perl module Paul Miller Excel::Writer::XLSX Perl module John McNamara Math::round Perl module Geoffrey Rommel - In our sequencing, R1 (30 nucleotides) was a cellular barcode, I1 (295 nucleotides) and R2 (nucleotides) were 16S rRNA sequences, and I2 (8 nucleotides) was an index for labeling each sample uniquely. All three sequencing operations are summarized in Table 4.
- The reads of the cellular barcode (R1) were clustered based on the sequence as reported previously (
WO 2018/235938A ), excluding the initial deletion of low-quality reads. First, as widely performed,47 low-quality R1 reads (the mean score < 15) containing at least one window consisting of four consecutive nucleotides were excluded. The proportions of reads ofSequence Runs distance 2 parameters derived from an identical Sequence Run containing both the sample and the spike-in control were clustered using a software, a nucleotide sequence clusterizer.25 Reads which had a different index but were clustered into the same cluster were excluded. The obtained cluster was designated as BCluster. Each read had two 16S rRNA sequences (I1 and R2) and a cellular barcode (R1) (Figure 6 ). - At this stage, the ends of all reads were trimmed at specific positions based on the quality of reads and primer portions thereof. The quality of read nucleotides in MiSeq sequencing is generally reduced at the ends of a read, resulting in more errors at the ends.50 Since maintaining the same read length is necessary at the next stage of data processing, we applied uniform thresholds and trimmed the ends of all reads with one sequencing operation. The trimming position of sequence runs were determined based on the average quality of all reads. The rule of selecting trimming positions was as follows: when the starting average quality of two sequential positions was lower than 25 (incidental changes in the quality during sequencing can be avoided using the average quality at two sequential positions), the position was selected from the head of the read as the first position. Trimming positions 231 (I1) and 194 (R2) were used for
Sequence Run 1, 294 (I1) and 267 (R2) were used forSequence Run 2, and 271 (I1) and 237 (R2) were used forSequence Run 3. Further, the primer portions of each read were directly trimmed depending on the lengths of designed primers: 21 nucleotides for I1 and 17 nucleotides for R2. - At this stage, two substeps of clustering reads in each BCluster were performed based on 16S rRNA sequences (I1 and R2).
- In step 3.1, the reads I1 and R2 were clustered by a parameter of
distance 3 based on the substitution distance between the reads using a nucleotide sequence clusterizer software, and the reads I1 and R2 having the same MiSeq ID were by physically linked and considered as a single read. - Since very similar sequences that might be a true 16S rRNA sequence, not an erroneous sequence, were integrated in Step 3.1, an additional clustering step was used. For each subcluster generated by Step 3.1, reads were re-clustered based on a specific position of the read (all reads were aligned according to a first nucleotide). The logic diagram of this step is shown in
Figure 20 . For each read position, the number of reads containing each kind of nucleotides (A, T, C, and G) was counted, and the ratio (designated as Ratio2nd) of the number of reads containing the second most abundant nucleotide to the number of reads containing the most abundant nucleotide was calculated. Further, the count of each read was weighted by the quality score of the nucleotide sequence at this position. The rule was as follows: the count was weighted by 0 if the score was lower than 15 and by a score obtained by dividing the score by 41 if the score was 15 or higher. Then, the highest Ratio2nd was selected among all positions and compared with the threshold of 0.75. If the Ratio2nd was 0.75 or higher, reads containing the second most abundant nucleotide were separated into a new subcluster from the original subcluster. Then, the reads in the newly generated subclusters for both sequences were reclustered by the same strategy, and clustering was repeated until the Ratio2nd became lower than 0.75 at all positions in all subclusters. The last subcluster was designated as SCluster (Figure 6 ). The efficiency of amplifying 16S rRNA sequences (a plurality of 16S rRNA sequences from the same bacterium) in droplets was often biased. Therefore, although the Ratio2nd in this case may be lower than 0.75, both sequences are true 16S rRNA sequences. Fortunately, the amplification bias in these different types of sequences (e.g., A and B) derived from an identical bacterium occurred at random. For example, Sequence A had more reads at times, and Sequence B had more reads at other times. Therefore, both these two sequence types may have been identified from different droplets, and the amplification bias did not affect cell counting. However, the number of droplets in which both sequence types were detected was reduced when the threshold of 0.75 was used, compared with cases where a lower threshold was used. This may affect the step used to identify two sequences from the same bacterium (see Step 12). Meanwhile, when a threshold lower than 0.75 is used, a subcluster containing erroneous sequences alone can be generated, resulting in a problem in the next step. Therefore, the 16S rRNA sequences were identified using the threshold of 0.75. However, when both sequences derived from the same bacterium were detected in the same droplet, the sequences were detected using another threshold of 0.1. The data generated by the threshold of 0.1 were used only for detecting a plurality of 16S rRNA sequences derived from the same bacterium, and only the 16S rRNA sequences identified using the threshold of 0.75 were used. Of note, since only substitution errors were considered inStep 3, all sequences with insertion errors or deletion errors were clustered as SClusters, and adverse reactions of this pipeline were resolved in the next step. - For each SCluster, representative sequences (RepSeqs) for both the reads I1 and R2 were generated based on both the sequence quality score of each nucleotide and the proportion of a nucleotide of each type. To calculate the proportion of a nucleotide of each type, the number of reads for a nucleotide of each type was weighted by the quality score. The rule was as follows: the number of reads was weighted by 0 if the quality score was lower than 15 and by a score obtained by dividing the score by 41 if the score was 15 or higher. For each position, the most abundant nucleotide type was used as a representative nucleotide (
Figure 6 ). Since a RepSeq generated from an SCluster of a single read has a high risk of errors, RepSeqs of a single read were also removed at this stage. The number of reads in each SCluster was used at the next stage as important information to distinguish correct RepSeqs from erroneous RepSeqs containing errors. - At this stage, RepSeqs having an error type due to insertion or deletion (indel) which occurred in the head portion (21 nucleotides in I1 and 17 nucleotides in R2) of the read excluded as a primer portion in
Step 2 were removed. For example, on the assumption that a BCluster x contains reads of the 16S rRNA sequences, when some of them have two deletions in the head portion, two types of reads (RepSeqs i and j (two deletions in the reads)) occur after excising the primer portions, and RepSeq j should have shifted by two nucleotides from left towards right compared with RepSeq i (Figure 21 ). A RepSeq having this error type was designated as a shifted - The logic diagram of
Step 5 is shown inFigure 21 . The strategy was as follows. a) Pairs of all RepSeq types conceivable for each BCluster were found. One RepSeq type was a sequence shifted from another RepSeq type, and only pairs of RepSeq types having a shift of less than eight nucleotides were selected. b) For each pair of the shifted RepSeq types (A and B), a RepSeq type identified in more BClusters was designated as Mother, and the other was considered as Shift wherever possible. This is because, in general, there are less erroneous sequences than correct sequences. c) For each pair of Mother and Shift, the number of BClusters having more reads of Mother than Shift (NoMother) and the number of BClusters in the opposite case (NoShift) were counted. Only BClusters including both Mother and Shift were used. d) Subsequently, since there are less erroneous sequences than correct sequences, Mother and Shift were preserved when NoMother is larger than NoShift. e) If corresponding Shift exists in a BCluster including Mother, the Shift in this BCluster was deleted, the number of reads in this Shift was added to the that of Mother (the total number of reads for Mother was used at the next step). If a Shift existed in BCluster not including Mother, Mother was replaced with the Shift (if two or more Mothers existed for an identical Shift, the Mother identified in more BClusters was to be selected), and the number of reads in the Shift was to be used as the number of reads for the replaced Mother. According to this rule, the Shift was removed based on the pairs of Mother and Shift preserved in d). The RepSeqs I1 and R2 were independently processed. - In this step, the RepSeq I1 and the RepSeq R2 were linked based on overlapped sequences at the ends thereof. The lengths of the 16S rRNA gene in the V3-V4 region depended on the Silva database (version 123.1) and were distributed in a range from almost (> 99.9%) 400 to 500 bp (
Figure 22 ). Therefore, sequencing of 295 nucleotides of reads for both I1 and R2 can basically achieve 90 or more overlapped nucleotides between the ends of each read pair of I1 and R2. However, because of the low sequencing quality at the ends of each read (see Step 2), the only sequences that can be used for data processing were approximately 294 nucleotides in I1 and approximately 267 nucleotides in R2 based on the best experience in the performed sequence runs. However, 60 or more overlapped nucleotides can still be detected. Therefore, to obtain the full length of the 16S rRNA gene in the V3-V4 region, overlapped sequences between the RepSeq I1 and the RepSeq R2 were found, and a linking step was performed using them as a single RepSeq. However, because of the poor sequencing quality, only 231 nucleotides in I1 and 194 nucleotides in R2 were used forSequence Run 1. Therefore, no overlapped sequences were detected, and the RepSeqs I1 and R2 were not linked. - In general, several nucleotides at the ends of both the RepSeqs I1 and R2 can be the same incidentally. Therefore, it was considered that this was because an overlap of five or more identical nucleotides at the ends of both the RepSeq I1 and the RepSeq R2 was used as a threshold to avoid false overlaps. In theory, the possibility of incidental overlaps is (1/4)b, wherein b is the number of overlapped nucleotides, and the possibility of accidental overlapping of five nucleotides is (1/4)5 ≤ 0.00098.
- Further, in the data of the mock cell population and M0, all incidental overlaps were < 5 nucleotides (overlaps could not be found because short reads were used).
- A difference due to substitutions between the RepSeq I1 the RepSeq and R2 might occur, although rarely, in the overlapped portion because the quality at the end portions of reads was relatively low. Therefore, another step was applied to remove these errors. The strategy for this step was as follows. a) After the above-described linking step, RepSeqs that had not been linked were found. b) Subsequently, each RepSeq was compared with other RepSeqs in an identical BCluster (directly compared with the respective RepSeqs I1 and R2), and a RepSeq having a one-nucleotide difference was found. c) RepSeqs with a one-nucleotide difference were linked, RepSeqs that had not been linked were deleted, and the reads were added to the linked RepSeqs.
- In this step, RepSeqs having an error type arising from one insertion or deletion (1-indel) error in the main portion of the read (not in the head portion of the read (i.e., the primer portion; see Step 5)) were removed. Since clustering in
Step 3 was based only on substitution as described above, all erroneous reads containing an indel were separated to prepare individual RepSeqs. In general, an indel error very rarely occurs around the center of the read in sequencing (Schirmer M et al., ). Therefore, at the stage, not only a 1-indel, but also two-nucleotide indel having substitution and a 1-indel were considered in Step 9 (described later). - The logic diagram of
Step 7 is shown inFigure 23 . The strategy is as follows. a) All pairs of RepSeq types that had a 1-indel difference were found in each BCluster. b) Since there are generally less erroneous sequences than correct sequences, the RepSeq type identified in more BClusters was designated as Mother for each pair of RepSeq types having a 1-indel (A and B), and the other was considered as 1-Indel. c) For each pair of Mother and 1-Indel, the number of BClusters having more reads of Mother than those of 1-Indel (NoMother) and the number of BClusters in the opposite case (No1-Indel) were counted. Only BClusters including both Mother and 1-Indel were used. d) We preserved a pair of Mother and 1-Indel only when NoMother is larger than No1-Indel. This is because there are generally less erroneous reads than correct reads. e) The ratio (Rs) of the number of BClusters including possible 1-indels and likely Mothers and the number of all BClusters including possible 1-indels (No1-Indel) was calculated, and a conditional statement Rs ≤ (No1-Indel-3)/No1-Indel was true, possible pairs of Mother and 1-Indel were selected. f) Based on the selected pairs Mother and 1-Indel, if a 1-indel exists in Mother and a BCluster, the 1-indel was deleted from this BCluster, and the number of 1-Indel reads was added to that of Mother (the total number of reads was used for Mother in the next step). If 1-Indel exists in BClusters not including Mother, the number of reads of 1-Indel was replaced with that for Mother (if there were two or more Mothers for the same 1-Indel, Mother identified in more BClusters was selected) and used as the number of reads for Mother with which the number of reads of 1-Indel was replaced. - At this stage, chimeric RepSeqs having an error type arising from chimeric amplification were removed. Chimera occurs during PCR at all times, which makes the product more complex. In particular, chimeric RepSeqs occur very frequently during the measurement of 16S rRNA amplification products.27
- The logic diagram for removing chimeras is provided in
Figure 24 . The strategy was as follows. a) In each BCluster, chimeras of RepSeq types (A, B, and C) in all possible orders were examined. The head portion of A was the same as the head portion of B, the other portion of A (containing B) was identical to the end portion of C, the number of reads in A was not the largest among the three, A was considered chimeric, and B and C were considered parents of this chimera. b) For each of the identified chimeras, the number of BClusters including chimeras (Total_No) and the number of BClusters including only chimeras but not including parents (No_d) were counted. c) Conditional statements Ratio_d(= N_d/Total_No) ≤ 0.1 and Ratio_d ≤ 1/Total_No were true, and candidates of chimeras were excluded from RepSeqs. - Only 1% to 5% were chimeric in BarBIQ, and this proportion is much lower than those by the conventional methods (approximately 70%).27 It was therefore shown that chimeras were removed by this step. The reason why almost no chimeras were generated by BarBIQ is that a barcode and a sequencing adapter were attached to the 16S rRNA gene derived from a single bacterium by one-step amplification in a separated space (that is, a droplet), and this means that the 16S rRNA amplification products derived from different bacteria were not mixed. This approach was not performed even in the latest studies on high throughput sequencing of the 16S rRNA gene using droplets and barcodes (Borgstrom E et al., and Sheth RU et al., ).
- In this step, RepSeqs having high-level errors such as errors of one indel and one substitution (designated as Case A), one indel and two substitutions (designated as Case B), or two indels (designated as Case C) were removed. As described above, only indel errors can occur by our clustering method in
Step 3, high-level errors discussed here include indels. Meanwhile, more complex errors occur very rarely and are removed inStep 10. - The logic diagram of
Step 9 is shown inFigure 25 . The strategy is as follows. a) All possible pairs of RepSeq types in each BCluster having any of the above-described differences (Cases A, B, and C) were identified. b) The numbers of RepSeq reads for each identified pair were compared. If the ratio of the numbers of reads between RepSeqs (small and large) was lower than a threshold of 0.2, RepSeqs having a small number of reads were excluded, and the number of reads was added to other pairs. - After most errors were removed in the above-described steps, unknown RepSeqs (different from San sequence) still remained in data of the mock cell population. However, all these RepSeqs existed in a small number. Accordingly, the number of BClusters was counted by type of the remaining RepSeqs. Since the variation due to the low count was large, the mean count obtained by repeating the sampling for each RepSeq type (sequencing of the identical sample by a different sampling) was used. For each repeat, the count of each RepSeq type was normalized by the total count of all RepSeq types using the highest total count among all repeats. Subsequently, the mean count of each RepSeq type was calculated from all repeated experiments. Sampling was performed for the mock cell population three times, and the mean count was obtained from three repeated experiments. Finally, if the mean count was lower than 2, the RepSeq type was excluded.
- After this step, in the data of the mock cell population excluding the type of RepSeqs which matched the San sequence, all the remaining RepSeq types can be rationally explained by one-nucleotide errors (see Step 11) arising from PCR or contamination (see Step 14).
- We also conducted a study using only one repeat or two repeats and found that a threshold of < 6 (one repeat) or a threshold of < 3 (two repeats) functioned for the mock cell population data. However, since one sampling and two samplings are likely to have a higher risk than three samplings because of randomness, < 10 and < 5 were used for one sampling and two samplings, respectively, as the thresholds for the cecal sample.
- At this stage, one-nucleotide errors of RepSeq types that are considered to have arisen from PCR were removed. To characterize this RepSeq, first, the remaining RepSeq types having a one-nucleotide or zero-nucleotide difference from each San sequence were classified into groups (low-count RepSeq types were maintained for this analysis; see Step 10). Subsequently, the distribution of the mean counts of all RepSeq types in each group was plotted (
Figure 26a ), and the ratio (highest ratio) of the highest mean count of RepSeq types having a one-nucleotide difference to the mean count of RepSeq types matching the San-sequence in the identical group was calculated (Figure 26b ). We found two categories (Categories Figure 26b ):Category 1 was a group with 1,000 or higher counts of San-sequence-matching RepSeq types, andCategory 2 was a group with less than 1,000 counts of San-sequence-matching RepSeq types. InCategory 1, the highest mean number of RepSeq types having a one-nucleotide difference was larger than 2, and the highest ratios for these RepSeq types were consistent between the different groups. It was concluded that these RepSeq types having a one-nucleotide difference probably had errors arising from PCR. This is because the ratio of the number of the actual 16S rRNA sequence to the number of other actual 16S rRNA sequences usually varies for each type of the 16S rRNA sequence. Accordingly, a step of removing these RepSeq types was applied using a threshold that the ratio of the count of RepSeq types having a one-nucleotide difference to the count of San-sequence-matching RepSeq types is lower than 1/400 (Figure 26b ). If only one repeat measurement was performed, a threshold of 1/100 was used for the data. InCategory 2, the highest mean count of RepSeq types having a one-nucleotide difference was < 2, which was similar between the different groups, indicating a possibility that these results may have been due to the low concentration of these 16S rRNA sequence. Errors occurred at random, and all erroneous sequences did not match. Since there was a high risk of low-count RepSeqs, RepSeqs were excluded inStep 10. In the mock cell population data, it was confirmed that, if the ratio of the numbers of counts of two RepSeq types showing only a one-nucleotide difference was 1/50 or higher, both the RepSeq types matched the San sequence. However, no RepSeqs with this ratio being in the range from 1/400 to 1/50 were found. Further, one odd RepSeq type was detected in our data of the mock cell population. This sequence was examined, and it was found that the sequence matched the center of the San sequences JCM5824-A and JCM5824-B and was much shorter than the full length of the V3-V4 region of JCM5824-A/B. The 6-mer at the center of JCM5824-A/B was the same as the 3' end of the forward primer used to amplify the 16S rRNA gene. Given that this odd sequence was always detected simultaneously with the full-length V3-V4 region of JCM5824-A and/or JCM5824-B in an identical droplet, and the count was always very rare (2, 4, and 1 in three repeats), it was interpreted that this odd RepSeq type was a non-specific amplification product of the 16S rRNA gene from JCM5824. However, since a short amplification product of this type was not found in the cecal specimen, no step for detecting these short amplification products was included in our final pipeline. After all the above-described steps, the remaining RepSeq types (unique RepSeqs) were designated as BarBIQ identifying sequences (Bar sequences) and labelled with respective ID numbers. - Making the best of the great advantage of BarBIQ, a plurality of 16S rRNA sequences were identified from the same bacterium based on cellular barcodes at this stage.
- For this purpose, two possibilities should be considered. One is a possibility that different bacteria might be mixed in an identical droplet, and the other is a possibility that only one of different sequences can be detected because of the amplification bias against different sequences from the identical bacterial cell. The first possibility depends on the Poisson distribution and is very rare because bacteria were used at a low concentration to generate droplets. The second possibility is not affected by the concentration of bacteria. It was found that these two possibilities could be distinguished by experimentally setting the ratio of the number of bacteria to the number of droplets as 20%.
- To distinguish these two possibilities, the authors checked all possible pairs of Bar sequences. For each pair (labelled as BS_A and BS_B), the number of droplets containing both pairs (designated as Overlap), the number of droplets containing only BS_A (designated as A), and the number of droplets containing only BS_B (designated as B) were counted. These counts are based on the data processed using a parameter 0.1 in the above-described Step 3.2.
- In theory, if one pair of Bar sequences are derived from different bacteria, the number of droplets in which both the Bar sequences are detected should follow the Poisson distribution, and the estimated number of droplets detected at the same time (designated as Poission_Overlap) can be calculated as follows:

- Subsequently, the parameter was divided into two terms using log10 conversion:

- While the parameters, A and B, in the first term can be obtained from data, the parameters in the second term, the total number of droplets and µ, cannot be measured individually. It was assumed that µ was the same for different Bar sequence pairs, and that logic (total number of droplets/p) was constant for all Bar sequence pairs in each experiment. This term was designated as an operational droplet (OD). Subsequently, the OD was estimated by inserting a running median of log10(Poission_Overlap) for log10(A × B) using a model y = x - OD. In general, in our data, most Bar sequence pairs were derived from different bacteria, and their measured Overlap was similar to theoretical Poission_Overlap. Therefore, the running median of log10(Poission_Overlap) was imitated using the running median of log10(Overlap) (here, a running median is a group consisting of median values in a region of window a of a specific size, median values further obtained by shifting the region by overlap b of a specific size, and further median values obtained by repeating this operation, and a is > b). The running median of log10 (Overlap) was obtained with a window of 0.4 and an overlap of 0.2 based on log10(A × B), and only medians exceeding 0 were used (red, white circles in
Figure 27a ). - After OD was obtained by fitting, data were replotted using log10 (Overlap) against log10(A × B) + OD (
Figure 27b ). In actual fact, this was a relationship between log10(Overlap) and log10(Poission_Overlap). Therefore, data of log10 (Overlap) for which the pair was derived from different bacteria should be on a linear line y = x. However, data were widely distributed because of noises. - Subsequently, simulation was performed to estimate possible distributions of log10 (Poission_Overlap) for different values of log10 (A × B) + OD. First, it was confirmed that distributions of log10 (Poission_Overlap) are slightly different when the values of log10 (A × B) + OD for different values of A, B, and OD were the same, that the distribution became widest when A is equal to B, and that the distributions of log10 (Poission_Overlap) was different when the values of log10 (A × B) + OD were different. Accordingly, simulation was repeated 500,000 times for the distribution of log10 (Poission_Overlap) for possible values of each of A and B in a range from 1 to 1,500 (A = B, integers) and a fixed value of OD = log10 (5,000). Here, when A is equal to B, the Poisson distribution is considered to be widest. In this case, since it can be estimated that sequence pairs that do not follow the Poisson distribution are more likely to be sequences obtained from different droplets, the simulation was performed with A = B here. The same distribution of higher approximate simulation values was used for the log10 (A × B) + OD vales between two simulations. Then, a one-sided confidence interval of each distribution was calculated as 0.999 (green line in
Figure 27b ). - In the data of the mock cell population, all log10(Overlap) values of Bar sequence pairs derived from an identical bacterium were larger than the upper limit 0.999 of the one-sided confidence interval (UP999), but the values of pairs derived from different bacteria were equal to or smaller than UP999 of the one-sided confidence interval (
Figure 27b ; It should be noted that log10 (Overlap) values of some Bar sequence pairs were lower than the lower limit 0.999 of the one-sided confidence interval because detection efficiency was not stable, but these values do not affect this purpose). These data indicated that, since the values of log10 (Overlap) of pairs derived from an identical bacterium were significantly larger than log10 (Poission_Overlap) when 20% was used as the ratio of the number of bacteria to the number of droplets, the pairs derived from an identical bacterium could be easily distinguished by UP999. - Subsequently, the data of M0 were analyzed using the same method as used for measurement of the cecal sample. No clear gaps were observed in the vicinity of UP999 in the plot of log10 (Overlap) against log10 (A × B) + OD (
Figure 27c ). To find a favorable threshold for the cecal sample, the mapping information of each Bar sequence based on a public database Silva was used. Since the names of most Bar sequences cannot be determined based on the database at a species level, occasionally even at higher levels, we focused only on Bar sequences mapped to different names. In each of repeated experiments of sampling in the M0 data, the log10 (Overlap) values of several Bar sequence pairs mapped to different names in the database were larger than UP999 (black circle inFigure 27c ). Subsequently, when these Bar sequence pairs were examined in two other samplings, all the log10 (Overlap) values were lower than UP999. Since 20,000 or more Bar sequence pairs were examined in one measurement, and it was rational that they were outside the one-sided confidence interval, 0.999, these cases may have occurred statistically by accident. - To avoid statistically rare cases, whether these two Bar sequences were derived from the same bacterium was determined using a plurality of repeated experiments. In theory, the results of Bar sequences from the same bacterium should be the same in different samples. Therefore, all samples can be used as repeats for this purpose. Subsequently, using all cell samples derived from the cecum of mice Ma, Mb, and Mc, the ratio of the number of samples in which the log10 (Overlap) values of Bar sequence pairs were shown to be larger than UP999 to the total number of samples in which both Bar sequences were detected was analyzed. This ratio is referred to as Ratio_Positive. The ratio, rather than the number of samples, is used because some Bar sequences are detected in only some samples, the number of samples that can be used for each Bar sequence pair can vary. To secure reliability, only Bar sequence pairs detected in at least two samples were used. Further, some samples were found to have poor OD fitting, only samples with a standard error of OD by fitting being lower than 0.08 were selected. All Bar sequence pairs mapped to different names based on mapping names of Bar sequences had a low Ratio_Positive (
Figure 27d ), and the distribution was exponentially attenuated, indicating that such sequences occur with a low possibility. Therefore, Bar sequence pairs derived from an identical bacterium were identified using a threshold of Ratio_Positive > 0.5. - Subsequently, all Bar sequences were classified into groups based on the identified Bar sequence pairs derived from an identical bacterium. Each group can have one Bar sequence or a plurality of Bar sequences. We designated these groups as cell-based operational taxonomic units (cOTUs). The strategy for this classification was to classify the Bar sequences into one group if the Bar sequence and at least one of the plurality of Bar sequence are derived from the same bacterium. Some Bar sequence pairs in some cOTUs could not be detected by the above-described process. This may be because detection efficiency was low when a droplet contains two or more sequences.
- When RepSeqs detected in an identical BCluster belonged to an identical cOTU, a single cell was assumed. Subsequently, the number of cells in each cOTU was calculated based on cellular barcodes (number of BClusters). The data processed with a parameter of 0.75 in Step 3.2 were used to calculate the number of cells.
- At this stage, cOTUs contaminated with foreign substances were removed based on the control. To identify cOTUs contaminated with foreign substances, measurement was performed for a similar time period (several days) under the same condition using a control sample M0 of the mock cell population or an empty test tube control of the cecal samples of mice Ma, Mb, and Mc.
- The strategy for detecting cOTUs contaminated with foreign substances was as follows. The number of BClusters in a cOTU identified in the sample was counted for each control, and the count of each cOTU in the control was compared with the count of identical cOTUs in the sample. In an experiment of the mock cell population, the counts were also normalized by the estimated total number of droplets because a different number of droplets were used to prepare the libraries of the mock cell population and the M0 sample. In another experiment, standardization of the counts was not applied because the control was an empty tube, and the same number of droplets was used in all experiments.
- Three different categories (I, II, and III) were found for the mock cell population (
Figure 28 ). (I) The count of cOTUs in the control (i.e., M0) was much larger than that in the sample (i.e., the mock cell population), and the cOTU sequence did not match the San sequence. (II) The number of cOTUs was comparable between the sample and the control (their mean ± SD were overlapped), and the cOTU sequences did not match San sequence either. (III) The number of cOTUs in the sample was much larger than that in the control, and the cOTU sequence matched San sequence. Category I could not be explained as a chimera because bacteria cross-mixed in from the control to the sample or mixed in from the environment were the same as bacteria in the control (because we used an actual sample as the control for measurement of the mock cell population), and, further, this cOTU sequence was very different from the Bar sequence (≤ 86% identity) that matched the San sequence in the sample. This result indicates that this cOTU does not have an error arising from a chimera. Category II can be explained as foreign substances mixed in from the environment for both the sample and the control. This is because their numbers were similar in the different samples and the control. We removed cOTUs from the samples for both Category I and Category II. This is because they were probably foreign substances mixed in from the environment or other samples. In Category III, bacteria mixed in from the sample to the control or incidentally mixed in from the environment were the same bacteria in the sample although there was a possibility that foreign substances were cross-mixed in. In this case, the value obtained by subtracting the count of this cOTU in the control from the count of this cOTU in the sample was used as the final number of cells in this cOTU in the sample. There was a possibility of cross-mixing of foreign substances only when the concentration of cOTUs in the sample was high, and these counts in the sample contaminated with foreign substances were very rare. - Since only one measurement was performed for each sample for data of mice Ma, Mb, and Mc, the square root of the count was used as an error bar based on the Poisson sampling noise instead of a repeat SD.
- For the data of mice Ma, Mb, and Mc, two empty test tubes were used as controls. In this case, the two test tubes were experimental repeats rather than sampling of repeats, and do not follow the Poisson distribution. Further, to avoid an accident due to a small number of repeats, 3.27 × SD was used as an error bar against the controls. Further, if 3.27 × SD is smaller than 10% of the mean count, 10% of the mean was used as an error bar. The rule of removing cOTUs contaminated with foreign substances from these samples was as follows. If the count in the control + the error bar was higher than the count in the sample - the error bar, this cOTU was removed from the sample. If the count in the control + the error bar was lower than the count in the sample - the error bar, the count in the sample - the count in the control was used as the final count of the cOTUs in the sample.
- The number of cells in the cOTU contaminated with foreign substances was approximately 0.5% of the number of all cells detected in measurement of the mock cell population, and approximately 4% in measurements of the cell samples from Ma, Mb, and Mc.
- The absolute cell concentration in each cOTU was calculated by normalizing by the count obtained in
Step 13 using the total concentration measured by droplet digital PCR. - The sequence identity between the 16S rRNA genes closest (i.e., highest identity) to the Bar sequence identified in three different public databases, GreenGene (release 13_5),10 Ribosomal Database Project (release 11.5),11 and Silva (release 131.1)12 was calculated using the NCBI blast (version 2.7.1).51
- Classification of the identified cOTUs from the phylum to the genus was predicted based on their Bar sequences by a RDP classifier using the bootstrap cutoff of 50%.36 The RDP classifier was trained using the 16S rRNA training set11 (https://rdp.cme.msu.edu/classifier/classifier.jsp). A predicted taxon having the highest score was selected for the cOTU including a plurality of Bar sequences.
- The bray-Curtis dissimilarity between the samples of each pair based on the cell concentrations was calculated using the vegdist function of vegan R package. Subsequent analyses were performed using R (version 3.5.1) and JupyterLab (version 0.34.9).
- Noises in the cOTU in the technical replicates of a sample Madist measured by BarBIQ were examined mainly from the sampling noises by comparing the mock noises obtained from the Poisson distribution and the technical noises of the cOTU. To eliminate a bias from the different total numbers of detected cells in the technical replicates, the number of cells for each replicate was standardized for the minimum total number of cells in the replicate by subsampling using dilution of a function in the vegan R package. The noises in the cOTU were quantified by CV2. Here, the CV represents a change in the coefficient calculated based on the normalized numbers of cells in cOTUs in three technical replicates.52,53 The Poisson noise simulated for each cOTU was calculated based on three numbers (to imitate three technical replicates) randomly generated from the Poisson distribution, which is the mean number of cells in a given cOTU in the sample, to perform two simulations (1 and 2). Subsequently, a residual error of CV2 after correction of the theoretical mean was calculated for each cOTU.52,53

- Here, the CVPoisson is a theoretical CV for a predetermined cOTU based on the Poisson distribution. The distribution of all Rmc in the sample of Madist matches the distribution of the simulation, indicating that technical noises in the BarBIQ measurement were mainly due to sampling (
Figures 7c and 7d ). - For each cOTU, 95% confidence intervals of CVs of the cell concentrations at distal and proximal positions in three mice (
Ma dist1, Mbdist, and Mcdist orMa prox1, Mbprox, and Mcprox) were estimated by simulation. The simulation process was repeated 1,000 times, and the CV was obtained from three simulated cell concentrations for the given cOTU for each time. Each simulated concentration was obtained by a random number generated by the Poisson distribution. The mean was the number of sequenced cells in the given cOTU in the sample (i.e., one ofMa dist1, Mbdist, Mcdist. orMa prox1, Mbprox, Mcprox) and was then normalized using the estimated total concentration of this sample. This estimated total concentration was randomly generated from the normal distribution with the mean being the measured flora concentration of this sample and the standard deviation being of 10.1% of the mean (10.1% was the maximum standard deviation (10.1%) standardized by the mean of five independent experiments of repeated filtering (Figure 18 )). A 95% confidence interval of each CV was obtained from the distribution of CVs from 1,000 simulations. - Hierarchical clustering was performed by a function hclust in a statistical package (a heat map was generated using the Pheatmap package). The distance used for clustering is defined as 1 - minimum (|r'|) [r' ∈ (r - OCI, r + OCI)], wherein OCI means a 90% one-sided confidence interval of each r. Evolutionary trees of hierarchical clustering were obtained by the complete linking method. Specifically, a Pearson correlation coefficient r between all included cOTUs was obtained. Then, a distance between one microorganism and another microorganism was determined based on the above-mentioned expression, and cOTUs were clustered based on the distance. The distance between possible cOTU pairs within a branch after clustering was lower than the height of the branch. The OCI of each r was obtained by simulation. The simulation process was repeated 1,000 times, the cell concentration in each cOTU was randomly generated for each time for the
samples Ma dist1,Ma prox1, Mbdist, Mbprox, Mcdist, and Mcprox (this process is the same as the above-described simulation of the confidence interval of the CV) to calculate Pearson's r for each cOTU pair. Then, the OCI was obtained from the distribution of simulators simulated 1,000 times. - A network of cOTUs for each SCBG obtained using a threshold of 0.6 was visualized by a force-directed layout39 using the igraph of the package, and the layout of nodes (i.e., cOTUs) in the network was created using r which is larger than 0.9, and all r between cOTUs were displayed with color gradients using the RColorBrewer package.
- The network of SCBGs based on the correlation between SCBGs for each possible pair of SCBGs (Rinter) was visualized by a force-directed layout using the igraph package. The layout of SCBGs was determined based on Rinter that is larger than 0.7, and all Rinter between SCBGs were drawn by lines with color gradients using the RColorBrewer package. Kruskal-Wallis test for a comparison of the means of Rinter was performed using the function Kruskal.test in the R package stats.
- Interactions between a microbiota and a host are associated with homeostasis and many diseases of the host.13-16 To further understand the mechanism of interactions between the microbiota and the host in an integrated manner, it is important not only to study the microbiota, but also to link compositional analyses of the microbiota to other analyses, such as metabolomics and/or transcriptomics, for both the microbiota and the host.5 For this purpose, measurement of concentrations based on a commonly usable unit, for example, the number of cells per weight and/or the number of molecules per volume is required. However, it has been difficult to measure the microbiota composition at a cell level with current techniques.6-8 Furthermore, a microbiota comprises an enormous number of bacteria of a large number of bacterial species.17 Therefore, a high throughput cell quantification method having a high taxonomic resolution ability is demanded.
- High throughput methods based on sequencing of 16S rRNA gene amplification products using next-generation sequencing techniques have contributed to studies of the diversity of bacteria in a given cell population over many years.22,23 However, since conventional methods amplify the 16S rRNA gene from a purified bulk bacterial genome and measure the number of amplified molecules, they basically have the following limitations.
- 1) Since different species have a different copy number of the 16S rRNA gene on the genome, and the copy number is unknown for most species, it is difficult to measure the number of cells and compare the numbers of cells of different species;
- 2) Identification of 16S rRNA sequences is not accurate because of errors occurring during sequencing and amplification, resulting in a low taxonomic resolution ability.
- In fact, sequencing errors were corrected using molecular barcodes,24-26 but amplification errors due to a chimera generated mainly during sequence amplification have not been sufficiently removed.27
- To overcome these limitations of the conventional methods, a cell quantification method associated with accurate identification of the 16S rRNA genes and BarBIQ (
Figures 1a and29 ) was developed. First, a sample was prepared in a buffer solution, and the aggregates were broken by vortex. Subsequently, the bacterial sample was mixed with a solution containing cellular barcodes,25,26 primers, and reagents for DNA amplification, and the mixture was encapsulated into droplets with a size of 100 µm. The ratio of single cells and single cellular barcodes (i.e., DNA molecules) was adjusted based on the concentrations of barcodes and bacteria and the Poisson distribution, so that approximately 4% of droplets would have both single cells and single cellular barcodes. For subsequent sequencings, the amplified barcode and sequencing adapter were linked to the 16S rRNA gene amplified in the droplet by single-step amplification (approximately 450 nucleotides in the V3-V4 region)28 (Figure 5 ). After amplification, droplets were cut, the library (linked amplicons) was purified, and both the cellular barcodes and the 16S rRNA sequences of the individual amplified molecules were sequenced using a high throughput sequencer MiSeq. We analyzed the sequenced molecules (i.e., reads) for each sequence type of the barcode (i.e., cell), identified the type of each cell based on the 16S rRNA sequence, and counted the number of cells for each cell type (Figure 6 ). This analysis also functioned for bacteria having a plurality of 16S rRNA sequence types on the genome. This is because the same cellular barcode was linked to a plurality of amplified 16S rRNA sequences derived from an identical cell. Finally, the cell concentration for each cell type in a sample was obtained by normalizing the number of sequenced cells using the total concentration in the identical sample measured by droplet digital PCR (see the section of the "BarBIQ method"). - The essential difference between BarBIQ and conventional methods is the unit for defining the composition of a microbiota. In conventional methods, the unit is an operational taxonomic unit (OTU), and this essentially represents a group of similar obtained 16S rRNA sequences by clustering based on the identity of sequences obtained from bulk sampling.30 However, BarBIQ uses cell types classified based on the 16S rRNA sequence identified from each barcoded cell. To distinguish the cell-based method of the present inventors and conventional methods using OTUs, the classification unit obtained herein was designated as "cell-based operational taxonomic unit (cOTU)."
- First, it was demonstrated that BarBIQ acted on the mock cell population including 10 types of cultured human intestinal bacterial strains (Table 1). It was found that each of 16 sequences (Bar sequences) derived from the mock cell population including two pairs of Bar sequences identified by BarBIQ had a one-nucleotide difference (
Figure 1b ). - All 16 Bar sequences were found to be identical to one of 16S rRNA sequences identified by Sanger sequencing of 10 cultured strains (San sequences) (
Figure 1b ). It should be noted that some San sequences were not found by BarBIQ and detected from only one or two cells by Sanger sequencing. Subsequently, 10 cOTUs were identified from the 16 Bar sequences based on the cellular barcodes, and each of them corresponded to one of the 10 strains (Figures 1b and20 to 28 ). In contrast, when the identical mock cell populations were measured by a usual method, only two of 12 types of representative OUT sequences were found to be identical to one of San sequences (Figure 1b ). Therefore, BarBIQ had one-nucleotide precision and resolution ability for identifying 16S rRNA sequences. Here, it was concluded that the conventional method performed here was infeasible. - Subsequently, the concentration of each cOTU in the mock cell population ([C]BarBIQ) (per volume) was measured by BarBIQ. It was confirmed that the concentration measured by BarBIQ matched the cell concentration measured by microscopic imaging ([C]Microscopy,
Figure 1c ) . The Pearson moment correlation coefficient r (Pearson's r) between two measured values was 0.98. The mean ratio ([C]BarBIQ/[C]Microscopy) was 0.88, which was determined by applying it to a logarithmic scale using a fixed gradient 1 (R2 = 0.95). This result indicated that BarBIQ had accurately measured the cell concentration of each bacterium (cOTU) in the mock cell population. - Subsequently, we applied BarBIQ to the microbiota derived from the murine cecum. The cecum functions as a microorganism fermentation container31 and often selected as a sampling site for studies of microbiota-related diseases.32,33 As recently reported,34 we removed extracellular DNA from the cecal specimen because extracellular bacterial DNA might affect the quantification of the intestinal microbiota.
- In three co-accommodated male C57BL6/J mice (Ma, Mb, and Mc), a microbiota was investigated at two positions, distal (dist) and proximal (prox) positions of the coloncecum and small intestine-cecum joints (
Figure 2a ). Measurement was performed for the samples collected at both sites in Ma (three repeated experiments each were performed at a distal site,Ma dist1,Ma dist2, andMa dist3, and at a proximal site,Ma prox1,Ma prox2, and Maprox3) and for other samples (Mbdist, Mbprox, Mcdist, and Mcprox). A total of 1.3 × 10⁵ bacteria cells were counted, and 604 cOTUs including 730 Bar sequences were identified. Surprisingly, 230 identified Bar sequences (32% of the 730 sequences) have not yet been registered in the widely used three different public databases (GreenGene,10 Ribosomal Database Project,11 and Silva12), and their identity to the closest registered sequence was 86.9% to 99.9% (Figure 2b ). Since BarBIQ was found to have a single-nucleotide precision by the mock cell population, it was concluded that BarBIQ could identify unknown 16S rRNA sequences. - Subsequently, the cell concentration was quantified for each cOTU identified in the sample as described above. First, it was confirmed that technical replicates of the identical sample had high reproducibility (Pearson's r ≥ 0.982;
Figure 15 ), and that noises for quantification including the filtration step were mainly due to sampling (Figure 7b to 7d ). Subsequently, the cell concentrations were compared between the samples, using 240 cOTUs detected in all samples. We found that the concentrations of 10 to 97 cOTUs (Figures 2d, 2e , and16a to 16c ) of each sample pair (i.e., different positions and/or different mice) were different. The differences were larger than the sampling noises, and the change factor was larger than 2 (dots which were outside the confidence interval and whose change factor was two or more times larger inFigures 2d, 2e , and16 ; i.e., cOTUs considered to have a different concentration), but the concentrations of other 143 to 230 cOTUs (60% to 96% of the 240 cOTUs) were consistent (dots in the range of the confidence interval or with a change factor being less than two times in Figures 3d, 3e, and16a to 16c ). For example, when differences between healthy mice and diseased mice are to be described, consistent identification of bacteria would be crucial. - To quantify the overall difference in each sample pair, Bray-Curtis dissimilarity (diversity of β based on abundance)35 analysis was performed based on the cell concentrations in 240 cOTUs (
Figure 2f ). Consistent with the above-described observation results, the differences between different samples (between samples from different sites and between samples from different mice inFigure 2f ) were significantly larger than the differences between the repeated experiments in Ma (see Madist and Maprox inFigure 2f ). Furthermore, heterogeneity between samples at a proximal position or a different position (circular symbols inFigure 2d ) from different mice was higher than those at different positions from the same mouse or at a distal position from different mice (triangular symbols inFigure 2d ). These results indicated that the quantitative analysis of comprehensive cell-based differences in microbiotas showed that microbiotas from distal and proximal positions in the same mouse or different mice were different overall. - Further, both the position-dependent (dependent on the positions of the sample collection site (i.e., distal and proximal positions)) and mouse-dependent differences in concentrations were investigated for each of the 240 cOTUs. First, three repeated experiments were performed for each position in Ma to statistically compare cOTU concentrations between different positions of the same mouse. Of these, the concentrations of 13 cOTUs (5% of the 240 cOTUs) were significantly different (FDR < 0.05 and change factor > 2) (
Figure 8 ), and the maximum change factor (based on the mean concentration among repeated experiments) was 4.1. - Subsequently, consistency of the cell concentrations in three mice was quantified by calculating the coefficient of variation (CV, CV obtained by dividing the standard deviation of cell concentrations for three mice by their mean value) for cOTUs at each site (
Figure 3a ). The authors compared CVs between distal and proximal positions for each cOTU (Figures 9a and9b ) and found that CVs of the majority of cOTUs did not vary depending on the simulated confidence interval. Interestingly, consistency of cOTUs of an identical genus (i.e., CV) often varied (Figures 9a and9b ) (it should be noted that classification was predicted by the Bar sequence of each cOTU using RDP classifier36 because information from the public databases was limited). For example, the CV of cOTUs of the genus Clostridium XIVa ranged from 0.05 to 1.70 at the two sites (Figure 3b ). Interestingly, it has been reported that one species belonging to this genus produces a short chain fatty acid such as butylate,37 which is the main function of the cecum.31 This finding indicates that quantifying cells at more detailed levels than a genus level, in particular, quantifying cells at a cOTU level is required to further understand the physiological roles of bacteria.37,38 - To understand the relationships between cells, bacterial networks were explored based on correlations between cOTU pairs. Correlating bacterial networks associated with transition of conditions in humans have been shown over several years. However, the network analyses so far have been performed basically based on OTUs at the genus level or higher levels, in other words, based on OTUs, not cOTUs. In this example, using the measured concentrations of six samples (
Ma dist1,Ma prox1, Mbdist, Mbprox, Mcdist, and Mcprox), correlations based on cell concentrations were characterized by calculating Pearson's r for each pair of 296 commonly detected cOTUs on a logarithmic scale (Figure 4a ). No cOTUs having a high correlation with the majority of cOTUs were found, but some cOTUs strongly correlated with some other cOTUs (Figure 10 ). - Accordingly, we performed hierarchical clustering based on distances of all possible cOTU pairs and found groups of bacteria in which all cOTUs were strongly correlated (strongly correlated bacterial groups; SCBGs) using Iris (
Figure 4b ). To identify SCBGs including both positively and negatively correlated cOTUs, |r|, not r, was used, which means that the SCBG defined herein is a "relationship group." To secure the reliability of identification of SCBGs, simulated errors were considered to calculate Iris. When the threshold of 0.6, which is expressed as a dotted line on the evolutionary tree inFigure 4b , was used, a total of 31 SCBGs were found. SCBG was defined as a branch which was lower than the threshold and included three or more cOTUs (Figures 4b and17 ). The obtained SCBGs were characterized. The number of cOTUs in an SCBG varied from 3 to 19 (Figure 11c ), and more than half (16/31) of SCBGs included positively and negatively correlated cOTUs (Figures 4c and12a to 12f ). The mean abundances of cOTUs in each SCBG were widely distributed (Figures 4c and 11d), and the highest difference in abundance between the SCBGs was 230 times, which was observed in SCBG12 (Figure 11d). As in Figure 3c, taxonomic prediction (Figure 4c ) of each cOTG was different species (Figures 4c and13 ). These findings indicated that a strong relation was possible even if bacteria belonged to different taxa or their abundances were different. The number of SCBGs and the number of cOTUs in each SCBG change as a function of the threshold (Figures 11a and 11b ), and the threshold of 0.6 used herein seems to be a transition point for the number of SCBGs (Figure 11a ). To define SCBGs, a different threshold may be selected so that specific characteristics can be found in a given sample. - To assess characteristics of a bacterial microbiota at the entire network level, correlations between SCBGs were investigated using all possible SCBG pairs. The correlation Rinter between two SCBGs was defined as the mean of |r|s calculated for all possible cOTU pairs where two cOTUs in a pair are from different SCBGs (
Figure 4d ). First, it was confirmed that all Rinter were basically lower than the Rinner, which is a correlation within the SCBGs defined as the mean of |r|s calculated for all possible cOTU pairs in each SCBG (Figure 14a ). Subsequently, each SCBG was found to show a relatively high correlation with a small number of SCBGs. Finally, the mean of Rinter between an SCBG and all other SCBGs was calculated for each SCBG, and the mean of all 31 SCBGs was found not to have a significant difference using Kruskal-Wallis test (chi-square value = 30, df = 29, p value = 0.41) (Figure 14b ). These findings indicated that the average characteristics of all SCBGs in the overall network were not clear. Analyses of the entire bacterial networks, which compare the bacterial network of a disease model with that of a healthy mouse, are considered important, for example, to find characteristics of a disease-related landmark in a microbiota. - Further, the following investigation was performed.
- The large intestine was subdivided, and an analysis of each subdivided fragment was attempted in a state in which position information could be identified. Specifically, immediately after a mouse was slaughtered, the entire large intestine was removed and spread to make it linear, and the positional relationships of the solid contents in the large intestine were photographed. One solid content in the large intestine was removed in a state wrapped in the intestinal wall using sterilized scissors and sterilized tweezers and placed in the center of the hole of a brain slicer (Muromachi Kikai Co., Ltd., MK-RC-01) with the cecal side on the left (Panel a of
Figure 39 ). At this time, the brain slicer had been marked beforehand so that the cecal side (A) and the anal side (E) could be distinguished. - Subsequently, after sterilization in an autoclave, 3% agarose (Nacalai Tesque, 01157-95)-containing 1 × TAE (Nacalai Tesque, 32666-81) that had been incubated at 50°C was quietly poured (Panel b of
Figure 39 ) and allowed to stand at -20°C for 30 minutes to embed the large intestine content in an agarose gel (Panel c ofFigure 39 ). The brain slicer was removed from a freezer set at -20°C, and a sterilized razor blade (Muromachi Kikai Co., Ltd., TCB-100) was inserted into a groove of the brain slicer positioned approximately 1 mm left from the center of the solid large intestine content and the second groove positioned to the right thereof (Panel d ofFigure 39 ). Since the grooves of the brain slicer used in this experiment had a width of 1 mm, the central portion having a thickness of 2 mm (hereinafter, Area C) was separated from the large intestine content by this operation. Then, a razor blade was inserted into each of the grooves positioned at 2 mm or more and 3 mm or less inside from the left and right ends of the solid large intestine contents (Panel e ofFigure 39 ) to separate the cecal side end portion (hereinafter, Area A) and the anal side end portion (hereinafter, Area E). The widths of Area B (between Area A and Area C) and Area D (between Area C and Area E) varied depending on the length of the entire solid large intestine content. Further, in some intestinal samples, the length of the entire content was short, and either Area B or Area D was missing. Finally, a razor blade was inserted into each of the grooves positioned 1 mm or more outside from the left and right ends of the solid large intestine content. By removing the razor blades from the brain slicer, a section containing the large intestine content in each area was collected in a state in which the razor blade was attached thereto, and the large intestine content in each area was placed in a DNA LoBind Tube (Eppendorf, 0030108051) using sterilized tweezers. After removed from the brain slicer, Area C was placed on a sterilized Petri dish (Panel f ofFigure 39 ), divided into the central portion (hereinafter, Area CC) and the peripheral portion (hereinafter, Area CO) using a sterilized 15-gauge metal needle (Musashi Engineering, Inc., SNA-15G-B), and collected into DNA LoBind Tubes. A series of the above-described operations were also repeated for other solid large intestine content areas. - As a result, the solid large intestine contents could be divided into areas of A, B, CC, CO, D, and E (Panel g of
Figure 39 ) (however, Area B or D might be missing for the above-mentioned reasons). - Under a condition where bacteria cells were contained or not contained, the concentration of an equimolar mixed four cellular barcode template (hereinafter, equimolar mixed cellular barcodes) was measured by ddPCR. Specifically, first, QX200™ ddPCR™ EvaGreen Supermix (Bio-Rad, #1864034), 1 µM primers (NoBiotin-Link-barcode-F and P5-index-R1P-barcode-R), 0.1 µM dNTPs (New England BioLabs Inc., N0447), Platinum Taq DNA Polymerase (Thermo Fisher Scientific, 10966034), and a sample (equimolar mixed cellular barcodes and bacteria cells collected from the murine cecum, or equimolar mixed cellular barcodes alone) were mixed to make a volume of 30 µL and divided into DG8 Cartridge (Bio-Rad, #1864008). Subsequently, the mixture solution was encapsulated into droplets using Droplet Generation Oil for EvaGreen (Bio-Rad, #1864006) and Droplet Generator (Bio-Rad, #1864002JA).
- ddPCR was performed by the following steps:
- First stage, at 95°C for 5 minutes;
- Second stage, six cycles at 95°C for 45 seconds and at 60°C for 150 seconds;
- Third stage, 39 cycles at 95°C for 25 seconds and at 60°C for 80 seconds; and
- Fourth stage, at 4°C for 5 minutes and at 90°C for 5 minutes.
- Then, the barcode concentrations were measured using QX200 Droplet Reader (Bio-Rad, #1864003JA).
- The results showed that no significant differences were found in the measured values of the barcode concentrations under a condition where bacterial cells were contained or not contained (see
Figure 40 ), and that the presence or absence of bacteria cells did not affect the distribution ratio of barcodes to droplets. - This experiment examined whether the number of PCR cycles for preparing a sequence library by the BarBIQ method was sufficient to amplify 16S rRNA sequences in bacteria cells contained in a droplet. Specifically, first, QX200™ ddPCR™EvaGreen Supermix, 1 µM primers (F1-Fw and F1-Rv), 0.1 µM dNTPs, and a sample (bacteria cells collected from the murine cecum) were mixed to make a volume of 30 µL and divided into DG8 Cartridge.
- Subsequently, the mixture solution was encapsulated into droplets using Droplet Generation Oil for EvaGreen and Droplet Generator. ddPCR was performed under the same cycle condition as in the
above Experiment 2, excluding the third stage. In the third stage, the number of cycles was changed to 0, 10, 20, 30, 39, or 49. Then, the fluorescence intensity of droplets was measured using QX200 Droplet Reader, and positive and negative droplets were determined based on a threshold which is the trough of a bimodal distribution of the intensity, using a software QuantaSoft (Bio-Rad, #1864011JA). - The results showed that the intensity distributions of positive droplets and negative droplets were clearly separated (Panel a of
Figure 41 ), and the proportion of positive droplets to all droplets was constant at approximately 14% (Panel b ofFigure 41 ) under a condition where the number of cycles in the third stage was 30 or more, indicating that the number of PCR cycles for preparing a sequence library by the BarBIQ method was sufficient to amplify the 16S rRNA sequences in bacteria cells contained in a droplet. - This experiment examined whether the initial denaturation time for preparing a sequence library by the BarBIQ method was sufficient to amplify 16S rRNA sequences of bacteria cells contained in a droplet. Specifically, first, QX200™ ddPCR™EvaGreen Supermix, 1 µM primers (F1-Fw and F1-Rv), 0.1 µM dNTPs, and a sample (bacteria cells collected from the murine cecum) were mixed to make a volume of 30 µL and divided into DG8 Cartridge. Subsequently, the mixture solution was encapsulated into droplets using Droplet Generation Oil for EvaGreen and Droplet Generator. ddPCR was performed under the same cycle conditions as in the
above Experiment 2, excluding the first stage. In the first stage, the time was changed to 0, 5, or 10 minutes. Then, the fluorescence intensity of droplets was measured using QX200 Droplet Reader, and positive and negative droplets were determined based on a threshold which is the trough of a bimodal distribution of intensity, using a software QuantaSoft. - The results showed that the proportion of positive droplets to all droplets did not change even if the time of the first stage was changed (
Figure 42 ), indicating that the initial denaturation time for preparing a sequence library by the BarBIQ method was sufficient to amplify 16S rRNA sequences of bacteria cells contained in a droplet. - Currently, absolute quantification,3 accurate measurement,40 complete gene sequencing,41 and bacteriabacteria interactions tend to be considered in studies of microbiotas based on 16S rRNA gene amplification products.42 However, these considerations have not yet been associated with quantification of cells. As far as we know, BarBIQ is the first method that enables high taxonomic resolution quantification of a bacterial microbiota composition at a cell level in a high throughput format. Furthermore, one-nucleotide precision identification of unknown 16S RNA sequences by BarBIQ without using databases is considered useful for other studies. For example, to find a location of a newly found bacterium, fluorescence in situ hybridization (FISH) can be performed by designing a fluorescence probe using a 16S rRNA sequence identified by BarBIQ.
- Recently, different meta-omics datasets, such as metagenomics, transcriptomics, proteomics, and metabolomics, were integrated, and further calculation models using these datasets have been proposed as a promising direction for studying the mechanism of microbiota functions.5 Since bacterial cells not only integrate clearly different meta-omics datasets, but also are fundamental units for their functions in this approach, microbiota should be defined at a cell level. The analyses of microbiotas provided by BarBIQ, which are cell-based and not dependent on taxa, evolve microbiota studies from the current association research to necessary mechanism research.44
Here, A and B can be measured experimentally, log10 (total number of droplets/µ) can be set as a certain constant for each experiment. Therefore, when log10 (total number of droplets/µ) is assumed as a constant OD, the above expression can be converted to
This can be linearly approximated with y = x - OD. Log10 (Poission_Overlap) can be calculated by assuming various integers for A and B. If the value of log10 (Overlap) in reality is outside the confidence interval of the calculated log10(Poission_Overlap), it can be estimated that two nucleotide sequences were contained in one cell. Additionally, if two nucleotide sequences are within the confidence interval of log10 (Poission_Overlap), it can be estimated that they were contained in different cells. As a confidence interval, for example, a one-sided confidence interval (for example, it can be a confidence interval of 95% or higher, 98% or higher, 99% or higher, or 99.9%, or higher) can be used. Thus, if it cannot be explained statistically by the Poisson distribution, it can be estimated that two nucleotide sequences were contained in one cell. Or, if it can be explained statistically by the Poisson distribution, it can be estimated that two nucleotide sequences existed in different cells.
Claims (19)
- A method for treating a cell population, the method comprising(A) obtaining a droplet population from a cell dispersion comprising an isolated cell population, the droplet population comprising aqueous droplets, at least some of which each comprise one cell and one-molecule cellular barcode.
- A method for analyzing nucleotide sequences of genes included in a cell population, the method comprising(A) obtaining a droplet population from a cell dispersion comprising an isolated cell population, the droplet population comprising aqueous droplets, at least some of which each comprise one cell and one-molecule cellular barcode; and(B) obtaining an amplification product of the cellular barcode and an amplification product of a predetermined gene in each obtained droplet, further obtaining a linked product comprising nucleotide sequences of the cellular barcode and all or some of the predetermined gene, and collecting the obtained linked product from the droplets into an aqueous solution and sequencing the obtained linked product to determine the nucleotide sequence of the predetermined gene and the nucleotide sequences of the cellular barcode.
- The method according to claim 2, wherein, in the (B), the amplification product of the cellular barcode has a first region derived from a first primer, the amplification product of the predetermined gene has a second region derived from a second primer, the first region and the second region have complementary sequence portions hybridizable with each other, the first primer and the second primer each have one or more tag molecules linked thereto, and the tag molecule is not included in the linked product; and
the method further comprising removing the amplification product having a tag molecule from the linked products collected into the aqueous solution using a column or a bead carrying a molecule having an affinity for the tag molecule in the (B). - The method according to claim 2 or 3, further comprising
(C-1) clustering the determined nucleotide sequences based on the determined nucleotide sequence of the cellular barcode to obtain a plurality of first clusters. - The method according to claim 4, further comprising
(D-1) estimating the number of cells included in the cell population or the number of cells having a specific predetermined gene from the number of the obtained first clusters. - The method according to claim 2 or 3, further comprising
(C-2) clustering the determined nucleotide sequences based on the determined nucleotide sequence of the predetermined gene to obtain a plurality of second clusters. - The method according to claim 6, further comprising
(D-2) estimating the number of cell types included in the cell population from the number of the obtained second clusters. - The method according to claim 2 or 3, further comprising
(C-3) clustering the determined nucleotide sequences based on the determined nucleotide sequence of the cellular barcode to obtain a plurality of first clusters, and clustering the determined nucleotide sequences based on the determined nucleotide sequence of the predetermined gene to obtain a plurality of second clusters. - The method according to claim 8, further comprising
(D-3) determining the first cluster, into which the nucleotide sequence of the predetermined gene is classified, from the nucleotide sequence of a cellular barcode linked to the nucleotide sequence of the predetermined gene classified into at least one second cluster based on information on combinations of the obtained nucleotide sequence of the cellular barcode and the obtained nucleotide sequence of the predetermined gene, and estimating the number of cells classified into the second cluster from the number of the first clusters into which the cellular barcode is classified. - The method according to claim 8, further comprising
(C-4) when sequences classified into one identical first cluster are classified into different second clusters, classifying the second clusters into one identical cell-based operational taxonomic unit (cOTU). - The method according to claim 10, further comprising
(E) estimating (i) the number of cOTUs included in the cell population and/or (ii) the number of cells included in a specific cOTU for each of a first cell population and a second cell population different from the first cell population, and comparing (i) the number of cOTUs and/or (ii) the number of cells included in the specific cOTU estimated for the first cell population with (i) the number of cOTUs and/or (ii) the number of cells included in the specific cOTU estimated for the second cell population. - The method according to claim 11, comprising
(F) comparing (i) the number of cOTUs and (ii') the number of cells included in the specific cOTU estimated for the first cell population with (i) the number of cOTUs and (ii') the number of cells included in the specific cOTU estimated for the second cell population. - The method according to any one of claims 1 to 12, wherein the cell population is a microbiota.
- The method according to claim 13, wherein the microbiota is a microbiota in the body or on the body surface.
- The method according to claim 13, wherein the microbiota is a microbiota in the gastrointestinal tract.
- The method according to claim 11 or 12, wherein the first cell population and the second cell population are microbiotas obtained from different sites of an identical subject.
- The method according to claim 11 or 12, wherein the first cell population and the second cell population are microbiotas obtained from an identical site of different subjects.
- The method according to claim 11 or 12, wherein the first cell population and the second cell population are microbiotas obtained from an identical site of an identical subject at different time points.
- The method according to any one of claims 1 to 18, wherein the cell population includes unknown cells.
Applications Claiming Priority (2)
| Application Number | Priority Date | Filing Date | Title |
|---|---|---|---|
| JP2020094141 | 2020-05-29 | ||
| PCT/JP2021/020338 WO2021241721A1 (en) | 2020-05-29 | 2021-05-28 | Method for treating cell population and method for analyzing genes included in cell population |
Publications (2)
| Publication Number | Publication Date |
|---|---|
| EP4159873A1 true EP4159873A1 (en) | 2023-04-05 |
| EP4159873A4 EP4159873A4 (en) | 2024-07-17 |
Family
ID=78744799
Family Applications (1)
| Application Number | Title | Priority Date | Filing Date |
|---|---|---|---|
| EP21812570.6A Pending EP4159873A4 (en) | 2020-05-29 | 2021-05-28 | Method for treating cell population and method for analyzing genes included in cell population |
Country Status (6)
| Country | Link |
|---|---|
| US (1) | US20230203600A1 (en) |
| EP (1) | EP4159873A4 (en) |
| JP (1) | JP7423101B2 (en) |
| CN (1) | CN115867676A (en) |
| CA (1) | CA3185619A1 (en) |
| WO (1) | WO2021241721A1 (en) |
Families Citing this family (1)
| Publication number | Priority date | Publication date | Assignee | Title |
|---|---|---|---|---|
| CN114642684B (en) * | 2022-03-21 | 2024-07-26 | 北京航空航天大学 | Eubacterium rectum (Eubacterium rectale) for preventing and treating anxiety depression |
Family Cites Families (11)
| Publication number | Priority date | Publication date | Assignee | Title |
|---|---|---|---|---|
| ES2615733T3 (en) | 2010-12-16 | 2017-06-08 | Gigagen, Inc. | Methods for parallel mass analysis of nucleic acids in individual cells |
| US9260753B2 (en) | 2011-03-24 | 2016-02-16 | President And Fellows Of Harvard College | Single cell nucleic acid detection and analysis |
| US20150154352A1 (en) * | 2012-06-21 | 2015-06-04 | Gigagen, Inc. | System and Methods for Genetic Analysis of Mixed Cell Populations |
| EP4112744A1 (en) * | 2015-02-04 | 2023-01-04 | The Regents of the University of California | Sequencing of nucleic acids via barcoding in discrete entities |
| CN108369230B (en) | 2015-09-25 | 2021-09-17 | 阿布维特罗有限责任公司 | High throughput method for T cell receptor targeted identification of naturally paired T cell receptor sequences |
| CN108473984A (en) | 2015-11-04 | 2018-08-31 | 阿特雷卡公司 | The group of nucleic acid bar code for analyzing nucleic acid associated with individual cells is combined |
| JP2019531730A (en) * | 2016-09-28 | 2019-11-07 | ジェネラル オートメーション ラボ テクノロジーズ インコーポレイテッド | Bacterial community relationship determination and other high-throughput microbiology applied high resolution systems, kits, devices, and methods |
| EP3545089B1 (en) * | 2017-01-30 | 2022-03-09 | 10X Genomics, Inc. | Methods and systems for droplet-based single cell barcoding |
| MA49352A (en) * | 2017-05-26 | 2020-04-08 | Abvitro Llc | HIGH YIELD POLYNUCLEOTIDE LIBRARY SEQUENCING AND TRANSCRIPTOME ANALYSIS |
| JP7160349B2 (en) | 2017-06-23 | 2022-10-25 | 国立研究開発法人理化学研究所 | Methods of sequencing and analyzing nucleic acids |
| US11525164B2 (en) * | 2018-03-27 | 2022-12-13 | The Trustees Of Columbia University In The City Of New York | Spatial metagenomic characterization of microbial biogeography |
-
2021
- 2021-05-28 WO PCT/JP2021/020338 patent/WO2021241721A1/en unknown
- 2021-05-28 US US17/928,184 patent/US20230203600A1/en active Pending
- 2021-05-28 CN CN202180038544.5A patent/CN115867676A/en active Pending
- 2021-05-28 CA CA3185619A patent/CA3185619A1/en active Pending
- 2021-05-28 JP JP2022526658A patent/JP7423101B2/en active Active
- 2021-05-28 EP EP21812570.6A patent/EP4159873A4/en active Pending
Also Published As
| Publication number | Publication date |
|---|---|
| US20230203600A1 (en) | 2023-06-29 |
| JPWO2021241721A1 (en) | 2021-12-02 |
| JP7423101B2 (en) | 2024-01-29 |
| WO2021241721A1 (en) | 2021-12-02 |
| CA3185619A1 (en) | 2021-12-02 |
| CN115867676A (en) | 2023-03-28 |
| EP4159873A4 (en) | 2024-07-17 |
Similar Documents
| Publication | Publication Date | Title |
|---|---|---|
| AU2021202149B2 (en) | Detecting repeat expansions with short read sequencing data | |
| US12087401B2 (en) | Using cell-free DNA fragment size to detect tumor-associated variant | |
| EP3169803B1 (en) | Non-invasive prenatal diagnosis of fetal genetic condition using cellular dna and cell free dna | |
| US12040053B2 (en) | Methods for generating sequencer-specific nucleic acid barcodes that reduce demultiplexing errors | |
| CN111394426A (en) | Transposition to native chromatin for personal epigenomics | |
| JP7009518B2 (en) | Methods and systems for the degradation and quantification of DNA mixtures from multiple contributors of known or unknown genotypes | |
| EP4159873A1 (en) | Method for treating cell population and method for analyzing genes included in cell population | |
| CN114736970B (en) | Method for identifying different crowds | |
| RU2799654C2 (en) | Sequence graph-based tool for determining variation in short tandem repeat areas | |
| Ogundolie et al. | Microbiome characterization and identification: key emphasis on molecular approaches | |
| Bajaj et al. | MICROBIAL GENOMICS | |
| Barbaro | Overview of NGS platforms and technological advancements for forensic applications | |
| Reineke et al. | Microbial Communities: Structural and Functional Analyses with Molecular Biological Approach | |
| Nema et al. | Significance of Upcoming Technologies and Their Potential Applications in Understanding Microbial Diversity | |
| WO2018061638A1 (en) | METHOD FOR DETERMINING ORIGIN OF HUMAN GENOMIC DNA OF 100 pg OR LESS THEREFROM, METHOD FOR PERSONAL IDENTIFICATION, AND METHOD FOR ANALYZING DEGREE OF ENGRAFTMENT OF HEMATOPOIETIC STEM CELL | |
| Calus | Evaluation of nanopore-based sequencing technology for gene marker based analysis of complex microbial communities. Method development for accurate 16S rRNA gene amplicon sequencing |
Legal Events
| Date | Code | Title | Description |
|---|---|---|---|
| STAA | Information on the status of an ep patent application or granted ep patent |
Free format text: STATUS: THE INTERNATIONAL PUBLICATION HAS BEEN MADE |
|
| PUAI | Public reference made under article 153(3) epc to a published international application that has entered the european phase |
Free format text: ORIGINAL CODE: 0009012 |
|
| STAA | Information on the status of an ep patent application or granted ep patent |
Free format text: STATUS: REQUEST FOR EXAMINATION WAS MADE |
|
| 17P | Request for examination filed |
Effective date: 20221222 |
|
| AK | Designated contracting states |
Kind code of ref document: A1 Designated state(s): AL AT BE BG CH CY CZ DE DK EE ES FI FR GB GR HR HU IE IS IT LI LT LU LV MC MK MT NL NO PL PT RO RS SE SI SK SM TR |
|
| DAV | Request for validation of the european patent (deleted) | ||
| DAX | Request for extension of the european patent (deleted) | ||
| A4 | Supplementary search report drawn up and despatched |
Effective date: 20240618 |
|
| RIC1 | Information provided on ipc code assigned before grant |
Ipc: C12Q 1/686 20180101ALI20240612BHEP Ipc: C12Q 1/02 20060101ALI20240612BHEP Ipc: C12Q 1/6869 20180101AFI20240612BHEP |