WO2021193101A1 - 画像解析システム、画像解析方法及び画像解析プログラム - Google Patents
画像解析システム、画像解析方法及び画像解析プログラム Download PDFInfo
- Publication number
- WO2021193101A1 WO2021193101A1 PCT/JP2021/009791 JP2021009791W WO2021193101A1 WO 2021193101 A1 WO2021193101 A1 WO 2021193101A1 JP 2021009791 W JP2021009791 W JP 2021009791W WO 2021193101 A1 WO2021193101 A1 WO 2021193101A1
- Authority
- WO
- WIPO (PCT)
- Prior art keywords
- image
- image analysis
- monitored object
- existence
- grid
- Prior art date
- Legal status (The legal status is an assumption and is not a legal conclusion. Google has not performed a legal analysis and makes no representation as to the accuracy of the status listed.)
- Ceased
Links
Images



Classifications
-
- G—PHYSICS
- G06—COMPUTING OR CALCULATING; COUNTING
- G06V—IMAGE OR VIDEO RECOGNITION OR UNDERSTANDING
- G06V20/00—Scenes; Scene-specific elements
- G06V20/50—Context or environment of the image
- G06V20/52—Surveillance or monitoring of activities, e.g. for recognising suspicious objects
-
- G—PHYSICS
- G06—COMPUTING OR CALCULATING; COUNTING
- G06T—IMAGE DATA PROCESSING OR GENERATION, IN GENERAL
- G06T7/00—Image analysis
- G06T7/0002—Inspection of images, e.g. flaw detection
-
- G—PHYSICS
- G06—COMPUTING OR CALCULATING; COUNTING
- G06T—IMAGE DATA PROCESSING OR GENERATION, IN GENERAL
- G06T7/00—Image analysis
- G06T7/10—Segmentation; Edge detection
- G06T7/11—Region-based segmentation
-
- G—PHYSICS
- G06—COMPUTING OR CALCULATING; COUNTING
- G06V—IMAGE OR VIDEO RECOGNITION OR UNDERSTANDING
- G06V10/00—Arrangements for image or video recognition or understanding
- G06V10/20—Image preprocessing
- G06V10/255—Detecting or recognising potential candidate objects based on visual cues, e.g. shapes
-
- G—PHYSICS
- G06—COMPUTING OR CALCULATING; COUNTING
- G06V—IMAGE OR VIDEO RECOGNITION OR UNDERSTANDING
- G06V10/00—Arrangements for image or video recognition or understanding
- G06V10/40—Extraction of image or video features
- G06V10/50—Extraction of image or video features by performing operations within image blocks; by using histograms, e.g. histogram of oriented gradients [HoG]; by summing image-intensity values; Projection analysis
-
- G—PHYSICS
- G08—SIGNALLING
- G08B—SIGNALLING SYSTEMS, e.g. PERSONAL CALLING SYSTEMS; ORDER TELEGRAPHS; ALARM SYSTEMS
- G08B25/00—Alarm systems in which the location of the alarm condition is signalled to a central station, e.g. fire or police telegraphic systems
-
- H—ELECTRICITY
- H04—ELECTRIC COMMUNICATION TECHNIQUE
- H04N—PICTORIAL COMMUNICATION, e.g. TELEVISION
- H04N7/00—Television systems
- H04N7/18—Closed-circuit television [CCTV] systems, i.e. systems in which the video signal is not broadcast
-
- G—PHYSICS
- G06—COMPUTING OR CALCULATING; COUNTING
- G06T—IMAGE DATA PROCESSING OR GENERATION, IN GENERAL
- G06T2207/00—Indexing scheme for image analysis or image enhancement
- G06T2207/20—Special algorithmic details
- G06T2207/20021—Dividing image into blocks, subimages or windows
-
- G—PHYSICS
- G06—COMPUTING OR CALCULATING; COUNTING
- G06T—IMAGE DATA PROCESSING OR GENERATION, IN GENERAL
- G06T2207/00—Indexing scheme for image analysis or image enhancement
- G06T2207/20—Special algorithmic details
- G06T2207/20081—Training; Learning
-
- G—PHYSICS
- G06—COMPUTING OR CALCULATING; COUNTING
- G06V—IMAGE OR VIDEO RECOGNITION OR UNDERSTANDING
- G06V2201/00—Indexing scheme relating to image or video recognition or understanding
- G06V2201/07—Target detection
Definitions
- the present invention relates to an image analysis system, and particularly monitors an image analysis system, an image analysis method, and an image capable of quickly detecting and notifying an abnormality without increasing the processing amount by monitoring the state of a specific object.
- the analysis program Regarding the analysis program.
- an object detection YOLO: YouOnlyLookOnce
- object detection a model learned by deep learning is used to detect the shape of an object by surrounding the area of the monitored object with a rectangle and detect the change in shape.
- Patent Document 1 Japanese Patent Application Laid-Open No. 2011-61651 "Suspicious Object Detection System” (Patent Document 1) and Japanese Patent Application Laid-Open No. 2010-171705 "Surveillance Video Search Device and Surveillance Video Search Program” (Patent). There is a document 2).
- Patent Document 1 describes that a suspicious object is detected by comparing a captured image with a reference image using a reference image having a brightness closest to the brightness of the image captured by the two-dimensional imaging device.
- Patent Document 2 describes that pattern matching is performed by comparing the latest monitored image data with the past monitored image data, the amount of movement of pixels is calculated, and a moving body is detected.
- the conventional image analysis system using object detection has a problem that the amount of processing is large and it is complicated to collect teacher data and learn a model.
- Patent Document 1 and Patent Document 2 an image in a region where a monitored object is expected to exist is divided into a plurality of grids, and learning is performed on an image in which an object exists and an image in which an object does not exist in each grid. It is not described that a completed model is created and the existence of an object is determined based on the trained model for the input image.
- the present invention has been made in view of the above-mentioned actual conditions, and can correctly detect the state of an object with a small amount of processing. Further, learning is continued using the acquired image data and the state of the object as teacher data, and the detection accuracy is high. It is an object of the present invention to provide an image analysis system, an image analysis method, and an image analysis program capable of improving the above.
- the present invention for solving the problems of the above-mentioned conventional example is an image analysis system having an image analysis server that analyzes an input image of a monitoring area and detects the state of a specific monitored object, and performs image analysis.
- the server divides a part of the image of the monitored area where the monitored object is expected to exist into a plurality of grids, and learns the image when the monitored object exists and does not exist for each grid. It is characterized in that the trained model is created and it is determined whether or not a monitored object exists in the grid based on the trained model for the input image.
- the image analysis server associates "1" with an image in which a monitored object exists in the grid and "0" with an image in which the monitored object does not exist, for each grid. It is characterized in that it includes a trained trained model, and uses the trained model to calculate the certainty of the existence of a monitored object for each grid of an input image.
- the image analysis server determines the existence or nonexistence of the monitored object in the monitored area based on the certainty of the plurality of grids, and the certainty of the certainty in any of the grids. It is characterized by detecting an anomaly when the value contradicts the existence or non-existence information.
- the image analysis server acquires information indicating the existence or non-existence of the monitored object in the monitoring area from the outside, and the value of the degree of certainty in any of the grids is determined. It is characterized by detecting an abnormality when it contradicts the existence or non-existence information.
- the image analysis server stores a set of grid unit images and the presence / absence information of the monitored object corresponding to the grid units as learning data, and uses the learning data. It is characterized by training to build a new model and updating the trained model with the new model.
- the present invention is characterized in that, in the above image analysis system, the image analysis server removes information on the presence or absence of the image in which the abnormality is detected and the corresponding monitored object from the training data.
- the present invention is an image analysis method for detecting the state of a specific monitored object by analyzing an input image of the monitored area, and it is expected that the monitored object exists in the image of the monitored area.
- the area is divided into a plurality of grids, a trained model is created in which images are learned when the monitored object exists and when the monitored object does not exist in each grid, and the input image is based on the trained model. It is characterized in determining whether or not a monitored object exists in the grid.
- the present invention is an image analysis program that operates on an image analysis server that analyzes an input image of a monitoring area and detects the state of a specific monitored object.
- the image analysis server is used for each grid.
- a trained model is generated by associating "1" with an image in which a monitored object exists in the grid and associating "0" with an image that does not exist, and using the trained model, about the input image.
- the certainty of the existence of the monitored object is calculated for each grid, and information indicating the existence or non-existence of the monitored object in the monitored area is acquired from the outside, and the image for each grid and the acquired existence or non-existence are acquired. It is characterized in that it stores information in association with each other and functions to detect an abnormality when the certainty value in any of the grids is inconsistent with the existence or non-existence information.
- an image analysis system having an image analysis server that analyzes an input image of a monitoring area and detects the state of a specific monitored object, and the image analysis server uses the image of the monitoring area as an image.
- a part of the area where the monitored object is expected to exist is divided into multiple grids, and a trained model is created and input by learning the images when the monitored object exists and does not exist for each grid. Since it is an image analysis system that determines whether or not a monitored object exists in the grid based on the trained model for the image, it is possible to analyze only a preset specific area instead of the entire image. Judgment is possible, the amount of processing can be significantly reduced, and the manager of the monitored object can quickly recognize and respond to an abnormality based on the judgment result.
- the image analysis server trains each grid by associating "1" with an image in which a monitored object exists in the grid and associating "0" with an image in which the monitored object does not exist. Since the image analysis system is equipped with a trained model and calculates the certainty that a monitored object exists for each grid of the input image using the trained model, the detection accuracy is calculated by processing using the trained model. Has the effect of improving.
- the image analysis server determines the existence or non-existence of the monitored object in the monitored area based on the certainty of the plurality of grids, and the value of the certainty in any of the grids is determined. Since the image analysis system is used to detect anomalies when it contradicts the existence or nonexistence information, it is possible to detect anomalies in a monitored object from image data without requiring information from an external device. There is an effect that the system can be realized with a simple configuration.
- the image analysis server acquires information indicating the existence or non-existence of the monitored object in the monitored area from the outside, and the certainty value in any of the grids is the existence.
- the image analysis system is used to detect an abnormality when it conflicts with non-existent information, there is an effect that an abnormality of a monitored object can be detected by a simple process using information from the outside.
- the image analysis server stores a set of grid-based images and the corresponding / non-existent information of the monitored object as learning data, and performs learning using the learning data. Since a new model is constructed and the trained model is updated with the new model as an image analysis system, there is an effect that the learning accuracy and the detection accuracy can be improved. Further, according to the present invention, the image analysis server is the above-mentioned image analysis system that removes the information on the existence or non-existence of the image in which the abnormality is detected and the corresponding object to be monitored from the learning data. There is an effect that the detection accuracy can be further improved.
- the present invention is an image analysis method for detecting the state of a specific monitored object by analyzing an input image of the monitored area, and the monitored object may exist in the image of the monitored area.
- the expected area is divided into a plurality of grids, a trained model is created in which images with and without monitored objects are trained for each grid, and the trained model is used for the input image.
- the image analysis method is used to determine whether or not a monitored object exists in the grid, it is possible to make a determination by analyzing only a specific area set in advance instead of the entire image, and the amount of processing is greatly reduced.
- the manager of the monitored object has the effect of being able to quickly recognize and respond to an abnormality based on the determination result.
- an image analysis program that operates on an image analysis server that analyzes an input image of a monitoring area and detects the state of a specific monitored object, and the image analysis server is set for each grid.
- a trained model was generated by associating "1" with an image in which a monitored object exists in the grid and associating "0" with an image not existing, and input using the trained model.
- the certainty of the existence of the monitored object is calculated for each grid, and the information indicating the existence or non-existence of the monitored object in the monitored area is acquired from the outside, and the image for each grid and the acquired existence or non-existence are acquired.
- the image analysis system monitors the state of an object (monitored object) existing in the monitored area, divides the image of the area into a plurality of grids, and the monitored object exists. For some of the grids that are expected to be Based on the model, it is equipped with an image analysis server that determines whether or not there is a monitored object in the grid, and the state of the monitored object can be detected by simple processing for each grid, and the administrator can detect it. It is possible to determine whether or not the state of the monitored object is normal, and it is possible to improve convenience.
- the image analysis server (this image analysis server) of this image analysis system associates "1 (exists)” with an image in which a monitored object exists in each grid, and "0 (does not exist)” with an image that does not exist. Is installed, and when an image is input to the model, the certainty of the existence of the object is calculated in grid units, and based on the certainty of multiple grids in the monitoring area. It is for determining whether or not the monitored object exists in the area and whether or not the object is in a normal state, and the convenience can be improved.
- the image analysis server of this image analysis system determines the existence or non-existence of the monitored object in the monitored area based on the certainty of a plurality of grids, and the value of the certainty in any of the grids is present or present. It detects anomalies when they conflict with non-existent information, and can detect anomalies in monitored objects from image data without the need for information from external devices, realizing a system with a simple configuration. It can be done. Further, the image analysis server of this image analysis system receives data indicating the state of the monitored object from the outside, and determines the state of the received monitored object and the presence / absence of the monitored object for each grid determined from the image. When they do not match, the abnormality is detected, and the administrator can quickly recognize the defect of the monitored object and deal with it.
- the image analysis server of this image analysis system accumulates a set of grid-based images and the corresponding / non-existent information of the monitored object as learning data, and performs learning using the learning data.
- a new model can be constructed and the trained model can be updated with the new model, and the learning accuracy and the detection accuracy can be further improved.
- the image analysis server of this image analysis system removes the information on the existence or non-existence of the image in which the abnormality is detected and the corresponding monitored object from the learning data, further improving the learning accuracy and the detection accuracy. It is something that can be made to do.
- the image analysis method (this image analysis method) according to the present embodiment is an image analysis method in the image analysis server of the present image analysis system
- the image analysis program (the present image analysis program) according to the present embodiment is , This is a program that causes this image analysis server to perform image analysis processing.
- FIG. 1 is a configuration diagram of this image analysis system.
- the image analysis system includes an image analysis server 1, an image database (image DB) 2, a learning data storage unit 3, and is further connected to the image analysis server 1 via a network 7.
- the display terminal 4, the camera 5, and the gate opening / closing device 6 are provided as the configuration.
- the image analysis server 1 is a characteristic part of this system, and is a server that analyzes an image of a monitored object and detects its state or abnormality.
- the monitored object is a gate bar provided at the parking lot gate.
- the image analysis server 1 includes a control unit 11, a storage unit 12, and an interface 13. By executing a processing program stored in the storage unit 12 on the control unit 11, image data can be collected, analyzed, and described later. It realizes the function of learning to do.
- the image of the monitored object is divided into a plurality of rectangular areas (grids) instead of the entire image taken by the camera as the analysis target, and the monitored object is monitored in the monitored area.
- Image analysis is performed only on the grid where objects are likely to exist. As a result, the processing becomes simpler than the case where the entire screen is targeted for processing, and the processing amount can be significantly reduced.
- this image analysis system is not in an environment where it is not possible to predict when the monitored object will appear and how it will move, but the area in which the monitored object is constantly present is almost constant, and the monitored object is being monitored. This is particularly effective when the movement of is a predetermined movement.
- the control unit 11 of the image analysis server 1 is equipped with a trained model realized by AI (Artificial Intelligence).
- AI Artificial Intelligence
- the trained model of the control unit 11 has a large number of bars (gate bars) that open and close the parking lot gate, which correspond to a closed (down) state and an open (up) state.
- This is a model in which learning is performed by reading teacher data in which each image is tagged with an “open state” (“0”) or a “closed state” (“1”).
- the image analysis server 1 continuously learns the image data and the open / closed state of the gate bar even during operation, and updates (re-learns) the trained model at any time to improve the accuracy of image analysis. It has become.
- the processing of the image analysis server 1 will be described later.
- the image DB 2 stores images of the monitoring area captured by the camera 5 and received via the network 7 together with the imaging date and time.
- the learning data storage unit 3 stores learning data (teacher data) for further learning the analysis model of the image analysis server 1.
- the training data will be described later, but it is an image in which the image data acquired during the operation of this system and the open / closed state of the gate bar are associated with each other, and the feature of this system is that the training data is in grid units.
- the display terminal 4 is a personal computer or the like that can be operated and viewed by the administrator, receives an abnormality notification signal from the image analysis server 1, and displays an alarm.
- the camera 5 is fixedly installed at a predetermined position where the gate bar, which is a monitored object, can be photographed in an open state and a closed state, and an image of the gate bar is photographed and transmitted to the image analysis server 1 via the network 7. Further, the camera 5 is operated in a state where the pan, tilt, and zoom are fixed.
- the gate opening / closing device 6 is a device that controls raising / lowering (opening / closing) of the gate bar, and includes an opening / closing mechanism that holds the gate bar and performs an opening / closing operation. "Opening and closing the gate bar" may be referred to as “opening and closing the gate”. Further, the gate opening / closing device 6 notifies the image analysis server 1 of data (gate opening / closing information) indicating the current opening / closing state of the gate. The image analysis server 1 relearns the model by associating the image data from the camera 5 with the open / closed state of the gate acquired from the gate opening / closing device 6, or an abnormality of the monitored target (gate bar) (gate bar). For example, malfunction, breakage, cracking, cutting) is detected.
- FIG. 2 is an explanatory diagram showing an outline of this image analysis method.
- the front right side of the screen is a portion attached to the gate opening / closing device 6, and the back side of the left side of the screen is a tip portion.
- a holder for holding the gate bar is provided at the tip portion.
- the gate bar is driven by the gate opening / closing device 6, and the gate is opened / closed by moving the tip portion up and down so as to draw an arc around a portion attached to the gate opening / closing device 6, for example.
- the image analysis server 1 divides the image into a plurality of grids, extracts an area in which the gate bar normally exists, and performs image analysis only on the grid. That is, for any image, the image of the grid at the same position on the screen is analyzed. In the example of FIG. 2, nine grids are extracted and each has a grid number (not shown).
- the image analysis server 1 reads an image with the gate open and an image with the gate closed for each preset grid number, and sets the open image to "0" and the closed image to "0". 1 ”is tagged to build a trained model.
- the holder holding the tip of the gate, neighboring buildings (not shown), etc. are learned as background images so as not to affect the image analysis of the gate bar.
- the image analysis server 1 calculates the certainty (value of 0 or more and 1 or less) that the gate bar exists in the grid for each grid number.
- FIG. 2B shows an example of the degree of certainty for each grid. Then, based on the obtained certainty, the image analysis server 1 determines that the grid has a low certainty that the gate bar exists even though the open / closed state of the gate is "closed". It is determined that the gate bar does not exist, and an abnormality notification signal is output.
- the model is learned using the image of the gate bar viewed diagonally from the side (thick in the foreground and thin in the back) to calculate the certainty, but the gate bar is viewed from the front. After converting the image to the state of viewing (constant thickness), learning and calculation of certainty may be performed.
- the size and position of the grid can be set arbitrarily.
- FIG. 3 is an explanatory diagram showing an example of abnormality detection in the image analysis server 1.
- the image analysis server 1 has a gate bar in the grid if the certainty obtained from the input image is equal to or higher than a preset threshold value, and is equal to or lower than the threshold value. If so, it is determined that the gate bar does not exist.
- the threshold of certainty is set to 0.4, in the example of FIG. 3, the certainty of the grid at the cutting edge is 0.2, and the certainty of the grid to the right is 0.4. Yes, it is determined that there is no gate bar in these grids. If the gate opening / closing information from the gate opening / closing device 6 is "closed” and the gate bar does not exist in any of the grids (if the certainty is below the threshold value), the existence is based on the gate opening / closing information and the certainty. The state does not match, and the image analysis server 1 detects an abnormality and outputs an abnormality notification signal. If the certainty of the tip portion is low, it is expected that the gate bar is damaged (broken, cracked, cut, etc.) in some way.
- an abnormality is detected even if there is a grid where the gate bar exists (the certainty is equal to or higher than the threshold value).
- the gate bar is raised, abnormalities such as a state in which the bar is broken and hangs down in the middle, a malfunction of the opening / closing mechanism, and an erroneous detection due to a change in the background image are expected.
- the image analysis server 1 detects that the state of the gate bar is normal. In this system, the state and abnormality of the gate bar are detected in this way. Compared with conventional pattern matching, the method of this system is less susceptible to changes in sunshine and aging, and can accurately detect the state of the monitored object.
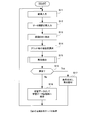
- FIG. 4 is a flowchart showing processing during operation of the image analysis server 1.
- the image analysis server 1 inputs the image from the camera 5 (S11) and inputs the gate open / closed state from the gate opening / closing device 6 (S12), the received image corresponds to the gate open / closed state. It is attached and saved in the image DB2 (S13).
- the image analysis server 1 cuts out (extracts) a preset grid from the input image, and calculates the certainty degree for each cut out grid (S14). Further, as described above, the image analysis server 1 compares the certainty of each grid with the threshold value, collates it with the gate opening / closing information from the gate opening / closing device 6, and detects the presence / absence of an abnormality (S15).
- the image analysis server 1 determines whether or not an abnormality has been detected (S16), and if an abnormality is detected (in the case of Yes), outputs an abnormality notification signal to the display terminal 4 (S17).
- the case where an abnormality is detected is a case where the gate opening / closing information and the existence of the gate bar in the grid obtained from the certainty do not match (inconsistent or inconsistent) as described above.
- the image analysis server 1 stores the images input in the processes S11 and S12 and the corresponding open / closed state as learning data in the learning data DB. (S18). That is, the image and the open / closed state when the abnormality is detected in the process S16 are not used as learning data, and the learning accuracy is not lowered.
- This process is one of the features of the image analysis server 1 of this system.
- the image in the normal state and the open / closed state are accumulated as teacher data for learning the model, and relearning is performed regularly, for example. It goes and builds a new model and updates the model used for operation. Thereby, the analysis accuracy in the image analysis server 1 can be improved. For example, changes in the background image can be reflected as appropriate, and as a result, changes in the scene of the site can be dealt with in real time, so that more accurate image analysis can be performed.
- the image analysis server 1 When monitoring the parking lot gate, it is normally closed and only when the vehicle is passing, so all the images in the open state are saved, but the images in the closed state are saved even if the frequency of saving is low. good. For example, in the process S18, if the image to be saved is in the open state, it is saved in the learning data DB as it is, and if it is in the closed state, a certain time (for example, 30 minutes) has passed since the previous saving. A method such as saving in case is conceivable. Then, when the process S18 is completed, the image analysis server 1 returns to the process S11 and repeats the same process for the next image. In this way, the processing during the operation of the image analysis server 1 is performed.
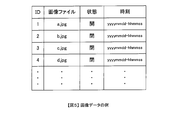
- FIG. 5 is an explanatory diagram showing an example of image data.
- the image data stores an image file, an open / closed state, and a shooting time (year / month / day-hour / minute / second) for each ID.
- the shooting times are the same, but they are different.
- the acquired image is stored in the image DB 2 regardless of whether it is normal or abnormal.
- An image whose open / closed state is "open" may be saved separately so as to be used as a background image.
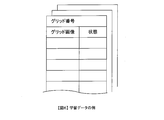
- FIG. 6 is an explanatory diagram showing an example of learning data.
- the training data is teacher data for re-learning the model, and is generated by using the image acquired during operation and the open / closed state.
- the learning data is stored in association with the grid image and the open / closed state at that time for each grid number.
- the open / closed state is information acquired from the gate opening / closing device 6.
- the image analysis device 1 stores the normal image for each grid extracted in the process S14 and the open / closed state as learning data in association with each other. Then, the image analysis server 1 performs training using the training data to construct a new model, and when a new model is generated, updates (replaces and switches) the old model with the new model and performs image analysis. Used for processing.
- learning data for re-learning can be accumulated during the operation of the image analysis server 1, and there is no need to prepare special teacher data, and re-learning can be easily performed and learning is frequently performed. It is possible to update the completed model and improve the analysis accuracy.
- FIG. 7 is a flowchart of the relearning process of the image analysis server 1.
- the image analysis server 1 performs re-learning processing on a regular basis, for example.
- the image analysis server 1 reads the learning data from the learning data storage unit 3 (S21), performs learning using the learning data as teacher data, and reconstructs (re-learns) the model (re-learning). S22). Then, the image analysis server 1 switches the trained model to the newly generated model (S23), and ends the process. As a result, after that, the operation is performed with the updated trained model.
- the re-learning process is performed in this way.
- the image analysis server 1 divides a part of the image in which the gate bar as a monitored object is expected to exist into a plurality of grids, and the image in which the gate bar exists for each grid. It is equipped with a model that is trained by associating "1" with “1" and "0" with an image that does not exist, and when an image is input to the model, the certainty that a gate bar exists for each grid is calculated. If the certainty is equal to or higher than the threshold value, it is determined that the gate bar exists in the grid, and if it is less than the threshold value, it is determined that the gate bar does not exist.
- the abnormality notification signal is output to the display terminal 4, so that the processing is not performed for the entire screen.
- the image analysis server 1 determines that the state of the gate bar is normal, an image in grid units is displayed based on the image from the camera 5 and the gate opening / closing information from the gate opening / closing device 6. It is extracted, the gate opening / closing information is associated with it, and it is stored in the learning data storage unit 3 as learning data.
- the learning data for example, it is periodically retrained to generate a new model, and the trained model is generated. Since it is updated, training data can be generated from the images acquired during operation, efficient re-learning can be performed, the model can be updated frequently, and the image analysis accuracy can be improved. be.
- the system can be realized with the same configuration. For example, it is also used for monitoring the arrival of trains, monitoring the open / closed state of platform doors, monitoring the movement of robot arms that perform fixed movements, and monitoring railroad crossing barriers. Also, if a camera is installed above the train door, it is possible to monitor whether or not foreign matter is caught in the door.
- the grid other than the grid on which the gate bar exists is always the background, it is efficient to learn all the background parts as "0". That is, instead of creating a learning model that judges "0" and "1" for each grid, multiple grids for several lines are input as one image, the background part is "0", and the gate bar part is "1".
- a trained model is generated by training the map as teacher data, and the output at the time of inference also outputs a map of certainty. This method is so-called grid segmentation.
- the abnormality detection in this method and the presence / absence of the gate bar are similar by comparing the certainty map for judgment prepared in advance and the map output by the trained model, that is, comparing the distribution of certainty. It may be judged depending on whether or not it is done.
- the determination of whether or not the images are similar can be determined by, for example, a method using SAD (Sum of Absolute Difference), which is an index for observing the correlation of images, a method using SSD (Sum of Squared Difference), or NCC (Normalized Cross-). It is carried out by using Correlation).
- SAD Sud of Absolute Difference
- SSD Small Squared Difference
- NCC Normalized Cross-
- anomaly detection and the presence / absence of the gate bar are determined by comparing the certainty in each grid of both maps for each grid, as in the above-described embodiment. May be good.
- the learning data for re-learning can be easily generated based on the control information indicating the gate opening / closing acquired from the outside, as in the above-described embodiment, and the gate exists in advance in the grid for several rows. It may be created as a map in which "1" is assigned to the grid known to be known and "0" is assigned to the background portion, and the map may be recorded in the learning data recording unit 3. Even if the grids for several rows are managed in a table as shown in FIG. 6, since the grid numbers correspond to the XY coordinates, the image map at the corresponding time can be reconstructed, and the grid segmentation. Can be used for.
- the control information indicating the gate opening / closing acquired from the gate opening / closing device 6 has been described as an example.
- the present invention is not limited to this, and may be acquired based on the sound output when the gate is opened and closed and the lighting state of a lighting device such as a traffic light.
- a microphone and a voice analysis device are provided near the camera 5 to acquire information indicating the presence or absence of the gate.
- the control signal of the lighting device and the analysis result of the lighting state based on the image taken by the camera are used as the information indicating the existence or non-existence of the gate.
- an image analysis server (another image analysis server) according to another embodiment of the present invention.
- the configuration of another image analysis server is the same as the configuration of the image analysis server 1 shown in FIG.
- Another image analysis server is also used in the image analysis system shown in FIG. 1, but the gate opening / closing information is not acquired from the gate opening / closing device 6, and the gate opening / closing is determined only from the image information. There is.
- another image analysis server calculates the certainty for each of the plurality of grids to be monitored, and then, based on the distribution of the certainty of the entire multiple grids, the presence / absence of the gate bar (open / closed state). To judge. For example, another image analysis server finds the average value of certainty across multiple grids, and if the average value is greater than or equal to the first threshold (eg 0.6), the gate bar is closed. If it is determined to be present and the average value is equal to or less than the second threshold value (for example, 0.4), it is determined that the gate bar is in the open state.
- the first threshold eg 0.6
- another image analysis server reads an image in which the gate is open and an image in which the gate is closed for each preset grid number, and sets "0" for the open image and "1" for the closed image.
- the method is not limited to the method of constructing a trained model by tagging with, and a method of expressing it as a decimal value using the ratio of the number of pixels of the gate bar in each grid may be used.
- another image analysis server does not determine the open / closed state of the gate and displays it as pending on the display terminal 4.
- the image may be transmitted, and the administrator may see the image displayed on the display terminal 4 to determine the presence or absence of the gate bar.
- the image file, the determined gate open / closed state (1 or 0), and the shooting time are stored in the image DB2 in association with each other.
- another image analysis server detects an abnormality when the certainty in each grid is low even though the gate is determined to be closed. For example, if it is determined that there is a gate bar from the average of the certainty of the entire cut out grid, but the certainty of the grid at the tip is very low (for example, less than 0.3), it is judged to be abnormal. , Outputs an abnormality notification signal. In this case, it is assumed that the gate bar is broken at the tip.
- another image analysis server like the present image analysis server, stores the image of each grid in the normal state acquired during operation and the determined gate open / closed state in association with each other in the learning data storage unit 3. It is used for retraining the model.
- another image analysis server can determine the gate opening / closing state from the certainty of the entire grid of the image, acquire the gate opening / closing information from the gate opening / closing device 6, and collate the two to detect an abnormality. It is possible. For example, if the information from the gate opening / closing device 6 is in the closed state but is in the open state in the determination based on the entire grid from the image, a malfunction of the opening / closing mechanism or the like is expected.
- the certainty of each of the grids to be monitored is calculated for each grid, and the presence or absence of the gate bar is determined based on the distribution of the certainty of the entire grids, and the determination result is obtained. Since the abnormality is detected from the consistency of the certainty in each grid, even if the information indicating the gate opening / closing state cannot be obtained from the gate opening / closing device, the abnormality can be detected only by another image analysis server. It has the effect of being able to build a system with a simple configuration.
- the present invention is suitable for an image analysis system, an image analysis method, and an image analysis program that can monitor the state of a specific object and quickly detect and notify an abnormality without increasing the processing amount.
- 1 ... image analysis server, 2 ... image database, 3 ... learning data storage unit, 4 ... display terminal, 5 ... camera, 6 ... gate opening / closing device, 7 ... network, 11 ... control unit, 12 ... storage unit, 13 ... interface
Landscapes
- Engineering & Computer Science (AREA)
- General Physics & Mathematics (AREA)
- Physics & Mathematics (AREA)
- Theoretical Computer Science (AREA)
- Multimedia (AREA)
- Computer Vision & Pattern Recognition (AREA)
- Quality & Reliability (AREA)
- Emergency Management (AREA)
- Signal Processing (AREA)
- Business, Economics & Management (AREA)
- Image Analysis (AREA)
- Closed-Circuit Television Systems (AREA)
- Alarm Systems (AREA)
Priority Applications (2)
| Application Number | Priority Date | Filing Date | Title |
|---|---|---|---|
| US17/909,458 US12175760B2 (en) | 2020-03-27 | 2021-03-11 | Image analysis system, image analysis method, and image analysis program |
| JP2022509908A JP7372446B2 (ja) | 2020-03-27 | 2021-03-11 | 画像解析システム、画像解析方法及び画像解析プログラム |
Applications Claiming Priority (2)
| Application Number | Priority Date | Filing Date | Title |
|---|---|---|---|
| JP2020057507 | 2020-03-27 | ||
| JP2020-057507 | 2020-03-27 |
Publications (1)
| Publication Number | Publication Date |
|---|---|
| WO2021193101A1 true WO2021193101A1 (ja) | 2021-09-30 |
Family
ID=77892003
Family Applications (1)
| Application Number | Title | Priority Date | Filing Date |
|---|---|---|---|
| PCT/JP2021/009791 Ceased WO2021193101A1 (ja) | 2020-03-27 | 2021-03-11 | 画像解析システム、画像解析方法及び画像解析プログラム |
Country Status (3)
| Country | Link |
|---|---|
| US (1) | US12175760B2 (https=) |
| JP (1) | JP7372446B2 (https=) |
| WO (1) | WO2021193101A1 (https=) |
Cited By (1)
| Publication number | Priority date | Publication date | Assignee | Title |
|---|---|---|---|---|
| CN119741443A (zh) * | 2024-12-09 | 2025-04-01 | 除卫士环保科技(北京)有限公司 | 一种基于计算机视觉的消杀地图生成系统 |
Families Citing this family (3)
| Publication number | Priority date | Publication date | Assignee | Title |
|---|---|---|---|---|
| US12586198B2 (en) * | 2022-02-18 | 2026-03-24 | Techcyte, Inc. | Image analysis for identifying objects and classifying background exclusions |
| EP4299411A1 (de) * | 2022-06-29 | 2024-01-03 | Siemens Mobility GmbH | Verfahren und vorrichtung zum erkennen von hindernissen in einem gefahrenraum |
| CN116882070B (zh) * | 2023-09-01 | 2023-11-14 | 中汽研汽车工业工程(天津)有限公司 | 一种面向整车制造的工业数字孪生管理系统 |
Citations (2)
| Publication number | Priority date | Publication date | Assignee | Title |
|---|---|---|---|---|
| JP2018072938A (ja) * | 2016-10-25 | 2018-05-10 | 株式会社パスコ | 目的物個数推定装置、目的物個数推定方法及びプログラム |
| JP2019139618A (ja) * | 2018-02-14 | 2019-08-22 | キヤノン株式会社 | 情報処理装置、被写体の判別方法及びコンピュータプログラム |
Family Cites Families (5)
| Publication number | Priority date | Publication date | Assignee | Title |
|---|---|---|---|---|
| US20070028219A1 (en) * | 2004-10-15 | 2007-02-01 | Miller William L | Method and system for anomaly detection |
| JP5416421B2 (ja) | 2009-01-22 | 2014-02-12 | 株式会社日立国際電気 | 監視映像検索装置、監視映像検索プログラム及び監視映像検索方法 |
| JP2011061651A (ja) | 2009-09-14 | 2011-03-24 | Hitachi Kokusai Electric Inc | 不審物検知システム |
| US8660368B2 (en) * | 2011-03-16 | 2014-02-25 | International Business Machines Corporation | Anomalous pattern discovery |
| JP2019136918A (ja) | 2018-02-08 | 2019-08-22 | キヤノンファインテックニスカ株式会社 | ラミネート装置 |
-
2021
- 2021-03-11 JP JP2022509908A patent/JP7372446B2/ja active Active
- 2021-03-11 WO PCT/JP2021/009791 patent/WO2021193101A1/ja not_active Ceased
- 2021-03-11 US US17/909,458 patent/US12175760B2/en active Active
Patent Citations (2)
| Publication number | Priority date | Publication date | Assignee | Title |
|---|---|---|---|---|
| JP2018072938A (ja) * | 2016-10-25 | 2018-05-10 | 株式会社パスコ | 目的物個数推定装置、目的物個数推定方法及びプログラム |
| JP2019139618A (ja) * | 2018-02-14 | 2019-08-22 | キヤノン株式会社 | 情報処理装置、被写体の判別方法及びコンピュータプログラム |
Cited By (1)
| Publication number | Priority date | Publication date | Assignee | Title |
|---|---|---|---|---|
| CN119741443A (zh) * | 2024-12-09 | 2025-04-01 | 除卫士环保科技(北京)有限公司 | 一种基于计算机视觉的消杀地图生成系统 |
Also Published As
| Publication number | Publication date |
|---|---|
| US20230125890A1 (en) | 2023-04-27 |
| JPWO2021193101A1 (https=) | 2021-09-30 |
| JP7372446B2 (ja) | 2023-10-31 |
| US12175760B2 (en) | 2024-12-24 |
Similar Documents
| Publication | Publication Date | Title |
|---|---|---|
| JP7372446B2 (ja) | 画像解析システム、画像解析方法及び画像解析プログラム | |
| CN109711320A (zh) | 一种值班人员违规行为检测方法及系统 | |
| WO2021114866A1 (zh) | 遮挡图像检测方法、装置、电子设备及存储介质 | |
| JP7125843B2 (ja) | 障害検知システム | |
| US12499668B2 (en) | Image analysis system an update method for machine learning model | |
| CN109271872A (zh) | 一种高压隔离开关分合状态判断与故障诊断装置及方法 | |
| CN119810037A (zh) | 一种沥青混凝土路面早期裂缝检测方法及系统 | |
| CN116385948A (zh) | 一种预警铁路边坡异常的系统和方法 | |
| US20250150573A1 (en) | Camera operation verification system and method | |
| CN118982794A (zh) | 一种基于视觉ai技术的idc机房异常检测方法及系统 | |
| CN112507902A (zh) | 交通标志异常检测方法、计算机设备及存储介质 | |
| CN114663479A (zh) | 一种基于计算机视觉的智能监控预警方法及系统 | |
| CN114782883B (zh) | 基于群体智能的异常行为检测方法、装置和设备 | |
| CN109001210B (zh) | 一种人防门密封胶条老化龟裂检测系统及方法 | |
| CN120746066B (zh) | 基于数字孪生的智慧机房多维动态监测管理方法及系统 | |
| JP6687962B1 (ja) | 撮影条件提案システム | |
| CN114694090B (zh) | 一种基于改进PBAS算法与YOLOv5的校园异常行为检测方法 | |
| CN117351271A (zh) | 高压配电线路监控设备故障监测方法、系统及其存储介质 | |
| CN117935164B (zh) | 智能站房安防监控方法及系统 | |
| CN119741701A (zh) | 粮仓内的环境监测方法及装置、设备及存储介质 | |
| CN119399249A (zh) | 一种基于机器视觉的摄像头自动识别追踪方法及系统 | |
| CN119579925A (zh) | 基于视频特征与相似计算的媒体屏内容比对方法及系统 | |
| CN116156149B (zh) | 一种用于检测摄像头移动的检测方法及装置 | |
| CN115082865B (zh) | 基于视觉图像识别的桥机入侵危险行为预警方法及系统 | |
| CN118101899B (zh) | 一种安防监控存储信息智能分析管理方法及系统 |
Legal Events
| Date | Code | Title | Description |
|---|---|---|---|
| 121 | Ep: the epo has been informed by wipo that ep was designated in this application |
Ref document number: 21776325 Country of ref document: EP Kind code of ref document: A1 |
|
| ENP | Entry into the national phase |
Ref document number: 2022509908 Country of ref document: JP Kind code of ref document: A |
|
| NENP | Non-entry into the national phase |
Ref country code: DE |
|
| 122 | Ep: pct application non-entry in european phase |
Ref document number: 21776325 Country of ref document: EP Kind code of ref document: A1 |