WO2021177353A1 - 画像処理方法、画像処理装置、プログラム及び記録媒体 - Google Patents
画像処理方法、画像処理装置、プログラム及び記録媒体 Download PDFInfo
- Publication number
- WO2021177353A1 WO2021177353A1 PCT/JP2021/008197 JP2021008197W WO2021177353A1 WO 2021177353 A1 WO2021177353 A1 WO 2021177353A1 JP 2021008197 W JP2021008197 W JP 2021008197W WO 2021177353 A1 WO2021177353 A1 WO 2021177353A1
- Authority
- WO
- WIPO (PCT)
- Prior art keywords
- statistic
- target substance
- image processing
- aging
- phase difference
- Prior art date
- Legal status (The legal status is an assumption and is not a legal conclusion. Google has not performed a legal analysis and makes no representation as to the accuracy of the status listed.)
- Ceased
Links
Images


Classifications
-
- G—PHYSICS
- G06—COMPUTING OR CALCULATING; COUNTING
- G06T—IMAGE DATA PROCESSING OR GENERATION, IN GENERAL
- G06T7/00—Image analysis
- G06T7/0002—Inspection of images, e.g. flaw detection
- G06T7/0012—Biomedical image inspection
-
- A—HUMAN NECESSITIES
- A61—MEDICAL OR VETERINARY SCIENCE; HYGIENE
- A61B—DIAGNOSIS; SURGERY; IDENTIFICATION
- A61B5/00—Measuring for diagnostic purposes; Identification of persons
- A61B5/0033—Features or image-related aspects of imaging apparatus, e.g. for MRI, optical tomography or impedance tomography apparatus; Arrangements of imaging apparatus in a room
- A61B5/004—Features or image-related aspects of imaging apparatus, e.g. for MRI, optical tomography or impedance tomography apparatus; Arrangements of imaging apparatus in a room adapted for image acquisition of a particular organ or body part
- A61B5/0042—Features or image-related aspects of imaging apparatus, e.g. for MRI, optical tomography or impedance tomography apparatus; Arrangements of imaging apparatus in a room adapted for image acquisition of a particular organ or body part for the brain
-
- A—HUMAN NECESSITIES
- A61—MEDICAL OR VETERINARY SCIENCE; HYGIENE
- A61B—DIAGNOSIS; SURGERY; IDENTIFICATION
- A61B5/00—Measuring for diagnostic purposes; Identification of persons
- A61B5/05—Detecting, measuring or recording for diagnosis by means of electric currents or magnetic fields; Measuring using microwaves or radio waves
- A61B5/055—Detecting, measuring or recording for diagnosis by means of electric currents or magnetic fields; Measuring using microwaves or radio waves involving electronic [EMR] or nuclear [NMR] magnetic resonance, e.g. magnetic resonance imaging
-
- A—HUMAN NECESSITIES
- A61—MEDICAL OR VETERINARY SCIENCE; HYGIENE
- A61B—DIAGNOSIS; SURGERY; IDENTIFICATION
- A61B5/00—Measuring for diagnostic purposes; Identification of persons
- A61B5/40—Detecting, measuring or recording for evaluating the nervous system
- A61B5/4076—Diagnosing or monitoring particular conditions of the nervous system
- A61B5/4088—Diagnosing of monitoring cognitive diseases, e.g. Alzheimer, prion diseases or dementia
-
- A—HUMAN NECESSITIES
- A61—MEDICAL OR VETERINARY SCIENCE; HYGIENE
- A61B—DIAGNOSIS; SURGERY; IDENTIFICATION
- A61B5/00—Measuring for diagnostic purposes; Identification of persons
- A61B5/48—Other medical applications
- A61B5/4842—Monitoring progression or stage of a disease
-
- G—PHYSICS
- G01—MEASURING; TESTING
- G01R—MEASURING ELECTRIC VARIABLES; MEASURING MAGNETIC VARIABLES
- G01R33/00—Arrangements or instruments for measuring magnetic variables
- G01R33/20—Arrangements or instruments for measuring magnetic variables involving magnetic resonance
- G01R33/44—Arrangements or instruments for measuring magnetic variables involving magnetic resonance using nuclear magnetic resonance [NMR]
- G01R33/48—NMR imaging systems
- G01R33/54—Signal processing systems, e.g. using pulse sequences ; Generation or control of pulse sequences; Operator console
- G01R33/56—Image enhancement or correction, e.g. subtraction or averaging techniques, e.g. improvement of signal-to-noise ratio and resolution
- G01R33/5608—Data processing and visualization specially adapted for MR, e.g. for feature analysis and pattern recognition on the basis of measured MR data, segmentation of measured MR data, edge contour detection on the basis of measured MR data, for enhancing measured MR data in terms of signal-to-noise ratio by means of noise filtering or apodization, for enhancing measured MR data in terms of resolution by means for deblurring, windowing, zero filling, or generation of gray-scaled images, colour-coded images or images displaying vectors instead of pixels
-
- G—PHYSICS
- G06—COMPUTING OR CALCULATING; COUNTING
- G06T—IMAGE DATA PROCESSING OR GENERATION, IN GENERAL
- G06T2207/00—Indexing scheme for image analysis or image enhancement
- G06T2207/10—Image acquisition modality
- G06T2207/10072—Tomographic images
- G06T2207/10088—Magnetic resonance imaging [MRI]
-
- G—PHYSICS
- G06—COMPUTING OR CALCULATING; COUNTING
- G06T—IMAGE DATA PROCESSING OR GENERATION, IN GENERAL
- G06T2207/00—Indexing scheme for image analysis or image enhancement
- G06T2207/30—Subject of image; Context of image processing
- G06T2207/30004—Biomedical image processing
- G06T2207/30016—Brain
-
- G—PHYSICS
- G06—COMPUTING OR CALCULATING; COUNTING
- G06T—IMAGE DATA PROCESSING OR GENERATION, IN GENERAL
- G06T2207/00—Indexing scheme for image analysis or image enhancement
- G06T2207/30—Subject of image; Context of image processing
- G06T2207/30004—Biomedical image processing
- G06T2207/30096—Tumor; Lesion
-
- G—PHYSICS
- G06—COMPUTING OR CALCULATING; COUNTING
- G06T—IMAGE DATA PROCESSING OR GENERATION, IN GENERAL
- G06T2207/00—Indexing scheme for image analysis or image enhancement
- G06T2207/30—Subject of image; Context of image processing
- G06T2207/30168—Image quality inspection
Definitions
- the present invention relates to an image processing method, an image processing device, a program, and a recording medium, and more particularly to an image processing method for processing magnetic resonance image data obtained by photographing a plurality of parts of a living body.
- Patent Documents 1 and 2 the inventor is studying magnetic resonance image data obtained by magnetic resonance imaging (MRI).
- MRI magnetic resonance imaging
- Patent Document 2 describes that the magnetic susceptibility of a tissue is specified by fitting a phase difference distribution of a nuclear magnetic resonance signal obtained from a predetermined region of a living body with a plurality of function groups.
- Patent Document 2 is for performing non-linear approximation. Therefore, it may be difficult to specify the magnetic susceptibility, for example, due to poor convergence of the nonlinear approximation. Further, the technique described in Patent Document 1 relates to emphasis processing, and does not describe reduction of calculation load in analysis of image data.
- an object of the present invention is to propose an image processing method or the like suitable for analyzing magnetic resonance image data by simple arithmetic processing.
- the first aspect of the present invention is an image processing method in which processing is performed on magnetic resonance image data obtained by photographing a plurality of parts of a living body, and a signal acquisition unit is positioned from the magnetic resonance image data.
- a signal acquisition step for acquiring a phase difference image signal and a statistic calculation step for the statistic calculation unit to perform statistical processing for each part of the distribution of the phase difference image signal with respect to the phase difference to calculate a statistic. include.
- the second aspect of the present invention is the image processing method of the first aspect, and the statistical processing includes calculating at least a part of the average value, standard deviation, kurtosis and skewness.
- the third aspect of the present invention is the image processing method of the first or second aspect, in which the target substance evaluation unit uses the statistics of the respective parts to cover the target substance contained in the plurality of parts. Includes a target substance evaluation step that evaluates the amount and produces an evaluation result.
- the fourth aspect of the present invention is the image processing method of the third aspect, and in the statistic calculation step, the statistic calculation unit evaluates the statistic from a part or all of the statistic of each part. The value is calculated, and in the target substance evaluation step, the target substance evaluation unit evaluates the amount of the target substance using the statistic evaluation value in addition to or instead of the statistic of each part.
- Pre-magnetic resonance image data can be obtained by either single echo or multi-echo.
- the fifth aspect of the present invention is the image processing method of the third or fourth aspect, and when the magnetic resonance image data is obtained by multi-echo, the statistic calculation is performed in the statistic calculation step.
- the unit calculates the statistic using statistical processing performed on a plurality of echo times, and in the target substance evaluation step, the target substance evaluation unit uses the change in echo time to calculate the target substance.
- the amount is evaluated, and in the statistic calculation step, the statistic calculation unit calculates the approximate model between the echo time and the statistic from the echo time for the site where the accumulation of the target substance is equal to or more than the detection limit.
- the statistic is calculated using an approximate model with data whose determination coefficient representing the degree to which the quantification can be reproduced is larger than the Cut-off value, and / or a linear function for the value obtained by the plurality of statistical processes.
- the statistic is calculated by performing approximation processing using a higher-order model.
- the sixth aspect of the present invention is the image processing method of any one of the third to fifth aspects, in which the target substance increases or decreases with aging of the living body at each site and is different from aging. It increases or decreases depending on factors, and the statistic changes by at least increasing or decreasing the target substance due to a factor different from aging, and in the target substance evaluation step, the target substance evaluation unit is a factor different from aging. The amount of the target substance increased or decreased by is evaluated.
- the seventh aspect of the present invention is the image processing method of the sixth aspect, wherein the target substance is iron bound to a protein, and a plurality of parts of the living body include a plurality of parts in the brain. Iron bound to a protein increases at each of the sites with aging of the living body and increases due to factors different from aging.
- the eighth aspect of the present invention is the image processing method of the sixth or seventh aspect, and the order in which the target substance increases or decreases in each part due to a factor different from aging is determined, and the subject.
- the target substance evaluation unit evaluates the amount of the target substance that has increased or decreased due to a factor different from aging, using the above order.
- a ninth aspect of the present invention is an image processing device that processes magnetic resonance image data obtained by photographing a plurality of parts of a living body, and acquires a phase difference image signal from the magnetic resonance image data.
- a signal acquisition unit is provided, and a statistic calculation unit is provided for calculating statistics by performing statistical processing for each part of the distribution of the phase difference image signal with respect to the phase difference.
- the tenth aspect of the present invention is the image processing apparatus of the ninth aspect, and the statistical processing includes calculating at least a part of the average value, standard deviation, kurtosis and skewness.
- the eleventh aspect of the present invention is the image processing apparatus of the ninth or tenth aspect, and the amount of the target substance contained in the plurality of parts is evaluated and evaluated by using the statistic of each part. It is equipped with a target substance evaluation unit that produces results.
- the twelfth aspect of the present invention is the image processing apparatus of the eleventh aspect, and the statistic calculation unit calculates a statistic evaluation value from a part or all of the statistic of each part, and the object.
- the substance evaluation unit evaluates the amount of the target substance by using the statistic evaluation value in addition to or instead of the statistic of each part.
- the magnetic resonance image data can be obtained by either single echo or multi-echo.
- the thirteenth aspect of the present invention is the image processing apparatus of the eleventh or twelfth aspect, and when the magnetic resonance image data is obtained by multi-echo, the statistic calculation unit has a plurality of echo times.
- the statistic is calculated by using the statistical processing performed on the target substance, the target substance evaluation unit evaluates the amount of the target substance using the change in echo time, and the statistic calculation unit evaluates the target.
- Approximate model with data whose determination coefficient is larger than the Cut-off value which indicates the degree to which the approximate model between the echo time and the statistic can reproduce the statistic from the echo time for the part where the accumulation of the substance is above the detection limit.
- the values obtained by the plurality of statistical processes are approximated by a model higher than the linear function to calculate the statistic.
- the fourteenth aspect of the present invention is the image processing apparatus according to any one of the eleventh to thirteenth aspects, wherein the target substance increases or decreases with aging of the living body at each site and is different from aging.
- the amount increases or decreases depending on factors, and the statistic changes at least when the target substance increases or decreases due to a factor different from aging, and the target substance evaluation unit increases or decreases the target substance due to a factor different from aging. evaluate.
- the fifteenth aspect of the present invention is the image processing apparatus of the fourteenth aspect, wherein the target substance is iron bound to a protein, and a plurality of parts of the living body include a plurality of parts in the brain. Iron bound to a protein increases at each of the sites with the aging of the living body and increases due to factors different from aging.
- the sixteenth aspect of the present invention is the image processing apparatus according to the fourteenth or fifteenth aspect, wherein the target substance is increased or decreased in the order of increasing or decreasing in each part due to a factor different from aging.
- the substance evaluation unit evaluates the increase or decrease of the target substance due to a factor different from aging by using the above order.
- the seventeenth aspect of the present invention is a program for causing a computer to function as an image processing device according to any one of the ninth to sixteenth aspects.
- the eighteenth aspect of the present invention is a computer-readable recording medium for recording the program of the seventeenth aspect.
- the image processing unit extracts the phase difference using the magnetic resonance image data to generate the phase difference image data, and the signal acquisition unit acquires the phase difference image signal from the phase difference image data.
- the image processing device may include an image processing unit.
- the magnetic resonance image data is analyzed by a simple calculation called statistical processing. Therefore, the analysis can be easily realized without performing a complicated calculation such as a nonlinear approximation.
- FIG. 1A It is a block diagram which shows an example of (a) configuration of the image processing system 1 which concerns on embodiment of this invention, and is a flow diagram which shows an example of (b) processing. It is a figure for demonstrating the MRI imaging apparatus 3 of FIG. 1A. An example of the region of interest 41 set in the phase difference image data is shown. An example of the histogram generated by the statistic calculation unit 15 of FIG. 1 (a) by the single echo method is shown. An example of the histogram generated by the statistic calculation unit 15 of FIG. 1 (a) by the multi-echo method is shown. (A) is a diagram showing the rate of change of the statistic with respect to the echo time obtained in FIG.
- (b) is a diagram showing that this rate of change shows a high correlation with the evaluation index.
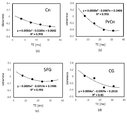
- (A) and (b) are diagrams showing the rate of change of the statistic of each part, and (c) is a figure showing the sum thereof. It is a figure which shows (a) the case of a linear model, and (b) the case of a quadratic function model, about the model assumed for each part. It is a figure for demonstrating the improvement of accuracy by using Cut-off in Cn and CG. It is a figure which shows the result of Fit in Cn, PrCn, SFG and CG when the model of a quadratic function is used.
- FIG. 1 is a block diagram showing an example of (a) configuration of the image processing system 1 according to the embodiment of the present invention, and a flow diagram showing an example of (b) processing.
- the image processing system 1 includes an MRI imaging device 3 and an image processing device 5.
- the MRI imaging device 3 includes an imaging unit 7.
- the image processing device 5 includes a captured image storage unit 9, an image processing unit 11, a signal acquisition unit 13 (an example of the “signal acquisition unit” of the present application claim), and a statistic calculation unit 15 (“statistics” of the present application claim).
- An example of a “quantity calculation unit") and a target substance evaluation unit 17 (an example of the “target substance evaluation unit” of the claim of the present application) are provided.
- the invention of the present application may be realized by incorporating a part or all of each part included in the image processing device 5 in the MRI imaging device 3.
- the imaging unit 7 photographs the human body and acquires captured image data (step ST1).
- the photographing unit 7 may take an image by an imaging method (for example, a gradient echo method) usually provided in the MRI imaging device 3.
- the captured image data may be captured by either a single echo method (a method of collecting by a single echo) or a multi-echo (a method of collecting by a plurality of echoes).
- the image processing device 5 can communicate with the MRI imaging device 3.
- the MRI imaging device 3 transmits captured image data (an example of “magnetic resonance image data” according to the claim of the present application) captured by the photographing unit 7 to the image processing device 5.
- the captured image storage unit 9 of the image processing device 5 stores the received captured image data.
- the image processing unit 11 generates phase difference image data using the photographed image data stored in the photographed image storage unit 9, for example, by using the technique described in Patent Document 2.
- the signal acquisition unit 13 sets an area of interest (ROI) in the phase difference image data and acquires the phase difference image signal in the area of interest (step ST2).
- the area of interest may be set, for example, by the signal acquisition unit 13 analyzing the phase difference image data and automatically setting it, or by displaying it on the image processing device 5 and setting it according to the user's instruction.
- the statistic calculation unit 15 creates a histogram of the acquired phase difference image signal with the horizontal axis as the phase difference and the vertical axis as the frequency. Then, statistical processing is performed for each part included in the region of interest to calculate the statistic (step ST3). Statistical processing is, for example, calculating the mean value, standard deviation, kurtosis, skewness, and the like. A statistic is a value calculated by statistical processing.
- the target substance evaluation unit 17 evaluates the amount of the target substance using the statistic calculated by the statistic calculation unit 15 and generates an evaluation result (step ST4).
- the target substance is, for example, iron bound to a protein.
- the main pathological cause of Alzheimer's disease (hereinafter referred to as “AD") is the accumulation of amyloid ⁇ in the brain.
- Amyloid ⁇ mainly accumulates inside the cerebral (neocortex) cortex to form amyloid amyloid plaque (hereinafter referred to as “AP”), and AP produces neurotoxicity to damage the cranial nerves inside the cortex.
- AP amyloid amyloid plaque
- the iron accumulated in the AP is reflected in the phase difference image signal acquired from the magnetic resonance image data obtained by photographing the AP.
- the target substance evaluation unit 17 predicts the accumulation (amount) of iron in the AP from the distribution of the phase difference image signal extracted from the magnetic resonance imaging data obtained by photographing the cortex using the statistic, and clinically. It is possible to provide information that correlates with an index (for example, AD or MMSE, which is a typical cognitive function index of dementia).
- the target substance evaluation unit 17 may, for example, calculate a clinical index as an evaluation result, or may provide reference information used when a doctor or the like determines a clinical index. good.
- the statistic calculation unit 15 calculates the statistic for each echo in step ST3, and determines the rate of change of the statistic with respect to the change in the echo time.
- the target substance evaluation unit 17 may evaluate the amount of the target substance using the rate of change of the statistic with respect to the change in echo time.
- the target substance evaluation unit 17 may evaluate the amount of the target substance by using a statistic, a statistic evaluation value, or the like.
- the statistic calculation unit 15 calculates the statistic for each part and calculates the statistic evaluation value
- the target substance evaluation unit 17 adds to the statistic of each part.
- the amount of the target substance may be evaluated using the statistic evaluation value.
- the rate of change of the statistic with respect to the change of the echo time, the rate of change of the statistic evaluation value, and a part or all of the rate of change of the statistic of each part are used for calculation.
- the amount of the target substance may be evaluated by using the statistic change rate evaluation value, or the like.
- Iron that binds to proteins in the brain includes those that increase with age and those that accumulate in APs.
- a histogram with a phase difference on the horizontal axis and a frequency on the vertical axis usually follows a predetermined distribution (eg, a single Gaussian distribution) without iron in the AP. Then, for example, the central axis is different between the distribution of iron accumulated in AP and the predetermined distribution of iron that increases with aging. Therefore, the histogram of the iron that increases with aging and the iron accumulated in the AP is different from the predetermined distribution of iron that increases with aging (see FIG. 4).
- the value of the statistic calculated by statistical processing changes depending on whether the iron in the AP is high or low. It is known that there is a correlation (linear correlation, etc.) between the amount of AP accumulated and clinical indicators (for example, Cummings, 3 other authors, ⁇ -AMYLOID DEPOSITION AND OTHER MEASURES OF NEUROPATHOLOGY PREDICT COGNITIVE STATUS IN ALZHEIMER'S. See DISEASE, Neurobiology of Aging, Vol. 17, No. 6, pp. 921-933, 1996, etc.). Therefore, the statistic is correlated with the amount of iron in the AP and is correlated with the clinical index.
- FIG. 2 is a diagram for explaining the MRI imaging device 3 of FIG. 1 (a).
- FIG. 2A is a diagram for explaining a shooting situation.
- 2 (b) to 2 (g) are diagrams showing an example of magnetic resonance image data.
- the MRI imaging apparatus 3 can image the internal information of the subject by utilizing the magnetism in the cylinder and utilizing the NMR (Nuclear Magnetic Resonance) phenomenon.
- the image data obtained by imaging with the MRI imaging apparatus 3 is a complex image having the magnitude and angle of the rotating magnetization vector.
- the intensity image (magnitude image) data and the phase image (phase image) data can be used as the captured image data (see Patent Document 2).
- the intensity image is an image of the intensity component of the magnetic resonance signal.
- the phase image is an image of the angle of rotation of the magnetization vector (see FIGS. 2 (b) to 2 (g)).
- the captured image storage unit 9 stores intensity image data and phase image data.
- the image processing unit 11 generates phase difference image data from intensity image data and phase image data (see FIG. 3).
- This retardation image data can be generated by, for example, the technique described in Patent Document 2 (see, for example, the description of creating a retardation image).
- phase difference image data The generation of phase difference image data will be explained just in case. If a long TE (echo time) is used when acquiring an MRI signal, phase wrapping occurs in the phase image, and if the phase exceeds 2 ⁇ , the phase obtained by subtracting 2 ⁇ n (n is an integer) from the actual phase. Take a value. Therefore, the phase image becomes a striped image and does not show the original phase value.
- the image processing unit 11 removes this phase wrapping and performs a process of extracting the phase difference by the technique described in Patent Document 2 or the like to generate the phase difference image data.
- the signal acquisition unit 13 sets an area of interest (ROI) in the phase difference image data.
- ROI area of interest
- FIG. 3 shows an example of the region of interest 41 set in the phase difference image data.
- the signal acquisition unit 13 displays the phase difference image data on a display unit such as a display of the image processing device 5, and the user of the image processing device 5 designates the region of interest by using an input unit such as a mouse. It may be set according to the thing. Further, the region of interest may be automatically determined and set by using, for example, learning processing.
- the region of interest may be a two-dimensional region or a three-dimensional region.
- the signal acquisition unit 13 acquires all the phase difference data of the MRI signal acquired from the tissue included in the region of interest (an example of the "phase difference image signal" in the claims of the present application).
- the statistic calculation unit 15 divides all the phase difference data of the MRI signal for each part and generates a phase difference distribution. For example, a histogram is created in which the horizontal axis is the phase difference and the vertical axis is the number of data. Then, the statistic is calculated for each part.
- the statistic is, for example, the average value of the phase difference distribution for each part, the standard deviation, the kurtosis, the skewness, and the like.
- FIG. 4 shows an example of the histogram generated by the statistic calculation unit 15.
- the horizontal axis is the phase difference (rad), and the vertical axis is the frequency (number of data).
- Line 43 shows the distribution of iron due to aging of the living body (aged iron phase distribution).
- Line 45 shows the distribution of amyloid iron (amyloid iron distribution). Without amyloid iron, there would be a single Gaussian distribution, as in line 43. Due to the presence of the amyloid iron distribution, there is a difference from the Gaussian distribution, as shown on line 47.
- the statistic calculated by line 47 reflects the change from line 43. For example, skewness is an indicator of distribution asymmetry.
- the amyloid iron distribution is on the left side of FIG.
- the amyloid iron distribution can be evaluated by calculating the skewness with respect to the line 47.
- the amyloid iron distribution changes the sharpness of the distribution. Therefore, the amyloid iron distribution (line 45) can be evaluated by calculating the kurtosis of the line 47.
- the inventor confirmed that the amyloid iron distribution (line 45) can also be evaluated by the mean value and standard deviation of the line 47.
- FIG. 5 shows an example of the distribution of the phase difference image signal obtained by the multi-echo method.
- the echo time increases in the order of (a), (b), (c), and (d).
- the distribution of amyloid iron shifts significantly to the negative. Therefore, the distribution of amyloid iron affects the calculated statistic for each echo.
- FIG. 6A shows the rate of change (slope) of each echo with respect to TE (echo time) for the skewness calculated for each graph of FIG. From FIG. 6A, the amyloid iron distribution can be evaluated using the rate of change as a quantitative value.
- the horizontal axis is the MMSE score
- the vertical axis is the plot of the rate of change obtained in the same manner as in FIG. 6 (a) for 39 patient data.
- the value in FIG. 6 (a) is highly correlated with the MMSE score. Therefore, it is expected that the rate of change obtained in the same manner as in FIG. 6A can be used as a reference when a doctor or the like determines the MMSE score, and further, there is a possibility that the MMSE score is automatically determined. It is accepted.
- the rate of change obtained in the same manner as in FIG. 6A is an example of the “evaluation result” of the present invention.
- FIG. 7 shows an example of evaluation based on the statistic evaluation value.
- 7 (a) and 7 (b) show the rate of change of the statistic (skewness) of each part.
- FIG. 7 (a) is the precuneus PrCn
- FIG. 7 (b) is the superior frontal gyrus SFG.
- FIG. 7C is a plot of the sum of the skewnesses of these two parts (an example of the “statistical evaluation value” in the claims of the present application) taken for each individual. From FIG. 7 (c), it was found that there was a better correlation with the MMSE. When AD develops, it is considered that the result appears in the direction in which the difference between the sites disappears. Therefore, the statistic evaluation value may be a calculation of, for example, a difference between parts, in addition to the sum.
- the target substance evaluation unit 17 utilizes the fact that the statistic for each part calculated by the statistic calculation unit 15 and the statistic evaluation value reflect the distribution of amyloid iron for each part, and the amyloid iron for each part is used. Evaluate the quantity.
- the amount of the target substance can be evaluated by the statistic of the retardation image signal, using it as the target substance.
- the invention of the present application can also be introduced as a non-invasive inspection method.
- Skewness which is a basic statistic, is expressed as a cubic moment using the average ⁇ ( ⁇ ⁇ 0) of X, as shown in Equation (1), where X is the random variable.
- E (x) represents the expected value of x
- ⁇ represents the standard deviation of the random variable. Expanding the expected value in the numerator of equation (1) yields equation (2). Since X represents the phase value in Echo Time (TE), it is expressed by Eq. (3) with ⁇ as the gyromagnetic ratio and B as the local magnetic field.
- skewness is a third-order polynomial of TE.
- skewness can be approximated to the linear expression of TE as in Eq. (4) by using Eq. (3) under the lowest order approximation of TE. .. Therefore, under this approximation, skewness can be considered to have a linear relationship with TE.
- a linear model of Eq. (4) can be assumed for the short TE.
- skewness is skewness
- k is PCS (Proportional coefficient of Skewness, a parameter related to the average magnetic susceptibility of amyloid iron)
- k 0 is a constant.
- the constant of proportionality k can be expected to include the effect of magnetic susceptibility in comparison with equation (3).
- R 2 is a numerical value that can be taken from 0 to 1, 0 is a case where it cannot be reproduced at all, and the larger the numerical value is, the more it can be reproduced, and 1 is a case where it can be completely reproduced.
- R 2 for example, the ROI set in the subject's brain is applied to phase images created with different TEs, Skewness is acquired for each TE, and each data point is set to TE on the horizontal axis and TE on the vertical axis. It can be obtained as Skewness.
- a Cut-off is provided for the coefficient of determination R 2, and only those having a fit accuracy of a certain level or higher are selected.
- the average value of R 2 obtained in each brain region was set as Cut-off, and the data showing R 2 higher than Cut-off was adopted as reliable data. Skewness can be obtained with high accuracy by using an approximate model with reliable data.
Landscapes
- Health & Medical Sciences (AREA)
- Life Sciences & Earth Sciences (AREA)
- Physics & Mathematics (AREA)
- Engineering & Computer Science (AREA)
- Nuclear Medicine, Radiotherapy & Molecular Imaging (AREA)
- General Health & Medical Sciences (AREA)
- Radiology & Medical Imaging (AREA)
- Medical Informatics (AREA)
- Public Health (AREA)
- Biomedical Technology (AREA)
- Heart & Thoracic Surgery (AREA)
- Pathology (AREA)
- Molecular Biology (AREA)
- Surgery (AREA)
- Animal Behavior & Ethology (AREA)
- Biophysics (AREA)
- Veterinary Medicine (AREA)
- Neurology (AREA)
- High Energy & Nuclear Physics (AREA)
- Computer Vision & Pattern Recognition (AREA)
- General Physics & Mathematics (AREA)
- Condensed Matter Physics & Semiconductors (AREA)
- Signal Processing (AREA)
- Child & Adolescent Psychology (AREA)
- Developmental Disabilities (AREA)
- Hospice & Palliative Care (AREA)
- Artificial Intelligence (AREA)
- Psychiatry (AREA)
- Psychology (AREA)
- Neurosurgery (AREA)
- Physiology (AREA)
- Quality & Reliability (AREA)
- Theoretical Computer Science (AREA)
- Magnetic Resonance Imaging Apparatus (AREA)
Priority Applications (2)
| Application Number | Priority Date | Filing Date | Title |
|---|---|---|---|
| JP2022504425A JP7504340B2 (ja) | 2020-03-04 | 2021-03-03 | 画像処理方法、画像処理装置、プログラム及び記録媒体 |
| US17/905,501 US12373944B2 (en) | 2020-03-04 | 2021-03-03 | Image processing method, image processing device, program, and recording medium for processing MRI data to determine an amount of target material |
Applications Claiming Priority (2)
| Application Number | Priority Date | Filing Date | Title |
|---|---|---|---|
| JP2020037332 | 2020-03-04 | ||
| JP2020-037332 | 2020-03-04 |
Publications (1)
| Publication Number | Publication Date |
|---|---|
| WO2021177353A1 true WO2021177353A1 (ja) | 2021-09-10 |
Family
ID=77614345
Family Applications (1)
| Application Number | Title | Priority Date | Filing Date |
|---|---|---|---|
| PCT/JP2021/008197 Ceased WO2021177353A1 (ja) | 2020-03-04 | 2021-03-03 | 画像処理方法、画像処理装置、プログラム及び記録媒体 |
Country Status (3)
| Country | Link |
|---|---|
| US (1) | US12373944B2 (https=) |
| JP (1) | JP7504340B2 (https=) |
| WO (1) | WO2021177353A1 (https=) |
Families Citing this family (1)
| Publication number | Priority date | Publication date | Assignee | Title |
|---|---|---|---|---|
| WO2022181726A1 (ja) | 2021-02-25 | 2022-09-01 | 国立大学法人東北大学 | 画像処理方法、プログラム、および画像処理装置 |
Citations (3)
| Publication number | Priority date | Publication date | Assignee | Title |
|---|---|---|---|---|
| WO2013047583A1 (ja) * | 2011-09-28 | 2013-04-04 | 国立大学法人熊本大学 | 画像解析装置、画像解析方法及び画像解析プログラム |
| JP2017184935A (ja) * | 2016-04-04 | 2017-10-12 | 株式会社日立製作所 | 磁気共鳴イメージング装置、及び、画像処理方法 |
| US20180203087A1 (en) * | 2017-01-18 | 2018-07-19 | Shanghai United Imaging Healthcare Co., Ltd. | Methods and apparatuses for phase unwrapping |
Family Cites Families (8)
| Publication number | Priority date | Publication date | Assignee | Title |
|---|---|---|---|---|
| JP3534669B2 (ja) * | 2000-01-27 | 2004-06-07 | ジーイー・メディカル・システムズ・グローバル・テクノロジー・カンパニー・エルエルシー | 磁気共鳴撮像装置 |
| JP3976515B2 (ja) * | 2001-04-11 | 2007-09-19 | 株式会社日立メディコ | 磁気共鳴イメージング装置及び画像処理方法 |
| DE10330926B4 (de) * | 2003-07-08 | 2008-11-27 | Siemens Ag | Verfahren zur absoluten Korrektur von B0-Feld-Abweichungen in der Magnetresonanz-Tomographie-Bildgebung |
| US10098563B2 (en) * | 2006-11-22 | 2018-10-16 | Toshiba Medical Systems Corporation | Magnetic resonance imaging apparatus |
| US8829902B2 (en) | 2008-12-26 | 2014-09-09 | National University Corporation Kumamoto University | Phase difference enhanced imaging method (PADRE), functional image creating method, phase difference enhanced imaging program, phase difference enhanced imaging apparatus, functional image creating apparatus, and magnetic resonance imaging (MRI) apparatus |
| DE102011004881B4 (de) * | 2011-03-01 | 2012-10-31 | Siemens Aktiengesellschaft | Verarbeiten von komplexen Bilddaten eines Untersuchungsobjekts mit unterschiedlichen Spin-Spezies in der MR-Bildgebung |
| US10145925B2 (en) * | 2014-05-08 | 2018-12-04 | The Arizona Board Of Regents On Behalf Of The University Of Arizona | MRI with reconstruction of MR phase image |
| CN117805706B (zh) * | 2024-02-28 | 2024-05-28 | 中国科学院国家授时中心 | 采用组合分离振荡场的原子束磁共振方法及系统 |
-
2021
- 2021-03-03 WO PCT/JP2021/008197 patent/WO2021177353A1/ja not_active Ceased
- 2021-03-03 US US17/905,501 patent/US12373944B2/en active Active
- 2021-03-03 JP JP2022504425A patent/JP7504340B2/ja active Active
Patent Citations (3)
| Publication number | Priority date | Publication date | Assignee | Title |
|---|---|---|---|---|
| WO2013047583A1 (ja) * | 2011-09-28 | 2013-04-04 | 国立大学法人熊本大学 | 画像解析装置、画像解析方法及び画像解析プログラム |
| JP2017184935A (ja) * | 2016-04-04 | 2017-10-12 | 株式会社日立製作所 | 磁気共鳴イメージング装置、及び、画像処理方法 |
| US20180203087A1 (en) * | 2017-01-18 | 2018-07-19 | Shanghai United Imaging Healthcare Co., Ltd. | Methods and apparatuses for phase unwrapping |
Also Published As
| Publication number | Publication date |
|---|---|
| US20230123738A1 (en) | 2023-04-20 |
| JPWO2021177353A1 (https=) | 2021-09-10 |
| US12373944B2 (en) | 2025-07-29 |
| JP7504340B2 (ja) | 2024-06-24 |
Similar Documents
| Publication | Publication Date | Title |
|---|---|---|
| Barbieri et al. | Impact of the calculation algorithm on biexponential fitting of diffusion‐weighted MRI in upper abdominal organs | |
| Keihaninejad et al. | An unbiased longitudinal analysis framework for tracking white matter changes using diffusion tensor imaging with application to Alzheimer's disease | |
| US7995825B2 (en) | Histogram segmentation of FLAIR images | |
| US9361686B2 (en) | Method and apparatus for the assessment of medical images | |
| Parker et al. | Not all voxels are created equal: Reducing estimation bias in regional NODDI metrics using tissue-weighted means | |
| Steens et al. | Reproducibility of brain ADC histograms | |
| CN111212600B (zh) | 帕金森病诊断装置 | |
| CN1794005B (zh) | 校正图像中非均匀性的方法及采用该方法的成像设备 | |
| CN105825496A (zh) | 磁共振图像数据组的图像质量改进方法、计算设备和程序 | |
| US8160330B2 (en) | Texture quantification of medical images based on a complex-valued local spatial frequency distribution of a stockwell transform | |
| Reig et al. | Assessment of the increase in variability when combining volumetric data from different scanners | |
| JP2017080349A (ja) | 磁気共鳴イメージング及び医用画像処理装置 | |
| Peltonen et al. | MRI quality assurance based on 3D FLAIR brain images | |
| JP6629247B2 (ja) | 微細構造解析データのデータ品質を評価し向上させる方法 | |
| Kor et al. | An automated pipeline for extracting histological stain area fraction for voxelwise quantitative MRI-histology comparisons | |
| WO2021177353A1 (ja) | 画像処理方法、画像処理装置、プログラム及び記録媒体 | |
| van Tuijl et al. | Reliability of velocity pulsatility in small vessels on 3tesla mri in the basal ganglia: A test–retest study | |
| Taymourtash et al. | Quantifying residual motion artifacts in fetal fMRI data | |
| Pezold et al. | A semi-automatic method for the quantification of spinal cord atrophy | |
| CN119317396A (zh) | 改进医学图像的图像质量 | |
| Ye et al. | Probabilistic tractography using Lasso bootstrap | |
| Priya et al. | Brain tissue volume estimation to detect Alzheimer’s disease in magnetic resonance images | |
| Dore et al. | CapAIBL: automated reporting of cortical PET quantification without need of MRI on brain surface using a patch-based method | |
| Hahn et al. | How accurate is brain volumetry? A methodological evaluation | |
| JP2008272014A (ja) | 定量測定装置、定量評価装置及び画像処理プログラム |
Legal Events
| Date | Code | Title | Description |
|---|---|---|---|
| 121 | Ep: the epo has been informed by wipo that ep was designated in this application |
Ref document number: 21764322 Country of ref document: EP Kind code of ref document: A1 |
|
| ENP | Entry into the national phase |
Ref document number: 2022504425 Country of ref document: JP Kind code of ref document: A |
|
| NENP | Non-entry into the national phase |
Ref country code: DE |
|
| 122 | Ep: pct application non-entry in european phase |
Ref document number: 21764322 Country of ref document: EP Kind code of ref document: A1 |
|
| WWG | Wipo information: grant in national office |
Ref document number: 17905501 Country of ref document: US |