WO2021060379A1 - γ線計測方法およびγ線計測装置 - Google Patents
γ線計測方法およびγ線計測装置 Download PDFInfo
- Publication number
- WO2021060379A1 WO2021060379A1 PCT/JP2020/036042 JP2020036042W WO2021060379A1 WO 2021060379 A1 WO2021060379 A1 WO 2021060379A1 JP 2020036042 W JP2020036042 W JP 2020036042W WO 2021060379 A1 WO2021060379 A1 WO 2021060379A1
- Authority
- WO
- WIPO (PCT)
- Prior art keywords
- energy spectrum
- ray
- dose
- measurement
- rays
- Prior art date
Links
Images


Classifications
-
- G—PHYSICS
- G01—MEASURING; TESTING
- G01T—MEASUREMENT OF NUCLEAR OR X-RADIATION
- G01T1/00—Measuring X-radiation, gamma radiation, corpuscular radiation, or cosmic radiation
-
- G—PHYSICS
- G01—MEASURING; TESTING
- G01T—MEASUREMENT OF NUCLEAR OR X-RADIATION
- G01T1/00—Measuring X-radiation, gamma radiation, corpuscular radiation, or cosmic radiation
- G01T1/02—Dosimeters
-
- G—PHYSICS
- G01—MEASURING; TESTING
- G01T—MEASUREMENT OF NUCLEAR OR X-RADIATION
- G01T1/00—Measuring X-radiation, gamma radiation, corpuscular radiation, or cosmic radiation
- G01T1/16—Measuring radiation intensity
- G01T1/169—Exploration, location of contaminated surface areas
-
- G—PHYSICS
- G01—MEASURING; TESTING
- G01T—MEASUREMENT OF NUCLEAR OR X-RADIATION
- G01T1/00—Measuring X-radiation, gamma radiation, corpuscular radiation, or cosmic radiation
- G01T1/16—Measuring radiation intensity
- G01T1/17—Circuit arrangements not adapted to a particular type of detector
-
- G—PHYSICS
- G01—MEASURING; TESTING
- G01T—MEASUREMENT OF NUCLEAR OR X-RADIATION
- G01T1/00—Measuring X-radiation, gamma radiation, corpuscular radiation, or cosmic radiation
- G01T1/16—Measuring radiation intensity
- G01T1/20—Measuring radiation intensity with scintillation detectors
-
- G—PHYSICS
- G01—MEASURING; TESTING
- G01T—MEASUREMENT OF NUCLEAR OR X-RADIATION
- G01T1/00—Measuring X-radiation, gamma radiation, corpuscular radiation, or cosmic radiation
- G01T1/16—Measuring radiation intensity
- G01T1/20—Measuring radiation intensity with scintillation detectors
- G01T1/202—Measuring radiation intensity with scintillation detectors the detector being a crystal
-
- G—PHYSICS
- G01—MEASURING; TESTING
- G01T—MEASUREMENT OF NUCLEAR OR X-RADIATION
- G01T1/00—Measuring X-radiation, gamma radiation, corpuscular radiation, or cosmic radiation
- G01T1/36—Measuring spectral distribution of X-rays or of nuclear radiation spectrometry
Definitions
- the present invention relates to a ⁇ -ray measuring method for simultaneously measuring and displaying a ⁇ -ray dose and an energy spectrum, and a ⁇ -ray measuring device incorporating the ⁇ -ray measuring method.
- Non-Patent Document 1 In nuclear facilities such as nuclear reactors and accelerator facilities, the law requires that radiation doses be monitored to ensure the safety of radiation workers, and for that purpose, ionization chambers and GM counters are used. Radiation doses have been measured using radiation measuring devices such as survey meters and personal dosimeters (Non-Patent Document 1).
- one-point calibration of the dose value is performed by standardizing the absolute value of the measured value based on the value at the 137 Cs ⁇ standard radiation source (662 keV). .. Therefore, although it depends on the dosimeter, if the error is up to about 1.5 to 2.0 MeV, the error can be kept within several tens of percent, but the measurement is performed as the distance from the above-mentioned 137 Cs ⁇ ray standard radiation source increases. It is inevitable that accuracy will be lacking.
- the actual ⁇ -ray energy is 3 MeV or less in the absence of neutrons (reactor is stopped, accelerator is not in operation, etc.), and is maximum in the presence of neutrons (accelerator is in operation). It is as large as 10 MeV. For this reason, in conventional general survey meters and personal dosimeters that cannot handle high energies up to 3 MeV, let alone 10 MeV, it is underestimated by evaluating the numerical value with a large error as a conservative numerical value. By being evaluated, problems that occur in practical use are avoided. However, as confirmed by the present inventor, in the conventional general survey meter and personal dosimeter, in the presence of neutrons, a value more than double the theoretical value (correct answer value) is displayed as the dose of ⁇ -rays. It turned out that.
- the present invention can measure and display not only the dose but also the energy spectrum of ⁇ -rays on the spot in real time with high accuracy, and the radiation can be easily worn around the body.
- the challenge is to provide ⁇ -ray measurement technology that can raise the awareness of workers about radiation exposure.
- the present inventor has diligently studied the solution to the above-mentioned problem, found that the above-mentioned problem can be solved by the invention described below, and has completed the present invention.
- the invention according to claim 1 It is a ⁇ -ray measurement method that measures the dose of ⁇ -rays and the energy spectrum at the same time.
- An energy spectrum creation step that creates an energy spectrum using the Bayesian estimation method based on the intensity data of ⁇ -rays detected by the detection unit. It is provided with a dose calculation step of calculating the dose by multiplying the created energy spectrum by a dose conversion coefficient.
- the Bayesian estimation method in the energy spectrum creation step is a sequential Bayesian estimation method. This is a ⁇ -ray measurement method characterized in that an ⁇ value indicating the degree of correction is defined by the following equation based on the number of counts and the decrease index.
- the invention according to claim 2 The ⁇ -ray measurement method according to claim 1, wherein the decrease index is 10-5 to 10-3.
- the invention according to claim 3 A ⁇ -ray measuring device that simultaneously measures ⁇ -ray dose and energy spectrum.
- a detector that detects incoming ⁇ -rays and A converter that converts the detected ⁇ -ray intensity into an electrical signal,
- An energy spectrum creation unit that creates an energy spectrum of incoming ⁇ -rays based on the converted electrical signal,
- a dose calculation unit that calculates the dose of incoming ⁇ -rays based on the created energy spectrum, It is equipped with a display unit that simultaneously displays the created energy spectrum and the calculated dose as measurement data.
- the ⁇ -ray measuring device is characterized in that the ⁇ -ray measuring method according to claim 1 or 2 is incorporated as a program in advance in the energy spectrum creating unit.
- the detection unit is a scintillator that emits light in proportion to the energy of the ⁇ -rays that have arrived.
- the conversion unit is an MPPC (Multi-Pixel Photon Counter) that counts photons of emitted light and converts them into a pulse signal corresponding to a peak value proportional to the energy of ⁇ -rays.
- MPPC Multi-Pixel Photon Counter
- the invention according to claim 5 The ⁇ -ray measuring device according to claim 4, wherein the scintillator is cesium iodide (CsI).
- CsI cesium iodide
- the invention according to claim 6 The ⁇ -ray measuring device according to claim 5, wherein the scintillator is cesium iodide processed into a cube of 2 to 3 cm square.
- the present invention not only the dose but also the energy spectrum of ⁇ -rays can be measured and displayed on the spot in real time with high accuracy, and the miniaturization that makes it easy to wear around the body enables radiation workers. It is possible to provide a ⁇ -ray measurement technique that can raise awareness of radiation exposure.
- the output (wave height distribution) y i of the discretized measuring device has the following relationship with the radiation information (energy distribution) ⁇ j and the detector responses R i, j at a certain energy E j. It is known that the energy distribution ⁇ j can be obtained by solving this equation (1).
- Bayesian inference method Therefore, the present inventor considered using the Bayesian inference method as a solution to the inverse problem of Eq. (2).
- Bayesian estimation method is an estimation method based on the so-called Bayes' theorem, and by using the Bayesian estimation method, the energy distribution can be estimated from the wave height distribution measured by the ⁇ -ray measuring device. It should be noted that, for this thing, has already been shown by the Iwasaki, etc. of Tohoku University (S.Iwasaki, "A new approach for unfolding problems based only on the Bayes'Theorem", Proc.of the 9 th Int.Symp.on Refer to Reactor University, pp. 245-252 (1996)).
- the spectral Bayesian estimation method is a method of estimating the energy distribution by the Bayesian estimation method after the measurement by the detector is completed. This method is used in ordinary radiation measurements.
- Sequential Bayesian estimation method Therefore, the present inventor considered using a sequential Bayesian estimation method in order to realize real-time measurement.
- the sequential Bayesian inference method estimates the energy spectrum according to Bayes' theorem every time one output (peak value> is obtained (1 count) from the detector (real-time processing), and the degree of correction is high.
- ⁇ value indicating the estimated spectrum after a certain 1-count detection can be shown by the following equation.
- the present inventor has conducted various experiments and studies on the improvement of accuracy in this sequential Bayesian estimation method, and as a result, sets the above-mentioned ⁇ value in consideration of the environment such as the counting rate of the measurement field, and concretely. It was found that when the ⁇ value is set to an accurate value that gives good results every time the measurement is performed, the estimation error can be suppressed to a sufficiently acceptable accuracy for practical use.
- the ⁇ value is used as a function of k, and the ⁇ -ray energy spectrum is dynamically changed with respect to the count number, and the ⁇ -ray energy spectrum in which instability is avoided with high accuracy based on the sequential Bayesian estimation method is obtained in real time.
- the dose calculated by multiplying the energy spectrum by the dose conversion coefficient can also be calculated with high accuracy in real time with strict consideration of all energies.
- the ⁇ -ray measuring device incorporating such a processing process can display and evaluate both the dose and the energy spectrum in real time on the spot in a state close to the true value.
- a miniaturized element such as CsI is used as the ⁇ -ray detection element, and the conversion unit that converts the detected ⁇ -ray intensity into an electric signal is compatible with CsI such as MPPC and is compact.
- such a ⁇ -ray measuring device can raise the awareness of radiation workers to radiation exposure, and can complement or replace conventional survey meters and personal dosimeters.
- FIG. 1 is a block diagram illustrating an electronic circuit in the ⁇ -ray measuring device according to the present embodiment. As shown in FIG. 1, the ⁇ -ray measuring device 1 according to the present embodiment is formed of the following components.
- a scintillator 11 that emits light in proportion to the intensity (energy) of ⁇ -rays as a detection unit for detecting ⁇ -rays that have arrived.
- a conversion unit that converts the detected intensity of ⁇ -rays into an electric signal, the photons of the light emitted by the scintillator 11 are counted and correspond to the peak value proportional to the energy of the ⁇ -rays.
- MPPC12 to convert to pulse signal
- the energy spectrum of the incoming ⁇ -ray is created by applying the sequential Bayesian estimation method described later to the pulse signal digitally converted by the ADC (Analog to Digital Converter) 16 from the converted electric signal.
- Energy spectrum creation unit 18 (4) Dose calculation unit that calculates the dose of incoming ⁇ -rays based on the created energy spectrum (corresponding to "dose" in the energy spectrum creation unit 18) (5) Display unit that simultaneously displays the created energy spectrum and the calculated dose as measurement data (not shown)
- 13 is a power supply unit that supplies power to the MPPC
- 14 is an amplifier that amplifies the pulse signal converted by the MPPC 12.
- the created energy spectrum has high accuracy and is also excellent in stability, so that the dose is also accurate. Calculated at a high value.
- the scintillator 11 is preferably CsI, which has no deliquescent property and can be easily processed to be miniaturized.
- CsI activated by adding a small amount of thallium (Tl).
- Tl thallium-activated cesium iodide
- the size of the scintillator 11 is preferably processed into a cube of 2 to 3 cm square, and as a specific example, a CsI (Tl) 2.6 cm square cube (weight: less than 100 g) is used. used.
- This CsI is compatible with MPPC, which is much lighter than a photomultiplier tube.
- the pulse height distribution y i in channel i, the posterior probability of the energy spectrum in the j, as shown in the following expression can be derived in response function R of the detector.
- the energy spectrum ⁇ j is revised as shown in the following equation by adding the contribution for each count of the detected signal (peak height signal) on the channel i. I will estimate. It should be noted that ⁇ is a coefficient (coefficient indicating the degree of correction) for adjusting how much the posterior probability is controlled as the prior probability.
- the position of the peak of the ⁇ -ray energy spectrum may shift or the intensity may fluctuate depending on the number of counts, and the obtained ⁇ -ray energy spectrum is unstable.
- FIG. 2 shows an example of measurement inside the nuclear fuel depot of natural uranium, and the dose is about 2 ⁇ Sv / hr.
- the energy spectrum shown on the right in FIG. 2 is obtained by using the sequential Bayesian estimation method.
- the present inventor examined a method for appropriately changing such an ⁇ value, defined a decrease index k of the ⁇ value as shown in FIG. 3, and based on the decrease index k and the count number N, the following It was found that the ⁇ value should be specified as in the formula.
- k is changed from 10-20 to 10-1 with respect to the ⁇ -ray wave height spectrum in the ⁇ -ray measurement time from 1 second to 5 hours, and the sequential Bayesian inference is performed. Using the method, it was unfolded into a real-time energy spectrum.
- k is preferably 10-5 to 10-3 , and in particular, in the case of 10-4 , if the measurement time of the ⁇ -ray intensity by the scintillator is 60 seconds, 3 of the wave height spectrum shown on the left of FIG.
- FIG. 4 is a measurement example (dose to 2 ⁇ Sv / hr) inside the nuclear fuel depot of natural uranium, and is a diagram for explaining the development from the wave height spectrum to the energy spectrum.
- the number of repetitions I is an index indicating how many times the 1 / k count measurement is repeated during the sequential Bayesian estimation (see FIG. 6A), and is defined by the following equation.
- FIG. 6 (b) where I is 45 and FIG. 6 (c) where I is 47 the peak clearly appears and the position is not displaced.
- FIG. 6D in which I exceeds 100 instability due to a large ⁇ appears, such as a peak being distorted or its position being displaced.
- FIG. 6E in which I is less than 1 since sufficient revision is not performed, the shape of the spectrum does not change even if the number of counts increases, and it is difficult to grasp the peak.
- Specific I in FIG. 6D is (1) 450, (2) 2700, (3) 5400, and (4) 27000.
- the specific I in FIG. 6 (e) is (1) 1.5E-7, (2) 1.5E-6, (3) 4.5E-6, (4) 9E-6, (5). ) 1.35E-5, (6) 4.5E-5, (7) 2.7E-4, (8) 5.4E-4, (9) 2.7E-3.
- the dose can be obtained by multiplying the energy spectrum by the dose conversion coefficient.
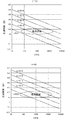
- FIG. 7 shows the temporal dose of the dose obtained from the energy spectrum of ⁇ -rays obtained by changing k from 10-2 (0.01) to 10-5 (0.00001) in the same manner as in FIG. It is a figure which shows the change. Note that FIG. 7 also shows the dose measured by a conventional survey meter for comparison.
- the dose value obtained by the ⁇ -ray measuring device of the present embodiment is a correct value
- the average energy in the nuclear fuel depot is lower than 137 Cs, even if the ⁇ -ray measuring device of the present embodiment displays a value lower than that of the conventional survey meter calibrated at 137 Cs. However, as shown in FIG. 7, it can be seen that the correct value is shown.
- the ⁇ -ray measuring device is as compact as a smartphone and can weigh about 200 g, so that radiation workers can easily wear it around them.
- FIG. 10 shows the results for the peak based on 137 Cs.
- FIG. 11 shows the results for the lower peak based on 60 Co.
- the estimation of the ⁇ -ray flux at the peak of 1.17MeV It turns out that is possible.
- FIG. 12 shows the results for the higher peak based on 60 Co.
- (Gf est / Gf ref ) converges to near 1 in about 60 seconds, and ⁇ at the peak of 1.33 MeV. It can be seen that the line flux can be estimated.
- the peaks are 0.356 MeV, 0.384 MeV and 600 keV or less, and because of the influence of backscatter, (Gf est / Gf ref ) deviates from 1, but k is set to 10 -4 or 10-5. By doing so, it was confirmed that (Gf est / Gf ref ) quickly converged in about 30 seconds.
- k is preferably 10-5 to 10-3 , and in the explanations of FIGS. 10 to 13, it was explained that the cases of 10-5 and 10-3 are insufficient or unstable. Is explained in comparison with the most preferable 10 -4 , and if k is 10 -5 to 10 -3 , a practically applicable convergence is achieved.
- the dose is evaluated based on the results of FIGS. 10 to 13.
- the dose can be calculated from the formula (radioactivity at the time of measurement) ⁇ (air collision kerma rate constant) / (distance between scintillator and radioactivity) 2 , and the theoretical values are 60 Co, 133 Ba, and 137 Cs, respectively. Can be shown as the sum of the doses of.
- the estimated value it can be shown as a value obtained by multiplying each estimated energy spectrum by a dose conversion coefficient and summing up.
- FIG. 15 shows an example in which ⁇ -rays are measured for 60 seconds in a room where no radiation source exists, that is, in a background ⁇ -ray field.
- FIG. 16 shows the result of measuring ⁇ -rays for 1 hour under the same conditions as in FIG. In the case of FIG. 16, did it appear at the bottom of FIG. 15? It can be seen that the peak at the position of is disappearing. This indicates that the measurement is possible even in the background ⁇ -ray field, but it takes time to make a stable measurement because the radiation is weak.
- the total number of counts is 28 million counts (46 CPS) in one week of measurement time.
- FIG. 18 is a graph showing the result of the dose, which is obtained by multiplying the energy spectrum estimated by the dose conversion coefficient by the dose conversion coefficient. From FIG. 18, it can be seen that when k is smaller than 0.001, the dose converges in about 20 seconds without instability.
- the spectrum and dose can be sufficiently estimated. Even when the air dose is in the background of about 0.08 ⁇ Sv / hr, both the spectrum and the dose can be sufficiently estimated, but it takes about 7.5 minutes for the spectrum.
- the decrease index k of ⁇ in the case of background or when the counting rate is small, it is about 10-3 , in the case of after accelerator operation, it is about 10-4 , and in the case of On-beam such as BNCT. 10-5 is suitable for this.
- FIG. 19 shows an appropriate use area of the Bayesian estimation method of the present invention.
- it takes a little time to evaluate the spectrum at I 40, so it is preferable to consider another measure for increasing the count value.
- k can be determined once the count rate CPS, the measurement time, and I are determined. Specifically, k is calculated by the following formula.
- I is appropriately set to about several tens.
- the measurement time t is desired to be several tens of seconds or less. Therefore, I and t can be appropriately determined.
- the number of counts CPS per second is determined by the measurement location. Therefore, an appropriate k can be automatically determined. It can be said that the ability to automatically determine k has great significance in practical use. Further, it can be said that a method in which k can be selected from 10 -3 , 10 -4 , 10 -5, etc. with a switch is also a practically preferable method.
Landscapes
- Physics & Mathematics (AREA)
- Spectroscopy & Molecular Physics (AREA)
- Health & Medical Sciences (AREA)
- Life Sciences & Earth Sciences (AREA)
- General Physics & Mathematics (AREA)
- High Energy & Nuclear Physics (AREA)
- Molecular Biology (AREA)
- Chemical & Material Sciences (AREA)
- Crystallography & Structural Chemistry (AREA)
- Measurement Of Radiation (AREA)
Abstract
線量だけでなくγ線のエネルギースペクトルをも、その場でリアルタイムに、精度高く計測、表示することができると共に、身の回りに装着し易い小型化により、放射線作業従事者らの放射線被曝への意識を高めさせることができるγ線計測技術を提供する。γ線の線量とエネルギースペクトルとを、同時に計測するγ線計測方法であって、検知部に検知されたγ線の強度データに基づいて、ベイズ推定法を用いて、エネルギースペクトルを作成するエネルギースペクトル作成ステップと、作成されたエネルギースペクトルに、線量変換係数を乗じることにより、線量を算出する線量算出ステップとを備えており、エネルギースペクトル作成ステップにおけるベイズ推定法が、逐次型ベイズ推定法であり、修正の度合いを示すα値を、カウント数および減少指数に基づいて規定するγ線計測方法。
Description
本発明は、γ線の線量とエネルギースペクトルとを、同時に計測して表示するγ線計測方法、および、前記γ線計測方法が組み込まれたγ線計測装置に関する。
原子炉や加速器施設などの核施設では、放射線の線量をモニターして、放射線作業従事者らの安全を確保することが法律で定められており、そのために、電離箱やGM計数管などを用いたサーベイメータや個人線量計などの放射線計測装置を用いて、放射線の線量を計測することが行われている(非特許文献1)。
しかしながら、これらのサーベイメータや個人線量計は、一般的にかなりの重量がある。また、いずれも、表示は線量のみであり、しかも、その数値の評価は137Csの一点校正によるものであり、γ線のような高エネルギーの放射線に対してまでの精度は保証されていなかった。
即ち、従来の一般的なサーベイメータや個人線量計では、137Csγ線標準線源(662keV)での値に基づいて計測値の絶対値を規格化することにより、線量値の一点校正を行っている。このため、線量計にもよるが、1.5~2.0MeV程度までであれば、数10%以内の誤差に収めることができるが、前記した137Csγ線標準線源から離れるに従って、計測の正確さが欠けてくることが避けられない。
実際のγ線エネルギーは、中性子がない状態(原子炉が停止している状態や、加速器が運転されていない状態など)では3MeV以下であり、中性子がある状態(加速器が運転状態)では最大で10MeVと大きい。このため、10MeVはおろか、3MeVまでの高エネルギーにも対応できていない従来の一般的なサーベイメータや個人線量計においては、大きめの誤差を乗せた数値を保守的な数値として評価することで、過小評価となることにより実用上において発生する不具合を回避している。しかしながら、本発明者が確認したところ、従来の一般的なサーベイメータや個人線量計では、中性子が存在している状態において、理論値(正解値)の倍以上の数値がγ線の線量として表示されていることが分かった。
また、γ線エネルギーは、そのスペクトルに分布があり、形も一定していないため、線量をリアルタイムで知るには、そのエネルギースペクトルをリアルタイムに知る必要があるが、現在のところ、サーベイメータや個人線量計によりγ線のエネルギースペクトルをリアルタイムに知る技術は、まだ提案されていない。
このため、放射線作業従事者らは、作業を第一優先にせざるを得ないこととも相俟って、重くて身につけやすいとは言えない現状から、サーベイメータや個人線量計を使用することには抵抗感があり、放射線作業従事者らの放射線被曝への意識が低くなり、自身の被曝管理が疎かになりがちであった。
「放射線による健康影響等に関する統一的な基礎資料 平成29年度版 第2章 放射線による被ばく(環境省)」、https://www.env.go.jp/chemi/rhm/kisoshiryo/pdf_h29/2017tk1s02.pdf
本発明は、上記の問題に鑑みて、線量だけでなくγ線のエネルギースペクトルをも、その場でリアルタイムに、精度高く計測、表示することができると共に、身の回りに装着し易い小型化により、放射線作業従事者らの放射線被曝への意識を高めさせることができるγ線計測技術を提供することを課題とする。
本発明者は、上記した課題の解決について鋭意検討を行い、以下に記載する発明により上記課題が解決できることを見出し、本発明を完成させるに至った。
請求項1に記載の発明は、
γ線の線量とエネルギースペクトルとを、同時に計測するγ線計測方法であって、
検知部に検知されたγ線の強度データに基づいて、ベイズ推定法を用いて、エネルギースペクトルを作成するエネルギースペクトル作成ステップと、
作成された前記エネルギースペクトルに、線量変換係数を乗じることにより、線量を算出する線量算出ステップとを備えており、
前記エネルギースペクトル作成ステップにおけるベイズ推定法が、逐次型ベイズ推定法であり、
修正の度合いを示すα値を、カウント数および減少指数に基づいて、下式で規定することを特徴とするγ線計測方法である。
γ線の線量とエネルギースペクトルとを、同時に計測するγ線計測方法であって、
検知部に検知されたγ線の強度データに基づいて、ベイズ推定法を用いて、エネルギースペクトルを作成するエネルギースペクトル作成ステップと、
作成された前記エネルギースペクトルに、線量変換係数を乗じることにより、線量を算出する線量算出ステップとを備えており、
前記エネルギースペクトル作成ステップにおけるベイズ推定法が、逐次型ベイズ推定法であり、
修正の度合いを示すα値を、カウント数および減少指数に基づいて、下式で規定することを特徴とするγ線計測方法である。

請求項2に記載の発明は、
前記減少指数が、10-5~10-3であることを特徴とする請求項1に記載のγ線計測方法である。
前記減少指数が、10-5~10-3であることを特徴とする請求項1に記載のγ線計測方法である。
請求項3に記載の発明は、
γ線の線量とエネルギースペクトルとを、同時に計測するγ線計測装置であって、
到来したγ線を検知する検知部と、
検知されたγ線の強度を電気信号に変換する変換部と、
変換された電気信号に基づいて、到来したγ線のエネルギースペクトルを作成するエネルギースペクトル作成部と、
作成されたエネルギースペクトルに基づいて、到来したγ線の線量を算出する線量算出部と、
作成されたエネルギースペクトルと算出された線量とを、計測データとして、同時に表示する表示部とを備えており、
前記エネルギースペクトル作成部に、請求項1または請求項2に記載のγ線計測方法が、予め、プログラムとして組み込まれていることを特徴とするγ線計測装置である。
請求項4に記載の発明は、
前記検知部が、到来したγ線のエネルギーに比例して発光するシンチレータであり、
前記変換部が、発光した光の光子をカウントして、γ線のエネルギーに比例した波高値に対応するパルス信号に変換するMPPC(Multi-Pixel Photon Counter)であることを特徴とする請求項3に記載のγ線計測装置である。
前記検知部が、到来したγ線のエネルギーに比例して発光するシンチレータであり、
前記変換部が、発光した光の光子をカウントして、γ線のエネルギーに比例した波高値に対応するパルス信号に変換するMPPC(Multi-Pixel Photon Counter)であることを特徴とする請求項3に記載のγ線計測装置である。
請求項5に記載の発明は、
前記シンチレータが、ヨウ化セシウム(CsI)であることを特徴とする請求項4に記載のγ線計測装置である。
前記シンチレータが、ヨウ化セシウム(CsI)であることを特徴とする請求項4に記載のγ線計測装置である。
請求項6に記載の発明は、
前記シンチレータが、2~3cm角の立方体に加工されたヨウ化セシウムであることを特徴とする請求項5に記載のγ線計測装置である。
前記シンチレータが、2~3cm角の立方体に加工されたヨウ化セシウムであることを特徴とする請求項5に記載のγ線計測装置である。
本発明によれば、線量だけでなくγ線のエネルギースペクトルをも、その場でリアルタイムに、精度高く計測、表示することができると共に、身の回りに装着し易い小型化により、放射線作業従事者らの放射線被曝への意識を高めさせることができるγ線計測技術を提供することができる。
[1]γ線のエネルギースペクトルのリアルタイム表示
前記したように、γ線の線量を精度高く計測するためには、γ線のエネルギースペクトルをリアルタイムに知る必要がある。
前記したように、γ線の線量を精度高く計測するためには、γ線のエネルギースペクトルをリアルタイムに知る必要がある。
このため、最初に、このエネルギースペクトルのリアルタイム表示について説明する。
1.基本的な考え方
離散化した計測装置の出力(波高分布)yiは、放射線の情報(エネルギー分布)ψj、および、あるエネルギーEjにおける検出器応答Ri,jと、以下の関係があることが知られており、この式(1)を解くことにより、エネルギー分布ψjを得ることができる。
離散化した計測装置の出力(波高分布)yiは、放射線の情報(エネルギー分布)ψj、および、あるエネルギーEjにおける検出器応答Ri,jと、以下の関係があることが知られており、この式(1)を解くことにより、エネルギー分布ψjを得ることができる。
しかし、実際には、波高分布yiに計測誤差、検出器応答Ri,jに評価誤差があるため、工学的には式(1)が成立せず、一般的に式(2)のようになり、解くことが難しい。
なお、この逆問題の解法については、例えば、最尤法やモンテカルロ法などを用いた汎用コードを用いることにより近似的に解けることが知られているが、これらの方法は、原理的にポストプロセス(計測後処理)によるデータ処理であるため、その場でリアルタイムに解く本発明に適用することはできない。
2.ベイズ推定法
そこで、本発明者は、式(2)の逆問題の解法として、ベイズ推定法を用いることを考えた。
そこで、本発明者は、式(2)の逆問題の解法として、ベイズ推定法を用いることを考えた。
(1)ベイズ推定法
ベイズ推定法は、いわゆるベイズの定理に基づく推定法であり、ベイズ推定法を用いることにより、γ線計測装置で計測される波高分布からエネルギー分布が推定できる。なお、このことについては、東北大学の岩崎等により既に示されている(S.Iwasaki,“A new approach for unfolding problems based only on the Bayes’Theorem”,Proc.of the 9th Int.Symp.on Reactor Dosimetry,pp.245-252(1996)参照)。
ベイズ推定法は、いわゆるベイズの定理に基づく推定法であり、ベイズ推定法を用いることにより、γ線計測装置で計測される波高分布からエネルギー分布が推定できる。なお、このことについては、東北大学の岩崎等により既に示されている(S.Iwasaki,“A new approach for unfolding problems based only on the Bayes’Theorem”,Proc.of the 9th Int.Symp.on Reactor Dosimetry,pp.245-252(1996)参照)。
(2)スペクトル型ベイズ推定法
スペクトル型ベイズ推定法は、検出器による計測終了後にベイズ推定法によりエネルギー分布を推定する方法である。この方法は通常の放射線計測で使用されているものである。
スペクトル型ベイズ推定法は、検出器による計測終了後にベイズ推定法によりエネルギー分布を推定する方法である。この方法は通常の放射線計測で使用されているものである。
しかしながら、この手法は、通常、測定が終了して測定データが取得された後(ポストプロセス)にエネルギー分布を求める場合に適用できる手法であり、その場でリアルタイムに解く本発明には適用できない。
(3)逐次型ベイズ推定法
そこで、本発明者は、リアルタイム計測を実現するため、逐次型ベイズ推定法を用いることを考えた。
そこで、本発明者は、リアルタイム計測を実現するため、逐次型ベイズ推定法を用いることを考えた。
逐次型ベイズ推定法は、検出器からの出力(波高値〉が1個(1カウント)得られるたびに、エネルギースペクトルの推定をベイズの定理により実施するもの(リアルタイム処理)であり、修正の度合いを示すα値を設定することにより、ある1カウント検出後の推定スペクトルを、以下の式で示すことができる。
上式は、例えば、α=0.1の場合、新たな推定結果は、前回の推定結果に対して、10%だけ上乗せされるということになることを示している。
しかしながら、この逐次型ベイズ推定法の採用については、従来、精度が悪く(測定が進んでカウント数が増えても結果が収束せず、統計精度が向上しない)、また、結果(カウント数に対する推定スペクトル)に不安定性があるという評価がなされていた。
本発明者は、この逐次型ベイズ推定法における精度の向上について、種々の実験と検討を行い、その結果、上記したα値を、計測場の計数率などの環境を勘案して設定、具体的には、計測を実施するたびにα値を良い結果が出る正確な数値に設定した場合には、実用上、十分に受け入れ可能な精度にまで推定誤差を抑え込んで、推定できることを見出した。
しかしながら、結果の不安定性については依然として認められ、未だ十分とは言えなかったため、さらに、α値の変化による収束の傾向などを、計測実験毎に詳しく調べ、その解決について検討を行った。
その結果、逐次型ベイズ推定法にα値の変化のパラメータとしての定数k(減少指数)を導入し、α値をこのkの関数として、カウント数に対して動的に変化させることにより、収束が著しく改善され、受け入れ可能な精度にまで十分に推定誤差を抑え込むことに加えて、不安定性が回避できることを見出した。
そして、このように、α値をkの関数として、カウント数に対して動的に変化させて、逐次型ベイズ推定法に基づいて高い精度で不安定性が回避されたγ線エネルギースペクトルをリアルタイムに作成することにより、エネルギースペクトルに線量変換係数を乗じて算出される線量も、全てのエネルギーを厳密に考慮した状態で、リアルタイムに精度高く算出することができる。
そして、このような処理プロセスが組み込まれたγ線計測装置は、線量とエネルギースペクトルの両方を真の値に近い状態で、その場でリアルタイムに表示して評価することができる。また、γ線の検知素子としてCsIのような小型化が可能な素子を用い、検知されたγ線の強度を電気信号に変換する変換部としてMPPCのようなCsIと相性がよく、小型の変換器を用いることにより、身の回りに装着し易い程度にまで容易に小型化することができる。
この結果、このようなγ線計測装置は、放射線作業従事者らの放射線被曝への意識を高めさせることができ、これまでのサーベイメータや個人線量計を補完する、もしくは代替させることができる。
[2]実施の形態
以下、具体的な実施例を交えた実施の形態に基づき、図面を参照しつつ説明する。
以下、具体的な実施例を交えた実施の形態に基づき、図面を参照しつつ説明する。
1.本実施の形態に係るγ線計測装置
最初に、本実施の形態に係るγ線計測装置について説明する。
最初に、本実施の形態に係るγ線計測装置について説明する。
図1は、本実施の形態に係るγ線計測装置における電子回路を説明するブロック図である。図1に示すように、本実施の形態に係るγ線計測装置1は、以下の構成要素から形成されている。
(1)到来したγ線を検知する検知部として、γ線の強度(エネルギー)に比例して発光するシンチレータ11
(2)検知されたγ線の強度を電気信号に変換する変換部として、シンチレータ11に検知されることによって発光した光の光子をカウントして、γ線のエネルギーに比例した波高値に対応するパルス信号に変換するMPPC12
(3)変換された電気信号からADC(Analog to Digital Converter)16によりディジタル変換されたパルス信号に対して、後述する逐次型ベイズ推定法を適用することにより、到来したγ線のエネルギースペクトルを作成するエネルギースペクトル作成部18
(4)作成されたエネルギースペクトルに基づいて、到来したγ線の線量を算出する線量算出部(エネルギースペクトル作成部18の「dose」に対応)
(5)作成されたエネルギースペクトルと算出された線量とを、計測データとして、同時に表示する表示部(図示せず)
なお、13はMPPCへ電力を供給する電源部であり、14はMPPC12により変換されたパルス信号を増幅する増幅器である。
そして、本実施の形態に係るγ線計測装置1においては、後述するように、作成されたエネルギースペクトルが、高い精度を有しており、また、安定性にも優れているため、線量も精度高い値で算出される。
なお、本実施の形態において、シンチレータ11としては、潮解性が無く、容易に加工して小型化が可能なCsIが好ましく、通常は、タリウム(Tl)を少量添加することにより活性化させたCsI(Tl)(タリウム活性化ヨウ化セシウム)が使用される。なお、シンチレータ11として使用する際のサイズとしては、2~3cm角の立方体に加工したものが好ましく、具体的な一例として、CsI(Tl)の2.6cm角の立方体(重量:100g弱)が使用される。
このCsIは、光電子増倍管に比べて格段に軽いMPPCとの相性がよく、CsIとMPPCを組み合わせることにより、優れたエネルギー分解能と検出効率の確保を図ると共に、γ線計測装置の小型化、軽量化を図ることができる。
2.γ線のエネルギースペクトルの作成
次に、本実施の形態におけるγ線のエネルギースペクトルの作成について説明する。
次に、本実施の形態におけるγ線のエネルギースペクトルの作成について説明する。
ベイズの定理によると、チャンネルiにおける波高分布yiから、jにおけるエネルギースペクトルの事後確率を、以下の式のように、検出器の応答関数Rで導出することができる。

そして、逐次型ベイズ推定法においては、検出されたチャンネルiでの信号(波高信号)1カウントごとに寄与を加算していくことにより、下式のように、エネルギースペクトルψjを改定して、推定していく。なお、αは、事前確率として、どの程度、事後確率が制御されるのかを調整する係数(修正の度合いを示す係数)である。

しかし、上記の式を適用した場合、γ線のエネルギースペクトルのピークの位置がカウント数によってずれたり、強度が変動する場合があり、得られるγ線のエネルギースペクトルに不安定性がある。
具体的な一例を図2に示す。図2は、天然ウランの核燃料庫の内部における計測例であり、線量は、~2μSv/hr程度である。なお、図2においては、α=0.01として、5時間(下図)および30秒間(上図)、γ線の計測を行って、図2左に示すγ線の波高スペクトルを得た後、逐次型ベイズ推定法を用いて、図2右に示すエネルギースペクトルを得ている。
図2より、γ線の波高スペクトルでは両者の波高分布の形状変化が小さいが、統計精度は5時間計測の方が格段に優れていることが分かる。しかし、エネルギースペクトルでは、両者の間に、ピーク位置のずれが生じており、しかも、5時間計測の方がむしろ精度が悪くなっており、エネルギースペクトルが安定していないことが分かる。これに対して、30秒計測の方では、1MeV付近にはっきりとしたピークが認められ、天然ウランからのピークであることが確認されている。
本発明者が、さらに、α値を変化させて、その不安定性を見た場合、α値が大き過ぎるとこの不安定性が大きくなり、一方、α値が小さ過ぎると改定スピードが遅くなることが分かり、結果として、計測の開始時にはα値を大きくし、その後は、徐々に小さくしていく必要性があることが分かった。
本発明者は、このようなα値を適切に変化させる手法について検討し、図3に示すようにα値の減少指数kを規定して、この減少指数kおよびカウント数Nに基づいて、下式のようにα値を規定すればよいことを見出した。

本発明者は、次に、上記したkの好ましい値について検討を行った。具体的には、図4に示すように、1秒から5時間までのγ線の計測時間におけるγ線の波高スペクトルに対し、kを10-20から10-1まで変化させて、逐次型ベイズ法を用いて、リアルタイムのエネルギースペクトルに展開(unfolding)した。その結果、kは10-5~10-3であることが好ましく、特に、10-4の場合、シンチレータによるγ線の強度の計測時間が60秒あれば、図4左に示す波高スペクトルの3つのピーク、即ち、0.1MeV付近における234Thのピーク、0.8MeV付近、および1MeV付近における234Paのピークが、図4右に示すエネルギースペクトルにおいても再現されており、特に好ましいことが分かった。なお、図4は、天然ウランの核燃料庫の内部における計測例(線量~2μSv/hr)であり、波高スペクトルからエネルギースペクトルへの展開を説明する図である。
そして、上記で得られたγ線のエネルギースペクトルを、Ge検出器によるγ線の波高スペクトルの計測結果(図5)と比較すると、概ね似た形となっており、また、同じ位置にピークが現れていることが確認でき、正しく計測できていることが確認できた。
そして、本実施の形態に係るγ線計測装置の場合、上記したように、線量が2μSv/hr程度の強度の場では、少なくとも60秒の計測を行うことにより、リアルタイムで精度の高いエネルギースペクトルが得られることが確認できた。
一方、結果の不安定性は、逐次型ベイズ推定における繰り返し数Iに関係しているため、次に、好ましい繰り返し数Iについて検討した。なお、この繰り返し数Iは、逐次型ベイズ推定中に、1/kカウントの計測が何回繰り返されるかを示す指標であり(図6(a)参照)、下式によって定義されている。

その結果、図6(b)~(e)に示すように、繰り返し数Iは約50とすることが特に好ましいことが分かった。
即ち、Iが45である図6(b)や、Iが47である図6(c)では、ピークが明確に現れており、位置もずれていない。一方、Iが100を超える図6(d)では、ピークが歪んだり、その位置がずれるなど、αが大きいことによる不安定性が現れている。そして、Iが1未満の図6(e)では、十分な改定が行われないため、カウント数が増えても、スペクトルの形に変化が現れず、ピークを把握することが難しい。なお、図6(d)における具体的なIは、(1)450、(2)2700、(3)5400、(4)27000である。また、図6(e)における具体的なIは、(1)1.5E-7、(2)1.5E-6、(3)4.5E-6、(4)9E-6、(5)1.35E-5、(6)4.5E-5、(7)2.7E-4、(8)5.4E-4、(9)2.7E-3である。
3.γ線のエネルギースペクトルから線量への変換
次に、得られたγ線のエネルギースペクトルから線量への変換について説明する。
次に、得られたγ線のエネルギースペクトルから線量への変換について説明する。
前記したように、エネルギースペクトルに線量変換係数を乗じることにより、線量を求めることができる。
図7は、図4と同様にして、kを10-2(0.01)から10-5(0.00001)まで変化させて得られたγ線のエネルギースペクトルから求められた線量の時間的変化を示す図である。なお、図7には、比較のために、従来のサーベイメータで計測された線量も記載している。
図7より、安定した線量値は、k≦10-4の場合に得られており、従来のサーベイメータで計測された線量よりも低い値となっていることが分かる。これは、従来のサーベイメータで計測された線量が、137Csで一点校正されているためである。
次に、本実施の形態のγ線計測装置において得られた線量値が正しい値であるか否かを確認するために、3つの標準線源、即ち、137Cs(662KeV)、60Co(1.3MeV)、133Ba(356KeV)について、本実施の形態のγ線計測装置、および、従来のサーベイメータを用いて線量の計測を行い、得られた各値を理論値と比較した(k=10-4)。結果を表1に示す。

表1から分かるように、本実施の形態のγ線計測装置では、理論値とほぼ一致した値が得られている。これに対して、従来のサーベイメータでは、137Cs以外は理論値と合致していない。これは、従来のサーベイメータが137Csのγ線一点で校正されているためである。
そして、核燃料庫における平均エネルギーは、137Csよりも低いことを考慮すると、たとえ、本実施の形態のγ線計測装置で、137Csで一点校正された従来のサーベイメータよりも低い値が表示されたとしても、図7に示すように、正しい値を示していることが分かる。
そして、本実施の形態に係るγ線計測装置は、スマートフォン程度のコンパクトさで、重量も200g程度とすることができるため、放射線作業従事者らが、身の回りに装着し易い。
4.標準線源場での測定
上記においては、天然ウランの核燃料庫の内部における計測例を示したが、以下においては、線源強度が理論的に分かっている標準線源場での計測例を挙げて、本発明においては、短時間にγ線のフラックスのピークのエネルギーを推定して、30秒以内に、線量を正しく評価できることを説明する。
上記においては、天然ウランの核燃料庫の内部における計測例を示したが、以下においては、線源強度が理論的に分かっている標準線源場での計測例を挙げて、本発明においては、短時間にγ線のフラックスのピークのエネルギーを推定して、30秒以内に、線量を正しく評価できることを説明する。
具体的には、まず、137Cs、60Co、133Ba、3種類の標準線源を用いて、既知の複数のエネルギーのγ線場を製作し、600秒間の計測を行い、図8上に示す波高スペクトルを得た後、得られた波高スペクトルに対して、kの値を10-3、10-4、10-5と変化させて、逐次型ベイズ法を用いて展開し、図8下に示す20秒後の推定エネルギースペクトルを得た。
得られた推定エネルギースペクトルでは、図8下に示すように、137Csに基づく1つのピーク、133Baに基づく1つのピーク、60Coに基づく2つのピークがあることが分かる。
次に、各ピークのγ線フラックスについて、逐次型ベイズ法に基づく推定値Gfestの、図9に示す式から算出される理論値Gfrefに対する比(Gfest/Gfref)と、測定時間との関係について、kの値を10-3、10-4、10-5と変化させて、算出した。結果を図10~図13に示す。(Gfest/Gfref)が1に近いほど、推定値と理論値が一致していることを示す。
図10は、137Csに基づくピークについての結果であり、k=10-4の場合には、60秒で(Gfest/Gfref)が、1.1に安定的に収束しているが、k=10-3の場合には、不安定性が生じており、k=10-5の場合には、不十分な収束となっている。この結果より、137Csの場合、kを10-4と設定することにより、60秒ほどで(Gfest/Gfref)が1近くに収束して、662keVのピークにおけるγ線フラックスの推定が可能であることが分かる。
図11は、60Coに基づく低い方のピークについての結果であり、k=10-4の場合には、60秒で(Gfest/Gfref)が、0.9に安定的に収束しているが、k=10-3の場合には、不安定性が生じており、k=10-5の場合には、不十分な収束となっている。この結果より、60Coの場合、kを10-4と設定することにより、60秒ほどで(Gfest/Gfref)が1近くに収束して、1.17MeVのピークにおけるγ線フラックスの推定が可能であることが分かる。
図12は、60Coに基づく高い方のピークについての結果であり、k=10-4の場合には、60秒で(Gfest/Gfref)が、0.9に収束し、k=10-5の場合には、60秒で(Gfest/Gfref)が、0.95に収束しているが、k=10-3の場合には、不安定性が生じている。この結果より、60Coの場合、kを10-4あるいは10-5と設定することにより、60秒ほどで(Gfest/Gfref)が1近くに収束して、1.33MeVのピークにおけるγ線フラックスの推定が可能であることが分かる。
図13は、133Baに基づくピークについての結果であり、k=10-3、10-4、10-5のいずれの場合においても、30秒で(Gfest/Gfref)が、1.4近くに収束している(k=10-3の場合、若干、不安定な収束)。ピークが0.356MeV、0.384MeVと600keV以下であり、後方散乱の影響があるため、(Gfest/Gfref)は1からはズレているが、kを10-4あるいは10-5と設定することにより、30秒ほどで(Gfest/Gfref)が素早く収束することが確認できた。
なお、kは前記した通り、10-5~10-3が好ましく、図10~図13の説明において、10-5、10-3の場合に、不十分ないし不安定という説明をしたが、これは最も好ましい10-4との比較において説明したものであり、kが10-5~10-3であれば、実用的に適用可能な収束はできている。
次に、図10~図13の結果に基づいて、線量の評価を行う。線量は、(測定時の放射能)×(空気衝突カーマ率定数)/(シンチレータと線源の距離)2の式より求めることができ、理論値は、60Co、133Ba、137Cs、それぞれの線量の合計として示すことができる。一方、推定値としては、推定された各エネルギースペクトルに線量変換係数をかけて合計した値で示すことができる。
図14は、図10~図13に基づいて得られた線量の推定値と、測定時間との関係を示す図であり、k=10-3やk=10-5でも推定可能であるが、k=10-3の場合には、若干不安定性が見られ、k=10-5の場合には、少し収束が遅いことが分かる。k=10-4の場合、最も安定しており、30秒以内で正しい線量を評価できることが分かる。具体的な結果として、図14において、k=10-4、30秒の場合、推定値は6.006μSv/hrとなり、理論値6.013μSv/hrとほぼ一致している。
以上より、本実施の形態によれば、複数の標準ガンマ線源を用いた線量の計測が可能であることが確認できた。
5.バックグランドγ線場での測定
上記においては、天然ウランの核燃料庫の内部における計測例を示したが、以下においては、本発明を実際に使用する場合、最も線量が低い場と考えられるバックグランドγ線場での計測例を示し、バックグランドγ線場においても、即ち、ほぼ全ての場所で、本発明が適用できることを説明する。
上記においては、天然ウランの核燃料庫の内部における計測例を示したが、以下においては、本発明を実際に使用する場合、最も線量が低い場と考えられるバックグランドγ線場での計測例を示し、バックグランドγ線場においても、即ち、ほぼ全ての場所で、本発明が適用できることを説明する。
図15は、放射線源が存在しない室内、即ち、バックグランドγ線場でγ線を60秒、計測した例であり、図15上に示すγ線の波高スペクトルを得た後、本発明による手法を用いて、図15下に示すエネルギースペクトルを推定している。
図15下のエネルギースペクトルにおいては、40K(1461KeV)と、208Tl(2614.5KeV)のピークが現れている一方、ピークがないことが予め分かっている?の位置にピークが見られ、安定した測定ができていないことが分かる。
図16は、図15の場合と同様の条件で、γ線を1時間計測した結果である。図16の場合は、図15下に現れていた?の位置のピークが、消えていることが分かる。このことは、バックグランドγ線場でも、測定は可能であるが、放射線が弱いため、安定した測定をするには、時間がかかることを示している。
なお、図15、図16の場合、測定時間、1週間で、総カウント数は2800万カウント(46CPS)である。
次に、図17は、バックグランドγ線場での計測に適切な繰り返し数Iを調べた結果であり、繰り返し数Iを、I=1、I=20、I=50にした時のエネルギースペクトルを示している。(a)のI=1の場合、ピークがないことが予め分かっている丸囲みした部分にピークが表れており、安定した測定ができていないことが分かる。
一方、(b)のI=20の場合、I=1の場合に丸囲みした部分に表われていたピークが消えていることが分かる。また、得られたピークは、I=1の場合より明瞭に表れており、精度高く測定できていることが分かる。
(c)のI=50の場合においても、I=1の場合に丸囲みした部分に表われていたピークが消えていることが分かり、また、各ピークが、I=20の場合より明瞭に表れており、精度高く測定できていることが分かる。一方、I=50を超えると、安定した測定ができないことが実験で確認できている。このため、I=20~50の間で測定することが好ましい。
そして、繰り返し数Iを変化させて得られた図17の3つのエネルギースペクトルのいずれにおいても、kの値に拘わらず、ほぼ同じエネルギースペクトルを示しており、推定の精度は、kの値に関係なく、繰り返し数Iによって制御されていることが分かる。
次に、バックグランドでの計測に必要な測定時間を検討した。
前記した通り、I=kNであるため、繰り返し数Iが決まっている場合、kが小さいほど、カウント数Nが多くなり、必要な測定時間が長くかかる。
前記の通り、推定の精度は、kに関係なく、繰り返し数Iによって制御されるため、測定時間の短縮のためには、kは支障のない範囲で大きいことが好ましく、図17の場合、kが0.001の場合でも、精度高い測定ができているため、I=20で、k=0.001とすることが好ましい。この場合、カウント数Nは20000となり、安定した測定に必要な時間は7.5分となる。
なお、I=20において、k=0.0001とすると、カウント数Nは200000となり、安定した測定に必要な時間は1.2時間となる。また、I=20において、k=0.00001とすると、カウント数Nは2000000となり、安定した測定に必要な時間は12時間となる。
以上より、天然ウランの核燃料庫の内部における計測の場合、上記した通り、60秒で、精度の高いエネルギースペクトルが得られていることと比較すると、バックグランドでの計測の場合、長い計測時間を要することが、実験の結果から分かる。
図18は線量の結果を示すグラフであり、線量変換係数で推定したエネルギースペクトルに線量変換係数を乗じることで求めている。図18より、kが0.001より小さいと、線量は、20秒程度で不安定性もなく収束することが分かる。
6.まとめ
上記において、本発明によるベイズ推定法に基づいた天然ウランの核燃料庫の内部における計測例および、バックグランドγ線場での計測例を示したが、上記以外の実験結果も含めて、種々の実験により得られた結果を表2に示す。そして、表2より以下のことが分かる。
上記において、本発明によるベイズ推定法に基づいた天然ウランの核燃料庫の内部における計測例および、バックグランドγ線場での計測例を示したが、上記以外の実験結果も含めて、種々の実験により得られた結果を表2に示す。そして、表2より以下のことが分かる。

空間線量が、核燃料庫の内部や、加速器運転後、適当な時間経過後の線量である2μSv/hr程度であれば、スペクトルも、線量も十分に推定が可能である。空間線量が0.08μSv/hr程度のバックグランドの場合でも、スペクトル、線量共に、十分に推定が可能であるが、スペクトルについては、7.5分程度の時間を要す。
測定時間に関しては、実験において、1インチ角のCslのシンチレータを用いたが、シンチレータのサイズを大きくすることにより、精度が向上し、測定時間を短くすることができる。
繰り返し数Iについては、数十程度が適切である。
また、αの減少指数kについては、バックグランドの場合や、計数率が小さい場合には、10-3程度、加速器運転後などの場合には10-4程度、BNCTなどのOn-beamの場合には10-5程度が適当である。
次に、図19に、本発明のベイズ推定法の適切な使用領域を示す。I=10の場合は、スペクトルの評価の安定度が悪く、I=40付近の方が好ましい。しかし、バックグランドでの計測まで考慮すると、I=40では、スペクトルの評価に少し時間がかかるので、計数値を上げる別の方策も考慮することが好ましい。
ただし、バックグランドでの計測の場合、スペクトルの評価まで必要な場合が、どの程度あるかを考えておく必要がある。また、医療現場での計測では、バックグランドよりずっと高い線量である。測定時間については、シンチレータの結晶を大きくすればよいと言えるが、実用上は、あまり大きくしたくないものである。このように種々の考慮すべき事項があり、これらを総合的に考慮して、適切な使用領域を決めることになる。
次に、実用面からの考察結果について説明する。実用上、効率的な計測には、kの値を短時間に適切に決めることが重要となる。本発明者が行ったこれまでの結果を考慮するとkは、計数率CPS、計測時間、そしてIが決まれば決めることができ、具体的には、kは以下の式で求められる。
ここで、Iは上記した通り、数十程度が適当である。計測時間tは、実用上、数十秒以下にしたいものである。このため、I、tは適宜決めることができる。そして、1秒当たりのカウント数CPSは、計測場所で決まる。このため、適切なkを自動的に決めることができる。kを自動的に決めることができることは、実用上、大きな意義を有すると言える。また、kを10-3、10-4、10-5などからスイッチで選択できるようにしておく方法も、実用上、好ましい方法と言える。
以上、本発明を実施の形態に基づいて説明したが、本発明は、上記の実施の形態に限定されるものではない。なお、本発明と同一および均等の範囲内において、上記の実施の形態に対して種々の変更を加えることが可能である。
1 γ線計測装置
11 シンチレータ
12 MPPC
13 電源部
14 増幅器
16 ADC
18 エネルギースペクトル作成部
11 シンチレータ
12 MPPC
13 電源部
14 増幅器
16 ADC
18 エネルギースペクトル作成部
Claims (6)
- γ線の線量とエネルギースペクトルとを、同時に計測するγ線計測方法であって、
検知部に検知されたγ線の強度データに基づいて、ベイズ推定法を用いて、エネルギースペクトルを作成するエネルギースペクトル作成ステップと、
作成された前記エネルギースペクトルに、線量変換係数を乗じることにより、線量を算出する線量算出ステップとを備えており、
前記エネルギースペクトル作成ステップにおけるベイズ推定法が、逐次型ベイズ推定法であり、
修正の度合いを示すα値を、カウント数および減少指数に基づいて、下式で規定することを特徴とするγ線計測方法。

- 前記減少指数が、10-5~10-3であることを特徴とする請求項1に記載のγ線計測方法。
- γ線の線量とエネルギースペクトルとを、同時に計測するγ線計測装置であって、
到来したγ線を検知する検知部と、
検知されたγ線の強度を電気信号に変換する変換部と、
変換された電気信号に基づいて、到来したγ線のエネルギースペクトルを作成するエネルギースペクトル作成部と、
作成されたエネルギースペクトルに基づいて、到来したγ線の線量を算出する線量算出部と、
作成されたエネルギースペクトルと算出された線量とを、計測データとして、同時に表示する表示部とを備えており、
前記エネルギースペクトル作成部に、請求項1または請求項2に記載のγ線計測方法が、予め、プログラムとして組み込まれていることを特徴とするγ線計測装置。 - 前記検知部が、到来したγ線のエネルギーに比例して発光するシンチレータであり、
前記変換部が、発光した光の光子をカウントして、γ線のエネルギーに比例した波高値に対応するパルス信号に変換するMPPC(Multi-Pixel Photon Counter)であることを特徴とする請求項3に記載のγ線計測装置。 - 前記シンチレータが、ヨウ化セシウム(CsI)であることを特徴とする請求項4に記載のγ線計測装置。
- 前記シンチレータが、2~3cm角の立方体に加工されたヨウ化セシウムであることを特徴とする請求項5に記載のγ線計測装置。
Priority Applications (1)
| Application Number | Priority Date | Filing Date | Title |
|---|---|---|---|
| JP2021548991A JP7477890B2 (ja) | 2019-09-25 | 2020-09-24 | γ線計測方法およびγ線計測装置 |
Applications Claiming Priority (2)
| Application Number | Priority Date | Filing Date | Title |
|---|---|---|---|
| JP2019-174461 | 2019-09-25 | ||
| JP2019174461 | 2019-09-25 |
Publications (1)
| Publication Number | Publication Date |
|---|---|
| WO2021060379A1 true WO2021060379A1 (ja) | 2021-04-01 |
Family
ID=75165240
Family Applications (1)
| Application Number | Title | Priority Date | Filing Date |
|---|---|---|---|
| PCT/JP2020/036042 WO2021060379A1 (ja) | 2019-09-25 | 2020-09-24 | γ線計測方法およびγ線計測装置 |
Country Status (2)
| Country | Link |
|---|---|
| JP (1) | JP7477890B2 (ja) |
| WO (1) | WO2021060379A1 (ja) |
Citations (4)
| Publication number | Priority date | Publication date | Assignee | Title |
|---|---|---|---|---|
| JP2013527433A (ja) * | 2010-04-02 | 2013-06-27 | コミシリア ア レネルジ アトミック エ オ エナジーズ オルタネティヴズ | 分光分析の方法および関連装置 |
| JP2015501928A (ja) * | 2011-11-23 | 2015-01-19 | クロメック リミテッドKromek Limited | 検出器装置及び検出方法 |
| JP2015204985A (ja) * | 2014-04-18 | 2015-11-19 | 株式会社日立製作所 | X線エネルギースペクトル測定方法およびx線エネルギースペクトル測定装置およびx線ct装置 |
| US20180059259A1 (en) * | 2015-03-24 | 2018-03-01 | Commissariat A L'energie Atomique Et Aux Energies Al Ternatives | Method and device for detecting radioelements |
-
2020
- 2020-09-24 JP JP2021548991A patent/JP7477890B2/ja active Active
- 2020-09-24 WO PCT/JP2020/036042 patent/WO2021060379A1/ja active Application Filing
Patent Citations (4)
| Publication number | Priority date | Publication date | Assignee | Title |
|---|---|---|---|---|
| JP2013527433A (ja) * | 2010-04-02 | 2013-06-27 | コミシリア ア レネルジ アトミック エ オ エナジーズ オルタネティヴズ | 分光分析の方法および関連装置 |
| JP2015501928A (ja) * | 2011-11-23 | 2015-01-19 | クロメック リミテッドKromek Limited | 検出器装置及び検出方法 |
| JP2015204985A (ja) * | 2014-04-18 | 2015-11-19 | 株式会社日立製作所 | X線エネルギースペクトル測定方法およびx線エネルギースペクトル測定装置およびx線ct装置 |
| US20180059259A1 (en) * | 2015-03-24 | 2018-03-01 | Commissariat A L'energie Atomique Et Aux Energies Al Ternatives | Method and device for detecting radioelements |
Also Published As
| Publication number | Publication date |
|---|---|
| JP7477890B2 (ja) | 2024-05-02 |
| JPWO2021060379A1 (ja) | 2021-04-01 |
Similar Documents
| Publication | Publication Date | Title |
|---|---|---|
| Clairand et al. | Use of active personal dosemeters in interventional radiology and cardiology: Tests in laboratory conditions and recommendations-ORAMED project | |
| Behrens et al. | Monitoring the eye lens: which dose quantity is adequate? | |
| Tsuda et al. | Characteristics and verification of a car-borne survey system for dose rates in air: KURAMA-II | |
| JP4583480B2 (ja) | 中性子線量計 | |
| Tsuda et al. | Spectrum–dose conversion operator of NaI (Tl) and CsI (Tl) scintillation detectors for air dose rate measurement in contaminated environments | |
| Kessler et al. | Characterization of detector-systems based on CeBr3, LaBr3, SrI2 and CdZnTe for the use as dosemeters | |
| Kržanović et al. | Development and testing of a low cost radiation protection instrument based on an energy compensated Geiger-Müller tube | |
| JP2017161259A (ja) | 放射能濃度測定装置及び放射能濃度測定方法 | |
| Gressier et al. | Characterization of a measurement reference standard and neutron fluence determination method in IRSN monoenergetic neutron fields | |
| RU2657296C2 (ru) | Способ измерения дозы посредством детектора излучения, в частности детектора рентгеновского излучения или гамма-излучения, используемого в спектроскопическом режиме, и система для измерения дозы с применением такого способа | |
| WO2021060379A1 (ja) | γ線計測方法およびγ線計測装置 | |
| Ishak-Boushaki et al. | Thick activation detectors for neutron spectrometry using different unfolding methods: sensitivity analysis and dose calculation | |
| RU2613594C1 (ru) | Способ измерения мощности дозы в смешанном аппаратурном спектре гамма-излучения | |
| Bohra et al. | Quantification of pure beta spectra in mixed beta gamma fields as part of eye lens dosimetry at CANDU power plants | |
| Tsujimura et al. | Beta dose rate measurements with an end-window GM survey meter in environments contaminated by the Fukushima Daiichi nuclear accident | |
| Luszik-Bhadra et al. | A new neutron monitor with silver activation | |
| Eakins et al. | Calibration of the GNU and HSREM neutron survey instruments | |
| Wielunski et al. | The HMGU combined neutron and photon dosemeter | |
| Lobdell et al. | Photon spectra and dose measurements using a tissue-equivalent plastic scintillator | |
| Suliman et al. | Performance testing of selected types of electronic personal dosimeters used in Sudan | |
| McDonald | Radiation Detection and Measurement | |
| Correia et al. | Study and calibration of the HPGe detector for radionuclide analysis of iodine-125 | |
| Kahane et al. | Optimizing the Teflon thickness for fast neutron detection using a Ge detector | |
| Alkhayat | On the question of the verification of the MCNP6. 2 simulation program for the NaI (Tl) detector | |
| Sallaska et al. | Methods for characterizing a radiation detector for specifying radiation fields during testing against standards for homeland security applications |
Legal Events
| Date | Code | Title | Description |
|---|---|---|---|
| 121 | Ep: the epo has been informed by wipo that ep was designated in this application |
Ref document number: 20868508 Country of ref document: EP Kind code of ref document: A1 |
|
| WWE | Wipo information: entry into national phase |
Ref document number: 2021548991 Country of ref document: JP |
|
| NENP | Non-entry into the national phase |
Ref country code: DE |
|
| 122 | Ep: pct application non-entry in european phase |
Ref document number: 20868508 Country of ref document: EP Kind code of ref document: A1 |