WO2020261383A1 - データ収集装置、プラント監視システムおよびデータ収集方法 - Google Patents
データ収集装置、プラント監視システムおよびデータ収集方法 Download PDFInfo
- Publication number
- WO2020261383A1 WO2020261383A1 PCT/JP2019/025163 JP2019025163W WO2020261383A1 WO 2020261383 A1 WO2020261383 A1 WO 2020261383A1 JP 2019025163 W JP2019025163 W JP 2019025163W WO 2020261383 A1 WO2020261383 A1 WO 2020261383A1
- Authority
- WO
- WIPO (PCT)
- Prior art keywords
- measured values
- event number
- measurement
- time difference
- trend graph
- Prior art date
- Legal status (The legal status is an assumption and is not a legal conclusion. Google has not performed a legal analysis and makes no representation as to the accuracy of the status listed.)
- Ceased
Links
Images



Classifications
-
- G—PHYSICS
- G06—COMPUTING OR CALCULATING; COUNTING
- G06F—ELECTRIC DIGITAL DATA PROCESSING
- G06F16/00—Information retrieval; Database structures therefor; File system structures therefor
- G06F16/20—Information retrieval; Database structures therefor; File system structures therefor of structured data, e.g. relational data
- G06F16/24—Querying
- G06F16/248—Presentation of query results
-
- G—PHYSICS
- G06—COMPUTING OR CALCULATING; COUNTING
- G06F—ELECTRIC DIGITAL DATA PROCESSING
- G06F11/00—Error detection; Error correction; Monitoring
- G06F11/30—Monitoring
- G06F11/3003—Monitoring arrangements specially adapted to the computing system or computing system component being monitored
- G06F11/3006—Monitoring arrangements specially adapted to the computing system or computing system component being monitored where the computing system is distributed, e.g. networked systems, clusters, multiprocessor systems
-
- G—PHYSICS
- G01—MEASURING; TESTING
- G01R—MEASURING ELECTRIC VARIABLES; MEASURING MAGNETIC VARIABLES
- G01R31/00—Arrangements for testing electric properties; Arrangements for locating electric faults; Arrangements for electrical testing characterised by what is being tested not provided for elsewhere
- G01R31/34—Testing dynamo-electric machines
- G01R31/346—Testing of armature or field windings
-
- G—PHYSICS
- G05—CONTROLLING; REGULATING
- G05B—CONTROL OR REGULATING SYSTEMS IN GENERAL; FUNCTIONAL ELEMENTS OF SUCH SYSTEMS; MONITORING OR TESTING ARRANGEMENTS FOR SUCH SYSTEMS OR ELEMENTS
- G05B23/00—Testing or monitoring of control systems or parts thereof
- G05B23/02—Electric testing or monitoring
-
- G—PHYSICS
- G06—COMPUTING OR CALCULATING; COUNTING
- G06F—ELECTRIC DIGITAL DATA PROCESSING
- G06F16/00—Information retrieval; Database structures therefor; File system structures therefor
- G06F16/20—Information retrieval; Database structures therefor; File system structures therefor of structured data, e.g. relational data
- G06F16/24—Querying
- G06F16/245—Query processing
- G06F16/2458—Special types of queries, e.g. statistical queries, fuzzy queries or distributed queries
- G06F16/2465—Query processing support for facilitating data mining operations in structured databases
-
- G—PHYSICS
- G06—COMPUTING OR CALCULATING; COUNTING
- G06F—ELECTRIC DIGITAL DATA PROCESSING
- G06F17/00—Digital computing or data processing equipment or methods, specially adapted for specific functions
- G06F17/40—Data acquisition and logging
-
- G—PHYSICS
- G06—COMPUTING OR CALCULATING; COUNTING
- G06F—ELECTRIC DIGITAL DATA PROCESSING
- G06F2201/00—Indexing scheme relating to error detection, to error correction, and to monitoring
- G06F2201/86—Event-based monitoring
Definitions
- This application relates to a data collection device, a plant monitoring system and a data collection method.
- Japanese Patent Application Laid-Open No. 2019-8435 proposes a method of displaying both the alarm information of a device and the trend graph, which are displayed separately, on the display screen of the trend graph.
- the measured values are displayed in a trend graph by a method in which the horizontal axis is the measurement time.
- This publication also proposes a method of changing the display format of the trend graph during the period when a failure occurs in the device and an alarm occurs.
- the visibility of the trend graph with the measurement time on the horizontal axis as in the above-mentioned conventional technology may decrease.
- An example of a case where visibility is reduced is a trend graph of the results of inspection work that can be performed only when the plant operation is stopped.
- An example of inspection work that can be performed only when the plant operation is stopped is the motor winding insulation deterioration inspection that is carried out in steel plants and the like.
- the motor winding insulation deterioration inspection can be performed only when the plant operation is stopped, and the plant operation stop is planned at a frequency of, for example, about once a month based on the production plan of the plant.
- the measured value of such a motor winding insulation deterioration test is displayed as a trend graph with the horizontal axis as the measurement time, the visibility is reduced. This is because when the horizontal axis is the measurement time, a large amount of measured values are drawn during the plant operation stop period, but no measured values are drawn during the plant operation. Therefore, while a large amount of measured values are drawn only in a specific time range, the measured data are blank for a long period of time during plant operation. As a result, there is a problem that the visibility of the trend graph is deteriorated.
- the purpose of this application is to provide a data collection device, a plant monitoring system and a data collection method improved so as to improve visibility when graphing measurement data.
- the data collection device for this application is A measurement value collection unit that collects multiple measurement values, When the time difference between the times when the plurality of measured values are acquired is smaller than the predetermined time difference, the same event number is assigned to the plurality of measured values, and the time difference is equal to or greater than the specified time difference.
- the plant monitoring system for this application is A data collection device that collects multiple measurements measured during the inspection of plant equipment, A trend graph display unit that generates a trend graph from the plurality of measured values collected by the data collecting device, and With The data collection device A measurement value collection unit that collects the plurality of measurement values, When the time difference between the times when the plurality of measured values are acquired is smaller than the predetermined time difference, the same event number is assigned to the plurality of measured values, and the time difference is equal to or greater than the specified time difference.
- the trend graph display unit is constructed so as to draw the plurality of measured values stored in the measured value storage unit on a graph having the measured value as the first axis and the event number as the second axis. is there.
- the data collection method for this application is A measurement collection step that collects multiple measurements and A comparison determination step for comparing the time difference in which the plurality of measured values are acquired with a predetermined time difference, and When the time difference at which the plurality of measured values are acquired is smaller than the designated time difference, the same event number is assigned to the plurality of measured values, and when the time difference is greater than or equal to the designated time difference, the plurality of measured values are assigned.
- An event numbering step constructed to assign different event numbers to measurements, and A measurement value saving step for storing the plurality of measured values in a state in which the plurality of measured values are associated with the event number, and a measurement value saving step. To be equipped.
- a plurality of measurement values can be associated with each other based on the time difference of the measurement times, and the same event number can be assigned to the associated measurement values. This makes it possible to group a group of measured values measured at the same time by event number. According to the plant monitoring system according to the present application, the measured values in which such grouping is performed can be displayed for each event number in the trend graph, which has an advantage of improving the visibility of the user.
- n 1, 2, ... k-1, k, k + 1 ... k is an arbitrary integer.
- the subscript k and the subscript k + 1 are used to describe two consecutive time steps.
- the plant monitoring system of the embodiment is provided as a "motor insulation resistance tendency monitoring tool".
- the motor insulation resistance trend monitoring tool is a tool that automatically measures the insulation resistance between motor windings with an insulation resistance meter to check the insulation deterioration of the motor windings and displays the transition of the measured insulation resistance in a trend graph. is there.
- FIG. 1 is a diagram showing a configuration of a data collection device 100 and a plant monitoring system according to an embodiment.
- FIG. 1 shows the configuration and data flow of the plant monitoring system 101 and the data collection device 100.
- the plant monitoring system 101 according to the embodiment monitors the plant equipment 102.
- the plant equipment 102 includes an electric motor 103 and a megger 104.
- the megger 104 is an insulation resistance tester.
- the measured value D n is an electrical characteristic value measured in the motor winding insulation deterioration check included in the motor 103.
- the measurement value D n is assumed to be the current value.
- the plant monitoring system 101 includes a data collection device 100 and a trend graph display unit 7.
- the data collection device 100 collects a plurality of measured values D n measured at the time of inspection of the plant equipment.
- the trend graph display unit 7 generates a trend graph from a plurality of measured values D n collected by the data collecting device 100.
- the data collection device 100 includes a measurement value collection unit 1, an event number assignment unit 2, and a measurement value storage unit 4.
- the measured value collecting unit 1 automatically collects a plurality of measured values D n .
- the measurement value acquisition unit 1 in plant operation, or automatically when the plant shutdowns, or manually inspection work to collect measurements D n obtained by being implemented.
- the insulation resistance measurement between automatic motor windings during plant shutdowns are performed, the measurement value D n is assumed to be collected.
- the measured value collecting unit 1 collects a new measured value D k + 1 .
- a measurement time t k + 1 collected measurements collecting unit 1 is a new measurement value D k + 1 as a new measured value D k + 1, is transmitted to the measurement value grouping unit 2a.
- the value of the insulation resistance between the motor windings newly collected by the measured value collecting unit 1 is transmitted to the measured value grouping unit 2a.
- the event numbering unit 2 calculates the time difference ⁇ T at the time when the plurality of measured values D k and D k + 1 are acquired. When the time difference ⁇ T is smaller than the predetermined time difference Tth, the event number assigning unit 2 assigns the same event number #k to a plurality of measured values D k and D k + 1 . When the time difference ⁇ T is equal to or greater than the designated time difference Tth, the event number assigning unit 2 assigns different event numbers # k and # k + 1 to the plurality of measured values D k and D k + 1, respectively.
- the event number assignment unit 2 includes a measurement value grouping unit 2a, an event number generation unit 2b, an event number storage unit 2c, and a setting file 2d.
- the measured value grouping unit 2a receives the new measured value D k + 1 and the new measured time t k + 1 from the measured value collecting unit 1, the measured value grouping unit 2a reads the preset event number change condition from the setting file 2d. ..
- the event number change condition includes the specified time difference Tth.
- the measurement value storage unit 4 stores a plurality of measurement values D n in a state in which the plurality of measurement values D n and the event number # n are associated with each other. Specifically, when the measured value grouping unit 2a receives the new measured value D k + 1 and the measured time t k + 1 from the measured value collecting unit 1, the measured value grouping unit 2a receives the previous measured time t from the measured value storage unit 4. Read k .
- the measured value grouping unit 2a calculates the time difference ⁇ T between the new measurement time tk + 1 and the previous measurement time tk from the respective data obtained by the above processing.
- the measured value grouping unit 2a compares this time difference ⁇ T with the designated time difference Tth of the event number change condition.
- the measurement value grouping unit 2a When the time difference ⁇ T between measurements is equal to or greater than the specified time difference Tth of the event number change condition (that is, ⁇ T ⁇ Tth), the measurement value grouping unit 2a changes (updates) the event number to the event number generation unit 2b.
- the event number generation unit 2b When the event number generation unit 2b receives the event number setting flag F from the measurement value grouping unit 2a, the event number generation unit 2b reads the event number # k of the previous measurement value Dk from the measurement value storage unit 4.
- the event number storage unit 2c receives the event number for the measured value D k + 1 from the event number generation unit 2b.
- the event number to be received is either #k or #k + 1 as described above.
- the event number storage unit 2c assigns an event number of either #k or #k + 1 to the new measured value D k + 1 according to the event number sent from the event number generation unit 2b.
- the measured value storage unit 4 and the trend graph display unit 7 are connected via a wired communication network or a wireless communication network.
- the trend graph display unit 7 reads out a plurality of measured values D n , a plurality of measurement times t n, and a plurality of event numbers # n from the measured value storage unit 4.
- the measured value storage unit 4 and the trend graph display unit 7 may automatically communicate with each other. Specifically, an electronic file in which the measured value measured in the past (current value for calculating the insulation resistance between the motor windings), the measurement time t n by the megger 104, and the event number # n are recorded is received. It is passed and the contents of the electronic file are automatically read.
- each function in FIG. 1 is implemented by dividing it into two types of software.
- the measurement value collection unit 1, the measurement value grouping unit 2a, the setting file 2d, the measurement value storage unit 4, the event number generation unit 2b, and the event number storage unit 2c are implemented on the first software.
- the trend graph display unit 7 is implemented on the second software.
- the first software and the second software are installed on different computers.
- the computer in which the first software is installed constitutes the data collection device 100.
- the computer in which the second software is installed constitutes the trend graph display unit 7.
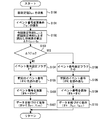
- FIG. 2 is a flowchart for explaining the operation of the data collecting device 100 according to the embodiment.
- step S100 measured value collecting step
- step S101 the event number change condition (designated time difference Tth) is read out.
- step S102 on the basis of the measurement time t k of the new measured value D k + 1 of the measuring time t k + 1 and the previous measurement value D k, the time difference ⁇ T is calculated according to the following formula (1).
- ⁇ T t k + 1 ⁇ t k ⁇ ⁇ ⁇ (1)
- step S103 compare determination step
- the time difference ⁇ T and the designated time difference Tth are compared.
- the event numbering steps steps S104 to S106, S108 to S109 are executed according to the comparison result.
- steps S104, S105, and S106 are executed in this order.
- steps S108, S105, and S109 are executed in this order.
- step S104 If the determination result in step S103 is ⁇ T ⁇ Tth, steps S104, S105, and S106 are executed in this order.
- the time difference ⁇ T is a more specified time difference Tth
- the measurement value D k event number #k is given
- event number # k + 1 is assigned to the measured value D k + 1.
- Measured value storing step (step S107, S110) stores a plurality of measurement values D n in the state in which marked string and a plurality of measurement values D n and event number #n. Specifically, in step S107 following step S106, the measured value D k + 1 this time is stored in association with the time t k + 1 and the updated event number # k + 1. Further, in the step S110 following the step S109, the measured value D k + 1 this time is stored in association with the time t k + 1 and the previous event number # k .
- inspection work of various plant equipment is carried out.
- the inspection work enables continuous and stable plant operation.
- the motor winding insulation deterioration inspection carried out in a steel plant is an important inspection work to prevent a ground fault of the motor, which can contribute to the shutdown of the plant operation.
- a megger that is, an insulation resistance tester
- the motor winding insulation deterioration inspection can be carried out only when the plant operation is stopped, and the plant operation stop is planned about once a month based on the production plan of the plant.
- the quality of the equipment to be inspected is judged by the measured value during one inspection work.
- the signs of failure appear slowly but are not defective according to the judgment criteria, and in such cases there is a problem that the failure is difficult to notice.
- a first comparative example in which the measured values of the motor winding insulation deterioration test are displayed in a trend graph with the horizontal axis as the measurement time can be considered.
- this first comparative example in the graph with the measurement time on the horizontal axis, a large amount of measured values are drawn during the plant operation stop period, but no measured values are drawn during the plant operation. Therefore, while a large amount of measured values are drawn only in a specific time range, the measured data are blank for a long period of time during plant operation. As a result, there is a problem that the visibility of the trend graph is deteriorated.
- the above second comparative example also has problems from other viewpoints.
- the current value is measured and the resistance value is calculated in a state where a high voltage is applied between the phases of the motor winding by an insulation resistance tester.
- One of the inspection items for deterioration of motor winding insulation is the temperature dependence of the motor winding. Trend so that you can compare the high temperature measurement value when the motor winding temperature is high immediately after the plant operation is stopped and the normal temperature measurement value when the motor winding temperature has dropped to near the temperature after the plant operation is stopped. It is preferable to display the graph.
- temperature information is missing in the event number display as in the second comparative example, there is a drawback that it is difficult to perform an intuitive comparison.
- grouping is performed by assigning the same event number # n to the measured values whose measurement time t n is close to some extent among the plurality of measured values D n. ing. Visibility can be improved by displaying the grouped measured values D n in an easy-to-understand manner on a graph.
- the measurement time t n and the event number # n are stored separately. Therefore, unlike the second comparative example described above, the embodiment has an advantage that not only time-series information for each event but also precise time information such as individual measurement times can be recorded and retained.
- FIG. 3 is an example of a trend graph created by the plant monitoring system according to the embodiment.
- FIG. 3 shows a trend graph display method focusing on individual measurement results.
- measurements D n is assumed to be the current value.
- the value of the insulation resistance can be calculated by converting this current measurement value by a predetermined conversion formula.
- a mode may be provided in which the insulation resistance value is displayed on the trend graph.
- the trend graph display unit 7 draws a plurality of measured values D n stored in the measured value storage unit 4 on the graph of FIG. 3 having the measured value D n as the first axis and the event number # n as the second axis. ..
- an xy Cartesian coordinate graph is created in which the first axis is the vertical axis and the second axis is the horizontal axis.
- the GUI (graphical user interface) button of the tool on which the trend graph display unit 7 is mounted is pressed, a screen including the trend graph window 8 is displayed.
- the trend graph window 8 the trend graph display area 9, the vertical axis legend 10, the vertical axis range 11, the horizontal axis legend 12, and the horizontal axis range 13 are displayed.
- the trend graph display area 9 a trend graph in which the current value between the motor windings and the event number #n are plotted on the two-dimensional coordinates is displayed according to the vertical axis range 11 and the horizontal axis range 13.
- the event number change condition may be set according to the difference in the operation stop time for each plant.
- the event number change condition is a designated time difference Tth.
- the event numbering unit 2 may be constructed so that a plurality of different values are set for the designated time difference Tth.
- a plurality of designated time differences Tth1, Tth2, Tth3 ... With different sizes may be selectively used according to the difference in the operation stop time for each plant.
- An appropriate designated time difference Tth can be set according to the installed plant operation stop time.
- the value of insulation resistance between motor windings is automatically measured multiple times within one plant operation stop time.
- the maximum measured value plot 14 and the minimum measured value plot 15 in the event number # 1 are connected by a straight line.
- the final measurement value plot 16 in the event number # 1 and the first measurement value plot 17 in the next event number # 2 are connected by a straight line.
- the display format switching button 18 when the display format switching button 18 is pressed, a process of changing the horizontal axis to the time is executed (see FIG. 5). By pressing the display format switching button 18 again after changing the horizontal axis to the time, the horizontal axis can be returned to the event number # D n .
- a plurality of measured values D n can be associated based on the time difference ⁇ T of the measurement times, and the same event number # n can be assigned to the associated measured values D n .
- the measured values D n related to each other can be displayed for each event number # n in the trend graph, so that the user can intuitively grasp the measurement result.
- the trend graph display unit 7 draws a plurality of measured values D n to which the same event number # n is assigned side by side in a direction orthogonal to the horizontal axis (that is, a direction parallel to the vertical axis). It may be constructed as follows.
- the trend graph display method for distinguishing a plurality of measured values D n to which the same event number # n is assigned from a plurality of measured values n to which another event number # n is assigned may be variously modified. As one of the variation examples, a plurality of measured values D n to which the same event number # n is assigned are separated from each other on the second axis from a plurality of measured values n to which another event number # n is assigned. These may be distinguished.
- This is a trend graph display method in which the spatial arrangement of measured values is separated on a graph, and the example shown in FIG. 3 is also a kind of this trend graph display method.
- a trend graph display method in which the symbols on the graph are different may be used. This means that multiple measured values D n with the same event number # n are entered in the graph with the first symbol, and multiple measured values n with other event numbers # n are given with the first symbol. It is a trend graph display method that distinguishes these by filling in the graph with different second symbols.
- a trend graph display method in which the display colors on the graph are different may be used. This draws a plurality of measured values D n with the same event number # n in the first color, and a plurality of measured values n assigned other event numbers # n are different from the first color. This is a trend graph display method that distinguishes between these by drawing in the second color.
- two or more methods may be combined: a grouping method that separates the spatial arrangements on the graph, a grouping method that uses different symbols, and a grouping method that uses different colors.
- the trend graph display unit 7 may be constructed so as to draw a line graph connecting a plurality of measured values D n in the order of acquisition time.
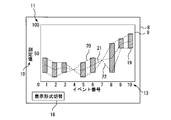
- FIG. 4 is another example of the trend graph created by the plant monitoring system according to the embodiment.
- FIG. 4 shows a trend graph display method focusing on the maximum value, the minimum value, and the average value.
- One of the inspection items for motor winding insulation deterioration inspection is the temperature dependence of the motor winding. It is preferable to display the trend graph so that the temperature dependence of the measured value can be visually recognized. That is, the measured values are the high temperature measured value when the motor winding temperature is high immediately after the plant operation is stopped and the low temperature measured value when the motor winding temperature is lowered to near the air temperature after the plant operation is stopped. Is included. It is preferable that the high temperature measured value and the low temperature measured value can be visually recognized separately so that the temperature dependence can be visually recognized.
- the process of displaying at least one of the measured value range 19 in the event, the measured maximum value trend graph 20, the measured average value trend graph 21, and the measured minimum value trend graph 22 is a trend graph display. It may be mounted in part 7.
- the trend graph display unit 7 may be constructed so as to draw the measured maximum value trend graph 20.
- the measurement maximum value trend graph 20 shows the maximum value among the plurality of measurement values D n to which the first event number # n is assigned and the second event following the first event number # n. It connects with the maximum value among a plurality of measured values D n to which the number # n is assigned.
- various statistical graphs such as a fitting function such as an approximate curve or a moving average line may be created based on each maximum value data, and this may be used as an approximate measurement maximum value trend graph.
- the trend graph display unit 7 may be constructed so as to draw the measurement minimum value trend graph 22.
- the measurement minimum value trend graph 22 shows the minimum value among the plurality of measurement values D n to which the first event number # n is assigned and the second event following the first event number # n. It connects with the minimum value among the plurality of measured values D n to which the number # n is assigned.
- various statistical graphs such as a fitting function such as an approximate curve or a moving average line may be created based on each minimum value data, and this may be used as an approximate measurement minimum value trend graph.
- the trend graph display unit 7 may be constructed so as to draw the measured average value trend graph 21.
- the measured mean value trend graph 21 shows the mean value among the plurality of measured values D n to which the first event number # n is assigned and the second event following the first event number # n. It connects with the average value among a plurality of measured values D n to which the number # n is assigned.
- various statistical graphs such as a fitting function such as an approximate curve or a moving average line may be created based on each mean value data, and this may be used as an approximate measurement mean value trend graph.
- the trend graph display unit 7 may be constructed so as to draw the in-event measurement value range 19.
- the in-event measurement value range 19 represents a range determined by the maximum value and the minimum value among a plurality of measurement values D n to which the same event number # n is assigned. According to the in-event measurement value range 19, it is possible to visually recognize how much the measured value has changed in one event.
- the in-event measurement value range 19 may be, for example, a bar graph as shown in FIG.
- FIG. 5 is another example of a trend graph created by the plant monitoring system according to the embodiment.
- the scale of the horizontal axis range 13a in FIG. 5 is the time t n .
- the trend graph display unit 7 is constructed so as to reversibly switch the unit of the horizontal axis between the event number #n and the time in response to the input operation of the switching instruction via the display format switching button 18. Good.
- the subscript n has been used for convenience of explanation, but the value of the subscript n is not always synchronized between the measured value D n , the time t n, and the event number # n. Absent.
- the number of event numbers # n may be sufficiently smaller than the number of measured values D n and time t n . For example, a large number of measured values D k-1 , D k , D k + 1, ... May be associated with one event number # k.
- measured values D n are the electrical characteristic value measured at the motor winding insulation deterioration inspection.
- the measurement value D n according to the embodiment is a current value.
- the data collection device 100 and the plant monitoring system 101 according to the embodiment can be diverted to different types of data acquisition, measurement D n is can be diverse modified.
- the measured value D n may be a measured value in another inspection item other than the motor winding insulation deterioration inspection.
- the measured value D n may be a physical characteristic value other than the electrical characteristic value (for example, a thermal characteristic value, a mechanical characteristic value, a magnetic characteristic value, a chemical characteristic value, or other characteristic value).
Landscapes
- Engineering & Computer Science (AREA)
- Physics & Mathematics (AREA)
- Theoretical Computer Science (AREA)
- General Physics & Mathematics (AREA)
- General Engineering & Computer Science (AREA)
- Databases & Information Systems (AREA)
- Data Mining & Analysis (AREA)
- Mathematical Physics (AREA)
- Computational Linguistics (AREA)
- Software Systems (AREA)
- Computing Systems (AREA)
- Fuzzy Systems (AREA)
- Probability & Statistics with Applications (AREA)
- Computer Hardware Design (AREA)
- Automation & Control Theory (AREA)
- Quality & Reliability (AREA)
- Testing And Monitoring For Control Systems (AREA)
- Tests Of Circuit Breakers, Generators, And Electric Motors (AREA)
Abstract
Description
複数の測定値を収集する測定値収集部と、
前記複数の測定値が取得された時刻の時刻差が予め定められた指定時間差よりも小さい場合には前記複数の測定値に同じイベント番号を付与し、前記時刻差が前記指定時間差以上である場合には前記複数の測定値に異なるイベント番号を付与するように構築されたイベント番号付与部と、
前記複数の測定値と前記イベント番号とを紐づけた状態で前記複数の測定値を保存する測定値保存部と、
を備える。
プラント機器の点検時に測定された複数の測定値を収集するデータ収集装置と、
前記データ収集装置で収集した前記複数の測定値からトレンドグラフを生成するトレンドグラフ表示部と、
を備え、
前記データ収集装置は、
前記複数の測定値を収集する測定値収集部と、
前記複数の測定値が取得された時刻の時刻差が予め定められた指定時間差よりも小さい場合には前記複数の測定値に同じイベント番号を付与し、前記時刻差が前記指定時間差以上である場合には前記複数の測定値に異なるイベント番号を付与するように構築されたイベント番号付与部と、
前記複数の測定値と前記イベント番号とを紐づけた状態で前記複数の測定値を保存する測定値保存部と、
を備え、
前記トレンドグラフ表示部は、前記測定値を第一軸とし前記イベント番号を第二軸としたグラフに前記測定値保存部に保存された前記複数の測定値を描画するように構築されたものである。
複数の測定値を収集する測定値収集ステップと、
前記複数の測定値が取得された時刻差と予め定められた指定時間差とを比較する比較判定ステップと、
前記複数の測定値が取得された時刻差が前記指定時間差よりも小さい場合には前記複数の測定値に同じイベント番号を付与し、前記時刻差が前記指定時間差以上である場合には前記複数の測定値に異なるイベント番号を付与するように構築されたイベント番号付与ステップと、
前記複数の測定値と前記イベント番号とを紐づけた状態で前記複数の測定値を保存する測定値保存ステップと、
を備える。
ΔT=tk+1-tk ・・・(1)
モータ巻線絶縁劣化試験の測定値を、横軸を測定時刻としたトレンドグラフで表示する第一比較例が考えられる。この第一比較例では、横軸を測定時刻としたグラフにおいて、プラント操業停止期間には大量の測定値が描画される一方、プラント操業中は測定値が全く描画されない。このため、特定の時間範囲にのみ大量の測定値が描画される一方、プラント操業中の長期間に渡って測定データが空白となる。その結果、トレンドグラフの視認性が悪くなる問題があった。
複数の測定値と複数のイベント番号とを一対一で対応づけしたうえで、横軸をイベント番号としたトレンドグラフを作成する第二比較例が考えられる。この場合、横軸が時間ではなくイベント番号となるので、プラント操業中の空白期間がトレンドグラフから省略される。従って、上記の第一比較例のような測定値の偏りを抑制することはできる。しかしながら、一回のプラント操業停止期間に実施された複数の点検結果は互いに関連性があるので、本来ならばグルーピングしておくことが好ましい。第二比較例では、イベント番号が順次付与されることで、関連性のある測定値のまとまりが消滅してしまうおそれがある。その結果、トレンドグラフに基づいて故障兆候を発見するための利便性が低下するという問題があった。
Claims (12)
- 複数の測定値を収集する測定値収集部と、
前記複数の測定値が取得された時刻の時刻差が予め定められた指定時間差よりも小さい場合には前記複数の測定値に同じイベント番号を付与し、前記時刻差が前記指定時間差以上である場合には前記複数の測定値に異なるイベント番号を付与するように構築されたイベント番号付与部と、
前記複数の測定値と前記イベント番号とを紐づけた状態で前記複数の測定値を保存する測定値保存部と、
を備えるデータ収集装置。 - プラント機器の点検時に測定された複数の測定値を収集するデータ収集装置と、
前記データ収集装置で収集した前記複数の測定値からトレンドグラフを生成するトレンドグラフ表示部と、
を備え、
前記データ収集装置は、
前記複数の測定値を収集する測定値収集部と、
前記複数の測定値が取得された時刻の時刻差が予め定められた指定時間差よりも小さい場合には前記複数の測定値に同じイベント番号を付与し、前記時刻差が前記指定時間差以上である場合には前記複数の測定値に異なるイベント番号を付与するように構築されたイベント番号付与部と、
前記複数の測定値と前記イベント番号とを紐づけた状態で前記複数の測定値を保存する測定値保存部と、
を備え、
前記トレンドグラフ表示部は、前記測定値を第一軸とし前記イベント番号を第二軸としたグラフに前記測定値保存部に保存された前記複数の測定値を描画するように構築されたプラント監視システム。 - 前記トレンドグラフ表示部は、同じ前記イベント番号が付与された前記複数の測定値を、前記第二軸と直交する方向に並べて描画するように構築された請求項2に記載のプラント監視システム。
- 前記トレンドグラフ表示部は、前記複数の測定値を取得時刻の順番で繋ぐ折れ線グラフを描画するように構築された請求項2または3に記載のプラント監視システム。
- 前記トレンドグラフ表示部は、第一イベント番号が付与された複数の測定値のなかの最大値と前記第一イベント番号の次の第二イベント番号が付与された複数の測定値のなかの最大値とを結ぶ測定最大値トレンドグラフを描画するように構築された請求項2~4のいずれか1項に記載のプラント監視システム。
- 前記トレンドグラフ表示部は、第一イベント番号が付与された複数の測定値のなかの最小値と前記第一イベント番号の次の第二イベント番号が付与された複数の測定値のなかの最小値とを結ぶ測定最小値トレンドグラフを描画するように構築された請求項2~5のいずれか1項に記載のプラント監視システム。
- 前記トレンドグラフ表示部は、第一イベント番号が付与された複数の測定値のなかの平均値と前記第一イベント番号の次の第二イベント番号が付与された複数の測定値のなかの平均値とを結ぶ測定平均値トレンドグラフを描画するように構築された請求項2~6のいずれか1項に記載のプラント監視システム。
- 前記トレンドグラフ表示部は、同じイベント番号が付与された複数の測定値のなかの最大値と最小値とを結ぶ棒グラフを描画するように構築された請求項2~7のいずれか1項に記載のプラント監視システム。
- 前記トレンドグラフ表示部は、切替指示の入力操作に応答して、前記第二軸の単位を前記イベント番号と時刻との間で切り替えるように構築された請求項2~8のいずれか1項に記載のプラント監視システム。
- 前記プラント機器は、電動機を含み、
前記測定値は、前記電動機が備えるモータ巻線の絶縁劣化点検で測定された電気特性値を含む請求項2~9のいずれか1項に記載のプラント監視システム。 - 前記イベント番号付与部は、前記指定時間差が可変に設定されるように構築された請求項2~10のいずれか1項に記載のプラント監視システム。
- 複数の測定値を収集する測定値収集ステップと、
前記複数の測定値が取得された時刻差と予め定められた指定時間差とを比較する比較判定ステップと、
前記複数の測定値が取得された時刻差が前記指定時間差よりも小さい場合には前記複数の測定値に同じイベント番号を付与し、前記時刻差が前記指定時間差以上である場合には前記複数の測定値に異なるイベント番号を付与するように構築されたイベント番号付与ステップと、
前記複数の測定値と前記イベント番号とを紐づけた状態で前記複数の測定値を保存する測定値保存ステップと、
を備えるデータ収集方法。
Priority Applications (7)
| Application Number | Priority Date | Filing Date | Title |
|---|---|---|---|
| JP2021528703A JP7099635B2 (ja) | 2019-06-25 | 2019-06-25 | データ収集装置、プラント監視システムおよびデータ収集方法 |
| CN201980049542.9A CN112513758B (zh) | 2019-06-25 | 2019-06-25 | 数据收集装置、成套设备监视系统以及数据收集方法 |
| US17/262,748 US12619622B2 (en) | 2019-06-25 | Data collection device, plant monitoring system and data collection method | |
| PCT/JP2019/025163 WO2020261383A1 (ja) | 2019-06-25 | 2019-06-25 | データ収集装置、プラント監視システムおよびデータ収集方法 |
| BR112021001101-3A BR112021001101B1 (pt) | 2019-06-25 | Sistema de monitoramento de planta | |
| TW109112645A TWI739391B (zh) | 2019-06-25 | 2020-04-15 | 資料收集裝置、設備監視系統及資料收集方法 |
| PH12021550186A PH12021550186A1 (en) | 2019-06-25 | 2021-01-25 | Data collection device, plant monitoring system and data collection method |
Applications Claiming Priority (1)
| Application Number | Priority Date | Filing Date | Title |
|---|---|---|---|
| PCT/JP2019/025163 WO2020261383A1 (ja) | 2019-06-25 | 2019-06-25 | データ収集装置、プラント監視システムおよびデータ収集方法 |
Publications (1)
| Publication Number | Publication Date |
|---|---|
| WO2020261383A1 true WO2020261383A1 (ja) | 2020-12-30 |
Family
ID=74060832
Family Applications (1)
| Application Number | Title | Priority Date | Filing Date |
|---|---|---|---|
| PCT/JP2019/025163 Ceased WO2020261383A1 (ja) | 2019-06-25 | 2019-06-25 | データ収集装置、プラント監視システムおよびデータ収集方法 |
Country Status (5)
| Country | Link |
|---|---|
| JP (1) | JP7099635B2 (ja) |
| CN (1) | CN112513758B (ja) |
| PH (1) | PH12021550186A1 (ja) |
| TW (1) | TWI739391B (ja) |
| WO (1) | WO2020261383A1 (ja) |
Cited By (1)
| Publication number | Priority date | Publication date | Assignee | Title |
|---|---|---|---|---|
| JP2023094213A (ja) * | 2021-12-23 | 2023-07-05 | 富士電機株式会社 | データ可視化装置、データ可視化方法、及びプログラム |
Citations (2)
| Publication number | Priority date | Publication date | Assignee | Title |
|---|---|---|---|---|
| JP2015146088A (ja) * | 2014-02-03 | 2015-08-13 | 三菱電機株式会社 | 統合維持管理システム |
| JP2018124697A (ja) * | 2017-01-31 | 2018-08-09 | オムロン株式会社 | 情報処理装置、情報処理プログラムおよび情報処理方法 |
Family Cites Families (16)
| Publication number | Priority date | Publication date | Assignee | Title |
|---|---|---|---|---|
| CN1186700C (zh) * | 2000-09-15 | 2005-01-26 | 先进微装置公司 | 半导体制造中用来改进控制的自调适取样方法 |
| JP4497058B2 (ja) * | 2005-08-24 | 2010-07-07 | 横河電機株式会社 | プラント監視システム |
| JP5032902B2 (ja) * | 2007-06-28 | 2012-09-26 | ルネサスエレクトロニクス株式会社 | 標準作業時間算出装置および標準作業時間算出方法 |
| US20130103656A1 (en) * | 2009-11-12 | 2013-04-25 | Onzo Limited | Event identification |
| GB2476927B (en) * | 2009-11-12 | 2012-01-11 | Onzo Ltd | Event identification |
| GB2491109B (en) * | 2011-05-18 | 2014-02-26 | Onzo Ltd | Identification of a utility consumption event |
| CN104272687B (zh) * | 2012-03-07 | 2017-10-24 | 思睿逻辑国际半导体有限公司 | 信号转换系统及方法 |
| US9098891B2 (en) * | 2013-04-08 | 2015-08-04 | Kla-Tencor Corp. | Adaptive sampling for semiconductor inspection recipe creation, defect review, and metrology |
| US9366713B2 (en) * | 2013-05-23 | 2016-06-14 | Pentair Thermal Management Llc | Arc fault detection system and method |
| US10545986B2 (en) * | 2013-12-27 | 2020-01-28 | General Electric Company | Systems and methods for dynamically grouping data analysis content |
| JP2016157313A (ja) * | 2015-02-25 | 2016-09-01 | 東芝三菱電機産業システム株式会社 | 鉄鋼プラントの傾向監視装置 |
| JP6515937B2 (ja) * | 2017-02-08 | 2019-05-22 | 横河電機株式会社 | イベント解析装置、イベント解析システム、イベント解析方法、イベント解析プログラム、および記録媒体 |
| JP6886870B2 (ja) * | 2017-06-09 | 2021-06-16 | 株式会社日立製作所 | プラント運転監視システム及びプラント運転監視方法 |
| JP2019008435A (ja) * | 2017-06-22 | 2019-01-17 | アズビル株式会社 | トレンドグラフ表示装置 |
| JP2019102037A (ja) * | 2017-11-30 | 2019-06-24 | 東芝Itコントロールシステム株式会社 | プラント監視装置およびプラント監視方法 |
| US10497475B2 (en) * | 2017-12-01 | 2019-12-03 | Verily Life Sciences Llc | Contextually grouping sensor channels for healthcare monitoring |
-
2019
- 2019-06-25 WO PCT/JP2019/025163 patent/WO2020261383A1/ja not_active Ceased
- 2019-06-25 JP JP2021528703A patent/JP7099635B2/ja active Active
- 2019-06-25 CN CN201980049542.9A patent/CN112513758B/zh active Active
-
2020
- 2020-04-15 TW TW109112645A patent/TWI739391B/zh active
-
2021
- 2021-01-25 PH PH12021550186A patent/PH12021550186A1/en unknown
Patent Citations (2)
| Publication number | Priority date | Publication date | Assignee | Title |
|---|---|---|---|---|
| JP2015146088A (ja) * | 2014-02-03 | 2015-08-13 | 三菱電機株式会社 | 統合維持管理システム |
| JP2018124697A (ja) * | 2017-01-31 | 2018-08-09 | オムロン株式会社 | 情報処理装置、情報処理プログラムおよび情報処理方法 |
Cited By (1)
| Publication number | Priority date | Publication date | Assignee | Title |
|---|---|---|---|---|
| JP2023094213A (ja) * | 2021-12-23 | 2023-07-05 | 富士電機株式会社 | データ可視化装置、データ可視化方法、及びプログラム |
Also Published As
| Publication number | Publication date |
|---|---|
| US20210141787A1 (en) | 2021-05-13 |
| TWI739391B (zh) | 2021-09-11 |
| CN112513758B (zh) | 2024-08-02 |
| TW202102953A (zh) | 2021-01-16 |
| JP7099635B2 (ja) | 2022-07-12 |
| CN112513758A (zh) | 2021-03-16 |
| PH12021550186A1 (en) | 2022-02-14 |
| BR112021001101A2 (pt) | 2022-01-18 |
| JPWO2020261383A1 (ja) | 2021-10-28 |
Similar Documents
| Publication | Publication Date | Title |
|---|---|---|
| US9037273B2 (en) | Operator terminal in a process control system | |
| EP2458467B1 (en) | Method and system for monitoring an industrial system | |
| US20050246119A1 (en) | Event occurrence graph | |
| JP5866446B2 (ja) | グラフ描画装置、グラフ描画方法、工程管理システム、工程管理方法、制御プログラムおよび可読記憶媒体 | |
| JP2009070052A (ja) | 監視装置及びプログラム | |
| KR20210118016A (ko) | 데이터 처리 방법, 데이터 처리 장치, 및 데이터 처리 프로그램을 기록한 컴퓨터 판독 가능한 기록 매체 | |
| CN115640860B (zh) | 一种工业云服务的机电设备远程维护方法及系统 | |
| KR101233264B1 (ko) | 섹터 그래프 기반 플랜트 및 건축물 설비 운영상태 감시 장치 및 방법 | |
| JP2019096238A (ja) | 監視状態表示装置、監視状態表示方法、および、監視状態表示プログラム | |
| CA3007463A1 (en) | Display method, display program, and display control device | |
| CN118687632B (zh) | 一种基于数据分析的煤矿机电设备运行状态监测系统 | |
| CN104166941B (zh) | 一种用于电网潮流图的告警信息可视化方法及其系统 | |
| JP7099635B2 (ja) | データ収集装置、プラント監視システムおよびデータ収集方法 | |
| WO2018097062A1 (ja) | プラント管理装置、プラント管理方法、およびプログラム | |
| TW201926132A (zh) | 監視狀態顯示裝置、監視狀態顯示方法、及監視狀態顯示程式 | |
| CN103914033B (zh) | 监视和控制现场设备的方法和控制设备 | |
| US12619622B2 (en) | Data collection device, plant monitoring system and data collection method | |
| CN108321925B (zh) | 低压配电系统的监控方法和系统 | |
| BR112021001101B1 (pt) | Sistema de monitoramento de planta | |
| CN108490267B (zh) | 一种电力设备在线监测数据的展示系统 | |
| CN114509175B (zh) | 一种温升检测中温度稳定的判定方法及温升自动检测装置 | |
| KR102783471B1 (ko) | 지하철의 전력 관련 사고 이벤트를 모니터링하고 시각화하는 전력 관제 방법 및 그 시스템 | |
| CN109828146A (zh) | 一种通过设备电参数ad采样判断设备工况的方法 | |
| EP3623892A1 (en) | Anomaly assessment device, anomaly assessment method, and anomaly assessment program | |
| CN117353462A (zh) | 一种基于人工智能的电网运营监控分析方法及平台 |
Legal Events
| Date | Code | Title | Description |
|---|---|---|---|
| REG | Reference to national code |
Ref country code: BR Ref legal event code: B01A Ref document number: 112021001101 Country of ref document: BR |
|
| 121 | Ep: the epo has been informed by wipo that ep was designated in this application |
Ref document number: 19935725 Country of ref document: EP Kind code of ref document: A1 |
|
| ENP | Entry into the national phase |
Ref document number: 2021528703 Country of ref document: JP Kind code of ref document: A |
|
| NENP | Non-entry into the national phase |
Ref country code: DE |
|
| ENP | Entry into the national phase |
Ref document number: 112021001101 Country of ref document: BR Kind code of ref document: A2 Effective date: 20210121 |
|
| 122 | Ep: pct application non-entry in european phase |
Ref document number: 19935725 Country of ref document: EP Kind code of ref document: A1 |