WO2020218145A1 - Spring-back amount divergence origin site specification method and device - Google Patents
Spring-back amount divergence origin site specification method and device Download PDFInfo
- Publication number
- WO2020218145A1 WO2020218145A1 PCT/JP2020/016698 JP2020016698W WO2020218145A1 WO 2020218145 A1 WO2020218145 A1 WO 2020218145A1 JP 2020016698 W JP2020016698 W JP 2020016698W WO 2020218145 A1 WO2020218145 A1 WO 2020218145A1
- Authority
- WO
- WIPO (PCT)
- Prior art keywords
- springback
- stress
- distribution
- molded product
- analysis
- Prior art date
Links
Images


Classifications
-
- B—PERFORMING OPERATIONS; TRANSPORTING
- B21—MECHANICAL METAL-WORKING WITHOUT ESSENTIALLY REMOVING MATERIAL; PUNCHING METAL
- B21D—WORKING OR PROCESSING OF SHEET METAL OR METAL TUBES, RODS OR PROFILES WITHOUT ESSENTIALLY REMOVING MATERIAL; PUNCHING METAL
- B21D22/00—Shaping without cutting, by stamping, spinning, or deep-drawing
- B21D22/20—Deep-drawing
- B21D22/24—Deep-drawing involving two drawing operations having effects in opposite directions with respect to the blank
-
- B—PERFORMING OPERATIONS; TRANSPORTING
- B30—PRESSES
- B30B—PRESSES IN GENERAL
- B30B15/00—Details of, or accessories for, presses; Auxiliary measures in connection with pressing
- B30B15/26—Programme control arrangements
-
- B—PERFORMING OPERATIONS; TRANSPORTING
- B21—MECHANICAL METAL-WORKING WITHOUT ESSENTIALLY REMOVING MATERIAL; PUNCHING METAL
- B21D—WORKING OR PROCESSING OF SHEET METAL OR METAL TUBES, RODS OR PROFILES WITHOUT ESSENTIALLY REMOVING MATERIAL; PUNCHING METAL
- B21D22/00—Shaping without cutting, by stamping, spinning, or deep-drawing
- B21D22/02—Stamping using rigid devices or tools
-
- B—PERFORMING OPERATIONS; TRANSPORTING
- B21—MECHANICAL METAL-WORKING WITHOUT ESSENTIALLY REMOVING MATERIAL; PUNCHING METAL
- B21D—WORKING OR PROCESSING OF SHEET METAL OR METAL TUBES, RODS OR PROFILES WITHOUT ESSENTIALLY REMOVING MATERIAL; PUNCHING METAL
- B21D22/00—Shaping without cutting, by stamping, spinning, or deep-drawing
- B21D22/20—Deep-drawing
- B21D22/30—Deep-drawing to finish articles formed by deep-drawing
-
- G—PHYSICS
- G01—MEASURING; TESTING
- G01B—MEASURING LENGTH, THICKNESS OR SIMILAR LINEAR DIMENSIONS; MEASURING ANGLES; MEASURING AREAS; MEASURING IRREGULARITIES OF SURFACES OR CONTOURS
- G01B21/00—Measuring arrangements or details thereof, where the measuring technique is not covered by the other groups of this subclass, unspecified or not relevant
- G01B21/20—Measuring arrangements or details thereof, where the measuring technique is not covered by the other groups of this subclass, unspecified or not relevant for measuring contours or curvatures, e.g. determining profile
-
- G—PHYSICS
- G06—COMPUTING; CALCULATING OR COUNTING
- G06F—ELECTRIC DIGITAL DATA PROCESSING
- G06F30/00—Computer-aided design [CAD]
- G06F30/10—Geometric CAD
-
- G—PHYSICS
- G06—COMPUTING; CALCULATING OR COUNTING
- G06F—ELECTRIC DIGITAL DATA PROCESSING
- G06F30/00—Computer-aided design [CAD]
- G06F30/20—Design optimisation, verification or simulation
- G06F30/23—Design optimisation, verification or simulation using finite element methods [FEM] or finite difference methods [FDM]
-
- G—PHYSICS
- G06—COMPUTING; CALCULATING OR COUNTING
- G06F—ELECTRIC DIGITAL DATA PROCESSING
- G06F2113/00—Details relating to the application field
- G06F2113/24—Sheet material
-
- G—PHYSICS
- G06—COMPUTING; CALCULATING OR COUNTING
- G06F—ELECTRIC DIGITAL DATA PROCESSING
- G06F2119/00—Details relating to the type or aim of the analysis or the optimisation
- G06F2119/14—Force analysis or force optimisation, e.g. static or dynamic forces
Definitions
- the present invention relates to a method and an apparatus for identifying a portion of the press-molded product that causes a discrepancy between the springback amount of the press-molded product of the actual panel and the springback amount of the CAE analysis.
- the springback (SB) effective stress is calculated from the residual stress before mold release and the residual stress after mold release, and the SB effective stress is used.
- a method for performing a more appropriate evaluation by performing factor analysis is disclosed.
- the above method performs springback analysis from the stress state calculated from the data setting in CAE analysis.
- Patent Document 3 the measured three-dimensional shape created by actually measuring the surface shape of the press-molded molded product is incorporated into the CAE analysis, and the measured three-dimensional shape is in the bottom dead point state of molding by the mold model.
- a method for performing a more accurate evaluation is disclosed by performing a mechanical analysis of the state of being sandwiched between the two to obtain a stress distribution state and performing a factor analysis using the stress distribution state.
- JP-A-2007-229724 Japanese Unexamined Patent Publication No. 2012-206158 Japanese Unexamined Patent Publication No. 2013-71120
- the shape may be different from the shape expected by the countermeasures taken for the actual press-molded product. This is because the molding load assumed in the CAE analysis is not applied to the metal plate due to the shape of the mold used for press molding and various molding conditions, or the CAE analysis accurately determines the stress state before mold release. It can happen when it cannot be reproduced. In such a case, it is necessary to adjust the mold and molding conditions used for press molding, and to review the settings in CAE analysis and the mold shape.
- Patent Documents 1 to 3 specify the part that causes the springback itself to occur, and do not specify the part that causes the difference between the CAE analysis and the actual springback amount.
- the present invention has been made to solve the above problems, and is a portion of the press-molded product that causes a discrepancy between the springback amount of the press-molded product of the actual panel and the springback amount of the CAE analysis. It is an object of the present invention to provide a method and an apparatus for identifying a part of a springback amount divergence factor that identifies
- a springback analysis was performed on a springback amount generated in a press-molded product obtained by press-molding an actual panel and an analysis model having the same shape as the press-molded product.
- the part in the molded product shape that causes the discrepancy is specified, and the tertiary surface shape obtained by measuring the surface shape of the press-molded product after mold release is obtained.
- a press-molded product model is created from the original shape measurement data, a mechanical analysis is performed with the press-molded product model sandwiched by a mold model up to the bottom dead point, and the stress distribution at the bottom dead point of molding is determined by the press-molded product.
- the molded product drive stress distribution acquisition step to be acquired as the drive stress distribution that contributed to the springback, and the bottom dead point stress distribution and the residual stress distribution after mold release in the springback analysis are acquired and separated from the bottom dead point stress distribution.
- the analysis drive stress distribution acquisition step for acquiring the difference of the residual stress distribution after the mold as the drive stress distribution in the springback analysis, the analysis drive stress distribution acquired in the analysis drive stress distribution acquisition step, and the molded product drive stress distribution acquisition step.
- the springback amount divergence factor part that identifies the part in the molded product shape that causes the divergence between the press-molded product and the springback amount in the springback analysis. It has specific steps.
- the change of the stress difference value in the change stress difference springback amount acquisition step eliminates the component in at least one direction with respect to the stress difference distribution. It is either multiplied by a constant, added by a constant, multiplied by a constant, replaced with the average value in the plate thickness direction of the work material, or replaced with the median value in the plate thickness direction of the work material.
- the springback amount divergence factor site identification device performs springback analysis on the springback amount generated in the press-molded product obtained by press-molding the actual panel and the analysis model having the same shape as the press-molded product.
- the part in the molded product shape that causes the discrepancy is specified, and the tertiary surface shape obtained by measuring the surface shape of the press-molded product after mold release is obtained.
- a press-molded product model is created from the original shape measurement data, a mechanical analysis is performed with the press-molded product model sandwiched by a mold model up to the bottom dead point, and the stress distribution at the bottom dead point of molding is determined by the press-molded product.
- the molded product drive stress distribution acquisition means acquired as the drive stress distribution that contributed to the springback, and the bottom dead point stress distribution and the residual stress distribution after mold release in the springback analysis are acquired and separated from the bottom dead point stress distribution.
- Analytical drive stress distribution acquisition means that acquires the difference of residual stress distribution after molding as the drive stress distribution in springback analysis, analysis drive stress distribution acquired by the analysis drive stress distribution acquisition means, and the molded product drive stress distribution acquisition means.
- a stress difference distribution setting means for acquiring the stress difference distribution from the difference in the driven stress distribution of the molded product acquired in the above and setting the stress difference distribution to the shape of the molded product at the bottom dead point in the springback analysis, and the set stress.
- the stress difference springback amount acquisition means for acquiring the springback amount by performing springback analysis based on the difference distribution and the stress difference distribution set by the stress difference distribution setting means, the stress difference in a part of the region.
- the change of the value of the stress difference in the modified stress difference springback amount acquisition means eliminates the component in at least one direction with respect to the stress difference distribution. It is either multiplied by a constant, added by a constant, multiplied by a constant, replaced with the average value in the plate thickness direction of the work material, or replaced with the median value in the plate thickness direction of the work material.
- the present invention it is possible to identify a portion that causes a discrepancy between the springback analysis by CAE analysis and the amount of springback that occurs in the actual molded product, so that the actual press molding die and molding conditions are adjusted. It is possible to reduce the work load and improve the usefulness of springback countermeasures using CAE analysis.
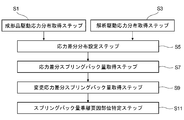
- FIG. 1 is a flow chart showing a processing flow of a method for identifying a portion of a springback amount divergence factor according to the first embodiment.
- FIG. 2 is a diagram illustrating a press-molded product according to the first embodiment.
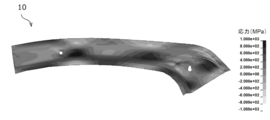
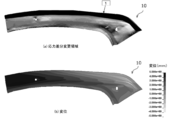
- FIG. 3 is a diagram showing a driving stress distribution in the CAE analysis in the first embodiment.
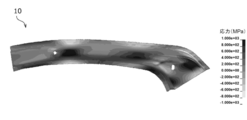
- FIG. 4 is a diagram showing a driving stress distribution in an actual panel in the first embodiment.
- FIG. 5 is a diagram showing the driving stress distribution (a) in the CAE analysis, the driving stress distribution (b) in the actual panel, and the driving stress difference distribution (c) in the CAE analysis and the actual panel in the first embodiment. is there.
- FIG. 1 is a flow chart showing a processing flow of a method for identifying a portion of a springback amount divergence factor according to the first embodiment.
- FIG. 2 is a diagram illustrating a press-molded product according to the first embodiment.
- FIG. 3 is a diagram showing a driving stress distribution in the CA
- FIG. 6 is a diagram showing a driving stress difference distribution (a) of a CAE analysis and an actual panel, and a displacement (b) calculated by a springback analysis based on the driving stress difference distribution.
- FIG. 7 is a diagram showing an analysis result of a fixed point in the springback analysis in the first embodiment and a displacement obtained by the springback analysis.
- FIG. 8 is a diagram illustrating a method of calculating a swing amount and a splash amount, which are springback amounts in the first embodiment.
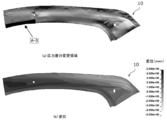
- FIG. 9 is a diagram illustrating region division of the molded product in the first embodiment.
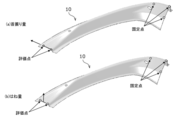
- FIG. 10 is a diagram showing a region (a) in which the stress difference is changed and a displacement (b) in which the stress difference in the region is changed and calculated by springback analysis in the first embodiment (No.
- FIG. 11 is a diagram showing a region (a) in which the stress difference is changed and a displacement (b) in which the stress difference in the region is changed and calculated by springback analysis in the first embodiment (No. 2).
- FIG. 12 is a diagram showing a region (a) in which the stress difference is changed and a displacement (b) in which the stress difference in the region is changed and calculated by springback analysis in the first embodiment (No. 3).
- FIG. 13 is a diagram showing a region (a) in which the stress difference is changed and a displacement (b) in which the stress difference in the region is changed and calculated by springback analysis in the first embodiment (No. 4). .. FIG. FIG.
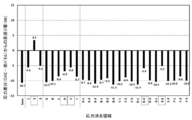
- FIG. 14 is a graph showing the relationship between the region in which the stress difference is eliminated and the swing amount generated by the springback when the stress difference is eliminated in the first embodiment.
- FIG. 15 is a graph showing the relationship between the region where the stress difference is eliminated and the amount of splash generated by the springback when the stress difference is eliminated in the first embodiment.
- FIG. 16 is a graph showing a region in which the stress distribution at the bottom dead center of the CAE analysis is replaced with the stress distribution of the actual panel, and the amount of deviation between the CAE analysis and the swing of the actual panel when the stress distribution is changed.
- FIG. 17 is a graph showing a region in which the stress distribution at the bottom dead center of the CAE analysis is replaced with the stress distribution of the actual panel, and the amount of deviation between the CAE analysis and the splash of the actual panel when the stress distribution is changed.
- FIG. 18 is a block diagram for explaining the configuration of the springback amount divergence factor site specifying device according to the second embodiment.
- the cause of the discrepancy in the amount of springback may be the difference between the stress that contributed to springback in the CAE analysis and the stress that contributed to springback in the actual panel.
- the stresses that contributed to the springback for each of the CAE analysis and the actual panel of the press-formed product 10 having the hat cross-sectional shape shown in FIG. 2 (hereinafter, also referred to as driving stress distribution).
- the stress difference distribution the difference between the driving stress distribution in the CAE analysis and the driving stress distribution in the actual panel
- the stress difference distribution is replaced with the stress distribution at the molding bottom dead point in the CAE analysis to replace the spring. Back analysis was performed (the driving stress calculation method will be described in detail in the embodiment described later).
- the swing amount which is the displacement amount of the end portion in the longitudinal direction in the plate width direction
- the splash amount which is the displacement amount in the molding stroke direction (see FIG. 8)
- Table 1 shows the results of comparison with the difference (displacement amount) in the springback amount of.
- the “bottom dead center” indicates a state in which the punch and the die are in contact with each other with the blank sandwiched between them (in the CAE analysis, the molding is completed).
- the “bottom dead center of molding” indicates a state in which molding is completed with an actual press die.
- the “dead center under analysis” indicates a state in which molding in CAE analysis is completed.
- the springback amount dissociates. This is to specify a part in the shape of the molded product that causes the occurrence.
- a molded product drive stress distribution acquisition step S1 an analysis drive stress distribution acquisition step S3, a stress difference distribution setting step S5, a stress difference springback amount acquisition step S7, and a modified stress difference springback amount.
- the acquisition step S9 and the springback amount deviation factor portion identification step S11 are provided.
- FIG. 2 a press forming analysis is performed in which the blank model 9 which is the work material (steel plate) is sandwiched by the mold model 3 including the die 5 and the punch 7.
- the press molding analysis as shown in FIG. 2, the blank model 9 is fixed in the molding process by a positioning pin, the element size of the blank model 9 is about 1 mm, and the blank model 9 and the mold model 3 are used as analysis conditions.
- the coefficient of friction between them was 0.15, and the bottom dead point position of molding was set to the position where the gap of the upper and lower mold models was 1.45 mm.
- the work material was a 980 MPa class GA steel sheet with a thickness of 1.4 mm. It is assumed that the actual panel in the present embodiment is formed by press molding under the same conditions as the molding conditions set in the CAE analysis.
- the molded product driving stress distribution acquisition step S1 is a step of acquiring the driving stress distribution of the actual panel.
- the actual panel is molded by press molding under the same molding conditions as those set in the CAE analysis as described above.
- a press-molded product model is created from the three-dimensional shape measurement data obtained by measuring the surface shape of the actual panel after the mold is released, and the press-molded product model is molded by the mold model 3 shown in FIG.
- the stress distribution as shown in FIG. 4 is obtained by performing a mechanical analysis in a state of being sandwiched to the dead center.
- Elastic finite element analysis is performed as the above mechanical analysis.
- the stress distribution obtained by the elastic finite element analysis corresponds to the stress contributing to the springback of the actual panel, that is, the driving stress of the actual panel.
- Patent Document 3 As a specific method for measuring the three-dimensional shape of the actual panel, creating a press-formed product model, and analyzing the elastic finite element, for example, the method described in Patent Document 3 can be used.
- the analysis driving stress distribution acquisition step S3 is a step of acquiring the bottom dead point stress distribution in the CAE analysis (springback analysis) and the residual stress after the mold release, respectively, and acquiring the driving stress in the CAE analysis from the difference.
- the stress at the bottom dead center of the press-molded product affects the behavior of the springback, the stress remains in the press-molded product after the mold is released from the mold. That is, it is considered that not all the stresses before the mold release contributed to the springback, and the stress remaining in the press-formed product in which the springback after the mold release occurred did not contribute to the springback. It is necessary to calculate the driving stress in the CAE analysis in order to perform an accurate comparative analysis with the driving stress (stress contributing to the springback) acquired in the molded product driving stress distribution acquisition step S1.
- CAE analysis is performed using the mold model 3 and the blank model 9 shown in FIG. 2, and the stress of the press-formed product before the mold release (bottom dead point) and after the mold release are performed.
- the driving stress distribution in the CAE analysis as shown in FIG. 3 (hereinafter, simply stress) (Also called distribution) is calculated.
- the computer performs CAE analysis.
- CAE analysis for example, finite element method analysis software can be used.
- analysis is performed by executing LS-DYNA Ver.971 which is commercially available finite element method analysis software on a computer, and a dynamic explicit method is applied to the solver.
- the present invention is not limited to the one using the mold model 3 as shown in FIG. 2 and the one for which the press-molded product 10 having a hat cross-sectional shape is the molding target, and the mold model, the press-molded product, etc. Can be set as appropriate. Furthermore, if the residual stress after mold release is a small value that can be almost ignored, it is considered that the entire stress distribution at the bottom dead center of the analysis contributes to springback, and the stress distribution at the bottom dead center is analyzed. It may be a distribution.
- the stress difference distribution setting step S5 includes the stress distribution (FIGS. 3 and 5 (a)) calculated in the analysis drive stress distribution acquisition step S3 and the stress calculated in the molded product drive stress distribution acquisition step S1.
- the difference in stress magnitude is shown by shades of color.
- FIG. 5 (c) shows that the range width of the color display is set smaller than that of FIGS. 5 (a) and 5 (b). By doing so, it is easier to distinguish between a part having a large stress difference (a part close to black or white) and a part having a small stress difference (a part close to the grayscale intermediate color on the right side of the figure).
- the stress difference springback amount acquisition step S7 is a step of performing a springback analysis using the stress difference distribution set in the stress difference distribution setting step S5 and calculating the springback amount generated there.
- a springback analysis is performed on a press-formed product 10 (FIG. 6A) having a bottom dead center shape in which a stress difference distribution is set, and the displacement after springback is performed by the springback analysis (FIG. 6). 6 (b)) is calculated.
- the springback analysis as shown in FIG. 7, three points provided on one end side of the molded product were fixed at fixed points, and the displacement due to the springback was calculated.
- the swing amount (FIG. 8 (a)) and the splash amount (FIG. 8 (b)) were calculated based on the displacement calculated by the springback analysis.
- the swing amount is moved in the direction of the arrow in the figure by the springback of either of the two evaluation points provided on the other end side of the press-molded product 10.
- the amount (the direction of the arrow is positive) and the amount of splash are the amount of displacement in the molding stroke direction at the midpoint of the two evaluation points (the direction away from the die 5 is positive). ..
- ⁇ Change stress difference springback amount acquisition step> the value of the stress difference of a part of the stress difference distribution set in the stress difference distribution setting step S5 is changed, and the changed stress difference distribution ( This is a step of performing a springback analysis from the modified stress difference distribution) and calculating the amount of springback generated there.
- the press-formed product 10 is divided into a plurality of regions (6 divisions A to F in the longitudinal direction and 3 divisions 1 to 3 in the width direction), and stress in each region. Eliminate the difference, that is, set the stress difference value to zero.
- the region for eliminating the stress difference does not necessarily have to be one region, and the stress difference in a plurality of regions may be eliminated.
- a springback analysis is performed to calculate the swing amount and the splash amount shown in FIG. 8 as the springback amount.
- the stress difference in the region 1 was eliminated from the stress difference distribution set in the stress difference distribution setting step S5 (the value of the stress difference was zero), and the springback analysis was performed to calculate.
- the displacement is shown.
- the springback amount (swing amount, splash amount) was calculated based on the calculated displacement.
- the springback amount was calculated in the same manner for the regions 2 and 3 (not shown).
- the stress difference in the region A is eliminated from the stress difference distribution set in the stress difference distribution setting step S5 (the value of the stress difference is zero), and springback analysis is performed. (See FIG. 11B) is shown.
- the springback amount (swing amount, splash amount) was calculated based on the calculated displacement.
- the springback amount was calculated in the same manner for the regions B to F (not shown).
- FIGS. 12 and 13 the stress differences in the regions A-1 and A-3 (see FIGS. 12A and 13A) are deleted from the stress difference distribution set in the stress difference distribution setting step S5. (The value of the stress difference is set to zero), and the displacement calculated by performing the springback analysis (see FIGS. 12 (b) and 13 (b)) is shown.
- the springback amount (swing amount, splash amount) was calculated based on the calculated displacement.
- the springback amount was calculated in the same manner for the regions A-1 to F-3 (not shown).
- the springback amount divergence factor site identification step S11 deviates from the springback amount in the CAE analysis and the actual panel based on the springback amount calculated in the stress difference springback amount acquisition step S7 and the changed stress difference springback amount acquisition step S9. It is a step to identify the part that causes the occurrence of.
- FIG. 14 shows the results of the swing amount calculated in the stress difference springback amount acquisition step S7 and the changed stress difference springback amount acquisition step S9.
- base is the amount of swing due to the stress difference distribution in which stress elimination is not performed, and 1 to 3, A to F, and A-1 to F-3 are altered stresses in which the stress difference in each region is eliminated. It is the amount of swing due to the difference distribution.
- the swing amount (base) when the stress difference is not changed is -10.7 mm.
- the swing amount of the stress scavenging regions 1 to 3 it can be seen that only the region 2 has a larger change from the base than the regions 1 and 3.
- the amount of swing of the stress scavenging regions A to F it can be seen that the regions D and E have a larger change from the base than the other regions.
- the swing amounts of regions D-2 and E-2 perform stress elimination. It can be seen that it is reduced compared to the base that is not.
- the fact that the swing amount is reduced by eliminating the stress difference in a certain region indicates that the region has a great influence on the deviation of the swing amount. This is a reasonable result because the changes were large in the above-mentioned areas 2 and D and E, and the areas D-2 and E-2 caused a discrepancy between the CAE analysis and the swing amount of the actual panel. It can be specified as the part to be caused.
- the amount of splash (base) when the stress difference is not changed is 4.2 mm.
- region 2 when looking at the amount of splash in the stress scavenging regions 1 to 3, only region 2 (-8.3 mm) has a larger change from base than region 1 (4.8 mm) and region 3 (7.5 mm). You can see that.
- looking at the amount of splash in the areas A to F of the stress elimination region it can be seen that the area D (-2.9 mm) and the area F (-0.9 mm) have a larger change from the base than the other areas. ..
- the amount of splash (0.1 mm) in region F-2 is stress-eliminating. It is greatly reduced compared to the base without base, and it can be seen that almost no splash occurs. Similar to the swing amount, the reduction of the splash amount by eliminating the stress difference in a certain region indicates that the region has a great influence on the deviation of the splash amount. This is a reasonable result because the change in the amount of splashing was large in the area 2 and the area F, and it is considered that the area F-2 is a site that causes a discrepancy between the CAE analysis and the amount of splashing in the actual panel. Can be identified.
- Areas 2 and D also had a large change from the base, but the results when the stress in the subdivided area D-2 was eliminated showed that the amount of splash was -4.6 mm, and stress elimination was not performed. Compared to the 4.2mm splash amount of the base, the splash direction is opposite and the splash amount is increased. This indicates that the region is a region where the amount of splash is more likely to be dissociated by eliminating the stress difference in the region D-2. That is, it is determined that the region D-2 is a portion that suppresses the deviation of the splash amount due to the stress difference, and is not a portion that causes the deviation.
- the amount of springback when stress elimination is performed in all of the subdivided regions A-1 to F-3 is calculated, but as described above. From the results of regions 1 to 3 and regions A to F, it is possible to narrow down the regions that are expected to have a large influence, so that the results when only those regions are further subdivided may be obtained. Press-formed products having complicated shapes need to be further subdivided by increasing the number of divided regions, and it takes time to obtain results in all the subdivided regions. Therefore, it is possible to shorten the time from the large region division to the identification of the dissociation factor site by performing the analysis while narrowing down the sites that are likely to affect the dissociation.
- the part specified by the springback amount deviation factor part identification method according to the present embodiment is the part that causes the difference between the CAE analysis and the springback amount of the actual panel. Will be described.
- the regions D-2 and E-2 in the press-molded product 10 cause a discrepancy between the CAE analysis and the swing amount of the actual panel.
- region F-2 was identified as a site that causes a deviation in the amount of splash. Therefore, in the driving stress distribution obtained by CAE analysis (see FIG. 3), the driving stress of each of the specified parts is replaced with the corresponding driving stress distribution of each part of the actual panel, and the springback analysis is performed. Was performed, and it was verified whether the deviation of the springback amount was reduced.
- FIG. 16 shows the result of verifying whether or not the amount of deviation between the CAE analysis and the swing of the actual panel is reduced.
- FIG. 16 is a graph showing the result (deviation amount) obtained by subtracting the swing amount in the actual panel from the swing amount in the CAE analysis, and the vertical axis shows the deviation amount and the horizontal axis shows the stress substitution region. .. “None” on the horizontal axis means that there is no stress substitution region. In this case, the amount of dissociation is -11.6 mm, which is the difference between the CAE analysis and the actual panel.
- ALL is a case where all the regions of the driving stress distribution of the CAE analysis are replaced with the driving stress distribution of the actual panel, and in this case, the dissociation amount becomes almost zero.
- the stress distribution of the actual panel is replaced only in the region D-2 or the region E-2 specified in the present embodiment, it is shown in “D-2” and "E-2” of FIG. In each case, the amount of swing deviation from the actual panel decreased.
- the amount of swing deviation from the actual panel can be further reduced. It has been shown.
- FIG. 17 shows the result of verifying whether or not the amount of deviation between the CAE analysis and the splash of the actual panel is reduced.
- the deviation of the amount of splash as shown in "F-2"
- F-2 by replacing the stress distribution of the region F-2 at the bottom dead center of the molding with the stress distribution of the actual panel, the amount of deviation from the actual panel Has decreased.
- the change in the stress difference distribution performed in the present embodiment was to eliminate the stress difference in at least a part of the region (all components are set to zero), but this is the method for changing the stress difference distribution. It is not limited to, but the components in at least one direction with respect to the stress difference distribution are eliminated, multiplied by a constant, added with a constant, multiplied by a constant, replaced with the average value in the plate thickness direction of the material to be processed, and processed. It may be performed by either replacing it with the median value in the plate thickness direction of the material.
- the method for identifying the springback amount divergence factor portion described in the first embodiment can be realized by causing a PC (personal computer) to execute a preset program.
- a PC personal computer
- An example of such a device will be described in this embodiment.
- the springback amount deviation factor site identification device 11 includes a display device 13, an input device 15, a main storage device 17, an auxiliary storage device 19, and arithmetic processing as shown in FIG. 18 as an example. It has a part 21.
- a display device 13, an input device 15, a main storage device 17, and an auxiliary storage device 19 are connected to the arithmetic processing unit 21, and each function is performed by a command of the arithmetic processing unit 21.
- the display device 13 is used for displaying an execution result and the like, and is composed of a liquid crystal monitor and the like.
- the input device 15 is used for input from an operator and is composed of a keyboard, a mouse, and the like.
- the main storage device 17 is used for temporary storage and calculation of data used by the calculation processing unit 21, and is composed of a RAM or the like.
- the auxiliary storage device 19 is used for storing data and the like, and is composed of a hard disk and the like. At least various data necessary for CAE analysis such as the three-dimensional shape measurement data 23 and the mold model 25 are stored in the auxiliary storage device 19.
- the arithmetic processing unit 21 is composed of a CPU such as a PC. Molded product drive stress distribution acquisition means 27, analysis drive stress distribution acquisition means 29, stress difference distribution setting means 31, stress difference springback amount acquisition means 33, modified stress difference springback amount acquisition means 35, and springback.
- the quantity divergence factor site identifying means 37 is realized by executing a preset program in the arithmetic processing unit 21.
- the molded product driving stress distribution acquisition means 27 realizes the same processing as the molded product driving stress distribution acquisition step S1 described in the first embodiment.
- the analysis drive stress distribution acquisition means 29 performs the analysis drive stress distribution acquisition step S3
- the stress difference distribution setting means 31 performs the stress difference distribution setting step S5
- the stress difference springback amount acquisition means 33 acquires the stress difference springback amount.
- the changed stress difference springback amount acquisition means 35 realizes the changed stress difference springback amount acquisition step S9
- the springback amount deviation factor site specifying means 37 realizes the springback amount deviation factor site specifying step S11. is there.
- the present embodiment as described above, it is possible to accurately identify the portion that causes the difference between the CAE analysis and the springback amount of the actual panel as in the first embodiment. Therefore, it is possible to efficiently perform CAE analysis and various adjustment operations for bringing the shape of the actual panel closer to each other based on the specified portion, and further ensure the usefulness of the springback countermeasure.
- the present invention is not limited to the final molded product (product shape), but can also be applied to an intermediate molded product in the case of a press-molded product in which the molding process is performed separately. Further, in the above-described embodiment, an example in which a steel plate is used as a work material has been described, but it can also be applied to an aluminum plate.
Landscapes
- Engineering & Computer Science (AREA)
- Physics & Mathematics (AREA)
- Theoretical Computer Science (AREA)
- General Physics & Mathematics (AREA)
- Geometry (AREA)
- Computer Hardware Design (AREA)
- General Engineering & Computer Science (AREA)
- Evolutionary Computation (AREA)
- Mechanical Engineering (AREA)
- Computational Mathematics (AREA)
- Pure & Applied Mathematics (AREA)
- Mathematical Optimization (AREA)
- Mathematical Analysis (AREA)
- Shaping Metal By Deep-Drawing, Or The Like (AREA)
Abstract
The present invention provides a spring-back amount divergence origin site specification method and device for specifying the origin site of a divergence in spring-back amount of a molded article between CAE analysis and actual measurement. The present invention comprises a molded article driving stress distribution acquisition step for acquiring a driving stress distribution of a press-molded article, an analyzed driving stress distribution acquisition step for acquiring a driving stress distribution according to spring-back analysis, a stress difference distribution setting step for setting a stress difference distribution between the analyzed driving stress distribution and the molded article driving stress distribution in a bottom-dead-center molded article shape, a stress difference spring-back amount acquisition step for acquiring a spring-back amount according to the stress difference distribution, a changed stress difference spring-back amount acquisition step for changing a value of a region in part of the stress difference distribution and acquiring the spring-back amount, and a spring-back amount divergence origin site specification step for comparing the acquired spring-back amounts and specifying a site that is the origin of a divergence in the spring-back amounts.
Description
本発明は、実パネルのプレス成形品のスプリングバック量とCAE解析のスプリングバック量に乖離が生じる要因となる前記プレス成形品における部位を特定するスプリングバック量乖離要因部位特定方法および装置に関する。
The present invention relates to a method and an apparatus for identifying a portion of the press-molded product that causes a discrepancy between the springback amount of the press-molded product of the actual panel and the springback amount of the CAE analysis.
金属板のプレス成形における成形品に対しては、高い形状精度が求められている。要求される形状精度を満足させるために、プレス成形後に金型から取り出した成形品が弾性変形することによって生じるスプリングバックを低減させることが重要である。
成形品の下死点における内部応力がスプリングバックの挙動に影響を及ぼすため、成形品のどの部位における応力がスプリングバックに対してどのような影響を与えるのかを把握することはスプリングバック対策を講じるのに有効である。
その手法として、特許文献1に開示されるプレス成形解析方法では、有限要素法を用いた解析によって解析を行っている。 High shape accuracy is required for molded products in press molding of metal plates. In order to satisfy the required shape accuracy, it is important to reduce the springback caused by the elastic deformation of the molded product taken out from the mold after press molding.
Since the internal stress at the bottom dead center of the molded product affects the behavior of the springback, it is necessary to take measures against the springback to understand what part of the molded product the stress affects the springback. It is effective for.
As the method, in the press molding analysis method disclosed inPatent Document 1, the analysis is performed by the analysis using the finite element method.
成形品の下死点における内部応力がスプリングバックの挙動に影響を及ぼすため、成形品のどの部位における応力がスプリングバックに対してどのような影響を与えるのかを把握することはスプリングバック対策を講じるのに有効である。
その手法として、特許文献1に開示されるプレス成形解析方法では、有限要素法を用いた解析によって解析を行っている。 High shape accuracy is required for molded products in press molding of metal plates. In order to satisfy the required shape accuracy, it is important to reduce the springback caused by the elastic deformation of the molded product taken out from the mold after press molding.
Since the internal stress at the bottom dead center of the molded product affects the behavior of the springback, it is necessary to take measures against the springback to understand what part of the molded product the stress affects the springback. It is effective for.
As the method, in the press molding analysis method disclosed in
特許文献1のプレス成形解析方法によれば、「プレス成形品である成形対象物のある領域についての残留応力分布を変更する前後において、スプリングバックに関するある定義された量がどのように変化するかを算出するので、この結果に基づいて、離型前の成形対象物のある領域の残留応力のスプリングバックへの影響を予測することができる」(発明の効果参照)としている。
特許文献1に開示されたような手法を用いることで、実際の金型を作成する前にスプリングバック対策を検討することができ、形状精度を確保するための金型調整作業を大幅に低減することができる。 According to the press molding analysis method ofPatent Document 1, "how a certain defined amount of springback changes before and after changing the residual stress distribution in a certain region of a press-molded object to be molded. Based on this result, it is possible to predict the effect of the residual stress in a certain region of the object to be molded before the mold release on the springback ”(see the effect of the invention).
By using the method disclosed inPatent Document 1, it is possible to consider springback countermeasures before making an actual mold, and the mold adjustment work for ensuring shape accuracy is greatly reduced. be able to.
特許文献1に開示されたような手法を用いることで、実際の金型を作成する前にスプリングバック対策を検討することができ、形状精度を確保するための金型調整作業を大幅に低減することができる。 According to the press molding analysis method of
By using the method disclosed in
その他のCAE解析を用いたスプリングバックの要因分析方法として、特許文献2では離型前の残留応力と離型後の残留応力からスプリングバック(SB)有効応力を算出し、該SB有効応力を用いて要因分析を行うことで、より適切な評価を行う方法が開示されている。
As another method for analyzing the factors of springback using CAE analysis, in Patent Document 2, the springback (SB) effective stress is calculated from the residual stress before mold release and the residual stress after mold release, and the SB effective stress is used. A method for performing a more appropriate evaluation by performing factor analysis is disclosed.
上述した方法はCAE解析におけるデータ設定から算出した応力状態よりスプリングバック解析を行っている。これに対し、特許文献3では、実際にプレス成形した成形品の表面形状を測定して作成した測定三次元形状をCAE解析に取り込み、該測定三次元形状を金型モデルによって成形下死点状態まで挟み込んだ状態の力学的解析を行って応力分布状態を取得し、該応力分布状態を用いて要因分析を行うことで、より正確な評価を行う方法が開示されている。
The above method performs springback analysis from the stress state calculated from the data setting in CAE analysis. On the other hand, in Patent Document 3, the measured three-dimensional shape created by actually measuring the surface shape of the press-molded molded product is incorporated into the CAE analysis, and the measured three-dimensional shape is in the bottom dead point state of molding by the mold model. A method for performing a more accurate evaluation is disclosed by performing a mechanical analysis of the state of being sandwiched between the two to obtain a stress distribution state and performing a factor analysis using the stress distribution state.
しかしながら、CAE解析に基づいたスプリングバック対策を講じた金型を作製してプレス成形を行っても、実際のプレス成形品に講じた対策で期待された形状とは異なる形状となることがある。
これは、プレス成形に使用した金型の形状や種々の成形条件によって、金属板に対してCAE解析で想定した成形荷重がかからなかった場合や、CAE解析が離型前の応力状態を正確に再現することができなかった場合などに起きうる。そのような場合にはプレス成形に用いる金型や成形条件を調整したり、CAE解析上の設定や金型形状を見直したりする必要がある。 However, even if a die with springback countermeasures based on CAE analysis is produced and press-formed, the shape may be different from the shape expected by the countermeasures taken for the actual press-molded product.
This is because the molding load assumed in the CAE analysis is not applied to the metal plate due to the shape of the mold used for press molding and various molding conditions, or the CAE analysis accurately determines the stress state before mold release. It can happen when it cannot be reproduced. In such a case, it is necessary to adjust the mold and molding conditions used for press molding, and to review the settings in CAE analysis and the mold shape.
そのような調整作業においては、CAE解析によるスプリングバック解析結果と実際の成形品のスプリングバック量の乖離要因が、成形品のどの部位で発生しているのかを特定することが求められる。特許文献1乃至3に開示されている方法はスプリングバックそのものの発生要因となる部位を特定するものであり、CAE解析と実スプリングバック量の乖離要因となる部位を特定するものではなかった。
In such adjustment work, it is required to identify at which part of the molded product the cause of the discrepancy between the springback analysis result by CAE analysis and the actual springback amount of the molded product occurs. The methods disclosed in Patent Documents 1 to 3 specify the part that causes the springback itself to occur, and do not specify the part that causes the difference between the CAE analysis and the actual springback amount.
また、CAE解析を用いたスプリングバック対策の有用性を担保するためには、スプリングバック解析の再現性を向上させて、実際の成形品のスプリングバックと乖離しないようにすることが求められる。そのためにも、成形品において乖離要因となる部位を特定することが必要である。
In addition, in order to ensure the usefulness of springback countermeasures using CAE analysis, it is necessary to improve the reproducibility of springback analysis so that it does not deviate from the actual springback of the molded product. For that purpose, it is necessary to identify the part that causes the dissociation in the molded product.
本発明は、上記のような課題を解決するためになされたものであり、実パネルのプレス成形品のスプリングバック量とCAE解析のスプリングバック量に乖離が生じる要因となる前記プレス成形品における部位を特定するスプリングバック量乖離要因部位特定方法および装置を提供することを目的とする。
The present invention has been made to solve the above problems, and is a portion of the press-molded product that causes a discrepancy between the springback amount of the press-molded product of the actual panel and the springback amount of the CAE analysis. It is an object of the present invention to provide a method and an apparatus for identifying a part of a springback amount divergence factor that identifies
(1)本発明に係るスプリングバック量乖離要因部位特定方法は、実パネルをプレス成形したプレス成形品に生ずるスプリングバック量と、前記プレス成形品と同形状の解析モデルについてスプリングバック解析を行った際のスプリングバック量に乖離が生ずる場合において、該乖離が生ずる要因となる成形品形状における部位を特定するものであって、前記プレス成形品の離型後における表面形状を測定して取得した三次元形状測定データからプレス成形品モデルを作成し、該プレス成形品モデルを金型モデルによって下死点まで挟み込んだ状態の力学的解析を行い、成形下死点における応力分布を前記プレス成形品のスプリングバックに寄与した駆動応力分布として取得する成形品駆動応力分布取得ステップと、前記スプリングバック解析における下死点応力分布及び離型後の残留応力分布を取得し、該下死点応力分布と離型後の残留応力分布の差分をスプリングバック解析における駆動応力分布として取得する解析駆動応力分布取得ステップと、該解析駆動応力分布取得ステップで取得した解析駆動応力分布と前記成形品駆動応力分布取得ステップで取得した成形品駆動応力分布の差分から応力差分分布を取得して、前記スプリングバック解析における下死点の成形品形状に前記応力差分分布を設定する応力差分分布設定ステップと、該設定した応力差分分布に基づいてスプリングバック解析を行ってスプリングバック量を取得する応力差分スプリングバック量取得ステップと、前記応力差分分布設定ステップで設定した前記応力差分分布のうち、一部の領域の応力差分の値を変更して、該変更した応力差分分布に基づいてスプリングバック解析を行ってスプリングバック量を取得する変更応力差分スプリングバック量取得ステップと、該変更応力差分スプリングバック量取得ステップ及び前記応力差分スプリングバック量取得ステップで取得したスプリングバック量を比較して、前記プレス成形品と前記スプリングバック解析のスプリングバック量に乖離が生ずる要因となる成形品形状における部位を特定するスプリングバック量乖離要因部位特定ステップと、を備えている。
(1) In the method for identifying a part of a springback amount divergence factor according to the present invention, a springback analysis was performed on a springback amount generated in a press-molded product obtained by press-molding an actual panel and an analysis model having the same shape as the press-molded product. When there is a discrepancy in the amount of springback at the time, the part in the molded product shape that causes the discrepancy is specified, and the tertiary surface shape obtained by measuring the surface shape of the press-molded product after mold release is obtained. A press-molded product model is created from the original shape measurement data, a mechanical analysis is performed with the press-molded product model sandwiched by a mold model up to the bottom dead point, and the stress distribution at the bottom dead point of molding is determined by the press-molded product. The molded product drive stress distribution acquisition step to be acquired as the drive stress distribution that contributed to the springback, and the bottom dead point stress distribution and the residual stress distribution after mold release in the springback analysis are acquired and separated from the bottom dead point stress distribution. The analysis drive stress distribution acquisition step for acquiring the difference of the residual stress distribution after the mold as the drive stress distribution in the springback analysis, the analysis drive stress distribution acquired in the analysis drive stress distribution acquisition step, and the molded product drive stress distribution acquisition step. The stress difference distribution setting step of acquiring the stress difference distribution from the difference of the molded product driving stress distribution acquired in step 2 and setting the stress difference distribution to the shape of the molded product at the bottom dead point in the springback analysis, and the set stress Of the stress difference springback amount acquisition step for acquiring the springback amount by performing springback analysis based on the difference distribution and the stress difference distribution set in the stress difference distribution setting step, the stress difference in a part of the region A modified stress difference springback amount acquisition step, a modified stress difference springback amount acquisition step, and the stress difference obtained by changing the value and performing a springback analysis based on the changed stress difference distribution to acquire the springback amount. By comparing the springback amount acquired in the springback amount acquisition step, the springback amount divergence factor part that identifies the part in the molded product shape that causes the divergence between the press-molded product and the springback amount in the springback analysis. It has specific steps.
(2)また、上記(1)に記載のものにおいて、前記変更応力差分スプリングバック量取得ステップにおける応力差分の値の変更は、前記応力差分分布に対して少なくとも1方向の成分を、消去する、定数倍する、定数を加算する、定数乗する、被加工材の板厚方向の平均値に置き換える、被加工材の板厚方向の中央値に置き換える、のいずれかである。
(2) Further, in the above (1), the change of the stress difference value in the change stress difference springback amount acquisition step eliminates the component in at least one direction with respect to the stress difference distribution. It is either multiplied by a constant, added by a constant, multiplied by a constant, replaced with the average value in the plate thickness direction of the work material, or replaced with the median value in the plate thickness direction of the work material.
(3)本発明に係るスプリングバック量乖離要因部位特定装置は、実パネルをプレス成形したプレス成形品に生ずるスプリングバック量と、前記プレス成形品と同形状の解析モデルについてスプリングバック解析を行った際のスプリングバック量に乖離が生ずる場合において、該乖離が生ずる要因となる成形品形状における部位を特定するものであって、前記プレス成形品の離型後における表面形状を測定して取得した三次元形状測定データからプレス成形品モデルを作成し、該プレス成形品モデルを金型モデルによって下死点まで挟み込んだ状態の力学的解析を行い、成形下死点における応力分布を前記プレス成形品のスプリングバックに寄与した駆動応力分布として取得する成形品駆動応力分布取得手段と、前記スプリングバック解析における下死点応力分布及び離型後の残留応力分布を取得し、該下死点応力分布と離型後の残留応力分布の差分をスプリングバック解析における駆動応力分布として取得する解析駆動応力分布取得手段と、該解析駆動応力分布取得手段で取得した解析駆動応力分布と前記成形品駆動応力分布取得手段で取得した成形品駆動応力分布の差分から応力差分分布を取得して、前記スプリングバック解析における下死点の成形品形状に前記応力差分分布を設定する応力差分分布設定手段と、該設定した応力差分分布に基づいてスプリングバック解析を行ってスプリングバック量を取得する応力差分スプリングバック量取得手段と、前記応力差分分布設定手段で設定した前記応力差分分布のうち、一部の領域の応力差分の値を変更して、該変更した応力差分分布に基づいてスプリングバック解析を行ってスプリングバック量を取得する変更応力差分スプリングバック量取得手段と、該変更応力差分スプリングバック量取得手段及び前記応力差分スプリングバック量取得手段で取得したスプリングバック量を比較して、前記プレス成形品と前記スプリングバック解析のスプリングバック量に乖離が生ずる要因となる成形品形状における部位を特定するスプリングバック量乖離要因部位特定手段と、を備えている。
(3) The springback amount divergence factor site identification device according to the present invention performs springback analysis on the springback amount generated in the press-molded product obtained by press-molding the actual panel and the analysis model having the same shape as the press-molded product. When there is a discrepancy in the amount of springback at the time, the part in the molded product shape that causes the discrepancy is specified, and the tertiary surface shape obtained by measuring the surface shape of the press-molded product after mold release is obtained. A press-molded product model is created from the original shape measurement data, a mechanical analysis is performed with the press-molded product model sandwiched by a mold model up to the bottom dead point, and the stress distribution at the bottom dead point of molding is determined by the press-molded product. The molded product drive stress distribution acquisition means acquired as the drive stress distribution that contributed to the springback, and the bottom dead point stress distribution and the residual stress distribution after mold release in the springback analysis are acquired and separated from the bottom dead point stress distribution. Analytical drive stress distribution acquisition means that acquires the difference of residual stress distribution after molding as the drive stress distribution in springback analysis, analysis drive stress distribution acquired by the analysis drive stress distribution acquisition means, and the molded product drive stress distribution acquisition means. A stress difference distribution setting means for acquiring the stress difference distribution from the difference in the driven stress distribution of the molded product acquired in the above and setting the stress difference distribution to the shape of the molded product at the bottom dead point in the springback analysis, and the set stress. Of the stress difference springback amount acquisition means for acquiring the springback amount by performing springback analysis based on the difference distribution and the stress difference distribution set by the stress difference distribution setting means, the stress difference in a part of the region. A modified stress difference springback amount acquisition means for changing a value and performing a springback analysis based on the changed stress difference distribution to acquire a springback amount, a modified stress difference springback amount acquiring means, and the stress difference. By comparing the springback amount acquired by the springback amount acquisition means, a portion in the molded product shape that causes a discrepancy between the press-molded product and the springback amount in the springback analysis is specified. It has specific means.
(4)また、上記(3)に記載のものにおいて、前記変更応力差分スプリングバック量取得手段における応力差分の値の変更は、前記応力差分分布に対して少なくとも1方向の成分を、消去する、定数倍する、定数を加算する、定数乗する、被加工材の板厚方向の平均値に置き換える、被加工材の板厚方向の中央値に置き換える、のいずれかである。
(4) Further, in the above (3), the change of the value of the stress difference in the modified stress difference springback amount acquisition means eliminates the component in at least one direction with respect to the stress difference distribution. It is either multiplied by a constant, added by a constant, multiplied by a constant, replaced with the average value in the plate thickness direction of the work material, or replaced with the median value in the plate thickness direction of the work material.
本発明によれば、CAE解析によるスプリングバック解析と実際の成形品に生じたスプリングバック量の乖離の要因となる部位を特定することができるので、実際のプレス成形金型や成形条件を調整する作業の負荷を低減し、CAE解析を用いたスプリングバック対策の有用性を向上させることができる。
According to the present invention, it is possible to identify a portion that causes a discrepancy between the springback analysis by CAE analysis and the amount of springback that occurs in the actual molded product, so that the actual press molding die and molding conditions are adjusted. It is possible to reduce the work load and improve the usefulness of springback countermeasures using CAE analysis.
本発明の実施の形態に係るスプリングバック量乖離要因部位特定方法を説明する前に、まず本発明に至った経緯について説明する。
Before explaining the method for identifying the part of the springback amount divergence factor according to the embodiment of the present invention, first, the background to the present invention will be described.
<本発明に至った経緯>
図2に一例として示すようなプレス成形品10のプレス成形においては、プレス成形前に行うスプリングバック解析(CAE解析ともいう)によって算出されたスプリングバック量と実際にプレス成形されたプレス成形品(実パネルともいう)のスプリングバック量に差(乖離)が生じる場合があった。このようなCAE解析と実パネルにスプリングバック量の乖離が生じる要因となる部位は、スプリングバックそのものが発生する要因となる部位とは異なる場合がある。そのため、スプリングバックが発生する要因となる部位に何らかの対策を施してスプリングバックを低減したとしても、CAE解析と実パネルの間に生じるスプリングバック量の乖離を低減するには至らないという問題があった。 <History of the present invention>
In the press molding of the press-moldedproduct 10 as shown as an example in FIG. 2, the springback amount calculated by the springback analysis (also referred to as CAE analysis) performed before the press molding and the press-molded product actually press-molded (also referred to as CAE analysis). There was a case where there was a difference (dissociation) in the amount of springback (also called the actual panel). The part that causes the discrepancy between the CAE analysis and the actual panel in the amount of springback may be different from the part that causes the springback itself to occur. Therefore, even if some measures are taken to reduce the springback in the part that causes the springback, there is a problem that the discrepancy in the amount of the springback that occurs between the CAE analysis and the actual panel cannot be reduced. It was.
図2に一例として示すようなプレス成形品10のプレス成形においては、プレス成形前に行うスプリングバック解析(CAE解析ともいう)によって算出されたスプリングバック量と実際にプレス成形されたプレス成形品(実パネルともいう)のスプリングバック量に差(乖離)が生じる場合があった。このようなCAE解析と実パネルにスプリングバック量の乖離が生じる要因となる部位は、スプリングバックそのものが発生する要因となる部位とは異なる場合がある。そのため、スプリングバックが発生する要因となる部位に何らかの対策を施してスプリングバックを低減したとしても、CAE解析と実パネルの間に生じるスプリングバック量の乖離を低減するには至らないという問題があった。 <History of the present invention>
In the press molding of the press-molded
そこで発明者は、このような問題を解決するために鋭意検討した。その結果、スプリングバック量の乖離の要因が、CAE解析におけるスプリングバックに寄与した応力と、実パネルにおけるスプリングバックに寄与した応力の違いに起因するのではないかと着想するに至った。
Therefore, the inventor made a diligent study to solve such a problem. As a result, I came up with the idea that the cause of the discrepancy in the amount of springback may be the difference between the stress that contributed to springback in the CAE analysis and the stress that contributed to springback in the actual panel.
そこで、この着想の妥当性を検証するために、図2に示すハット断面形状のプレス成形品10について、CAE解析及び実パネルのそれぞれについてスプリングバックに寄与した応力(以降、駆動応力分布ともいう)を求め、CAE解析における駆動応力分布と実パネルにおける駆動応力分布の差分(以降、応力差分分布ともいう)を算出し、該応力差分分布をCAE解析の成形下死点における応力分布に置き換えてスプリングバック解析を行った(駆動応力算出方法については後述する実施の形態で詳しく説明する)。
Therefore, in order to verify the validity of this idea, the stresses that contributed to the springback for each of the CAE analysis and the actual panel of the press-formed product 10 having the hat cross-sectional shape shown in FIG. 2 (hereinafter, also referred to as driving stress distribution). Is calculated, the difference between the driving stress distribution in the CAE analysis and the driving stress distribution in the actual panel (hereinafter also referred to as the stress difference distribution) is calculated, and the stress difference distribution is replaced with the stress distribution at the molding bottom dead point in the CAE analysis to replace the spring. Back analysis was performed (the driving stress calculation method will be described in detail in the embodiment described later).
スプリングバック量として、長手方向端部の板幅方向への変位量である首振り量と、成形ストローク方向への変位量であるはね量(図8参照)を算出し、CAE解析と実パネルのスプリングバック量の差(乖離量)と比較した結果を表1に示す。
As the springback amount, the swing amount, which is the displacement amount of the end portion in the longitudinal direction in the plate width direction, and the splash amount, which is the displacement amount in the molding stroke direction (see FIG. 8), are calculated, and CAE analysis and the actual panel are performed. Table 1 shows the results of comparison with the difference (displacement amount) in the springback amount of.

表1に示すように、CAE解析と実パネルのスプリングバック量の差と応力差分分布を設定したスプリングバック解析により得られたスプリングバック量とはほぼ同じ値になることが確認された。つまり、CAE解析と実パネルの駆動応力分布の違いである応力差分が、スプリングバック量の乖離の原因であると考えてよいという知見が得られた。
As shown in Table 1, it was confirmed that the springback amount obtained by the CAE analysis and the springback analysis in which the difference between the springback amount of the actual panel and the stress difference distribution were set was almost the same value. That is, it was found that the stress difference, which is the difference between the CAE analysis and the driving stress distribution of the actual panel, may be considered to be the cause of the deviation of the springback amount.
本発明に係るスプリングバック量乖離要因部位特定方法は、上記の経緯により完成されたものであり、その具体的な方法を以下の実施の形態にて説明する。
なお、以下の説明において、「下死点」とは、パンチとダイがブランクを挟んで接触した状態(CAE解析においては成形が完了した状態)を示す。「成形下死点」とは、実際のプレス金型で成形完了した状態を示す。「解析下死点」とは、CAE解析での成形を完了した状態を示す。 The method for identifying the portion of the springback amount divergence factor according to the present invention has been completed by the above circumstances, and a specific method thereof will be described in the following embodiments.
In the following description, the "bottom dead center" indicates a state in which the punch and the die are in contact with each other with the blank sandwiched between them (in the CAE analysis, the molding is completed). The “bottom dead center of molding” indicates a state in which molding is completed with an actual press die. The “dead center under analysis” indicates a state in which molding in CAE analysis is completed.
[実施の形態1]
本発明の実施の形態1に係るスプリングバック量乖離要因部位特定方法は、実パネルをプレス成形したプレス成形品とスプリングバック解析のスプリングバック量に乖離が生じる場合において、該スプリングバック量に乖離が生じる要因となる成形品形状における部位を特定するものである。図1に示すように、成形品駆動応力分布取得ステップS1と、解析駆動応力分布取得ステップS3と、応力差分分布設定ステップS5と、応力差分スプリングバック量取得ステップS7と、変更応力差分スプリングバック量取得ステップS9と、スプリングバック量乖離要因部位特定ステップS11とを備えたものである。 [Embodiment 1]
In the method for identifying the cause of the springback amount dissociation according to the first embodiment of the present invention, when there is a dissociation between the press-molded product obtained by press-molding the actual panel and the springback amount in the springback analysis, the springback amount dissociates. This is to specify a part in the shape of the molded product that causes the occurrence. As shown in FIG. 1, a molded product drive stress distribution acquisition step S1, an analysis drive stress distribution acquisition step S3, a stress difference distribution setting step S5, a stress difference springback amount acquisition step S7, and a modified stress difference springback amount. The acquisition step S9 and the springback amount deviation factor portion identification step S11 are provided.
図2に示すようなハット断面形状のプレス成形品10をプレス成形する場合を例とし、上記の各ステップを説明する。
本実施の形態におけるCAE解析では、図2に示すように、ダイ5とパンチ7からなる金型モデル3により被加工材(鋼板)であるブランクモデル9を挟むプレス成形解析を実施する。プレス成形解析においては、図2に示すように位置決めピンにより成形過程においてブランクモデル9を固定するものとし、ブランクモデル9の要素サイズを約1mm、解析条件として、ブランクモデル9と金型モデル3との間の摩擦係数を0.15、成形下死点位置を上下金型のモデルのスキが1.45mmとなる位置とした。被加工材は、板厚1.4mmの980MPa級GA鋼板とした。
なお、本実施の形態における実パネルはCAE解析に設定した成形条件と同じ条件下でプレス成形を行って成形したものとする。 Each of the above steps will be described by taking as an example a case where a press-moldedproduct 10 having a hat cross-sectional shape as shown in FIG. 2 is press-molded.
In the CAE analysis in the present embodiment, as shown in FIG. 2, a press forming analysis is performed in which theblank model 9 which is the work material (steel plate) is sandwiched by the mold model 3 including the die 5 and the punch 7. In the press molding analysis, as shown in FIG. 2, the blank model 9 is fixed in the molding process by a positioning pin, the element size of the blank model 9 is about 1 mm, and the blank model 9 and the mold model 3 are used as analysis conditions. The coefficient of friction between them was 0.15, and the bottom dead point position of molding was set to the position where the gap of the upper and lower mold models was 1.45 mm. The work material was a 980 MPa class GA steel sheet with a thickness of 1.4 mm.
It is assumed that the actual panel in the present embodiment is formed by press molding under the same conditions as the molding conditions set in the CAE analysis.
本実施の形態におけるCAE解析では、図2に示すように、ダイ5とパンチ7からなる金型モデル3により被加工材(鋼板)であるブランクモデル9を挟むプレス成形解析を実施する。プレス成形解析においては、図2に示すように位置決めピンにより成形過程においてブランクモデル9を固定するものとし、ブランクモデル9の要素サイズを約1mm、解析条件として、ブランクモデル9と金型モデル3との間の摩擦係数を0.15、成形下死点位置を上下金型のモデルのスキが1.45mmとなる位置とした。被加工材は、板厚1.4mmの980MPa級GA鋼板とした。
なお、本実施の形態における実パネルはCAE解析に設定した成形条件と同じ条件下でプレス成形を行って成形したものとする。 Each of the above steps will be described by taking as an example a case where a press-molded
In the CAE analysis in the present embodiment, as shown in FIG. 2, a press forming analysis is performed in which the
It is assumed that the actual panel in the present embodiment is formed by press molding under the same conditions as the molding conditions set in the CAE analysis.
<成形品駆動応力分布取得ステップ>
成形品駆動応力分布取得ステップS1は、実パネルの駆動応力分布を取得するステップである。
具体的には、上述したようなCAE解析に設定した成形条件と同じ条件でプレス成形を行って実パネルを成形する。その後、該実パネルの離型後における表面形状を測定して取得した三次元形状測定データからプレス成形品モデルを作成し、該プレス成形品モデルを図2に示した金型モデル3によって成形下死点まで挟み込んだ状態の力学的解析を行って図4に示したような応力分布を取得するものである。
上記力学的解析として弾性有限要素解析を行う。該弾性有限要素解析により得られた応力分布は実パネルのスプリングバックに寄与した応力、すなわち、実パネルの駆動応力に相当する。 <Molded product drive stress distribution acquisition step>
The molded product driving stress distribution acquisition step S1 is a step of acquiring the driving stress distribution of the actual panel.
Specifically, the actual panel is molded by press molding under the same molding conditions as those set in the CAE analysis as described above. After that, a press-molded product model is created from the three-dimensional shape measurement data obtained by measuring the surface shape of the actual panel after the mold is released, and the press-molded product model is molded by themold model 3 shown in FIG. The stress distribution as shown in FIG. 4 is obtained by performing a mechanical analysis in a state of being sandwiched to the dead center.
Elastic finite element analysis is performed as the above mechanical analysis. The stress distribution obtained by the elastic finite element analysis corresponds to the stress contributing to the springback of the actual panel, that is, the driving stress of the actual panel.
成形品駆動応力分布取得ステップS1は、実パネルの駆動応力分布を取得するステップである。
具体的には、上述したようなCAE解析に設定した成形条件と同じ条件でプレス成形を行って実パネルを成形する。その後、該実パネルの離型後における表面形状を測定して取得した三次元形状測定データからプレス成形品モデルを作成し、該プレス成形品モデルを図2に示した金型モデル3によって成形下死点まで挟み込んだ状態の力学的解析を行って図4に示したような応力分布を取得するものである。
上記力学的解析として弾性有限要素解析を行う。該弾性有限要素解析により得られた応力分布は実パネルのスプリングバックに寄与した応力、すなわち、実パネルの駆動応力に相当する。 <Molded product drive stress distribution acquisition step>
The molded product driving stress distribution acquisition step S1 is a step of acquiring the driving stress distribution of the actual panel.
Specifically, the actual panel is molded by press molding under the same molding conditions as those set in the CAE analysis as described above. After that, a press-molded product model is created from the three-dimensional shape measurement data obtained by measuring the surface shape of the actual panel after the mold is released, and the press-molded product model is molded by the
Elastic finite element analysis is performed as the above mechanical analysis. The stress distribution obtained by the elastic finite element analysis corresponds to the stress contributing to the springback of the actual panel, that is, the driving stress of the actual panel.
ここで、実パネルの三次元形状の測定、プレス成形品モデルの作成および弾性有限要素解析の具体的な方法としては、例えば、特許文献3に記載されている方法を用いることができる。
Here, as a specific method for measuring the three-dimensional shape of the actual panel, creating a press-formed product model, and analyzing the elastic finite element, for example, the method described in Patent Document 3 can be used.
<解析駆動応力分布取得ステップ>
解析駆動応力分布取得ステップS3は、CAE解析(スプリングバック解析)における下死点応力分布及び離型後の残留応力をそれぞれ取得して、その差分からCAE解析における駆動応力を取得するステップである。
プレス成形品の下死点における応力がスプリングバックの挙動に影響を及ぼすものではあるが、金型から離型した後のプレス成形品にも応力が残留している。すなわち、離型前の応力のすべてがスプリングバックに寄与するわけではなく、離型後のスプリングバックが生じたプレス成形品に残留する応力はスプリングバックに寄与しなかったものと考えられる。
成形品駆動応力分布取得ステップS1で取得した駆動応力(スプリングバックに寄与した応力)との正確な比較分析を行うためにはCAE解析における駆動応力を算出する必要がある。 <Analysis drive stress distribution acquisition step>
The analysis driving stress distribution acquisition step S3 is a step of acquiring the bottom dead point stress distribution in the CAE analysis (springback analysis) and the residual stress after the mold release, respectively, and acquiring the driving stress in the CAE analysis from the difference.
Although the stress at the bottom dead center of the press-molded product affects the behavior of the springback, the stress remains in the press-molded product after the mold is released from the mold. That is, it is considered that not all the stresses before the mold release contributed to the springback, and the stress remaining in the press-formed product in which the springback after the mold release occurred did not contribute to the springback.
It is necessary to calculate the driving stress in the CAE analysis in order to perform an accurate comparative analysis with the driving stress (stress contributing to the springback) acquired in the molded product driving stress distribution acquisition step S1.
そこで、解析駆動応力分布取得ステップS3では、図2に示した金型モデル3及びブランクモデル9を用いてCAE解析を行い、離型前(下死点)におけるプレス成形品の応力及び離型後(スプリングバック後)におけるプレス成形品の残留応力を取得し、下死点の応力から離型後の残留応力を差し引くことで図3に示したようなCAE解析における駆動応力分布(以降、単に応力分布ともいう)を算出するようにした。
Therefore, in the analysis drive stress distribution acquisition step S3, CAE analysis is performed using the mold model 3 and the blank model 9 shown in FIG. 2, and the stress of the press-formed product before the mold release (bottom dead point) and after the mold release are performed. By acquiring the residual stress of the press-formed product (after springback) and subtracting the residual stress after mold release from the stress at the bottom dead point, the driving stress distribution in the CAE analysis as shown in FIG. 3 (hereinafter, simply stress) (Also called distribution) is calculated.
なお、解析駆動応力分布取得ステップS3は、コンピュータがCAE解析を行うものである。CAE解析には、例えば、有限要素法解析ソフトウェアを用いることができる。本実施の形態では、市販の有限要素法解析ソフトウェアであるLS-DYNA Ver.971をコンピュータ上で実行することにより解析を行い、ソルバーには動的陽解法を適用した。
In the analysis drive stress distribution acquisition step S3, the computer performs CAE analysis. For the CAE analysis, for example, finite element method analysis software can be used. In this embodiment, analysis is performed by executing LS-DYNA Ver.971 which is commercially available finite element method analysis software on a computer, and a dynamic explicit method is applied to the solver.
本発明は、図2に示すような金型モデル3を用いるものや、ハット断面形状のプレス成形品10を成形対象とするものに限らず、成形対象に応じて金型モデルやプレス成形品などを適宜設定することができる。
さらに、離型後の残留応力がほぼ無視できるような小さな値であった場合には、解析下死点の応力分布の全てがスプリングバックに寄与するとみなし、下死点における応力分布を解析駆動応力分布としてもよい。 The present invention is not limited to the one using themold model 3 as shown in FIG. 2 and the one for which the press-molded product 10 having a hat cross-sectional shape is the molding target, and the mold model, the press-molded product, etc. Can be set as appropriate.
Furthermore, if the residual stress after mold release is a small value that can be almost ignored, it is considered that the entire stress distribution at the bottom dead center of the analysis contributes to springback, and the stress distribution at the bottom dead center is analyzed. It may be a distribution.
さらに、離型後の残留応力がほぼ無視できるような小さな値であった場合には、解析下死点の応力分布の全てがスプリングバックに寄与するとみなし、下死点における応力分布を解析駆動応力分布としてもよい。 The present invention is not limited to the one using the
Furthermore, if the residual stress after mold release is a small value that can be almost ignored, it is considered that the entire stress distribution at the bottom dead center of the analysis contributes to springback, and the stress distribution at the bottom dead center is analyzed. It may be a distribution.
<応力差分分布設定ステップ>
応力差分分布設定ステップS5は、図5に示すように、解析駆動応力分布取得ステップS3で算出した応力分布(図3、図5(a))と成形品駆動応力分布取得ステップS1で算出した応力分布(図4、図5(b))との差分を応力差分分布として算出し(図5(c))、算出した応力差分分布を、CAE解析の下死点形状における応力分布に設定するステップである。
なお、図5に示す各応力分布は応力の大きさの違いが色の濃淡で示されている。図5(c)は、図5(a)及び図5(b)よりも色表示のレンジ幅を小さく設定したものである。このようにすることで、応力差が大きい部分(黒または白に近い部分)と応力差が小さい部分(図中右側のグレースケール中間色に近い部分)をより区別しやすくしている。 <Stress difference distribution setting step>
As shown in FIG. 5, the stress difference distribution setting step S5 includes the stress distribution (FIGS. 3 and 5 (a)) calculated in the analysis drive stress distribution acquisition step S3 and the stress calculated in the molded product drive stress distribution acquisition step S1. A step of calculating the difference from the distribution (FIGS. 4 and 5 (b)) as the stress difference distribution (FIG. 5 (c)) and setting the calculated stress difference distribution as the stress distribution in the bottom dead point shape of the CAE analysis. Is.
In each stress distribution shown in FIG. 5, the difference in stress magnitude is shown by shades of color. FIG. 5 (c) shows that the range width of the color display is set smaller than that of FIGS. 5 (a) and 5 (b). By doing so, it is easier to distinguish between a part having a large stress difference (a part close to black or white) and a part having a small stress difference (a part close to the grayscale intermediate color on the right side of the figure).
<応力差分スプリングバック量取得ステップ>
応力差分スプリングバック量取得ステップS7は、応力差分分布設定ステップS5で設定した応力差分分布を用いてスプリングバック解析を行い、そこで生じるスプリングバック量を算出するステップである。 <Stress difference springback amount acquisition step>
The stress difference springback amount acquisition step S7 is a step of performing a springback analysis using the stress difference distribution set in the stress difference distribution setting step S5 and calculating the springback amount generated there.
本実施の形態では、応力差分分布が設定された下死点形状のプレス成形品10(図6(a))に対してスプリングバック解析を行い、該スプリングバック解析によりスプリングバック後の変位(図6(b))を算出する。スプリングバック解析においては、図7に示すように、成形品の一端側に設けた3箇所を固定点で固定し、スプリングバックによる変位を算出した。
In the present embodiment, a springback analysis is performed on a press-formed product 10 (FIG. 6A) having a bottom dead center shape in which a stress difference distribution is set, and the displacement after springback is performed by the springback analysis (FIG. 6). 6 (b)) is calculated. In the springback analysis, as shown in FIG. 7, three points provided on one end side of the molded product were fixed at fixed points, and the displacement due to the springback was calculated.
次に、図8に示すように、スプリングバック解析により算出した変位に基づいて、首振り量(図8(a))およびはね量(図8(b))を算出した。本実施の形態において、首振り量は、図8(a)に示すように、プレス成形品10の他端側に設けた2箇所の評価点どちらかのスプリングバックによる図中矢印方向への移動量(矢印の向きを正)とし、はね量は、図8(b)に示すように、2つの評価点の中点における成形ストローク方向の変位量(ダイ5から離れる向きを正)とした。
Next, as shown in FIG. 8, the swing amount (FIG. 8 (a)) and the splash amount (FIG. 8 (b)) were calculated based on the displacement calculated by the springback analysis. In the present embodiment, as shown in FIG. 8A, the swing amount is moved in the direction of the arrow in the figure by the springback of either of the two evaluation points provided on the other end side of the press-molded product 10. As shown in FIG. 8B, the amount (the direction of the arrow is positive) and the amount of splash are the amount of displacement in the molding stroke direction at the midpoint of the two evaluation points (the direction away from the die 5 is positive). ..
<変更応力差分スプリングバック量取得ステップ>
変更応力差分スプリングバック量取得ステップS9は、応力差分分布設定ステップS5で設定した応力差分分布のうち、プレス成形品10における一部分のある部位の応力差分の値を変更し、変更した応力差分分布(変更応力差分分布)から、スプリングバック解析を行い、そこで生じるスプリングバック量を算出するステップである。 <Change stress difference springback amount acquisition step>
In the changed stress difference springback amount acquisition step S9, the value of the stress difference of a part of the stress difference distribution set in the stress difference distribution setting step S5 is changed, and the changed stress difference distribution ( This is a step of performing a springback analysis from the modified stress difference distribution) and calculating the amount of springback generated there.
本実施の形態では、図9に示すように、プレス成形品10を複数の領域に分割(長手方向にA~Fの6分割、幅方向に1~3の3分割)し、各領域における応力差分を消去、すなわち、応力差分の値をゼロにする。なお、応力差分を消去する領域は、必ずしも1領域である必要はなく、複数の領域の応力差分を消去してもよい。
ある領域の値を消去した後、スプリングバック解析を行って、スプリングバック量として図8に示した首振り量とはね量をそれぞれ算出する。 In the present embodiment, as shown in FIG. 9, the press-formedproduct 10 is divided into a plurality of regions (6 divisions A to F in the longitudinal direction and 3 divisions 1 to 3 in the width direction), and stress in each region. Eliminate the difference, that is, set the stress difference value to zero. The region for eliminating the stress difference does not necessarily have to be one region, and the stress difference in a plurality of regions may be eliminated.
After erasing the value in a certain region, a springback analysis is performed to calculate the swing amount and the splash amount shown in FIG. 8 as the springback amount.
ある領域の値を消去した後、スプリングバック解析を行って、スプリングバック量として図8に示した首振り量とはね量をそれぞれ算出する。 In the present embodiment, as shown in FIG. 9, the press-formed
After erasing the value in a certain region, a springback analysis is performed to calculate the swing amount and the splash amount shown in FIG. 8 as the springback amount.
図10に、応力差分分布設定ステップS5で設定した応力差分分布から領域1(図10(a)参照)における応力差分を消去(応力差分の値をゼロ)し、スプリングバック解析を行って算出した変位(図10(b)参照)を示す。算出した変位に基づいてスプリングバック量(首振り量、はね量)を算出した。領域2、領域3についても同様にスプリングバック量を算出した(図示は省略)。
In FIG. 10, the stress difference in the region 1 (see FIG. 10A) was eliminated from the stress difference distribution set in the stress difference distribution setting step S5 (the value of the stress difference was zero), and the springback analysis was performed to calculate. The displacement (see FIG. 10B) is shown. The springback amount (swing amount, splash amount) was calculated based on the calculated displacement. The springback amount was calculated in the same manner for the regions 2 and 3 (not shown).
同様に、図11に、応力差分分布設定ステップS5で設定した応力差分分布から領域A(図11(a)参照)における応力差分を消去(応力差分の値をゼロ)し、スプリングバック解析を行って算出した変位(図11(b)参照)を示す。算出した変位に基づいてスプリングバック量(首振り量、はね量)を算出した。領域B~Fについても同様にスプリングバック量を算出した(図示は省略)。
Similarly, in FIG. 11, the stress difference in the region A (see FIG. 11A) is eliminated from the stress difference distribution set in the stress difference distribution setting step S5 (the value of the stress difference is zero), and springback analysis is performed. (See FIG. 11B) is shown. The springback amount (swing amount, splash amount) was calculated based on the calculated displacement. The springback amount was calculated in the same manner for the regions B to F (not shown).
また、図12、図13に、応力差分分布設定ステップS5で設定した応力差分分布から領域A-1、領域A-3(図12(a)、図13(a)参照)における応力差分を消去(応力差分の値をゼロ)し、スプリングバック解析を行って算出した変位(図12(b)、図13(b)参照)を示す。算出した変位に基づいてスプリングバック量(首振り量、はね量)を算出した。領域A-1~領域F-3についても同様にスプリングバック量を算出した(図示は省略)。
Further, in FIGS. 12 and 13, the stress differences in the regions A-1 and A-3 (see FIGS. 12A and 13A) are deleted from the stress difference distribution set in the stress difference distribution setting step S5. (The value of the stress difference is set to zero), and the displacement calculated by performing the springback analysis (see FIGS. 12 (b) and 13 (b)) is shown. The springback amount (swing amount, splash amount) was calculated based on the calculated displacement. The springback amount was calculated in the same manner for the regions A-1 to F-3 (not shown).
<スプリングバック量乖離要因部位特定ステップ>
スプリングバック量乖離要因部位特定ステップS11は、応力差分スプリングバック量取得ステップS7及び変更応力差分スプリングバック量取得ステップS9で算出したスプリングバック量に基づいて、CAE解析と実パネルでスプリングバック量に乖離が生じる要因となる部位を特定するステップである。 <Step to identify the cause of the springback amount deviation>
The springback amount divergence factor site identification step S11 deviates from the springback amount in the CAE analysis and the actual panel based on the springback amount calculated in the stress difference springback amount acquisition step S7 and the changed stress difference springback amount acquisition step S9. It is a step to identify the part that causes the occurrence of.
図14に、応力差分スプリングバック量取得ステップS7及び変更応力差分スプリングバック量取得ステップS9で算出した首振り量の結果を示す。図14において、baseは、応力消去を行っていない応力差分分布による首振り量であり、1~3、A~F、A-1~F-3は、各領域の応力差分を消去した変更応力差分分布による首振り量である。
FIG. 14 shows the results of the swing amount calculated in the stress difference springback amount acquisition step S7 and the changed stress difference springback amount acquisition step S9. In FIG. 14, base is the amount of swing due to the stress difference distribution in which stress elimination is not performed, and 1 to 3, A to F, and A-1 to F-3 are altered stresses in which the stress difference in each region is eliminated. It is the amount of swing due to the difference distribution.
応力差分を変更しない場合の首振り量(base)は、-10.7mmである。これに対し、応力消去領域が領域1~3の首振り量をみると、領域2のみ領域1、3に比べてbaseからの変化が大きいことがわかる。
同様に、応力消去領域が領域A~Fの首振り量をみると、領域D及び領域Eが他の領域に比べてbaseからの変化が大きいことがわかる。 The swing amount (base) when the stress difference is not changed is -10.7 mm. On the other hand, when looking at the swing amount of thestress scavenging regions 1 to 3, it can be seen that only the region 2 has a larger change from the base than the regions 1 and 3.
Similarly, when the amount of swing of the stress scavenging regions A to F is observed, it can be seen that the regions D and E have a larger change from the base than the other regions.
同様に、応力消去領域が領域A~Fの首振り量をみると、領域D及び領域Eが他の領域に比べてbaseからの変化が大きいことがわかる。 The swing amount (base) when the stress difference is not changed is -10.7 mm. On the other hand, when looking at the swing amount of the
Similarly, when the amount of swing of the stress scavenging regions A to F is observed, it can be seen that the regions D and E have a larger change from the base than the other regions.
次に、さらに細分化した領域である領域A-1~領域F-3を応力消去した場合の首振り量をみると、領域D-2及び領域E-2の首振り量が応力消去を行っていないbaseに比べて低減していることがわかる。このように、ある領域の応力差分を消去したことによって首振り量が低減するのは、当該領域が首振り量の乖離に大きく影響することを示している。
上述した領域2及び領域D、Eにおいても変化が大きかったことからもこれは妥当な結果であり、領域D-2及び領域E-2が、CAE解析と実パネルの首振り量に乖離を生じさせる部位であると特定することができる。 Next, looking at the amount of swing when the regions A-1 to F-3, which are further subdivided regions, are stress-erased, the swing amounts of regions D-2 and E-2 perform stress elimination. It can be seen that it is reduced compared to the base that is not. The fact that the swing amount is reduced by eliminating the stress difference in a certain region indicates that the region has a great influence on the deviation of the swing amount.
This is a reasonable result because the changes were large in the above-mentionedareas 2 and D and E, and the areas D-2 and E-2 caused a discrepancy between the CAE analysis and the swing amount of the actual panel. It can be specified as the part to be caused.
上述した領域2及び領域D、Eにおいても変化が大きかったことからもこれは妥当な結果であり、領域D-2及び領域E-2が、CAE解析と実パネルの首振り量に乖離を生じさせる部位であると特定することができる。 Next, looking at the amount of swing when the regions A-1 to F-3, which are further subdivided regions, are stress-erased, the swing amounts of regions D-2 and E-2 perform stress elimination. It can be seen that it is reduced compared to the base that is not. The fact that the swing amount is reduced by eliminating the stress difference in a certain region indicates that the region has a great influence on the deviation of the swing amount.
This is a reasonable result because the changes were large in the above-mentioned
なお、領域D-2及び領域E-2以外の領域における首振り量は、応力差分を変更しない場合の首振り量(base)と同程度であることから、これらの領域は、CAE解析と実パネルの首振り量の乖離に対する影響が小さい部位であると判断される。
Since the swing amount in the regions other than the regions D-2 and E-2 is about the same as the swing amount (base) when the stress difference is not changed, these regions are the same as the CAE analysis. It is judged that the part has a small effect on the deviation of the swing amount of the panel.
はね量に関しても同様に、算出した結果を図15に示す。
応力差分を変更しない場合のはね量(base)は、4.2mmである。これに対し、応力消去領域が領域1~3のはね量をみると、領域2(-8.3mm)のみ領域1(4.8mm)、領域3(7.5mm)に比べてbaseからの変化が大きいことがわかる。
同様に、応力消去領域が領域A~Fのはね量をみると、領域D(-2.9mm)及び領域F(-0.9mm)が他の領域に比べてbaseからの変化が大きいことがわかる。 Similarly, the calculated result of the amount of splash is shown in FIG.
The amount of splash (base) when the stress difference is not changed is 4.2 mm. On the other hand, when looking at the amount of splash in thestress scavenging regions 1 to 3, only region 2 (-8.3 mm) has a larger change from base than region 1 (4.8 mm) and region 3 (7.5 mm). You can see that.
Similarly, looking at the amount of splash in the areas A to F of the stress elimination region, it can be seen that the area D (-2.9 mm) and the area F (-0.9 mm) have a larger change from the base than the other areas. ..
応力差分を変更しない場合のはね量(base)は、4.2mmである。これに対し、応力消去領域が領域1~3のはね量をみると、領域2(-8.3mm)のみ領域1(4.8mm)、領域3(7.5mm)に比べてbaseからの変化が大きいことがわかる。
同様に、応力消去領域が領域A~Fのはね量をみると、領域D(-2.9mm)及び領域F(-0.9mm)が他の領域に比べてbaseからの変化が大きいことがわかる。 Similarly, the calculated result of the amount of splash is shown in FIG.
The amount of splash (base) when the stress difference is not changed is 4.2 mm. On the other hand, when looking at the amount of splash in the
Similarly, looking at the amount of splash in the areas A to F of the stress elimination region, it can be seen that the area D (-2.9 mm) and the area F (-0.9 mm) have a larger change from the base than the other areas. ..
次に、さらに細分化した領域である領域A-1~領域F-3を応力消去した場合のはね量をみると、領域F-2のはね量(0.1mm)が応力消去を行っていないbaseに比べて大きく低減しており、はねがほとんど生じていないことがわかる。首振り量と同様、ある領域の応力差分を消去したことによってはね量が低減するのは、当該領域がはね量の乖離に大きく影響することを示している。
領域2及び領域Fにおいてもはね量の変化が大きかったことからもこれは妥当な結果であり、領域F-2が、CAE解析と実パネルのはね量に乖離を生じさせる部位であると特定することができる。 Next, looking at the amount of splash when stress-eliminating regions A-1 to F-3, which are further subdivided regions, the amount of splash (0.1 mm) in region F-2 is stress-eliminating. It is greatly reduced compared to the base without base, and it can be seen that almost no splash occurs. Similar to the swing amount, the reduction of the splash amount by eliminating the stress difference in a certain region indicates that the region has a great influence on the deviation of the splash amount.
This is a reasonable result because the change in the amount of splashing was large in thearea 2 and the area F, and it is considered that the area F-2 is a site that causes a discrepancy between the CAE analysis and the amount of splashing in the actual panel. Can be identified.
領域2及び領域Fにおいてもはね量の変化が大きかったことからもこれは妥当な結果であり、領域F-2が、CAE解析と実パネルのはね量に乖離を生じさせる部位であると特定することができる。 Next, looking at the amount of splash when stress-eliminating regions A-1 to F-3, which are further subdivided regions, the amount of splash (0.1 mm) in region F-2 is stress-eliminating. It is greatly reduced compared to the base without base, and it can be seen that almost no splash occurs. Similar to the swing amount, the reduction of the splash amount by eliminating the stress difference in a certain region indicates that the region has a great influence on the deviation of the splash amount.
This is a reasonable result because the change in the amount of splashing was large in the
領域2及び領域Dもbaseからの変化が大きかったが、細分化した領域D-2の応力を消去した場合の結果をみるとはね量が-4.6mmとなっており、応力消去を行わなかったbaseのはね量4.2mmと比べると、はね方向が逆向きになり、かつ、はね量が増加している。
これは、領域D-2における応力差分を消去することで、当該領域がはね量をさらに乖離させやすい部位であることを示すものである。すなわち、領域D-2は応力差分があることによってはね量の乖離を抑制する部位であり、乖離を生じさせる部位ではないと判断される。Areas 2 and D also had a large change from the base, but the results when the stress in the subdivided area D-2 was eliminated showed that the amount of splash was -4.6 mm, and stress elimination was not performed. Compared to the 4.2mm splash amount of the base, the splash direction is opposite and the splash amount is increased.
This indicates that the region is a region where the amount of splash is more likely to be dissociated by eliminating the stress difference in the region D-2. That is, it is determined that the region D-2 is a portion that suppresses the deviation of the splash amount due to the stress difference, and is not a portion that causes the deviation.
これは、領域D-2における応力差分を消去することで、当該領域がはね量をさらに乖離させやすい部位であることを示すものである。すなわち、領域D-2は応力差分があることによってはね量の乖離を抑制する部位であり、乖離を生じさせる部位ではないと判断される。
This indicates that the region is a region where the amount of splash is more likely to be dissociated by eliminating the stress difference in the region D-2. That is, it is determined that the region D-2 is a portion that suppresses the deviation of the splash amount due to the stress difference, and is not a portion that causes the deviation.
なお、本実施の形態では図14、図15に示すように、細分化した領域A-1~F-3のすべてにおいて応力消去を行った場合のスプリングバック量を算出したが、前述したように領域1~3、領域A~Fの結果から、影響が大きいと想定される領域を絞ることができるため、その領域のみさらに細分化した場合の結果を求めるようにしてもよい。複雑な形状のプレス成形品は分割領域を多くしてさらに細分化する必要があり、すべての細分化領域において結果を求めることは時間を要する。そのため、大きい領域分割から乖離に影響がありそうな部位を絞り込みながら分析を行うことで、乖離要因部位特定までの時間を短縮することができる。
In the present embodiment, as shown in FIGS. 14 and 15, the amount of springback when stress elimination is performed in all of the subdivided regions A-1 to F-3 is calculated, but as described above. From the results of regions 1 to 3 and regions A to F, it is possible to narrow down the regions that are expected to have a large influence, so that the results when only those regions are further subdivided may be obtained. Press-formed products having complicated shapes need to be further subdivided by increasing the number of divided regions, and it takes time to obtain results in all the subdivided regions. Therefore, it is possible to shorten the time from the large region division to the identification of the dissociation factor site by performing the analysis while narrowing down the sites that are likely to affect the dissociation.
次に、本実施の形態に係るスプリングバック量乖離要因部位特定方法により特定された部位が、CAE解析と実パネルのスプリングバック量に乖離が生じる要因となる部位であると判断することの妥当性について説明する。
Next, it is appropriate to determine that the part specified by the springback amount deviation factor part identification method according to the present embodiment is the part that causes the difference between the CAE analysis and the springback amount of the actual panel. Will be described.
上述のとおり、図2に示すプレス成形品10を成形するにあたって、プレス成形品10における領域D-2及び領域E-2が、CAE解析と実パネルの首振り量に乖離が生じる要因となる部位であると特定された。また、領域F-2が、はね量に乖離が生じる要因となる部位であると特定された。
そこで、CAE解析によって得られた駆動応力分布(図3参照)における、前記特定された各部位の駆動応力を、これに対応する実パネルの各部位の駆動応力分布に置換して、スプリングバック解析を行い、スプリングバック量の乖離が低減するかどうかについて検証した。 As described above, when the press-moldedproduct 10 shown in FIG. 2 is molded, the regions D-2 and E-2 in the press-molded product 10 cause a discrepancy between the CAE analysis and the swing amount of the actual panel. Was identified as. In addition, region F-2 was identified as a site that causes a deviation in the amount of splash.
Therefore, in the driving stress distribution obtained by CAE analysis (see FIG. 3), the driving stress of each of the specified parts is replaced with the corresponding driving stress distribution of each part of the actual panel, and the springback analysis is performed. Was performed, and it was verified whether the deviation of the springback amount was reduced.
そこで、CAE解析によって得られた駆動応力分布(図3参照)における、前記特定された各部位の駆動応力を、これに対応する実パネルの各部位の駆動応力分布に置換して、スプリングバック解析を行い、スプリングバック量の乖離が低減するかどうかについて検証した。 As described above, when the press-molded
Therefore, in the driving stress distribution obtained by CAE analysis (see FIG. 3), the driving stress of each of the specified parts is replaced with the corresponding driving stress distribution of each part of the actual panel, and the springback analysis is performed. Was performed, and it was verified whether the deviation of the springback amount was reduced.
まず、CAE解析と実パネルの首振りの乖離量が低減するかどうかを検証した結果を図16に示す。
図16はCAE解析における首振り量から実パネルにおける首振り量を差し引いた結果(乖離量)をグラフにしたものであり、縦軸が乖離量を、横軸が応力置換領域をそれぞれ示している。横軸における「なし」は、応力置換領域が無い場合であり、この場合には、乖離量はCAE解析と実パネルの差である-11.6mmとなっている。また、「ALL」は、CAE解析の駆動応力分布の全ての領域を実パネルの駆動応力分布に置換した場合であり、この場合には、乖離量はほぼゼロとなる。
これらに対して、本実施の形態で特定された領域D-2または領域E-2のみに実パネルの応力分布を置き換えた場合は、図16の「D-2」「E-2」に示されるように、いずれにおいても実パネルとの首振り乖離量が減少した。
さらに、「D-2/E-2」に示されるように、領域D-2、E-2の両方に実パネルの応力分布を置き換えることで、実パネルとの首振り乖離量をより低減できることが示された。 First, FIG. 16 shows the result of verifying whether or not the amount of deviation between the CAE analysis and the swing of the actual panel is reduced.
FIG. 16 is a graph showing the result (deviation amount) obtained by subtracting the swing amount in the actual panel from the swing amount in the CAE analysis, and the vertical axis shows the deviation amount and the horizontal axis shows the stress substitution region. .. “None” on the horizontal axis means that there is no stress substitution region. In this case, the amount of dissociation is -11.6 mm, which is the difference between the CAE analysis and the actual panel. Further, "ALL" is a case where all the regions of the driving stress distribution of the CAE analysis are replaced with the driving stress distribution of the actual panel, and in this case, the dissociation amount becomes almost zero.
On the other hand, when the stress distribution of the actual panel is replaced only in the region D-2 or the region E-2 specified in the present embodiment, it is shown in "D-2" and "E-2" of FIG. In each case, the amount of swing deviation from the actual panel decreased.
Furthermore, as shown in "D-2 / E-2", by replacing the stress distribution of the actual panel in both the regions D-2 and E-2, the amount of swing deviation from the actual panel can be further reduced. It has been shown.
同様に、CAE解析と実パネルのはねの乖離量が低減するかどうかを検証した結果を図17に示す。はね量の乖離についても、「F-2」に示されるように、成形下死点における領域F-2の応力分布を実パネルの応力分布に置き換えることで、実パネルとのはね乖離量が減少した。
Similarly, FIG. 17 shows the result of verifying whether or not the amount of deviation between the CAE analysis and the splash of the actual panel is reduced. Regarding the deviation of the amount of splash, as shown in "F-2", by replacing the stress distribution of the region F-2 at the bottom dead center of the molding with the stress distribution of the actual panel, the amount of deviation from the actual panel Has decreased.
この結果は、本実施の形態に係るスプリングバック量乖離要因部位特定方法により特定された部位が、CAE解析と実パネルのスプリングバック量乖離の要因となる部位として妥当であることを示すものである。
This result shows that the part specified by the springback amount divergence factor part identification method according to the present embodiment is appropriate as a part that causes the springback amount divergence in the CAE analysis and the actual panel. ..
以上のように、本実施の形態に係る方法によれば、CAE解析と実パネルのスプリングバック量乖離の要因となる部位を精度良く特定できることが示された。
このようにスプリングバック量乖離の要因となる部位を特定することで、CAE解析と実パネルの離型後形状を近づけるために行っていた金型や成形条件などの調整作業を効率的に行うことができる。
また、特定した部位を中心にCAE解析上の設定や金型形状を見直すことで、スプリングバック解析の再現性を向上させることができ、CAE解析を用いたスプリングバック対策の有用性を担保することができる。 As described above, it has been shown that according to the method according to the present embodiment, it is possible to accurately identify the portion that causes the difference between the CAE analysis and the springback amount of the actual panel.
By identifying the part that causes the springback amount deviation in this way, it is possible to efficiently perform the adjustment work such as the mold and molding conditions that were performed to bring the CAE analysis and the shape of the actual panel after mold release closer. Can be done.
In addition, the reproducibility of springback analysis can be improved by reviewing the CAE analysis settings and mold shape focusing on the specified part, and the usefulness of springback countermeasures using CAE analysis can be ensured. Can be done.
なお、本実施の形態で行う応力差分分布の変更は、少なくともある一部の領域の応力差分を消去(すべての成分をゼロに)するものであったが、応力差分分布を変更する方法はこれに限るものではなく、応力差分分布に対して少なくとも1方向の成分を、消去する、定数倍する、定数を加算する、定数乗する、被加工材の板厚方向の平均値に置き換える、被加工材の板厚方向の中央値に置き換える、のいずれかにより行えばよい。
The change in the stress difference distribution performed in the present embodiment was to eliminate the stress difference in at least a part of the region (all components are set to zero), but this is the method for changing the stress difference distribution. It is not limited to, but the components in at least one direction with respect to the stress difference distribution are eliminated, multiplied by a constant, added with a constant, multiplied by a constant, replaced with the average value in the plate thickness direction of the material to be processed, and processed. It may be performed by either replacing it with the median value in the plate thickness direction of the material.
[実施の形態2]
実施の形態1で説明したスプリングバック量乖離要因部位特定方法は、予め設定されたプログラムをPC(パーソナルコンピュータ)に実行させることで実現できる。そのような装置の一例を本実施の形態にて説明する。
本実施の形態に係るスプリングバック量乖離要因部位特定装置11は、図18に一例を示すような、表示装置13と、入力装置15と、主記憶装置17と、補助記憶装置19と、演算処理部21を有している。演算処理部21には、表示装置13、入力装置15、主記憶装置17及び補助記憶装置19が接続され、演算処理部21の指令によって各機能を行う。 [Embodiment 2]
The method for identifying the springback amount divergence factor portion described in the first embodiment can be realized by causing a PC (personal computer) to execute a preset program. An example of such a device will be described in this embodiment.
The springback amount deviation factorsite identification device 11 according to the present embodiment includes a display device 13, an input device 15, a main storage device 17, an auxiliary storage device 19, and arithmetic processing as shown in FIG. 18 as an example. It has a part 21. A display device 13, an input device 15, a main storage device 17, and an auxiliary storage device 19 are connected to the arithmetic processing unit 21, and each function is performed by a command of the arithmetic processing unit 21.
実施の形態1で説明したスプリングバック量乖離要因部位特定方法は、予め設定されたプログラムをPC(パーソナルコンピュータ)に実行させることで実現できる。そのような装置の一例を本実施の形態にて説明する。
本実施の形態に係るスプリングバック量乖離要因部位特定装置11は、図18に一例を示すような、表示装置13と、入力装置15と、主記憶装置17と、補助記憶装置19と、演算処理部21を有している。演算処理部21には、表示装置13、入力装置15、主記憶装置17及び補助記憶装置19が接続され、演算処理部21の指令によって各機能を行う。 [Embodiment 2]
The method for identifying the springback amount divergence factor portion described in the first embodiment can be realized by causing a PC (personal computer) to execute a preset program. An example of such a device will be described in this embodiment.
The springback amount deviation factor
表示装置13は実行結果の表示等に用いられ、液晶モニター等で構成される。入力装置15はオペレータからの入力等に用いられ、キーボードやマウス等で構成される。主記憶装置17は演算処理部21で使用するデータの一時保存や演算等に用いられRAM等で構成される。補助記憶装置19はデータの記憶等に用いられ、ハードディスク等で構成される。
補助記憶装置19には少なくとも、三次元形状測定データ23、金型モデル25等のCAE解析に必要な各種データが記憶されている。 Thedisplay device 13 is used for displaying an execution result and the like, and is composed of a liquid crystal monitor and the like. The input device 15 is used for input from an operator and is composed of a keyboard, a mouse, and the like. The main storage device 17 is used for temporary storage and calculation of data used by the calculation processing unit 21, and is composed of a RAM or the like. The auxiliary storage device 19 is used for storing data and the like, and is composed of a hard disk and the like.
At least various data necessary for CAE analysis such as the three-dimensionalshape measurement data 23 and the mold model 25 are stored in the auxiliary storage device 19.
補助記憶装置19には少なくとも、三次元形状測定データ23、金型モデル25等のCAE解析に必要な各種データが記憶されている。 The
At least various data necessary for CAE analysis such as the three-dimensional
演算処理部21はPCなどのCPU等によって構成されている。成形品駆動応力分布取得手段27と、解析駆動応力分布取得手段29と、応力差分分布設定手段31と、応力差分スプリングバック量取得手段33と、変更応力差分スプリングバック量取得手段35と、スプリングバック量乖離要因部位特定手段37は、演算処理部21で予め設定されたプログラムが実行されることで実現される。
The arithmetic processing unit 21 is composed of a CPU such as a PC. Molded product drive stress distribution acquisition means 27, analysis drive stress distribution acquisition means 29, stress difference distribution setting means 31, stress difference springback amount acquisition means 33, modified stress difference springback amount acquisition means 35, and springback. The quantity divergence factor site identifying means 37 is realized by executing a preset program in the arithmetic processing unit 21.
成形品駆動応力分布取得手段27は実施の形態1で説明した成形品駆動応力分布取得ステップS1と同様の処理を実現するものである。同様に、解析駆動応力分布取得手段29は解析駆動応力分布取得ステップS3を、応力差分分布設定手段31は応力差分分布設定ステップS5を、応力差分スプリングバック量取得手段33は応力差分スプリングバック量取得ステップS7を、変更応力差分スプリングバック量取得手段35は変更応力差分スプリングバック量取得ステップS9を、スプリングバック量乖離要因部位特定手段37はスプリングバック量乖離要因部位特定ステップS11をそれぞれ実現するものである。
The molded product driving stress distribution acquisition means 27 realizes the same processing as the molded product driving stress distribution acquisition step S1 described in the first embodiment. Similarly, the analysis drive stress distribution acquisition means 29 performs the analysis drive stress distribution acquisition step S3, the stress difference distribution setting means 31 performs the stress difference distribution setting step S5, and the stress difference springback amount acquisition means 33 acquires the stress difference springback amount. In step S7, the changed stress difference springback amount acquisition means 35 realizes the changed stress difference springback amount acquisition step S9, and the springback amount deviation factor site specifying means 37 realizes the springback amount deviation factor site specifying step S11. is there.
上述したような本実施の形態によれば、実施の形態1と同様にCAE解析と実パネルのスプリングバック量乖離の要因となる部位を精度良く特定することができる。
よって、特定した部位に基づいてCAE解析と実パネルの離型後形状を近づけるための各種調整作業を効率的に行うことができ、さらにスプリングバック対策の有用性を担保することができる。 According to the present embodiment as described above, it is possible to accurately identify the portion that causes the difference between the CAE analysis and the springback amount of the actual panel as in the first embodiment.
Therefore, it is possible to efficiently perform CAE analysis and various adjustment operations for bringing the shape of the actual panel closer to each other based on the specified portion, and further ensure the usefulness of the springback countermeasure.
本発明は最終成形品(製品形状)に限らず、成形工程を分けて行うようなプレス成形品の場合には途中成形品にも適用可能である。また、上述した実施の形態では鋼板を被加工材とする例を説明したが、アルミ板にも適用可能である。
The present invention is not limited to the final molded product (product shape), but can also be applied to an intermediate molded product in the case of a press-molded product in which the molding process is performed separately. Further, in the above-described embodiment, an example in which a steel plate is used as a work material has been described, but it can also be applied to an aluminum plate.
3 金型モデル
5 ダイ
7 パンチ
9 ブランクモデル
10 プレス成形品
11 スプリングバック量乖離要因部位特定装置
13 表示装置
15 入力装置
17 主記憶装置
19 補助記憶装置
21 演算処理部
23 三次元形状測定データ
25 金型モデル
27 成形品駆動応力分布取得手段
29 解析駆動応力分布取得手段
31 応力差分分布設定手段
33 応力差分スプリングバック量取得手段
35 変更応力差分スプリングバック量取得手段
37 スプリングバック量乖離要因部位特定手段 3Die model 5 Die 7 Punch 9 Blank model 10 Press-molded product 11 Springback amount divergence factor part identification device 13 Display device 15 Input device 17 Main memory device 19 Auxiliary storage device 21 Arithmetic processing unit 23 Three-dimensional shape measurement data 25 Gold Type model 27 Molded product drive stress distribution acquisition means 29 Analytical drive stress distribution acquisition means 31 Stress difference distribution setting means 33 Stress difference springback amount acquisition means 35 Change stress difference springback amount acquisition means 37 Springback amount deviation factor Site identification means
5 ダイ
7 パンチ
9 ブランクモデル
10 プレス成形品
11 スプリングバック量乖離要因部位特定装置
13 表示装置
15 入力装置
17 主記憶装置
19 補助記憶装置
21 演算処理部
23 三次元形状測定データ
25 金型モデル
27 成形品駆動応力分布取得手段
29 解析駆動応力分布取得手段
31 応力差分分布設定手段
33 応力差分スプリングバック量取得手段
35 変更応力差分スプリングバック量取得手段
37 スプリングバック量乖離要因部位特定手段 3
Claims (4)
- 実パネルをプレス成形したプレス成形品に生ずるスプリングバック量と、前記プレス成形品と同形状の解析モデルについてスプリングバック解析を行った際のスプリングバック量に乖離が生ずる場合において、該乖離が生ずる要因となる成形品形状における部位を特定するスプリングバック量乖離要因部位特定方法であって、
前記プレス成形品の離型後における表面形状を測定して取得した三次元形状測定データからプレス成形品モデルを作成し、該プレス成形品モデルを金型モデルによって下死点まで挟み込んだ状態の力学的解析を行い、成形下死点における応力分布を前記プレス成形品のスプリングバックに寄与した駆動応力分布として取得する成形品駆動応力分布取得ステップと、
前記スプリングバック解析における下死点応力分布及び離型後の残留応力分布を取得し、該下死点応力分布と離型後の残留応力分布の差分をスプリングバック解析における駆動応力分布として取得する解析駆動応力分布取得ステップと、
該解析駆動応力分布取得ステップで取得した解析駆動応力分布と前記成形品駆動応力分布取得ステップで取得した成形品駆動応力分布の差分から応力差分分布を取得して、前記スプリングバック解析における下死点の成形品形状に前記応力差分分布を設定する応力差分分布設定ステップと、
該設定した応力差分分布に基づいてスプリングバック解析を行ってスプリングバック量を取得する応力差分スプリングバック量取得ステップと、
前記応力差分分布設定ステップで設定した前記応力差分分布のうち、一部の領域の応力差分の値を変更して、該変更した応力差分分布に基づいてスプリングバック解析を行ってスプリングバック量を取得する変更応力差分スプリングバック量取得ステップと、
該変更応力差分スプリングバック量取得ステップ及び前記応力差分スプリングバック量取得ステップで取得したスプリングバック量を比較して、前記プレス成形品と前記スプリングバック解析のスプリングバック量に乖離が生ずる要因となる成形品形状における部位を特定するスプリングバック量乖離要因部位特定ステップと、を備えているスプリングバック量乖離要因部位特定方法。 Factors that cause a discrepancy between the amount of springback that occurs in a press-molded product obtained by press-molding an actual panel and the amount of springback that occurs when a springback analysis is performed on an analysis model having the same shape as the press-molded product. This is a method for identifying the part of the springback amount deviation factor that specifies the part in the shape of the molded product.
A press-molded product model is created from the three-dimensional shape measurement data obtained by measuring the surface shape of the press-molded product after mold release, and the press-molded product model is sandwiched by the mold model to the bottom dead point. The step of acquiring the drive stress distribution of the molded product and the step of acquiring the stress distribution at the bottom dead point of the molding as the drive stress distribution contributing to the springback of the press-molded product.
An analysis in which the bottom dead point stress distribution and the residual stress distribution after mold release in the springback analysis are acquired, and the difference between the bottom dead point stress distribution and the residual stress distribution after mold release is acquired as the driving stress distribution in the springback analysis. Driving stress distribution acquisition step and
The stress difference distribution is acquired from the difference between the analytical driving stress distribution acquired in the analytical driving stress distribution acquisition step and the molded product driving stress distribution acquired in the molded product driving stress distribution acquisition step, and the bottom dead point in the springback analysis is obtained. The stress difference distribution setting step for setting the stress difference distribution in the shape of the molded product of
A stress difference springback amount acquisition step for acquiring a springback amount by performing a springback analysis based on the set stress difference distribution, and
Of the stress difference distribution set in the stress difference distribution setting step, the value of the stress difference in a part of the region is changed, and the springback analysis is performed based on the changed stress difference distribution to obtain the springback amount. Change stress difference Springback amount acquisition step and
Comparing the springback amount acquired in the changed stress difference springback amount acquisition step and the stress difference springback amount acquisition step, molding that causes a discrepancy between the press-molded product and the springback amount in the springback analysis. A springback amount divergence factor part identification method including a springback amount divergence factor part identification step for specifying a part in the product shape. - 前記変更応力差分スプリングバック量取得ステップにおける応力差分の値の変更は、前記応力差分分布に対して少なくとも1方向の成分を、消去する、定数倍する、定数を加算する、定数乗する、被加工材の板厚方向の平均値に置き換える、被加工材の板厚方向の中央値に置き換える、のいずれかである請求項1記載のスプリングバック量乖離要因部位特定方法。 To change the value of the stress difference in the change stress difference springback amount acquisition step, the components in at least one direction with respect to the stress difference distribution are eliminated, multiplied by a constant, added by a constant, multiplied by a constant, or processed. The method for identifying a portion of a springback amount deviation factor according to claim 1, wherein the value is replaced with the average value in the plate thickness direction of the material or the median value in the plate thickness direction of the material to be processed.
- 実パネルをプレス成形したプレス成形品に生ずるスプリングバック量と、前記プレス成形品と同形状の解析モデルについてスプリングバック解析を行った際のスプリングバック量に乖離が生ずる場合において、該乖離が生ずる要因となる成形品形状における部位を特定するスプリングバック量乖離要因部位特定装置であって、
前記プレス成形品の離型後における表面形状を測定して取得した三次元形状測定データからプレス成形品モデルを作成し、該プレス成形品モデルを金型モデルによって下死点まで挟み込んだ状態の力学的解析を行い、成形下死点における応力分布を前記プレス成形品のスプリングバックに寄与した駆動応力分布として取得する成形品駆動応力分布取得手段と、
前記スプリングバック解析における下死点応力分布及び離型後の残留応力分布を取得し、該下死点応力分布と離型後の残留応力分布の差分をスプリングバック解析における駆動応力分布として取得する解析駆動応力分布取得手段と、
該解析駆動応力分布取得手段で取得した解析駆動応力分布と前記成形品駆動応力分布取得手段で取得した成形品駆動応力分布の差分から応力差分分布を取得して、前記スプリングバック解析における下死点の成形品形状に前記応力差分分布を設定する応力差分分布設定手段と、
該設定した応力差分分布に基づいてスプリングバック解析を行ってスプリングバック量を取得する応力差分スプリングバック量取得手段と、
前記応力差分分布設定手段で設定した前記応力差分分布のうち、一部の領域の応力差分の値を変更して、該変更した応力差分分布に基づいてスプリングバック解析を行ってスプリングバック量を取得する変更応力差分スプリングバック量取得手段と、
該変更応力差分スプリングバック量取得手段及び前記応力差分スプリングバック量取得手段で取得したスプリングバック量を比較して、前記プレス成形品と前記スプリングバック解析のスプリングバック量に乖離が生ずる要因となる成形品形状における部位を特定するスプリングバック量乖離要因部位特定手段と、を備えているスプリングバック量乖離要因部位特定装置。 Factors that cause a discrepancy between the amount of springback that occurs in a press-molded product obtained by press-molding an actual panel and the amount of springback that occurs when a springback analysis is performed on an analysis model having the same shape as the press-molded product. It is a device for identifying the part of the springback amount deviation factor that specifies the part in the shape of the molded product.
A press-molded product model is created from the three-dimensional shape measurement data obtained by measuring the surface shape of the press-molded product after mold release, and the press-molded product model is sandwiched by the mold model to the bottom dead point. A molded product driving stress distribution acquisition means for performing a physical analysis and acquiring the stress distribution at the bottom dead point of the molding as a driving stress distribution contributing to the springback of the press-molded product.
An analysis in which the bottom dead point stress distribution and the residual stress distribution after mold release in the springback analysis are acquired, and the difference between the bottom dead point stress distribution and the residual stress distribution after mold release is acquired as the driving stress distribution in the springback analysis. Driving stress distribution acquisition means and
The stress difference distribution is acquired from the difference between the analytical driving stress distribution acquired by the analytical driving stress distribution acquisition means and the molded product driving stress distribution acquired by the molded product driving stress distribution acquisition means, and the bottom dead point in the springback analysis is obtained. A stress difference distribution setting means for setting the stress difference distribution in the shape of the molded product of
A stress difference springback amount acquisition means for acquiring a springback amount by performing a springback analysis based on the set stress difference distribution, and
Of the stress difference distribution set by the stress difference distribution setting means, the value of the stress difference in a part of the region is changed, and the springback analysis is performed based on the changed stress difference distribution to obtain the springback amount. Change stress difference Springback amount acquisition means and
Comparing the springback amount acquired by the modified stress difference springback amount acquisition means and the stress difference springback amount acquisition means, molding that causes a discrepancy between the press-molded product and the springback amount in the springback analysis. A springback amount deviation factor part identification device including a springback amount deviation factor part identification means for specifying a part in the product shape. - 前記変更応力差分スプリングバック量取得手段における応力差分の値の変更は、前記応力差分分布に対して少なくとも1方向の成分を、消去する、定数倍する、定数を加算する、定数乗する、被加工材の板厚方向の平均値に置き換える、被加工材の板厚方向の中央値に置き換える、のいずれかである請求項3記載のスプリングバック量乖離要因部位特定装置。 To change the value of the stress difference in the changed stress difference springback amount acquisition means, the component in at least one direction with respect to the stress difference distribution is eliminated, multiplied by a constant, added by a constant, multiplied by a constant, or processed. The device for identifying a component of a springback amount deviation factor according to claim 3, wherein the value is replaced with the average value in the plate thickness direction of the material or the median value in the plate thickness direction of the material to be processed.
Priority Applications (5)
| Application Number | Priority Date | Filing Date | Title |
|---|---|---|---|
| MX2021012954A MX2021012954A (en) | 2019-04-25 | 2020-04-16 | Spring-back amount divergence origin site specification method and device. |
| US17/606,202 US20220219217A1 (en) | 2019-04-25 | 2020-04-16 | Springback amount discrepancy factor portion identification method and apparatus |
| EP20795399.3A EP3960320A4 (en) | 2019-04-25 | 2020-04-16 | Spring-back amount divergence origin site specification method and device |
| CN202080030142.6A CN113727790B (en) | 2019-04-25 | 2020-04-16 | Method and device for determining main factor part of springback value deviation |
| KR1020217034409A KR102549984B1 (en) | 2019-04-25 | 2020-04-16 | Springback amount discrepancy factor portion identification method and apparatus, and computer-readable medium storing program of springback amount discrepancy factor portion identification |
Applications Claiming Priority (2)
| Application Number | Priority Date | Filing Date | Title |
|---|---|---|---|
| JP2019083661A JP6852750B2 (en) | 2019-04-25 | 2019-04-25 | Springback amount Dissociation factor Part identification method and device |
| JP2019-083661 | 2019-04-25 |
Publications (1)
| Publication Number | Publication Date |
|---|---|
| WO2020218145A1 true WO2020218145A1 (en) | 2020-10-29 |
Family
ID=72941894
Family Applications (1)
| Application Number | Title | Priority Date | Filing Date |
|---|---|---|---|
| PCT/JP2020/016698 WO2020218145A1 (en) | 2019-04-25 | 2020-04-16 | Spring-back amount divergence origin site specification method and device |
Country Status (7)
| Country | Link |
|---|---|
| US (1) | US20220219217A1 (en) |
| EP (1) | EP3960320A4 (en) |
| JP (1) | JP6852750B2 (en) |
| KR (1) | KR102549984B1 (en) |
| CN (1) | CN113727790B (en) |
| MX (1) | MX2021012954A (en) |
| WO (1) | WO2020218145A1 (en) |
Families Citing this family (1)
| Publication number | Priority date | Publication date | Assignee | Title |
|---|---|---|---|---|
| CN114571124B (en) * | 2022-04-07 | 2024-01-30 | 三一技术装备有限公司 | Battery cell welding position determining method and battery module manufacturing method |
Citations (5)
| Publication number | Priority date | Publication date | Assignee | Title |
|---|---|---|---|---|
| JPH0219639B2 (en) * | 1983-09-14 | 1990-05-02 | Matsushita Electric Ind Co Ltd | |
| JP2007229724A (en) | 2006-02-27 | 2007-09-13 | Jfe Steel Kk | Method of analyzing press forming |
| JP2012206158A (en) | 2011-03-30 | 2012-10-25 | Jfe Steel Corp | Press forming analysis method |
| JP2013043182A (en) * | 2011-08-22 | 2013-03-04 | Jfe Steel Corp | Method of confirming spring back countermeasure effect of press molded product and device |
| JP2013071120A (en) | 2011-09-26 | 2013-04-22 | Jfe Steel Corp | Method and device for analyzing spring back factor in press molding |
Family Cites Families (8)
| Publication number | Priority date | Publication date | Assignee | Title |
|---|---|---|---|---|
| JP2554368Y2 (en) * | 1992-03-16 | 1997-11-17 | 関東自動車工業株式会社 | Pressed product residual stress analyzer |
| JP4352658B2 (en) * | 2002-05-29 | 2009-10-28 | Jfeスチール株式会社 | Springback analysis method for press-formed products |
| JP4724626B2 (en) * | 2006-08-31 | 2011-07-13 | 新日本製鐵株式会社 | Springback occurrence cause identifying method, apparatus thereof, and program thereof |
| JP6064447B2 (en) * | 2012-08-31 | 2017-01-25 | Jfeスチール株式会社 | Springback suppression part manufacturing method |
| JP6060591B2 (en) * | 2012-09-26 | 2017-01-18 | Jfeスチール株式会社 | Method and apparatus for identifying springback factor of press-formed product |
| JP5582211B1 (en) * | 2013-03-14 | 2014-09-03 | Jfeスチール株式会社 | Stress-strain relationship simulation method, springback amount prediction method, and springback analysis device |
| JP5987852B2 (en) * | 2013-05-16 | 2016-09-07 | Jfeスチール株式会社 | Springback amount evaluation method |
| JP6149843B2 (en) | 2014-11-04 | 2017-06-21 | Jfeスチール株式会社 | Method and apparatus for analyzing shape correction of press-formed product, and method for correcting shape of press-formed product |
-
2019
- 2019-04-25 JP JP2019083661A patent/JP6852750B2/en active Active
-
2020
- 2020-04-16 EP EP20795399.3A patent/EP3960320A4/en active Pending
- 2020-04-16 KR KR1020217034409A patent/KR102549984B1/en active IP Right Grant
- 2020-04-16 US US17/606,202 patent/US20220219217A1/en active Pending
- 2020-04-16 CN CN202080030142.6A patent/CN113727790B/en active Active
- 2020-04-16 WO PCT/JP2020/016698 patent/WO2020218145A1/en unknown
- 2020-04-16 MX MX2021012954A patent/MX2021012954A/en unknown
Patent Citations (5)
| Publication number | Priority date | Publication date | Assignee | Title |
|---|---|---|---|---|
| JPH0219639B2 (en) * | 1983-09-14 | 1990-05-02 | Matsushita Electric Ind Co Ltd | |
| JP2007229724A (en) | 2006-02-27 | 2007-09-13 | Jfe Steel Kk | Method of analyzing press forming |
| JP2012206158A (en) | 2011-03-30 | 2012-10-25 | Jfe Steel Corp | Press forming analysis method |
| JP2013043182A (en) * | 2011-08-22 | 2013-03-04 | Jfe Steel Corp | Method of confirming spring back countermeasure effect of press molded product and device |
| JP2013071120A (en) | 2011-09-26 | 2013-04-22 | Jfe Steel Corp | Method and device for analyzing spring back factor in press molding |
Non-Patent Citations (1)
| Title |
|---|
| See also references of EP3960320A4 |
Also Published As
| Publication number | Publication date |
|---|---|
| JP6852750B2 (en) | 2021-03-31 |
| CN113727790A (en) | 2021-11-30 |
| KR102549984B1 (en) | 2023-06-29 |
| EP3960320A4 (en) | 2022-07-13 |
| KR20210141681A (en) | 2021-11-23 |
| MX2021012954A (en) | 2022-01-31 |
| US20220219217A1 (en) | 2022-07-14 |
| JP2020179409A (en) | 2020-11-05 |
| CN113727790B (en) | 2023-03-28 |
| EP3960320A1 (en) | 2022-03-02 |
Similar Documents
| Publication | Publication Date | Title |
|---|---|---|
| US20160288184A1 (en) | Method for Bending Metal Sheet to Achieve High Angle Accuracy | |
| JP5582211B1 (en) | Stress-strain relationship simulation method, springback amount prediction method, and springback analysis device | |
| US6947809B2 (en) | Method of modifying stamping tools for spring back compensation based on tryout measurements | |
| JP6060591B2 (en) | Method and apparatus for identifying springback factor of press-formed product | |
| WO2020158062A1 (en) | Method for identifying variation factor portion of springback amount | |
| JP6519639B1 (en) | Springback amount fluctuation factor site identification method | |
| WO2010073756A1 (en) | Springback occurrence cause analyzing method, springback occurrence cause analyzing device, springback occurrence cause analyzing program, and recording medium | |
| JP2009172677A (en) | Method of analyzing cause of occurrence of spring-back, its device and its program, and recording medium | |
| WO2020218145A1 (en) | Spring-back amount divergence origin site specification method and device | |
| JP5834698B2 (en) | Springback factor analysis method and apparatus in press molding | |
| WO2020235288A1 (en) | Method and device for identifying springback-amount discrepancy-causing sites | |
| CN107729661B (en) | Method for controlling resilience of curved surface stretching flanging of automobile covering part | |
| WO2013027378A1 (en) | Method and device for confirming press molded product springback countermeasure effect | |
| JP2013045119A (en) | Method and device for press molding simulation analysis | |
| JP2012166224A (en) | Molding analysis method, molding analysis device, program, and storage medium | |
| JP2023151337A (en) | Friction coefficient determination method for forming simulation, forming simulation method, pressed part design method, die manufacturing method, pressed part manufacturing method, friction coefficient determination program, and program for forming simulation | |
| JP2005193292A (en) | Method for simulating press molding of nonferrous metal sheet | |
| JP2023108091A (en) | Method, device and program for estimating shape of outer periphery of press molded product | |
| JP2023102256A (en) | Method, device, and program for evaluating peripheral shape of press formed item, and method for manufacturing press formed item | |
| JPH08197153A (en) | Forming acceptance/rejection predicting method for metallic sheet |
Legal Events
| Date | Code | Title | Description |
|---|---|---|---|
| 121 | Ep: the epo has been informed by wipo that ep was designated in this application |
Ref document number: 20795399 Country of ref document: EP Kind code of ref document: A1 |
|
| ENP | Entry into the national phase |
Ref document number: 20217034409 Country of ref document: KR Kind code of ref document: A |
|
| NENP | Non-entry into the national phase |
Ref country code: DE |
|
| ENP | Entry into the national phase |
Ref document number: 2020795399 Country of ref document: EP Effective date: 20211125 |