WO2020195615A1 - 血圧関連情報表示装置、血圧関連情報表示方法、およびプログラム - Google Patents
血圧関連情報表示装置、血圧関連情報表示方法、およびプログラム Download PDFInfo
- Publication number
- WO2020195615A1 WO2020195615A1 PCT/JP2020/008976 JP2020008976W WO2020195615A1 WO 2020195615 A1 WO2020195615 A1 WO 2020195615A1 JP 2020008976 W JP2020008976 W JP 2020008976W WO 2020195615 A1 WO2020195615 A1 WO 2020195615A1
- Authority
- WO
- WIPO (PCT)
- Prior art keywords
- blood pressure
- waveform
- related information
- information display
- display device
- Prior art date
- Legal status (The legal status is an assumption and is not a legal conclusion. Google has not performed a legal analysis and makes no representation as to the accuracy of the status listed.)
- Ceased
Links
Images



Classifications
-
- A—HUMAN NECESSITIES
- A61—MEDICAL OR VETERINARY SCIENCE; HYGIENE
- A61B—DIAGNOSIS; SURGERY; IDENTIFICATION
- A61B5/00—Measuring for diagnostic purposes; Identification of persons
- A61B5/02—Detecting, measuring or recording for evaluating the cardiovascular system, e.g. pulse, heart rate, blood pressure or blood flow
- A61B5/021—Measuring pressure in heart or blood vessels
- A61B5/02108—Measuring pressure in heart or blood vessels from analysis of pulse wave characteristics
- A61B5/02125—Measuring pressure in heart or blood vessels from analysis of pulse wave characteristics of pulse wave propagation time
-
- A—HUMAN NECESSITIES
- A61—MEDICAL OR VETERINARY SCIENCE; HYGIENE
- A61B—DIAGNOSIS; SURGERY; IDENTIFICATION
- A61B5/00—Measuring for diagnostic purposes; Identification of persons
- A61B5/48—Other medical applications
- A61B5/4806—Sleep evaluation
- A61B5/4818—Sleep apnoea
-
- A—HUMAN NECESSITIES
- A61—MEDICAL OR VETERINARY SCIENCE; HYGIENE
- A61B—DIAGNOSIS; SURGERY; IDENTIFICATION
- A61B5/00—Measuring for diagnostic purposes; Identification of persons
- A61B5/0002—Remote monitoring of patients using telemetry, e.g. transmission of vital signals via a communication network
- A61B5/0015—Remote monitoring of patients using telemetry, e.g. transmission of vital signals via a communication network characterised by features of the telemetry system
- A61B5/002—Monitoring the patient using a local or closed circuit, e.g. in a room or building
-
- A—HUMAN NECESSITIES
- A61—MEDICAL OR VETERINARY SCIENCE; HYGIENE
- A61B—DIAGNOSIS; SURGERY; IDENTIFICATION
- A61B5/00—Measuring for diagnostic purposes; Identification of persons
- A61B5/02—Detecting, measuring or recording for evaluating the cardiovascular system, e.g. pulse, heart rate, blood pressure or blood flow
- A61B5/021—Measuring pressure in heart or blood vessels
- A61B5/02108—Measuring pressure in heart or blood vessels from analysis of pulse wave characteristics
- A61B5/02116—Measuring pressure in heart or blood vessels from analysis of pulse wave characteristics of pulse wave amplitude
-
- A—HUMAN NECESSITIES
- A61—MEDICAL OR VETERINARY SCIENCE; HYGIENE
- A61B—DIAGNOSIS; SURGERY; IDENTIFICATION
- A61B5/00—Measuring for diagnostic purposes; Identification of persons
- A61B5/72—Signal processing specially adapted for physiological signals or for diagnostic purposes
- A61B5/7235—Details of waveform analysis
- A61B5/7264—Classification of physiological signals or data, e.g. using neural networks, statistical classifiers, expert systems or fuzzy systems
-
- A—HUMAN NECESSITIES
- A61—MEDICAL OR VETERINARY SCIENCE; HYGIENE
- A61B—DIAGNOSIS; SURGERY; IDENTIFICATION
- A61B5/00—Measuring for diagnostic purposes; Identification of persons
- A61B5/72—Signal processing specially adapted for physiological signals or for diagnostic purposes
- A61B5/7271—Specific aspects of physiological measurement analysis
- A61B5/7282—Event detection, e.g. detecting unique waveforms indicative of a medical condition
-
- A—HUMAN NECESSITIES
- A61—MEDICAL OR VETERINARY SCIENCE; HYGIENE
- A61B—DIAGNOSIS; SURGERY; IDENTIFICATION
- A61B5/00—Measuring for diagnostic purposes; Identification of persons
- A61B5/74—Details of notification to user or communication with user or patient; User input means
- A61B5/742—Details of notification to user or communication with user or patient; User input means using visual displays
Definitions
- the present invention relates to a blood pressure-related information display device and a blood pressure-related information display method, and more particularly to a device and method for visualizing and displaying information related to a blood pressure surge of a subject.
- the present invention also relates to a program for causing a computer to execute such a blood pressure-related information display method.
- the waveform of the blood pressure surge is only displayed in a form in which the peak of each pulse can be seen by expanding the time axis of the systolic blood pressure value (SBP) time series data. It is not displayed as a curve (shape) showing the tendency of rising and falling.
- SBP systolic blood pressure value
- the blood pressure-related information display device of this disclosure is A blood pressure-related information display device that visualizes and displays information related to blood pressure surges.
- a blood pressure surge detector that detects a blood pressure surge based on predetermined criteria from time-series data of blood pressure that changes in conjunction with the subject's pulsation, For each detected blood pressure surge, an individual waveform acquisition unit that obtains an envelope connecting a plurality of beat-corresponding peaks forming the blood pressure surge as an individual waveform, and A statistical processing unit that statistically processes the plurality of obtained individual waveforms to obtain typical waveforms and waveform variations of blood pressure surges in the time series data. It is characterized by including a display processing unit that performs a process of superimposing a curve showing the representative waveform on a region showing the waveform variation of the blood pressure surge on the display screen.
- the "predetermined criteria” typically refers to criteria for detecting blood pressure surges in patients with sleep apnea syndrome (SAS). For example, from the time of the surge start point to the time of the surge peak point within the peak detection section (for example, a period of 15 beats) as disclosed in Japanese Patent Application No. 2017-048946 and Japanese Patent Application No. 2017-050066 In addition to being included, the difference (blood pressure fluctuation) between the systolic blood pressure value at the time of the surge start point and the systolic blood pressure value at the time of the peak point is 20 mmHg (or 15 mmHg) or more, and the time and peak of the surge start point. It means that the period between the point time is larger than 5 beats and the period between the peak point time and the surge end point time is larger than 7 beats.
- the plurality of "beat-corresponding peaks" that form a blood pressure surge refer to peaks corresponding to systolic blood pressure in a continuous instantaneous blood pressure waveform. However, it may be a peak corresponding to the diastolic blood pressure value (DBP).
- DBP diastolic blood pressure value
- “statistical processing” refers to processing for averaging individual waveforms, processing for obtaining the median, and the like.
- the “typical waveform” of a blood pressure surge refers to, for example, an average waveform obtained by averaging a plurality of individual waveforms, or a waveform corresponding to the median value of a plurality of individual waveforms.
- the “waveform variation” of the blood pressure surge refers to, for example, the width of the distribution of a plurality of individual waveforms.
- the "display screen” typically refers to the screen of the display device, but may be, for example, a paper surface output by a printer.
- the horizontal coordinates typically represent the passage of time (for example, the progression of beats), and the vertical coordinates are blood pressure fluctuations associated with a blood pressure surge. It is done in a manner that represents a quantity.
- the blood pressure surge detection unit detects the blood pressure surge from the time-series data of the blood pressure that changes in conjunction with the pulsation of the subject based on a predetermined determination criterion.
- the individual waveform acquisition unit obtains an envelope connecting a plurality of beat-corresponding peaks forming the blood pressure surge as an individual waveform for each detected blood pressure surge.
- the statistical processing unit statistically processes the plurality of obtained individual waveforms to obtain a representative waveform and waveform variation of the blood pressure surge in the time series data.
- the display processing unit performs a process of superimposing a curve showing the representative waveform on the region showing the waveform variation of the blood pressure surge on the display screen.
- the user typically, a medical person such as a doctor or a nurse.
- the subject may be a subject; the same applies hereinafter
- the statistical processing unit described above with respect to the horizontal direction on a coordinate plane including horizontal coordinates representing the passage of time and vertical coordinates representing the amount of blood pressure fluctuation associated with a blood pressure surge A state equivalent to aligning the peak positions of the plurality of individual waveforms by relatively sliding the plurality of individual waveforms is created in the memory area, and in this state, the plurality of individual waveforms are generated for each of the horizontal coordinates. It is characterized in that the blood pressure fluctuation amount data is statistically processed to obtain the representative waveform and the waveform variation.
- the “individual waveform peak” refers to the peak of each blood pressure surge, and corresponds to the maximum beat-corresponding peak among the plurality of beat-corresponding peaks forming each blood pressure surge.
- the "equivalent state” does not require a process of actually drawing and aligning the peak positions of the plurality of individual waveforms on the coordinate plane, and the data in the memory area is defined on the coordinate plane. It means that it is enough if it is in a state equivalent to the state.
- the statistical processing unit is in a state equivalent to aligning the peak positions of the plurality of individual waveforms by relatively sliding the plurality of individual waveforms in the lateral direction. Is created in the memory area, and the blood pressure fluctuation amount data of the plurality of individual waveforms is statistically processed in this state, so that the representative waveform and the waveform variation can be easily grasped.
- the blood pressure-related information display device of one embodiment is characterized in that each of the blood pressure fluctuation amount data of the plurality of individual waveforms is a fluctuation amount based on the blood pressure value at the start point of the individual waveform.
- the blood pressure-related information display device of this one embodiment makes it easy to grasp the typical waveform and the waveform variation.
- the blood pressure-related information display device of one embodiment is characterized in that the blood pressure fluctuation amount data of the plurality of individual waveforms is normalized so as to align the peak heights of the plurality of individual waveforms.
- the blood pressure-related information display device of this one embodiment makes it easier to grasp the typical waveform and the waveform variation.
- the horizontal coordinates representing the passage of time are determined by the beat numbers that specify the beat-corresponding peaks.
- the statistical processing unit is characterized in that the blood pressure fluctuation amount data of the plurality of individual waveforms is statistically processed for each beat number.
- the beat interval is not constant due to the beating of the heart, the period of one beat when a blood pressure surge forming a certain individual waveform occurs and the period of one beat when a blood pressure surge forming another individual waveform occurs. May differ from each other. "The lateral coordinates representing the passage of time are ... determined by the beat number" means that the passage of time is represented by the progress of the beat regardless of the difference.
- the lateral coordinates representing the passage of time are determined by the beat number that specifies the beat-corresponding peak. Therefore, regardless of the difference between the period of one beat when a blood pressure surge forming a certain individual waveform and the period of one beat when a blood pressure surge forming another individual waveform occurs, the representative waveform and the waveform It becomes easier to grasp the variation. Further, when the statistical processing unit statistically processes the blood pressure fluctuation data of the plurality of individual waveforms, it is sufficient to perform the statistical processing of the blood pressure fluctuation data for each beat number. Therefore, the calculation amount of the statistical processing unit can be reduced as compared with the case where the statistical processing of the blood pressure fluctuation amount data is continuously performed in the lateral direction.
- the statistical processing unit has a portion of the plurality of individual waveforms whose lateral dimension is shorter than the longest individual waveform is insufficient from the longest individual waveform. , The contribution of the blood pressure fluctuation data to the statistical processing is set to zero.
- the statistical processing of the blood pressure fluctuation amount data can be performed without any trouble. ..
- the waveform variation obtained by the statistical processing unit is defined as ⁇ k times the standard deviation of the distribution formed by the blood pressure fluctuation data of the plurality of individual waveforms, where k is a natural number.
- the display processing unit is characterized in that, as a region showing the waveform variation, a region having a width corresponding to ⁇ k times the standard deviation in the vertical direction is displayed on the display screen.
- the area showing the waveform variation on the display screen is ⁇ k times the standard deviation in the vertical direction (however, k is a natural number. Typically, it is a natural number.
- a region having a width corresponding to (k is set as 1, 2 or 3) is displayed. Therefore, the user can intuitively grasp the curve showing the typical waveform of the blood pressure surge in the subject and the region showing the waveform variation.
- the display of the region showing the waveform variation is particularly useful, for example, when the variation of the individual waveforms is sufficient to be treated as a normal distribution (for example, when the number of individual waveforms is several tens or more).
- the waveform variation obtained by the statistical processing unit is defined as an interquartile range of the distribution formed by the blood pressure fluctuation data of the plurality of individual waveforms.
- the display processing unit is characterized in that, as a region showing the waveform variation, a region having a width corresponding to the interquartile range in the vertical direction is displayed on the display screen.
- a region having a width corresponding to the interquartile range in the vertical direction is displayed as a region showing the waveform variation on the display screen. Therefore, the user can intuitively grasp the curve showing the typical waveform of the blood pressure surge in the subject and the region showing the waveform variation. Further, as compared with the case where the region showing the waveform variation is defined by using the standard deviation, many calculations are not required and the calculation is simple. Therefore, it can contribute to the improvement of processing speed and the saving of memory.
- the display processing unit forms a region showing the waveform variation on the display screen so as to be distinguishable from the curve showing the typical waveform. It is characterized in that it performs a process of displaying a curve showing an individual waveform of.
- a curve showing the representative waveform and a curve showing the plurality of individual waveforms are displayed so as to form a region showing the waveform variation on the display screen. Therefore, the user can intuitively grasp the curve showing the typical waveform of the blood pressure surge in the subject and the region showing the waveform variation.
- the display of the curve showing the plurality of individual waveforms is useful for allowing the user to grasp the variation of the individual waveforms, for example, when the number of individual waveforms is several or less.
- the input unit for inputting the information indicating the physical condition specific period in which the physical condition of the subject is specified is provided.
- the statistical processing unit obtains a typical waveform and waveform variation of the blood pressure surge in the time series data for each physical condition specific period.
- the display processing unit is characterized in that it performs a process of superimposing a curve showing a typical waveform on a region showing the waveform variation of the blood pressure surge for each physical condition specific period on the display screen. And.
- the term "physical condition specific period” refers to a subject such as an apnea period, a REM sleep period, a non-REM sleep period, an arousal period, and / or a period in which percutaneous arterial oxygen saturation (SpO 2 ) is low. Refers to the period during which a person is in a physical condition that can cause a blood pressure surge.
- the input unit inputs information representing the physical condition specific period of the subject along with the time-series data of the blood pressure that changes in conjunction with the pulsation of the subject.
- the statistical processing unit obtains a typical waveform and waveform variation of the blood pressure surge in the time series data for each physical condition specific period.
- the display processing unit performs a process of superimposing a curve showing the representative waveform on the region showing the waveform variation of the blood pressure surge for each physical condition specific period on the display screen.
- the user can use a curve and waveform variation showing a typical waveform of the blood pressure surge in the subject for each of the above-mentioned physical condition specific periods, in other words, for each period in which the subject is in a physical condition that can cause a blood pressure surge. It is possible to grasp the area indicating. Therefore, the user can grasp, for example, the factor (physical condition) causing the most serious blood pressure surge.
- the blood pressure-related information display method of this disclosure is a blood pressure related information display method that visualizes and displays information related to blood pressure surge.
- Blood pressure surge is detected based on predetermined criteria from time-series data of blood pressure that changes in conjunction with the pulsation of the subject.
- the envelope connecting the multiple beat-corresponding peaks forming the blood pressure surge was obtained as an individual waveform.
- Statistical processing of the plurality of obtained individual waveforms was performed to obtain typical waveforms and waveform variations of blood pressure surges in the time series data. It is characterized in that a process of superimposing a curve showing the typical waveform on the region showing the waveform variation of the blood pressure surge and displaying it on the display screen is performed.
- the user can intuitively grasp the curve showing the typical waveform of the blood pressure surge in the subject and the region showing the waveform variation. This is considered to be useful as a material for evaluating the risk of cardiovascular disease and a material for evaluating the risk of disease of a specific organ, in addition to the diagnosis and treatment of SAS.
- this disclosed program is a program for causing a computer to execute the above blood pressure-related information display method.
- the blood pressure-related information display device and the blood pressure-related information display method of this disclosure a typical waveform of a blood pressure surge and a waveform variation can be superposed and displayed. Further, the blood pressure-related information display method can be implemented by causing a computer to execute the program of this disclosure.
- FIG. 1 It is a block diagram which shows one Embodiment which configured the blood pressure-related information display device of this invention as a system on a network. It is a block diagram which shows the structure of the hospital terminal included in the said system. It is a block diagram which shows the structure of the server included in the said system. It is a figure which shows the mode in which the time series data of the overnight blood pressure of a subject and the physical condition which can cause a blood pressure surge are measured together by the said system. It is a figure which shows the operation flow of the said server at the time of executing the basic blood pressure-related information display method. It is a figure which shows the operation flow of the said server at the time of executing the applied blood pressure-related information display method. FIG.
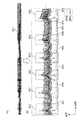
- FIG. 6A is a diagram showing time-series data of the overnight blood pressure of the subject.
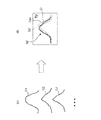
- FIG. 6B is an enlarged view of a part of FIG. 6A to show the blood pressure surge detected on the time-series data and the apnea / hypopnea event measured by the PSG device. It is a figure explaining the determination criterion for detecting a blood pressure surge by exemplifying a waveform (individual waveform) of a blood pressure surge. It is a figure which conceptually explains the process of averaging the individual waveforms of a blood pressure surge.
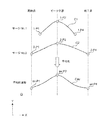
- FIG. 9A is a diagram illustrating a plurality of individual waveforms.
- FIG. 9A is a diagram illustrating a plurality of individual waveforms.
- 9B is a diagram illustrating image data in a mode in which a curve showing an average waveform is superimposed on a region showing waveform variation. It is a figure which shows the detailed flow of the statistical processing about the individual waveform of a blood pressure surge. It is a figure which illustrates the table which recorded the time to identify the detected blood pressure surge. It is a figure which illustrates the table which recorded the time series data of the beat correspondence peak of an individual waveform for a certain blood pressure surge. It is a figure which illustrates the table used for statistical processing of the blood pressure fluctuation amount data. It is a figure which shows the flow of the display processing in the said hospital terminal at the time of executing the said-applied blood pressure-related information display method.
- FIG. 16A is a diagram illustrating a plurality of individual waveforms obtained for the apnea period, as in FIG. 9A.
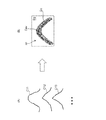
- FIG. 16B is a diagram showing a modified example of how to display the waveform variation.
- FIG. 1 shows an example in which the blood pressure-related information display device of the present invention is configured as a system of one embodiment on a network (the whole is indicated by reference numeral 100).
- the system 100 includes hospital terminals 200A and 200B having a display 240 as a display screen, a server 300, a tonometry type sphygmomanometer 400, and a PSG (polysomnography) device 500.
- hospital terminals 200A and 200B, a server 300, a blood pressure monitor 400, and a PSG device 500 can communicate with each other via a network 900 which is a LAN (Local Area Network) in the hospital. Communication via the network 900 may be wireless or wired.
- LAN Local Area Network
- the network 900 is an in-hospital LAN (Local Area Network), but is not limited to this, and may be another type of network such as the Internet, or a USB cable or the like is used. It may be one-to-one communication. Although only two hospital terminals 200A and 200B are shown in this example, three or more hospital terminals may be provided.
- LAN Local Area Network
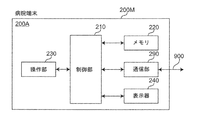
- the hospital terminal 200A includes a main body 200M, a control unit 210, a memory 220, an operation unit 230, a display 240 as a display screen, and a communication unit 290 mounted on the main body 200M. And include.
- the hospital terminal 200A is composed of a commercially available notebook personal computer, and application software (computer program) is installed so as to perform the processing described later, and the server 300 can be accessed.
- the control unit 210 includes a CPU (Central Processing Unit) and its auxiliary circuits, controls each part of the hospital terminal 200A, and executes the processing described later according to the programs and data stored in the memory 220. That is, the data input from the operation unit 230 and the communication unit 290 is processed, and the processed data is stored in the memory 220, displayed on the display 240, or output from the communication unit 290.
- CPU Central Processing Unit
- the memory 220 includes a RAM (Random Access Memory) used as a work area required for the control unit 210 to execute a program, and a ROM (Read Only) for storing a basic program for execution by the control unit 210. Memory) and is included. Further, a semiconductor memory (memory card, SSD (Solid State Drive)) or the like may be used as a storage medium of the auxiliary storage device for assisting the storage area of the memory 220.
- RAM Random Access Memory
- ROM Read Only
- the operation unit 230 is composed of a keyboard and a mouse, and typically inputs an operation signal indicating an operation by a doctor as a user to the control unit 210. Further, the operation unit 230 may be composed of other operation devices such as a touch panel in place of or in addition to the keyboard and mouse.
- the display 240 includes a display screen (for example, an LCD (Liquid Crystal Display) or an EL (Electroluminescence) display).
- the display 240 is controlled by the control unit 210 to display a predetermined image on the display screen.
- the communication unit 290 transmits the information from the control unit 210 to the server 300 via the network 900.
- the server 300 includes a control unit 310, a storage unit 320, an operation unit 330, a display 340, and a communication unit 390.
- the server 300 is a general-purpose computer device in which a program (software) is installed so as to perform a process described later.
- the control unit 310 includes a CPU and its auxiliary circuits, controls each unit of the server 300, executes a predetermined process according to the programs and data stored in the storage unit 320, and inputs from the operation unit 330 and the communication unit 390.
- the processed data is processed, and the processed data is stored in the storage unit 320, displayed on the display 340, or output from the communication unit 390.
- the storage unit 320 includes a RAM used as a work area required for the control unit 310 to execute a program, and a ROM for storing a basic program for execution by the control unit 310.
- the storage unit 320 is provided with a database 321 containing blood pressure measurement data sent from many subjects.
- a magnetic disk (HD (Hard Disk), FD (Flexible Disk)), an optical disk (CD (Compact Disc), DVD (Digital Versatile Disk)) ), BD (Blu-ray Disc)), magneto-optical disk (MO (Magneto-Optical disk)), semiconductor memory (memory card, SSD), or the like may be used.
- HD Hard Disk
- FD Fluorescent Disk
- CD Compact Disc
- DVD Digital Versatile Disk
- BD Blu-ray Disc
- MO Magneto-optical disk
- semiconductor memory memory card, SSD
- the operation unit 330 is composed of a keyboard and a mouse, and inputs an operation signal indicating an operation by the user to the control unit 310. Further, the operation unit 330 may be composed of other operation devices such as a touch panel in place of or in addition to the keyboard and mouse.
- the display 340 includes a display screen (for example, an LCD or an EL display).
- the display 340 is controlled by the control unit 310 to display a predetermined image on the display screen.
- the communication unit 390 transmits the information from the control unit 310 to another device (hospital terminal 200A in this example) via the network 900, and receives the information transmitted from the other device via the network 900. And hands it over to the control unit 310.
- the sphygmomanometer 400 shown in FIG. 1 is composed of a tonometry type sphygmomanometer as disclosed in Japanese Patent Application No. 2017-050066.
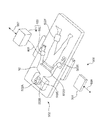
- the sphygmomanometer 400 is a pressure sensor unit that continuously detects the pressure pulse wave of the radial artery passing through the measurement site (for example, the left wrist) of the subject 90 by a tonometry method for each beat. It includes a 402 and a main unit 401 that outputs a change in pressure detected by the pressure sensor unit 402 as time-series data of blood pressure.
- the pressure sensor unit 402 and the main unit 401 are connected by a signal cable 403.
- the tonometry method is a method for determining blood pressure by measuring a pressure pulse wave by compressing a blood vessel with a pressure sensor unit 402 (for example, a pressure pulse wave sensor).
- a pressure sensor unit 402 for example, a pressure pulse wave sensor.
- the internal pressure (blood pressure) of the blood vessels and the external pressure of the blood vessels (blood pressure) according to Laplace's law, considering the blood flow in the blood vessels and the blood vessel wall regardless of the presence or absence of pulsation.
- the relational expression with the pressure of the pressure pulse wave) can be derived.
- the sphygmomanometer 400 measures the blood pressure value of the measurement site (for example, the left wrist) for each heartbeat, and measures the measurement time (time) and the blood pressure in the manner shown in FIG. 6 (A), for example.
- the blood pressure time series data 801 associated with the above is output.
- Overnight time-series data 801 includes beat-corresponding peaks (corresponding to systolic blood pressure (SBP) or diastolic blood pressure (DBP)) for approximately 30,000 beats.
- the PSG device 500 shown in FIG. 1 is composed of a commercially available PSG device (for example, Neurotax® EEG-9200 manufactured by Nihon Kohden Co., Ltd.) in this example, and will be described later in [B. It is used only when executing [Applied blood pressure related information display method].
- the PSG device 500 includes a sensor group 502 and a main unit 501 that processes signals from the sensor group 502 and outputs information that identifies the physical condition of the subject 90. ..
- the sensor group 502 includes an electroencephalogram detection electrode 502A for detecting an electroencephalogram, an eye movement detection electrode 502B for detecting eye movement, an air flow sensor 502C for detecting airflow associated with breathing, and an electrocardiogram electrode for obtaining an electrocardiogram. It includes a 502D, a pulse oximeter 502E for detecting percutaneous arterial oxygen saturation (SpO 2 ), and an electromyogram electrode 502F for obtaining an electromyogram.
- the sensor group 502 and the main unit 501 are connected by a signal cable (not shown) via a cable box (not shown).
- the PSG device 500 uses the apnea period (or hypopnea period) and the REM sleep period as information indicating the period during which the physical condition of the subject 90 is specified (this is referred to as a “physical condition specifying period”).
- apnea during sleep means "a state in which breathing stops for 10 seconds or more”.
- hyperpnea means that the ventilation by respiration is reduced to 50% or more for 10 seconds or more.
- REM sleep refers to sleep accompanied by rapid eye movement
- non-REM sleep refers to sleep not accompanied by rapid eye movement
- awakening refers to a state of being awake.
- SpO 2 refers to a value measured (percutaneously) through the skin as to what percentage of hemoglobin contained in red blood cells flowing in arterial blood is bound to oxygen. The period during which SpO 2 is “low” refers to the period during which SpO 2 is less than 90% in this example.
- the PSG device 500 can output a plurality of types of information representing a physical condition specifying period for the subject 90.
- the system 100 is roughly classified as follows, including the creation of image data on the server 300 and the display of image data on a hospital terminal (for example, 200A) [A. Basic blood pressure-related information display method] and [B. An applied blood pressure-related information display method] can be implemented.
- the blood pressure is associated with the measurement time (time) output by the sphygmomanometer 400 and the blood pressure as illustrated in FIG. 6A without using the PSG device 500.
- Image data is created and displayed as follows using only the time series data 801.
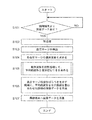
- the server 300 is always in an operating state (however, the maintenance period, etc. are excluded), and FIG. 5A (shows the operating flow of the server 300 when executing the basic blood pressure-related information display method).
- step S101 of the above the data from the hospital terminal 200A is awaited.
- the control unit 310 of the server 300 receives the above-mentioned blood pressure time series data from the hospital terminal 200A from the network 900 via the communication unit 390 as an input unit (YES in step S101)
- the received blood pressure time series The data is stored in the database 321 of the storage unit 320.
- the processes of steps S102 to S107 described below are executed.
- control unit 310 functions as a preprocessing unit, smoothing using a moving average known for time series data of blood pressure, noise removal, and a high frequency component using a low-pass filter. Perform pretreatment such as removal.
- the control unit 310 acts as a blood pressure surge detection unit and discloses it to, for example, Japanese Patent Application No. 2017-0489946 and Japanese Patent Application No. 2017-050066 from the time series data of the blood pressure of the subject 90.
- the blood pressure surge is detected based on a predetermined criterion.
- a predetermined criterion for example, in FIG. 6B, a plurality of blood pressure surges are detected as shown by the broken line rectangular frames 803, 803, .... It is said that hundreds of blood pressure surges can occur overnight.
- peaks corresponding to systolic blood pressure (SBP) are marked with black circles, which are connected by envelopes.
- peaks corresponding to diastolic blood pressure (DBP) are marked with white circles, which are connected by envelopes.
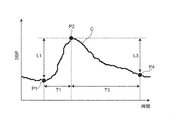
- the “predetermined criterion” for detecting the blood pressure surge is a peak detection section (for example, as shown in FIG. 7 (an example of an individual waveform of the blood pressure surge is shown by a curve C)).
- the period of 15 beats includes the time from the surge start point P1 to the time of the surge peak point P2, and the systolic blood pressure value (SBP) at the time of the surge start point P1 and the systolic period at the time of the peak point P2.
- the difference (blood pressure fluctuation amount) L1 from the blood pressure value (SBP) is 20 mmHg (or 15 mmHg) or more, and the period T1 between the time of the surge start point P1 and the time of the peak point P2 is larger than 5 beats. It also means that the period T3 between the time of the peak point P2 and the time of the surge end point P4 is larger than 7 beats.
- the surge start point P1 is defined as a point prior to the peak point P2 that gives the minimum systolic blood pressure value (SBP).
- the control unit 310 acts as an individual waveform acquisition unit, and for each of the detected blood pressure surges 803,803, ..., Corresponds to a plurality of beats forming the blood pressure surge 803.
- the envelope connecting the peaks (in this example, the peak corresponding to systolic blood pressure (SBP)) is obtained as an individual waveform.
- SBP systolic blood pressure
- FIG. 7 the individual waveform of the blood pressure surge is represented by a curve C forming a mountain shape.
- the control unit 310 acts as a statistical processing unit, and in this example, all the obtained individual waveforms are statistically processed in the time series data 801. Obtain the typical waveform and waveform variation of the blood pressure surge.
- statistical processing refers to processing for averaging individual waveforms.
- the "typical waveform” of a blood pressure surge refers to an average waveform obtained by averaging a plurality of individual waveforms.
- the "waveform variation” of the blood pressure surge refers to the width of the distribution of a plurality of individual waveforms.
- the process of averaging the individual waveforms of blood pressure surges means the following process. As illustrated in FIG. 8, it is assumed that the individual waveform C1 of "surge No. 1" and the individual waveform C2 of "surge No. 2" exist as blood pressure surges. In this case, the process of averaging the individual curves of the blood pressure surge is the horizontal direction X on the coordinate plane Q including the horizontal coordinates X representing the passage of time and the vertical coordinates Y representing the amount of blood pressure fluctuation associated with the blood pressure surge.
- the blood pressure fluctuation amount data of the plurality of individual curves C1 and C2 for each lateral coordinate X Corresponds to the process of obtaining a curve Cav showing an average waveform as a representative waveform by averaging.
- the lateral coordinates X representing the passage of time are defined by the beat numbers that specify the beat-corresponding peaks.
- the longitudinal coordinate Y is determined by the amount of fluctuation in the systolic blood pressure value (SBP) associated with the blood pressure surge.
- SBP systolic blood pressure value
- the range of the "waveform variation" of the blood pressure surge is the lateral coordinate X using the standard deviation ⁇ of the distribution (distribution for each lateral coordinate X) formed by the blood pressure fluctuation data of a plurality of individual waveforms.
- Each is defined as a range of ⁇ k times the standard deviation ⁇ (where k is a natural number).
- k is set as 1, 2 or 3.
- the range of “waveform variation” of blood pressure surge is the range of ⁇ ⁇ .
- the display of the region showing the waveform variation ⁇ ⁇ (for example, the region Sd shown in FIG. 9B described later) is when the variation of the individual waveform is sufficient to be treated as a normal distribution (for example, several tens). In the above cases), it becomes a particularly useful display.
- control unit 310 acts as a part of the display processing unit to generate an average waveform in a region (represented by the symbol Sd) indicating the waveform variation of the blood pressure surge.
- Image data of an aspect in which the shown curve Cav is superimposed is created.
- step S104 of FIG. 5A it is assumed that the individual waveforms C11, C12, C13, ... Are obtained in step S104 of FIG. 5A.
- step S106 of FIG. 5A as shown in FIG. 9B, for example, image data Im in an embodiment in which the curve Cav showing the average waveform is superimposed on the region Sd showing the waveform variation is obtained.
- the curve Cav showing the average waveform is represented by a solid line with a certain concentration.
- the region Sd showing the waveform variation is represented as a region having an intermediate concentration between the curve Cav and the background region (white region in this example) Bg.
- step S107 of FIG. 5A the control unit 310 of the server 300 sends the created image data Im via the network 900, in this example, the provider of the time series data of blood pressure. Send to the hospital terminal 200A.
- control unit 310 of the server 300 may transmit the image data Im to a hospital terminal 200B or the like other than the hospital terminal 200A according to the designation of the user who operates the hospital terminal 200A, for example.
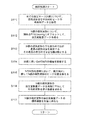
- FIG. 10 shows a detailed flow of statistical processing for individual waveforms of blood pressure surges by the control unit 310 of the server 300 described in step S105 of FIG. 5A.
- the control unit 310 acquires time-series data of beat-corresponding peaks of individual waveforms for all detected blood pressure surges from the database 321.
- the number of acquired blood pressure surges is N.
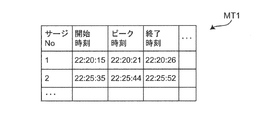
- the detected blood pressure surge No. 1 is specified by a start time (start point time) 22:20:15, a peak time (peak time) 22:20:21, and an end time (end point time) 22:20:26.
- blood pressure surge No. 2 is specified at a start time of 22:25:35, a peak time of 22:25:44, and an end time of 22:25:52.
- the time notation is "hour: minute: second" (the same applies hereinafter).
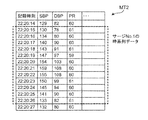
- blood pressure surge No. Regarding No. 1 as for the time-series data of the beat-corresponding peaks of the individual waveforms, for example, as shown in the table MT2 of FIG. 12, at the start time 22:20:15, the peak corresponding to SBP as the beat-corresponding peak is 130 [mmHg]. , The peak corresponding to DBP is recorded as 78 [mmHg], and the pulse rate PR is recorded as 61 [beats / minute].
- the peak corresponding to SBP is 134 [mmHg]
- the peak corresponding to DBP is 80 [mmHg]
- the pulse rate PR is 60 [beats / minute].
- the time-series data of the peaks corresponding to beats are recorded sequentially, and at the end time of 22:20:26, the peak corresponding to SBP is 133 [mmHg], the peak corresponding to DBP is 82 [mmHg], and the pulse rate PR. Is recorded as 61 [beats / minute].
- the blood pressure surge No. As for 2, the time-series data of the beat-corresponding peaks of the individual waveforms are recorded in the same manner.
- the offset By performing the offset in this way, it becomes easy to grasp the curve Cav showing the average waveform as a typical waveform and the waveform variation ⁇ ⁇ for each lateral coordinate X.
- control unit 310 identifies the individual waveform having the longest X-direction (horizontal) dimension among the N individual waveforms. Further, the longest dimension in the X direction is obtained as the number of beats M.
- control unit 310 secures a memory area of N rows and M columns in the storage unit 320 as a work area for executing the calculation.
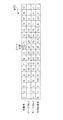
- the number of acquired blood pressure surges N 2
- the X-direction dimension of the individual waveform C1 of “Surge No. 1” is 12 beats. It is assumed that the individual waveform C2 of "Surge No. 2" has a dimension in the X direction of 17 beats.
- a memory area of 2 rows and 17 columns is secured as a work area for the purpose.
- N of acquired blood pressure surges is actually larger than 2
- a memory area having a number of rows greater than 2 is secured.
- the beat numbers representing the X-direction coordinates are represented.
- the control unit 310 relatively slides N individual waveforms with respect to the lateral direction X in the memory area of N rows and M columns to obtain peaks of N individual waveforms. Align the positions (beat numbers). For example, in the example of FIG. 13, the positions of the peaks of the two individual waveforms C1 and C2 of "surge No. 1" and “surge No. 2" in the lateral direction X are surrounded by a beat number 10 (circled by a broken line). It is arranged in the place of). As a result, in the second row of the table MT3, the blood pressure fluctuation amount data of "surge No.
- the control unit 310 statistically processes (averages in this example) the blood pressure fluctuation amount data of N individual waveforms for each beat number (column). Find the average value. For example, in the example of FIG. 13, in the lowermost row (fourth row) of the table MT3, for each beat number of the blood pressure fluctuation amount data in the case of the individual waveforms of the above-mentioned "surge No. 1" and "surge No. 2". The average value is shown. The average value of the beat numbers determines a curve Cav showing an average waveform as a representative waveform.
- the control unit 310 has an individual waveform shorter than the individual waveform having the longest X-direction dimension among the N individual waveforms (“surge No. 2” in the above example) (“surge No. 2” in the above example).
- the contribution of the portion short of the longest individual waveform ("Surge No. 2 "in the above example) to the statistical processing of the blood pressure fluctuation amount data is set to zero.
- the individual waveform of "surge No. 1” the portion where the X-direction dimension is insufficient compared to the individual waveform of "surge No. 2", that is, the portions of beat numbers 1 to 3, and the beat.
- the contribution of the blood pressure fluctuation data to the statistical processing is set to zero.
- the statistical processing of the blood pressure fluctuation amount data can be performed without any trouble.
- control unit 310 obtains the standard deviation ⁇ of the distribution formed by the blood pressure fluctuation amount data of N individual waveforms for each beat number (column).
- the area of ⁇ ⁇ for each beat number defines the area Sd showing the waveform variation described above.
- N individual waveforms are further added. It may be normalized so that the heights of the peaks of are aligned. This makes it easier to grasp the curve Cav showing the average waveform as a typical waveform and the waveform variation ⁇ ⁇ for each lateral coordinate X.
- the hospital terminal 200A receives the image data Im as shown in FIG. 9B from the server 300 via the network 900.
- the control unit 210 of the hospital terminal 200A works as a part of the display processing unit, and the display screen of the display 240 is displayed. Image data Im is displayed.
- the blood pressure fluctuation amount (systolic blood pressure value (SBP) at the time of the surge start point P1 and the systolic blood pressure value (SBP) at the time of the peak point P2 shown in FIG. 7) is displayed on the display screen of the display 240.
- the mean value of the difference L1) from and the value of the standard deviation ⁇ (or ⁇ ⁇ , ⁇ 2 ⁇ , ⁇ 3 ⁇ ) of the distribution may be displayed together.
- the user can grasp the curve Cav showing the typical waveform of the blood pressure surge in the subject 90 and the region Sd showing the waveform variation. This is considered to be useful as a material for evaluating the risk of cardiovascular disease and a material for evaluating the risk of disease of a specific organ, in addition to the diagnosis and treatment of SAS.
- the user may input a transfer instruction via the operation unit 230 of the hospital terminal 200A and transmit the image data Im to a hospital terminal 200B or the like other than the hospital terminal 200A.
- a doctor as a user operates the operation unit 230 of the hospital terminal 200A, and the time-series data of the blood pressure measured for the subject 90 and the information indicating the physical condition specific period are combined with each other via the network 900.
- Send to server 300 for example, a doctor as a user operates the operation unit 230 of the hospital terminal 200A, and the time-series data of the blood pressure measured for the subject 90 and the information indicating the physical condition specific period are combined with each other via the network 900.
- server 300 Send to server 300.
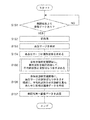
- the server 300 is always in an operating state (however, the maintenance period, etc. are excluded), and FIG. 5B (shows the operating flow of the server 300 when executing an applied blood pressure-related information display method).
- step S151 of the above the data from the hospital terminal 200A is awaited.
- the control unit 310 of the server 300 receives the above-mentioned data (time-series data of blood pressure and information representing the physical condition specific period) from the hospital terminal 200A from the network 900 via the communication unit 390 as an input unit (step). YES in S151), the time-series data of the received blood pressure and the information representing the physical condition specific period are stored in the database 321 of the storage unit 320. Then, the processes of steps S152 to S157 described below are executed.
- control unit 310 acts as a preprocessing unit, smoothing using a moving average known for time series data of blood pressure, noise removal, and high frequency components using a low-pass filter. Perform pretreatment such as removal.
- the control unit 310 acts as a blood pressure surge detection unit and discloses it to, for example, Japanese Patent Application No. 2017-0489946 and Japanese Patent Application No. 2017-050066 from the time series data of the blood pressure of the subject 90.
- the blood pressure surge is detected based on a predetermined criterion.
- a predetermined criterion for example, in FIG. 6B, a plurality of blood pressure surges are detected as shown by the broken line rectangular frames 803, 803, ....
- the "predetermined determination criterion" for detecting the blood pressure surge is the same as the determination criterion described with reference to FIG. 7 with respect to step S103 of FIG. 5A.
- the control unit 310 acts as an individual waveform acquisition unit, and for each of the detected blood pressure surges 803,803, ..., Corresponds to a plurality of beats forming the blood pressure surge 803.
- the envelope connecting the peaks (in this example, the peak corresponding to systolic blood pressure (SBP)) is obtained as an individual waveform.
- SBP systolic blood pressure
- FIG. 7 the individual waveform of the blood pressure surge is represented by a curve C forming a mountain shape.
- the control unit 310 functions as a statistical processing unit, and in this example, statistically processes a plurality of individual waveforms obtained for each physical condition specific period described above.
- the representative waveform and waveform variation of the blood pressure surge in the time series data 801 are obtained.
- a certain physical condition specific period for example, apnea period
- the blood pressure surge is in the physical condition specific period. Treated as occurring.
- the “statistical process” refers to a process of averaging individual waveforms in the same manner as described with reference to FIG. 8 (and FIGS.
- a plurality of processes for averaging the individual curves of the blood pressure surge are performed with respect to the horizontal direction X on the coordinate plane Q including the horizontal coordinates X representing the passage of time and the vertical coordinates Y representing the amount of blood pressure fluctuation associated with the blood pressure surge.
- the blood pressure fluctuation data of the plurality of individual curves C1 and C2 are averaged for each lateral coordinate X. Then, it corresponds to the process of obtaining the curve Cav showing the average waveform as a typical waveform.
- the range of the “wave pressure variation” of the blood pressure surge is the distribution (distribution for each lateral coordinate X) formed by the blood pressure fluctuation amount data of a plurality of individual waveforms. ) Is defined as a range of ⁇ ⁇ for each lateral coordinate X using the standard deviation ⁇ .
- a curve Cav showing an average waveform as a representative waveform and a waveform variation ⁇ ⁇ for each lateral coordinate X can be obtained for each physical condition specific period.
- apnea period including hypopnea period
- REM sleep period REM sleep period
- non-REM sleep period non-REM sleep period
- awakening period the apnea period
- a curve Cav showing an average waveform as a representative waveform and a waveform variation ⁇ ⁇ for each lateral coordinate X can be obtained.
- a curve Cav showing an average waveform as a representative waveform and a waveform variation ⁇ ⁇ for each lateral coordinate X can be obtained for each of the REM sleep period, the non-REM sleep period, and the awakening period.
- step S156 of FIG. 5B the control unit 310 acts as a part of the display processing unit, and is as illustrated in FIG. 9B for each physical condition specific period described above.
- Image data Im in an embodiment in which the curve Cav showing the average waveform is superimposed on the region Sd showing the waveform variation of the blood pressure surge is created.
- the region Sd1 showing waveform variation for each of the apnea period including the hypopnea period
- the REM sleep period REM
- the non-REM sleep period NREM
- Sd2, Sd3, and Sd4 are superposed with curves Cav1, Cav2, Cav3, and Cav4 showing average waveforms, respectively, to obtain image data Im1, Im2, Im3, and Im4.
- step S157 of FIG. 5B the control unit 310 of the server 300 transmits the image data Im1, Im2, Im3, Im4 created for each physical condition specific period to this example via the network 900. Then, it is transmitted to the hospital terminal 200A, which is the provider of the blood pressure time series data.
- the control unit 310 of the server 300 transmits the image data Im1, Im2, Im3, Im4 to, for example, a hospital terminal 200B other than the hospital terminal 200A according to the designation of the user who operates the hospital terminal 200A. May be good.
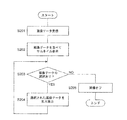
- FIG. 14 shows a flow of display processing on the hospital terminal 200A when image data created for each physical condition specific period is received from the server 300.
- the hospital terminal 200A will be described, but other hospital terminals 200B and the like can also perform the same display processing.
- the hospital terminal 200A receives the image data created for each physical condition specific period from the server 300 via the network 900.
- apnea period including hypopnea period
- REM sleep period REM sleep period
- non-REM sleep period REM sleep period
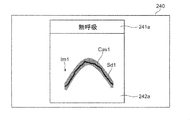
- the control unit 210 of the hospital terminal 200A functions as a part of the display processing unit, and as shown in FIG. 15A, the image data Im1 created for each physical condition specific period on the display screen of the display 240. , Im2, Im3, and Im4 are displayed side by side as thumbnails (step S202 in FIG. 14).
- the display screen of the display 240 has a physical condition specifying column 241 that specifies the physical condition specifying period and an image data column 242 arranged below the physical condition specifying column 241. It is displayed.
- an "apnea” column 241a representing an apnea period, a “REM” column 241b representing a REM sleep period, and a “non-REM sleep period” are displayed.
- a “NREM” column 241c and an "awakening response" column 241d representing the awakening period are included.
- the image data column 242 includes a column 242a for displaying the image data Im1 created for the aspiration period, a column 242b for displaying the image data Im2 created for the REM sleep period, and an image data created for the non-REM sleep period.
- a column 242c for displaying Im3 and a column 242d for displaying image data Im4 created for the awakening period are included.
- the image data Im1 created for the apnea period has a mode in which the curve Cav1 showing the average waveform is superimposed on the region Sd1 showing the waveform variation.
- the image data Im2 created for the REM sleep period has a mode in which the curve Cav2 showing the average waveform is superimposed on the region Sd2 showing the waveform variation.
- the image data Im3 created for the non-REM sleep period has a mode in which the curve Cav3 showing the average waveform is superimposed on the region Sd3 showing the waveform variation.
- the image data Im4 created for the awakening period has a mode in which the curve Cav4 showing the average waveform is superimposed on the region Sd4 showing the waveform variation.
- each physical condition specific period in other words, every period when the subject 90 is in a physical condition that can cause a blood pressure surge.
- the curve Cav showing the typical waveform of the blood pressure surge in the subject 90 and the region Sd showing the waveform variation can be grasped. Therefore, the user can easily grasp, for example, the factor (physical condition) that causes the most serious blood pressure surge. For example, among the image data Im1, Im2, Im3, Im4, since the blood pressure fluctuation amount of the image data Im1 created for the apnea period is the largest, it is determined that "apnea" causes the most serious blood pressure surge. You may.
- the control unit 210 of the hospital terminal 200A determines whether or not the displayed image data Im1, Im2, Im3, Im4 are selected.
- the control unit 210 displays as shown in FIG. 15B.
- the image data for the selected physical condition specific period in this example, the image data Im1 created for the apnea period
- the amount of blood pressure fluctuation for the selected physical condition specific period (systolic blood pressure value (SBP) and peak point P2 at the time of surge start point P1 shown in FIG. 7).
- the average value of the difference L1) from the systolic blood pressure value (SBP) at the time of, and the value of the standard deviation ⁇ (or ⁇ ⁇ , ⁇ 2 ⁇ , ⁇ 3 ⁇ ) of the distribution may also be displayed.
- control unit 210 turns off the image (step S205 of FIG. 14) and ends this display process. To do.
- the user may input a transfer instruction via the operation unit 230 of the hospital terminal 200A and transmit the image data Im1, Im2, Im3, Im4 to a hospital terminal 200B or the like other than the hospital terminal 200A. ..
- displaying the image data Im1, Im2, Im3, Im4 in the mode in which the curve showing the average waveform is superimposed on the region showing the waveform variation of the blood pressure surge is a diagnosis of SAS.
- it is considered to be useful as a material for evaluating the risk of cardiovascular disease and as a material for evaluating the risk of disease of a specific organ.
- the server 300 creates image data Im (or image data Im1, Im2, Im3, Im4 for each physical condition specific period; the same applies hereinafter), and displays 240 of the hospital terminals 200A, 200B, ... Displayed an image, but it is not limited to this.
- the control unit 310 of the server 300 transmits only the data for image creation, and the control unit 210 of the hospital terminals 200A, 200B, ... Data Im may be created.
- the blood pressure-related information display device of the present invention is configured as a system 100 on a network including hospital terminals 200A, 200B, ... And a server 300, but the present invention is not limited thereto.
- the blood pressure-related information display device of the present invention may be configured with only one of the hospital terminals 200A, 200B, .... That is, from the reception of all of the above-mentioned blood pressure-related information display methods (time-series data of blood pressure from the sphygmomanometer 400 and information indicating the physical condition specific period from the PSG device 500) on the hospital terminal (for example, 200A), the display 240 (Including the display of image data Im and the like on the display screen) may be executed.
- the display 240 Including the display of image data Im and the like on the display screen
- a program for executing the above-mentioned blood pressure-related information display method is installed in the control unit 210 in the memory 220 of the hospital terminal 200A.
- the blood pressure-related information display device of the present invention can be configured compactly and compactly.
- the above-mentioned blood pressure-related information display method can be used as software (computer program) to record non-transitory data such as a CD (compact disc), DVD (digital universal disc), and flash memory. It may be recorded on a medium.
- a substantial computer device such as a personal computer, a PDA (Personal Digital Assistance), or a smartphone, the above-mentioned blood pressure-related information is displayed on those computer devices. The method can be executed.
- the region Sd indicating the waveform variation constituting the image data Im is ⁇ k times (typically ⁇ ⁇ , ⁇ k times the standard deviation ⁇ of the distribution formed by the blood pressure fluctuation data for each lateral coordinate X. It was defined as a range of ⁇ 2 ⁇ or ⁇ 3 ⁇ ). However, the range of the region Sd showing the waveform variation is not limited to that defined by using the standard deviation ⁇ .
- the region Sd showing the waveform variation may be defined as the interquartile range of the distribution formed by the blood pressure fluctuation amount data for each lateral coordinate X. That is, as a process, the blood pressure fluctuation amount data is arranged in ascending order for each lateral coordinate X. Then, the first quartile is the lower limit of the region Sd, and the third quartile is the upper limit of the region Sd. As a result, the region Sd showing the waveform variation can be obtained.
- the "typical waveform" of the blood pressure surge is an average waveform obtained by averaging a plurality of individual waveforms, but the waveform is not limited to this.
- the "typical waveform" of the blood pressure surge may be the second quartile (median) of the distribution formed by the blood pressure fluctuation data for each lateral coordinate X.
- blood pressure fluctuation amount data can be arranged in ascending order for each lateral coordinate X, and the median value can be arranged in the lateral direction to obtain a representative waveform.
- the region Sd indicating the waveform variation constituting the image data Im is formed on the display screen of the display 240, for example, as shown in FIG. 9B, a curve cab showing a typical waveform and a background. It was displayed as a region with an intermediate concentration between the region Bg.
- the display mode of the region Sd showing the waveform variation is not limited to the region having an intermediate density.
- FIG. 16A exemplifies a plurality of individual waveforms C11, C12, C13, ..., Similar to FIG. 9A.
- a plurality of individual waveforms C11, C12 can be distinguished from the curve Cav'showing a typical waveform so as to form a region Sd'showing waveform variation.
- a curve Ci indicating C13, ... May be displayed.
- the curve Cav' is displayed as a solid line
- the curves Ci indicating a plurality of individual waveforms C11, C12, C13, ... are displayed as broken lines.
- the image data in the mode in which the curve Cav'showing a typical waveform is superposed on the region Sd' (including a plurality of curves Ci) showing the waveform variation is represented by the reference numeral Im'.
- the user can intuitively grasp the curve Cav'showing the typical waveform of the blood pressure surge in the subject 90 and the region Sd' showing the waveform variation.
- the display of the curve Ci showing the plurality of individual waveforms is useful for allowing the user to grasp the variation of the individual waveforms C11, C12, C13, ..., For example, when the number of individual waveforms is several or less.
- the curve Cav'showing a typical waveform and the curve Ci showing a plurality of individual waveforms C11, C12, C13, ... can be distinguished.
- the curve Cav'showing a typical waveform may be displayed by a solid red line
- the curve Ci showing a plurality of individual waveforms C11, C12, C13, ... May be displayed by a solid blue line.
- the acquisition is performed while creating and displaying the first image data Im including the region Sd (the region having an intermediate density of ⁇ ⁇ in the vertical direction) showing the waveform variation as shown in FIG. 9B. If the number N of blood pressure surges is less than the threshold value N ⁇ , the region Sd'(curves Ci showing a plurality of individual waveforms C11, C12, C13, ...) Showing waveform variation as shown in FIG. 16 (B) is formed. You may create and display the included second image data Im'. Whether or not the number N of blood pressure surges is larger than the threshold value N ⁇ can be determined, for example, by the control unit 310 of the server 300 acting as the blood pressure surge number determination unit.
- the control unit 310 of the server 300 includes the first image data Im including the region Sd showing the waveform variation as shown in FIG. 9B. Both may be created with the second image data Im ′ including the region Sd ′ showing various waveform variations.
- both the first image data and the second image data are transmitted from the server 300 to the hospital terminal (for example, 200A), and input to the user via the operation unit 230 of the hospital terminal (for example, 200A).
- the display of the first image data Im'and the display of the second image data Im' may be switched on the display screen of the display 240.
- the sphygmomanometer 400 is a tonometry type sphygmomanometer, but the present invention is not limited to this.
- the sphygmomanometer 400 includes a light emitting element that irradiates light toward an artery passing through a corresponding portion of the measurement site and a light receiving element that receives reflected light (or transmitted light) of the light, and has an arterial pulse. Blood pressure may be detected continuously based on the change in volume of the wave (photoelectric method).
- the sphygmomanometer 400 is provided with a piezoelectric sensor that is in contact with the part to be measured, and detects the strain due to the pressure of the artery passing through the corresponding part of the part to be measured as a change in electrical resistance, and changes in this electrical resistance. Blood pressure may be continuously detected based on (piezoelectric method). Further, the sphygmomanometer 400 includes a transmitting element that sends a radio wave (transmitted wave) toward an artery passing through a corresponding portion of the measured portion, and a receiving element that receives a reflected wave of the radio wave, and has an arterial pulse.
- a radio wave transmitted wave
- the change in the distance between the artery and the sensor due to the wave may be detected as the phase shift between the transmitted wave and the reflected wave, and the blood pressure may be continuously detected based on this phase shift (radio wave irradiation method). ). Further, if a physical quantity capable of calculating blood pressure can be observed, a method other than these may be applied.
Landscapes
- Health & Medical Sciences (AREA)
- Life Sciences & Earth Sciences (AREA)
- Engineering & Computer Science (AREA)
- Physics & Mathematics (AREA)
- Public Health (AREA)
- Surgery (AREA)
- Veterinary Medicine (AREA)
- General Health & Medical Sciences (AREA)
- Animal Behavior & Ethology (AREA)
- Biophysics (AREA)
- Pathology (AREA)
- Biomedical Technology (AREA)
- Heart & Thoracic Surgery (AREA)
- Medical Informatics (AREA)
- Molecular Biology (AREA)
- Cardiology (AREA)
- Physiology (AREA)
- Artificial Intelligence (AREA)
- Vascular Medicine (AREA)
- Psychiatry (AREA)
- Computer Vision & Pattern Recognition (AREA)
- Signal Processing (AREA)
- Evolutionary Computation (AREA)
- Fuzzy Systems (AREA)
- Mathematical Physics (AREA)
- Computer Networks & Wireless Communication (AREA)
- Measuring Pulse, Heart Rate, Blood Pressure Or Blood Flow (AREA)
Abstract
本発明では、被験者の脈動に連動して変化する血圧の時系列データから、予め定められた判定基準に基づいて血圧サージを検出する。検出された各血圧サージについて、その血圧サージをなす複数の拍対応ピークを結ぶ包絡線を個別波形(C11,C12,C13,…)として求める。複数得られた個別波形(C11,C12,C13,…)を統計処理して、時系列データ内での血圧サージの代表的波形と波形ばらつきを求める。表示画面上で、血圧サージの波形ばらつきを示す領域(Sd)に代表的波形を示す曲線(Cav)を重ね合わせて表示する処理を行う。
Description
この発明は血圧関連情報表示装置および血圧関連情報表示方法に関し、より詳しくは、被験者の血圧サージに関連する情報を可視化して表示する装置および方法に関する。また、この発明は、そのような血圧関連情報表示方法をコンピュータに実行させるためのプログラムに関する。
睡眠時無呼吸症候群(SAS;Sleep Apnea Syndrome)を罹患している患者においては、無呼吸後の呼吸再開時に血圧が急激に上昇し、その後に下降することが知られている。本明細書では、このような急激な血圧変動を「血圧サージ」(または単に「サージ」)と呼ぶ。患者に発生した血圧サージに関連する情報(例えば、血圧サージの波形)を可視化して表示することは、SASの診断や治療に役立つと考えられる。
従来、例えば特許文献1(WO 2017/082107 A1)の図3では、睡眠時無呼吸症候群(SAS)患者における変動状態(血圧サージ)の波形がグラフとして表示されている。
しかしながら、特許文献1では、血圧サージの波形は、収縮期血圧値(SBP)の時系列データについて時間軸を拡大して、脈拍毎のピークが分かる形態で表示されているに過ぎず、血圧の上昇、下降の傾向を示す曲線(形状)としては表示されていない。
このような状況下で、本出願人は、先に、SAS患者おける血圧サージの波形のパタン(形状)を分類し、可視化して表示する発明を出願した(特願2017-050066号)。これにより、医師は、比較的短い時間内に、各SAS患者おける血圧サージの波形のパタンを把握することができる。さらに、一歩進んで、医師が、各SAS患者における血圧サージの代表的波形と波形ばらつきを重ね合わせて見ることができれば便利であろう。また、SAS患者に限らず、被験者の血圧サージの代表的波形と波形ばらつきを重ね合わせて見ることは、心血管の疾病リスクを評価する材料や、特定の臓器の疾病リスクを評価する材料として役立つと考えられる。
そこで、この発明の課題は、血圧サージの代表的波形と波形ばらつきを重ね合わせて表示できる血圧関連情報表示装置および血圧関連情報表示方法を提供することにある。また、この発明の課題は、そのような血圧関連情報表示方法をコンピュータに実行させるためのプログラムを提供することにある。
上記課題を解決するため、この開示の血圧関連情報表示装置は、
血圧サージに関連する情報を可視化して表示する血圧関連情報表示装置であって、
被験者の脈動に連動して変化する血圧の時系列データから、予め定められた判定基準に基づいて血圧サージを検出する血圧サージ検出部と、
検出された各血圧サージについて、その血圧サージをなす複数の拍対応ピークを結ぶ包絡線を個別波形として求める個別波形取得部と、
複数得られた上記個別波形を統計処理して、上記時系列データ内での血圧サージの代表的波形と波形ばらつきを求める統計処理部と、
表示画面上で、上記血圧サージの上記波形ばらつきを示す領域に上記代表的波形を示す曲線を重ね合わせて表示する処理を行う表示処理部とを備えたことを特徴とする。
本明細書で、「予め定められた判定基準」とは、典型的には、睡眠時無呼吸症候群(SAS)患者において血圧サージを検出するための基準を指す。例えば、特願2017-048946号、特願2017-050066号に開示されているような、ピーク検出区間(例えば、15拍分の期間)内にサージ開始点の時刻からサージピーク点の時刻までが含まれるとともに、サージ開始点の時刻における収縮期血圧値とピーク点の時刻における収縮期血圧値との差(血圧変動量)が20mmHg(または15mmHg)以上であること、サージ開始点の時刻とピーク点の時刻との間の期間が5拍分よりも大きいこと、かつ、ピーク点の時刻とサージ終了点の時刻との間の期間が7拍分よりも大きいことを指す。
また、包絡線を作成するに用いられる、血圧サージをなす複数の「拍対応ピーク」とは、連続瞬時血圧波形の中での、収縮期血圧に相当するピークを指す。ただし、拡張期血圧値(DBP)に相当するピークであってもよい。
また、「統計処理」とは、個別波形を平均する処理、中央値を求める処理などを指す。血圧サージの「代表的波形」とは、例えば、複数の個別波形を平均して得られた平均的波形、または、複数の個別波形の中央値に相当する波形などを指す。また、血圧サージの「波形ばらつき」とは、例えば複数の個別波形の分布の幅を指す。
また、「表示画面」は、典型的には表示器の画面を指すが、例えば、プリンタによって出力される紙面であってもよい。
また、表示画面上の例えば代表的波形を示す曲線の「表示」は、典型的には、横方向座標が時間経過(例えば、拍の進行)を表し、縦方向座標が血圧サージに伴う血圧変動量を表す態様で行われる。
この開示の血圧関連情報表示装置では、血圧サージ検出部は、被験者の脈動に連動して変化する血圧の時系列データから、予め定められた判定基準に基づいて血圧サージを検出する。個別波形取得部は、検出された各血圧サージについて、その血圧サージをなす複数の拍対応ピークを結ぶ包絡線を個別波形として求める。統計処理部は、複数得られた上記個別波形を統計処理して、上記時系列データ内での血圧サージの代表的波形と波形ばらつきを求める。表示処理部は、表示画面上で、上記血圧サージの上記波形ばらつきを示す領域に上記代表的波形を示す曲線を重ね合わせて表示する処理を行う。これにより、ユーザ(典型的には、医師、看護師などの医療関係者を指す。被験者であってもよい。以下同様。)は、上記表示画面を見ることによって、直感的に、上記被験者における血圧サージの代表的波形を示す曲線と波形ばらつきを示す領域を把握することができる。このことは、SASの診断や治療のほか、心血管の疾病リスクを評価する材料や、特定の臓器の疾病リスクを評価する材料として役立つと考えられる。
一実施形態の血圧関連情報表示装置では、上記統計処理部は、時間経過を表す横方向座標と、血圧サージに伴う血圧変動量を表す縦方向座標とを含む座標平面上で、横方向に関して上記複数の個別波形を相対的にスライドさせて上記複数の個別波形のピークの位置を揃えたのと等価な状態をメモリ領域に作成し、この状態で上記横方向座標毎に上記複数の個別波形の血圧変動量データを統計処理して、上記代表的波形と上記波形ばらつきを求めることを特徴とする。
本明細書で、「個別波形のピーク」とは、各血圧サージのピークを指し、各血圧サージをなす複数の拍対応ピークのうちの最大の拍対応ピークに相当する。
また、「等価な状態」とは、上記座標平面上で上記複数の個別波形のピークの位置を実際に描いて揃える処理などを要さず、メモリ領域のデータが、上記座標平面上で規定された状態と等価な状態になっていれば足りるという意味である。
この一実施形態の血圧関連情報表示装置では、上記統計処理部は、横方向に関して上記複数の個別波形を相対的にスライドさせて上記複数の個別波形のピークの位置を揃えたのと等価な状態をメモリ領域に作成し、この状態で上記複数の個別波形の血圧変動量データを統計処理するので、上記代表的波形と上記波形ばらつきを把握し易くなる。
一実施形態の血圧関連情報表示装置では、上記複数の個別波形の血圧変動量データは、それぞれ、その個別波形の開始点の血圧値を基準とした変動量であることを特徴とする。
この一実施形態の血圧関連情報表示装置では、上記代表的波形と上記波形ばらつきを把握し易くなる。
一実施形態の血圧関連情報表示装置では、上記複数の個別波形の血圧変動量データは、上記複数の個別波形のピークの高さを揃えるように正規化されていることを特徴とする。
この一実施形態の血圧関連情報表示装置では、上記代表的波形と上記波形ばらつきをさらに把握し易くなる。
一実施形態の血圧関連情報表示装置では、
上記時間経過を表す横方向座標は、上記拍対応ピークを特定する拍番号によって定められ、
上記統計処理部は、上記拍番号毎に上記複数の個別波形の血圧変動量データを統計処理することを特徴とする。
上記時間経過を表す横方向座標は、上記拍対応ピークを特定する拍番号によって定められ、
上記統計処理部は、上記拍番号毎に上記複数の個別波形の血圧変動量データを統計処理することを特徴とする。
ここで、心臓の拍動によって拍間隔は一定ではないため、或る個別波形をなす血圧サージ発生時の1拍分の期間と、別の個別波形をなす血圧サージ発生時の1拍分の期間とは、互いに相違する場合がある。「上記時間経過を表す横方向座標は…拍番号によって定められ」とは、その相違にかかわらず、上記時間経過が拍の進行によって表される、という意味である。
この一実施形態の血圧関連情報表示装置では、上記時間経過を表す横方向座標は、上記拍対応ピークを特定する拍番号によって定められる。したがって、或る個別波形をなす血圧サージ発生時の1拍分の期間と、別の個別波形をなす血圧サージ発生時の1拍分の期間との相違にかかわらず、上記代表的波形と上記波形ばらつきを把握し易くなる。また、上記統計処理部は、上記複数の個別波形の血圧変動量データを統計処理する際に、上記拍番号毎に上記血圧変動量データの統計処理を行えば足りる。したがって、横方向に関して連続的に血圧変動量データの統計処理を行う場合に比して、上記統計処理部の演算量が少なくて済む。
一実施形態の血圧関連情報表示装置では、上記統計処理部は、上記複数の個別波形のうち横方向寸法が最長の個別波形よりも短い個別波形について、上記最長の個別波形よりも不足する部分の、上記血圧変動量データの統計処理に対する寄与をゼロにすることを特徴とする。
この一実施形態の血圧関連情報表示装置では、上記座標平面上で上記複数の個別波形の横方向寸法が互いに異なる場合であっても、上記血圧変動量データの統計処理を支障無く行うことができる。
一実施形態の血圧関連情報表示装置では、
上記統計処理部が求める上記波形ばらつきは、kを自然数としたとき、上記複数の個別波形の血圧変動量データがなす分布の標準偏差の±k倍として定義され、
上記表示処理部は、上記表示画面上に、上記波形ばらつきを示す領域として、縦方向に関して上記標準偏差の±k倍に相当する幅をもつ領域を表示することを特徴とする。
上記統計処理部が求める上記波形ばらつきは、kを自然数としたとき、上記複数の個別波形の血圧変動量データがなす分布の標準偏差の±k倍として定義され、
上記表示処理部は、上記表示画面上に、上記波形ばらつきを示す領域として、縦方向に関して上記標準偏差の±k倍に相当する幅をもつ領域を表示することを特徴とする。
この一実施形態の血圧関連情報表示装置では、上記表示画面上に、上記波形ばらつきを示す領域として、縦方向に関して上記標準偏差の±k倍(ただし、kは自然数である。典型的には、kは1、2または3として設定される。)に相当する幅をもつ領域が表示される。したがって、ユーザは、直感的に、上記被験者における血圧サージの代表的波形を示す曲線と波形ばらつきを示す領域を把握できる。この波形ばらつきを示す領域の表示は、例えば個別波形のばらつきが正規分布として取り扱われるのに十分である場合(例えば、個別波形の数が数十個以上の場合)に、特に有益となる。
一実施形態の血圧関連情報表示装置では、
上記統計処理部が求める上記波形ばらつきは、上記複数の個別波形の血圧変動量データがなす分布の四分位範囲として定義され、
上記表示処理部は、上記表示画面上に、上記波形ばらつきを示す領域として、縦方向に関して上記四分位範囲に相当する幅をもつ領域を表示することを特徴とする。
上記統計処理部が求める上記波形ばらつきは、上記複数の個別波形の血圧変動量データがなす分布の四分位範囲として定義され、
上記表示処理部は、上記表示画面上に、上記波形ばらつきを示す領域として、縦方向に関して上記四分位範囲に相当する幅をもつ領域を表示することを特徴とする。
この一実施形態の血圧関連情報表示装置では、上記表示画面上に、上記波形ばらつきを示す領域として、縦方向に関して上記四分位範囲に相当する幅をもつ領域が表示される。したがって、ユーザは、直感的に、上記被験者における血圧サージの代表的波形を示す曲線と波形ばらつきを示す領域を把握できる。また、上記波形ばらつきを示す領域を標準偏差を用いて定義する場合に比して、多くの計算を必要とせず、計算が簡単で済む。したがって、処理速度の向上やメモリの節約に貢献することができる。
一実施形態の血圧関連情報表示装置では、上記表示処理部は、上記表示画面上で上記波形ばらつきを示す領域をなすように、上記代表的波形を示す曲線とは区別可能な態様で、上記複数の個別波形を示す曲線を表示する処理を行うことを特徴とする。
この一実施形態の血圧関連情報表示装置では、上記表示画面上で上記波形ばらつきを示す領域をなすように、上記代表的波形を示す曲線と上記複数の個別波形を示す曲線とが表示される。したがって、ユーザは、直感的に、上記被験者における血圧サージの代表的波形を示す曲線と波形ばらつきを示す領域を把握できる。この複数の個別波形を示す曲線の表示は、例えば個別波形の数が数個以下の場合に、ユーザに個別波形のばらつきを把握させるのに有益となる。
一実施形態の血圧関連情報表示装置では、
上記被験者の脈動に連動して変化する血圧の時系列データに伴って、上記被験者の身体状態が特定された身体状態特定期間を表す情報を入力する入力部を備え、
上記統計処理部は、上記身体状態特定期間毎に、上記時系列データ内での血圧サージの代表的波形と波形ばらつきを求め、
上記表示処理部は、上記表示画面上で、上記身体状態特定期間毎に、上記血圧サージの上記波形ばらつきを示す領域に上記代表的波形を示す曲線を重ね合わせて表示する処理を行うことを特徴とする。
上記被験者の脈動に連動して変化する血圧の時系列データに伴って、上記被験者の身体状態が特定された身体状態特定期間を表す情報を入力する入力部を備え、
上記統計処理部は、上記身体状態特定期間毎に、上記時系列データ内での血圧サージの代表的波形と波形ばらつきを求め、
上記表示処理部は、上記表示画面上で、上記身体状態特定期間毎に、上記血圧サージの上記波形ばらつきを示す領域に上記代表的波形を示す曲線を重ね合わせて表示する処理を行うことを特徴とする。
本明細書で、「身体状態特定期間」とは、無呼吸期間、レム睡眠期間、ノンレム睡眠期間、覚醒期間、および/または、経皮的動脈血酸素飽和度(SpO2)が低い期間など、被験者が血圧サージの要因となり得る身体状態をとっている期間を指す。
この一実施形態の血圧関連情報表示装置では、入力部は、上記被験者の脈動に連動して変化する血圧の時系列データに伴って、上記被験者の身体状態特定期間を表す情報を入力する。上記統計処理部は、上記身体状態特定期間毎に、上記時系列データ内での血圧サージの代表的波形と波形ばらつきを求める。上記表示処理部は、上記表示画面上で、上記身体状態特定期間毎に、上記血圧サージの上記波形ばらつきを示す領域に上記代表的波形を示す曲線を重ね合わせて表示する処理を行う。これにより、ユーザは、上記身体状態特定期間毎に、言い換えれば、被験者が血圧サージの要因となり得る身体状態をとっている期間毎に、上記被験者における血圧サージの代表的波形を示す曲線と波形ばらつきを示す領域を把握することができる。したがって、ユーザは、例えば最も深刻な血圧サージを引き起こしている要因(身体状態)を把握することができる。
別の局面では、この開示の血圧関連情報表示方法は、
血圧サージに関連する情報を可視化して表示する血圧関連情報表示方法であって、
被験者の脈動に連動して変化する血圧の時系列データから、予め定められた判定基準に基づいて血圧サージを検出し、
検出された各血圧サージについて、その血圧サージをなす複数の拍対応ピークを結ぶ包絡線を個別波形として求め、
複数得られた上記個別波形を統計処理して、上記時系列データ内での血圧サージの代表的波形と波形ばらつきを求め、
表示画面上で、上記血圧サージの上記波形ばらつきを示す領域に上記代表的波形を示す曲線を重ね合わせて表示する処理を行うことを特徴とする。
血圧サージに関連する情報を可視化して表示する血圧関連情報表示方法であって、
被験者の脈動に連動して変化する血圧の時系列データから、予め定められた判定基準に基づいて血圧サージを検出し、
検出された各血圧サージについて、その血圧サージをなす複数の拍対応ピークを結ぶ包絡線を個別波形として求め、
複数得られた上記個別波形を統計処理して、上記時系列データ内での血圧サージの代表的波形と波形ばらつきを求め、
表示画面上で、上記血圧サージの上記波形ばらつきを示す領域に上記代表的波形を示す曲線を重ね合わせて表示する処理を行うことを特徴とする。
この開示の血圧関連情報表示方法によれば、ユーザは、直感的に、上記被験者における血圧サージの代表的波形を示す曲線と波形ばらつきを示す領域を把握することができる。このことは、SASの診断や治療のほか、心血管の疾病リスクを評価する材料や、特定の臓器の疾病リスクを評価する材料として役立つと考えられる。
さらに別の局面では、この開示のプログラムは、上記血圧関連情報表示方法をコンピュータに実行させるためのプログラムである。
この開示のプログラムをコンピュータに実行させることによって、上記血圧関連情報表示方法を実施することができる。
以上より明らかなように、この開示の血圧関連情報表示装置および血圧関連情報表示方法によれば、血圧サージの代表的波形と波形ばらつきを重ね合わせて表示できる。また、この開示のプログラムをコンピュータに実行させることによって、上記血圧関連情報表示方法を実施することができる。
以下、この発明の実施の形態を、図面を参照しながら詳細に説明する。
(システムの構成)
図1は、この発明の血圧関連情報表示装置をネットワーク上の一実施形態のシステム(全体を符号100で示す。)として構成した例を示している。このシステム100は、表示画面としての表示器240を有する病院端末200A,200Bと、サーバ300と、トノメトリ方式の血圧計400と、PSG(polysomnography;睡眠ポリグラフ検査)装置500とを含んでいる。これらの病院端末200A,200B、サーバ300、血圧計400およびPSG装置500は、病院内LAN(Local Area Network)であるネットワーク900を介して互いに通信可能になっている。このネットワーク900を介した通信は、無線、有線のいずれでも良い。この実施の形態において、ネットワーク900は、病院内LAN(Local Area Network)であるが、これに限定されず、インターネットのような他の種類のネットワークであってもよいし、USBケーブルなどを用いた1対1の通信であってもよい。なお、病院端末200A,200Bは、この例では2台のみを示しているが、3台以上設けられていてもよい。
図1は、この発明の血圧関連情報表示装置をネットワーク上の一実施形態のシステム(全体を符号100で示す。)として構成した例を示している。このシステム100は、表示画面としての表示器240を有する病院端末200A,200Bと、サーバ300と、トノメトリ方式の血圧計400と、PSG(polysomnography;睡眠ポリグラフ検査)装置500とを含んでいる。これらの病院端末200A,200B、サーバ300、血圧計400およびPSG装置500は、病院内LAN(Local Area Network)であるネットワーク900を介して互いに通信可能になっている。このネットワーク900を介した通信は、無線、有線のいずれでも良い。この実施の形態において、ネットワーク900は、病院内LAN(Local Area Network)であるが、これに限定されず、インターネットのような他の種類のネットワークであってもよいし、USBケーブルなどを用いた1対1の通信であってもよい。なお、病院端末200A,200Bは、この例では2台のみを示しているが、3台以上設けられていてもよい。
図2に示すように、病院端末200Aは、本体200Mと、この本体200Mに搭載された、制御部210と、メモリ220と、操作部230と、表示画面としての表示器240と、通信部290とを含む。この病院端末200Aは、市販のノート型パーソナルコンピュータからなり、後述の処理を行わせるようにアプリケーションソフトウェア(コンピュータプログラム)をインストールしたものであり、サーバ300にアクセスできるようになっている。
制御部210は、CPU(Central Processing Unit;中央演算処理装置)およびその補助回路を含み、病院端末200Aの各部を制御し、メモリ220に記憶されたプログラムおよびデータに従って後述の処理を実行する。すなわち、操作部230、および、通信部290から入力されたデータを処理し、処理したデータを、メモリ220に記憶させたり、表示器240で表示させたり、通信部290から出力させたりする。
メモリ220は、制御部210でプログラムを実行するために必要な作業領域として用いられるRAM(Random Access Memory)と、制御部210で実行するための基本的なプログラムを記憶するためのROM(Read Only Memory)とを含む。また、メモリ220の記憶領域を補助するための補助記憶装置の記憶媒体として、半導体メモリ(メモリカード、SSD(Solid State Drive))などが用いられてもよい。
操作部230は、この例では、キーボードおよびマウスで構成され、典型的にはユーザとしての医師による操作を示す操作信号を制御部210に入力する。また、操作部230は、キーボードおよびマウスに替えて、または、加えて、タッチパネルなどの他の操作デバイスで構成されるようにしてもよい。
表示器240は、表示画面(例えば、LCD(Liquid Crystal Display)またはEL(Electroluminescence)ディスプレイなど)を含む。表示器240は、制御部210によって制御されて、所定の映像を表示画面に表示させる。
通信部290は、制御部210からの情報をネットワーク900を介してサーバ300へ送信する。
簡単のため図示を省略するが、他の病院端末200B,…も病院端末200Aと同様の構成になっている。
図3に示すように、サーバ300は、制御部310と、記憶部320と、操作部330と、表示器340と、通信部390とを含む。このサーバ300は、汎用のコンピュータ装置に、後述の処理を行わせるようにプログラム(ソフトウェア)をインストールしたものである。
制御部310は、CPUおよびその補助回路を含み、サーバ300の各部を制御し、記憶部320に記憶されたプログラムおよびデータに従って所定の処理を実行し、操作部330、および、通信部390から入力されたデータを処理し、処理したデータを、記憶部320に記憶させたり、表示器340で表示させたり、通信部390から出力させたりする。
記憶部320は、制御部310でプログラムを実行するために必要な作業領域として用いられるRAMと、制御部310で実行するための基本的なプログラムを記憶するためのROMとを含む。記憶部320には、多くの被験者から送られてきた血圧測定データを含むデータベース321が設けられている。また、記憶部320の記憶領域を補助するための補助記憶装置の記憶媒体として、磁気ディスク(HD(Hard Disk)、FD(Flexible Disk))、光ディスク(CD(Compact Disc)、DVD(Digital Versatile Disk)、BD(Blu-ray Disc))、光磁気ディスク(MO(Magneto-Optical disk))、または、半導体メモリ(メモリカード、SSD)などが用いられてもよい。
操作部330は、この例では、キーボードおよびマウスで構成され、ユーザによる操作を示す操作信号を制御部310に入力する。また、操作部330は、キーボードおよびマウスに替えて、または、加えて、タッチパネルなどの他の操作デバイスで構成されるようにしてもよい。
表示器340は、表示画面(例えば、LCDまたはELディスプレイなど)を含む。表示器340は、制御部310によって制御されて、所定の映像を表示画面に表示させる。
通信部390は、制御部310からの情報をネットワーク900を介して他の装置(この例では病院端末200A)へ送信するとともに、他の装置からネットワーク900を介して送信されてきた情報を受信して制御部310に受け渡す。
図1中に示す血圧計400は、この例では、特願2017-050066号に開示されているようなトノメトリ方式の血圧計からなっている。この血圧計400は、図4中に示すように、トノメトリ方式で被験者90の被測定部位(例えば、左手首)を通る橈骨動脈の圧脈波を一拍毎に連続的に検出する圧力センサ部402と、この圧力センサ部402が検出した圧力の変化を血圧の時系列データとして出力する本体ユニット401とを備えている。圧力センサ部402と本体ユニット401との間は、信号ケーブル403によって接続されている。トノメトリ法は血管を圧力センサ部402(例えば、圧脈波センサ)で圧扁することにより圧脈波を計測し血圧を決定する手法である。血管の厚さが一様な円管と見なすと、血管内の血液の流れ、拍動の有無に関係なく血管壁を考慮してラプラスの法則に従い、血管の内圧(血圧)と血管の外圧(圧脈波の圧力)との関係式を導くことができる。この関係式で押圧面において血管が圧扁されている条件下では、血管の外壁及び内壁の半径を近似することにより、圧脈波の圧力と血圧とが等しいと近似できる。従って以降は、圧脈波の圧力は血圧と同一値になる。この結果、血圧計400は、被測定部位(例えば、左手首)の血圧値を一心拍ごとに測定して、例えば図6(A)に示すような態様で、測定時刻(時間)と血圧とを対応付けた血圧の時系列データ801を出力するようになっている。一晩の時系列データ801は、約3万拍分の拍対応ピーク(収縮期血圧(SBP)または拡張期血圧(DBP)に相当するピーク)を含んでいる。
また、図1中に示すPSG装置500は、この例では、市販のPSG装置(例えば、日本光電工業株式会社製のNeurofax(登録商標)EEG-9200)からなり、後述の[B.応用的な血圧関連情報表示方法]を実行する際にのみ用いられる。このPSG装置500は、図4中に示すように、センサ群502と、このセンサ群502からの信号を処理して被験者90の身体状態を特定する情報を出力する本体ユニット501とを備えている。この例では、センサ群502は、脳波を検出する脳波検出電極502Aと、眼球運動を検出する眼球運動検出電極502Bと、呼吸に伴う気流を検出する気流センサ502Cと、心電図を得るための心電図電極502Dと、経皮的動脈血酸素飽和度(SpO2)を検出するパルスオキシメータ502Eと、筋電図を得るための筋電図電極502Fとを含んでいる。センサ群502と本体ユニット501との間は、図示しないケーブルボックスを介して図示しない信号ケーブルによって接続されている。この例では、PSG装置500は、被験者90の身体状態が特定された期間(これを「身体状態特定期間」と呼ぶ。)を表す情報として、無呼吸期間(若しくは低呼吸期間)、レム睡眠期間、ノンレム睡眠期間、覚醒期間、および/または、SpO2が低い期間を表す情報を出力することができる。ここで、睡眠中の「無呼吸」とは、「呼吸が10秒以上止まる状態」を指す。また、「低呼吸」とは、呼吸による換気が10秒以上50%以下に低下することを指す。また、「レム睡眠」とは急速眼球運動を伴う睡眠を指し、「ノンレム睡眠」とは急速眼球運動を伴わない睡眠を指し、「覚醒」とは目覚めている状態を指す。SpO2とは、動脈血の中を流れている赤血球に含まれるヘモグロビンの何%に酸素が結合しているかを、皮膚を通して(経皮的に)測定した値を指す。SpO2が「低い」期間とは、この例ではSpO2が90%未満となった期間を指す。
例えば図6(A)の一部を拡大して示す図6(B)中に、「無呼吸」期間が、斜線付きのバー805,805,…で示されている。また、「低呼吸」期間が、白抜きのバー804,804,…で示されている。このような態様で、PSG装置500は、被験者90についての身体状態特定期間を表す情報を複数種類出力することができる。
(血圧関連情報表示方法)
このシステム100は、大別して、サーバ300での画像データの作成と、病院端末(例えば200A)での画像データの表示とを含む、以下のような[A.基本的な血圧関連情報表示方法]と[B.応用的な血圧関連情報表示方法]を実施することができる。
このシステム100は、大別して、サーバ300での画像データの作成と、病院端末(例えば200A)での画像データの表示とを含む、以下のような[A.基本的な血圧関連情報表示方法]と[B.応用的な血圧関連情報表示方法]を実施することができる。
[A.基本的な血圧関連情報表示方法]
この基本的な血圧関連情報表示方法では、PSG装置500を用いることなく、図6(A)に例示したような、血圧計400が出力する測定時刻(時間)と血圧とを対応付けた血圧の時系列データ801のみを用いて、次のように画像データの作成・表示を行う。
この基本的な血圧関連情報表示方法では、PSG装置500を用いることなく、図6(A)に例示したような、血圧計400が出力する測定時刻(時間)と血圧とを対応付けた血圧の時系列データ801のみを用いて、次のように画像データの作成・表示を行う。
(サーバ300での画像データの作成)
i) 図4に示した態様で、被験者90について、一晩(睡眠期間を含む。)にわたって、血圧計400を用いた連続的な血圧測定が行われたものとする(この例では、PSG装置500を用いた身体状態の測定は行われないものとする。)。この例では、血圧計400からの血圧の時系列データが、病院端末200Aによって受信され、メモリ220に一旦記憶される。続いて、例えばユーザとしての医師が病院端末200Aの操作部230を操作して、被験者90について測定された血圧の時系列データと身体状態特定期間を表す情報とを併せて、ネットワーク900を介してサーバ300に送信する。
i) 図4に示した態様で、被験者90について、一晩(睡眠期間を含む。)にわたって、血圧計400を用いた連続的な血圧測定が行われたものとする(この例では、PSG装置500を用いた身体状態の測定は行われないものとする。)。この例では、血圧計400からの血圧の時系列データが、病院端末200Aによって受信され、メモリ220に一旦記憶される。続いて、例えばユーザとしての医師が病院端末200Aの操作部230を操作して、被験者90について測定された血圧の時系列データと身体状態特定期間を表す情報とを併せて、ネットワーク900を介してサーバ300に送信する。
ii) サーバ300は、この例では常時動作状態にあり(ただし、メンテナンス期間等を除く。)、図5A(基本的な血圧関連情報表示方法を実行する際のサーバ300の動作フローを示す。)のステップS101に示すように、病院端末200Aからのデータを待っている。サーバ300の制御部310は、ネットワーク900から入力部としての通信部390を介して、病院端末200Aからの上述の血圧の時系列データを受信すると(ステップS101でYES)、受信した血圧の時系列データを記憶部320のデータベース321に記憶する。そして、次に述べるステップS102~S107の処理を実行する。
iii) まず、ステップS102に示すように、制御部310は前処理部として働いて、血圧の時系列データに公知の移動平均などなどを用いた平滑化、ノイズ除去、ローパスフィルタを用いた高周波成分除去等の前処理を施す。
iv) 次に、ステップS103に示すように、制御部310は血圧サージ検出部として働いて、被験者90の血圧の時系列データから、例えば特願2017-048946号、特願2017-050066号に開示されているように、予め定められた判定基準に基づいて血圧サージを検出する。これにより、例えば図6(B)中に、破線の矩形枠803,803,…で示すように、複数の血圧サージを検出する。血圧サージは一晩に数百個も発生することがあると言われている。この例では、収縮期血圧(SBP)に相当するピークに黒丸●が付され、それらが包絡線で結ばれている。また、拡張期血圧(DBP)に相当するピークに白丸○が付され、それらが包絡線で結ばれている。
ここで、血圧サージを検出するための「予め定められた判定基準」とは、例えば図7(血圧サージの個別波形の一例を曲線Cで示す。)に示すように、ピーク検出区間(例えば、15拍分の期間)内にサージ開始点P1の時刻からサージピーク点P2の時刻までが含まれるとともに、サージ開始点P1の時刻における収縮期血圧値(SBP)とピーク点P2の時刻における収縮期血圧値(SBP)との差(血圧変動量)L1が20mmHg(または15mmHg)以上であること、サージ開始点P1の時刻とピーク点P2の時刻との間の期間T1が5拍分よりも大きいこと、かつ、ピーク点P2の時刻とサージ終了点P4の時刻との間の期間T3が7拍分よりも大きいことを指す。この例では、サージ開始点P1は、ピーク点P2よりも前で、収縮期血圧値(SBP)の極小を与える点として規定されている。また、サージ終了点P4は、ピーク点P2よりも後で、ピーク点P2からL1×0.75(=L3)の分だけ血圧が降下した点として規定されている。
v)次に、図5AのステップS104に示すように、制御部310は個別波形取得部として働いて、検出された各血圧サージ803,803,…について、その血圧サージ803をなす複数の拍対応ピーク(この例では、収縮期血圧(SBP)に相当するピーク)を結ぶ包絡線を個別波形として求める。図7に示したように、血圧サージの個別波形は、山状の形状をなす曲線Cとして表される。
vi)次に、図5AのステップS105に示すように、制御部310は統計処理部として働いて、この例では、得られた全ての個別波形を統計処理して、上記時系列データ801内での血圧サージの代表的波形と波形ばらつきを求める。ここで、「統計処理」とは、個別波形を平均する処理を指す。この例では、血圧サージの「代表的波形」とは、複数の個別波形を平均して得られた平均的波形を指す。また、この例では、血圧サージの「波形ばらつき」とは、複数の個別波形の分布の幅を指す。
概念的に説明すると、血圧サージの個別波形を平均する処理とは、次のような処理を意味する。図8中に例示するように、血圧サージとして「サージNo.1」の個別波形C1、「サージNo.2」の個別波形C2が存在するものとする。この場合、血圧サージの個別波形を平均する処理とは、時間経過を表す横方向座標Xと、血圧サージに伴う血圧変動量を表す縦方向座標Yとを含む座標平面Q上で、横方向Xに関して複数の個別波形C1,C2を相対的にスライドさせて複数の個別波形C1,C2のピークの位置を揃えた状態で、横方向座標X毎に複数の個別波形C1,C2の血圧変動量データを平均して、代表的波形としての平均的波形を示す曲線Cavを求める処理に相当する。ここで、図8では、時間経過を表す横方向座標Xは、拍対応ピークを特定する拍番号によって定められている。縦方向座標Yは血圧サージに伴う収縮期血圧値(SBP)の血圧変動量によって定められている。なお、具体的なデータ処理(血圧サージの個別波形の統計処理)については、後に詳述する。
また、この例では、血圧サージの「波形ばらつき」の範囲は、複数の個別波形の血圧変動量データがなす分布(横方向座標X毎の分布)の標準偏差σを用いて、横方向座標X毎に標準偏差σの±k倍(ただし、kは自然数である。)の範囲として定義される。典型的には、kは1、2または3として設定される。以下では、特段断らない限り、血圧サージの「波形ばらつき」の範囲は、±σの範囲とする。この波形ばらつき±σを示す領域(例えば、後述の図9(B)中に示す領域Sd)の表示は、個別波形のばらつきが正規分布として取り扱われるのに十分である場合(例えば、数十個以上の場合)に、特に有益な表示となる。
これにより、代表的波形としての平均的波形を示す曲線Cavと、横方向座標X毎の波形ばらつき±σとが得られる。
vii)次に、図5AのステップS106に示すように、制御部310は表示処理部の一部として働いて、血圧サージの波形ばらつきを示す領域(符号Sdで表す。)に、平均的波形を示す曲線Cavを重ね合わせた態様の画像データを作成する。
例えば、図9(A)に示すように、図5AのステップS104で個別波形C11,C12,C13,…が得られたものとする。この場合、図5AのステップS106によって、例えば図9(B)に示すように、波形ばらつきを示す領域Sdに、平均的波形を示す曲線Cavを重ね合わせた態様の画像データImが得られる。この例では、平均的波形を示す曲線Cavは、或る一定の濃度を有する実線で表されている。波形ばらつきを示す領域Sdは、曲線Cavと背景領域(この例では、白色領域)Bgとの間の中間濃度を有する領域として表されている。
viii)この後、図5AのステップS107に示すように、サーバ300の制御部310は、作成した画像データImを、ネットワーク900を介して、この例では、血圧の時系列データの提供元である病院端末200Aへ送信する。
なお、サーバ300の制御部310は、画像データImを、例えば病院端末200Aを操作するユーザの指定に応じて、病院端末200A以外の他の病院端末200B等へ送信してもよい。
(血圧サージの個別波形の統計処理)
図10は、図5AのステップS105で述べた、サーバ300の制御部310による血圧サージの個別波形についての統計処理の詳細なフローを示している。
図10は、図5AのステップS105で述べた、サーバ300の制御部310による血圧サージの個別波形についての統計処理の詳細なフローを示している。
図10のステップS111に示すように、制御部310は、データベース321から、検出された全ての血圧サージについて、個別波形の拍対応ピークの時系列データを取得する。この例では、取得された血圧サージの数はN個であったものとする。
例えば、図11のテーブルMT1に示すように、検出された血圧サージNo.1は、開始時刻(開始点の時刻)22:20:15、ピーク時刻(ピークの時刻)22:20:21、終了時刻(終了点の時刻)22:20:26で特定されている。また、血圧サージNo.2は、開始時刻22:25:35、ピーク時刻22:25:44、終了時刻22:25:52で特定されている。なお、時刻表記の仕方は、「時:分:秒」である(以下同様)。
この場合、例えば血圧サージNo.1について、個別波形の拍対応ピークの時系列データは、例えば図12のテーブルMT2に示すように、開始時刻22:20:15では、拍対応ピークとしてのSBPに相当するピークが130[mmHg]、DBPに相当するピークが78[mmHg]、脈拍数PRが61[拍/分]というように記録されている。次の拍に相当する時刻22:20:16では、SBPに相当するピークが134[mmHg]、DBPに相当するピークが80[mmHg]、脈拍数PRが60[拍/分]というように記録されている。このようにして順次拍対応ピークの時系列データが記録され、終了時刻22:20:26では、SBPに相当するピークが133[mmHg]、DBPに相当するピークが82[mmHg]、脈拍数PRが61[拍/分]というように記録されている。簡単のため図示を省略するが、血圧サージNo.2についても、個別波形の拍対応ピークの時系列データは、同様に記録されている。
次に、図10のステップS112に示すように、制御部310は、N個の個別波形について、それぞれその個別波形の開始点P1を基準(=0[mmHg])としてオフセットする。すなわち、N個の個別波形について、それぞれ、各時刻の血圧値(この例では、SBP値)からその個別波形の開始点P1の血圧値(この例では、SBP値)を差し引く。これにより、時刻毎の血圧変動量データを得る。このようにオフセットを行うことによって、代表的波形としての平均的波形を示す曲線Cavと、横方向座標X毎の波形ばらつき±σとを把握し易くなる。
次に、図10のステップS113に示すように、制御部310は、N個の個別波形のうちX方向(横方向)寸法が最長の個別波形を特定する。また、その最長のX方向寸法を拍数M個として求める。
次に、図10のステップS114に示すように、制御部310は、記憶部320に、演算を実行するための作業領域としてN行M列のメモリ領域を確保する。
ここで簡単のため、図8中に例示したように、取得された血圧サージの数N=2個であり、「サージNo.1」の個別波形C1のX方向寸法が拍数12個分であり、「サージNo.2」の個別波形C2のX方向寸法が拍数17個分であったとする。このとき、制御部310は、X方向寸法が最長の個別波形をC2であると特定し、その最長のX方向寸法を拍数M=17個として求める。そして、制御部310は、記憶部320に、図13のテーブルMT3の2行目~3行目に示すように、「サージNo.1」、「サージNo.2」のための演算を実行するための作業領域として2行17列のメモリ領域を確保する。なお、実際に、取得された血圧サージの数Nが2より大きい場合は、2より多い行数のメモリ領域が確保される。テーブルMT3の最上段(1行目)には、X方向座標を表す拍番号が表されている。
次に、図10のステップS115に示すように、制御部310は、N行M列のメモリ領域において横方向Xに関してN個の個別波形を相対的にスライドさせてN個の個別波形のピークの位置(拍番号)を揃える。例えば図13の例では、横方向Xに関して「サージNo.1」、「サージNo.2」の2個の個別波形C1,C2のピークの位置が、拍番号10(破線の丸印で囲んで示す)の所に揃えられている。この結果、テーブルMT3の2行目に、「サージNo.1」の血圧変動量データが、拍番号4~15にわたって拍番号毎に「0」、「4」、「10」、「13」、…、「11」、「3」というように表されている(単位はmmHg。以下同様。)。また、テーブルMT3の3行目に、「サージNo.2」の血圧変動量データが、拍番号1~17にわたって拍番号毎に「0」、「2」、「3」、「5」、…、「4」、「2」というように表されている。このように、N個の個別波形のピークの位置(拍番号)を揃えた状態は、図8中に示した座標平面Q上で、横方向Xに関して複数の個別波形C1,C2を相対的にスライドさせて複数の個別波形C1,C2のピークの位置を揃えた状態と等価になっている。これにより、代表的波形としての平均的波形を示す曲線Cavと、横方向座標X毎の波形ばらつき±σとを、さらに把握し易くなる。なお、「サージNo.1」の個別波形C1の開始点(拍番号4)の値、「サージNo.2」の個別波形C2の開始点(拍番号1)の値がいずれも「0」になっているのは、既述のオフセット(図10のステップS112)の結果である。
次に、図10のステップS116に示すように、制御部310は、N個の個別波形の血圧変動量データを、拍番号(列)毎に統計処理(この例では、平均化)して、平均値を求める。例えば図13の例では、テーブルMT3の最下段(4行目)に、上述の「サージNo.1」、「サージNo.2」の個別波形の場合の血圧変動量データについての拍番号毎の平均値が表されている。この拍番号の平均値によって、代表的波形としての平均的波形を示す曲線Cavが定められる。
このとき、制御部310は、N個の個別波形のうちX方向寸法が最長の個別波形(上の例では、「サージNo.2」)よりも短い個別波形(上の例では、「サージNo.1」)について、最長の個別波形(上の例では、「サージNo.2」)よりも不足する部分の、上記血圧変動量データの統計処理に対する寄与をゼロにする。例えば図13の例では、「サージNo.1」の個別波形について、X方向寸法が「サージNo.2」の個別波形よりも不足する部分、すなわち、拍番号1~3の部分、および、拍番号16~17の部分について、上記血圧変動量データの統計処理に対する寄与をゼロにする。これにより、座標平面Q上でN個の個別波形のX方向寸法が互いに異なる場合であっても、上記血圧変動量データの統計処理を支障無く行うことができる。
さらに、図10のステップS117に示すように、制御部310は、N個の個別波形の血圧変動量データがなす分布の標準偏差σを、拍番号(列)毎に求める。拍番号毎に±σの領域が、既述の波形ばらつきを示す領域Sdを定める。
このように、このフローでは、N個の個別波形の血圧変動量データを統計処理する際に、拍番号(列)毎に血圧変動量データの統計処理を行えば足りる。したがって、横方向Xに関して連続的に血圧変動量データの統計処理を行う場合に比して、制御部310の演算量が少なくて済む。
なお、上述の図10のステップS112で、N個の個別波形について、それぞれその個別波形の開始点P1を基準(=0[mmHg])としてオフセットするのに加えて、さらに、N個の個別波形のピークの高さを揃えるように正規化してもよい。これにより、代表的波形としての平均的波形を示す曲線Cavと、横方向座標X毎の波形ばらつき±σとを、さらに把握し易くなる。
(病院端末での画像データの表示)
病院端末200Aは、図9(B)に示したような画像データImを、ネットワーク900を介して、サーバ300から受信する。
次に、病院端末200Aの操作部230を介したユーザの表示指示があると、病院端末200Aの制御部210は、表示処理部の一部として働いて、表示器240の表示画面上に、その画像データImを表示する。このとき、表示器240の表示画面上に、血圧変動量(図7中に示したサージ開始点P1の時刻における収縮期血圧値(SBP)とピーク点P2の時刻における収縮期血圧値(SBP)との差L1)の平均値、分布の標準偏差σ(または±σ,±2σ,±3σ)の値などを併せて表示してもよい。
ユーザは、表示器240の表示画面を見ることによって、被験者90における血圧サージの代表的波形を示す曲線Cavと波形ばらつきを示す領域Sdを把握することができる。このことは、SASの診断や治療のほか、心血管の疾病リスクを評価する材料や、特定の臓器の疾病リスクを評価する材料として役立つと考えられる。
なお、ユーザは、病院端末200Aの操作部230を介して転送指示を入力して、その画像データImを、病院端末200A以外の他の病院端末200B等へ送信してもよい。
[B.応用的な血圧関連情報表示方法]
この応用的な血圧関連情報表示方法では、血圧計400が出力する測定時刻(時間)と血圧とを対応付けた血圧の時系列データと、PSG装置500が出力する身体状態特定期間を表す情報とを用いて、次のように画像データの作成・表示を行う。
この応用的な血圧関連情報表示方法では、血圧計400が出力する測定時刻(時間)と血圧とを対応付けた血圧の時系列データと、PSG装置500が出力する身体状態特定期間を表す情報とを用いて、次のように画像データの作成・表示を行う。
(サーバ300での画像データの作成)
i) 図4に示した態様で、被験者90について、一晩(睡眠期間を含む。)にわたって、血圧計400を用いた連続的な血圧測定と、PSG装置500を用いた身体状態の測定が行われたものとする。この例では、血圧計400からの血圧の時系列データと、PSG装置500からの身体状態特定期間を表す情報とが、病院端末200Aによって受信され、メモリ220に一旦記憶される。続いて、例えばユーザとしての医師が病院端末200Aの操作部230を操作して、被験者90について測定された血圧の時系列データと身体状態特定期間を表す情報とを併せて、ネットワーク900を介してサーバ300に送信する。
i) 図4に示した態様で、被験者90について、一晩(睡眠期間を含む。)にわたって、血圧計400を用いた連続的な血圧測定と、PSG装置500を用いた身体状態の測定が行われたものとする。この例では、血圧計400からの血圧の時系列データと、PSG装置500からの身体状態特定期間を表す情報とが、病院端末200Aによって受信され、メモリ220に一旦記憶される。続いて、例えばユーザとしての医師が病院端末200Aの操作部230を操作して、被験者90について測定された血圧の時系列データと身体状態特定期間を表す情報とを併せて、ネットワーク900を介してサーバ300に送信する。
ii) サーバ300は、この例では常時動作状態にあり(ただし、メンテナンス期間等を除く。)、図5B(応用的な血圧関連情報表示方法を実行する際のサーバ300の動作フローを示す。)のステップS151に示すように、病院端末200Aからのデータを待っている。サーバ300の制御部310は、ネットワーク900から入力部としての通信部390を介して、病院端末200Aからの上述のデータ(血圧の時系列データと身体状態特定期間を表す情報)を受信すると(ステップS151でYES)、受信した血圧の時系列データと身体状態特定期間を表す情報を記憶部320のデータベース321に記憶する。そして、次に述べるステップS152~S157の処理を実行する。
iii) まず、ステップS152に示すように、制御部310は前処理部として働いて、血圧の時系列データに公知の移動平均などなどを用いた平滑化、ノイズ除去、ローパスフィルタを用いた高周波成分除去等の前処理を施す。
iv) 次に、ステップS153に示すように、制御部310は血圧サージ検出部として働いて、被験者90の血圧の時系列データから、例えば特願2017-048946号、特願2017-050066号に開示されているように、予め定められた判定基準に基づいて血圧サージを検出する。これにより、例えば図6(B)中に、破線の矩形枠803,803,…で示すように、複数の血圧サージを検出する。ここで、血圧サージを検出するための「予め定められた判定基準」は、図5AのステップS103に関して図7を用いて説明した判定基準と同様である。
v)次に、図5BのステップS154に示すように、制御部310は個別波形取得部として働いて、検出された各血圧サージ803,803,…について、その血圧サージ803をなす複数の拍対応ピーク(この例では、収縮期血圧(SBP)に相当するピーク)を結ぶ包絡線を個別波形として求める。図7に示したように、血圧サージの個別波形は、山状の形状をなす曲線Cとして表される。
vi)次に、図5BのステップS155に示すように、制御部310は統計処理部として働いて、この例では既述の身体状態特定期間毎に、それぞれ複数得られた個別波形を統計処理して、上記時系列データ801内での血圧サージの代表的波形と波形ばらつきを求める。この例では、或る身体状態特定期間(例えば、無呼吸期間)が血圧サージの開始点P1から終了点P4までの期間と一部でも重なっていれば、その血圧サージはその身体状態特定期間に発生したものとして処理される。ここで、「統計処理」とは、図5AのステップS105に関して図8(および図10~図13)を用いて説明したのと同様に、個別波形を平均する処理を指す。すなわち、血圧サージの個別波形を平均する処理は、時間経過を表す横方向座標Xと、血圧サージに伴う血圧変動量を表す縦方向座標Yとを含む座標平面Q上で、横方向Xに関して複数の個別波形C1,C2を相対的にスライドさせて複数の個別波形C1,C2のピークの位置を揃えた状態で、横方向座標X毎に複数の個別波形C1,C2の血圧変動量データを平均して、代表的波形としての平均的波形を示す曲線Cavを求める処理に相当する。また、この例では、図5AのステップS105に関して説明したのと同様に、血圧サージの「波形ばらつき」の範囲は、複数の個別波形の血圧変動量データがなす分布(横方向座標X毎の分布)の標準偏差σを用いて、横方向座標X毎に±σの範囲として定義される。
これにより、身体状態特定期間毎に、代表的波形としての平均的波形を示す曲線Cavと、横方向座標X毎の波形ばらつき±σとが得られる。例えば、一晩の時系列データで特定された身体状態特定期間が無呼吸期間(低呼吸期間を含む。)、レム睡眠期間、ノンレム睡眠期間、覚醒期間の4種類である場合、無呼吸期間について、代表的波形としての平均的波形を示す曲線Cavと、横方向座標X毎の波形ばらつき±σとが得られる。同様に、レム睡眠期間、ノンレム睡眠期間、覚醒期間のそれぞれについて、代表的波形としての平均的波形を示す曲線Cavと、横方向座標X毎の波形ばらつき±σとが得られる。
vii)次に、図5BのステップS156に示すように、制御部310は表示処理部の一部として働いて、既述の身体状態特定期間毎に、図9(B)に例示したような、血圧サージの波形ばらつきを示す領域Sdに、平均的波形を示す曲線Cavを重ね合わせた態様の画像データImを作成する。
例えば、後述の図15A中に示すように、無呼吸期間(低呼吸期間を含む。)、レム睡眠期間(REM)、ノンレム睡眠期間(NREM)、覚醒期間のそれぞれについて、波形ばらつきを示す領域Sd1,Sd2,Sd3,Sd4に、それぞれ平均的波形を示す曲線Cav1,Cav2,Cav3,Cav4を重ね合わせた態様の画像データIm1,Im2,Im3,Im4が得られる。
viii)この後、図5BのステップS157に示すように、サーバ300の制御部310は、身体状態特定期間毎に作成した画像データIm1,Im2,Im3,Im4を、ネットワーク900を介して、この例では、血圧の時系列データの提供元である病院端末200Aへ送信する。
なお、サーバ300の制御部310は、画像データIm1,Im2,Im3,Im4を、例えば病院端末200Aを操作するユーザの指定に応じて、病院端末200A以外の他の病院端末200B等へ送信してもよい。
(病院端末での画像データの表示)
図14は、サーバ300から身体状態特定期間毎に作成された画像データを受信した場合の、病院端末200Aでの表示処理のフローを示している。なお、この例では、病院端末200Aについて説明するが、他の病院端末200B等も同様の表示処理が可能になっている。
図14は、サーバ300から身体状態特定期間毎に作成された画像データを受信した場合の、病院端末200Aでの表示処理のフローを示している。なお、この例では、病院端末200Aについて説明するが、他の病院端末200B等も同様の表示処理が可能になっている。
病院端末200Aは、まず図14のステップS201に示すように、身体状態特定期間毎に作成された画像データを、ネットワーク900を介して、サーバ300から受信する。この例では、身体状態特定期間は、無呼吸期間(低呼吸期間を含む。)、レム睡眠期間、ノンレム睡眠期間、覚醒期間の4種類であるものとする。
次に、病院端末200Aの制御部210は、表示処理部の一部として働いて、図15Aに示すように、表示器240の表示画面上に、身体状態特定期間毎に作成された画像データIm1,Im2,Im3,Im4を並べてサムネイル表示する(図14のステップS202)。図15A中に示すように、この例では、表示器240の表示画面には、身体状態特定期間を特定する身体状態特定欄241と、その下方に対応して配置された画像データ欄242とが表示されている。この例では、身体状態特定欄241には、左から右へ向かって、無呼吸期間を表す「無呼吸」欄241aと、レム睡眠期間を表す「REM」欄241bと、ノンレム睡眠期間を表す「NREM」欄241cと、覚醒期間を表す「覚醒反応」欄241dとが含まれている。画像データ欄242には、無呼吸期間について作成された画像データIm1を表示する欄242aと、レム睡眠期間について作成された画像データIm2を表示する欄242bと、ノンレム睡眠期間について作成された画像データIm3を表示する欄242cと、覚醒期間について作成された画像データIm4を表示する欄242dとが含まれている。
この例では、無呼吸期間について作成された画像データIm1は、波形ばらつきを示す領域Sd1に、平均的波形を示す曲線Cav1を重ね合わせた態様になっている。レム睡眠期間について作成された画像データIm2は、波形ばらつきを示す領域Sd2に、平均的波形を示す曲線Cav2を重ね合わせた態様になっている。ノンレム睡眠期間について作成された画像データIm3は、波形ばらつきを示す領域Sd3に、平均的波形を示す曲線Cav3を重ね合わせた態様になっている。また、覚醒期間について作成された画像データIm4は、波形ばらつきを示す領域Sd4に、平均的波形を示す曲線Cav4を重ね合わせた態様になっている。
ユーザは、これらの画像データIm1,Im2,Im3,Im4のサムネイル表示を見ることによって、身体状態特定期間毎に、言い換えれば、被験者90が血圧サージの要因となり得る身体状態をとっている期間毎に、被験者90における血圧サージの代表的波形を示す曲線Cavと波形ばらつきを示す領域Sdを把握することができる。したがって、ユーザは、例えば最も深刻な血圧サージを引き起こしている要因(身体状態)を容易に把握することができる。例えば、画像データIm1,Im2,Im3,Im4のうち、無呼吸期間について作成された画像データIm1の血圧変動量が最も大きいことから、「無呼吸」が最も深刻な血圧サージを引き起こしていると判断してもよい。
次に、病院端末200Aの制御部210は、図14のステップS203に示すように、表示されている画像データIm1,Im2,Im3,Im4が選択されたか否かを判断する。ユーザが操作部230を操作することによって画像データIm1,Im2,Im3,Im4のうちいずれかを選択した場合(図14のステップS203でYES)、制御部210は、図15Bに示すように、表示器240の表示画面上に、その選択された身体状態特定期間についての画像データ(この例では、無呼吸期間について作成された画像データIm1)を拡大表示する(図14のステップS204)。このとき、表示器240の表示画面上に、その選択された身体状態特定期間についての血圧変動量(図7中に示したサージ開始点P1の時刻における収縮期血圧値(SBP)とピーク点P2の時刻における収縮期血圧値(SBP)との差L1)の平均値、分布の標準偏差σ(または±σ,±2σ,±3σ)の値などを併せて表示してもよい。
なお、画像データIm1,Im2,Im3,Im4がいずれも選択されない場合(図14のステップS203でNO)、制御部210は、画像をオフして(図14のステップS205)、この表示処理を終了する。
なお、ユーザは、病院端末200Aの操作部230を介して転送指示を入力して、画像データIm1,Im2,Im3,Im4を、病院端末200A以外の他の病院端末200B等へ送信してもよい。
上述のように、血圧サージの波形ばらつきを示す領域に平均的波形を示す曲線を重ね合わせた態様の画像データIm1,Im2,Im3,Im4を身体状態特定期間毎に表示することは、SASの診断や治療のほか、心血管の疾病リスクを評価する材料や、特定の臓器の疾病リスクを評価する材料として役立つと考えられる。
(変形例1)
上述の実施形態では、サーバ300が画像データIm(または、身体状態特定期間毎の画像データIm1,Im2,Im3,Im4。以下同様。)を作成し、病院端末200A,200B,…の表示器240が画像を表示したが、これに限られるものではない。サーバ300の制御部310は、画像データImを病院端末200A,200B,…へ送信する代わりに、画像作成のためのデータのみを送信し、病院端末200A,200B,…の制御部210が専ら画像データImを作成しても良い。
上述の実施形態では、サーバ300が画像データIm(または、身体状態特定期間毎の画像データIm1,Im2,Im3,Im4。以下同様。)を作成し、病院端末200A,200B,…の表示器240が画像を表示したが、これに限られるものではない。サーバ300の制御部310は、画像データImを病院端末200A,200B,…へ送信する代わりに、画像作成のためのデータのみを送信し、病院端末200A,200B,…の制御部210が専ら画像データImを作成しても良い。
(変形例2)
また、上述の実施形態では、本発明の血圧関連情報表示装置を、病院端末200A,200B,…とサーバ300とを含むネットワーク上のシステム100として構成したが、これに限られるものではない。
また、上述の実施形態では、本発明の血圧関連情報表示装置を、病院端末200A,200B,…とサーバ300とを含むネットワーク上のシステム100として構成したが、これに限られるものではない。
例えば、本発明の血圧関連情報表示装置を、病院端末200A,200B,…のいずれかのみで構成しても良い。つまり、病院端末(例えば200A)に上述の血圧関連情報表示方法の全部(血圧計400からの血圧の時系列データおよびPSG装置500からの身体状態特定期間を表す情報の受信から、表示器240の表示画面上への画像データIm等の表示までを含む。)を実行させてもよい。
その場合、病院端末200Aのメモリ220には、制御部210に、上述の血圧関連情報表示方法を実行させるプログラムをインストールしておく。これにより、本発明の血圧関連情報表示装置を小型かつコンパクトに構成することができる。
また、上述の血圧関連情報表示方法を、ソフトウェア(コンピュータプログラム)として、CD(コンパクトディスク)、DVD(デジタル万能ディスク)、フラッシュメモリなどの非一時的(non-transitory)にデータを記憶可能な記録媒体に記録してもよい。このような記録媒体に記録されたソフトウェアを、パーソナルコンピュータ、PDA(パーソナル・デジタル・アシスタンツ)、スマートフォンなどの実質的なコンピュータ装置にインストールすることによって、それらのコンピュータ装置に、上述の血圧関連情報表示方法を実行させることができる。
(変形例3)
上述の実施形態では、画像データImを構成する波形ばらつきを示す領域Sdは、横方向座標X毎に血圧変動量データがなす分布の標準偏差σの±k倍(典型的には、±σ,±2σまたは±3σ)の範囲として定義された。しかしながら、波形ばらつきを示す領域Sdの範囲は、標準偏差σを用いて定義されたものに限られない。
上述の実施形態では、画像データImを構成する波形ばらつきを示す領域Sdは、横方向座標X毎に血圧変動量データがなす分布の標準偏差σの±k倍(典型的には、±σ,±2σまたは±3σ)の範囲として定義された。しかしながら、波形ばらつきを示す領域Sdの範囲は、標準偏差σを用いて定義されたものに限られない。
例えば、波形ばらつきを示す領域Sdは、横方向座標X毎に血圧変動量データがなす分布の四分位範囲として定義されてもよい。すなわち、処理としては、横方向座標X毎に血圧変動量データを昇順に並べる。そして、第一四分位を領域Sdの下限とし、第三四分位を領域Sdの上限とする。これにより、波形ばらつきを示す領域Sdを求めることができる。
このように、波形ばらつきを示す領域Sdを、横方向座標X毎に血圧変動量データがなす分布の四分位範囲とした場合、標準偏差σを用いて定義する場合に比して、多くの計算を必要とせず、計算が簡単で済む。したがって、処理速度の向上やメモリの節約に貢献することができる。
また、血圧サージの「代表的波形」は、複数の個別波形を平均して得られた平均的波形としたが、これに限られるものではない。血圧サージの「代表的波形」は、横方向座標X毎に血圧変動量データがなす分布の第二四分位(中央値)であってもよい。この場合、処理としては、横方向座標X毎に血圧変動量データを昇順に並べ、横方向に中央値を連ねて、代表的波形を得ることかできる。
(変形例4)
上述の実施形態では、画像データImを構成する波形ばらつきを示す領域Sdは、表示器240の表示画面上で、例えば図9(B)に示したように、代表的波形を示す曲線Cavと背景領域Bgとの間の中間濃度を有する領域として表示された。しかしながら、波形ばらつきを示す領域Sdの表示態様は、中間濃度を有する領域に限られない。
上述の実施形態では、画像データImを構成する波形ばらつきを示す領域Sdは、表示器240の表示画面上で、例えば図9(B)に示したように、代表的波形を示す曲線Cavと背景領域Bgとの間の中間濃度を有する領域として表示された。しかしながら、波形ばらつきを示す領域Sdの表示態様は、中間濃度を有する領域に限られない。
例えば、図16(A)は、図9(A)と同様に、複数の個別波形C11,C12,C13,…を例示している。この場合において、図16(B)に示すように、波形ばらつきを示す領域Sd′をなすように、代表的波形を示す曲線Cav′とは区別可能な態様で、複数の個別波形C11,C12,C13,…を示す曲線Ciを表示してもよい。この例では、曲線Cav′が実線で表示されているのに対して、複数の個別波形C11,C12,C13,…を示す曲線Ciはそれぞれ破線で表示されている。この例では、この波形ばらつきを示す領域Sd′(複数の曲線Ciを含む)に代表的波形を示す曲線Cav′を重ね合わせた態様の画像データが符号Im′で表されている。
これにより、ユーザは、直感的に、被験者90における血圧サージの代表的波形を示す曲線Cav′と波形ばらつきを示す領域Sd′を把握できる。この複数の個別波形を示す曲線Ciの表示は、例えば個別波形の数が数個以下の場合に、ユーザに個別波形C11,C12,C13,…のばらつきを把握させるのに有益となる。
なお、代表的波形を示す曲線Cav′と複数の個別波形C11,C12,C13,…を示す曲線Ciとは区別可能であれば良い。例えば、代表的波形を示す曲線Cav′が赤色の実線で表示される一方、複数の個別波形C11,C12,C13,…を示す曲線Ciが青色の実線で表示されてもよい。
また、身体状態特定期間毎に取得された血圧サージの数Nに対して閾値Nα(例えば、Nα=10個とする。)を設けて、取得された血圧サージの数Nが閾値Nα以上であれば、図9(B)に示したような波形ばらつきを示す領域Sd(縦方向に±σの幅の中間濃度を有する領域)を含む第1の画像データImの作成・表示を行う一方、取得された血圧サージの数Nが閾値Nα未満であれば、図16(B)に示したような波形ばらつきを示す領域Sd′(複数の個別波形C11,C12,C13,…を示す曲線Ci)を含む第2の画像データIm′の作成・表示を行ってもよい。この血圧サージの数Nが閾値Nαよりも大きいか否かの判定は、例えば、サーバ300の制御部310が血圧サージ数判定部として働いて行うことができる。
または、それに代えて、例えばサーバ300の制御部310が、図9(B)に示したような波形ばらつきを示す領域Sdを含む第1の画像データImと、図16(B)に示したような波形ばらつきを示す領域Sd′を含む第2の画像データIm′との両方を作成してもよい。この場合、例えば、サーバ300から病院端末(例えば200A)へ第1の画像データと第2の画像データとの両方を送信し、病院端末(例えば200A)の操作部230を介したユーザの入力に応じて、表示器240の表示画面上で、それらの第1の画像データImの表示と第2の画像データIm′の表示とを切り替えるようにしてもよい。
(変形例5)
また、上述の実施形態では、血圧計400はトノメトリ方式の血圧計であるものとしたが、これに限られるものではない。血圧計400は、被測定部位のうち対応する部分を通る動脈へ向けて光を照射する発光素子と、その光の反射光(または透過光)を受光する受光素子とを備えて、動脈の脈波を容積の変化に基づいて連続的に血圧を検出してもよい(光電方式)。また、血圧計400は、被測定部位に当接された圧電センサを備えて、被測定部位のうち対応する部分を通る動脈の圧力による歪みを電気抵抗の変化として検出し、この電気抵抗の変化に基づいて連続的に血圧を検出してもよい(圧電方式)。さらに、血圧計400は、被測定部位のうち対応する部分を通る動脈へ向けて電波(送信波)を送る送信素子と、その電波の反射波を受信する受信素子とを備えて、動脈の脈波による動脈とセンサとの間の距離の変化を送信波と反射波との間の位相のずれとして検出し、この位相のずれに基づいて連続的に血圧を検出してもよい(電波照射方式)。また、血圧を算出することができる物理量を観測することができれば、これらの以外の方式を適用してもよい。
また、上述の実施形態では、血圧計400はトノメトリ方式の血圧計であるものとしたが、これに限られるものではない。血圧計400は、被測定部位のうち対応する部分を通る動脈へ向けて光を照射する発光素子と、その光の反射光(または透過光)を受光する受光素子とを備えて、動脈の脈波を容積の変化に基づいて連続的に血圧を検出してもよい(光電方式)。また、血圧計400は、被測定部位に当接された圧電センサを備えて、被測定部位のうち対応する部分を通る動脈の圧力による歪みを電気抵抗の変化として検出し、この電気抵抗の変化に基づいて連続的に血圧を検出してもよい(圧電方式)。さらに、血圧計400は、被測定部位のうち対応する部分を通る動脈へ向けて電波(送信波)を送る送信素子と、その電波の反射波を受信する受信素子とを備えて、動脈の脈波による動脈とセンサとの間の距離の変化を送信波と反射波との間の位相のずれとして検出し、この位相のずれに基づいて連続的に血圧を検出してもよい(電波照射方式)。また、血圧を算出することができる物理量を観測することができれば、これらの以外の方式を適用してもよい。
以上の実施形態は例示であり、この発明の範囲から離れることなく様々な変形が可能である。上述した複数の実施の形態は、それぞれ単独で成立し得るものであるが、実施の形態同士の組みあわせも可能である。また、異なる実施の形態の中の種々の特徴も、それぞれ単独で成立し得るものであるが、異なる実施の形態の中の特徴同士の組みあわせも可能である。
100 システム
200A,200B,… 病院端末
240 表示器
300 サーバ
400 血圧計
500 PSG装置
200A,200B,… 病院端末
240 表示器
300 サーバ
400 血圧計
500 PSG装置
Claims (12)
- 血圧サージに関連する情報を可視化して表示する血圧関連情報表示装置であって、
被験者の脈動に連動して変化する血圧の時系列データから、予め定められた判定基準に基づいて血圧サージを検出する血圧サージ検出部と、
検出された各血圧サージについて、その血圧サージをなす複数の拍対応ピークを結ぶ包絡線を個別波形として求める個別波形取得部と、
複数得られた上記個別波形を統計処理して、上記時系列データ内での血圧サージの代表的波形と波形ばらつきを求める統計処理部と、
表示画面上で、上記血圧サージの上記波形ばらつきを示す領域に上記代表的波形を示す曲線を重ね合わせて表示する処理を行う表示処理部とを備えたことを特徴とする血圧関連情報表示装置。 - 請求項1に記載の血圧関連情報表示装置において、
上記統計処理部は、時間経過を表す横方向座標と、血圧サージに伴う血圧変動量を表す縦方向座標とを含む座標平面上で、横方向に関して上記複数の個別波形を相対的にスライドさせて上記複数の個別波形のピークの位置を揃えたのと等価な状態をメモリ領域に作成し、この状態で上記横方向座標毎に上記複数の個別波形の血圧変動量データを統計処理して、上記代表的波形と上記波形ばらつきを求めることを特徴とする血圧関連情報表示装置。 - 請求項2に記載の血圧関連情報表示装置において、
上記複数の個別波形の血圧変動量データは、それぞれ、その個別波形の開始点の血圧値を基準とした変動量であることを特徴とする血圧関連情報表示装置。 - 請求項3に記載の血圧関連情報表示装置において、
上記複数の個別波形の血圧変動量データは、上記複数の個別波形のピークの高さを揃えるように正規化されていることを特徴とする血圧関連情報表示装置。 - 請求項2から4までのいずれか一つに記載の血圧関連情報表示装置において、
上記時間経過を表す横方向座標は、上記拍対応ピークを特定する拍番号によって定められ、
上記統計処理部は、上記拍番号毎に上記複数の個別波形の血圧変動量データを統計処理することを特徴とする血圧関連情報表示装置。 - 請求項2から5までのいずれか一つに記載の血圧関連情報表示装置において、
上記統計処理部は、上記複数の個別波形のうち横方向寸法が最長の個別波形よりも短い個別波形について、上記最長の個別波形よりも不足する部分の、上記血圧変動量データの統計処理に対する寄与をゼロにすることを特徴とする血圧関連情報表示装置。 - 請求項2から6までのいずれか一つに記載の血圧関連情報表示装置において、
上記統計処理部が求める上記波形ばらつきは、kを自然数としたとき、上記複数の個別波形の血圧変動量データがなす分布の標準偏差の±k倍として定義され、
上記表示処理部は、上記表示画面上に、上記波形ばらつきを示す領域として、縦方向に関して上記標準偏差の±k倍に相当する幅をもつ領域を表示することを特徴とする血圧関連情報表示装置。 - 請求項2から6までのいずれか一つに記載の血圧関連情報表示装置において、
上記統計処理部が求める上記波形ばらつきは、上記複数の個別波形の血圧変動量データがなす分布の四分位範囲として定義され、
上記表示処理部は、上記表示画面上に、上記波形ばらつきを示す領域として、縦方向に関して上記四分位範囲に相当する幅をもつ領域を表示することを特徴とする血圧関連情報表示装置。 - 請求項2から6までのいずれか一つに記載の血圧関連情報表示装置において、
上記表示処理部は、上記表示画面上で上記波形ばらつきを示す領域をなすように、上記代表的波形を示す曲線とは区別可能な態様で、上記複数の個別波形を示す曲線を表示する処理を行うことを特徴とする血圧関連情報表示装置。 - 請求項1から9までのいずれか一つに記載の血圧関連情報表示装置において、
上記被験者の脈動に連動して変化する血圧の時系列データに伴って、上記被験者の身体状態が特定された身体状態特定期間を表す情報を入力する入力部を備え、
上記統計処理部は、上記身体状態特定期間毎に、上記時系列データ内での血圧サージの代表的波形と波形ばらつきを求め、
上記表示処理部は、上記表示画面上で、上記身体状態特定期間毎に、上記血圧サージの上記波形ばらつきを示す領域に上記代表的波形を示す曲線を重ね合わせて表示する処理を行うことを特徴とする血圧関連情報表示装置。 - 血圧サージに関連する情報を可視化して表示する血圧関連情報表示方法であって、
被験者の脈動に連動して変化する血圧の時系列データから、予め定められた判定基準に基づいて血圧サージを検出し、
検出された各血圧サージについて、その血圧サージをなす複数の拍対応ピークを結ぶ包絡線を個別波形として求め、
複数得られた上記個別波形を統計処理して、上記時系列データ内での血圧サージの代表的波形と波形ばらつきを求め、
表示画面上で、上記血圧サージの上記波形ばらつきを示す領域に上記代表的波形を示す曲線を重ね合わせて表示する処理を行うことを特徴とする血圧関連情報表示方法。 - 請求項11に記載の血圧関連情報表示方法をコンピュータに実行させるためのプログラム。
Priority Applications (3)
| Application Number | Priority Date | Filing Date | Title |
|---|---|---|---|
| CN202080024289.4A CN113645897B (zh) | 2019-03-25 | 2020-03-03 | 血压关联信息显示装置、血压关联信息显示方法、以及存储介质 |
| DE112020001440.1T DE112020001440T5 (de) | 2019-03-25 | 2020-03-03 | Anzeigevorrichtung für blutdruckbezogene Informationen, Anzeigeverfahren für blutdruckbezogene Informationen und Programm |
| US17/484,422 US12186060B2 (en) | 2019-03-25 | 2021-09-24 | Blood pressure-related information display device, blood pressure-related information display method, and computer-readable recording medium |
Applications Claiming Priority (2)
| Application Number | Priority Date | Filing Date | Title |
|---|---|---|---|
| JP2019-057000 | 2019-03-25 | ||
| JP2019057000A JP7267055B2 (ja) | 2019-03-25 | 2019-03-25 | 血圧関連情報表示装置、血圧関連情報表示方法、およびプログラム |
Related Child Applications (1)
| Application Number | Title | Priority Date | Filing Date |
|---|---|---|---|
| US17/484,422 Continuation US12186060B2 (en) | 2019-03-25 | 2021-09-24 | Blood pressure-related information display device, blood pressure-related information display method, and computer-readable recording medium |
Publications (1)
| Publication Number | Publication Date |
|---|---|
| WO2020195615A1 true WO2020195615A1 (ja) | 2020-10-01 |
Family
ID=72610007
Family Applications (1)
| Application Number | Title | Priority Date | Filing Date |
|---|---|---|---|
| PCT/JP2020/008976 Ceased WO2020195615A1 (ja) | 2019-03-25 | 2020-03-03 | 血圧関連情報表示装置、血圧関連情報表示方法、およびプログラム |
Country Status (5)
| Country | Link |
|---|---|
| US (1) | US12186060B2 (ja) |
| JP (1) | JP7267055B2 (ja) |
| CN (1) | CN113645897B (ja) |
| DE (1) | DE112020001440T5 (ja) |
| WO (1) | WO2020195615A1 (ja) |
Families Citing this family (1)
| Publication number | Priority date | Publication date | Assignee | Title |
|---|---|---|---|---|
| JP6766708B2 (ja) * | 2017-03-15 | 2020-10-14 | オムロンヘルスケア株式会社 | 情報処理装置、方法及びプログラム |
Citations (3)
| Publication number | Priority date | Publication date | Assignee | Title |
|---|---|---|---|---|
| JP2003290174A (ja) * | 2002-03-29 | 2003-10-14 | Sofutorokkusu:Kk | 生体器官の監視方法 |
| JP2014168574A (ja) * | 2013-03-04 | 2014-09-18 | Omron Healthcare Co Ltd | 電子血圧計 |
| JP2018153232A (ja) * | 2017-03-15 | 2018-10-04 | オムロンヘルスケア株式会社 | 情報処理装置、方法及びプログラム |
Family Cites Families (11)
| Publication number | Priority date | Publication date | Assignee | Title |
|---|---|---|---|---|
| US5178154A (en) * | 1990-09-18 | 1993-01-12 | Sorba Medical Systems, Inc. | Impedance cardiograph and method of operation utilizing peak aligned ensemble averaging |
| US7527597B2 (en) * | 2001-01-16 | 2009-05-05 | Biomedical Acoustic Research Corporation | Acoustic detection of vascular conditions |
| US7041061B2 (en) * | 2002-07-19 | 2006-05-09 | Cardiac Pacemakers, Inc. | Method and apparatus for quantification of cardiac wall motion asynchrony |
| JP4342455B2 (ja) * | 2005-02-03 | 2009-10-14 | 株式会社東芝 | 健康管理装置および健康管理システム |
| CN102065763A (zh) * | 2008-05-28 | 2011-05-18 | 尼图尔医疗有限公司 | 用于co2评估的方法和装置 |
| JP5017501B1 (ja) * | 2011-01-24 | 2012-09-05 | 株式会社アクトメディカルサービス | 血管脈波測定システム |
| CN104398257A (zh) * | 2014-12-08 | 2015-03-11 | 蚌埠医学院 | 一种心电波形周期性统计分析方法 |
| JP6508473B2 (ja) | 2015-08-31 | 2019-05-08 | 東芝ライテック株式会社 | 照明器具 |
| JP6548522B2 (ja) | 2015-08-31 | 2019-07-24 | カルソニックカンセイ株式会社 | 吸着器の作製方法 |
| DE112016005179T5 (de) | 2015-11-10 | 2018-07-19 | Omron Healthcare Co., Ltd. | Diagnose-Unterstützungsgerät, Diagnose-Unterstützungsverfahren, Diagnose-Unterstützungsprogramm |
| US10973422B2 (en) * | 2016-01-22 | 2021-04-13 | Fitbit, Inc. | Photoplethysmography-based pulse wave analysis using a wearable device |
-
2019
- 2019-03-25 JP JP2019057000A patent/JP7267055B2/ja active Active
-
2020
- 2020-03-03 DE DE112020001440.1T patent/DE112020001440T5/de active Pending
- 2020-03-03 WO PCT/JP2020/008976 patent/WO2020195615A1/ja not_active Ceased
- 2020-03-03 CN CN202080024289.4A patent/CN113645897B/zh active Active
-
2021
- 2021-09-24 US US17/484,422 patent/US12186060B2/en active Active
Patent Citations (3)
| Publication number | Priority date | Publication date | Assignee | Title |
|---|---|---|---|---|
| JP2003290174A (ja) * | 2002-03-29 | 2003-10-14 | Sofutorokkusu:Kk | 生体器官の監視方法 |
| JP2014168574A (ja) * | 2013-03-04 | 2014-09-18 | Omron Healthcare Co Ltd | 電子血圧計 |
| JP2018153232A (ja) * | 2017-03-15 | 2018-10-04 | オムロンヘルスケア株式会社 | 情報処理装置、方法及びプログラム |
Also Published As
| Publication number | Publication date |
|---|---|
| DE112020001440T5 (de) | 2021-12-09 |
| JP7267055B2 (ja) | 2023-05-01 |
| US20220007951A1 (en) | 2022-01-13 |
| JP2020156609A (ja) | 2020-10-01 |
| US12186060B2 (en) | 2025-01-07 |
| CN113645897A (zh) | 2021-11-12 |
| CN113645897B (zh) | 2025-04-15 |
Similar Documents
| Publication | Publication Date | Title |
|---|---|---|
| US12263018B2 (en) | Spot check measurement system | |
| JP5584413B2 (ja) | 患者監視システム及び監視する方法 | |
| JP4280806B2 (ja) | 非侵襲性心拍出量監視による患者の監視システム | |
| JP5231561B2 (ja) | 改善型患者モニタリング | |
| EP2898823B1 (en) | Monitoring apparatus | |
| CN104321013A (zh) | 用于基于ecg信号来提供睡眠质量的视觉表示的方法和装置 | |
| US11185253B2 (en) | Pattern recognition system for quantifying the likelihood of the contribution of multiple possible forms of chronic disease to patient reported dyspnea | |
| JP2016112049A (ja) | 脈波解析装置 | |
| JP6762061B1 (ja) | ソフトウェア | |
| JP6547838B2 (ja) | 診断支援装置、診断支援方法、診断支援プログラム | |
| JP6645190B2 (ja) | 診断支援装置、診断支援方法、及び、診断支援プログラム | |
| US12023145B2 (en) | Gas exchange systems and methods for calculating ventilatory threshold and evaluating pulmonary arterial hypertension | |
| JP7267055B2 (ja) | 血圧関連情報表示装置、血圧関連情報表示方法、およびプログラム | |
| CN106572813B (zh) | 用于量化慢性疾病的多种可能形式对被报告呼吸困难的患者的贡献的可能性的模式识别系统 | |
| JP2020156609A5 (ja) | ||
| CN118574569A (zh) | 心音分析装置、心音分析程序和记录介质 | |
| US12575748B2 (en) | Blood pressure-related information display device, blood pressure-related information display method, and a non-transitory computer- readable computer medium | |
| JP7253419B2 (ja) | 血圧関連情報表示装置、血圧関連情報表示方法、およびプログラム | |
| JP2022167320A (ja) | 脈波解析装置、脈波解析方法、および脈波解析プログラム | |
| JP2020130531A (ja) | 血圧関連情報処理装置、血圧関連情報処理方法、およびプログラム | |
| EP4379734A1 (en) | System and method for patient monitoring | |
| EP4465305A1 (en) | Methods and systems for using and training clinical support algorithms | |
| Bachir | Time-of-flight abdominal wall displacement for non-invasive longitudinal monitoring of pulmonary function | |
| CN118574568A (zh) | 心音提取装置、心音提取程序、记录介质及监测系统 | |
| JP2007061572A (ja) | 脈波による動脈硬化・自律神経失調症診断装置 |
Legal Events
| Date | Code | Title | Description |
|---|---|---|---|
| 121 | Ep: the epo has been informed by wipo that ep was designated in this application |
Ref document number: 20777830 Country of ref document: EP Kind code of ref document: A1 |
|
| 122 | Ep: pct application non-entry in european phase |
Ref document number: 20777830 Country of ref document: EP Kind code of ref document: A1 |
|
| WWG | Wipo information: grant in national office |
Ref document number: 202080024289.4 Country of ref document: CN |