WO2020145215A1 - 情報処理装置、情報処理方法及びプログラム - Google Patents
情報処理装置、情報処理方法及びプログラム Download PDFInfo
- Publication number
- WO2020145215A1 WO2020145215A1 PCT/JP2019/051619 JP2019051619W WO2020145215A1 WO 2020145215 A1 WO2020145215 A1 WO 2020145215A1 JP 2019051619 W JP2019051619 W JP 2019051619W WO 2020145215 A1 WO2020145215 A1 WO 2020145215A1
- Authority
- WO
- WIPO (PCT)
- Prior art keywords
- matrix
- basis
- teacher
- extraction
- measurement data
- Prior art date
Links
Images


Classifications
-
- G—PHYSICS
- G01—MEASURING; TESTING
- G01M—TESTING STATIC OR DYNAMIC BALANCE OF MACHINES OR STRUCTURES; TESTING OF STRUCTURES OR APPARATUS, NOT OTHERWISE PROVIDED FOR
- G01M13/00—Testing of machine parts
- G01M13/04—Bearings
- G01M13/045—Acoustic or vibration analysis
-
- G—PHYSICS
- G01—MEASURING; TESTING
- G01M—TESTING STATIC OR DYNAMIC BALANCE OF MACHINES OR STRUCTURES; TESTING OF STRUCTURES OR APPARATUS, NOT OTHERWISE PROVIDED FOR
- G01M17/00—Testing of vehicles
- G01M17/08—Railway vehicles
-
- G—PHYSICS
- G01—MEASURING; TESTING
- G01M—TESTING STATIC OR DYNAMIC BALANCE OF MACHINES OR STRUCTURES; TESTING OF STRUCTURES OR APPARATUS, NOT OTHERWISE PROVIDED FOR
- G01M99/00—Subject matter not provided for in other groups of this subclass
Definitions
- the present invention relates to an information processing device, an information processing method, and a program.
- the present application claims priority based on Japanese Patent Application No. 2019-2055 filed in Japan on January 9, 2019, the entire contents of which are incorporated herein.
- Patent Document 1 discloses a technique of identifying a frequency characteristic of a signal with an autoregressive model to obtain a more accurate spectrum characteristic.
- Patent Literature 2 discloses the following technique. First, an autocorrelation matrix is generated from measurement data measured from a periodic motion of an object. Among the eigenvalues obtained by singular value decomposition of the autocorrelation matrix, the number set from the largest one is used to determine the coefficient of the modified autoregressive model that approximates the measurement data. The frequency characteristic of the corrected autoregressive model is obtained from the determined coefficient. A bearing abnormality is diagnosed based on the obtained frequency characteristic.
- An information processing apparatus includes an acquisition unit that acquires measurement data related to the periodic motion of an object that performs a periodic motion, and a self-corrected self based on the measurement data acquired by the acquisition unit.
- a determining means for determining a predetermined number of correction coefficients, which are coefficients in the regression model, and a data matrix in which non-negative data indicating the respective patterns of the correction coefficients of the number determined by the determining means is stored.
- a decomposing means To a teacher basis matrix, a teacher weight matrix, an extraction basis matrix, and an extraction weight matrix, a decomposing means, the teacher weight matrix obtained by decomposing the data matrix by the decomposing means, and the extraction weight matrix.
- a diagnostic means for diagnosing whether or not the object is in the predetermined state, based on, and the corrected autoregressive model, the actual value of the measurement data, and the actual result.
- the first matrix derived from the diagonal matrix having the eigenvalues of the correlation matrix as the diagonal components and the orthogonal matrix having the eigenvectors of the autocorrelation matrix as the column components is the coefficient matrix and is derived from the measurement data.
- the correction coefficient is determined using an equation in which the autocorrelation vector is a constant vector, and the autocorrelation vector has a time difference from 1 to m, which is the number of the actual values used in the corrected autoregressive model.
- the autocorrelation matrix is a vector whose component is the autocorrelation of the measurement data
- the autocorrelation matrix is a matrix whose component is the autocorrelation of the measurement data with a time difference of 0 to m ⁇ 1
- the first matrix is A second matrix ⁇ s derived from the s eigenvalues of the autocorrelation matrix and the diagonal matrix and s eigenvalues for s, which is a set number of 1 or more and less than m.
- the teacher basis matrix is a non-negative matrix that stores teacher bases
- the teacher weight matrix is a non-negative matrix that indicates weights of the teacher bases
- the extraction basis matrix is a non-negative matrix that stores extraction bases.
- the extraction weight matrix is a non-negative matrix indicating the weight of the extraction basis
- the teacher basis is a set of basis vectors indicating a pattern of the correction coefficient corresponding to a predetermined state of the object.
- the extraction basis is a set of basis vectors indicating a pattern of the correction coefficient other than the pattern of the correction coefficient corresponding to a predetermined state of the object, and the decomposing unit is the teacher basis matrix.
- the teacher weight matrix and the data matrix By updating the values of the extraction basis matrix and the extraction weight matrix, the data matrix is decomposed into the teacher basis matrix, the teacher weight matrix, the extraction basis matrix, and the extraction weight matrix.
- An information processing method is an information processing method executed by an information processing apparatus, the acquisition step of acquiring measurement data related to the periodic motion of an object that performs a periodic motion, and the acquisition step. Based on the measured data obtained, a correction coefficient, which is a coefficient in the corrected autoregressive model, is determined by a predetermined number, and each of the correction coefficients of the number determined in the determination step.
- the autoregressive model is an expression that represents a predicted value of the measurement data using the actual value of the measurement data and the correction coefficient for the actual value, and is derived from the measurement data in the determining step.
- the correction coefficient is determined using an equation in which a matrix of 1 is a coefficient matrix and an autocorrelation vector derived from the measurement data is a constant vector, and the autocorrelation vector has a time difference of 1 to the corrected autocorrelation vector.
- the autocorrelation matrix is a vector whose components are the autocorrelation of the measurement data up to m which is the number of the actual values used in the regression model, and the autocorrelation matrix is the autocorrelation of the measurement data with a time difference of 0 to m-1.
- the first matrix is derived from the s eigenvalues of the autocorrelation matrix and the diagonal matrix with respect to s, which is a set number of 1 or more and less than m.
- a second matrix ⁇ s a third matrix U s derived from the s eigenvalues and the orthogonal matrix, and a matrix U s ⁇ s U s T derived from the second matrix
- the matrix is a sub-matrix of the diagonal matrix, the matrix having the s eigenvalues as diagonal elements, and the third matrix is a sub-matrix of the orthogonal matrix
- the teacher basis matrix is a non-negative matrix storing a teacher basis
- the teacher weight matrix is a weight of the teacher basis.
- the extraction basis matrix is a non-negative matrix storing the extraction basis
- the extraction weight matrix is a non-negative matrix showing the weight of the extraction basis.
- the basis is a set of basis vectors indicating the pattern of the correction coefficient corresponding to the predetermined state of the object, and the extraction basis is other than the pattern of the correction coefficient corresponding to the predetermined state of the object.
- a program of the present invention is an autoregressive model corrected based on an acquisition step of acquiring measurement data related to the periodic motion of an object that performs periodic motion, and the measurement data acquired in the acquisition step.
- the correction coefficient is determined by using an equation in which an autocorrelation vector derived from the measurement data is a constant vector, and the autocorrelation vector has a time difference of 1 from the actual value used in the corrected autoregressive model.
- the first matrix is a second matrix ⁇ s derived from the s eigenvalues of the autocorrelation matrix and the diagonal matrix with respect to s, which is a set number of 1 or more and less than m.
- the teacher basis matrix is a non-negative matrix that stores the teacher basis
- the teacher weight matrix is a non-negative matrix indicating the weight of the teacher basis.
- the extraction basis matrix is a non-negative matrix storing the extraction basis
- the extraction weight matrix is a non-negative matrix showing the weight of the extraction basis
- the teacher base is the It is a set of basis vectors indicating a pattern of the correction coefficient corresponding to a predetermined state of the object
- the extraction basis is the correction coefficient other than the pattern of the correction coefficient corresponding to the predetermined state of the object
- the decomposition step the sum of the product of the teacher basis matrix and the teacher weight matrix, the product of the extracted basis matrix and the extracted weight matrix, and the data matrix.
- the values of the teacher weight matrix, the extraction basis matrix, and the extraction weight matrix are updated so as to optimize the value of the cost function with respect to the difference between the data matrix and the teacher basis matrix. It is decomposed into a weight matrix, the extracted basis matrix, and the extracted weight matrix.
- FIG. 1A is a diagram showing a situation of the experiment.
- FIG. 1B is a diagram showing a bearing attached to a gear box.
- FIG. 2 is a diagram illustrating an example of details of the bearing.
- FIG. 3A is a diagram showing an example of the distribution of eigenvalues.
- FIG. 3B is a diagram showing an example of the distribution of eigenvalues.
- FIG. 3C is a diagram showing an example of the distribution of eigenvalues.
- FIG. 3D is a diagram showing an example of the distribution of eigenvalues.
- FIG. 3E is a diagram showing an example of the distribution of eigenvalues.
- FIG. 4A is a diagram showing an example of a waveform of measurement data.
- FIG. 4A is a diagram showing an example of a waveform of measurement data.
- FIG. 4B is a diagram showing an example of a waveform of measurement data.
- FIG. 4C is a diagram showing an example of a waveform of measurement data.
- FIG. 4D is a diagram showing an example of a waveform of measurement data.
- FIG. 4E is a diagram showing an example of a waveform of measurement data.
- FIG. 5A is a diagram showing an example of a waveform of a corrected autoregressive model.
- FIG. 5B is a diagram showing an example of the waveform of the corrected autoregressive model.
- FIG. 5C is a diagram showing an example of the waveform of the corrected autoregressive model.
- FIG. 5D is a diagram showing an example of the waveform of the corrected autoregressive model.
- FIG. 5A is a diagram showing an example of a waveform of a corrected autoregressive model.
- FIG. 5B is a diagram showing an example of the waveform of the corrected autoregressive model.
- FIG. 5C is
- FIG. 5E is a diagram showing an example of the waveform of the corrected autoregressive model.
- FIG. 6A is a diagram showing an example of frequency characteristics of a corrected autoregressive model.
- FIG. 6B is a diagram showing an example of frequency characteristics of the corrected autoregressive model.
- FIG. 6C is a diagram showing an example of frequency characteristics of the corrected autoregressive model.
- FIG. 6D is a diagram showing an example of frequency characteristics of the corrected autoregressive model.
- FIG. 6E is a diagram showing an example of frequency characteristics of the corrected autoregressive model.
- FIG. 7A is a diagram showing an example of a waveform of a corrected autoregressive model.
- FIG. 7B is a diagram showing an example of the waveform of the corrected autoregressive model.
- FIG. 7A is a diagram showing an example of a waveform of a corrected autoregressive model.
- FIG. 7B is a diagram showing an example of the waveform of the corrected autore
- FIG. 7C is a diagram showing an example of the waveform of the corrected autoregressive model.
- FIG. 7D is a diagram showing an example of the waveform of the corrected autoregressive model.
- FIG. 7E is a diagram showing an example of the waveform of the corrected autoregressive model.
- FIG. 8A is a diagram showing an example of frequency characteristics of the corrected autoregressive model.
- FIG. 8B is a diagram showing an example of frequency characteristics of the corrected autoregressive model.
- FIG. 8C is a diagram showing an example of frequency characteristics of the corrected autoregressive model.
- FIG. 8D is a diagram showing an example of frequency characteristics of the corrected autoregressive model.
- FIG. 8E is a diagram showing an example of frequency characteristics of the corrected autoregressive model.
- FIG. 8A is a diagram showing an example of frequency characteristics of the corrected autoregressive model.
- FIG. 8B is a diagram showing an example of frequency characteristics of the corrected autoregressive model.
- FIG. 9 is a diagram showing an example of a coefficient pattern.
- FIG. 10 is a diagram illustrating an example of a pattern of coefficients specified by learning.
- FIG. 11 is a diagram illustrating an example of the weight of each pattern.
- FIG. 12 is a diagram showing an example of the teacher base.
- FIG. 13A is a diagram illustrating an example of a bearing to be tested.
- FIG. 13B is a diagram illustrating an example of a bearing as an experiment target.
- FIG. 13C is a diagram illustrating an example of a bearing as an experiment target.
- FIG. 14A is a diagram illustrating an example of the result of decomposing the data matrix.
- FIG. 14B is a diagram illustrating an example of the decomposition result of the data matrix.
- FIG. 14A is a diagram illustrating an example of the result of decomposing the data matrix.
- FIG. 15A is a diagram illustrating an example of the result of decomposing the data matrix.
- FIG. 15B is a diagram illustrating an example of the decomposition result of the data matrix.
- FIG. 16A is a diagram illustrating an example of the result of decomposing the data matrix.
- FIG. 16B is a diagram illustrating an example of the decomposition result of the data matrix.
- FIG. 17A is a diagram illustrating an example of the result of decomposing the data matrix.
- FIG. 17B is a diagram illustrating an example of the decomposition result of the data matrix.
- FIG. 18 is a diagram showing an example of the system configuration and the like of the diagnostic system.
- FIG. 19 is a diagram illustrating an example of the hardware configuration of the information processing device.
- FIG. 19 is a diagram illustrating an example of the hardware configuration of the information processing device.
- FIG. 20 is a flowchart showing an example of the learning process.
- FIG. 21 is a flowchart showing an example of the diagnosis process.
- FIG. 22A is a diagram showing an example of weights of a teacher basis and an extraction basis.
- FIG. 22B is a diagram showing an example of weights of the teacher basis and the extraction basis.
- FIG. 22C is a diagram showing an example of weights of the teacher basis and the extraction basis.
- FIG. 22D is a diagram showing an example of weights of the teacher basis and the extraction basis.
- FIG. 22E is a diagram showing an example of weights of the teacher basis and the extraction basis.
- FIG. 23A is a diagram showing an example of weights of a teacher basis and an extraction basis.
- FIG. 23B is a diagram showing an example of weights of the teacher basis and the extraction basis.
- FIG. 23C is a diagram showing an example of the weights of the teacher basis and the extraction basis.
- FIG. 23D is a diagram showing an example of weights of the teacher basis and the extraction basis.
- FIG. 23E is a diagram showing an example of weights of the teacher basis and the extraction basis.
- FIG. 24A is a diagram showing an example of weights of a teacher basis and an extraction basis.
- FIG. 24B is a diagram showing an example of the weights of the teacher basis and the extraction basis.
- FIG. 24C is a diagram showing an example of weights of the teacher basis and the extraction basis.
- FIG. 24D is a diagram showing an example of weights of the teacher basis and the extraction basis.
- FIG. 24A is a diagram showing an example of weights of a teacher basis and an extraction basis.
- FIG. 24B is a diagram showing an example of the weights of the teacher basis and the extraction basis.
- FIG. 25A is a diagram showing an example of weights of a teacher basis and an extraction basis.
- FIG. 25B is a diagram showing an example of the weights of the teacher basis and the extraction basis.
- FIG. 25C is a diagram showing an example of the weights of the teacher basis and the extraction basis.
- FIG. 25D is a diagram showing an example of weights of the teacher basis and the extraction basis.
- FIG. 26A is a diagram showing an example of weights of a teacher basis and an extraction basis.
- FIG. 26B is a diagram showing an example of weights of the teacher basis and the extraction basis.
- FIG. 26C is a diagram showing an example of the weights of the teacher basis and the extraction basis.
- FIG. 26D is a diagram showing an example of weights of the teacher basis and the extraction basis.
- FIG. 26A is a diagram showing an example of weights of a teacher basis and an extraction basis.
- FIG. 26B is a diagram showing an example of weights of the teacher basis and the extraction basis.
- FIG. 27A is a diagram showing an example of weights of a teacher basis and an extraction basis.
- FIG. 27B is a diagram showing an example of weights of the teacher base and the extraction base.
- FIG. 27C is a diagram showing an example of the weights of the teacher basis and the extraction basis.
- FIG. 27D is a diagram showing an example of weights of the teacher basis and the extraction basis.
- the diagnosis system diagnoses the state of the bearing based on the vibration signal measured from the bearing used for the railway bogie.
- the diagnostic system measures a signal corresponding to the vibration of the bearing.
- the diagnostic system represents the measured signal by an autoregressive model, decomposes a matrix in a conditional expression regarding the coefficient of the autoregressive model into singular values, and obtains an eigenvalue of the matrix.
- the diagnostic system determines the coefficient of the autoregressive model using only the number set from the maximum of the obtained eigenvalues. Then, the diagnostic system diagnoses the state of the bearing based on the determined coefficient pattern.
- FIG. 1A is a diagram for explaining the situation of this experiment.
- the situation of FIG. 1A is a situation in which the drive mechanism for the wheels of the railway truck is installed in the laboratory.
- the drive motor 101 rotates the small gear 105 via the drive motor shaft 102, the gear joint 103, and the small gear shaft 100.
- the small gear 105 rotates to rotate the large gear 107.
- the axle 109 rotates, and the wheels connected to the axle 109 also rotate.
- a dynamo 110 is connected to the axle 109 instead of the wheels.
- the dynamo 110 is a generator connected to give a pseudo running load. In this experiment, the load for rotating the dynamo 110 is assumed as the load during traveling.
- FIG. 1B is a diagram showing a state in which the bearings 106 and 108 attached to the gear box 104 are viewed from the side.
- the vibration measurement position 111 on the gear box 104 is the position where the vibration measurement device is installed.
- the vibration measuring device includes a sensor such as an acceleration sensor and a laser displacement meter, detects the vibration of the object through the sensor, and outputs a signal according to the detected vibration.
- the vibration measuring device installed at the vibration measuring position 111 measures the vibration transmitted to the vibration measuring position 111.
- the vibration measuring device outputs a signal indicating the measured vibration to an external information processing device or the like via wired or wireless communication.
- the measurement frequency of the vibration measuring device is 204800 Hz. However, as another example, the measurement frequency of the vibration measuring device may be another frequency such as 409600 Hz or 102400 Hz. In this experiment, the vibration measurement device is installed at the vibration measurement position 111, but it may be installed at any position as long as it is a position where the vibration caused by the bearing 106 is transmitted.
- FIG. 2 is a diagram illustrating an example of the configuration of the bearing 106.
- the bearing 106 is composed of four parts: an outer ring, an inner ring, a rolling element, and a cage.
- FIG. 2 shows an outline of the outer ring, the inner ring, the rolling elements, and the cage of the bearing 106.
- the bearing 106 has a configuration in which the rolling element held by the cage is sandwiched between the outer ring and the inner ring.
- the drive motor 101 is driven for each bearing 106, and the vibration measurement device installed at the vibration measurement position 111 measures the vibration to obtain measurement data for performing a state diagnosis of the bearing 106.
- the drive motor 101 was driven so that the rotation speed of the inner ring of the bearing 106 was 2954.7 rpm (round per minute).
- measurement data y the measurement data measured by the vibration measuring device
- the measured data y was approximated by a modified autoregressive model, and the feature amount was calculated from the coefficient of this modified autoregressive model.
- the value of the measurement data y at a certain time k is y k .
- M is a number indicating up to what time the measurement data y includes data, and is set in advance. For example, M may be determined in advance by trial and error so that the autocorrelation (R jl defined by Equation 5) described later has sufficient reliability as a statistic.
- An autoregressive model that approximates y k is, for example, as in the following Expression 1.
- the autoregressive model is a prediction value y ⁇ k ( ⁇ in the expression is attached above y) of data at a certain time k (m+1 ⁇ k ⁇ M) in time series data, This is an expression expressed using the actual value y kl of the data at time k-1 (1 ⁇ l ⁇ m) before that time in the time series data.
- ⁇ in Expression 1 is a coefficient of the autoregressive model.
- m is an integer less than M that indicates how many past data before the time y k , which is the value of the measurement data y at the time k in the autoregressive model, are approximated.
- m is 1500.
- Equation 4 Equation 4 below.
- R jl in Expression 4 is called autocorrelation of the measurement data y, and is a value defined by Expression 5 below.
- at this time is called the time difference.
- Equation 6 is a relational expression regarding the coefficient of the following autoregressive model.
- Equation 6 is an equation derived from the condition that minimizes the error between the predicted value of the measurement data by the autoregressive model and the measured data at the time corresponding to the predicted value. Equation 6 is called the Yule-Walker equation.
- Equation 6 is a linear equation in which a vector consisting of the coefficients of the autoregressive model is a variable vector.
- the constant vector on the left side of Expression 6 is a vector whose component is the autocorrelation of measurement data with a time difference of 1 to m. In the following, the constant vector on the left side of Equation 6 is the autocorrelation vector.
- the coefficient matrix on the right side of Expression 6 is a matrix whose component is the autocorrelation of the measurement data with a time difference of 0 to m-1. In the following, the coefficient matrix on the right side of Equation 6 is the autocorrelation matrix.
- the autocorrelation matrix (m ⁇ m matrix configured by R jl ) on the right side in Expression 6 is expressed as an autocorrelation matrix R as in Expression 7 below.
- the method of solving the equation 6 for the coefficient ⁇ is used.
- the predicted value y ⁇ k of the measurement data at a time k derived by autoregressive model the coefficient ⁇ is derived as close as possible to the actual value y k of the measurement data at that time k. Therefore, the frequency characteristic of the autoregressive model includes many frequency components included in the actual value y k of the measurement data at each time. Therefore, for example, when the measurement data y contains a lot of noise, it is impossible to extract a signal related to the vibration of the bearing 106, or it is not possible to extract a characteristic according to the failure mode of the bearing 106. The problem arises.
- the inventors of the present invention have paid attention to the autocorrelation matrix R by which the coefficient ⁇ of the autoregressive model is multiplied, and as a result of diligent examination, as a result, some of the eigenvalues of the autocorrelation matrix R are included in the measurement data y
- the idea is to rewrite the autocorrelation matrix R so that the influence of noise is reduced and the signal component related to bearing vibration is emphasized (the SN ratio is increased).
- the matrix ⁇ of Expression 8 is a diagonal matrix whose diagonal components are the eigenvalues of the autocorrelation matrix R, as shown in Expression 9.
- the diagonal components of the diagonal matrix ⁇ are ⁇ 11 , ⁇ 22 ,..., ⁇ mm .
- the matrix U is an orthogonal matrix in which each column component vector is an eigenvector of the autocorrelation matrix R.
- the column component vectors of the orthogonal matrix U are u 1 , u 2 ,..., U m .
- the eigenvalue of the autocorrelation matrix R with respect to the eigenvector u j is ⁇ jj .
- the eigenvalue of the autocorrelation matrix R is a variable that is reflected in the intensity of each frequency component included in the time waveform of the predicted value of the measurement data by the autoregressive model.
- the values of ⁇ 11 , ⁇ 22 ,..., ⁇ mm which are the diagonal components of the diagonal matrix ⁇ obtained as a result of the singular value decomposition of the autocorrelation matrix R, are in descending order in order to simplify the notation of the mathematical formula. ..
- the matrix R′ is calculated by using s eigenvalues of the number of used eigenvalues, which is a set number of 1 or more and less than m from the maximum, as in the following Expression 10. Define.
- the matrix R′ is a matrix obtained by approximating the autocorrelation matrix R using s eigenvalues of the number of used eigenvalues among the eigenvalues of the autocorrelation matrix R.
- the matrix U s in Expression 10 is an m ⁇ s matrix configured by s column component vectors (eigenvectors corresponding to the used eigenvalues) from the left of the orthogonal matrix U in Expression 8. That is, the matrix U s is a partial matrix configured by cutting out the left m ⁇ s component from the orthogonal matrix U.
- U s T is a transposed matrix of U s , and is an s ⁇ m matrix composed of s row component vectors from the top of the matrix U T of Expression 8.
- the matrix ⁇ s in Expression 10 is an s ⁇ s matrix configured by s columns from the left and s rows from the top of the diagonal matrix ⁇ in Expression 8. That is, the matrix ⁇ s is a partial matrix configured by cutting out the upper left s ⁇ s component from the diagonal matrix ⁇ .
- Expression 13 for obtaining the coefficient ⁇ is obtained.
- a model for calculating the prediction value y ⁇ k by the equation 1 using the coefficient ⁇ obtained by the equation 13 is referred to as a “corrected autoregressive model”.
- ⁇ 11 , ⁇ 22 ,..., ⁇ mm which are the diagonal components of the diagonal matrix ⁇
- the diagonal components of the diagonal matrix ⁇ are in descending order. It doesn't have to be.
- the matrix U s does not cut out the left m ⁇ s elements from the orthogonal matrix U, but rather the column element vector (eigenvector) corresponding to the eigenvalues used. It is a submatrix formed by cutting out.
- the matrix ⁇ s does not cut out the upper left s ⁇ s element from the diagonal matrix ⁇ , but uses the eigenvalues to be used as the diagonal elements. Is a submatrix cut out into.
- Equation 13 is the equation used to determine the coefficients of the modified autoregressive model.
- the matrix U s of Expressions 12 and 13 is a submatrix of an orthogonal matrix obtained by singular value decomposition of the autocorrelation matrix R, and is a matrix whose column component vector is an eigenvector corresponding to the eigenvalue used. It is a matrix.
- the matrix ⁇ s of Expressions 12 and 13 is a sub-matrix of the diagonal matrix obtained by singular value decomposition of the autocorrelation matrix R, and is a second matrix that is a matrix having the eigenvalues used as diagonal components. Is.
- the matrix U s ⁇ s U s T of Expressions 12 and 13 is the first matrix that is a matrix derived from the matrix ⁇ s and the matrix U s .
- the coefficient ⁇ of the corrected autoregressive model is obtained.
- An example of the method of deriving the coefficient of the modified autoregressive model has been described above, but the method of deriving the coefficient of the autoregressive model, which is the basis of the method, is the least squares method for the predicted value so that it can be intuitively understood. The method using is explained. However, in general, there is known a method of defining an autoregressive model using the concept of stochastic process and deriving its coefficient. In that case, the autocorrelation is represented by the autocorrelation of the stochastic process (population). The autocorrelation of this stochastic process is expressed as a function of the time difference.
- the autocorrelation of the measurement data in the present embodiment may be replaced with a value calculated by another calculation formula as long as it approximates the autocorrelation of the stochastic process.
- R 22 to R mm are autocorrelations with a time difference of 0, but they may be replaced with R 11 .
- the autocorrelation matrix R is obtained using Equation 5 and Equation 7 for each of the obtained measurement data, and the singular value decomposition represented by Equation 8 is performed to determine the self
- the eigenvalues of the correlation matrix R were obtained, and the distribution of the eigenvalues of the autocorrelation matrix R was obtained.
- the bearing 106 is normal, the inner ring of the bearing 106 is flawed, the cage of the bearing 106 is flawed, and the rolling element of the bearing 106 is flawed. This is when there is a flaw.
- the modified autoregressive model inputs the prediction error x k that is white noise as input, It can be regarded as a linear time-invariant system that outputs the actual measurement value y k of. Therefore, the frequency characteristic calculation formula can be derived by the following procedure.
- the prediction error x k is represented by the following Expression 14.
- the frequency characteristics of the system appear as changes in the amplitude and phase of the output with respect to the sine wave input, and are obtained by the Fourier transform of the impulse response.
- the transfer function H(z) when z rotates on the unit circle of the complex plane becomes the frequency characteristic.
- j is an imaginary unit
- ⁇ is an angular frequency
- T is a sampling interval
- the amplitude characteristic of H(z) (frequency characteristic of the system) can be expressed as the following Expression 18. It is assumed that ⁇ T in Expression 18 changes in the range of 0 to 2 ⁇ .
- the autocorrelation matrix R is obtained by using Equation 5 and Equation 7 for each obtained measurement data, and the eigenvalues of the autocorrelation matrix R are obtained by performing singular value decomposition represented by Equation 8.
- the distribution of the eigenvalues of the correlation matrix R was obtained.
- the waveform of the measurement data was obtained for each of the obtained measurement data.
- the matrix ⁇ s and the matrix U s are obtained by using Equation 11 from the singular value decomposition of the autocorrelation matrix R obtained by the above procedure, and corrected by using Equation 5 and Equation 13.
- the coefficient ⁇ of the obtained autoregressive model was obtained, and the waveform of the corrected autoregressive model specified by the obtained coefficient ⁇ was obtained.
- the frequency characteristic of the corrected autoregressive model and the like were obtained using Expression 18.
- FIG. 3A to 3E are diagrams showing the distribution of the eigenvalues of the autocorrelation matrix R obtained by the above procedure for each measurement data.
- the graph of FIG. 3A is a graph showing the distribution of the eigenvalues of the autocorrelation matrix R when using the measurement data measured when a normal bearing having no flaws is used as the bearing 106.
- the graph of FIG. 3B is a graph showing the distribution of the eigenvalues of the autocorrelation matrix R when the measurement data measured when a bearing having a flaw in the inner ring is used as the bearing 106.
- 3C is a graph showing the distribution of the eigenvalues of the autocorrelation matrix R when the measurement data measured when a bearing having a cage is used as the bearing 106 is used.
- the graph of FIG. 3D is a graph showing the distribution of the eigenvalues of the autocorrelation matrix R when the measurement data measured when a bearing having a rolling element is used as the bearing 106 is used.
- the graph of FIG. 3E is a graph showing the distribution of the eigenvalues of the autocorrelation matrix R when the measurement data measured when a bearing having a flaw on the outer ring is used as the bearing 106.
- the graphs of FIGS. 3A to 3E are graphs in which the eigenvalues ⁇ 11 to ⁇ mm obtained by singular value decomposition of the autocorrelation matrix R are rearranged in ascending order and plotted, and the horizontal axis represents the eigenvalue index and the vertical axis represents Indicates the value of eigenvalue.
- FIG. 3A it can be seen that there are five eigenvalues that have significantly higher values than the others. It can be seen that, among the five eigenvalues, two eigenvalues are particularly higher than the other three. In either case, it can be seen that the number of eigenvalues of the eigenvalues of the autocorrelation matrix R that is significantly higher than the others is significantly smaller than the number of all eigenvalues.
- FIG. 4A to 4E are diagrams showing waveforms of respective measurement data.
- the graph of FIG. 4A is a graph showing a waveform of measurement data measured when a normal bearing having no flaws is used as the bearing 106.
- the horizontal axis represents the time and the vertical axis represents the actual value of the measurement data at the corresponding time.
- the graph of FIG. 4B is a graph showing a waveform of measurement data measured when a bearing having a flaw in the inner ring is used as the bearing 106.
- FIG. 4A is a graph showing a waveform of measurement data measured when a bearing having a flaw in the inner ring is used as the bearing 106.
- the graph of FIG. 4C is a graph showing the waveform of measurement data measured when a bearing having a flaw is used as the bearing 106.
- the horizontal axis represents the time and the vertical axis represents the actual value of the measurement data at the corresponding time.
- the graph of FIG. 4D is a graph showing a waveform of measurement data measured when a bearing having a flaw in a rolling element is used as the bearing 106.
- the horizontal axis represents the time and the vertical axis represents the actual value of the measurement data at the corresponding time.
- 4E is a graph showing a waveform of measurement data measured when a bearing having a flaw on the outer ring is used as the bearing 106.
- the horizontal axis represents the time and the vertical axis represents the actual value of the measurement data at the corresponding time.
- FIGS. 4A and 4C have similar waveforms. It can also be seen that, for example, FIGS. 4D and 4E have similar waveforms. Therefore, it is difficult to diagnose the abnormal state of the bearing 106 from the graphs of FIGS. 4A to 4E.
- FIGS. 5A to 5E are diagrams showing waveforms of measurement data approximated by the modified autoregressive model specified by the coefficient ⁇ obtained by setting the number of used eigenvalues to 1.
- the graph of FIG. 5A is a modified autoregressive model that is specified by the coefficient ⁇ obtained from the measurement data measured when a normal bearing having no flaws is used as the bearing 106, with the number of used eigenvalues being 1. It is a graph which shows the waveform of approximated measurement data.
- the horizontal axis represents time and the vertical axis represents the predicted value of the measured data at the corresponding time.
- the graph of FIG. 5B is a corrected autoregressive model specified by the coefficient ⁇ obtained from the measurement data measured when the bearing 106 has a flaw in the inner ring, where the number of used eigenvalues is 1. It is a graph which shows the waveform of approximated measurement data. In the graph of FIG.
- the horizontal axis represents time and the vertical axis represents the predicted value of the measured data at the corresponding time.
- the corrected autoregressive model specified by the coefficient ⁇ obtained from the measurement data measured when the bearing 106 has a flaw in the retainer is used, with the number of used eigenvalues being 1 It is a graph which shows the waveform of the measurement data approximated by.
- the horizontal axis represents time and the vertical axis represents the predicted value of the measured data at the corresponding time.
- the corrected autoregressive model specified by the coefficient ⁇ obtained from the measurement data measured when the bearing 106 is a bearing having a flaw in the rolling element, with the number of eigenvalues used is 1. It is a graph which shows the waveform of the measurement data approximated by. In the graph of FIG. 5D, the horizontal axis represents the time and the vertical axis represents the predicted value of the measurement data at the corresponding time.
- the graph of FIG. 5E is a corrected autoregressive model specified by the coefficient ⁇ obtained from the measurement data measured when the bearing 106 is a bearing having a flaw on the outer ring, where the number of eigenvalues used is 1. It is a graph which shows the waveform of approximated measurement data. In the graph of FIG.
- the horizontal axis represents the time and the vertical axis represents the predicted value of the measurement data at the corresponding time. It can be seen that the noise components in the graphs of FIGS. 5A to 5E are reduced as compared with the graphs of FIGS. 4A to 4E.
- FIGS. 6A to 6E are diagrams showing the frequency characteristics of the modified autoregressive model specified by the coefficient ⁇ obtained with the number of used eigenvalues s being 1.
- the graphs of FIGS. 6A to 6E are graphs showing the frequency characteristics of the waveforms of FIGS. 5A to 5E.
- the graph of FIG. 6A shows the corrected autoregressive model specified by the coefficient ⁇ obtained from the measurement data measured when the bearing 106 is a normal bearing with no flaws, where the number of used eigenvalues is 1.
- 19 is a graph showing the frequency characteristic obtained by Expression 18.
- the horizontal axis represents frequency and the vertical axis represents signal strength.
- the graph of FIG. 6B shows the corrected autoregressive model specified by the coefficient ⁇ obtained from the measurement data measured when the bearing 106 is a bearing having a flaw in the inner ring, where the number of used eigenvalues is 1.
- 19 is a graph showing the frequency characteristic obtained by Expression 18.
- the horizontal axis represents frequency and the vertical axis represents signal strength.
- the corrected autoregressive model specified by the coefficient ⁇ obtained from the measurement data measured when the bearing 106 has a flaw in the retainer is used with the number of eigenvalues used as 1 19 is a graph showing the frequency characteristics obtained by Equation 18 regarding In the graph of FIG. 6C, the horizontal axis represents frequency and the vertical axis represents signal strength.
- the graph of FIG. 6D shows a corrected autoregressive model specified by the coefficient ⁇ obtained from the measurement data measured when the bearing 106 has a rolling element having a flaw with the number of used eigenvalues set to 1.
- 19 is a graph showing the frequency characteristics obtained by Equation 18 regarding In the graph of FIG.
- the horizontal axis represents frequency and the vertical axis represents signal strength.
- the graph of FIG. 6E shows the corrected autoregressive model specified by the coefficient ⁇ obtained from the measurement data measured when the bearing 106 is a bearing having a flaw on the outer ring, where the number of used eigenvalues is 1. 19 is a graph showing the frequency characteristic obtained by Expression 18. It In the graph of FIG. 6E, the horizontal axis represents frequency and the vertical axis represents signal strength.
- a peak stands at the frequency of 824 Hz. Further, from the graph of FIG. 6B, it can be seen that a peak stands at the frequency of 1649 Hz. Also, from the graph of FIG. 6C, it can be seen that a peak stands at the frequency of 1646 Hz.
- the peaked frequencies in the graphs of FIGS. 6A to 6E it can be seen that when the bearing 106 has no flaw, the peak appears at a lower frequency than when the bearing 106 has a flaw. That is, it is understood that the presence or absence of a flaw in the bearing 106 can be determined from the frequency characteristic of the corrected autoregressive model specified by the obtained coefficient ⁇ with the number of used eigenvalues set to 1. Further, it can be seen that the frequency in FIG. 6E is higher than that in FIG. 6D. Further, it can be seen that the peaked frequencies in the graphs of FIGS. 6D to 6E are significantly higher than the peaked frequencies in the graphs of FIGS. 6A to 6C.
- the value of the number of used eigenvalues s is further increased to 5, and the coefficient ⁇ is obtained by using five of the largest eigenvalues of the autocorrelation matrix R, and is specified by the obtained coefficient ⁇ .
- the waveform and frequency characteristics of the modified autoregressive model were calculated.
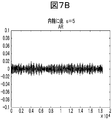
- 7A to 7E are diagrams showing the waveforms of the modified autoregressive model specified by the coefficient ⁇ obtained with the number of used eigenvalues s being 5.
- the graph of FIG. 7A is a modified autoregressive model specified by the coefficient ⁇ obtained from the measurement data measured when a normal bearing having no flaws is used as the bearing 106, with the number of used eigenvalues being 5. It is a graph which shows the waveform of approximated measurement data.
- the horizontal axis represents the time and the vertical axis represents the predicted value of the measurement data at the corresponding time.
- the graph of FIG. 7B is a modified autoregressive model specified by the coefficient ⁇ obtained from the measurement data measured when the bearing 106 is a bearing having a flaw in the inner ring, with the number of used eigenvalues s being 5. It is a graph which shows the waveform of approximated measurement data.
- the horizontal axis represents time and the vertical axis represents the predicted value of the measurement data at the corresponding time.
- the corrected autoregressive model specified by the coefficient ⁇ obtained from the measurement data measured when the bearing 106 is a bearing having a flaw is used, with the number s of eigenvalues used is 5. It is a graph which shows the waveform of the measurement data approximated by.
- the horizontal axis represents the time and the vertical axis represents the predicted value of the measurement data at the corresponding time.
- the corrected autoregressive model specified by the coefficient ⁇ obtained from the measurement data measured when the bearing 106 having a rolling element has a flaw is used, with the number of eigenvalues used is 5. It is a graph which shows the waveform of the measurement data approximated by. In the graph of FIG. 7D, the horizontal axis represents time and the vertical axis represents the predicted value of the measured data at the corresponding time.
- the graph of FIG. 7E is a modified autoregressive model specified by the coefficient ⁇ obtained from the measurement data measured when the bearing 106 is a bearing having a flaw on the outer ring, where the number of eigenvalues used is 5. It is a graph which shows the waveform of approximated measurement data. In the graph of FIG. 7E, the horizontal axis represents time and the vertical axis represents the predicted value of the measured data at the corresponding time.
- FIGS. 8A to 8E are diagrams showing frequency characteristics of the modified autoregressive model specified by the coefficient ⁇ obtained with the number of used eigenvalues s being 5.
- the graphs of FIGS. 8A to 8E are graphs showing the frequency characteristics of the waveforms of FIGS. 7A to 7E.
- the graph of FIG. 8A shows the corrected autoregressive model specified by the coefficient ⁇ obtained from the measurement data measured when the bearing 106 is a normal bearing with no flaws, with the number of used eigenvalues s being 5.
- 19 is a graph showing the frequency characteristic obtained by Expression 18.
- the horizontal axis represents frequency and the vertical axis represents signal strength.
- the graph of FIG. 8B shows the corrected autoregressive model specified by the coefficient ⁇ obtained from the measurement data measured when the bearing 106 has a flaw in the inner ring with the number of used eigenvalues s being 5.
- 19 is a graph showing the frequency characteristic obtained by Expression 18.
- the horizontal axis represents frequency and the vertical axis represents signal strength.
- the corrected autoregressive model specified by the coefficient ⁇ obtained from the measurement data measured when the bearing 106 is a bearing having a flaw is used with the number of eigenvalues used is 5.
- 19 is a graph showing the frequency characteristics obtained by Equation 18 regarding In the graph of FIG. 8C, the horizontal axis represents frequency and the vertical axis represents signal strength.
- the corrected autoregressive model specified by the coefficient ⁇ obtained from the measurement data measured when the bearing 106 has a rolling element flaw is used with the number of eigenvalues s used as 5.
- 19 is a graph showing the frequency characteristics obtained by Equation 18 regarding In the graph of FIG.
- the horizontal axis represents frequency and the vertical axis represents signal strength.
- the graph in FIG. 8E shows the corrected autoregressive model specified by the coefficient ⁇ obtained from the measurement data measured when the bearing 106 is a bearing having a flaw on the outer ring, where the number of used eigenvalues is 5. 19 is a graph showing the frequency characteristic obtained by Expression 18. In the graph of FIG. 8E, the horizontal axis represents frequency and the vertical axis represents signal strength.
- peaks are erected at the frequencies 821 Hz and 1047 Hz. Further, from the graph of FIG. 8B, it can be seen that peaks stand at portions of frequencies 1648 Hz, 2021 Hz, and 6474 Hz. Moreover, it can be seen from the graph of FIG. 8C that peaks are formed at the portions of frequencies 1646 Hz, 3291 Hz, and 1746 Hz. From the graph of FIG. 8D, it can be seen that a peak stands at the frequency of 19853 Hz. Also, from the graph of FIG. 8E, it can be seen that peaks stand at the portions of frequencies 22785 Hz and 23020 Hz.
- the frequency other than the frequency at which the peak occurs in FIGS. 6A to 6E is obtained. It can be seen that the signal strength of the component has increased. That is, the eigenvalue of the autocorrelation matrix R used to obtain the coefficient ⁇ is the component of each frequency included in the time waveform of the predicted value of the measurement data by the corrected autoregressive model specified by the obtained coefficient ⁇ . Was found to be correlated with the intensity of.
- a peak stands around 1640 Hz, as in the graphs of FIGS. 6B and 6C.
- peaks are further formed at 2021 Hz and 6474 Hz
- peaks are further formed at 3291 Hz and 1746 Hz.
- FIGS. 8B to 8C a remarkable difference in the peaked frequency can be seen between the bearing 106 having a flaw in the inner ring and the bearing 106 having a flaw in the cage. That is, by setting the number of used characteristic values s to 5, it is possible to distinguish whether the flaw of the bearing is the flaw of the inner ring, the flaw of the cage, or both.
- the inventors of the present invention are able to identify a site having a defect, which was difficult to distinguish when the number of used eigenvalues s is 1, by increasing the number of used eigenvalues s. I got the knowledge.
- the present inventors approach the actual measurement data by the corrected autoregressive model, and thereby signal the noise components and the like which are not useful for the state diagnosis of the bearing 106. It has been found that the intensity is increased and the frequency characteristic obtained by Equation 18 also has a peak due to the noise component.
- the coefficient ⁇ is obtained using a part of the eigenvalues having a relatively high value to approximate the component included in the measurement data that is useful for the state diagnosis of the object. It is considered possible to obtain the modified autoregressive model.
- Example 2 In addition, the inventors conducted the following experiment in the same experimental situation as the experiment 1.
- the bearing 106 is in a normal state without any flaw, the inner ring has a flaw, the cage has a flaw, the rolling element has a flaw, or the outer ring has a flaw.
- the following work was performed q times in each case. Although q is set to 50, it may be set to another value such as 30 or 100. That is, for the bearing 106, M consecutive measurement data items are obtained, and the matrix ⁇ s and the matrix U s are obtained using Equation 11 for each of the obtained M consecutive measurement data items, and Equation 5 and Equation 13 are obtained. Was used to obtain the coefficient ⁇ of the autoregressive model corrected. The number of eigenvalues used was set to 3.
- the inner ring has a flaw
- the cage has a flaw
- the rolling element has a flaw
- the outer ring has a flaw.
- the coefficient ⁇ of the q modified autoregressive models was obtained for each of the five cases of the state.
- the bearing 106 can be in five normal states without flaws, with flaws on the inner ring, flaws on the cage, flaws on the rolling elements, and flaws on the outer ring. Suppose there is. In the following, the number of states that the bearing 106 can assume is p. p was set to 5 corresponding to these 5 states.
- FIG. 9 shows that when the bearing 106 is in a normal state, the inner ring has a flaw, the cage has a flaw, the rolling element has a flaw, and the outer ring of the bearing 106 has a flaw.
- the pattern of the coefficient ⁇ is information indicating the shape when the components of the coefficient ⁇ are arranged.
- the value of m was 500. Therefore, the coefficient ⁇ is composed of 500 components ⁇ 1 to ⁇ 500 .
- This index i can be regarded as an index indicating the measurement time point of the measurement data y on which the coefficient component in Expression 1 is applied. That is, each of the patterns shown in FIG. 9 is an example of a pattern in which each component of the coefficient ⁇ is arranged based on the measurement time point of the measurement data y on which each component in Expression 1 is applied.
- the pattern of the coefficient ⁇ includes, for example, a vector in which the components of the coefficient ⁇ are arranged in the index order, a vector in which the components of the coefficient ⁇ are arranged by skipping by a predetermined number (for example, 1) in the index order, and the component of the coefficient ⁇ . For example, there is a vector arranged in the reverse order of the index. Further, in the pattern of the coefficient ⁇ , for example, a vector in which the components of the coefficient ⁇ in which the same value is added to each component are arranged in the index order, and the components of the coefficient ⁇ in which the same value is added to each component are predetermined in the index order.
- the pattern of the coefficient ⁇ is, for example, a vector in which the components of the coefficient ⁇ in which the respective components are multiplied by the same value are arranged in the index order, and the components of the coefficient ⁇ in which the respective components are multiplied by the same value are predetermined in the index order.
- the pattern of the coefficient ⁇ which is information indicating the shape when the components of the coefficient ⁇ are arranged, may be an image of a graph in which the components of the coefficient ⁇ are arranged instead of the vector.
- each of the q coefficient ⁇ patterns has a pattern indicating a region surrounded by two vertically symmetrical wavy lines.
- each of the q coefficient ⁇ patterns has a pattern in which a plurality of wavy lines overlap each other.
- each of the q coefficient ⁇ patterns is a pattern in which a mountain-shaped pattern having four peaks is continuous.
- each of the q coefficient ⁇ patterns is a wavy pattern that gradually attenuates.
- each of the q patterns of the coefficient ⁇ is a pattern in which a mountain-shaped pattern having two peaks is continuous.
- the bearing 106 can be diagnosed by specifying what kind of pattern the pattern of the coefficient ⁇ of the modified autoregressive model shows.
- a matrix Y having a size of m ⁇ d in which each column shows each coefficient ⁇ shown in FIG. 9 is generated as in the following Expression 19.
- d is p ⁇ q and is 250.
- ⁇ k,(i,j) in Expression 19 is the k-th component ⁇ k of the coefficient ⁇ determined from the j-th measurement data among the q measurement data measured from the bearing 106 in the state corresponding to i. Show.
- p is 5.
- ⁇ k,(4,j) is set to ⁇ k,(p ⁇ 1,j) . Further, in Expression 19, the notation of ⁇ k,(2,j) and ⁇ k,(3,j) is omitted.
- a non-negative matrix factorization of this matrix Y is performed to identify a representative pattern of the coefficient ⁇ of the corrected autoregressive model for each state of the bearing 106.
- a matrix in which each component has a non-negative value is a non-negative matrix.
- the non-negative matrix factorization of the matrix Y into the matrix A and the matrix P which are non-negative matrices is performed as shown in the following Expression 20.
- the matrix A is a matrix of size m ⁇ p.
- the matrix P has a size of p ⁇ d.
- the number of columns of the matrix A is the number of basis vectors in the non-negative matrix factorization, and in this experiment, p(5) is set as the number of states that the bearing 106 can assume.
- each column of the matrix A stores p(5) patterns of coefficient ⁇ (also referred to as a basis vector) derived from the matrix Y.
- Equation 21 ⁇ Define the cost function J as in Equation 21 below.
- the first term on the right side of Expression 21 indicates the condition for the product of the matrix A and the matrix P and the matrix Y to approximately match in the sense that the sum of squares of these residuals is minimized.
- the Fr symbol at the lower right of the first term on the right side of Expression 21 is a symbol that indicates the Frobenius norm. That is,
- the second term on the right side of Expression 21 indicates a condition that requires the sparsity of the matrix P. By adding this condition, it is possible to prevent non-negative matrix factorization from being overlearned.
- the index i in the second term on the right side of Expression 21 is an index indicating the row of the matrix. Further, the index k in the second term on the right side of Expression 21 is an index indicating a column of the matrix.
- the third term on the right side of Expression 21 indicates a condition that approximately requires orthogonality between patterns stored in different columns of the matrix A.
- the third term on the right side of Expression 21 has an effect of preventing the patterns stored in the p(5) columns of the matrix A from being as linearly dependent as possible. If the pattern stored in the columns of the matrix A is linearly dependent, the number of coefficients (also referred to as weights) when approximating a certain pattern by the linear combination of the patterns stored in the columns of the matrix A is not one Becomes difficult to identify.
- the matrix AT in the third term on the right side of Expression 21 is a transposed matrix of the matrix A, and the matrix I is a unit matrix. Further, the indexes k and k ⁇ (expressed as k with a bar drawn above in the expression) in the third term on the right side of Expression 21 are indexes indicating the rows and columns of the matrix, respectively.
- the cost function J even if only the first term on the right side of Expression 21 is used as the cost function J, the nonnegative matrix factorization functions, so that only the first term on the right side of Expression 21 may be used as the cost function J. Further, in the case where the above-mentioned problems such as over-learning and linear dependency occur, an equation in which the second term and the third term on the right side of Equation 21 are added to the first term on the right side of Equation 21 may be used as the cost function J. ..
- each state of the bearing 106 and a learning pattern determined by a method described later with reference to FIGS. 14A to 14B and the like can be favorably associated with each other.
- the coefficient ⁇ and the coefficient ⁇ are determined in advance by a case study. In this embodiment, ⁇ is 0.035 and ⁇ is 0.
- the first constraint condition in Expression 22 is a condition indicating that the matrix A and the matrix P are nonnegative matrixes.
- the second constraint condition in Expression 22 is a condition for normalizing the matrix A.
- the index k in the second constraint condition of Expression 22 is an index indicating a row and a column of the matrix.
- ⁇ P in Expression 23 is a relaxation coefficient used for updating the matrix P.
- ⁇ A in Expression 24 is a relaxation coefficient used for updating the matrix A. Partial differentiation of the cost function J in Expression 23 by the matrix P is as shown in Expression 25 below.
- the matrix E 1 in Expression 25 is a matrix in which all the components having a size of p ⁇ d are 1. Partial differentiation of the cost function J in Expression 24 by the matrix A is as shown in Expression 26 below.
- Equation 27 is obtained by rewriting Equation 23 using Equation 25.
- the index i in Expression 27 is an index indicating a row of a matrix.
- the index k in Expression 27 is an index indicating a column of the matrix.
- the value of Expression 27 needs to be a non-negative value.
- the third term on the right side of Expression 27 is a term that is always a non-negative value. That is, if the value of the expression obtained by removing the third term from the right side of Expression 27 is 0, Expression 27 is always a non-negative value. Therefore, as shown in the following Expression 28, the matrix P is updated so as to satisfy the condition that the expression obtained by removing the third term from the right side of Expression 27 is 0.
- the index i in Expression 28 is an index indicating the row of the matrix.
- the index k in Expression 28 is an index indicating a column of the matrix. From Expression 28, the value of the relaxation coefficient ⁇ P in Expression 23 is obtained as in Expression 29 below.
- the index i in Expression 29 is an index indicating the row of the matrix.
- the index k in Expression 29 is an index indicating a column of the matrix. Rewriting Equation 23 using Equation 29 gives Equation 30 below.
- the index i in Expression 30 is an index indicating the row of the matrix.
- the index k in Expression 30 is an index indicating a column of the matrix.
- the matrix P is updated by updating each component of the matrix P by using this Expression 30. Further, by rewriting the expression 24 using the expression 26, the following expression 31 is obtained.
- the index k in Expression 31 is an index indicating a row of the matrix.
- the index j in Expression 27 is an index indicating a column of the matrix. Since the matrix A has a non-negative value, the value of Expression 31 needs to be a non-negative value.
- the third term on the right side of Expression 31 is a term that always has a non-negative value. That is, if the value of the expression obtained by removing the third term from the right side of the expression 31 is 0, the expression 27 is always a non-negative value. Therefore, as shown in Expression 32 below, the matrix A is updated so as to satisfy the condition that the expression obtained by removing the third term from the right side of Expression 31 is 0.
- the index k in Expression 32 is an index indicating the row of the matrix.
- the index j in Expression 32 is an index indicating a column of the matrix. From Expression 32, the value of the relaxation coefficient ⁇ A in Expression 24 is obtained as in Expression 33 below.
- the index k in Expression 33 is an index indicating the row of the matrix.
- the index j in Expression 33 is an index indicating a column of the matrix.
- the index k in Expression 34 is an index indicating the row of the matrix.
- the index j in Expression 34 is an index indicating a column of the matrix.
- the matrix A is updated by updating each component of the matrix A using the equation 34. Further, in order to satisfy the second constraint condition in Expression 22, the matrix A is updated as shown in Expression 35 below.
- K in Expression 35 is an index indicating a row of the matrix.
- j is an index indicating the row or column of the matrix.
- the matrix P is updated using Expression 30, and the matrix A is updated using Expressions 34 and 35.
- the matrix ⁇ P and the matrix ⁇ A which are the differences obtained by subtracting the matrix P and the matrix A before the update from the matrix P and the matrix A after the update, respectively, are obtained. Then, the Frobenius norm of each of the matrix ⁇ P and the matrix ⁇ A is calculated.
- the cost function has an update step in which the ratio of the Frobenius norm of the matrix ⁇ P and the matrix ⁇ A in each update step to the Frobenius norm of the matrix ⁇ P and the matrix ⁇ A in the first update step is less than or equal to a predetermined threshold value. It is assumed that the value of J has converged. Then, the matrix A and the matrix P at that time are matrices that minimize the cost function J.
- the matrix A and the matrix P that minimize the cost function J it was decided to find the matrix A and the matrix P that minimize the cost function J as described above.
- the value of the cost function J is determined when a predetermined number of times continues May be assumed to have converged. Then, the matrix A and the matrix P at that time may be matrices that minimize the cost function J.
- FIG. 10 shows an example of a pattern shown by each column of the matrix A when the cost function J converges.
- the matrix A column includes m (500) values for each column and indicates the pattern of the coefficient ⁇ .
- the pattern is shown.
- FIG. 11 shows a graph showing the values of each row of the matrix P when the cost function J converges.
- the horizontal axis of the graph of FIG. 11 indicates the index of the column of the matrix P.
- the vertical axis of the graph in FIG. 11 indicates the value of each component of the matrix P.
- a line 1101 in FIG. 11 is a line connecting d(250) values in the first row of the matrix P.
- the line 1101 has a value of about 12 in the range where the horizontal axis is 0 or more and less than 50 (the range from the first column to the q(50)th column), and is a very small value compared with 12 in the other ranges. (About 0).
- a line 1102 in FIG. 11 is a line connecting d values in the second row of the matrix P.
- the line 1102 has a value of about 12 in the range where the horizontal axis is 50 or more and less than 100 (the range from the (q+1)th column to the 2qth column), and has a very small value (about 0) in other ranges. ).
- a line 1103 in FIG. 11 is a line connecting d values in the fourth row of the matrix P.
- the line 1103 has a value of about 12 in the range where the horizontal axis is 100 or more and less than 150 (the range from the 2q+1th column to the 3qth column), and is a very small value (about 0 in the range other than 12). ).
- a line 1104 in FIG. 11 is a line connecting d values in the fifth row of the matrix P.
- the line 1104 has a value of about 12 in the range where the horizontal axis is 150 or more and less than 200 (the range from the 3q+1th column to the 4qth column), and is extremely small compared to 12 in other ranges ( It is about 0).
- a line 1105 in FIG. 11 is a line connecting d values in the third row of the matrix P.
- the line 1105 is about 12 in the range where the horizontal axis is 200 or more and less than 250 (the range from the 4q+1th column to the 5qth column), and is a very small value (about 0 in the range other than 12). ).
- the value of each column of the matrix P is about 12 in the first row and about 0 in the second to fifth rows in the range from the first column to the q(50)th column. Further, regarding the value of each column of the matrix P, the value of the second row is about 12, and the value of the first row and the third to fifth rows is about 0 in the range from the (q+1)th column to the 2qth column. In addition, regarding the value of each column of the matrix P, the value of the 4th row is about 12, and the value of the 1st to 3rd rows and the 5th row is about 0 in the range from the 2q+1th column to the 3qth column.
- each column of the matrix P is about 12 in the 5th row and about 0 in the 1st to 4th rows in the range from the 3q+1th column to the 4qth column. Further, the value of each column of the matrix P is such that the value in the third row is about 12, and the value in the first, second, fourth, and fifth rows is about 0 in the range from the 4q+1th column to the 5qth column. Therefore, the pattern shown by the data of each column from the first column to the q-th column of the matrix AP has a weight of about 12 in the pattern shown in the top graph of FIG. 10, and is shown in the other graphs of FIG. The pattern shown in FIG. 10 is a pattern in which each pattern in FIG.
- the pattern shown by the data of each column from the q+1th column to the 2qth column of the matrix AP is about 12 weights for the pattern shown in the second graph from the top of FIG. 10
- the other graphs of FIG. 10 is a pattern in which the patterns shown in FIG. 10 are superimposed with a weight of about 0, and the pattern is similar to the pattern shown in the second graph from the top of FIG.
- the pattern indicated by the data in each column from the 2q+1th column to the 3qth column of the matrix AP is about 12 weights in the pattern shown in the second graph from the bottom in FIG.
- the other graphs in FIG. 10 is a pattern in which the patterns shown in FIG. 10 are superimposed with a weight of about 0, and the pattern is similar to the pattern shown in the second graph from the bottom in FIG. 10.
- the pattern shown by the data of each column from the 3q+1th column to the 4qth column of the matrix AP is about 12 weights in the pattern shown in the bottom graph of FIG. 10, and is shown in the other graphs of FIG.
- the pattern shown in FIG. 10 is a pattern in which the patterns shown in FIG. 10 are superposed on each other with a weight of about 0, and is similar to the pattern shown in the bottom graph of FIG.
- the pattern shown by the data in each of the 4q+1th column to the 5qth column of the matrix AP is about 12 weights in the pattern shown in the third graph from the top of FIG. 10, and the other graphs in FIG.
- the pattern shown in FIG. 10 is a pattern in which the patterns shown in FIG. 10 are superposed on each other with a weight of about 0, and the pattern is similar to the pattern shown in the third graph from the top of FIG.
- the pattern indicated by the data in each column from the 1st column to the qth column of the matrix Y is a pattern corresponding to the bearing 106 having a flaw in the outer ring shown in FIG.
- the pattern indicated by the data in each of the q+1th column to the 2qth column of the matrix Y is a pattern corresponding to the bearing 106 having a flaw in the rolling element shown in FIG. 9.
- the pattern indicated by the data in each of the 2q+1th to 3qth columns of the matrix Y is a pattern corresponding to the bearing 106 having a flaw in the inner ring shown in FIG. 9.
- the pattern indicated by the data in each of the 3q+1th column to the 4qth column of the matrix Y is a pattern corresponding to the normal bearing 106 having no flaw shown in FIG.
- the pattern indicated by the data in each of the 4q+1th column to the 5qth column of the matrix Y is a pattern corresponding to the bearing 106 having a flaw in the cage shown in FIG.
- the patterns shown by the data in each column of both are similar patterns. That is, it can be seen that the pattern indicated by the data in each column of the matrix A is a pattern of the coefficient ⁇ corresponding to the bearing 106 in each state.
- the data in the first column of the matrix A shows a typical pattern of the coefficient ⁇ corresponding to the bearing 106 having a flaw on the outer ring.
- the data in the second column of the matrix A shows a typical pattern of the coefficient ⁇ corresponding to the bearing 106 in the state where the rolling element has a flaw.
- the data in the third column of the matrix A shows a typical pattern of the coefficient ⁇ corresponding to the bearing 106 in which the cage has a flaw.
- the data in the fourth column of the matrix A shows a typical pattern of the coefficient ⁇ corresponding to the bearing 106 in which the inner ring has a flaw.
- the data in the fifth column of the matrix A shows a typical pattern of the coefficient ⁇ corresponding to the bearing 106 in a normal state without flaws.
- the matrix Y is generated, and the generated matrix Y is learned by non-negative matrix factorization so as to satisfy Expression 22, so that each column (base vector) of the matrix A is applied to the bearing 106 in each state. It was confirmed that the corresponding pattern of coefficient ⁇ was identified.
- Example 3 The inventor also came up with an idea of a method for diagnosing the state of the bearing 106. The outline of this idea will be described. From the measurement data of the bearing 106 whose state is known, a non-negative matrix showing the pattern of the coefficient ⁇ of the corrected autoregressive model corresponding to the state is specified as the teacher basis matrix. Then, a predetermined number of coefficients ⁇ of the autoregressive model corrected from the measurement data of the bearing 106 whose state is unknown are obtained, and the non-negative data indicating the respective patterns of the obtained number of coefficients ⁇ are obtained.
- the matrix stored in the column is the teacher basis matrix, the weight matrix of the teacher basis matrix, the extraction basis matrix indicating the basis extracted from the matrix storing the non-negative data in each column, and the weight matrix of the extracted basis matrix And decompose into. Then, by comparing the weight matrix of the teacher basis matrix and the weight matrix of the extracted basis matrix, it is diagnosed whether or not the state of the bearing 106 whose state is unknown is a state corresponding to the teacher basis matrix.
- the above is the outline of the idea obtained by the inventor.
- the inventors conducted the following experiment in the same experimental situation as Experiment 1 in order to verify the effectiveness of the method obtained by this idea.
- the number of used eigenvalues s was set to 3.
- m was set to 500.
- the data indicating the pattern of the coefficient ⁇ corresponding to the bearing 106 in the normal state without any flaw (the data in the column corresponding to the normal bearing 106 in the matrix A of the equation 20) is used as the teacher basis. It was acquired as the basis vector to which it belongs.
- the pattern belonging to the teacher base corresponding to the acquired normal bearing 106 is as shown in FIG.
- the graph of FIG. 12 shows the coefficient ⁇ corresponding to the bearing 106 in a normal state corrected to have a non-negative value.
- the horizontal axis of the graph of FIG. 12 represents the index of the coefficient ⁇ , and the vertical axis represents the value of the corresponding data.
- the inventors performed the following work q′ times for the case where the bearing 106 is in a normal state with no flaws, and the case where it is in each state shown in FIGS. 13A to 13C. 13A to 13C, the outer ring shown in FIG. 13A has a flaw with a width of 3 mm and a depth of about 0.1 mm, and the outer ring shown in FIG. 13B has a width of 0.5 mm and a depth of 0.1 mm.
- Each of the state having the following flaws and the state having minute flaws having a predetermined size (diameter of 1 mm or the like) or less on the outer ring shown in FIG. 13C.
- q′ is set to 200, it may be set to another value such as 100.
- M continuous measurement data of the bearing 106 is acquired, and the matrix ⁇ s and the matrix U s are calculated using Expression 11 based on the acquired continuous M measurement data, and Expression 5 is obtained. Then, the work of obtaining the coefficient ⁇ of the autoregressive model corrected by using Equation 13 was performed q′ times.
- q' is preferably 10 or more, more preferably 50 or more, and further preferably 100 or more.
- the data in each column of the matrix of Expression 37 is data indicating the respective coefficients ⁇ of the acquired q′ corrected autoregressive models. That is, ⁇ i,j indicates the i-th element in the j-th coefficient ⁇ of the q′ modified auto-regressive model coefficients ⁇ .
- this data matrix Y d is decomposed into a plurality of nonnegative matrices.
- each component of the data matrix Y d is made to be non-negative values.
- non-negative data indicating the pattern of the coefficient ⁇ in the corrected autoregressive model is stored.
- the data matrix Y d modified into a matrix of non-negative values is decomposed into a plurality of non-negative-value matrices. More specifically, the data matrix Y d includes a teacher basis matrix F, a teacher weight matrix G indicating weights for the teacher bases, and an extraction basis matrix Q indicating an extraction basis that is a basis extracted from the data matrix Y d. , And an extraction basis weight matrix W indicating weights for the extraction basis.
- the teacher basis matrix F, the teacher weight matrix G, the extracted basis matrix Q, and the extracted basis weight matrix W are all non-negative matrices.
- the teacher basis is a set of basis vectors indicating the pattern of the coefficient ⁇ corresponding to the bearing 106 in a normal state without any flaw.
- the extraction basis is a set of basis vectors indicating a pattern of the coefficient ⁇ other than the pattern of the coefficient ⁇ corresponding to the bearing 106 in a normal state without any flaw.
- the pattern of the coefficient ⁇ other than the pattern of the coefficient ⁇ corresponding to the bearing 106 in the normal state without flaws includes, for example, the pattern of the coefficient ⁇ corresponding to the bearing 106 whose state is unknown.
- the process of decomposing Y d into F, G, Q, and W can be regarded as the following process. That is, it can be regarded as a process of decomposing the data of the pattern of the coefficient ⁇ stored in each column of Y d as a weighted addition of the pattern belonging to the teacher base and the other patterns.
- F is a matrix of size m ⁇ 1.
- G is a matrix of size 1 ⁇ q'.
- Q is a matrix having a size of m ⁇ (the number n (1 in this experiment) indicating the number of basis vectors extracted from the data matrix).
- W is a matrix of size n ⁇ q'.
- the value of the element of each column in G indicates the weight of the component of the teacher base included in the data indicating the pattern of the coefficient ⁇ stored in that column of the data matrix Y d .
- the value of the element of each column of the nth row in W is the weight of the component of the extraction basis stored in that column of Q included in the data indicating the pattern of the coefficient ⁇ stored in that column of the data matrix Y d.
- the cost function J d is defined as in Expression 39 below.
- Fr of the first term on the right side of Expression 39 is a subscript indicating that it is a Frobenius norm. That is, the first term on the right side of Expression 39 is the Frobenius norm.
- the first term on the right side of Expression 39 indicates the magnitude of the difference between the sum of the product of F and G and the product of Q and W and the data matrix Y.
- the second term on the right side of Expression 39 is a term indicating the sparse constraint of the teacher weight matrix.
- ⁇ 1 of the second term on the right side of Expression 39 is a predetermined real number.
- K and t in the second term on the right side of Expression 39 are indexes indicating the rows and columns of the matrix, respectively.
- the third term on the right side of Expression 39 is a term indicating the sparse constraint of the extraction weight matrix.
- ⁇ 2 of the third term on the right side of Expression 39 is a predetermined real number.
- L and t in the third term on the right side of Expression 39 are indexes indicating the rows and columns of the matrix, respectively.
- the fourth term on the right side of Expression 39 is a term indicating an orthonormal constraint on the extraction basis (that is, a constraint that the entire pattern stored in each column of the extraction basis matrix Q approximately forms an orthonormal system). is there. That is, the fourth term on the right side of Expression 39 is a term relating to improvement of orthonormality.
- ⁇ 1 of the fourth term on the right side of Expression 39 is a predetermined real number.
- I and i′ of the fourth term on the right side of Expression 39 are indexes indicating the rows and columns of the matrix, respectively.
- I in the fourth term on the right side of Expression 39 is an identity matrix.
- the fifth term on the right side of Expression 39 is an orthogonal constraint between the teacher basis and the extraction basis (that is, all patterns stored in each column of the teacher basis matrix F and each column of the extraction basis matrix Q are stored. This is a term indicating the constraint that all existing patterns are approximately orthogonal).
- ⁇ 2 of the fifth term on the right side of Expression 39 is a predetermined real number.
- I and i′ of the fourth term on the right side of Expression 39 are indexes indicating the rows and columns of the matrix, respectively.
- the following processing is performed in order to minimize the cost function J d . That is, the cost function J d is minimized by repeating the update of G, Q, and W. Further, in order to minimize the cost function J d , a method other than the method described below (for example, an optimization method such as the Newton method or the stochastic gradient descent method) may be used. Update of G will be described. In this experiment, G was updated as shown in Equation 41 below.
- E 3 of the equation 42 is a matrix in which all the components of size 1 ⁇ q′ are 1.
- Matrix G has a non-negative value, so the value of Expression 43 needs to be a non-negative value.
- the last term on the rightmost side of Expression 43 is a term that is always a nonnegative value. That is, if the value of the expression excluding the last term from the rightmost side of the expression 43 is 0, the updated G is always a nonnegative value. Therefore, as shown in the following Expression 44, the matrix G is updated so as to satisfy the condition that the expression obtained by removing the last term from the rightmost side of Expression 43 is 0.
- Equation 46 based on Y d , F, G, Q, W before update at the time of processing, and a predetermined coefficient ⁇ 1 (0 in this experiment), G is calculated using Equation 46. updated. Next, updating Q will be described. In this experiment, Q was updated as shown in Equation 47 below.
- E 4 in Expression 48 is a matrix in which all the elements of size n ⁇ n are 1.
- E 5 in Expression 48 is a matrix in which all the elements having a size of 1 ⁇ 1 are 1.
- Matrix Q has a non-negative value, so the value of Expression 49 must be a non-negative value.
- the last term on the rightmost side of Expression 49 is always a nonnegative value. That is, if the value of the expression obtained by removing the last term from the rightmost side of expression 49 is 0, the updated Q is always a nonnegative value. Therefore, as shown in the following Expression 50, the matrix Q is updated so as to satisfy the condition that the expression obtained by removing the last term from the rightmost side of Expression 49 is 0.
- Equation 52 is used based on Y d , F, G, Q, W before updating at the time of processing, and predetermined coefficients ⁇ 1 , ⁇ 2 (both are 0 in this experiment). I updated Q. Next, the update of W will be described. In this experiment, W was updated as shown in Equation 53 below.
- E 6 of Expression 54 is a matrix in which all the elements having a size of 1 ⁇ q′ are 1.
- the value of Expression 55 needs to be a non-negative value.
- the last term on the rightmost side of Expression 55 is always a nonnegative value. That is, if the value of the expression obtained by removing the last term from the rightmost side of expression 55 is 0, W after updating is always a nonnegative value. Therefore, as shown in the following Expression 56, the matrix W is updated so as to satisfy the condition that the expression obtained by removing the last term from the rightmost side of Expression 55 is 0.
- G is calculated by using Expression 58. updated.
- the updating of G using Expression 46, the updating of Q using Expression 52, and the updating of W using Expression 58 are repeated.
- the Frobenius norm of these matrices is calculated for ⁇ G, ⁇ Q, and ⁇ W, which are differences obtained by subtracting G, Q, and W before update from G, Q, and W after update, respectively.
- the cost function J d has an update step in which the ratio of the Frobenius norm of ⁇ G, ⁇ Q, and ⁇ W in each update step to the Frobenius norm of ⁇ G, ⁇ Q, and ⁇ W in the first update step is less than or equal to a predetermined threshold value. The value of has converged. Then, G, Q, and W when J d converged were used as matrices that minimize the cost function J d . As a result, the data matrix Y d was decomposed into nonnegative matrixes F, G, Q, and W, respectively, as shown in Expression 38.
- G, Q, and W that minimize the cost function J d are obtained as described above.
- the update of G using Expression 46, the update of Q using Expression 52, and the update of W using Expression 58 are repeatedly performed, and before updating G, Q, and W,
- the change in the value of the cost function J d after the update may be equal to or less than a predetermined threshold value may be that the value of the cost function J d has converged after a predetermined number of consecutive times.
- G, Q, and W when J d converges may be a matrix that minimizes the cost function J d .
- the graph of FIG. 14B is a graph showing G and W obtained in this experiment from the measurement data of the bearing 106 in a normal state.
- the horizontal axis of the graph of FIG. 14B shows the indices of the columns G and W, and the vertical axis shows the values of the elements of G and W of the corresponding columns.
- the graph of FIG. 14B is a graph showing how much weight each of the teacher base component and the extraction base component exists in the data matrix Y d .
- the graph of FIG. 15A shows the present experiment based on the teacher base shown by F (the pattern of the coefficient ⁇ belonging to it) and the measurement data of the bearing 106 in a state where a line flaw having a width of 3 mm and a depth of about 0.1 mm exists in the outer ring.
- 3 is a graph showing the extraction basis (the pattern of the coefficient ⁇ belonging to) represented by Q obtained in FIG.
- the horizontal axis of the graph of FIG. 15A indicates the index of the coefficient ⁇ , and the vertical axis indicates the value of the corresponding data.
- the graph of FIG. 15B is a graph showing G and W obtained in the present experiment from the measurement data of the bearing 106 in a state where a line flaw having a width of 3 mm and a depth of about 0.1 mm exists in the outer ring.
- the horizontal axis of the graph of FIG. 15B shows the indices of the columns G and W, and the vertical axis shows the values of the elements of G and W of the corresponding columns.
- the graph of FIG. 16B is a graph showing G and W obtained in the present experiment from the measurement data of the bearing 106 in which a line flaw having a width of 0.5 mm and a depth of 0.1 mm or less exists on the outer ring.
- the horizontal axis of the graph of FIG. 16B shows the indices of the columns G and W, and the vertical axis shows the values of the elements of G and W of the corresponding columns.
- the graph of FIG. 17A is a graph showing the teacher base shown by F and the extraction base shown by Q obtained in this experiment from the measurement data of the bearing 106 in the state where minute flaws exist on the outer ring.
- the horizontal axis of the graph in FIG. 17A represents the index of the coefficient ⁇ , and the vertical axis represents the value of the corresponding data.
- the graph of FIG. 17B is a graph showing G and W obtained in this experiment from the measurement data of the bearing 106 in the state where minute flaws exist on the outer ring.
- the horizontal axis of the graph of FIG. 17B shows the indices of the columns G and W, and the vertical axis shows the values of the elements of G and W of the corresponding columns.
- the inventors compared the G and W obtained by the decomposition of the data matrix Y d from the experimental result of the present experiment to show that the state of the bearing 106 corresponding to the data matrix Y d is the state indicated by the teacher base. We obtained the finding that it can be diagnosed.
- the processing of this embodiment is the following processing. That is, the non-negative data showing the pattern of the coefficient ⁇ of the corrected autoregressive model corresponding to the bearing 106 in the predetermined state is obtained as the basis vector belonging to the teacher basis. Then, a data matrix Y d is generated from the measurement data measured from the bearing 106 to be diagnosed, and the generated data matrix Y d is a matrix indicating the teacher base, a teacher weight matrix indicating the weight of the teacher base, and an extraction base. And an extraction weight matrix indicating the weights of the extraction bases. Then, it is a process of diagnosing whether or not the state of the bearing 106 corresponds to the teacher basis, based on the teacher weight matrix obtained by the decomposition of the data matrix Y d and the extracted weight matrix.
- FIG. 18 is a diagram showing an example of the system configuration of the diagnostic system of this embodiment.
- the diagnostic system is a system that diagnoses a state of an object that periodically moves.
- the diagnostic system includes an information processing device 1800 and a vibration measuring device 1801.
- the diagnostic system diagnoses the condition of bearings used in railway bogies.
- the diagnostic system diagnoses the state of the bearing 106 based on the vibration measurement data measured by the vibration measuring device 1801 installed at the vibration measuring position 111 in the same situation as in FIGS. 1A and 1B. ..
- the information processing device 1800 is an information processing device such as a personal computer (PC), a server device, a tablet device, etc. that diagnoses the bearing state based on the signal measured by the vibration measuring device 1801. Further, the information processing device 1800 may be a computer incorporated in a train.
- PC personal computer
- server device a server device
- tablet device etc. that diagnoses the bearing state based on the signal measured by the vibration measuring device 1801. Further, the information processing device 1800 may be a computer incorporated in a train.
- the vibration measuring device 1801 includes a sensor such as an acceleration sensor, detects vibration of an object through the sensor, and outputs a signal corresponding to the detected vibration to an external device such as the information processing device 1800 by wire or wirelessly. It is a device.
- the information processing device 1800 includes an acquisition unit 1810, a determination unit 1820, a learning unit 1830, a decomposition unit 1840, a diagnosis unit 1850, and an output unit 1860.
- the acquisition unit 1810 acquires measurement data y regarding the periodic motion of an object that performs the periodic motion.
- the acquisition unit 1810 rotates the inner ring of the bearing 106 and acquires the measurement data y of the vibration measured by the vibration measurement device 1801 installed at the vibration measurement position 111.
- the determining unit 1820 determines the coefficient ⁇ in the corrected autoregressive model based on the measurement data y acquired by the acquiring unit 1810.
- the determining unit 1820 determines the coefficient ⁇ in the corrected autoregressive model using Expression 12.
- Equation 12 is an equation from the autocorrelation matrix R instead of the autocorrelation matrix R represented by Equation 7 in the equation 6 (Yule-Walker equation) used for determining the coefficient in the generally known autoregressive model.
- Equation 6 the autocorrelation matrix R having the autocorrelation of the measurement data y with the time difference of 0 to m ⁇ 1 as a component is the coefficient matrix, and the autocorrelation of the measurement data y with the time difference of 1 to m as the component is This is an equation in which the correlation vector is a constant vector.
- Equation 6 the minimum and the predicted value y ⁇ k of the measurement data y calculated by the formula 1, a square error between the actual measurement value y k of the measurement data y at time k corresponding to the predicted value y ⁇ k of measurement data y It can be derived as a conditional expression indicating the condition to be changed.
- the first matrix R′ is derived from a diagonal matrix ⁇ whose diagonal components are the eigenvalues of the autocorrelation matrix R, and an orthogonal matrix U whose column components are the eigenvectors of the autocorrelation matrix R.
- the eigenvalues of the autocorrelation matrix R are derived by performing singular value decomposition (Equation 8) on the autocorrelation matrix R.
- the first matrix R′ is a submatrix of the diagonal matrix ⁇ using the set number of eigenvalues s of 1 or more and less than m among the eigenvalues of the autocorrelation matrix R, and is the number of used eigenvalues. It is derived from a matrix ⁇ s having s eigenvalues as diagonal components and a matrix U s having a column component vector that is a submatrix of the orthogonal matrix U and that corresponds to the s eigenvalues of the number of used eigenvalues. Matrix U s ⁇ s U s T.
- the eigenvalues of the autocorrelation matrix R may be set to include the largest eigenvalue, but it is preferable to select the largest eigenvalue in order.
- the learning unit 1830 uses, as learning data, the coefficient ⁇ in the corrected autoregressive model determined by the determination unit 1820 from the measurement data acquired by the acquisition unit 1810 in advance for a plurality of states of objects in a predetermined state.
- the pattern of the coefficient ⁇ in the modified autoregressive model corresponding to the object is specified by learning as a basis vector belonging to the teacher basis.
- the decomposition unit 1840 acquires a predetermined number of the coefficient ⁇ determined by the determination unit 1820 based on the measurement data measured from the object to be diagnosed.
- the decomposing unit 1840 generates a data matrix that stores non-negative data indicating the respective patterns of the acquired coefficient ⁇ .
- the decomposition unit 1840 extracts the generated data matrix from the teacher matrix that stores the teacher base learned by the learning unit 1830, the teacher weight matrix that indicates the weight of the component of the teacher base in the data matrix, and the data matrix. It is decomposed into an extraction basis matrix in which the extracted basis is stored and an extraction weight matrix indicating the weights of the components of the extraction basis in the data matrix.
- the diagnosis unit 1850 diagnoses whether or not the state of the object is a state corresponding to the teacher base, based on the teacher weight matrix and the extraction weight matrix obtained by the decomposition unit 1840. In the present embodiment, whether or not the state of the bearing 106 corresponds to the teacher base is the diagnosis result.
- FIG. 19 is a diagram illustrating an example of the hardware configuration of the information processing device 1800.
- the information processing device 1800 includes a CPU 1900, a main storage device 1901, an auxiliary storage device 1902, and an input/output I/F 1903.
- the components are connected to each other via a system bus 1904 so that they can communicate with each other.
- the CPU 1900 is a central processing unit that controls the information processing device 1800.
- the main storage device 1901 is a storage device such as a RAM (Random Access Memory) that functions as a work area of the CPU 1900 and a temporary storage place of data.
- the auxiliary storage device 1902 stores various programs, setting data, measurement data output from the vibration measuring device 1801, measurement information, and the like, ROM (Read Only Memory), HDD (Hard Disk Drive), SSD (Solid State Drive). Etc. is a storage device.
- the input/output I/F 1903 is an interface used for exchanging information with an external device such as the vibration measuring device 1801.
- the CPU 1900 executes the process based on the program stored in the auxiliary storage device 1902 or the like, whereby the functions of the information processing device 1800 described with reference to FIG. 18 and the processes of the flowcharts described later with reference to FIGS.
- FIG. 20 is a flowchart showing an example of the learning process executed by the diagnostic system. A process of identifying a teacher base by learning will be described with reference to FIG.
- the information processing device 1800 includes a case where the bearing 106 has a flaw in the outer ring, a case where the bearing 106 has a flaw in the rolling element, and a case where the bearing 106 has a flaw in the inner ring. The following processing is repeated q (50) times in advance for each of the case where the bearing 106 is in a normal state with no flaws and the case where the bearing 106 has a flaw in the outer ring.
- the acquisition unit 1810 acquires the vibration measurement data y measured by the vibration measuring device 1801.
- the acquisition unit 1810 acquires, as the measurement data y, measurement data y 1 to y M from time 1 to time M when a randomly set time is time 1.
- the determining unit 1820 obtains the measurement data y, a preset constant M, and a number m indicating how many past data are approximated to the data at a certain time in the corrected autoregressive model, Based on, the autocorrelation matrix R is generated using Equation 5 and Equation 7.
- the determination unit 1820 acquires M and m by reading the information of M and m stored in advance. In this embodiment, the value of m is 500.
- M is an integer larger than m.
- the determining unit 1820 obtains the orthogonal matrix U and the diagonal matrix ⁇ of Equation 8 by performing singular value decomposition on the generated autocorrelation matrix R, and from the diagonal matrix ⁇ , the eigenvalues ⁇ 11 to Get ⁇ mm .
- the determining unit 1820 determines, from the plurality of eigenvalues ⁇ 11 to ⁇ mm of the autocorrelation matrix R, the eigenvalues ⁇ 11 to ⁇ ss corresponding to the number of used eigenvalues s from the largest one, and the modified ⁇ Is selected as the eigenvalue of the autocorrelation matrix R used to obtain
- the number of used eigenvalues s is 3, but may be 2 or less, or 4 or more.
- the determining unit 1820 is modified using Expression 13 based on the measurement data y, the eigenvalues ⁇ 11 to ⁇ ss, and the orthogonal matrix U obtained by singular value decomposition of the autocorrelation matrix R.
- the determining unit 1820 converts the determined coefficient ⁇ into a non-negative value and stores it in the auxiliary storage device 1902 as learning data.
- the non-negative conversion is performed, for example, by adding a value obtained by multiplying each component of the coefficient ⁇ by ⁇ 1 to the value of the lowest component less than 0 included in the coefficient ⁇ . Accordingly, the information processing device 1800 determines whether the bearing 106 has a flaw in the outer ring, the bearing 106 has a flaw in the rolling element, or the bearing 106 has a flaw in the inner ring.
- the data of the coefficient ⁇ in the autoregressive model corrected q(50) pieces is used as learning data. Can be retrieved and stored.
- the bearing 106 can be in a normal state without flaws, a flaw on the inner ring, a flaw on the cage, a flaw on the rolling element, and a flaw on the outer ring. There are five of them. That is, the number p of states that the bearing 106 can assume is 5.
- the learning unit 1830 acquires the learning data stored in the auxiliary storage device 1902.
- the learning unit 1830 generates the matrix Y of Expression 19 based on the learning data acquired in S2001.
- the learning unit 1830 generates a matrix having a size of m(500) ⁇ d(250), and sets the data in each column as the value of each coefficient ⁇ included in the learning data to generate the matrix Y.
- a matrix A having a size of m ⁇ p is generated, and a predetermined initial value is set for each element of the matrix A.
- a p ⁇ d size matrix P is generated, and each component of the matrix P is set to a predetermined initial value.
- the learning unit 1830 uses Expression 21 based on the matrix Y generated in S2002, the matrix A, the matrix P, the predetermined coefficient ⁇ , and the predetermined coefficient ⁇ , The value of the cost function J is calculated as the cost.
- the learning unit 1830 stores the calculated cost as the pre-update cost in the main storage device 1901 or the like.
- the learning unit 1830 uses Equation 34 based on the matrix Y, the matrix A, the matrix P, the coefficient ⁇ , and the matrix E 2 in which all the components of size p ⁇ p are 1s. To update the matrix A. Further, the learning unit 1830 further updates the updated matrix A using Expression 35. Further, the learning unit 1830 calculates Equation 30 based on the matrix Y, the matrix A, the matrix P, the coefficient ⁇ , and the matrix E 1 in which all the components of size m ⁇ p are 1s. To update the matrix P.
- the learning unit 1830 uses Equation 21 to calculate the cost function J based on the matrix Y, the matrix A updated in S2003, the matrix P updated in S2003, the coefficient ⁇ , and the coefficient ⁇ . The value is calculated as the cost.
- the learning unit 1830 stores the calculated cost in the main storage device 1901 or the like as the updated cost.
- the learning unit 1830 determines whether or not the absolute value of the difference between the post-update cost and the pre-update cost is less than or equal to a predetermined threshold value. When the learning unit 1830 determines that the difference between the post-update cost and the pre-update cost is less than or equal to the predetermined threshold value, the learning unit 1830 proceeds to the process of S2007. If the learning unit 1830 determines that the absolute value of the difference between the post-update cost and the pre-update cost is larger than the predetermined threshold value, the learning unit 1830 proceeds to the process of S2008. After the processing of S2006, the learning unit 1830 stores the post-update cost in the main storage device 1901 as a new pre-update cost.
- the learning unit 1830 adds 1 to the value of the counter stored in the main storage device 1901 or the like.
- the learning unit 1830 initializes the value of this counter to 0 before the processing of FIG. 20 is started.
- the learning unit 1830 initializes the value of the counter stored in the main storage device 1901 or the like to 0, and proceeds to the process of S2004.
- the learning unit 1830 determines whether the value of the counter stored in the main storage device 1901 or the like is equal to or larger than a predetermined threshold value. If the learning unit 1830 determines that the value of the counter stored in the main storage device 1901 or the like is equal to or greater than the predetermined threshold value, the learning unit 1830 determines that the value of the cost function J has converged to the minimum value, and proceeds to the process of S2010. .. If the learning unit 1830 determines that the value of the counter stored in the main storage device 1901 or the like is less than the predetermined threshold value, the learning unit 1830 proceeds to the process of S2004.
- the learning unit 1830 determines, based on the matrix P, the pattern indicated by the data in each column of the matrix A is the pattern of the coefficient ⁇ in the corrected autoregressive model corresponding to the bearing 106 in which state. Identify.
- the data in a certain column of the matrix Y is obtained as the data obtained by multiplying the matrix A by that column in the matrix P. That is, the data of a certain column of the matrix Y is data in which the data of each column of the matrix A is overlapped with the value of each row in that column of the matrix P as a weight. Therefore, in S2010, the learning unit 1830 determines whether the pattern indicated by the data of each column of the matrix A is the pattern of the coefficient ⁇ in the corrected autoregressive model corresponding to the bearing 106 in which state in the following manner. Specify.
- the learning unit 1830 identifies, among the columns of the matrix Y, a column that stores data indicating the coefficient ⁇ corresponding to the bearing 106 in one state. For example, the learning unit 1830 identifies, among the columns of the matrix Y, the first column to the qth column, which are the columns that store data indicating the coefficient ⁇ corresponding to the bearing 106 in which the outer ring has a flaw. The learning unit 1830 then aggregates the values for each row of the specified columns (first column to qth column) in the matrix P. Then, learning unit 1830 identifies the row corresponding to the largest value among the aggregated values. The learning unit 1830 identifies the columns of the matrix A that are multiplied with the identified rows of the matrix P.
- the learning unit 1830 specifies the first column because the column of the matrix A that is multiplied by the first row of the matrix P is the first column. Then, learning unit 1830 identifies the data indicated by the identified column of matrix A as data indicating a typical pattern of coefficient ⁇ corresponding to bearing 106 in that state.
- the learning unit 1830 performs the above processing for each state that the bearing 106 can take, so that the pattern indicated by the data in each column of the matrix A is in the corrected autoregressive model corresponding to which state the bearing 106 is. It is specified whether the pattern is the coefficient ⁇ .
- the learning unit 1830 uses the data corresponding to the bearing 106 in a predetermined state among the non-negative data showing the typical pattern of the coefficient ⁇ in the corrected autoregressive model corresponding to the identified bearing 106 in each state. Is stored in the auxiliary storage device 1902 or the like as a base vector belonging to the teacher base. In the present embodiment, this predetermined state is assumed to be a normal state without flaws. Therefore, the learning unit 1830 stores the data indicating the pattern of the coefficient ⁇ corresponding to the normal state in the auxiliary storage device 1902 or the like as a base vector belonging to the teacher base.
- the diagnostic system diagnoses the state of the bearing 106 by identifying whether the state of the bearing 106 corresponds to the teacher base.
- the diagnosis system may diagnose the state of the bearing 106 based on the measurement data previously measured by the vibration measuring device 1801, or the vibration measuring device 1801 measures and outputs the status in real time.
- the state of the bearing 106 in operation may be diagnosed using the continuously measured data.
- FIG. 21 is a flowchart showing an example of the diagnosis process.
- the acquisition unit 1810 acquires the vibration measurement data y measured by the vibration measurement device 1801.
- the acquisition unit 1810 randomly selects the time as the measurement data y from within the vibration measurement period.
- the acquisition unit 1810 acquires the selected time as time 1 and the measurement data from time 1 to M as y 1 to y M.
- the determination unit 1820 determines the number of past data to approximate the data at a certain time in the measured data y acquired in S2101, the preset constant M, and the corrected autoregressive model. Based on m and, the autocorrelation matrix R is generated using Equation 5 and Equation 7.
- the determination unit 1820 acquires M and m by reading the information of M and m stored in advance. In this embodiment, the value of m is 500. In addition, M is an integer larger than m.
- the determining unit 1820 obtains the orthogonal matrix U and the diagonal matrix ⁇ of Equation 8 by performing singular value decomposition on the autocorrelation matrix R generated in S2102, and the eigenvalues of the autocorrelation matrix R are obtained from the diagonal matrix ⁇ . Acquire ⁇ 11 to ⁇ mm .
- step S2104 the determining unit 1820 corrects the eigenvalues ⁇ 11 to ⁇ ss of the maximum number of eigenvalues ⁇ 11 to ⁇ mm among the plurality of eigenvalues of the autocorrelation matrix R by the number of used eigenvalues s. Is selected as the eigenvalue of the autocorrelation matrix R used to obtain the coefficient ⁇ of. In the present embodiment, the number of used eigenvalues s is 3, but may be 2 or less, or 4 or more.
- the determining unit 1820 is modified using Expression 13 based on the measurement data y, the eigenvalues ⁇ 11 to ⁇ ss, and the orthogonal matrix U obtained by singular value decomposition of the autocorrelation matrix R.
- the coefficient ⁇ determined in S2104 is an example of a correction coefficient that is a coefficient in the corrected autoregressive model determined from the measurement data.
- the pattern of the coefficient ⁇ determined in S2104 is an example of the measurement pattern.
- the determination unit 1820 determines whether or not a predetermined number q′ of coefficients ⁇ have been determined. When determining unit 1820 determines that a predetermined number q′ of coefficients ⁇ have been determined, the process proceeds to S2105, and determines that only a predetermined number q′ or less of coefficients ⁇ have been determined. In this case, the process proceeds to S2101, and the determination process of the coefficient ⁇ is repeated.
- the decomposition unit 1840 acquires the teacher base stored in S2010 from the auxiliary storage device 1902.
- the decomposing unit 1840 uses the q′ coefficients ⁇ determined by the determining unit 1820 to generate a data matrix Y d having a size of m ⁇ q′ as shown in Expression 37. That is, each column of the data matrix Y d stores the data of the pattern of the coefficient ⁇ determined in S2104.
- the decomposition unit 1840 also makes each component of the data matrix Y d non-negative.
- the non-negative conversion is performed by, for example, adding a value obtained by multiplying the lowest element of the matrix Y less than 0 by -1 to each element of the matrix Y.
- the decomposing unit 1840 generates an m ⁇ 1 size teacher base matrix F that stores the teacher bases. Then, the disassembling unit 1840 sets each element of F to data belonging to the teacher base. Further, the decomposition unit 1840 generates a teacher weight matrix G having a size of 1 ⁇ q′ that stores the weights of the teacher base components included in the data matrix Y d . Further, the decomposing unit 1840 generates a matrix Q having a size of m ⁇ a predetermined number n, which stores an extraction basis that is a set of patterns extracted from the data matrix Y d . In this embodiment, n is 1.
- the decomposition unit 1840 also generates a teacher weight matrix W of size n ⁇ q′ that stores the weights of the components of the extraction basis included in the data matrix Y d . Then, the decomposing unit 1840 initializes each of G, Q, and W by setting a predetermined initial value for each of G, Q, and W components.
- step S2109 the decomposing unit 1840 uses the equation 39 to calculate the cost function J based on Y d , F, G, Q, W, and the predetermined coefficients ⁇ 1 , ⁇ 2 , ⁇ 1 , ⁇ 2.
- the value of d is obtained as the cost.
- the values of ⁇ 1 , ⁇ 2 , ⁇ 1 and ⁇ 2 are 0.
- the disassembling unit 1840 stores the calculated cost in the main storage device 1901 or the like as the pre-update cost.
- the decomposition unit 1840 updates each of G, Q, and W. More specifically, the decomposing unit 1840 has Y d , F, G, Q, W before updating, a predetermined coefficient ⁇ 1 (0 in this embodiment), and a size of 1 ⁇ q. Based on E 3 where all the elements of'are a matrix of 1, and using Equation 46, update G. However, the decomposing unit 1840 may update G without using E 3 because ⁇ 1 is 0 in this embodiment.
- the decomposition unit 1840 has Y d , F, G, Q, and W before updating, predetermined coefficients ⁇ 1 and ⁇ 2 (both are 0 in this embodiment), and the size is n ⁇ n.
- Q is updated using Equation 52 based on E 4 which is a matrix in which all the components are 1 and E 5 which is a matrix in which all the components having a size of 1 ⁇ 1 are 1.
- the decomposing unit 1840 may update Q without using E 4 and E 5 , since each of ⁇ 1 and ⁇ 2 is 0 in this embodiment.
- the decomposition unit 1840 uses Y d , F, G, Q, and W before updating, a predetermined coefficient ⁇ 2 (0 in this embodiment), and all of the sizes of 1 ⁇ q′. Based on E 6 , which is a matrix of 1's, and using Equation 58, W is updated. However, the decomposition unit 1840 may update Q without using E 6 because ⁇ 2 is 0 in this embodiment.
- the decomposition unit 1840 uses Expression 39 based on Y d , F, G, Q, W updated in S2110, and the coefficients ⁇ 1 , ⁇ 2 , ⁇ 1 , ⁇ 2, and The value of the cost function J d is obtained as the cost.
- the disassembling unit 1840 stores the calculated cost as the updated cost in the main storage device 1901 or the like.
- the decomposition unit 1840 determines whether or not the absolute value of the difference between the post-update cost and the pre-update cost is less than or equal to a predetermined threshold value.
- the process proceeds to S2113.
- the disassembling unit 1840 determines that the absolute value of the difference between the post-update cost and the pre-update cost is larger than the predetermined threshold value, the process proceeds to S2114.
- the disassembling unit 1840 stores the post-update cost in the main storage device 1901 as a new pre-update cost.
- step S2113 the decomposition unit 1840 adds 1 to the value of the counter stored in the main storage device 1901 or the like.
- the disassembling unit 1840 initializes the value of this counter to 0 before starting the processing of FIG.
- the disassembling unit 1840 initializes the value of the counter stored in the main storage device 1901 or the like to 0, and advances the processing to S2110.
- the disassembling unit 1840 determines whether or not the value of the counter stored in the main storage device 1901 or the like is equal to or larger than a predetermined threshold value.
- the decomposing unit 1840 determines that the value of the counter stored in the main storage device 1901 or the like is equal to or larger than the predetermined threshold value, it determines that the value of the cost function J d has converged to the minimum value, and the process proceeds to S2116. Proceed.
- the disassembling unit 1840 determines that the value of the counter is less than the predetermined threshold value, the processing proceeds to S2110.
- the diagnosis unit 1850 diagnoses whether or not the state of the bearing 106 to be diagnosed corresponds to the teacher base, based on G and W updated up to the processing point.
- the diagnosis unit 1850 compares the elements in each of the G and W columns and specifies which is larger. Then, when the number of rows in which the G element is larger than the W element is equal to or greater than a predetermined threshold value, the diagnosis unit 1850 determines that the state of the bearing 106 to be diagnosed corresponds to the teacher base ( In this embodiment, it is diagnosed that it is a normal state.
- the predetermined threshold is, for example, 75% of the number of columns of G and W (150 in this embodiment). If the number of rows in which the G element is larger than the W element is less than a predetermined threshold, the diagnosis unit 1850 determines that the state of the bearing 106 to be diagnosed corresponds to the teacher base. Diagnose not.
- the output unit 1860 outputs information indicating the result of the diagnosis of the bearing 106 in S2116.
- the output unit 1860 outputs, for example, by displaying information indicating the diagnosis result of the bearing 106 on the display device. Further, as another example, the output unit 1860 may output the information indicating the diagnosis result of the bearing 106 by storing the information in the auxiliary storage device 1902. Further, the output unit 1860 may output the information indicating the diagnosis result of the bearing 106 by transmitting the information to the set destination such as an external server device, for example.
- the bearing Based on the weights of the components of the pattern corresponding to the predetermined state and the weights of the components of the other patterns included in the pattern of the coefficient ⁇ obtained from the measurement data of the bearing 106 to be diagnosed, the bearing It was found from Experiment 3 that it was possible to appropriately diagnose whether or not the state of 106 was a predetermined state. In the present embodiment, the diagnostic system performs the diagnostic process of the bearing 106 based on this knowledge.
- the diagnostic system previously obtains the pattern of the coefficient ⁇ of the corrected autoregressive model corresponding to the bearing 106 in a normal state without any defect as the basis vector belonging to the teacher basis. Then, the diagnostic system obtains q′ coefficients of the corrected autoregressive model ⁇ from the measurement data measured from the bearing 106 to be diagnosed, and stores the data indicating the respective patterns of the obtained q′ coefficients ⁇ . To generate a data matrix Y d . Then, the diagnostic system decomposes Y d into F, a teacher weight matrix G indicating the weight of the teacher base, an extraction basis matrix Q indicating the extraction base, and an extraction weight matrix W indicating the weight of the extraction base. ..
- the diagnostic system diagnoses whether or not the bearing 106 to be diagnosed is in a state corresponding to the teacher base based on G and W obtained by decomposing Y d . Thereby, the diagnostic system can appropriately diagnose whether the bearing 106 is in a predetermined state.
- the diagnostic system approximates the measurement data by using some eigenvalues among the eigenvalues of the autocorrelation matrix R so that more components useful for the diagnosis of the bearing 106 remain and less useful components do not remain.
- the diagnostic system diagnoses the bearing 106 by using the coefficient ⁇ as described above, and thus the bearing 106 of the bearing 106 is more accurately compared with the case where the diagnostic is performed using the signal including the signal components of various frequency ranges. Diagnosis can be done.
- the diagnostic system is configured to perform a state diagnosis of the bearing 106 of the railway bogie.
- the diagnostic system may be configured to diagnose the states of a rotating body such as a gear, a vibrating body such as a vibrator, a stretchable body such as a spring, and other objects that perform periodic motions such as the heart of a living thing.
- m is a preset number of 500.
- the number of past data that can appropriately approximate the measurement data may be specified by performing an experiment according to the diagnosis target, and the specified number may be set as the value of m.
- the information processing apparatus 1800 approximates the measurement data measured from the diagnosis target by approximating the measurement data at a certain time using a plurality of measurement data past the time using an autoregressive model or the like. The number of past measurement data used for approximation when the difference between the measured value and the measurement data at that time is less than the set threshold value may be determined as m.
- the information processing device 1800 sets the number of used eigenvalues s to 3.
- the information processing device 1800 may determine the value of the use eigenvalue number s as follows. That is, the information processing device 1800 first obtains the total value of all the eigenvalues of the autocorrelation matrix R. Then, the information processing device 1800 determines that the sum of the a eigenvalues of the autocorrelation matrix R from the largest one is the smallest among a in which the obtained total value is equal to or more than the set ratio (for example, 90%). The number may be determined as the number of used eigenvalues s.
- the information processing apparatus 1800 determines the coefficient ⁇ in the corrected autoregressive model by using the s eigenvalues of the number of used eigenvalues from the largest eigenvalue of the autocorrelation matrix R. did. However, the information processing device 1800 may determine the coefficient ⁇ in the corrected autoregressive model using any s eigenvalues of the eigenvalues of the autocorrelation matrix R. For example, the information processing apparatus 1800 determines the coefficient ⁇ in the corrected autoregressive model by using two of the eigenvalues of the autocorrelation matrix R, the largest and the third largest. May be
- the diagnostic system generates the matrix Y such that the columns storing the coefficient ⁇ corresponding to the bearing 106 in the same state are continuous.
- the diagnostic system may generate the matrix Y so that the columns storing the coefficient ⁇ corresponding to the bearing 106 in the same state are not continuous.
- the diagnostic system generates a matrix Y in which the coefficient ⁇ corresponding to the bearing 106 in each state is stored in each column, and the matrix Y is learned by non-negative matrix factorization to obtain the bearing in each state.
- a representative pattern of coefficient ⁇ corresponding to 106 was identified.
- the diagnosis system performs learning by determining a plurality of coefficients ⁇ corresponding to the bearing 106 in a certain state and obtaining an average of the plurality of determined coefficients ⁇ , for example, by the same process as the process of acquiring the learning data. By doing so, the pattern indicated by the calculated average coefficient may be specified as a representative pattern of the coefficient ⁇ corresponding to the bearing 106 in that state.
- the diagnosis unit 1850 is configured to diagnose the bearing 106 by the method described in S2116 of FIG. 21 based on G and W obtained by the decomposition of Y d .
- the diagnosis unit 1850 may use another method to diagnose whether or not the state of the bearing 106 to be diagnosed corresponds to the teacher base.
- the diagnosis unit 1850 may be configured as follows. That is, the diagnosis unit 1850 obtains a deviation for each element of G, identifies a predetermined number from the one with the smallest deviation, and obtains an average value of the identified elements of G.
- the predetermined number is, for example, 70% of all G elements (140 in this embodiment).
- the diagnosis unit 1850 obtains a deviation for each element of W, identifies a predetermined number from the one with the smallest deviation, and obtains an average value of the identified elements of W.
- the predetermined number is, for example, 70% of all G elements (140 in this embodiment).
- the diagnosis unit 1850 diagnoses that the bearing 106 to be diagnosed is in a state corresponding to the teacher base. ..
- the diagnosis unit 1850 diagnoses that the bearing 106 to be diagnosed is not in a state corresponding to the teacher base. ..
- the diagnosis unit 1850 may be configured as follows. That is, the diagnosis unit 1850 obtains an average value of a predetermined number of elements having intermediate values among the elements of G.
- the predetermined number is, for example, 70% of all G elements (140 in this embodiment). Further, the diagnosis unit 1850 obtains an average value of a predetermined number of elements having intermediate values among the elements of W. Then, when the average value of the obtained G elements is larger than the average value of the W elements by a predetermined threshold value or more, the diagnosis unit 1850 diagnoses that the bearing 106 to be diagnosed is in a state corresponding to the teacher base. ..
- the diagnosis unit 1850 diagnoses that the bearing 106 to be diagnosed is not in a state corresponding to the teacher base. ..
- the number of basis vectors belonging to the extraction basis extracted from the data matrix Y d (the number of columns of the extraction basis matrix Q, the number of rows of the extraction weight matrix W) is set to 1.
- the number of basis vectors belonging to the extraction basis extracted from the data matrix Y d may be two or more. In that case, in S2116, the diagnosis unit 1850 may perform the following.
- the diagnosis unit 1850 compares the elements in each column of each row of G and W, and identifies which is larger. Then, when the number of rows having the largest G element is equal to or larger than a predetermined threshold, the diagnosis unit 1850 diagnoses that the state of the bearing 106 to be diagnosed is a state corresponding to the teacher base. On the other hand, the diagnosis unit 1850 diagnoses that the state of the bearing 106 to be diagnosed is not the state corresponding to the teacher base when the number of rows having the largest G element is less than the predetermined threshold value.
- the diagnostic system generated the matrix Y d so as to store the non-negative data indicating the pattern of the coefficient ⁇ in each column.
- the diagnostic system may generate the matrix Y d so as to store the non-negative data indicating the pattern of the coefficient ⁇ in each row instead of each column.
- the diagnostic system may use, as the cost function J d , a function in which the part of “FG+QW ⁇ Y d ”in Expression 39 is replaced with “G T F T +W T Q T ⁇ Y d ”.
- the diagnostic system is configured to diagnose whether the bearing 106 to be diagnosed is in a normal state with no flaw. However, the diagnostic system diagnoses whether the bearing 106 to be diagnosed is in another state (for example, the outer ring has a specific flaw, the inner ring has a flaw, the rolling element has a flaw, etc.). It may be done.
- the diagnostic system uses the function J d represented by Expression 39 as the cost function.
- the diagnostic system may use another function as a cost function as long as it is a function that serves as an index for updating G, Q, and W.
- the diagnostic system may use the function represented by the reciprocal of the function J d represented by Expression 39 as the cost function. In that case, the diagnostic system optimizes (maximizes) the value of the cost function, and thus updates the values of G, Q, and W so that the value of the cost function increases. Then, when the cost function converges, the diagnostic system determines that the value of the cost function can be optimized (maximized), and acquires G, Q, and W at that time as the decomposition result of Y d .
- the minimization refers to minimizing the cost function J d in an optimization algorithm to derive a solution that minimizes the value of the cost function J d. That is, the minimization is not limited to obtaining the exact minimum value of the cost function. The same is true for maximization.
- the diagnostic system determines the matrix P and the matrix A when the cost function J is minimized.
- the diagnostic system may be as follows.
- the diagnostic system repeats updating the matrix P using Expression 30 and updating the matrix A using Expressions 34 and 35. Then, in each update stage, the diagnostic system obtains a matrix ⁇ P and a matrix ⁇ A which are differences obtained by subtracting the matrix P and the matrix A before the update from the matrix P and the matrix A after the update, respectively.
- the diagnostic system calculates the Frobenius norm of each of the matrix ⁇ P and the matrix ⁇ A.
- the diagnostic system is configured such that the ratio of the Frobenius norm of the matrix ⁇ P and the matrix ⁇ A at each updating stage to the Frobenius norm of the matrix ⁇ P and the matrix ⁇ A at the first updating stage is less than or equal to a predetermined threshold value. Then, it is assumed that the value of the cost function J has converged. Then, the diagnostic system obtains the matrix A and the matrix P at that time as a matrix that minimizes the cost function J.
- the diagnostic system repeats the update of G using Expression 46, the update of Q using Expression 52, and the update of W using Expression 58.
- the diagnostic system calculates the Frobenius norm of these matrices for ⁇ G, ⁇ Q, and ⁇ W, which are differences obtained by subtracting G, Q, and W before update from G, Q, and W after update, respectively. ..
- the diagnostic system has a cost function with an update stage in which the ratio of the Frobenius norm of ⁇ G, ⁇ Q, ⁇ W in each update stage to the Frobenius norm of ⁇ G, ⁇ Q, ⁇ W in the first update stage is less than or equal to a predetermined threshold value.
- the value of J d may be converged.
- the diagnostic system may obtain G, Q, and W when J d converges as a matrix that minimizes the cost function J d .
- Example 4 The inventors conducted the following experiment in the same experimental situation as the experiment 3. That is, an experiment similar to the experiment described in Experiment 3 for the bearing 106 in a normal state without flaws and the bearing 106 with a minute flaw in the outer ring shown in FIG. The values were changed for each of ⁇ 1 , ⁇ 2 , and ⁇ 2 of J d . In this experiment, the number of used eigenvalues s was set to 3. Moreover, m was set to 500.
- each of ⁇ 2 , ⁇ 1 , and ⁇ 2 was set to 0, and the value of ⁇ 1 was changed to 0, 0.00025, 0.0005, 0.00075, and 0.001, respectively.
- An experiment similar to the above experiment was performed.
- each of ⁇ 1 , ⁇ 2 , and ⁇ 1 was set to 0, and the value of ⁇ 2 was changed to 0, 0.025, 0.05, and 0.1, respectively, and the experiment described in Experiment 3 was performed. The same experiment was performed.
- ⁇ 1 is a coefficient related to the term of the constraint regarding the improvement of the sparsity of the teacher weight matrix G in the cost function J d .
- the constraint regarding improvement of sparseness is referred to as sparse constraint. That is, the value of ⁇ 1 is a coefficient indicating the degree of the sparse constraint of G in the decomposition of Y d .
- FIGS. 22A to 22E show the experimental results of the bearing 106 in which the outer ring has minute flaws. Further, FIGS. 23A to 23E show the experimental results of the bearing 106 in a normal state.
- the graphs of FIGS. 22A to 22E and FIGS. 23A to 23E are graphs showing G and W obtained as a result of decomposition of the data matrix Y d .
- the horizontal axis indicates the indexes of the G and W columns.
- the vertical axis represents the values of the elements in the columns corresponding to G and W.
- the graphs of FIG. 22A and FIG. 23A are graphs showing experimental results when ⁇ 1 is 0.
- the graphs of FIGS. 22B and 23B are graphs showing the experimental results when ⁇ 1 is 0.00025.
- the graphs of FIG. 22C and FIG. 23C are graphs showing experimental results when ⁇ 1 is 0.0005.
- the graphs of FIG. 22D and FIG. 23D are graphs showing the experimental results when ⁇ 1 is 0.00075.
- the graphs of FIGS. 22E and 23E are graphs showing the experimental results when ⁇ 1 is 0.001.
- ⁇ 1 is 0.00025, 0.0005, and 0.00075. It was From this, the inventors have found that an appropriate value of ⁇ 1 is a value in the range of 0.00025 or more and 0.00075 or less.
- ⁇ 2 is a coefficient related to the sparse constraint term of the extraction weight matrix W in the cost function J d . That is, the value of ⁇ 2 is a coefficient indicating the degree of the sparse constraint of W in the decomposition of Y d .
- FIGS. 24A to 24D show the experimental results of the bearing 106 in which the outer ring has minute flaws. Further, FIGS. 25A to 25D show experimental results of the bearing 106 in a normal state.
- the graphs of FIGS. 24A to 24D and FIGS. 25A to 25D are graphs showing G and W obtained as a result of decomposition of the data matrix Y d .
- the horizontal axis indicates the indexes of the G and W columns.
- the vertical axis represents the values of the elements in the columns corresponding to G and W.
- the graphs in FIGS. 24A and 25A are graphs showing the experimental results when ⁇ 2 is 0.
- the graphs of FIGS. 24B and 25B are graphs showing the experimental results when ⁇ 2 is 0.00005.
- the graphs of FIGS. 24C and 25C are graphs showing the experimental results when ⁇ 2 is 0.00025.
- the graphs in FIGS. 24D and 25D are graphs showing the experimental results when ⁇ 2 is 0.0005.
- ⁇ 2 is 0.00025 and 0.0005, respectively. From this, the inventors have found that an appropriate value of ⁇ 2 is a value in the range of 0 or more and 0.00005 or less (preferably 0 or more and less than 0.00005).
- epsilon 2 is a coefficient according to the term of the constraints on improving the orthogonality between the teacher base extraction basis of the cost function J d.
- the constraint regarding the improvement of orthogonality is referred to as an orthogonal constraint. That is, the value of ⁇ 2 is a coefficient indicating the degree of orthogonal constraint between F and Q in the decomposition of Y d .
- FIGS. 26A to 26D show the experimental results of the bearing 106 in the state where the outer ring has minute flaws.
- 27A to 27D show the experimental results of the bearing 106 in a normal state.
- the graphs of FIGS. 26A to 26D and FIGS. 27A to 27D are graphs showing G and W obtained as a result of decomposition of the data matrix Y d .
- the horizontal axis indicates the indexes of the G and W columns.
- the vertical axis represents the values of the elements in the columns corresponding to G and W.
- the graphs of FIGS. 26A and 27A are graphs showing experimental results when ⁇ 2 is 0.
- the graphs of FIGS. 26B and 27B are graphs showing the experimental results when ⁇ 2 is 0.025.
- the graphs of FIG. 26C and FIG. 26C are graphs showing experimental results when ⁇ 2 is 0.05.
- the graphs in FIGS. 26D and 27D are graphs showing the experimental results when ⁇ 2 is 0.1.
- the system configuration of the diagnostic system of this embodiment is the same as that of the first embodiment. Further, the hardware configuration and the functional configuration of the information processing device 1800 are the same as those in the first embodiment.
- At least one of ⁇ 1 , ⁇ 2 , ⁇ 1 , and ⁇ 2 is used instead of the cost function J d in which the diagnostic system has ⁇ 1 , ⁇ 2 , ⁇ 1 , and ⁇ 2 all 0.
- the process is the same as that of the first embodiment described with reference to FIGS. 20 and 21, except that the cost function J d that is not 0 is used.
- the value of ⁇ 1 is a predetermined value (for example, 0.00025, 0.0005) from an appropriate value range found by experiments (range of 0.00025 or more and 0.00075 or less). , 0.00075).
- the value of ⁇ 2 is a predetermined value (for example, 0, 0.000025, 0.00005, etc.) from an appropriate value range (range of 0 or more and 0.00005 or less) found by the experiment. is there.
- the value of ⁇ 2 is a predetermined value (for example, 0, 0.01, 0.025, etc.) from an appropriate value range (range of 0 or more and 0.025 or less) found by the experiment. is there.
- the value of ⁇ 1 is a predetermined value (for example, 0).
- the cost function J d at least one non-zero of the epsilon 2 are, ⁇ 1, ⁇ 2, ⁇ 1, the function obtained by adding the constraints corresponding to the non-zero coefficients of the epsilon 2 Becomes Therefore, the cost function J d in which at least one of ⁇ 1 , ⁇ 2 , ⁇ 1 , and ⁇ 2 is not 0 is a sparse constraint for the teacher weight matrix G, a sparse constraint for the extraction weight matrix, an orthonormal constraint of the extraction basis. , And at least one of the orthogonal constraints between the teacher basis and the extraction basis.
- the diagnostic system can more accurately diagnose whether the bearing 106 to be diagnosed is in a predetermined state.
- the modified example described in the first embodiment can be adopted.
- the information processing device 1800 implements the processing of FIGS. 20 and 21 by executing the program stored in the auxiliary storage device 1902.
- the information processing device 1800 may implement the processing of FIGS. 20 and 21 by executing a program stored in an external storage medium, an external storage server, or the like.
- the functions of the information processing device 1800 described above may be implemented as hardware in the information processing device 1800.
- all the embodiments of the present invention described above are merely examples of embodying the present invention, and the technical scope of the present invention should not be limitedly interpreted by these. It is a thing. That is, the present invention can be implemented in various forms without departing from its technical idea or its main features.
- the present invention can be used, for example, for diagnosing the state of an object that makes a periodic motion.
Landscapes
- Physics & Mathematics (AREA)
- General Physics & Mathematics (AREA)
- Acoustics & Sound (AREA)
- Testing Of Devices, Machine Parts, Or Other Structures Thereof (AREA)
Abstract
物体の周期的な運動に係る計測データに基づいて、修正された自己回帰モデルにおける係数である修正係数を、予め定められた個数だけ決定し、決定された修正係数それぞれのパターンを示す非負値のデータが格納されたデータ行列を、予め定められた状態に対応する修正係数のパターンを示すデータを格納する非負値の行列である教師基底行列と、データ行列における教師基底の重みを示す非負値の行列である教師重み行列と、データ行列から抽出される基底を格納する非負値の行列である抽出基底行列と、データ行列における抽出基底の重みを示す非負値の行列である抽出重み行列と、に分解し、教師重み行列と、抽出重み行列と、に基づいて、物体が予め定められた状態であるか否かを診断する。
Description
本発明は、情報処理装置、情報処理方法及びプログラムに関する。本願は、2019年1月9日に日本に出願された特願2019-2055号に基づき優先権を主張し、それらの内容を全てここに援用する。
周期的な運動を行う物体の診断を行う技術として、運動を行っている物体から得られる信号を計測し、その信号の特徴量を算出し、その特徴量から物体の診断を行う方法がある。特許文献1には、信号の周波数特性を自己回帰モデルで同定することで、より高精度なスペクトル特性を取得する技術が開示されている。特許文献2には、以下の技術が開示されている。まず、物体の周期的な運動から計測された計測データから、自己相関行列を生成する。自己相関行列を特異値分解することにより得られた固有値のうち、最大のものから設定された数を用いて、計測データを近似する修正された自己回帰モデルの係数を決定する。決定した係数から、修正された自己回帰モデルの周波数特性を求める。求めた周波数特性に基づいて、軸受の異常を診断する。
周期的な運動を行う物体が予め定められた状態であるか否かをより精度よく診断したいという要望がある。特許文献1、2等の従来技術では、この要望を満たすことができなかった。
本発明は、以上のような問題点に鑑みてなされたものであり、周期的な運動を行う物体が予め定められた状態であるか否かをより精度よく診断することを目的とする。
本発明は、以上のような問題点に鑑みてなされたものであり、周期的な運動を行う物体が予め定められた状態であるか否かをより精度よく診断することを目的とする。
本発明の情報処理装置は、周期的な運動を行う物体の前記周期的な運動に係る計測データを取得する取得手段と、前記取得手段により取得された前記計測データに基づいて、修正された自己回帰モデルにおける係数である修正係数を、予め定められた個数だけ決定する決定手段と、前記決定手段により決定された前記個数の前記修正係数それぞれのパターンを示す非負値のデータが格納されたデータ行列を、教師基底行列と、教師重み行列と、抽出基底行列と、抽出重み行列と、に分解する分解手段と、前記分解手段により前記データ行列が分解された前記教師重み行列と、前記抽出重み行列と、に基づいて、前記物体が前記予め定められた状態であるか否かを診断する診断手段と、を有し、前記修正された自己回帰モデルは、前記計測データの実績値と、前記実績値に対する前記修正係数と、を用いて、前記計測データの予測値を表す式であり、前記決定手段は、前記計測データから導出される自己相関行列を特異値分解することで導出される前記自己相関行列の固有値を対角成分とする対角行列と、前記自己相関行列の固有ベクトルを列成分とする直交行列と、から導出される第1の行列を係数行列とし、前記計測データから導出される自己相関ベクトルを定数ベクトルとする方程式を用いて、前記修正係数を決定し、前記自己相関ベクトルは、時差が1から前記修正された自己回帰モデルで用いられる前記実績値の数であるmまでの前記計測データの自己相関を成分とするベクトルであり、前記自己相関行列は、時差が0からm-1までの前記計測データの自己相関を成分とする行列であり、前記第1の行列は、1以上且つm未満の設定された数であるsに対して、前記自己相関行列のs個の固有値と前記対角行列とから導出される第2の行列Σsと、前記s個の固有値と前記直交行列とから導出される第3の行列Usと、から導出される行列UsΣsUs
Tであり、前記第2の行列は、前記対角行列の部分行列であって、前記s個の固有値を対角成分とする行列であり、前記第3の行列は、前記直交行列の部分行列であって、前記s個の固有値に対応する固有ベクトルを列成分ベクトルとする行列であり、前記教師基底行列は、教師基底を格納する非負値の行列であり、前記教師重み行列は、前記教師基底の重みを示す非負値の行列であり、前記抽出基底行列は、抽出基底を格納する非負値の行列であり、前記抽出重み行列は、前記抽出基底の重みを示す非負値の行列であり、前記教師基底は、前記物体の予め定められた状態に対応する前記修正係数のパターンを示す基底ベクトルの集合であり、前記抽出基底は、前記物体の予め定められた状態に対応する前記修正係数のパターン以外の前記修正係数のパターンを示す基底ベクトルの集合であり、前記分解手段は、前記教師基底行列と前記教師重み行列との積と前記抽出基底行列と前記抽出重み行列との積との和と、前記データ行列と、の差分に関するコスト関数の値を適正化するように、前記教師重み行列と前記抽出基底行列と前記抽出重み行列との値を更新することで、前記データ行列を、前記教師基底行列と前記教師重み行列と前記抽出基底行列と前記抽出重み行列とに分解する。
本発明の情報処理方法は、情報処理装置が実行する情報処理方法であって、周期的な運動を行う物体の前記周期的な運動に係る計測データを取得する取得ステップと、前記取得ステップで取得された前記計測データに基づいて、修正された自己回帰モデルにおける係数である修正係数を、予め定められた個数だけ決定する決定ステップと、前記決定ステップで決定された前記個数の前記修正係数それぞれのパターンを示す非負値のデータが格納されたデータ行列を、教師基底行列と、教師重み行列と、抽出基底行列と、抽出重み行列と、に分解する分解ステップと、前記分解ステップでの分解により前記データ行列が分解された前記教師重み行列と、前記抽出重み行列と、に基づいて、前記物体が前記予め定められた状態であるか否かを診断する診断ステップと、を含み、前記修正された自己回帰モデルは、前記計測データの実績値と、前記実績値に対する前記修正係数と、を用いて、前記計測データの予測値を表す式であり、前記決定ステップでは、前記計測データから導出される自己相関行列を特異値分解することで導出される前記自己相関行列の固有値を対角成分とする対角行列と、前記自己相関行列の固有ベクトルを列成分とする直交行列と、から導出される第1の行列を係数行列とし、前記計測データから導出される自己相関ベクトルを定数ベクトルとする方程式を用いて、前記修正係数を決定し、前記自己相関ベクトルは、時差が1から前記修正された自己回帰モデルで用いられる前記実績値の数であるmまでの前記計測データの自己相関を成分とするベクトルであり、前記自己相関行列は、時差が0からm-1までの前記計測データの自己相関を成分とする行列であり、前記第1の行列は、1以上且つm未満の設定された数であるsに対して、前記自己相関行列のs個の固有値と前記対角行列とから導出される第2の行列Σsと、前記s個の固有値と前記直交行列とから導出される第3の行列Usと、から導出される行列UsΣsUs
Tであり、前記第2の行列は、前記対角行列の部分行列であって、前記s個の固有値を対角成分とする行列であり、前記第3の行列は、前記直交行列の部分行列であって、前記s個の固有値に対応する固有ベクトルを列成分ベクトルとする行列であり、前記教師基底行列は、教師基底を格納する非負値の行列であり、前記教師重み行列は、前記教師基底の重みを示す非負値の行列であり、前記抽出基底行列は、抽出基底を格納する非負値の行列であり、前記抽出重み行列は、前記抽出基底の重みを示す非負値の行列であり、前記教師基底は、前記物体の予め定められた状態に対応する前記修正係数のパターンを示す基底ベクトルの集合であり、前記抽出基底は、前記物体の予め定められた状態に対応する前記修正係数のパターン以外の前記修正係数のパターンを示す基底ベクトルの集合であり、前記分解ステップでは、前記教師基底行列と前記教師重み行列との積と前記抽出基底行列と前記抽出重み行列との積との和と、前記データ行列と、の差分に関するコスト関数の値を適正化するように、前記教師重み行列と前記抽出基底行列と前記抽出重み行列との値を更新することで、前記データ行列を、前記教師基底行列と前記教師重み行列と前記抽出基底行列と前記抽出重み行列とに分解する。
本発明のプログラムは、周期的な運動を行う物体の前記周期的な運動に係る計測データを取得する取得ステップと、前記取得ステップで取得された前記計測データに基づいて、修正された自己回帰モデルにおける係数である修正係数を、予め定められた個数だけ決定する決定ステップと、前記決定ステップで決定された前記個数の前記修正係数それぞれのパターンを示す非負値のデータが格納されたデータ行列を、教師基底行列と、教師重み行列と、前抽出基底行列と、抽出重み行列と、に分解する分解ステップと、前記分解ステップでの分解により前記データ行列が分解された前記教師重み行列と、前記抽出重み行列と、に基づいて、前記物体が前記予め定められた状態であるか否かを診断する診断ステップと、を含むステップをコンピュータに実行させ、前記修正された自己回帰モデルは、前記計測データの実績値と、前記実績値に対する前記修正係数と、を用いて、前記計測データの予測値を表す式であり、前記決定ステップでは、前記計測データから導出される自己相関行列を特異値分解することで導出される前記自己相関行列の固有値を対角成分とする対角行列と、前記自己相関行列の固有ベクトルを列成分とする直交行列と、から導出される第1の行列を係数行列とし、前記計測データから導出される自己相関ベクトルを定数ベクトルとする方程式を用いて、前記修正係数を決定し、前記自己相関ベクトルは、時差が1から前記修正された自己回帰モデルで用いられる前記実績値の数であるmまでの前記計測データの自己相関を成分とするベクトルであり、前記自己相関行列は、時差が0からm-1までの前記計測データの自己相関を成分とする行列であり、前記第1の行列は、1以上且つm未満の設定された数であるsに対して、前記自己相関行列のs個の固有値と前記対角行列とから導出される第2の行列Σsと、前記s個の固有値と前記直交行列とから導出される第3の行列Usと、から導出される行列UsΣsUs
Tであり、前記第2の行列は、前記対角行列の部分行列であって、前記s個の固有値を対角成分とする行列であり、前記第3の行列は、前記直交行列の部分行列であって、前記s個の固有値に対応する固有ベクトルを列成分ベクトルとする行列であり、前記教師基底行列は、教師基底を格納する非負値の行列であり、前記教師重み行列は、前記教師基底の重みを示す非負値の行列であり、前記抽出基底行列は、抽出基底を格納する非負値の行列であり、前記抽出重み行列は、前記抽出基底の重みを示す非負値の行列であり、前記教師基底は、前記物体の予め定められた状態に対応する前記修正係数のパターンを示す基底ベクトルの集合であり、前記抽出基底は、前記物体の予め定められた状態に対応する前記修正係数のパターン以外の前記修正係数のパターンを示す基底ベクトルの集合であり、前記分解ステップでは、前記教師基底行列と前記教師重み行列との積と前記抽出基底行列と前記抽出重み行列との積との和と、前記データ行列と、の差分に関するコスト関数の値を適正化するように、前記教師重み行列と前記抽出基底行列と前記抽出重み行列との値を更新することで、前記データ行列を、前記教師基底行列と前記教師重み行列と前記抽出基底行列と前記抽出重み行列とに分解する。
<実施形態1>
以下、本発明の一実施形態について図面に基づいて説明する。
以下、本発明の一実施形態について図面に基づいて説明する。
(本実施形態の処理の概要)
本実施形態では、診断システムが鉄道台車に利用される軸受から計測された振動の信号に基づいて、その軸受の状態を診断する。
診断システムは、軸受の振動に応じた信号を計測する。診断システムは、計測された信号を自己回帰モデルで表現し、自己回帰モデルの係数に関する条件式における行列を特異値分解し、その行列の固有値を求める。診断システムは、求めた固有値のうち最大のものから設定された数のみを用いて、自己回帰モデルの係数を決定する。そして、診断システムは、決定した係数のパターンに基づいて、軸受の状態を診断する。
本実施形態では、診断システムが鉄道台車に利用される軸受から計測された振動の信号に基づいて、その軸受の状態を診断する。
診断システムは、軸受の振動に応じた信号を計測する。診断システムは、計測された信号を自己回帰モデルで表現し、自己回帰モデルの係数に関する条件式における行列を特異値分解し、その行列の固有値を求める。診断システムは、求めた固有値のうち最大のものから設定された数のみを用いて、自己回帰モデルの係数を決定する。そして、診断システムは、決定した係数のパターンに基づいて、軸受の状態を診断する。
(実験1)
鉄道台車に利用されている軸受の状態診断精度の評価のために行った実験について説明する。
図1Aは、本実験の状況を説明する図である。図1Aの状況は、実験室に鉄道台車における車輪の駆動機構が設置されている状況である。駆動モータ101は、駆動モータ軸102、歯車継手103、小歯車軸100を介して、小歯車105を回転させる。小歯車105は、回転することで、大歯車107を回転させる。それに合わせて、車軸109が回転し、車軸109に接続される車輪が回転することになる。本実験では、車軸109には、車輪の代わりにダイナモ110が接続されている。ダイナモ110は、疑似的な走行負荷を与えるために接続されている発電機である。本実験では、ダイナモ110を回転させるための負荷を、走行の際の負荷として想定する。
小歯車105が嵌められた小歯車軸100と大歯車107が嵌められた車軸109とは、歯車箱104に固定されている。そして、歯車箱104には、小歯車軸との間に軸受106が装着されており、車軸109との間に軸受108が装着されている。図1Bは、歯車箱104に取り付けられている軸受106、108を側面から見た様子を示す図である。
歯車箱104上の振動計測位置111は、振動計測装置が設置される位置である。振動計測装置は、加速度センサ、レーザ変位計等のセンサを含み、センサを介して物体の振動を検知し、検知した振動に応じた信号を出力する。振動計測位置111に設置された振動計測装置が振動計測位置111に伝達される振動を計測する。振動計測装置は、計測した振動を示す信号を外部の情報処理装置等に有線又は無線による通信を介して出力する。振動計測装置の計測周波数は、204800Hzである。ただし、他の例として、振動計測装置の計測周波数は、409600Hz、102400Hz等の他の周波数であることとしてもよい。本実験では、振動計測装置は、振動計測位置111に設置されるとするが、軸受106に起因する振動が伝達される位置であるならば、任意の位置に設置することとしてもよい。
ここで、軸受106について、説明する。図2は、軸受106の一例の構成を説明する図である。軸受106は、外輪、内輪、転動体、保持器の4つの部分から構成される。図2には、軸受106の外輪、内輪、転動体、保持器の概要が示されている。軸受106は、外輪と内輪との間に保持器により保持された転動体が挟まれる構成となっている。
本実験では、小歯車105に装着されている軸受106として、疵のない正常な軸受、内輪に疵のある軸受、保持器に疵のある軸受のそれぞれを利用した。それぞれの軸受106毎に、駆動モータ101を駆動させ、振動計測位置111に設置された振動計測装置が振動を計測することで、軸受106の状態診断を行うための計測データを取得した。本実験では、駆動モータ101は、軸受106の内輪の回転数が2954.7rpm(round per minute)となるように駆動した。
本実験では、小歯車105に装着されている軸受106として、疵のない正常な軸受、内輪に疵のある軸受、保持器に疵のある軸受のそれぞれを利用した。それぞれの軸受106毎に、駆動モータ101を駆動させ、振動計測位置111に設置された振動計測装置が振動を計測することで、軸受106の状態診断を行うための計測データを取得した。本実験では、駆動モータ101は、軸受106の内輪の回転数が2954.7rpm(round per minute)となるように駆動した。
以上のように、軸受106が正常な場合、軸受106の内輪に疵がある場合、軸受106の保持器に疵がある場合、軸受106の転動体に疵がある場合、軸受106の外輪に疵がある場合について、振動計測位置111における振動の計測データを取得した。
次に、振動計測装置が計測した計測データを用いた軸受106の状態診断の方法を説明する。以下では、振動計測装置が計測した計測データを、計測データyとする。
本実験では、計測データyを、修正された自己回帰モデルで近似し、この修正された自己回帰モデルの係数から特徴量を算出することとした。
ある時刻k(k:1≦k≦Mの整数)における計測データyの値をykとする。Mは、計測データyがどの時刻までのデータを含むかを示す数であり、予め設定されている。Mは、例えば、後述する自己相関(式5で定義されるRjl)が統計量として十分な信頼性を得るように、事前に試行錯誤して決定すればよい。ykを近似する自己回帰モデルは、例えば、以下の式1のようになる。式1に示すように、自己回帰モデルとは、時系列データにおけるある時刻k(m+1≦k≦M)のデータの予測値y^k(式において^はyの上に付けて表記)を、時系列データにおけるその時刻よりも前の時刻k-l(1≦l≦m)のデータの実績値yk-lを用いて表す式である。

式1におけるαは、自己回帰モデルの係数である。また、mは、自己回帰モデルにおいてある時刻kにおける計測データyの値であるykを、その時刻よりも前の過去幾つのデータを用いて近似するかを示すM未満の整数である。ここでは、mを1500とする。
続いて、最小二乗法を用いて、自己回帰モデルによる予測値y^kが実測値であるykに近似するための条件式を求める。自己回帰モデルによる予測値y^kが実測値であるykに近似するための条件として、式1で与えられるy^kとykとの二乗誤差を最小化することを考える。即ち、本実験では、自己回帰モデルによる予測値y^kをykに近似するために最小二乗法を用いる。以下の式2は、計測データと自己回帰モデルによる予測値との二乗誤差を最小にするための条件式である。

式2より、以下の式3の関係を満たす。

また、式3を変形(行列表記)することで、以下の式4のようになる。

式4におけるRjlは計測データyの自己相関と呼ばれるもので、以下の式5で定義される値である。このときの|j-l|を時差という。

式4を基に、以下の自己回帰モデルの係数に関する関係式である式6を考える。式6は、自己回帰モデルによる計測データの予測値と、その予測値に対応する時刻における計測データと、の誤差を最小化する条件から導出される方程式である。式6は、ユール・ウォーカー(Yule-Walker)方程式と呼ばれるものである。また、式6は自己回帰モデルの係数から成るベクトルを変数ベクトルとする線形方程式である。式6における左辺の定数ベクトルは、時差が1からmまでの計測データの自己相関を成分とするベクトルである。以下では、式6における左辺の定数ベクトルを自己相関ベクトルとする。また、式6における右辺の係数行列は、時差が0からm-1までの計測データの自己相関を成分とする行列である。以下では、式6における右辺の係数行列を自己相関行列とする。

また、式6における右辺の自己相関行列(Rjlで構成されるm×mの行列)を、以下の式7のように、自己相関行列Rと表記する。

一般に、自己回帰モデルの係数を求める際には、式6を係数αについて解くという方法が用いられる。式6では、自己回帰モデルで導出されるある時刻kにおける計測データの予測値y^kが、その時刻kにおける計測データの実績値ykにできるだけ近づくように係数αが導出される。よって、自己回帰モデルの周波数特性に、各時刻における計測データの実績値ykに含まれる多数の周波数成分が含まれる。したがって、例えば、計測データyに含まれるノイズが多い場合には、軸受106の振動に係る信号を抽出できなかったり、軸受106の故障の態様に応じた特徴を抽出することができなかったりするという問題が生じる。
そこで、本発明者らは、自己回帰モデルの係数αに乗算される自己相関行列Rに着目し、鋭意検討した結果、自己相関行列Rの固有値の一部を用いて、計測データyに含まれるノイズの影響が低減され、軸受の振動に係る信号成分が強調される(SN比を高める)ように自己相関行列Rを書き換えればよいという着想に至った。
以下で、このことの具体例を説明する。
自己相関行列Rを特異値分解する。自己相関行列Rの成分は、対称であるので、自己相関行列Rを特異値分解すると以下の式8のように、直交行列Uと、対角行列Σと、直交行列Uの転置行列との積となる。
自己相関行列Rを特異値分解する。自己相関行列Rの成分は、対称であるので、自己相関行列Rを特異値分解すると以下の式8のように、直交行列Uと、対角行列Σと、直交行列Uの転置行列との積となる。
式8の行列Σは、式9に示すように、対角成分が自己相関行列Rの固有値となる対角行列である。対角行列Σの対角成分を、σ11、σ22、・・・、σmmとする。また、行列Uは、各列成分ベクトルが自己相関行列Rの固有ベクトルとなる直交行列である。直交行列Uの列成分ベクトルを、u1、u2、・・・、umとする。自己相関行列Rの固有ベクトルujに対する固有値がσjjという対応関係が有る。自己相関行列Rの固有値は、自己回帰モデルによる計測データの予測値の時間波形に含まれる各周波数の成分の強度に反映する変数である。

自己相関行列Rの特異値分解の結果得られる対角行列Σの対角成分であるσ11、σ22、・・・、σmmの値は、数式の表記を簡略にするために降順とする。これらの自己相関行列Rの固有値のうち、最大のものから1以上且つm未満の設定された数である使用固有値数s個の固有値を用いて、以下の式10のように、行列R’を定義する。行列R’は、自己相関行列Rの固有値のうち使用固有値数s個の固有値用いて自己相関行列Rを近似した行列である。

式10における行列Usは、式8の直交行列Uの左からs個の列成分ベクトル(使用される固有値に対応する固有ベクトル)により構成されるm×s行列である。つまり、行列Usは、直交行列Uから左のm×sの成分を切り出して構成される部分行列である。また、Us
TはUsの転置行列であり、式8の行列UTの上からs個の行成分ベクトルにより構成されるs×m行列である。式10における行列Σsは、式8の対角行列Σの左からs個の列と上からs個の行により構成されるs×s行列である。つまり、行列Σsは、対角行列Σから左上のs×sの成分を切り出して構成される部分行列である。
行列Σs及び行列Usを行列成分表現すれば、以下の式11のようになる。
行列Σs及び行列Usを行列成分表現すれば、以下の式11のようになる。

自己相関行列Rの代わりに行列R’を用いることで、式6の関係式を、以下の式12のように書き換える。

式12を変形することで、係数αを求める式13が得られる。式13によって求められた係数αを用いて、式1により予測値y^kを算出するモデルを「修正された自己回帰モデル」とする。
これまで対角行列Σの対角成分であるσ11、σ22、・・・、σmmの値を降順として説明したが、係数αの算出過程において対角行列Σの対角成分は降順である必要はない。対角行列Σの対角成分は降順でない場合には、行列Usは直交行列Uから左のm×sの成分を切り出すのではなく、使用される固有値に対応する列成分ベクトル(固有ベクトル)を切り出して構成される部分行列である。また、対角行列Σの対角成分は降順でない場合には、行列Σsは対角行列Σから左上のs×sの成分を切り出すのではなく、使用される固有値を対角成分とするように切り出される部分行列である。
式13は、修正された自己回帰モデルの係数の決定に利用される方程式である。式12、13の行列Usは、自己相関行列Rの特異値分解により得られる直交行列の部分行列であって、利用される固有値に対応する固有ベクトルを列成分ベクトルとする行列である第3の行列である。また、式12、13の行列Σsは、自己相関行列Rの特異値分解により得られる対角行列の部分行列であって、利用される固有値を対角成分とする行列である第2の行列である。そして、式12、13の行列UsΣsUs
Tは、行列Σsと行列Usとから導出される行列である第1の行列である。

式13の右辺を計算することにより、修正された自己回帰モデルの係数αが求まる。以上に、修正された自己回帰モデルの係数の導出方法の一例について説明してきたが、その基となる自己回帰モデルの係数の導出については直感的に分かり易いように予測値に対して最小二乗法を用いる方法で説明した。しかしながら、一般的には確率過程という概念を用いて自己回帰モデルを定義し、その係数を導出する方法が知られている。その場合に、自己相関は確率過程(母集団)の自己相関で表現される。この確率過程の自己相関は時差の関数として表されるものである。従って、本実施形態における計測データの自己相関は、確率過程の自己相関を近似するものであれば他の計算式で算出した値に代えても良い。例えば、R22~Rmmは時差が0の自己相関であるが、これらをR11に置き換えてもよい。
本実験では、以下の4つの場合のそれぞれについて、得られた計測データ毎に、式5と式7を用いて自己相関行列Rを求め、式8で表される特異値分解を行うことによって自己相関行列Rの固有値を求め、自己相関行列Rの固有値の分布を求めた。4つの場合は、軸受106が正常な場合、軸受106の内輪に疵がある場合、軸受106の保持器に疵がある場合、および軸受106の転動体に疵がある場合、軸受106の外輪に疵がある場合である。
次に、求めた係数αで特定される修正された自己回帰モデルの周波数特性を求める方法を説明する。
式1で与えられる計測データの予測値y^kの予測誤差xkが白色雑音になるという性質を使うと、修正された自己回帰モデルは白色雑音である予測誤差xkを入力とし、計測データの実測値ykを出力とする線形時不変システムとみなせる。従って、以下の手順で周波数特性の算出式を導出することができる。以下では、修正された自己回帰モデルを線形時不変モデルとみなしたものを、単にシステムと称することにする。予測誤差xkは、以下の式14で表される。
式1で与えられる計測データの予測値y^kの予測誤差xkが白色雑音になるという性質を使うと、修正された自己回帰モデルは白色雑音である予測誤差xkを入力とし、計測データの実測値ykを出力とする線形時不変システムとみなせる。従って、以下の手順で周波数特性の算出式を導出することができる。以下では、修正された自己回帰モデルを線形時不変モデルとみなしたものを、単にシステムと称することにする。予測誤差xkは、以下の式14で表される。

式14の両辺にz変換を施すと、以下の式15が得られる。

式15から、システムのインパルス応答のz変換である伝達関数H(z)は、以下の式16のように求まる。
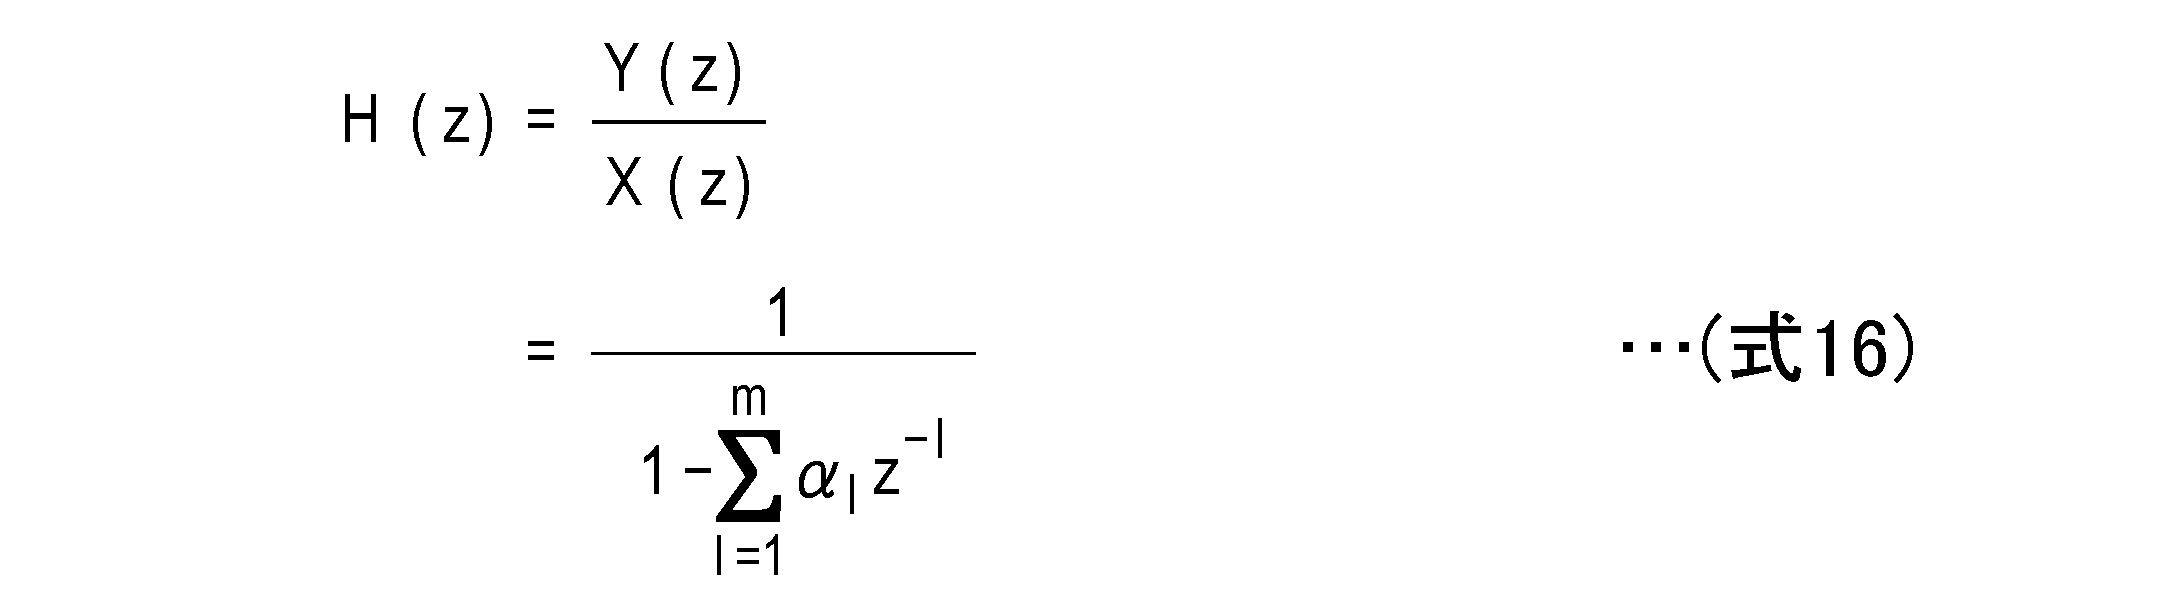
システムの周波数特性は、正弦波入力に対する出力の振幅と位相との変化として現れ、インパルス応答のフーリエ変換で求められる。言い換えると、zが複素平面の単位円上を回転した時の伝達関数H(z)が周波数特性となる。ここで、式16におけるzを、以下の式17のように置くことを考える。

その場合、H(z)の振幅特性(システムの周波数特性)は、以下の式18のように表すことができる。式18におけるωTは、0~2πの範囲で変化するものとする。

本実験では、得られた計測データ毎に、式5と式7を用いて自己相関行列Rを求め、式8で表される特異値分解を行うことによって自己相関行列Rの固有値を求め、自己相関行列Rの固有値の分布を求めた。また、得られた計測データ毎に、計測データの波形を求めた。また、得られた計測データ毎に、上記手順で求められた自己相関行列Rの特異値分解から式11を用いて行列Σsと行列Usとを求め、式5と式13を用いて修正された自己回帰モデルの係数αを求め、求めた係数αで特定される修正された自己回帰モデルの波形を求めた。そして、得られた計測データ毎に、式18を用いて、修正された自己回帰モデルの周波数特性等を求めた。
求められた実験結果を、図3A~図8Eを用いて説明する。
求められた実験結果を、図3A~図8Eを用いて説明する。
図3A~図3Eは、計測データそれぞれについて、上記手順で求められた自己相関行列Rの固有値の分布を示す図である。
図3Aのグラフは、軸受106に疵がない正常な軸受を用いた場合に計測された計測データを利用した際の自己相関行列Rの固有値の分布を示すグラフである。図3Bのグラフは、軸受106に内輪に疵がある軸受を用いた場合に計測された計測データを利用した際の自己相関行列Rの固有値の分布を示すグラフである。図3Cのグラフは、軸受106に保持器に疵がある軸受を用いた場合に計測された計測データを利用した際の自己相関行列Rの固有値の分布を示すグラフである。図3Dのグラフは、軸受106に転動体に疵がある軸受を用いた場合に計測された計測データを利用した際の自己相関行列Rの固有値の分布を示すグラフである。図3Eのグラフは、軸受106に外輪に疵がある軸受を用いた場合に計測された計測データを利用した際の自己相関行列Rの固有値の分布を示すグラフである。
図3Aのグラフは、軸受106に疵がない正常な軸受を用いた場合に計測された計測データを利用した際の自己相関行列Rの固有値の分布を示すグラフである。図3Bのグラフは、軸受106に内輪に疵がある軸受を用いた場合に計測された計測データを利用した際の自己相関行列Rの固有値の分布を示すグラフである。図3Cのグラフは、軸受106に保持器に疵がある軸受を用いた場合に計測された計測データを利用した際の自己相関行列Rの固有値の分布を示すグラフである。図3Dのグラフは、軸受106に転動体に疵がある軸受を用いた場合に計測された計測データを利用した際の自己相関行列Rの固有値の分布を示すグラフである。図3Eのグラフは、軸受106に外輪に疵がある軸受を用いた場合に計測された計測データを利用した際の自己相関行列Rの固有値の分布を示すグラフである。
図3A~図3Eの各グラフは、自己相関行列Rを特異値分解して得られた固有値σ11~σmmを昇順に並べ替え、プロットしたグラフであり、横軸が固有値のインデックス、縦軸が固有値の値を示す。
図3Aを見ると、他よりも顕著に高い値をもつ固有値が5つあるのが分かる。その5つの固有値の中でも特に2つの固有値が他の3つよりも高い値となっていることが分かる。
何れの場合にも、自己相関行列Rの固有値のうち値が他よりも顕著に高い固有値の数は、固有値全体の数よりも顕著に少ないことが分かる。
何れの場合にも、自己相関行列Rの固有値のうち値が他よりも顕著に高い固有値の数は、固有値全体の数よりも顕著に少ないことが分かる。
また、本実験では、得られた計測データ毎に、計測データの波形を求めた。
図4A~図4Eは、計測データそれぞれの波形を示す図である。
図4Aのグラフは、軸受106に疵がない正常な軸受を用いた場合に計測された計測データの波形を示すグラフである。図4Aのグラフでは、横軸が時間、縦軸が対応する時間における計測データの実績値を示す。図4Bのグラフは、軸受106に内輪に疵がある軸受を用いた場合に計測された計測データの波形を示すグラフである。図4Bのグラフでは、横軸が時間、縦軸が対応する時間における計測データの実績値を示す。図4Cのグラフは、軸受106に保持器に疵がある軸受を用いた場合に計測された計測データの波形を示すグラフである。図4Cのグラフでは、横軸が時間、縦軸が対応する時間における計測データの実績値を示す。図4Dのグラフは、軸受106に転動体に疵がある軸受を用いた場合に計測された計測データの波形を示すグラフである。図4Dのグラフでは、横軸が時間、縦軸が対応する時間における計測データの実績値を示す。図4Eのグラフは、軸受106に外輪に疵がある軸受を用いた場合に計測された計測データの波形を示すグラフである。図4Eのグラフでは、横軸が時間、縦軸が対応する時間における計測データの実績値を示す。
図4の各グラフを見ると、例えば、図4A及び図4Cが似通った波形をしているのが分かる。また、例えば、図4D及び図4Eが似通った波形をしているのも分かる。そのため、図4A~図4Eのグラフから軸受106に生じた異常の状態を診断することは困難である。
図5A~図5Eは、使用固有値数sを1として求められた係数αで特定される修正された自己回帰モデルで近似された計測データの波形を示す図である。
図5Aのグラフは、使用固有値数sを1として、軸受106に疵がない正常な軸受を用いた場合に計測された計測データから求められた係数αで特定される修正された自己回帰モデルで近似された計測データの波形を示すグラフである。図5Aのグラフでは、横軸が時間、縦軸が対応する時間における計測データの予測値を示す。図5Bのグラフは、使用固有値数sを1として、軸受106に内輪に疵がある軸受を用いた場合に計測された計測データから求められた係数αで特定される修正された自己回帰モデルで近似された計測データの波形を示すグラフである。図5Bのグラフでは、横軸が時間、縦軸が対応する時間における計測データの予測値を示す。図5Cのグラフは、使用固有値数sを1として、軸受106に保持器に疵がある軸受を用いた場合に計測された計測データから求められた係数αで特定される修正された自己回帰モデルで近似された計測データの波形を示すグラフである。図5Cのグラフでは、横軸が時間、縦軸が対応する時間における計測データの予測値を示す。図5Dのグラフは、使用固有値数sを1として、軸受106に転動体に疵がある軸受を用いた場合に計測された計測データから求められた係数αで特定される修正された自己回帰モデルで近似された計測データの波形を示すグラフである。図5Dのグラフでは、横軸が時間、縦軸が対応する時間における計測データの予測値を示す。図5Eのグラフは、使用固有値数sを1として、軸受106に外輪に疵がある軸受を用いた場合に計測された計測データから求められた係数αで特定される修正された自己回帰モデルで近似された計測データの波形を示すグラフである。図5Eのグラフでは、横軸が時間、縦軸が対応する時間における計測データの予測値を示す。
図5A~図5Eの各グラフは、図4A~図4Eの各グラフと比べると、ノイズ成分が低減されていることが分かる。
図5A~図5Eの各グラフは、図4A~図4Eの各グラフと比べると、ノイズ成分が低減されていることが分かる。
図6A~図6Eは、使用固有値数sを1として求められた係数αで特定される修正された自己回帰モデルの周波数特性を示す図である。図6A~図6Eの各グラフは、図5A~図5Eの各波形についての周波数特性を示すグラフである。
図6Aのグラフは、使用固有値数sを1として、軸受106に疵がない正常な軸受を用いた場合に計測された計測データから求められた係数αで特定される修正された自己回帰モデルについて、式18で求められた周波数特性を示すグラフである。図6Aのグラフでは、横軸が周波数、縦軸が信号強度を示す。図6Bのグラフは、使用固有値数sを1として、軸受106に内輪に疵がある軸受を用いた場合に計測された計測データから求められた係数αで特定される修正された自己回帰モデルについて、式18で求められた周波数特性を示すグラフである。図6Bのグラフでは、横軸が周波数、縦軸が信号強度を示す。図6Cのグラフは、使用固有値数sを1として、軸受106に保持器に疵がある軸受を用いた場合に計測された計測データから求められた係数αで特定される修正された自己回帰モデルについて、式18で求められた周波数特性を示すグラフである。図6Cのグラフでは、横軸が周波数、縦軸が信号強度を示す。図6Dのグラフは、使用固有値数sを1として、軸受106に転動体に疵がある軸受を用いた場合に計測された計測データから求められた係数αで特定される修正された自己回帰モデルについて、式18で求められた周波数特性を示すグラフである。図6Dのグラフでは、横軸が周波数、縦軸が信号強度を示す。図6Eのグラフは、使用固有値数sを1として、軸受106に外輪に疵がある軸受を用いた場合に計測された計測データから求められた係数αで特定される修正された自己回帰モデルについて、式18で求められた周波数特性を示すグラフである。る。図6Eのグラフでは、横軸が周波数、縦軸が信号強度を示す。
図6Aのグラフを見ると、周波数824Hzの部分にピークが立っているのが分かる。また、図6Bのグラフを見ると、周波数1649Hzの部分にピークが立っているのが分かる。また、図6Cのグラフを見ると、周波数1646Hzの部分にピークが立っているのが分かる。
図6Dのグラフを見ると、周波数19853Hzの部分にピークが立っているのが分かる。また、図6Eのグラフを見ると、周波数23007Hzの部分にピークが立っているのが分かる。
図6A~図6Eの各グラフにおけるピークが立っている周波数を見ると、軸受106に疵がない場合は、軸受106に疵がある場合に比べて低い周波数でピークが立っていることが分かる。即ち、使用固有値数sを1として、求められた係数αで特定される修正された自己回帰モデルの周波数特性から、軸受106における疵の有無を判断することが可能であることが分かる。また、図6Dよりも、図6Eの方が高い周波数であることが分かる。また、図6D~図6Eの各グラフにおけるピークが立っている周波数は、図6A~図6Cの各グラフにおけるピークが立っている周波数よりも顕著に高いことが分かる。そのため、使用固有値数sを1として、求められた係数αで特定される修正された自己回帰モデルの周波数特性から、軸受106の転動体又は外輪の疵の有無を判断することが可能であることが分かる。
以上より、自己相関行列Rの1個の固有値に基づいて求められた係数αで特定される修正された自己回帰モデルの周波数特性に基づいて、軸受106の状態診断を行うことができるという知見を得ることができた。
しかし、図6Bと図6Cとのグラフに示されるように、軸受106の内輪に疵がある場合と、軸受106の保持器に疵がある場合と、では、似通った値の周波数において周波数特性のピークが立っている。そのため、使用固有値数sを1として、求められた係数αで特定される修正された自己回帰モデルの周波数特性から、軸受106に内輪の又は保持器の疵の有無を判断することは可能であるが、内輪の疵であるか、保持器の疵であるか、両方の疵であるか、を判断することは困難である。
そこで、本実験では、更に、使用固有値数sの値を5に増やして、自己相関行列Rの固有値のうち、最大のものから5つを用いて係数αを求め、求めた係数αで特定される修正された自己回帰モデルの波形、周波数特性を求めた。
図7A~図7Eは、使用固有値数sを5として求められた係数αで特定される修正された自己回帰モデルの波形を示す図である。
図7Aのグラフは、使用固有値数sを5として、軸受106に疵がない正常な軸受を用いた場合に計測された計測データから求められた係数αで特定される修正された自己回帰モデルで近似された計測データの波形を示すグラフである。図7Aのグラフでは、横軸が時間、縦軸が対応する時間における計測データの予測値を示す。図7Bのグラフは、使用固有値数sを5として、軸受106に内輪に疵がある軸受を用いた場合に計測された計測データから求められた係数αで特定される修正された自己回帰モデルで近似された計測データの波形を示すグラフである。図7Bのグラフでは、横軸が時間、縦軸が対応する時間における計測データの予測値を示す。図7Cのグラフは、使用固有値数sを5として、軸受106に保持器に疵がある軸受を用いた場合に計測された計測データから求められた係数αで特定される修正された自己回帰モデルで近似された計測データの波形を示すグラフである。図7Cのグラフでは、横軸が時間、縦軸が対応する時間における計測データの予測値を示す。図7Dのグラフは、使用固有値数sを5として、軸受106に転動体に疵がある軸受を用いた場合に計測された計測データから求められた係数αで特定される修正された自己回帰モデルで近似された計測データの波形を示すグラフである。図7Dのグラフでは、横軸が時間、縦軸が対応する時間における計測データの予測値を示す。図7Eのグラフは、使用固有値数sを5として、軸受106に外輪に疵がある軸受を用いた場合に計測された計測データから求められた係数αで特定される修正された自己回帰モデルで近似された計測データの波形を示すグラフである。図7Eのグラフでは、横軸が時間、縦軸が対応する時間における計測データの予測値を示す。
図8A~図8Eは、使用固有値数sを5として求められた係数αで特定される修正された自己回帰モデルの周波数特性を示す図である。図8A~図8Eの各グラフは、図7A~図7Eの各波形についての周波数特性を示すグラフである。
図8Aのグラフは、使用固有値数sを5として、軸受106に疵がない正常な軸受を用いた場合に計測された計測データから求められた係数αで特定される修正された自己回帰モデルについて、式18で求められた周波数特性を示すグラフである。図8Aのグラフでは、横軸が周波数、縦軸が信号強度を示す。図8Bのグラフは、使用固有値数sを5として、軸受106に内輪に疵がある軸受を用いた場合に計測された計測データから求められた係数αで特定される修正された自己回帰モデルについて、式18で求められた周波数特性を示すグラフである。図8Bのグラフでは、横軸が周波数、縦軸が信号強度を示す。図8Cのグラフは、使用固有値数sを5として、軸受106に保持器に疵がある軸受を用いた場合に計測された計測データから求められた係数αで特定される修正された自己回帰モデルについて、式18で求められた周波数特性を示すグラフである。図8Cのグラフでは、横軸が周波数、縦軸が信号強度を示す。図8Dのグラフは、使用固有値数sを5として、軸受106に転動体に疵がある軸受を用いた場合に計測された計測データから求められた係数αで特定される修正された自己回帰モデルについて、式18で求められた周波数特性を示すグラフである。図8Dのグラフでは、横軸が周波数、縦軸が信号強度を示す。図8Eのグラフは、使用固有値数sを5として、軸受106に外輪に疵がある軸受を用いた場合に計測された計測データから求められた係数αで特定される修正された自己回帰モデルについて、式18で求められた周波数特性を示すグラフである。図8Eのグラフでは、横軸が周波数、縦軸が信号強度を示す。
図8Aのグラフを見ると、周波数821Hzと1047Hzの部分にピークが立っているのが分かる。また、図8Bのグラフを見ると、周波数1648Hz、2021Hz、6474Hzの部分にピークが立っているのが分かる。また、図8Cのグラフを見ると、周波数1646Hz、3291Hz、1746Hzの部分にピークが立っているのが分かる。図8Dのグラフを見ると、周波数19853Hzの部分にピークが立っているのが分かる。また、図8Eのグラフを見ると、周波数22785Hz、23020Hzの部分にピークが立っているのが分かる。
図8A~図8Eの各グラフにおけるピークと、図6A~図6Eの各グラフにおけるピークと、を見比べてみると、図6A~図6Eのグラフでピークが立っている周波数近辺においては、図8A~図8Eのグラフでもピークが立っているのが分かる。図8A~図8Eのグラフでは、更に、図6A~図6Eのグラフで見られなかったピークが見られるようになっている。
このように、係数αを求めるのに利用される自己相関行列Rの固有値を増やすことで、修正された自己回帰モデルによる予測値において、図6A~図6Eでピークが立っていた周波数以外の周波数の成分の信号強度が増加したことが分かる。即ち、係数αを求めるのに利用される自己相関行列Rの固有値は、求められた係数αで特定される修正された自己回帰モデルによる計測データの予測値の時間波形に含まれる各周波数の成分の強度と相関があることが見出された。
また、図8B、図8Cのグラフを見てみると、図6B、図6Cのグラフと同様に、1640Hz付近にピークが立っているのが分かる。しかし、図8Bでは、更に、2021Hz、6474Hzにおいてもピークが立っており、図8Cでは、更に、3291Hz、1746Hzにおいてもピークが立っていることが分かる。このように、図8B~図8Cでは、内輪に疵のある軸受106と保持器に疵のある軸受106とで、ピークが立っている周波数に顕著な違いが見て取れる。即ち、使用固有値数sを5にすることで、軸受の疵が、内輪の疵であるか、保持器の疵であるか、両方の疵であるか、を見分けることができる。
このように本発明者らは、使用固有値数sが1の場合には見分けることが困難であった疵の存在する部位を、使用固有値数sを増やすことで、見分けることができるようになるという知見を得た。一方で、本発明者らは、使用固有値数sを増やし過ぎると修正された自己回帰モデルが、実際の計測データに近づいていくことによって、軸受106の状態診断に有用でないノイズ成分等についても信号強度が増加されてしまい、式18で得られる周波数特性にもノイズ成分に起因するピークが生じるという知見を得た。即ち、自己相関行列Rの固有値のうち、相対的に値の高い一部の固有値を用いて係数αを求めることで、計測データに含まれる成分のうち、物体の状態診断に有用な成分を近似した修正された自己回帰モデルを求めることができると考えられる。
以上より、係数αを求めるのに利用される自己相関行列Rの固有値の数である使用固有値sを調整することで、より精度よく、軸受106の状態診断を行うことができるという知見を得ることができた。
(実験2)
また、発明者らは、実験1と同様の実験状況において、以下のような実験を行った。軸受106が疵のない正常な状態である場合、内輪に疵がある状態である場合、保持器に疵がある状態である場合、転動体に疵がある状態である場合、外輪に疵がある状態である場合それぞれについて、以下の作業をq回行った。qは50としたが、30や100等の他の値としてもよい。即ち、軸受106について、連続したM個の計測データを取得し、取得した連続したM個の計測データ毎に、式11を用いて行列Σsと行列Usとを求め、式5と式13を用いて修正された自己回帰モデルの係数αを求めた。使用固有値数sは、3とした。
また、発明者らは、実験1と同様の実験状況において、以下のような実験を行った。軸受106が疵のない正常な状態である場合、内輪に疵がある状態である場合、保持器に疵がある状態である場合、転動体に疵がある状態である場合、外輪に疵がある状態である場合それぞれについて、以下の作業をq回行った。qは50としたが、30や100等の他の値としてもよい。即ち、軸受106について、連続したM個の計測データを取得し、取得した連続したM個の計測データ毎に、式11を用いて行列Σsと行列Usとを求め、式5と式13を用いて修正された自己回帰モデルの係数αを求めた。使用固有値数sは、3とした。
これにより、軸受106が正常な状態である場合、内輪に疵がある状態である場合、保持器に疵がある状態である場合、転動体に疵がある状態である場合、外輪に疵がある状態である場合の5つの場合それぞれについて、q個の修正された自己回帰モデルの係数αを取得した。
軸受106が取り得る状態は、疵のない正常な状態、内輪に疵がある状態、保持器に疵がある状態、転動体に疵がある状態、および外輪に疵がある状態の5つの状態であるとする。以下では、軸受106が取り得る状態の数をpとする。pは、これらの5つの状態に対応して5とした。
図9は、軸受106が正常な状態である場合、内輪に疵がある状態である場合、保持器に疵がある状態である場合、転動体に疵がある状態である場合、軸受106の外輪に疵がある場合それぞれについての、上記手順で求められた係数αのパターンを示す図である。係数αのパターンとは、係数αの成分を並べた際の形状を示す情報である。mの値は、500とした。そのため、係数αは、α1~α500の500個の成分から成る。図9に示されるパターンそれぞれは、αi(1<=i<=500)をインデックスi順に並べたパターンである。このインデックスiは、式1において係数の成分がかかる計測データyの計測時点を示すインデックスとみなすことができる。即ち、図9に示されるパターンそれぞれは、係数αの各成分を、式1において各成分がかかる計測データyの計測時点に基づいて並べたパターンの一例である。
係数αのパターンには、例えば、係数αの成分をインデックス順に並べたベクトル、係数αの成分をインデックス順に予め定められた数(例えば、1等)ずつとばしに並べたベクトル、係数αの成分をインデックスと逆順に並べたベクトル等がある。また、係数αのパターンには、例えば、各成分に同じ値が加算された係数αの成分をインデックス順に並べたベクトル、各成分に同じ値が加算された係数αの成分をインデックス順に予め定められた数(例えば、1等)ずつとばしに並べたベクトル、各成分に同じ値が加算された係数αの成分をインデックスと逆順に並べたベクトル等がある。また、係数αのパターンには、例えば、各成分に同じ値が掛けられた係数αの成分をインデックス順に並べたベクトル、各成分に同じ値が掛けられた係数αの成分をインデックス順に予め定められた数(例えば、1等)ずつとばしに並べたベクトル、各成分に同じ値が掛けられた係数αの成分をインデックスと逆順に並べたベクトル等がある。また、係数αの成分を並べた際の形状を示す情報である係数αのパターンは、ベクトルでなく、係数αの成分を並べたグラフの画像であるとしてもよい。
図9に示されるパターンを見てみると、以下のようなことが見てとれる。軸受106の外輪に疵がある場合、q個の係数αのパターンそれぞれは、上下対称な2つの波線で囲まれた領域を示すようなパターンとなっている。また、軸受106の転動体に疵がある場合、q個の係数αのパターンそれぞれは、複数の波線が重なり合っているようなパターンとなっている。また、軸受106の内輪に疵がある場合、q個の係数αのパターンそれぞれは、4つのピークのある山形のパターンが連続しているパターンとなっている。また、軸受106に疵がない場合、q個の係数αのパターンそれぞれは、徐々に減衰していく波型のパターンとなっている。また、軸受106の保持器に疵がある場合、q個の係数αのパターンそれぞれは、2つのピークのある山形のパターンが連続しているパターンとなっている。
このように、軸受106が正常な場合、軸受106の内輪に疵がある場合、軸受106の保持器に疵がある場合、軸受106の転動体に疵がある場合、軸受106の外輪に疵がある場合それぞれについて、修正された自己回帰モデルの係数αが、特徴的なパターンを示すことが見て取れる。
そこで、発明者らは、修正された自己回帰モデルの係数αのパターンが、どのようなパターンを示すのかを特定することで、軸受106の診断を行うことができるという知見を得た。
また、本実験では、以下のようにして、軸受106が正常な場合、軸受106の内輪に疵がある場合、軸受106の保持器に疵がある場合、軸受106の転動体に疵がある場合、軸受106の外輪に疵がある場合それぞれについて、修正された自己回帰モデルの係数αの代表的なパターンを学習により特定した。
まず、各列が図9に示される係数αそれぞれを示すm×dのサイズの行列Yを、以下の式19のように生成する。dは、p×qであり、250となる。

式19のαk,(i,j)は、iに対応する状態の軸受106から計測されたq個の計測データのうちj番目の計測データから決定された係数αの第k成分αkを示す。本実験では、外輪に疵がある状態の軸受106から計測された計測データから決定された係数αの成分は、式19におけるαk,(0,j)(1<=k<=m、1<=j<=q)である。また、転動体に疵がある状態の軸受106から計測された計測データから決定された係数αの成分は、式19におけるαk,(1,j)(1<=k<=m、1<=j<=q)である。また、内輪に疵がある状態の軸受106から計測された計測データから決定された係数αの成分は、式19におけるαk,(2,j)(1<=k<=m、1<=j<=q)である。また、疵がない正常な状態の軸受106から計測された計測データから決定された係数αの成分は、式19におけるαk,(3,j)(1<=k<=m、1<=j<=q)である。また、保持器に疵がある状態の軸受106から計測された計測データから決定された係数αの成分は、式19におけるαk,(4,j)(1<=k<=m、1<=j<=q)である。ここでは、pは5である。式19では、表記の都合で、αk,(4,j)をαk,(p-1,j)とする。また、式19では、αk,(2,j)およびαk,(3,j)の表記を省略する。
本実験では、この行列Yを非負値行列因子分解することで、軸受106の状態それぞれについて、修正された自己回帰モデルの係数αの代表的なパターンを特定する。行列Yを非負値行列因子分解するためには、行列Yの各列の係数αのパターンを変えずに、行列Y自体の各成分を、非負値にするよう調整する必要がある。そこで、例えば、行列Yの0未満の成分のうち、最小のものの絶対値を、行列Yの各成分に加算することで、行列Yの各成分が非負値となるようにする。以下では、各成分が非負値である行列を、非負値行列とする。
以下の式20に示すように、この行列Yを、非負値行列である行列Aと行列Pとに非負値行列因子分解する。行列Aは、m×pのサイズの行列である。行列Pは、p×dのサイズの行列である。行列Aの列数は、非負値行列因子分解における基底ベクトルの数であり、本実験では、軸受106が取り得る状態の数としてp(5)とする。これにより、行列Aの各列には、行列Yから導出されたp(5)個の係数αのパターン(基底ベクトルともいう)が格納されることとなる。
以下の式21のようにコスト関数Jを定義する。

式21の右辺第1項は、行列Aと行列Pとの積と、行列Yと、が、これらの残差の二乗和を最小にするという意味で近似的に一致するための条件を示す。式21の右辺第1項の右下のFr記号は、フロベニウスノルムであることを示す記号である。即ち、式21の右辺第1項内の||AP-Y||は、フロベニウスノルムであり、行列(AP-Y)の各成分の絶対値の2乗の合計の平方根となる。式21の右辺第2項は、行列Pのスパース性を要求する条件を示す。この条件を付加することによって、非負値行列因子分解が過学習となることを防ぐことができる。
式21の右辺第2項におけるインデックスiは、行列の行を示すインデックスである。また、式21の右辺第2項におけるインデックスkは、行列の列を示すインデックスである。式21の右辺第3項は、行列Aの異なる列に格納されるパターン同士の直交性を近似的に要求する条件を示す。式21の右辺第3項によって、行列Aのp(5)個の列に格納されるパターンが可能な限り線形従属となることを防ぐ効果が得られる。行列Aの列に格納されるパターンが線形従属となれば、あるパターンを行列Aの列に格納されるパターンの線形結合で近似するときの係数(重みともいう)が一通りではなくなるため、パターンの同定が難しくなる。また、式21の右辺第3項における行列ATは、行列Aの転置行列であり、行列Iは、単位行列である。また、式21の右辺第3項におけるインデックスk、k-(式中では、上にバーが引かれたkとして表現)は、それぞれ行列の行と、列と、を示すインデックスである。
ここで、コスト関数Jとして、式21の右辺第1項のみを用いても、非負値行列因子分解は機能するので、コスト関数Jとして、式21の右辺第1項のみを用いてもよい。また、上述の過学習や線形従属といった問題が生じる場合に、コスト関数Jとして、式21の右辺第1項に式21の右辺第2項、第3項を追加した式を用いることとしてもよい。そして、右辺第2項、第3項を追加する場合、軸受106の各状態と、図14A~図14B等で後述する方法で決定される学習パターンと、を良好に対応付けることが出来るように、例えば、ケーススタディにより係数βと係数γとを予め決定しておく。本実施形態では、βを0.035、γを0とした。
このコスト関数Jを最小化するように、行列Yを、行列Aと行列Pと分解する。即ち、以下の式22で定義されるコスト関数Jの最小化問題を解くこととなる。

式22における第1の制約条件は、行列Aと行列Pとが非負値行列であることを示す条件である。式22における第2の制約条件は、行列Aを基準化(normalize)するための条件である。また、式22の第2の制約条件におけるインデックスkは、行列の行と、列と、を示すインデックスである。
本実験では、コスト関数Jを最小化するために、以下のような処理を行う。即ち、以下の式23と式24とを用いて行列Aと行列Pとの更新を繰り返すことで、コスト関数Jを最小化する。また、コスト関数Jを最小化するために、以下に記載する方法以外の方法(例えば、最急降下法、ニュートン法、確率的勾配降下法等の最適化手法)を用いてもよい。
本実験では、コスト関数Jを最小化するために、以下のような処理を行う。即ち、以下の式23と式24とを用いて行列Aと行列Pとの更新を繰り返すことで、コスト関数Jを最小化する。また、コスト関数Jを最小化するために、以下に記載する方法以外の方法(例えば、最急降下法、ニュートン法、確率的勾配降下法等の最適化手法)を用いてもよい。


式23のηPは、行列Pの更新に用いられる緩和係数である。式24のηAは、行列Aの更新に用いられる緩和係数である。
式23におけるコスト関数Jの行列Pによる偏微分は、以下の式25の通りとなる。
式23におけるコスト関数Jの行列Pによる偏微分は、以下の式25の通りとなる。

式25の行列E1は、サイズがp×dの全ての成分が1の行列である。
式24におけるコスト関数Jの行列Aによる偏微分は、以下の式26の通りとなる。
式24におけるコスト関数Jの行列Aによる偏微分は、以下の式26の通りとなる。

式26の行列E2は、サイズがp×pの全ての成分が1の行列である。
式25を用いて、式23を書き換えると以下の式27が求まる。
式25を用いて、式23を書き換えると以下の式27が求まる。

式27のインデックスiは、行列の行を示すインデックスである。式27のインデックスkは、行列の列を示すインデックスである。
行列Pは、非負値であるため、式27の値は、非負値である必要がある。式27の右辺の第3項は、必ず非負値となる項である。即ち、式27の右辺から第3項を除いた式の値が0であるならば、必ず式27は、非負値となる。そのため、以下の式28に示すように、式27の右辺から第3項を除いた式が0であるという条件を満たすように、行列Pの更新を行うこととする。

式28のインデックスiは、行列の行を示すインデックスである。式28のインデックスkは、行列の列を示すインデックスである。
式28から、式23における緩和係数ηPの値が、以下の式29のように求まる。
式28から、式23における緩和係数ηPの値が、以下の式29のように求まる。

式29のインデックスiは、行列の行を示すインデックスである。式29のインデックスkは、行列の列を示すインデックスである。
式29を用いて、式23を書き換えると、以下の式30のようになる。
式29を用いて、式23を書き換えると、以下の式30のようになる。

式30のインデックスiは、行列の行を示すインデックスである。式30のインデックスkは、行列の列を示すインデックスである。この式30を用いて、行列Pの各成分を更新することで、行列Pを更新していくこととなる。
また、式26を用いて、式24を書き換えると以下の式31が求まる。
また、式26を用いて、式24を書き換えると以下の式31が求まる。

式31のインデックスkは、行列の行を示すインデックスである。式27のインデックスjは、行列の列を示すインデックスである。
行列Aは、非負値であるため、式31の値は、非負値である必要がある。式31の右辺の第3項は、必ず非負値となる項である。即ち、式31の右辺から第3項を除いた式の値が0であるならば、必ず式27は、非負値となる。そのため、以下の式32に示すように、式31の右辺から第3項を除いた式が0であるという条件を満たすように、行列Aの更新を行うこととする。
行列Aは、非負値であるため、式31の値は、非負値である必要がある。式31の右辺の第3項は、必ず非負値となる項である。即ち、式31の右辺から第3項を除いた式の値が0であるならば、必ず式27は、非負値となる。そのため、以下の式32に示すように、式31の右辺から第3項を除いた式が0であるという条件を満たすように、行列Aの更新を行うこととする。

式32のインデックスkは、行列の行を示すインデックスである。式32のインデックスjは、行列の列を示すインデックスである。
式32から、式24における緩和係数ηAの値が、以下の式33のように求まる。
式32から、式24における緩和係数ηAの値が、以下の式33のように求まる。

式33のインデックスkは、行列の行を示すインデックスである。式33のインデックスjは、行列の列を示すインデックスである。
式33を用いて、式24を書き換えると、以下の式34のようになる。
式33を用いて、式24を書き換えると、以下の式34のようになる。

式34のインデックスkは、行列の行を示すインデックスである。式34のインデックスjは、行列の列を示すインデックスである。この式34を用いて、行列Aの各成分を更新することで、行列Aを更新していくこととなる。
また、式22における第2の制約条件を満たすようにするため、以下の式35に示すように、行列Aを更新する。
また、式22における第2の制約条件を満たすようにするため、以下の式35に示すように、行列Aを更新する。

式35のkは、行列の行を示すインデックスである。式35のjは、行列の行又は列を示すインデックスである。
コスト関数Jの値が、収束するまで、式30を用いて行列Pを更新し、式34、式35を用いて行列Aを更新することを繰り返す。例えば、各更新段階において、更新後の行列P及び行列Aから、それぞれ更新前の行列P及び行列Aを引いた差である行列△P及び行列△Aを求める。そして、行列△P及び行列△Aそれぞれのフロベニウスノルムを計算する。各更新段階における行列△P及び行列△Aのフロベニウスノルムの、それぞれ最初の更新段階における行列△P及び行列△Aのフロベニウスノルムに対する比が、予め定められた閾値以下となる更新段階をもって、コスト関数Jの値が収束したとする。そして、その際の行列Aと行列Pとをコスト関数Jを最小化させる行列とする。
コスト関数Jの値が、収束するまで、式30を用いて行列Pを更新し、式34、式35を用いて行列Aを更新することを繰り返す。例えば、各更新段階において、更新後の行列P及び行列Aから、それぞれ更新前の行列P及び行列Aを引いた差である行列△P及び行列△Aを求める。そして、行列△P及び行列△Aそれぞれのフロベニウスノルムを計算する。各更新段階における行列△P及び行列△Aのフロベニウスノルムの、それぞれ最初の更新段階における行列△P及び行列△Aのフロベニウスノルムに対する比が、予め定められた閾値以下となる更新段階をもって、コスト関数Jの値が収束したとする。そして、その際の行列Aと行列Pとをコスト関数Jを最小化させる行列とする。
本実験では、以上のように、コスト関数Jを最小化させる行列Aと行列Pとを求めることとした。ただし、他の例として、行列Pと行列Aとの更新前後で、コスト関数Jの値の変動が予め定められた閾値以下となることが、予め定められた回数連続したら、コスト関数Jの値が収束したとすることとしてもよい。そして、その際の行列Aと行列Pとをコスト関数Jを最小化させる行列とすることとしてもよい。
コスト関数Jが収束した際の行列Aの各列が示すパターンを確認した。図10に、コスト関数Jが収束した際の行列Aの各列が示すパターンの一例を示す。行列A列には、列毎に、m(500)個の値が含まれ、係数αのパターンを示す。
図10の一番上のグラフは、行列Aの1列目のm個の値(Ai,1(1<=i<=m))を、行を示すインデックス順に並べたパターンを示す。図10の上から2つ目のグラフは、行列Aの2列目のm個の値(Ai,2(1<=i<=m))を、行を示すインデックス(i)順に並べたパターンを示す。図10の上から3つ目のグラフは、行列Aの3列目のm個の値(Ai,3(1<=i<=m))を、行を示すインデックス順に並べたパターンを示す。図10の下から2つ目のグラフは、行列Aの4列目のm個の値(Ai,4(1<=i<=m))を、行を示すインデックス順に並べたパターンを示す。図10の一番下のグラフは、行列Aの5列目(p列目)のm個の値(Ai,5(1<=i<=m))を、行を示すインデックス順に並べたパターンを示す。
図10の一番上のグラフは、行列Aの1列目のm個の値(Ai,1(1<=i<=m))を、行を示すインデックス順に並べたパターンを示す。図10の上から2つ目のグラフは、行列Aの2列目のm個の値(Ai,2(1<=i<=m))を、行を示すインデックス(i)順に並べたパターンを示す。図10の上から3つ目のグラフは、行列Aの3列目のm個の値(Ai,3(1<=i<=m))を、行を示すインデックス順に並べたパターンを示す。図10の下から2つ目のグラフは、行列Aの4列目のm個の値(Ai,4(1<=i<=m))を、行を示すインデックス順に並べたパターンを示す。図10の一番下のグラフは、行列Aの5列目(p列目)のm個の値(Ai,5(1<=i<=m))を、行を示すインデックス順に並べたパターンを示す。
また、コスト関数Jが収束した際の行列Pの各成分の値を確認した。式20から得られる以下の式36に示されるように、行列Pの各列(第j列Pk,j(1<=k<=p))は、行列Yの各列(第j列Yi,j(1<=i<=m))に示されるパターンを行列Aの各列に示されるパターン(基底ベクトル)の線形結合で近似するときの係数(重み)を示している。

図11に、コスト関数Jが収束した際の行列Pの各行の値を示すグラフを示す。図11のグラフの横軸は、行列Pの列のインデックスを示す。図11のグラフの縦軸は、行列Pの各成分の値を示す。
図11のライン1101は、行列Pの1行目のd(250)個の値を結んだラインである。ライン1101は、横軸が0以上、50未満の範囲(1列目からq(50)列目までの範囲)では、約12となり、それ以外の範囲では、12と比べて非常に微小な値(約0)となっている。
図11のライン1102は、行列Pの2行目のd個の値を結んだラインである。ライン1102は、横軸が50以上、100未満の範囲(q+1列目から2q列目までの範囲)では、約12となり、それ以外の範囲では、12と比べて非常に微小な値(約0)となっている。
図11のライン1103は、行列Pの4行目のd個の値を結んだラインである。ライン1103は、横軸が100以上、150未満の範囲(2q+1列目から3q列目までの範囲)では、約12となり、それ以外の範囲では、12と比べて非常に微小な値(約0)となっている。
図11のライン1104は、行列Pの5行目のd個の値を結んだラインである。ライン1104は、横軸が150以上、200未満の範囲(3q+1列目から4q列目までの範囲)では、値が約12となり、それ以外の範囲では、12と比べて非常に微小な値(約0)となっている。
図11のライン1105は、行列Pの3行目のd個の値を結んだラインである。ライン1105は、横軸が200以上、250未満の範囲(4q+1列目から5q列目までの範囲)では、約12となり、それ以外の範囲では、12と比べて非常に微小な値(約0)となっている。
即ち、行列Pの各列の値は、1列目からq(50)列目までの範囲では、1行目の値が約12となり、2~5行目の値が約0となる。また、行列Pの各列の値は、q+1列目から2q列目までの範囲では、2行目の値が約12となり、1行目、3~5行目の値が約0となる。また、行列Pの各列の値は、2q+1列目から3q列目までの範囲では、4行目の値が約12となり、1~3行目、5行目の値が約0となる。また、行列Pの各列の値は、3q+1列目から4q列目までの範囲では、5行目の値が約12となり、1~4行目の値が約0となる。また、行列Pの各列の値は、4q+1列目から5q列目までの範囲では、3行目の値が約12となり、1、2、4、5行目の値が約0となる。
そのため、行列APの1列目からq列目までの各列のデータが示すパターンは、図10の一番上のグラフに示されるパターンに約12の重み、図10のそれ以外のグラフに示されるパターンに約0の重み、で図10の各パターンが重ね合わされたパターンであり、図10の一番上のグラフに示されるパターンに類似するパターンとなる。また、行列APのq+1列目から2q列目までの各列のデータが示すパターンは、図10の上から2つ目のグラフに示されるパターンに約12の重み、図10のそれ以外のグラフに示されるパターンに約0の重み、で図10の各パターンが重ね合わされたパターンであり、図10の上から2つ目のグラフに示されるパターンに類似するパターンとなる。また、行列APの2q+1列目から3q列目までの各列のデータが示すパターンは、図10の下から2つ目のグラフに示されるパターンに約12の重み、図10のそれ以外のグラフに示されるパターンに約0の重み、で図10の各パターンが重ね合わされたパターンであり、図10の下から2つ目のグラフに示されるパターンに類似するパターンとなる。また、行列APの3q+1列目から4q列目までの各列のデータが示すパターンは、図10の一番下のグラフに示されるパターンに約12の重み、図10のそれ以外のグラフに示されるパターンに約0の重み、で図10の各パターンが重ね合わされたパターンであり、図10の一番下のグラフに示されるパターンに類似するパターンとなる。また、行列APの4q+1列目から5q列目までの各列のデータが示すパターンは、図10の上から3番目のグラフに示されるパターンに約12の重み、図10のそれ以外のグラフに示されるパターンに約0の重み、で図10の各パターンが重ね合わされたパターンであり、図10の上から3つ目のグラフに示されるパターンに類似するパターンとなる。
そのため、行列APの1列目からq列目までの各列のデータが示すパターンは、図10の一番上のグラフに示されるパターンに約12の重み、図10のそれ以外のグラフに示されるパターンに約0の重み、で図10の各パターンが重ね合わされたパターンであり、図10の一番上のグラフに示されるパターンに類似するパターンとなる。また、行列APのq+1列目から2q列目までの各列のデータが示すパターンは、図10の上から2つ目のグラフに示されるパターンに約12の重み、図10のそれ以外のグラフに示されるパターンに約0の重み、で図10の各パターンが重ね合わされたパターンであり、図10の上から2つ目のグラフに示されるパターンに類似するパターンとなる。また、行列APの2q+1列目から3q列目までの各列のデータが示すパターンは、図10の下から2つ目のグラフに示されるパターンに約12の重み、図10のそれ以外のグラフに示されるパターンに約0の重み、で図10の各パターンが重ね合わされたパターンであり、図10の下から2つ目のグラフに示されるパターンに類似するパターンとなる。また、行列APの3q+1列目から4q列目までの各列のデータが示すパターンは、図10の一番下のグラフに示されるパターンに約12の重み、図10のそれ以外のグラフに示されるパターンに約0の重み、で図10の各パターンが重ね合わされたパターンであり、図10の一番下のグラフに示されるパターンに類似するパターンとなる。また、行列APの4q+1列目から5q列目までの各列のデータが示すパターンは、図10の上から3番目のグラフに示されるパターンに約12の重み、図10のそれ以外のグラフに示されるパターンに約0の重み、で図10の各パターンが重ね合わされたパターンであり、図10の上から3つ目のグラフに示されるパターンに類似するパターンとなる。
行列Yの1列目からq列目までの各列のデータが示すパターンは、図9に示す外輪に疵がある軸受106に対応するパターンである。また、行列Yのq+1列目から2q列目までの各列のデータが示すパターンは、図9に示す転動体に疵がある軸受106に対応するパターンである。また、行列Yの2q+1列目から3q列目までの各列のデータが示すパターンは、図9に示す内輪に疵がある軸受106に対応するパターンである。また、行列Yの3q+1列目から4q列目までの各列のデータが示すパターンは、図9に示す疵のない正常な軸受106に対応するパターンである。また、行列Yの4q+1列目から5q列目までの各列のデータが示すパターンは、図9に示す保持器に疵がある軸受106に対応するパターンである。
行列Yと行列Aとを見比べてみると、双方の各列のデータが示すパターンは、類似するパターンとなっていることが分かる。即ち、行列Aの各列のデータが示すパターンは、それぞれ、各状態の軸受106に対応する係数αのパターンとなっていることが分かる。行列Aの1列目のデータは、外輪に疵がある状態の軸受106に対応する係数αの代表的なパターンを示す。行列Aの2列目のデータは、転動体に疵がある状態の軸受106に対応する係数αの代表的なパターンを示す。行列Aの3列目のデータは、保持器に疵がある状態の軸受106に対応する係数αの代表的なパターンを示す。行列Aの4列目のデータは、内輪に疵のある状態の軸受106に対応する係数αの代表的なパターンを示す。行列Aの5列目のデータは、疵のない正常な状態の軸受106に対応する係数αの代表的なパターンを示す。
以上より、行列Yを生成し、生成した行列Yを、式22を満たすように、非負値行列因子分解により学習することで、行列Aの各列(基底ベクトル)として、各状態の軸受106に対応する係数αのパターンが特定されたことが確認された。
(実験3)
また、発明者は、軸受106の状態を診断する方法の着想を得た。この着想の概要について説明する。状態が既知な軸受106についての計測データから、予めその状態に対応する修正された自己回帰モデルの係数αのパターンを示す非負値の行列を、教師基底行列として特定する。そして、状態が不知な軸受106についての計測データから修正された自己回帰モデルの係数αを予め定められた個数だけ求めて、求めたその個数の係数αそれぞれのパターンを示す非負値のデータを各列に格納する行列を、教師基底行列と、教師基底行列の重み行列と、この非負値のデータを各列に格納する行列から抽出される基底を示す抽出基底行列と、抽出基底行列の重み行列と、に分解する。そして、教師基底行列の重み行列と、抽出基底行列の重み行列と、を比較することで、状態が不知な軸受106の状態が、教師基底行列に対応する状態であるか否かを診断する。以上が、発明者が得た着想の概要である。
また、発明者は、軸受106の状態を診断する方法の着想を得た。この着想の概要について説明する。状態が既知な軸受106についての計測データから、予めその状態に対応する修正された自己回帰モデルの係数αのパターンを示す非負値の行列を、教師基底行列として特定する。そして、状態が不知な軸受106についての計測データから修正された自己回帰モデルの係数αを予め定められた個数だけ求めて、求めたその個数の係数αそれぞれのパターンを示す非負値のデータを各列に格納する行列を、教師基底行列と、教師基底行列の重み行列と、この非負値のデータを各列に格納する行列から抽出される基底を示す抽出基底行列と、抽出基底行列の重み行列と、に分解する。そして、教師基底行列の重み行列と、抽出基底行列の重み行列と、を比較することで、状態が不知な軸受106の状態が、教師基底行列に対応する状態であるか否かを診断する。以上が、発明者が得た着想の概要である。
そこで、発明者らは、この着想で得られた方法の実効性を検証するため、実験1と同様の実験状況において、以下のような実験を行った。本実験では、使用固有値数sは、3とした。また、mは、500とした。
実験2で説明した方法で、疵のない正常な状態の軸受106に対応する係数αのパターンを示すデータ(式20の行列Aの正常な軸受106に対応する列のデータ)を、教師基底に属する基底ベクトルとして取得した。取得した正常な状態の軸受106に対応する教師基底に属するパターンは、図12に示すようなパターンとなった。図12のグラフは、非負値となるように修正された正常な状態の軸受106に対応する係数αを示す。図12のグラフの横軸は、係数αのインデックスを示し、縦軸は、対応するデータの値を示す。
そして、発明者らは、軸受106が疵のない正常な状態である場合、図13A~図13Cに示す各状態にある場合それぞれと、について、以下の作業をq’回行った。図13A~図13Cに示す各状態とは、図13Aに示す外輪に幅3mm・深さ約0.1mmの疵がある状態と、図13Bに示す外輪に幅0.5mm・深さ0.1mm以下の疵がある状態と、図13Cに示す外輪に予め定められた大きさ(径が1mm等)以下の微小な疵がある状態とのそれぞれである。q’は、200としたが、100等の他の値としてもよい。各場合について、軸受106についての連続したM個の計測データを取得し、取得した連続したM個の計測データに基づいて、式11を用いて行列Σsと行列Usとを求め、式5と式13を用いて修正された自己回帰モデルの係数αを求める作業をq’回行った。
q’が大きいほど診断結果の信頼性が向上するため、q’は、大きい方が望ましい。q’の適正な値は、診断の対象、診断結果に要求される信頼性の程度、計測データの種類等に応じ、実験等の手段を駆使して定めればよい。本実験3では、q’は、10以上とするのが望ましく、50以上とするのがより望ましく、100以上とするのがさらに望ましい。
これにより、疵のない正常な状態の軸受106と、図13A~図13Cに示す各状態にある軸受106それぞれと、について、q’個の修正された自己回帰モデルの係数αを取得した。
そして、軸受106が正常な場合、図13A~図13Cに示す各状態にある場合それぞれについて、以下の式37で示すようなデータ行列Ydを生成した。

式37の行列の各列のデータは、取得されたq’個の修正された自己回帰モデルの係数αそれぞれを示すデータである。即ち、αi,jは、q’個の修正された自己回帰モデルの係数αのうちのj個目の係数αにおけるi番目の要素を示す。
本実験では、このデータ行列Ydを、非負値の複数の行列に分解する。データ行列Ydを非負値の複数の行列に分解するためには、行列Yの各列の係数αのパターンを変えずに、行列Y自体の各成分を、非負値にするよう調整する必要がある。そこで、例えば、行列Yの0未満の成分のうち、最小のものの絶対値を、データ行列Ydの各成分に加算することで、データ行列Ydの各成分が非負値となるようにする。データ行列Ydの各列には、修正された自己回帰モデルにおける係数αのパターンを示す非負値のデータが格納されていることとなる。
本実験では、このデータ行列Ydを、非負値の複数の行列に分解する。データ行列Ydを非負値の複数の行列に分解するためには、行列Yの各列の係数αのパターンを変えずに、行列Y自体の各成分を、非負値にするよう調整する必要がある。そこで、例えば、行列Yの0未満の成分のうち、最小のものの絶対値を、データ行列Ydの各成分に加算することで、データ行列Ydの各成分が非負値となるようにする。データ行列Ydの各列には、修正された自己回帰モデルにおける係数αのパターンを示す非負値のデータが格納されていることとなる。
以下の式38に示すように、非負値の行列に修正したデータ行列Ydを、複数の非負値行列に分解する。より具体的には、データ行列Ydを、教師基底行列Fと、教師基底に対する重みを示す教師重み行列Gと、データ行列Ydから抽出される基底である抽出基底を示す抽出基底行列Qと、抽出基底に対する重みを示す抽出基底重み行列Wと、に分解する。教師基底行列Fと、教師重み行列Gと、抽出基底行列Qと、抽出基底重み行列Wは、何れも非負値行列である。本実験では、教師基底は、疵のない正常な状態の軸受106に対応する係数αのパターンを示す基底ベクトルの集合である。抽出基底は、疵のない正常な状態の軸受106に対応する係数αのパターン以外の係数αのパターンを示す基底ベクトルの集合である。疵のない正常な状態の軸受106に対応する係数αのパターン以外の係数αのパターンは、例えば、状態が不知の軸受106に対応する係数αのパターンを含む。
YdをFとGとQとWとに分解する処理は、以下のような処理とみなすことができる。即ち、Ydの各列に格納された係数αのパターンのデータを、教師基底に属するパターンと、それ以外のパターンと、の重み付けの足し合わせとして分解する処理とみなすことができる。
Fは、m×1のサイズの行列である。Gは、1×q’のサイズの行列である。Qは、m×(データ行列から抽出される基底ベクトルの数を示す数n(本実験では、1とした))のサイズの行列である。Wは、n×q’のサイズの行列である。
Gにおける各列の要素の値は、データ行列Ydのその列に格納された係数αのパターンを示すデータに含まれる教師基底の成分の重みを示す。Wにおけるn行目の各列の要素の値は、データ行列Ydのその列に格納された係数αのパターンを示すデータに含まれるQのその列に格納された抽出基底の成分の重みを示す。
Gにおける各列の要素の値は、データ行列Ydのその列に格納された係数αのパターンを示すデータに含まれる教師基底の成分の重みを示す。Wにおけるn行目の各列の要素の値は、データ行列Ydのその列に格納された係数αのパターンを示すデータに含まれるQのその列に格納された抽出基底の成分の重みを示す。
以下の式39のようにコスト関数Jdを定義する。

式39の右辺第1項のFrは、フロベニウスノルムであることを示す添え字である。即ち、式39の右辺第1項は、フロベニウスノルムである。式39の右辺第1項は、FとGとの積とQとWとの積との和と、データ行列Yと、の差分の大きさを示す。式39の右辺第2項は、教師重み行列のスパース制約を示す項である。式39の右辺第2項のδ1は、予め定められた実数である。式39の右辺第2項のk、tは、それぞれ行列の行、列を示すインデックスである。
式39の右辺第3項は、抽出重み行列のスパース制約を示す項である。式39の右辺第3項のδ2は、予め定められた実数である。式39の右辺第3項のl、tは、それぞれ行列の行、列を示すインデックスである。式39の右辺第4項は、抽出基底の正規直交制約(即ち、抽出基底行列Qの各列に格納されているパターンの全体が近似的に正規直交系をなすとの制約)を示す項である。即ち、式39の右辺第4項は、正規直交性の向上に関する項である。式39の右辺第4項のε1は、予め定められた実数である。式39の右辺第4項のi、i’は、それぞれ行列の行、列を示すインデックスである。式39の右辺第4項のIは、単位行列である。式39の右辺第5項は、教師基底と抽出基底との間の直交制約(即ち、教師基底行列Fの各列に格納されている全てのパターンと抽出基底行列Qの各列に格納されている全てのパターンとが近似的に直交するとの制約)を示す項である。式39の右辺第5項のε2は、予め定められた実数である。式39の右辺第4項のi、i’は、それぞれ行列の行、列を示すインデックスである。
本実験では、教師重み行列のスパース制約、抽出重み行列のスパース制約、抽出基底の正規直交制約、教師基底と抽出基底との間の直交制約の何れも付加しない。即ち、δ1、δ2、ε1、ε2それぞれは、0とする。そのため、コスト関数Jdは、式39の右辺第1項のみの式となる。
Jdの値を適正化するように、G、Q、Wの値を更新することで、Ydを、FとGとQとWとに分解する。以下の式40で定義されるコスト関数Jdの最小化問題を解くこととなる。

本実験では、コスト関数Jdを最小化するために、以下のような処理を行う。即ち、GとQとWとの更新を繰り返すことで、コスト関数Jdを最小化する。また、コスト関数Jdを最小化するために、以下に記載する方法以外の方法(例えば、ニュートン法、確率的勾配降下法等の最適化手法)を用いてもよい。
Gの更新について説明する。本実験では、以下の式41に示すようにGの更新を行った。
Gの更新について説明する。本実験では、以下の式41に示すようにGの更新を行った。

式41のk、tは、それぞれ行列の行、列を示すインデックスである。ηG
ktは、Gのk、t要素についての更新のステップサイズを示す非負値の値である。
コスト関数JdをGで偏微分することで、以下の式42が得られる。
コスト関数JdをGで偏微分することで、以下の式42が得られる。

式42のE3は、サイズが1×q’の全ての成分が1の行列である。
式41に式42を代入することで、更新後のGを示す以下の式43が得られる。
式41に式42を代入することで、更新後のGを示す以下の式43が得られる。

行列Gは、非負値であるため、式43の値は、非負値である必要がある。式43の最右辺の末尾の項は、必ず非負値となる項である。即ち、式43の最右辺から末尾の項を除いた式の値が0であるならば、必ず更新後のGは、非負値となる。そのため、以下の式44に示すように、式43の最右辺から末尾の項を除いた式が0であるという条件を満たすように、行列Gの更新を行うこととする。

式44からηG
ktは、以下の式45のようになる。

式41に式42と式45とを代入することで、更新後のGを示す以下の式46が得られる。

即ち、Ydと、Fと、処理時点における更新前のG、Q、Wと、予め定められた係数δ1(本実験では、0)と、に基づいて、式46を用いて、Gを更新した。
次に、Qの更新について説明する。本実験では、以下の式47に示すようにQを更新した。
次に、Qの更新について説明する。本実験では、以下の式47に示すようにQを更新した。

式47のw、tは、それぞれ行列の行、列を示すインデックスである。ηQ
wtは、Qのw、t要素についての更新のステップサイズを示す非負値の値である。
コスト関数JdをQで偏微分することで、以下の式48が得られる。
コスト関数JdをQで偏微分することで、以下の式48が得られる。

式48のE4は、サイズがn×nの全ての成分が1の行列である。式48のE5は、サイズが1×1の全ての成分が1の行列である。
式47に式48を代入することで、更新後のQを示す以下の式49が得られる。
式47に式48を代入することで、更新後のQを示す以下の式49が得られる。

行列Qは、非負値であるため、式49の値は、非負値である必要がある。式49の最右辺の末尾の項は、必ず非負値となる項である。即ち、式49の最右辺から末尾の項を除いた式の値が0であるならば、必ず更新後のQは、非負値となる。そのため、以下の式50に示すように、式49の最右辺から末尾の項を除いた式が0であるという条件を満たすように、行列Qを更新することとする。

式50からηQ
wtは、以下の式51のようになる。

47式に48式と51式とを代入することで、更新後のGを示す以下の式52が得られる。

即ち、Ydと、Fと、処理時点における更新前のG、Q、Wと、予め定められた係数ε1、ε2(本実験では、共に0)と、に基づいて、式52を用いて、Qを更新した。
次に、Wの更新について説明する。本実験では、以下の式53に示すようにWを更新した。
次に、Wの更新について説明する。本実験では、以下の式53に示すようにWを更新した。

式53のl、tは、それぞれ行列の行、列を示すインデックスである。ηW
ltは、Wのl、t要素についての更新のステップサイズを示す非負値の値である。
コスト関数JdをWで偏微分することで、以下の式54が得られる。
コスト関数JdをWで偏微分することで、以下の式54が得られる。

式54のE6は、サイズが1×q’の全ての成分が1の行列である。
式53に式54を代入することで、更新後のWを示す以下の式55が得られる。
式53に式54を代入することで、更新後のWを示す以下の式55が得られる。

行列Wは、非負値であるため、式55の値は、非負値である必要がある。式55の最右辺の末尾の項は、必ず非負値となる項である。即ち、式55の最右辺から末尾の項を除いた式の値が0であるならば、必ず更新後のWは、非負値となる。そのため、以下の式56に示すように、式55の最右辺から末尾の項を除いた式が0であるという条件を満たすように、行列Wの更新を行うこととする。
式56からηW
ltは、以下の式57のようになる。

53式に54式と57式とを代入することで、更新後のWを示す以下の式58が得られる。

即ち、Ydと、Fと、処理時点における更新前のG、Q、Wと、予め定められた係数δ2(本実験では、0)と、に基づいて、式58を用いて、Gを更新した。
以上のように、本実験では、式46を用いたGの更新と、式52を用いたQの更新と、式58を用いたWの更新と、を繰り返す。各更新段階において、更新後のG、Q、Wから、それぞれ更新前のG、Q、Wを引いた差であるΔG、ΔQ、ΔWについて、これらの行列のフロベニウスノルムを計算する。そして、各更新段階におけるΔG、ΔQ、ΔWのフロベニウスノルムの、それぞれ最初の更新段階におけるΔG、ΔQ、ΔWのフロベニウスノルムに対する比が、予め定められた閾値以下となる更新段階をもって、コスト関数Jdの値が収束したとした。そして、Jdが収束した際のG、Q、Wを、コスト関数Jdを最小化させる行列とした。これにより、データ行列Ydを、式38に示すように、それぞれ非負値の行列であるFとGとQとWとに分解した。
以上のように、本実験では、式46を用いたGの更新と、式52を用いたQの更新と、式58を用いたWの更新と、を繰り返す。各更新段階において、更新後のG、Q、Wから、それぞれ更新前のG、Q、Wを引いた差であるΔG、ΔQ、ΔWについて、これらの行列のフロベニウスノルムを計算する。そして、各更新段階におけるΔG、ΔQ、ΔWのフロベニウスノルムの、それぞれ最初の更新段階におけるΔG、ΔQ、ΔWのフロベニウスノルムに対する比が、予め定められた閾値以下となる更新段階をもって、コスト関数Jdの値が収束したとした。そして、Jdが収束した際のG、Q、Wを、コスト関数Jdを最小化させる行列とした。これにより、データ行列Ydを、式38に示すように、それぞれ非負値の行列であるFとGとQとWとに分解した。
本実験では、以上のようにして、コスト関数Jdを最小化させるGとQとWとを求めることとした。ただし、他の例として、式46を用いたGの更新と、式52を用いたQの更新と、式58を用いたWの更新と、を繰り返し行い、G、Q、Wの更新前と更新後とでコスト関数Jdの値の変動が予め定められた閾値以下となることが、予め定められた回数連続したら、コスト関数Jdの値が収束したこととしてもよい。そして、Jdが収束した際のG、Q、Wを、コスト関数Jdを最小化させる行列としてもよい。
図14A~図14Bを用いて、疵のない正常な状態にある軸受106についての本実験の実験結果について説明する。
図14Aのグラフは、Fが示す教師基底(に属する係数αのパターン)と、正常な状態にある軸受106についての計測データから本実験で求めたQが示す抽出基底(に属する係数αのパターン)と、を示すグラフである。図14Aのグラフの横軸は、係数αのインデックスを示し、縦軸は、対応するデータの値を示す。
図14Aのグラフは、Fが示す教師基底(に属する係数αのパターン)と、正常な状態にある軸受106についての計測データから本実験で求めたQが示す抽出基底(に属する係数αのパターン)と、を示すグラフである。図14Aのグラフの横軸は、係数αのインデックスを示し、縦軸は、対応するデータの値を示す。
図14Bのグラフは、正常な状態にある軸受106についての計測データから本実験で求めたGとWとを示すグラフである。図14Bのグラフの横軸は、GとWとの列のインデックスを示し、縦軸は、対応する列のGとWとの要素の値を示す。
GとWとの各要素は、データ行列Ydに格納されている係数αのパターンを示すデータそれぞれの中に、教師基底の成分と抽出基底の成分とのそれぞれが、どの程度の重みで存在しているかを示す重みを示す。そのため、図14Bのグラフは、データ行列Yd内に、教師基底の成分と抽出基底の成分とのそれぞれが、どの程度の重みで存在しているかを示すグラフである。
GとWとの各要素は、データ行列Ydに格納されている係数αのパターンを示すデータそれぞれの中に、教師基底の成分と抽出基底の成分とのそれぞれが、どの程度の重みで存在しているかを示す重みを示す。そのため、図14Bのグラフは、データ行列Yd内に、教師基底の成分と抽出基底の成分とのそれぞれが、どの程度の重みで存在しているかを示すグラフである。
図14Aのグラフから、教師基底と抽出基底とは、似通っていることが見て取れる。また、図14Bのグラフから、データ行列Yd内における教師基底の成分と抽出基底の成分との重みには、顕著な違いがみられないことが分かる。図14Bのグラフにおいて、GとWとを、200個の列の要素それぞれについて比較すると、113点においてGの方が大きくなっており、87点においてWの方が大きくなっている。
図15A~図15Bを用いて、図13Aに示すように幅3mm・深さ約0.1mmの線上の疵が外輪に存在する状態にある軸受106についての本実験の実験結果について説明する。
図15Aのグラフは、Fが示す教師基底(に属する係数αのパターン)と、幅3mm・深さ約0.1mmの線上の疵が外輪に存在する状態の軸受106についての計測データから本実験で求めたQが示す抽出基底(に属する係数αのパターン)と、を示すグラフである。図15Aのグラフの横軸は、係数αのインデックスを示し、縦軸は、対応するデータの値を示す。
図15Bのグラフは、幅3mm・深さ約0.1mmの線上の疵が外輪に存在する状態の軸受106についての計測データから本実験で求めたGとWとを示すグラフである。図15Bのグラフの横軸は、GとWとの列のインデックスを示し、縦軸は、対応する列のGとWとの要素の値を示す。
図15Aのグラフから、教師基底と抽出基底とは、顕著に異なることが見て取れる。また、図15Bのグラフから、データ行列Yd内における教師基底の成分と抽出基底の成分との重みには、顕著な違いがみられることが分かる。抽出基底の成分の重みが、教師基底の成分の重みよりも顕著に高くなっている。図15Bのグラフにおいて、GとWとを、200個の列の要素それぞれについて比較すると、200個全てにおいてWの方が大きくなる。
図16A~図16Bを用いて、図13Bに示すように幅0.5mm・深さ約0.1mm以下の線上の疵が外輪に存在する状態にある軸受106についての本実験の実験結果について説明する。
図16Aのグラフは、Fが示す教師基底と、幅0.5mm・深さ0.1mm以下の線上の疵が外輪に存在する状態の軸受106についての計測データから本実験で求めたQが示す抽出基底と、を示すグラフである。図16Aのグラフの横軸は、係数αのインデックスを示し、縦軸は、対応するデータの値を示す。
図16Bのグラフは、幅0.5mm・深さ0.1mm以下の線上の疵が外輪に存在する状態の軸受106についての計測データから本実験で求めたGとWとを示すグラフである。図16Bのグラフの横軸は、GとWとの列のインデックスを示し、縦軸は、対応する列のGとWとの要素の値を示す。
図16Aのグラフから、教師基底と抽出基底とは、大まかな波形の動きとしては、似通っているともとれる。しかし、抽出基底に属する基本ベクトルの波形は、教師基底に属する基本ベクトルの波形に比べてより細かな振動が多数存在することが分かる。また、図16Bのグラフから、データ行列Yd内における教師基底の成分と抽出基底の成分との重みには、顕著な違いがみられることが分かる。図16Bのグラフにおいて、GとWとを、200個の列の要素それぞれについて比較すると、199個においてWの方が大きくなっており、1個においてGの方が大きくなっている。
図17A~図17Bを用いて、図13Cに示すように微小な疵が外輪に存在する状態にある軸受106についての本実験の実験結果について説明する。
図17Aのグラフは、Fが示す教師基底と、微小な疵が外輪に存在する状態の軸受106についての計測データから本実験で求めたQが示す抽出基底と、を示すグラフである。図17Aのグラフの横軸は、係数αのインデックスを示し、縦軸は、対応するデータの値を示す。
図17Bのグラフは、微小な疵が外輪に存在する状態の軸受106についての計測データから本実験で求めたGとWとを示すグラフである。図17Bのグラフの横軸は、GとWとの列のインデックスを示し、縦軸は、対応する列のGとWとの要素の値を示す。
図17Aのグラフから、教師基底と抽出基底とは、似通っているともとれる。また、図17Bのグラフから、データ行列Yd内における教師基底の成分と抽出基底の成分との重みには、一見、顕著な違いがないようにもとれる。しかし、図17Bのグラフを見ると、Wの値は、大半が0.12付近に存在しており、Gの値は、大半が0.03付近に存在していることが分かる。図17Bのグラフにおいて、GとWとを、200個の列の要素それぞれについて比較すると、159個においてWの方が大きくなっており、41個においてGの方が大きくなっている。図14Bのグラフと比べて、GがWよりも大きくなっている箇所が顕著に多いのが分かる。
図14A~図17Bに示した実験結果から、データ行列Ydに対応する軸受106の状態と、教師基底に対応する軸受106の状態と、が異なっている場合、データ行列Ydの分解により得られたWとGとも顕著に異なる傾向が確認された。
発明者らは、本実験の実験結果から、データ行列Ydの分解により得られたGとWとを比較することで、データ行列Ydに対応する軸受106の状態が、教師基底が示す状態であるか否かを診断することができるとの知見を得た。
そこで、本実施形態の処理は、以下のような処理である。即ち、予め定められた状態の軸受106に対応する修正された自己回帰モデルの係数αのパターンを示す非負値のデータを、教師基底に属する基底ベクトルとして求める。そして、診断対象の軸受106から計測された計測データからデータ行列Ydを生成し、生成したデータ行列Ydを、教師基底を示す行列と、教師基底の重みを示す教師重み行列と、抽出基底を示す抽出基底行列と、抽出基底の重みを示す抽出重み行列と、に分解する。そして、データ行列Ydの分解により得られた教師重み行列と、抽出重み行列と、に基づいて、軸受106の状態が、教師基底に対応する状態であるか否かを診断する処理である。
(システム構成)
図18は、本実施形態の診断システムのシステム構成の一例を示す図である。診断システムは、周期的な運動を行う物体についての状態診断を行うシステムである。診断システムは、情報処理装置1800、振動計測装置1801を含む。診断システムは、鉄道台車に利用されている軸受の状態診断を行う。本実施形態では、診断システムは、図1Aおよび図1Bと同様の状況で振動計測位置111に設置された振動計測装置1801により計測された振動の計測データに基づいて、軸受106の状態を診断する。
図18は、本実施形態の診断システムのシステム構成の一例を示す図である。診断システムは、周期的な運動を行う物体についての状態診断を行うシステムである。診断システムは、情報処理装置1800、振動計測装置1801を含む。診断システムは、鉄道台車に利用されている軸受の状態診断を行う。本実施形態では、診断システムは、図1Aおよび図1Bと同様の状況で振動計測位置111に設置された振動計測装置1801により計測された振動の計測データに基づいて、軸受106の状態を診断する。
情報処理装置1800は、振動計測装置1801により計測された信号に基づいて、軸受の状態診断を行うパーソナルコンピュータ(PC)、サーバ装置、タブレット装置等の情報処理装置である。また、情報処理装置1800は、電車に組み込まれたコンピュータ等であってもよい。
振動計測装置1801は、加速度センサ等のセンサを含み、センサを介して物体の振動を検知し、検知した振動に応じた信号を有線又は無線で情報処理装置1800等の外部の装置に出力する計測装置である。
(情報処理装置の機能構成)
図18を参照しながら、情報処理装置1800が有する機能の一例を説明する。
情報処理装置1800は、取得部1810、決定部1820、学習部1830、分解部1840、診断部1850、出力部1860を含む。
図18を参照しながら、情報処理装置1800が有する機能の一例を説明する。
情報処理装置1800は、取得部1810、決定部1820、学習部1830、分解部1840、診断部1850、出力部1860を含む。
≪取得部1810≫
取得部1810は、周期的な運動を行う物体について、この周期的な運動に係る計測データyを取得する。
本実施形態では、取得部1810は、軸受106の内輪を回転させ、振動計測位置111に設置された振動計測装置1801により計測された振動の計測データyを取得する。
取得部1810は、周期的な運動を行う物体について、この周期的な運動に係る計測データyを取得する。
本実施形態では、取得部1810は、軸受106の内輪を回転させ、振動計測位置111に設置された振動計測装置1801により計測された振動の計測データyを取得する。
≪決定部1820≫
決定部1820は、取得部1810により取得された計測データyに基づいて、修正された自己回帰モデルにおける係数αを決定する。修正された自己回帰モデルは、計測データyの実績値yk-1~yk-mと、この実績値に対する係数α(=α1~αm)と、を用いて、計測データyの予測値y^kを表す式1である。決定部1820は、修正された自己回帰モデルにおける係数αを、式12を用いて決定する。式12は、一般的に知られている自己回帰モデルにおける係数の決定に用いる式6(ユール・ウォーカー方程式)において、式7で表される自己相関行列Rの代わりに、自己相関行列Rから物体の状態診断に有用な成分を抽出した第1の行列R’(式10)を用いる式である。式6は、時差が0からm-1までの計測データyの自己相関を成分とする自己相関行列Rを係数行列とし、時差が1からmまでの計測データyの自己相関を成分とする自己相関ベクトルを定数ベクトルとする方程式である。
決定部1820は、取得部1810により取得された計測データyに基づいて、修正された自己回帰モデルにおける係数αを決定する。修正された自己回帰モデルは、計測データyの実績値yk-1~yk-mと、この実績値に対する係数α(=α1~αm)と、を用いて、計測データyの予測値y^kを表す式1である。決定部1820は、修正された自己回帰モデルにおける係数αを、式12を用いて決定する。式12は、一般的に知られている自己回帰モデルにおける係数の決定に用いる式6(ユール・ウォーカー方程式)において、式7で表される自己相関行列Rの代わりに、自己相関行列Rから物体の状態診断に有用な成分を抽出した第1の行列R’(式10)を用いる式である。式6は、時差が0からm-1までの計測データyの自己相関を成分とする自己相関行列Rを係数行列とし、時差が1からmまでの計測データyの自己相関を成分とする自己相関ベクトルを定数ベクトルとする方程式である。
式6は、式1で算出される計測データyの予測値y^kと、計測データyの予測値y^kに対応する時刻kにおける計測データyの実測値ykとの二乗誤差を最小化する条件を示す条件式として導出することができる。第1の行列R’は、自己相関行列Rの固有値を対角成分とする対角行列Σと、自己相関行列Rの固有ベクトルを列成分とする直交行列Uと、から導出される。自己相関行列Rの固有値は、自己相関行列Rを特異値分解(式8)することで導出される。第1の行列R’は、自己相関行列Rの固有値のうち1以上且つm未満の設定された使用固有値数s個の固有値を用いて、対角行列Σの部分行列であって、使用固有値数s個の固有値を対角成分とする行列Σsと、直交行列Uの部分行列であって、使用固有値数s個の固有値に対応する固有ベクトルを列成分ベクトルとする行列Usと、から導出される行列UsΣsUs
Tである。使用固有値数s個の固有値は、自己相関行列Rの固有値のうち、値が最大の固有値を含むようにすればよいが、値が大きいものから順に選ばれるのが好ましい。
≪学習部1830≫
学習部1830は、複数の状態の物体について、予め取得部1810により取得された計測データから決定部1820により決定された修正された自己回帰モデルにおける係数αを学習データとして、予め定められた状態の物体に対応する修正された自己回帰モデルにおける係数αのパターンを学習により、教師基底に属する基底ベクトルとして特定する。
学習部1830は、複数の状態の物体について、予め取得部1810により取得された計測データから決定部1820により決定された修正された自己回帰モデルにおける係数αを学習データとして、予め定められた状態の物体に対応する修正された自己回帰モデルにおける係数αのパターンを学習により、教師基底に属する基底ベクトルとして特定する。
≪分解部1840≫
分解部1840は、診断対象の物体から計測された計測データに基づいて決定部1820により決定された係数αを予め定められた個数だけ取得する。分解部1840は、取得した係数αそれぞれのパターンを示す非負値のデータを格納するデータ行列を生成する。そして、分解部1840は、生成したデータ行列を、学習部1830により学習された教師基底を格納する教師基底行列と、データ行列内の教師基底の成分の重みを示す教師重み行列と、データ行列から抽出される基底が格納される抽出基底行列と、データ行列内の抽出基底の成分の重みを示す抽出重み行列と、に分解する。
分解部1840は、診断対象の物体から計測された計測データに基づいて決定部1820により決定された係数αを予め定められた個数だけ取得する。分解部1840は、取得した係数αそれぞれのパターンを示す非負値のデータを格納するデータ行列を生成する。そして、分解部1840は、生成したデータ行列を、学習部1830により学習された教師基底を格納する教師基底行列と、データ行列内の教師基底の成分の重みを示す教師重み行列と、データ行列から抽出される基底が格納される抽出基底行列と、データ行列内の抽出基底の成分の重みを示す抽出重み行列と、に分解する。
≪診断部1850≫
診断部1850は、分解部1840により求められた教師重み行列と抽出重み行列とに基づいて、物体の状態が教師基底に対応する状態であるか否かを診断する。
本実施形態では、軸受106の状態が教師基底に対応する状態であるか否かを診断の結果とする。
≪出力部1860≫
出力部1860は、診断部1850による診断の結果に係る情報を出力する。
診断部1850は、分解部1840により求められた教師重み行列と抽出重み行列とに基づいて、物体の状態が教師基底に対応する状態であるか否かを診断する。
本実施形態では、軸受106の状態が教師基底に対応する状態であるか否かを診断の結果とする。
≪出力部1860≫
出力部1860は、診断部1850による診断の結果に係る情報を出力する。
(情報処理装置のハードウェア構成)
図19は、情報処理装置1800のハードウェア構成の一例を示す図である。
情報処理装置1800は、CPU1900、主記憶装置1901、補助記憶装置1902、入出力I/F1903を含む。各構成要素は、システムバス1904を介して、相互に通信可能に接続されている。
図19は、情報処理装置1800のハードウェア構成の一例を示す図である。
情報処理装置1800は、CPU1900、主記憶装置1901、補助記憶装置1902、入出力I/F1903を含む。各構成要素は、システムバス1904を介して、相互に通信可能に接続されている。
CPU1900は、情報処理装置1800を制御する中央演算装置である。主記憶装置1901は、CPU1900のワークエリアやデータの一時的な保管場所として機能するRAM(Random Access Memory)等の記憶装置である。補助記憶装置1902は、各種のプログラム、設定データ、振動計測装置1801から出力される計測データ、診断情報等を記憶するROM(Read Only Memory)、HDD(Hard Disk Drive)、SSD(Solid State Drive)等の記憶装置である。入出力I/F1903は、振動計測装置1801等の外部の装置との間での情報のやり取りに利用されるインターフェースである。
CPU1900が、補助記憶装置1902等に記憶されたプログラムに基づき処理を実行することによって、図18で説明した情報処理装置1800の機能及び図20、21で後述するフローチャートの処理等が実現される。
CPU1900が、補助記憶装置1902等に記憶されたプログラムに基づき処理を実行することによって、図18で説明した情報処理装置1800の機能及び図20、21で後述するフローチャートの処理等が実現される。
(学習処理)
図20は、診断システムが実行する学習処理の一例を示すフローチャートである。図20を用いて、教師基底を学習により特定する処理を説明する。
本実施形態では、情報処理装置1800は、軸受106が外輪に疵のある状態である場合、軸受106が転動体に疵のある状態である場合、軸受106が内輪に疵のある状態である場合、軸受106に疵がなく正常な状態である場合、軸受106が外輪に疵のある状態である場合のそれぞれについて、予め、q(50)回、以下の処理を繰り返す。
図20は、診断システムが実行する学習処理の一例を示すフローチャートである。図20を用いて、教師基底を学習により特定する処理を説明する。
本実施形態では、情報処理装置1800は、軸受106が外輪に疵のある状態である場合、軸受106が転動体に疵のある状態である場合、軸受106が内輪に疵のある状態である場合、軸受106に疵がなく正常な状態である場合、軸受106が外輪に疵のある状態である場合のそれぞれについて、予め、q(50)回、以下の処理を繰り返す。
即ち、取得部1810は、振動計測装置1801により計測された振動の計測データyを取得する。取得部1810は、計測データyとして、ランダムに設定した時刻を時刻1とした場合の時刻1~Mまでの計測データであるy1~yMを取得する。そして、決定部1820は、取得した計測データyと、予め設定された定数Mと、修正された自己回帰モデルにおいて、ある時刻のデータを過去の幾つのデータで近似するかを示す数mと、に基づいて、式5と式7とを用いて自己相関行列Rを生成する。決定部1820は、予め記憶されているM、mの情報を読み出すことで、Mとmとを取得する。本実施形態では、mの値は、500である。また、Mは、mよりも大きい整数である。
そして、決定部1820は、生成した自己相関行列Rを特異値分解することで、式8の直交行列Uと対角行列Σを取得し、対角行列Σから自己相関行列Rの固有値σ11~σmmを取得する。決定部1820は、自己相関行列Rの複数の固有値であるσ11~σmmのうち、最大のものから使用固有値数sだけの固有値σ11~σssを、修正された自己回帰モデルの係数αを求めるのに利用する自己相関行列Rの固有値として選択する。本実施形態では、使用固有値数sは、3とするが、2以下としてもよいし、4以上としてもよい。そして、決定部1820は、計測データyと、固有値σ11~σssと、自己相関行列Rの特異値分解により得られた直交行列Uと、に基づいて、式13を用いて、修正された自己回帰モデルの係数αを決定する。そして、決定部1820は、決定した係数αを、非負値化して、学習データとして補助記憶装置1902に記憶する。非負値化は、例えば、係数αのそれぞれの成分に、係数αに含まれる0未満の最低の成分の値に-1をかけた値を足すことにより行われる。
これにより、情報処理装置1800は、軸受106が外輪に疵のある状態である場合、軸受106が転動体に疵のある状態である場合、軸受106が内輪に疵のある状態である場合、軸受106に疵がなく正常な状態である場合、軸受106が外輪に疵のある状態である場合のそれぞれについて、q(50)個ずつ修正された自己回帰モデルにおける係数αのデータを、学習データとして取得し、記憶することができる。
これにより、情報処理装置1800は、軸受106が外輪に疵のある状態である場合、軸受106が転動体に疵のある状態である場合、軸受106が内輪に疵のある状態である場合、軸受106に疵がなく正常な状態である場合、軸受106が外輪に疵のある状態である場合のそれぞれについて、q(50)個ずつ修正された自己回帰モデルにおける係数αのデータを、学習データとして取得し、記憶することができる。
本実施形態では、軸受106が取り得る状態は、疵のない正常な状態、内輪に疵がある状態、保持器に疵がある状態、転動体に疵がある状態、および外輪に疵がある状態の5つであるとする。即ち、軸受106が取り得る状態の数pは、5となる。
S2001において、学習部1830は、補助記憶装置1902に記憶されている学習データを取得する。
S2002において、学習部1830は、S2001で取得した学習データに基づいて、式19の行列Yを生成する。学習部1830は、m(500)×d(250)のサイズの行列を生成し、各列のデータを、学習データに含まれる各係数αの値とすることで、行列Yを生成する。また、m×pのサイズの行列Aを生成し、行列Aの各成分に、予め定められた初期値を設定する。また、p×dのサイズ行列Pを生成し、行列Pの各成分に、予め定められた初期値を設定する。
S2003において、学習部1830は、S2002で生成した行列Yと、行列Aと、行列Pと、予め定められた係数βと、予め定められた係数γと、に基づいて、式21を用いて、コスト関数Jの値を、コストとして求める。学習部1830は、求めたコストを、更新前コストとして、主記憶装置1901等に記憶する。
S2004において、学習部1830は、行列Yと、行列Aと、行列Pと、係数γと、サイズがp×pの全ての成分が1の行列である行列E2と、に基づいて、式34を用いて、行列Aを更新する。また、学習部1830は、更新した行列Aを、式35を用いて、更に更新する。また、学習部1830は、行列Yと、行列Aと、行列Pと、係数βと、サイズがm×pの全ての成分が1の行列である行列E1と、に基づいて、式30を用いて、行列Pを更新する。
S2005において、学習部1830は、行列Yと、S2003で更新した行列Aと、S2003で更新した行列Pと、係数βと、係数γと、に基づいて、式21を用いて、コスト関数Jの値を、コストとして求める。学習部1830は、求めたコストを、更新後コストとして、主記憶装置1901等に記憶する。
S2006において、学習部1830は、更新後コストと、更新前コストと、の差分の絶対値が、予め定められた閾値以下であるか否かを判定する。学習部1830は、更新後コストと、更新前コストと、の差分が、予め定められた閾値以下であると判定した場合、S2007の処理に進む。また、学習部1830は、更新後コストと、更新前コストと、の差分の絶対値が、予め定められた閾値よりも大きいと判定した場合、S2008の処理に進む。学習部1830は、S2006の処理の後、更新後コストを、新たな更新前コストとして、主記憶装置1901に記憶する。
S2007において、学習部1830は、主記憶装置1901等に記憶されたカウンタの値に1を加える。学習部1830は、このカウンタの値を、図20の処理の開始前に0に初期化している。
S2008において、学習部1830は、主記憶装置1901等に記憶されたカウンタの値を、0に初期化して、S2004の処理に進む。
S2008において、学習部1830は、主記憶装置1901等に記憶されたカウンタの値を、0に初期化して、S2004の処理に進む。
S2009において、学習部1830は、主記憶装置1901等に記憶されたカウンタの値が、予め定められた閾値以上であるか否かを判定する。学習部1830は、主記憶装置1901等に記憶されたカウンタの値が、予め定められた閾値以上であると判定した場合、コスト関数Jの値が極小値に収束したとして、S2010の処理に進む。学習部1830は、主記憶装置1901等に記憶されたカウンタの値が、予め定められた閾値未満であると判定した場合、S2004の処理に進む。
S2010において、学習部1830は、行列Pに基づいて、行列Aの各列のデータが示すパターンが、どの状態である軸受106に対応する修正された自己回帰モデルにおける係数αのパターンであるかを特定する。
行列Yのある列のデータは、行列Aと、行列Pにおけるその列と、をかけたデータとして求まる。即ち、行列Yのある列のデータは、行列Aの各列のデータを、行列Pのその列における各行の値を重みとして、重ね合せたデータとなる。そこで、学習部1830は、S2010で以下のようにして、行列Aの各列のデータが示すパターンが、どの状態である軸受106に対応する修正された自己回帰モデルにおける係数αのパターンであるかを特定する。
学習部1830は、行列Yの各列のうち、ある1つの状態である軸受106に対応する係数αを示すデータを格納する列を特定する。例えば、学習部1830は、行列Yの各列のうち、外輪に疵がある状態の軸受106に対応する係数αを示すデータを格納する列である1列目~q列目を特定する。そして、学習部1830は、行列Pにおける特定した列(1列目~q列目)について、行毎に値を集計する。そして、学習部1830は、集計した値のうち、最も大きいものに対応する行を特定する。学習部1830は、特定した行列Pの行とかけ合わされる行列Aの列を特定する。例えば、学習部1830は、行列Pの1行目を特定した場合、行列Pの1行目とかけ合わされる行列Aの列は、1列目なので、1列目を特定する。そして、学習部1830は、行列Aの特定した列が示すデータを、その状態である軸受106に対応する係数αの代表的なパターンを示すデータとして特定する。
学習部1830は、軸受106が取り得る各状態について、以上の処理を行うことで、行列Aの各列のデータが示すパターンが、どの状態である軸受106に対応する修正された自己回帰モデルにおける係数αのパターンであるかを特定する。
学習部1830は、特定した各状態の軸受106に対応する修正された自己回帰モデルにおける係数αの代表的なパターンを示す非負値のデータのうち、予め定められた状態の軸受106に対応するデータを、教師基底に属する基底ベクトルとして、補助記憶装置1902等に記憶する。本実施形態では、この予め定められた状態は、疵のない正常な状態であるとする。そのため、学習部1830は、正常な状態に対応する係数αのパターンを示すデータを、教師基底に属する基底ベクトルとして、補助記憶装置1902等に記憶する。
(診断処理)
本実施形態では、診断システムは、軸受106の状態が教師基底に対応する状態か否かを特定することで、軸受106の状態を診断することとする。ただし、他の例として、診断システムは、予め振動計測装置1801により計測された計測データに基づいて、軸受106の状態を診断することとしてもよいし、リアルタイムで振動計測装置1801により計測されて出力され続けている計測データを用いて、稼働中の軸受106の状態を診断することとしてもよい。
本実施形態では、診断システムは、軸受106の状態が教師基底に対応する状態か否かを特定することで、軸受106の状態を診断することとする。ただし、他の例として、診断システムは、予め振動計測装置1801により計測された計測データに基づいて、軸受106の状態を診断することとしてもよいし、リアルタイムで振動計測装置1801により計測されて出力され続けている計測データを用いて、稼働中の軸受106の状態を診断することとしてもよい。
図21は、診断処理の一例を示すフローチャートである。
S2101において、取得部1810は、振動計測装置1801により計測された振動の計測データyを取得する。取得部1810は、計測データyとして、振動の計測期間内からランダムに時刻を選択する。そして、取得部1810は、選択した時刻を時刻1として、時刻1~Mまでの計測データを、y1~yMとして取得する。
S2101において、取得部1810は、振動計測装置1801により計測された振動の計測データyを取得する。取得部1810は、計測データyとして、振動の計測期間内からランダムに時刻を選択する。そして、取得部1810は、選択した時刻を時刻1として、時刻1~Mまでの計測データを、y1~yMとして取得する。
S2102において、決定部1820は、S2101で取得した計測データyと、予め設定された定数Mと、修正された自己回帰モデルにおいて、ある時刻のデータを過去の幾つのデータで近似するかを示す数mと、に基づいて、式5と式7とを用いて自己相関行列Rを生成する。決定部1820は、予め記憶されているM、mの情報を読み出すことで、Mとmとを取得する。本実施形態では、mの値は、500である。また、Mは、mよりも大きい整数である。
S2103において、決定部1820は、S2102で生成した自己相関行列Rを特異値分解することで、式8の直交行列Uと対角行列Σを取得し、対角行列Σから自己相関行列Rの固有値σ11~σmmを取得する。
S2104において、決定部1820は、自己相関行列Rの複数の固有値であるσ11~σmmのうち、最大のものから使用固有値数sだけの固有値σ11~σssを、修正された自己回帰モデルの係数αを求めるのに利用する自己相関行列Rの固有値として選択する。本実施形態では、使用固有値数sは、3とするが、2以下としてもよいし、4以上としてもよい。そして、決定部1820は、計測データyと、固有値σ11~σssと、自己相関行列Rの特異値分解により得られた直交行列Uと、に基づいて、式13を用いて、修正された自己回帰モデルの係数αを決定する。S2104で決定された係数αは、計測データから決定された修正された自己回帰モデルにおける係数である修正係数の一例である。S2104で決定された係数αのパターンは、計測パターンの一例である。
S2105において、決定部1820は、予め定められた数q’個の係数αを決定したか否かを判定する。決定部1820は、予め定められた数q’個の係数αを決定したと判定した場合、処理をS2105に進め、予め定められた数q’個以下の係数αしか決定していないと判定した場合、処理をS2101に進め、係数αの決定処理を繰り返す。
S2106において、分解部1840は、補助記憶装置1902から、S2010で記憶された教師基底を取得する。
S2107において、分解部1840は、決定部1820により決定されたq’個の係数αを用いて、式37のように、m×q’のサイズのデータ行列Ydを生成する。即ち、データ行列Ydの各列が、S2104で決定された係数αのパターンのデータを格納することとなる。また、分解部1840は、データ行列Ydの各成分を、非負値化する。非負値化は、例えば、0未満の行列Yの成分のうち最低のものに-1をかけた値を、行列Yの各成分に足すことにより行われる。
S2108において、分解部1840は、教師基底を格納するm×1のサイズの教師基底行列Fを生成する。そして、分解部1840は、Fの各要素に、教師基底に属するデータを設定する。また、分解部1840は、データ行列Ydに含まれる教師基底の成分の重みを格納する1×q’のサイズの教師重み行列Gを生成する。また、分解部1840は、データ行列Ydから抽出されるパターンの集合である抽出基底を格納するm×予め定められた数nのサイズの行列Qを生成する。本実施形態では、nは1とする。また、分解部1840は、データ行列Ydに含まれる抽出基底の成分の重みを格納するn×q’のサイズの教師重み行列Wを生成する。
そして、分解部1840は、G、Q、Wそれぞれの各成分に予め定められた初期値を設定することで、G、Q、Wそれぞれを初期化する。
そして、分解部1840は、G、Q、Wそれぞれの各成分に予め定められた初期値を設定することで、G、Q、Wそれぞれを初期化する。
S2109において、分解部1840は、YdとFとGとQとWと予め定められた係数δ1、δ2、ε1、ε2と、に基づいて、式39を用いて、コスト関数Jdの値を、コストとして求める。本実施形態では、δ1、δ2、ε1、ε2それぞれの値は、0とする。分解部1840は、求めたコストを、更新前コストとして、主記憶装置1901等に記憶する。
S2110において、分解部1840は、G、Q、Wそれぞれを更新する。より具体的には、分解部1840は、Ydと、Fと、更新前のG、Q、Wと、予め定められた係数δ1(本実施形態では、0)と、サイズが1×q’の全ての成分が1の行列であるE3と、に基づいて、式46を用いて、Gを更新する。ただし、分解部1840は、本実施形態ではδ1が0なので、E3を用いずに、Gを更新してもよい。
また、分解部1840は、Ydと、Fと、更新前のG、Q、Wと、予め定められた係数ε1、ε2(本実施形態では、共に0)と、サイズがn×nの全ての成分が1の行列であるE4と、サイズが1×1の全ての成分が1の行列であるE5と、に基づいて、式52を用いて、Qを更新する。ただし、分解部1840は、本実施形態ではε1、ε2それぞれが0なので、E4とE5とを用いずに、Qを更新してもよい。
また、分解部1840は、Ydと、Fと、更新前のG、Q、Wと、予め定められた係数δ2(本実施形態では、0)と、サイズが1×q’の全ての成分が1の行列であるE6と、に基づいて、式58を用いて、Wを更新する。ただし、分解部1840は、本実施形態ではδ2が0なので、E6を用いずに、Qを更新してもよい。
S2111において、分解部1840は、Ydと、Fと、S2110で更新したG、Q、Wと、係数δ1、δ2、ε1、ε2と、に基づいて、式39を用いて、コスト関数Jdの値を、コストとして求める。分解部1840は、求めたコストを、更新後コストとして、主記憶装置1901等に記憶する。
S2112において、分解部1840は、更新後コストと、更新前コストと、の差分の絶対値が、予め定められた閾値以下であるか否かを判定する。分解部1840は、更新後コストと、更新前コストと、の差分の絶対値が、予め定められた閾値以下であると判定した場合、処理をS2113に進める。また、分解部1840は、更新後コストと、更新前コストと、の差分の絶対値が、予め定められた閾値よりも大きいと判定した場合、処理をS2114に進める。分解部1840は、S2112の処理の後、更新後コストを、新たな更新前コストとして、主記憶装置1901に記憶する。
S2113において、分解部1840は、主記憶装置1901等に記憶されたカウンタの値に1を加える。なお、分解部1840は、このカウンタの値を、図21の処理の開始前に0に初期化している。
S2114において、分解部1840は、主記憶装置1901等に記憶されたカウンタの値を、0に初期化して、処理をS2110に進める。
S2115において、分解部1840は、主記憶装置1901等に記憶されたカウンタの値が、予め定められた閾値以上であるか否かを判定する。分解部1840は、主記憶装置1901等に記憶されたカウンタの値が、予め定められた閾値以上であると判定した場合、コスト関数Jdの値が極小値に収束したとして、処理をS2116に進める。分解部1840は、カウンタの値が、予め定められた閾値未満であると判定した場合、処理をS2110に進める。
S2116において、診断部1850は、処理時点までに更新されたGとWとに基づいて、診断対象の軸受106の状態が教師基底に対応する状態であるか否かを診断する。診断部1850は、GとWとの各列について、要素同士を比較して、何れが大きいかを特定する。そして、診断部1850は、Gの要素の方がWの要素よりも大きい列の数が、予め定められた閾値以上である場合、診断対象の軸受106の状態が、教師基底に対応する状態(本実施形態では、正常な状態)であると診断する。予め定められた閾値は、例えば、GとWとの列数の75%の個数(本実施形態では150)である。また、診断部1850は、Gの要素の方がWの要素よりも大きい列の数が、予め定められた閾値未満である場合、診断対象の軸受106の状態が、教師基底に対応する状態ではないと診断する。
S2117において、出力部1860は、S2116での軸受106の診断の結果を示す情報を出力する。出力部1860は、例えば、表示装置に、軸受106の診断の結果を示す情報を表示することで出力する。また、他の例としては、出力部1860は、例えば、軸受106の診断の結果を示す情報を、補助記憶装置1902に記憶することで出力することとしてもよい。また、出力部1860は、例えば、外部のサーバ装置等の設定された送信先に、軸受106の診断の結果を示す情報を送信することで出力することとしてもよい。
(まとめ)
診断対象の軸受106の計測データから得られた係数αのパターンに含まれる、予め定められた状態に対応するパターンの成分の重みと、それ以外のパターンの成分の重みと、に基づいて、軸受106の状態が予め定められた状態か否かを適切に診断できるとの知見が実験3から見出された。本実施形態では、診断システムは、この知見に基づいた軸受106の診断処理を行う。
診断対象の軸受106の計測データから得られた係数αのパターンに含まれる、予め定められた状態に対応するパターンの成分の重みと、それ以外のパターンの成分の重みと、に基づいて、軸受106の状態が予め定められた状態か否かを適切に診断できるとの知見が実験3から見出された。本実施形態では、診断システムは、この知見に基づいた軸受106の診断処理を行う。
即ち、診断システムは、予め、疵のない正常な状態の軸受106に対応する修正された自己回帰モデルの係数αのパターンを、教師基底に属する基底ベクトルとして求める。そして、診断システムは、診断対象の軸受106から計測された計測データからq’個の修正された自己回帰モデルの係数αを求め、求めたq’個の係数αそれぞれのパターンを示すデータを格納するデータ行列Ydを生成する。そして、診断システムは、Ydを、Fと、教師基底の重みを示す教師重み行列Gと、抽出基底を示す抽出基底行列Qと、抽出基底の重みを示す抽出重み行列Wと、に分解する。診断システムは、Ydを分解して得られたGとWとに基づいて、診断対象の軸受106が教師基底に対応する状態であるか否かを診断する。これにより、診断システムは、軸受106が予め定められた状態であるか否かを適切に診断できる。
また、診断システムは、自己相関行列Rの固有値のうち一部の固有値を用いることで、軸受106の診断に有用な成分がより多く残り、有用でない成分がより残らないように、計測データを近似する修正された自己回帰モデルの係数αを決定する。診断システムは、このような係数αを用いて、軸受106の診断を行うことで、様々な周波数域の信号成分を含んだ信号を用いて診断を行う場合に比べて、より精度よく軸受106の診断を行うことができる。
(変形例1)
本実施形態では、診断システムは、鉄道台車の軸受106の状態診断を行うこととした。しかし、診断システムは、歯車等の回転体、振動子等の振動体、バネ等の伸縮体、生物の心臓等の周期的な運動を行う他の物体についての状態を診断することとしてもよい。
本実施形態では、診断システムは、鉄道台車の軸受106の状態診断を行うこととした。しかし、診断システムは、歯車等の回転体、振動子等の振動体、バネ等の伸縮体、生物の心臓等の周期的な運動を行う他の物体についての状態を診断することとしてもよい。
(変形例2)
本実施形態では、mは、予め設定された500という数であるとした。しかし、診断対象に応じて実験を行う等して適切に計測データを近似できる過去のデータの数を特定し、特定した数をmの値としてもよい。例えば、情報処理装置1800は、診断対象から計測された計測データについて、ある時刻の計測データを、その時刻よりも過去の計測データを複数用いて自己回帰モデル等を利用して近似して、近似した値とその時刻の計測データとの差分が設定された閾値未満となる場合の近似に用いられた過去の計測データの数を、mとして決定してもよい。
本実施形態では、mは、予め設定された500という数であるとした。しかし、診断対象に応じて実験を行う等して適切に計測データを近似できる過去のデータの数を特定し、特定した数をmの値としてもよい。例えば、情報処理装置1800は、診断対象から計測された計測データについて、ある時刻の計測データを、その時刻よりも過去の計測データを複数用いて自己回帰モデル等を利用して近似して、近似した値とその時刻の計測データとの差分が設定された閾値未満となる場合の近似に用いられた過去の計測データの数を、mとして決定してもよい。
(変形例3)
本実施形態では、情報処理装置1800は、使用固有値数sを3とした。しかし、情報処理装置1800は、以下のようにして、使用固有値数sの値を決定してもよい。即ち、情報処理装置1800は、まず、自己相関行列Rの固有値全ての合計値を求める。そして、情報処理装置1800は、自己相関行列Rの固有値のうち、最大のものからa個の合計が、求めた合計値の設定された割合(例えば90%)以上となるaのうち、最小のものを使用固有値数sとして決定してもよい。
本実施形態では、情報処理装置1800は、使用固有値数sを3とした。しかし、情報処理装置1800は、以下のようにして、使用固有値数sの値を決定してもよい。即ち、情報処理装置1800は、まず、自己相関行列Rの固有値全ての合計値を求める。そして、情報処理装置1800は、自己相関行列Rの固有値のうち、最大のものからa個の合計が、求めた合計値の設定された割合(例えば90%)以上となるaのうち、最小のものを使用固有値数sとして決定してもよい。
(変形例4)
本実施形態では、情報処理装置1800は、自己相関行列Rの固有値のうち、最大のものから、使用固有値数s個の固有値を用いて、修正された自己回帰モデルにおける係数αを決定することとした。しかし、情報処理装置1800は、自己相関行列Rの固有値のうち、任意のs個の固有値を用いて、修正された自己回帰モデルにおける係数αを決定することとしてもよい。例えば、情報処理装置1800は自己相関行列Rの固有値のうち、最大のものと、3つ目に大きいものと、の2つを利用して、修正された自己回帰モデルにおける係数αを決定することとしてもよい。
本実施形態では、情報処理装置1800は、自己相関行列Rの固有値のうち、最大のものから、使用固有値数s個の固有値を用いて、修正された自己回帰モデルにおける係数αを決定することとした。しかし、情報処理装置1800は、自己相関行列Rの固有値のうち、任意のs個の固有値を用いて、修正された自己回帰モデルにおける係数αを決定することとしてもよい。例えば、情報処理装置1800は自己相関行列Rの固有値のうち、最大のものと、3つ目に大きいものと、の2つを利用して、修正された自己回帰モデルにおける係数αを決定することとしてもよい。
(変形例5)
本実施形態では、式19に示す行列Yの各列には、複数の状態の軸受106に対応する計測データから決定された修正された自己回帰モデルにおける係数αが、状態毎に、q個ずつ格納されることとした。しかし、行列Yの各列には、複数の状態の軸受106に対応する計測データから決定された修正された自己回帰モデルにおける係数αが、状態毎に、異なる数ずつ格納されることとしてもよい。
本実施形態では、式19に示す行列Yの各列には、複数の状態の軸受106に対応する計測データから決定された修正された自己回帰モデルにおける係数αが、状態毎に、q個ずつ格納されることとした。しかし、行列Yの各列には、複数の状態の軸受106に対応する計測データから決定された修正された自己回帰モデルにおける係数αが、状態毎に、異なる数ずつ格納されることとしてもよい。
本実施形態では、診断システムは、行列Yを、同じ状態の軸受106に対応する係数αを格納する列が連続するように、生成した。しかし、診断システムは、同じ状態の軸受106に対応する係数αを格納する列が連続しないように、行列Yを生成してもよい。
本実施形態では、診断システムは、各列に各状態の軸受106に対応する係数αが格納された行列Yを生成し、行列Yを非負値行列因子分解により学習することで、各状態の軸受106に対応する係数αの代表的なパターンを特定した。しかし、診断システムは、例えば、学習データを取得する際の処理と同様の処理で、ある状態の軸受106に対応する係数αを複数決定し、決定した複数の係数αの平均を求めることにより学習することで、求めた平均の係数が示すパターンを、その状態の軸受106に対応する係数αの代表的なパターンとして特定してもよい。
(変形例6)
本実施形態では、診断部1850は、Ydの分解により求まったGとWとに基づいて、図21のS2116で説明した方法で軸受106の診断を行うこととした。しかし、診断部1850は、他の方法で、診断対象の軸受106の状態が教師基底に対応する状態であるか否かを診断してもよい。
本実施形態では、診断部1850は、Ydの分解により求まったGとWとに基づいて、図21のS2116で説明した方法で軸受106の診断を行うこととした。しかし、診断部1850は、他の方法で、診断対象の軸受106の状態が教師基底に対応する状態であるか否かを診断してもよい。
例えば、診断部1850は、以下のようにしてもよい。即ち、診断部1850は、Gの各要素について、偏差を求めて、偏差が小さいものから予め定められた数を特定し、特定したGの要素の平均値を求める。予め定められた数は、例えば、Gの全要素の70%の数(本実施形態では、140)である。また、診断部1850は、Wの各要素について、偏差を求めて、偏差が小さいものから予め定められた数を特定し、特定したWの要素の平均値を求める。予め定められた数は、例えば、Gの全要素の70%の数(本実施形態では、140)である。そして、診断部1850は、求めたGの要素の平均値がWの要素の平均値よりも予め定められた閾値以上大きい場合、診断対象の軸受106が教師基底に対応する状態であると診断する。一方、診断部1850は、求めたGの要素の平均値がWの要素の平均値よりも予め定められた閾値以上大きくない場合、診断対象の軸受106が教師基底に対応する状態でないと診断する。
また、診断部1850は、以下のようにしてもよい。即ち、診断部1850は、Gの各要素のうち値が中間の予め定められた数の要素の平均値を求める。予め定められた数は、例えば、Gの全要素の70%の数(本実施形態では、140)である。また、診断部1850は、Wの各要素のうち値が中間の予め定められた数の要素の平均値を求める。そして、診断部1850は、求めたGの要素の平均値がWの要素の平均値よりも予め定められた閾値以上大きい場合、診断対象の軸受106が教師基底に対応する状態であると診断する。一方、診断部1850は、求めたGの要素の平均値がWの要素の平均値よりも予め定められた閾値以上大きくない場合、診断対象の軸受106が教師基底に対応する状態でないと診断する。
(変形例7)
本実施形態では、データ行列Ydから抽出される、抽出基底に属する基底ベクトルの数(抽出基底行列Qの列数、抽出重み行列Wの行数)を1とした。ただし、データ行列Ydから抽出される、抽出基底に属する基底ベクトルの数を2以上としてもよい。その場合、S2116では、診断部1850は、以下のようにしてもよい。
本実施形態では、データ行列Ydから抽出される、抽出基底に属する基底ベクトルの数(抽出基底行列Qの列数、抽出重み行列Wの行数)を1とした。ただし、データ行列Ydから抽出される、抽出基底に属する基底ベクトルの数を2以上としてもよい。その場合、S2116では、診断部1850は、以下のようにしてもよい。
即ち、診断部1850は、診断部1850は、Gと、Wの各行それぞれと、の各列について、要素同士を比較して、何れが大きいかを特定する。そして、診断部1850は、Gの要素が最も大きい列の数が、予め定められた閾値以上である場合、診断対象の軸受106の状態が、教師基底に対応する状態であると診断する。一方、診断部1850は、Gの要素が最も大きい列の数が、予め定められた閾値未満である場合、診断対象の軸受106の状態が、教師基底に対応する状態ではないと診断する。
(変形例8)
本実施形態では、診断システムは、各列に係数αのパターンを示す非負値のデータを格納するように行列Ydを生成した。ただし、他の例として、診断システムは、各列ではなく各行に係数αのパターンを示す非負値のデータを格納するように行列Ydを生成してもよい。その場合、診断システムは、行列Ydを、Yd=GTFT+WTQTのように、分解すればよい。その場合、診断システムは、コスト関数Jdとして、式39における「FG+QW-Yd」の部分を「GTFT+WTQT-Yd」に置き換えた関数を用いればよい。
本実施形態では、診断システムは、各列に係数αのパターンを示す非負値のデータを格納するように行列Ydを生成した。ただし、他の例として、診断システムは、各列ではなく各行に係数αのパターンを示す非負値のデータを格納するように行列Ydを生成してもよい。その場合、診断システムは、行列Ydを、Yd=GTFT+WTQTのように、分解すればよい。その場合、診断システムは、コスト関数Jdとして、式39における「FG+QW-Yd」の部分を「GTFT+WTQT-Yd」に置き換えた関数を用いればよい。
(変形例9)
本実施形態では、診断システムは、診断対象の軸受106が疵のない正常な状態であるか否かを診断することとした。ただし、診断システムは、診断対象の軸受106が他の状態(例えば、外輪に特定の疵の有る状態、内輪に疵の有る状態、転動体に疵の有る状態等)であるか否かを診断することとしてもよい。
本実施形態では、診断システムは、診断対象の軸受106が疵のない正常な状態であるか否かを診断することとした。ただし、診断システムは、診断対象の軸受106が他の状態(例えば、外輪に特定の疵の有る状態、内輪に疵の有る状態、転動体に疵の有る状態等)であるか否かを診断することとしてもよい。
(変形例10)
本実施形態では、診断システムは、式39で表される関数Jdを、コスト関数として用いることとした。ただし、診断システムは、G、Q、Wの更新の指標となる関数であれば、他の関数をコスト関数として用いてもよい。例えば、診断システムは、式39で表される関数Jdの逆数で表される関数をコスト関数として用いてもよい。その場合、診断システムは、コスト関数の値を適正化(最大化)するため、G、Q、Wの値をコスト関数の値が増大するように更新していくこととなる。そして、診断システムは、コスト関数が収束したら、コスト関数の値が適正化(最大化)できたとして、その際のG、Q、Wを、Ydの分解結果として取得する。
本実施形態では、診断システムは、式39で表される関数Jdを、コスト関数として用いることとした。ただし、診断システムは、G、Q、Wの更新の指標となる関数であれば、他の関数をコスト関数として用いてもよい。例えば、診断システムは、式39で表される関数Jdの逆数で表される関数をコスト関数として用いてもよい。その場合、診断システムは、コスト関数の値を適正化(最大化)するため、G、Q、Wの値をコスト関数の値が増大するように更新していくこととなる。そして、診断システムは、コスト関数が収束したら、コスト関数の値が適正化(最大化)できたとして、その際のG、Q、Wを、Ydの分解結果として取得する。
ここで、最小化とは、コスト関数Jdの値を最小化する解を導出する最適化アルゴリズムにおいてコスト関数Jdを最小化することを指す。即ち、最小化とは、コスト関数の値の厳密な最小値を求めるものに限られない。このことは、最大化についても同じである。
(変形例11)
本実施形態では、診断システムは、図20の学習処理において、行列Pと行列Aとの更新前後で、コスト関数Jの値の変動が予め定められた閾値以下となることが、予め定められた回数連続するまで、行列Pと行列Aとの更新を繰り返した。これにより、診断システムは、コスト関数Jが最小化した際の行列Pと行列Aとを求めることとした。ただし、他の例として、診断システムは、以下のようにしてもよい。
本実施形態では、診断システムは、図20の学習処理において、行列Pと行列Aとの更新前後で、コスト関数Jの値の変動が予め定められた閾値以下となることが、予め定められた回数連続するまで、行列Pと行列Aとの更新を繰り返した。これにより、診断システムは、コスト関数Jが最小化した際の行列Pと行列Aとを求めることとした。ただし、他の例として、診断システムは、以下のようにしてもよい。
即ち、診断システムは、式30を用いて行列Pを更新し、式34、式35を用いて行列Aを更新することを繰り返す。そして、診断システムは、各更新段階において、更新後の行列P及び行列Aから、それぞれ更新前の行列P及び行列Aを引いた差である行列△P及び行列△Aを求める。診断システムは、行列△P及び行列△Aそれぞれのフロベニウスノルムを計算する。診断システムは、各更新段階における行列△P及び行列△Aのフロベニウスノルムの、それぞれ最初の更新段階における行列△P及び行列△Aのフロベニウスノルムに対する比が、予め定められた閾値以下となる更新段階をもって、コスト関数Jの値が収束したとする。そして、診断システムは、その際の行列Aと行列Pとをコスト関数Jを最小化させる行列として求める。
(変形例12)
本実施形態では、診断システムは、図21の診断処理において、G、Q、Wの更新前と更新後とでコスト関数Jdの値の変動が予め定められた閾値以下となることが、予め定められた回数連続するまで、G、Q、Wそれぞれの更新を繰り返すことで、コスト関数Jdの値が収束した際のG、Q、Wを求めることとした。ただし、他の例として、診断システムは、以下のようにしてもよい。
本実施形態では、診断システムは、図21の診断処理において、G、Q、Wの更新前と更新後とでコスト関数Jdの値の変動が予め定められた閾値以下となることが、予め定められた回数連続するまで、G、Q、Wそれぞれの更新を繰り返すことで、コスト関数Jdの値が収束した際のG、Q、Wを求めることとした。ただし、他の例として、診断システムは、以下のようにしてもよい。
即ち、診断システムは、式46を用いたGの更新と、式52を用いたQの更新と、式58を用いたWの更新と、を繰り返し行う。診断システムは、各更新段階において、更新後のG、Q、Wから、それぞれ更新前のG、Q、Wを引いた差であるΔG、ΔQ、ΔWについて、これらの行列のフロベニウスノルムを計算する。診断システムは、各更新段階におけるΔG、ΔQ、ΔWのフロベニウスノルムの、それぞれ最初の更新段階におけるΔG、ΔQ、ΔWのフロベニウスノルムに対する比が、予め定められた閾値以下となる更新段階をもって、コスト関数Jdの値が収束したとしてもよい。そして、診断システムは、Jdが収束した際のG、Q、Wを、コスト関数Jdを最小化させる行列として求めてもよい。
<実施形態2>
本実施形態では、コスト関数Jdにおける係数δ1、δ2、ε1、ε2のうちの少なくとも1つが0以外の値である場合の処理について説明する。
本実施形態では、コスト関数Jdにおける係数δ1、δ2、ε1、ε2のうちの少なくとも1つが0以外の値である場合の処理について説明する。
(実験4)
発明者らは、実験3と同様の実験状況において、以下のような実験を行った。即ち、疵のない正常な状態にある軸受106と、図13Cに示す外輪に微小な疵のある状態の軸受106と、について実験3で説明した実験と同様の実験を、式39に示すコスト関数Jdのδ1、δ2、ε2それぞれについて、値を変更しつつ行った。本実験では、使用固有値数sは、3とした。また、mは、500とした。
発明者らは、実験3と同様の実験状況において、以下のような実験を行った。即ち、疵のない正常な状態にある軸受106と、図13Cに示す外輪に微小な疵のある状態の軸受106と、について実験3で説明した実験と同様の実験を、式39に示すコスト関数Jdのδ1、δ2、ε2それぞれについて、値を変更しつつ行った。本実験では、使用固有値数sは、3とした。また、mは、500とした。
本実験では、δ2、ε1、ε2それぞれを0として、δ1の値を、0、0.00025、0.0005、0.00075、0.001それぞれに変更しつつ、実験3で説明した実験と同様の実験を行った。
また、本実験では、δ1、ε1、ε2それぞれを0として、δ2の値を、0、0.00005、0.00025、0.0005それぞれに変更しつつ、実験3で説明した実験と同様の実験を行った。
また、本実験では、δ1、δ2、ε1それぞれを0として、ε2の値を、0、0.025、0.05、0.1それぞれに変更しつつ、実験3で説明した実験と同様の実験を行った。
δ2、ε1、ε2それぞれを0として、δ1の値を変更しつつ、実験3で説明した実験と同様の実験を行った結果について説明する。δ1は、コスト関数Jdにおける教師重み行列Gのスパース性の向上に関する制約の項に係る係数である。以下では、スパース性の向上に関する制約を、スパース制約とする。即ち、δ1の値は、Ydの分解におけるGのスパース制約の度合を示す係数である。
図22A~図22Eに、外輪に微小な疵のある状態の軸受106についての実験結果を示す。また、図23A~図23Eに、正常な状態の軸受106についての実験結果を示す。図22A~図22E、および図23A~図23Eの各グラフは、データ行列Ydの分解の結果求まったGとWとを示すグラフである。横軸は、GとWとの各列のインデックスを示す。縦軸は、GとWとの対応する列の要素の値を示す。
図22A、図23Aのグラフは、δ1が0の場合の実験結果を示すグラフである。図22B、図23Bのグラフは、δ1が0.00025の場合の実験結果を示すグラフである。図22C、図23Cのグラフは、δ1が0.0005の場合の実験結果を示すグラフである。図22D、図23Dのグラフは、δ1が0.00075の場合の実験結果を示すグラフである。図22E、図23Eのグラフは、δ1が0.001の場合の実験結果を示すグラフである。
図22A~図22Eの各グラフを見ると、δ1が0.00025、0.0005、0.00075それぞれの場合、δ1が0の場合に比べて、Gの値とWの値とは、より分離しており、正常な状態と微小な疵のある状態との違いがより表れており、診断により有利になっていることが見て取れる。ただし、δ1が0.001の場合、δ1が0.00075の場合に比べて、Gの値とWの値とは、より近くなっており、正常な状態と微小な疵のある状態との違いが小さくなり、診断に不利になっていしまっていることが見て取れる。
図23A~図23Eの各グラフを見ると、δ1が0.00025、0.0005、0.00075、0.001それぞれの場合で、Gの値とWの値との分離の度合に顕著な違いが表れていないことが見て取れる。
発明者らは、図22A~図22E、図23A~図23Eの各グラフから、δ1が0.00025、0.0005、0.00075の場合において、軸受106の診断により有利であることを見出した。これにより、発明者らは、δ1の適切な値は、0.00025以上0.00075以下の範囲の値であるとの知見を得た。
次に、δ1、ε1、ε2それぞれを0として、δ2の値を変更しつつ、求まった実験結果について説明する。δ2は、コスト関数Jdにおける抽出重み行列Wのスパース制約の項に係る係数である。即ち、δ2の値は、Ydの分解におけるWのスパース制約の度合を示す係数である。
図24A~図24Dに、外輪に微小な疵のある状態の軸受106についての実験結果を示す。また、図25A~図25Dに、正常な状態の軸受106についての実験結果を示す。図24A~図24D、図25A~図25Dの各グラフは、データ行列Ydの分解の結果求まったGとWとを示すグラフである。横軸は、GとWとの各列のインデックスを示す。縦軸は、GとWとの対応する列の要素の値を示す。
図24A、図25Aのグラフは、δ2が0の場合の実験結果を示すグラフである。図24B、図25Bのグラフは、δ2が0.00005の場合の実験結果を示すグラフである。図24C、図25Cのグラフは、δ2が0.00025の場合の実験結果を示すグラフである。図24D、図25Dのグラフは、δ2が0.0005の場合の実験結果を示すグラフである。
図24A~図24Dの各グラフを見ると、δ2が0.00005の場合、δ2が0の場合と同等に、Gの値とWの値とが分離していることが見て取れる。また、δ2が0.00025、0.0005の場合、δ2が0、0.00005の場合に比べて、Gの値とWの値とがより近くなっており、正常な状態と微小な疵のある状態との違いが小さくなり、診断に不利になっていしまっていることが見て取れる。
図25A~図25Dの各グラフを見ると、δ2が0、0.00005それぞれの場合で、Gの値とWの値との分離の度合に顕著な違いが表れていないことが見て取れる。また、δ2が0.00025、0.0005それぞれの場合で、δ2が0、0.00005の場合に比べて、Gの値とWの値とがより分離してしまっており、正常な状態同士で違いが大きくなり、診断に不利になっていしまっていることが見て取れる。
発明者らは、図24A~図24B、図25A~図25Bの各グラフから、δ2が0.00025、0.0005それぞれの場合において、軸受106の診断により不利であることを見出した。これにより、発明者らは、δ2の適切な値は、0以上0.00005以下(好ましくは0以上0.00005未満)の範囲の値であるとの知見を得た。
次に、δ1、δ2、ε1それぞれを0として、ε2の値を変更しつつ、求まった実験結果について説明する。ε2は、コスト関数Jdにおける教師基底と抽出基底との直交性の向上に関する制約の項に係る係数である。以下では、直交性の向上に関する制約を、直交制約とする。即ち、ε2の値は、Ydの分解におけるFとQとの直交制約の度合を示す係数である。
図26A~図26Dに、外輪に微小な疵のある状態の軸受106についての実験結果を示す。また、図27A~図27Dに、正常な状態の軸受106についての実験結果を示す。図26A~図26D、図27A~図27Dの各グラフは、データ行列Ydの分解の結果求まったGとWとを示すグラフである。横軸は、GとWとの各列のインデックスを示す。縦軸は、GとWとの対応する列の要素の値を示す。
図26A、図27Aのグラフは、ε2が0の場合の実験結果を示すグラフである。図26B、図27Bのグラフは、ε2が0.025の場合の実験結果を示すグラフである。図26C、図26Cのグラフは、ε2が0.05の場合の実験結果を示すグラフである。図26D、図27Dのグラフは、ε2が0.1の場合の実験結果を示すグラフである。
図26A~図26Dの各グラフを見ると、ε2が0.05、0.1の場合、ε2が0、0.025の場合に比べて、Gの値とWの値とがより近くなっており、正常な状態と微小な疵のある状態との違いが小さくなり、診断に不利になっていしまっていることが見て取れる。
図27A~図27Dの各グラフを見ると、ε2が0.1の場合、ε2が0、0.025、0.05の場合に比べて、Gの値とWの値とがより分離してしまっており、正常な状態同士で違いが大きくなり、診断に不利になっていしまっていることが見て取れる。
発明者らは、図26A~図26D、図27A~図27Dの各グラフから、ε2が0.05、0.1それぞれの場合において、軸受106の診断により不利であることを見出した。これにより、発明者らは、ε2の適切な値は、0以上0.025以下の範囲の値であるとの知見を得た。
(診断処理)
本実施形態の診断システムのシステム構成は、実施形態1と同様である。また、情報処理装置1800のハードウェ構成及び機能構成についても、実施形態1と同様である。
本実施形態の診断システムのシステム構成は、実施形態1と同様である。また、情報処理装置1800のハードウェ構成及び機能構成についても、実施形態1と同様である。
本実施形態の処理は、診断システムがδ1、δ2、ε1、ε2の全てが0のコスト関数Jdの代わりにδ1、δ2、ε1、ε2のうちの少なくとも1つが0でないコスト関数Jdを用いること以外は、図20、図21で説明した実施形態1の処理と同様である。
本実施形態では、δ1の値は、実験により見出された適切な値の範囲(0.00025以上0.00075以下の範囲)から予め定められた値(例えば、0.00025、0.0005、0.00075等)である。また、δ2の値は、実験により見出された適切な値の範囲(0以上0.00005以下の範囲)から予め定められた値(例えば、0、0.000025、0.00005等)である。また、ε2の値は、実験により見出された適切な値の範囲(0以上0.025以下の範囲)から予め定められた値(例えば、0、0.01、0.025等)である。また、ε1の値は、予め定められた値(例えば、0等)である。
δ1、δ2、ε1、ε2のうちの少なくとも1つが0でないコスト関数Jdは、δ1、δ2、ε1、ε2のうちの0でない係数に対応する制約を付加した関数となる。そのため、δ1、δ2、ε1、ε2のうちの少なくとも1つが0でないコスト関数Jdは、教師重み行列Gについてのスパース制約、抽出重み行列についてのスパース制約、抽出基底の正規直交制約、および教師基底と抽出基底との間の直交制約のうちの少なくとも1つを示す。
(まとめ)
本実施形態の処理により、診断システムは、診断対象の軸受106が予め定められた状態であるか否かをより精度よく診断できる。尚、理論上は、式38に示す分解の自由度を低減させるために、コスト関数に抽出基底の正規直交制約と教師基底と抽出基底との間の直交制約とを付加するのが好ましい。本実施形態においても、実施形態1で説明した変形例を採用することができる。
本実施形態の処理により、診断システムは、診断対象の軸受106が予め定められた状態であるか否かをより精度よく診断できる。尚、理論上は、式38に示す分解の自由度を低減させるために、コスト関数に抽出基底の正規直交制約と教師基底と抽出基底との間の直交制約とを付加するのが好ましい。本実施形態においても、実施形態1で説明した変形例を採用することができる。
<その他の実施形態>
本実施形態では、情報処理装置1800は、補助記憶装置1902に記憶されたプログラムを実行することで、図20、図21の処理を実現することとした。しかし、情報処理装置1800は、外付けの記憶媒体や外部の記憶サーバ等に記憶されたプログラムを実行することで、図20、図21の処理を実現することとしてもよい。
本実施形態では、情報処理装置1800は、補助記憶装置1902に記憶されたプログラムを実行することで、図20、図21の処理を実現することとした。しかし、情報処理装置1800は、外付けの記憶媒体や外部の記憶サーバ等に記憶されたプログラムを実行することで、図20、図21の処理を実現することとしてもよい。
また、例えば、上述した情報処理装置1800の機能の一部又は全てをハードウェアとして情報処理装置1800に実装してもよい。
また、以上説明した本発明の実施形態は、何れも本発明を実施するにあたっての具体化の例を示したものに過ぎず、これらによって本発明の技術的範囲が限定的に解釈されてはならないものである。即ち、本発明はその技術思想、またはその主要な特徴から逸脱することなく、様々な形で実施することができる。
また、以上説明した本発明の実施形態は、何れも本発明を実施するにあたっての具体化の例を示したものに過ぎず、これらによって本発明の技術的範囲が限定的に解釈されてはならないものである。即ち、本発明はその技術思想、またはその主要な特徴から逸脱することなく、様々な形で実施することができる。
本発明は、例えば、周期的な運動を行う物体の状態を診断することに利用することができる。
Claims (11)
- 周期的な運動を行う物体の前記周期的な運動に係る計測データを取得する取得手段と、
前記取得手段により取得された前記計測データに基づいて、修正された自己回帰モデルにおける係数である修正係数を、予め定められた個数だけ決定する決定手段と、
前記決定手段により決定された前記個数の前記修正係数それぞれのパターンを示す非負値のデータが格納されたデータ行列を、教師基底行列と、教師重み行列と、抽出基底行列と、抽出重み行列と、に分解する分解手段と、
前記分解手段により前記データ行列が分解された前記教師重み行列と、前記抽出重み行列と、に基づいて、前記物体が前記予め定められた状態であるか否かを診断する診断手段と、
を有し、
前記修正された自己回帰モデルは、前記計測データの実績値と、前記実績値に対する前記修正係数と、を用いて、前記計測データの予測値を表す式であり、
前記決定手段は、前記計測データから導出される自己相関行列を特異値分解することで導出される前記自己相関行列の固有値を対角成分とする対角行列と、前記自己相関行列の固有ベクトルを列成分とする直交行列と、から導出される第1の行列を係数行列とし、前記計測データから導出される自己相関ベクトルを定数ベクトルとする方程式を用いて、前記修正係数を決定し、
前記自己相関ベクトルは、時差が1から前記修正された自己回帰モデルで用いられる前記実績値の数であるmまでの前記計測データの自己相関を成分とするベクトルであり、
前記自己相関行列は、時差が0からm-1までの前記計測データの自己相関を成分とする行列であり、
前記第1の行列は、1以上且つm未満の設定された数であるsに対して、前記自己相関行列のs個の固有値と前記対角行列とから導出される第2の行列Σsと、前記s個の固有値と前記直交行列とから導出される第3の行列Usと、から導出される行列UsΣsUs Tであり、
前記第2の行列は、前記対角行列の部分行列であって、前記s個の固有値を対角成分とする行列であり、
前記第3の行列は、前記直交行列の部分行列であって、前記s個の固有値に対応する固有ベクトルを列成分ベクトルとする行列であり、
前記教師基底行列は、教師基底を格納する非負値の行列であり、
前記教師重み行列は、前記教師基底の重みを示す非負値の行列であり、
前記抽出基底行列は、抽出基底を格納する非負値の行列であり、
前記抽出重み行列は、前記抽出基底の重みを示す非負値の行列であり、
前記教師基底は、前記物体の予め定められた状態に対応する前記修正係数のパターンを示す基底ベクトルの集合であり、
前記抽出基底は、前記物体の予め定められた状態に対応する前記修正係数のパターン以外の前記修正係数のパターンを示す基底ベクトルの集合であり、
前記分解手段は、前記教師基底行列と前記教師重み行列との積と前記抽出基底行列と前記抽出重み行列との積との和と、前記データ行列と、の差分に関するコスト関数の値を適正化するように、前記教師重み行列と前記抽出基底行列と前記抽出重み行列との値を更新することで、前記データ行列を、前記教師基底行列と前記教師重み行列と前記抽出基底行列と前記抽出重み行列とに分解する情報処理装置。 - 前記s個の固有値は、前記自己相関行列の固有値のうち、値が最大の固有値を含む請求項1記載の情報処理装置。
- 前記s個の固有値は、前記自己相関行列の固有値の中から、値が大きいものから順に選ばれた固有値である請求項2記載の情報処理装置。
- 前記自己相関行列は、前記計測データの予測値と当該計測データの予測値に対応する時刻における前記計測データの実測値との二乗誤差を最小化する条件を示す条件式に含まれる行列である請求項1乃至3何れか1項記載の情報処理装置。
- 前記コスト関数は、前記教師基底行列と前記教師重み行列との積と前記抽出基底行列と前記抽出重み行列との積との和と、前記データ行列と、の差分を評価する項と、前記教師重み行列のスパース性の向上に関する制約と、前記抽出重み行列のスパース性の向上に関する制約と、前記抽出基底の正規直交性の向上に関する制約と、前記教師基底と前記抽出基底との直交性の向上に関する制約と、のうちの少なくとも1つの制約を示す項とを含む請求項1乃至4何れか1項記載の情報処理装置。
- 前記コスト関数の値の適正化は、前記コスト関数の値の最小化また最大化である請求項1乃至5何れか1項記載の情報処理装置。
- 前記計測データは、前記物体の振動に係る計測データである請求項1乃至6何れか1項記載の情報処理装置。
- 前記診断手段による診断の結果に係る情報を出力する出力手段を更に有する請求項1乃至7何れか1項記載の情報処理装置。
- 前記物体は、鉄道台車に利用される軸受であり、
前記診断手段は、前記教師重み行列と、前記抽出重み行列と、に基づいて、前記物体の状態が、前記予め定められた状態である疵のない正常な状態であるか否かを診断する請求項1乃至8何れか1項記載の情報処理装置。 - 情報処理装置が実行する情報処理方法であって、
周期的な運動を行う物体の前記周期的な運動に係る計測データを取得する取得ステップと、
前記取得ステップで取得された前記計測データに基づいて、修正された自己回帰モデルにおける係数である修正係数を、予め定められた個数だけ決定する決定ステップと、
前記決定ステップで決定された前記個数の前記修正係数それぞれのパターンを示す非負値のデータが格納されたデータ行列を、教師基底行列と、教師重み行列と、抽出基底行列と、抽出重み行列と、に分解する分解ステップと、
前記分解ステップでの分解により前記データ行列が分解された前記教師重み行列と、前記抽出重み行列と、に基づいて、前記物体が前記予め定められた状態であるか否かを診断する診断ステップと、
を含み、
前記修正された自己回帰モデルは、前記計測データの実績値と、前記実績値に対する前記修正係数と、を用いて、前記計測データの予測値を表す式であり、
前記決定ステップでは、前記計測データから導出される自己相関行列を特異値分解することで導出される前記自己相関行列の固有値を対角成分とする対角行列と、前記自己相関行列の固有ベクトルを列成分とする直交行列と、から導出される第1の行列を係数行列とし、前記計測データから導出される自己相関ベクトルを定数ベクトルとする方程式を用いて、前記修正係数を決定し、
前記自己相関ベクトルは、時差が1から前記修正された自己回帰モデルで用いられる前記実績値の数であるmまでの前記計測データの自己相関を成分とするベクトルであり、
前記自己相関行列は、時差が0からm-1までの前記計測データの自己相関を成分とする行列であり、
前記第1の行列は、1以上且つm未満の設定された数であるsに対して、前記自己相関行列のs個の固有値と前記対角行列とから導出される第2の行列Σsと、前記s個の固有値と前記直交行列とから導出される第3の行列Usと、から導出される行列UsΣsUs Tであり、
前記第2の行列は、前記対角行列の部分行列であって、前記s個の固有値を対角成分とする行列であり、
前記第3の行列は、前記直交行列の部分行列であって、前記s個の固有値に対応する固有ベクトルを列成分ベクトルとする行列であり、
前記教師基底行列は、教師基底を格納する非負値の行列であり、
前記教師重み行列は、前記教師基底の重みを示す非負値の行列であり、
前記抽出基底行列は、抽出基底を格納する非負値の行列であり、
前記抽出重み行列は、前記抽出基底の重みを示す非負値の行列であり、
前記教師基底は、前記物体の予め定められた状態に対応する前記修正係数のパターンを示す基底ベクトルの集合であり、
前記抽出基底は、前記物体の予め定められた状態に対応する前記修正係数のパターン以外の前記修正係数のパターンを示す基底ベクトルの集合であり、
前記分解ステップでは、前記教師基底行列と前記教師重み行列との積と前記抽出基底行列と前記抽出重み行列との積との和と、前記データ行列と、の差分に関するコスト関数の値を適正化するように、前記教師重み行列と前記抽出基底行列と前記抽出重み行列との値を更新することで、前記データ行列を、前記教師基底行列と前記教師重み行列と前記抽出基底行列と前記抽出重み行列とに分解する情報処理方法。 - 周期的な運動を行う物体の前記周期的な運動に係る計測データを取得する取得ステップと、
前記取得ステップで取得された前記計測データに基づいて、修正された自己回帰モデルにおける係数である修正係数を、予め定められた個数だけ決定する決定ステップと、
前記決定ステップで決定された前記個数の前記修正係数それぞれのパターンを示す非負値のデータが格納されたデータ行列を、教師基底行列と、教師重み行列と、前抽出基底行列と、抽出重み行列と、に分解する分解ステップと、
前記分解ステップでの分解により前記データ行列が分解された前記教師重み行列と、前記抽出重み行列と、に基づいて、前記物体が前記予め定められた状態であるか否かを診断する診断ステップと、
を含むステップをコンピュータに実行させ、
前記修正された自己回帰モデルは、前記計測データの実績値と、前記実績値に対する前記修正係数と、を用いて、前記計測データの予測値を表す式であり、
前記決定ステップでは、前記計測データから導出される自己相関行列を特異値分解することで導出される前記自己相関行列の固有値を対角成分とする対角行列と、前記自己相関行列の固有ベクトルを列成分とする直交行列と、から導出される第1の行列を係数行列とし、前記計測データから導出される自己相関ベクトルを定数ベクトルとする方程式を用いて、前記修正係数を決定し、
前記自己相関ベクトルは、時差が1から前記修正された自己回帰モデルで用いられる前記実績値の数であるmまでの前記計測データの自己相関を成分とするベクトルであり、
前記自己相関行列は、時差が0からm-1までの前記計測データの自己相関を成分とする行列であり、
前記第1の行列は、1以上且つm未満の設定された数であるsに対して、前記自己相関行列のs個の固有値と前記対角行列とから導出される第2の行列Σsと、前記s個の固有値と前記直交行列とから導出される第3の行列Usと、から導出される行列UsΣsUs Tであり、
前記第2の行列は、前記対角行列の部分行列であって、前記s個の固有値を対角成分とする行列であり、
前記第3の行列は、前記直交行列の部分行列であって、前記s個の固有値に対応する固有ベクトルを列成分ベクトルとする行列であり、
前記教師基底行列は、教師基底を格納する非負値の行列であり、
前記教師重み行列は、前記教師基底の重みを示す非負値の行列であり、
前記抽出基底行列は、抽出基底を格納する非負値の行列であり、
前記抽出重み行列は、前記抽出基底の重みを示す非負値の行列であり、
前記教師基底は、前記物体の予め定められた状態に対応する前記修正係数のパターンを示す基底ベクトルの集合であり、
前記抽出基底は、前記物体の予め定められた状態に対応する前記修正係数のパターン以外の前記修正係数のパターンを示す基底ベクトルの集合であり、
前記分解ステップでは、前記教師基底行列と前記教師重み行列との積と前記抽出基底行列と前記抽出重み行列との積との和と、前記データ行列と、の差分に関するコスト関数の値を適正化するように、前記教師重み行列と前記抽出基底行列と前記抽出重み行列との値を更新することで、前記データ行列を、前記教師基底行列と前記教師重み行列と前記抽出基底行列と前記抽出重み行列とに分解するプログラム。
Priority Applications (1)
| Application Number | Priority Date | Filing Date | Title |
|---|---|---|---|
| JP2020565726A JP7036233B2 (ja) | 2019-01-09 | 2019-12-27 | 情報処理装置、情報処理方法及びプログラム |
Applications Claiming Priority (2)
| Application Number | Priority Date | Filing Date | Title |
|---|---|---|---|
| JP2019-002055 | 2019-01-09 | ||
| JP2019002055 | 2019-01-09 |
Publications (1)
| Publication Number | Publication Date |
|---|---|
| WO2020145215A1 true WO2020145215A1 (ja) | 2020-07-16 |
Family
ID=71521659
Family Applications (1)
| Application Number | Title | Priority Date | Filing Date |
|---|---|---|---|
| PCT/JP2019/051619 WO2020145215A1 (ja) | 2019-01-09 | 2019-12-27 | 情報処理装置、情報処理方法及びプログラム |
Country Status (2)
| Country | Link |
|---|---|
| JP (1) | JP7036233B2 (ja) |
| WO (1) | WO2020145215A1 (ja) |
Cited By (1)
| Publication number | Priority date | Publication date | Assignee | Title |
|---|---|---|---|---|
| US20220307941A1 (en) * | 2021-03-25 | 2022-09-29 | GM Global Technology Operations LLC | Method for early detection and prognosis of wheel bearing faults using wheel speed sensor |
Citations (2)
| Publication number | Priority date | Publication date | Assignee | Title |
|---|---|---|---|---|
| JP2013033196A (ja) * | 2011-07-07 | 2013-02-14 | Nara Institute Of Science & Technology | 音響処理装置 |
| JP2018163135A (ja) * | 2017-03-24 | 2018-10-18 | 新日鐵住金株式会社 | 情報処理装置、情報処理方法及びプログラム |
-
2019
- 2019-12-27 JP JP2020565726A patent/JP7036233B2/ja active Active
- 2019-12-27 WO PCT/JP2019/051619 patent/WO2020145215A1/ja active Application Filing
Patent Citations (2)
| Publication number | Priority date | Publication date | Assignee | Title |
|---|---|---|---|---|
| JP2013033196A (ja) * | 2011-07-07 | 2013-02-14 | Nara Institute Of Science & Technology | 音響処理装置 |
| JP2018163135A (ja) * | 2017-03-24 | 2018-10-18 | 新日鐵住金株式会社 | 情報処理装置、情報処理方法及びプログラム |
Cited By (1)
| Publication number | Priority date | Publication date | Assignee | Title |
|---|---|---|---|---|
| US20220307941A1 (en) * | 2021-03-25 | 2022-09-29 | GM Global Technology Operations LLC | Method for early detection and prognosis of wheel bearing faults using wheel speed sensor |
Also Published As
| Publication number | Publication date |
|---|---|
| JPWO2020145215A1 (ja) | 2021-09-30 |
| JP7036233B2 (ja) | 2022-03-15 |
Similar Documents
| Publication | Publication Date | Title |
|---|---|---|
| JP6848813B2 (ja) | 情報処理装置、情報処理方法及びプログラム | |
| Bafroui et al. | Application of wavelet energy and Shannon entropy for feature extraction in gearbox fault detection under varying speed conditions | |
| US20180217585A1 (en) | Sensor data fusion for prognostics and health monitoring | |
| Sanz et al. | Gear dynamics monitoring using discrete wavelet transformation and multi-layer perceptron neural networks | |
| JP6919397B2 (ja) | 情報処理装置、情報処理方法及びプログラム | |
| JP2014525097A (ja) | 予測および予想のための逐次カーネル回帰モデリングのシステム | |
| Urbas et al. | Machine learning based nominal root stress calculation model for gears with a progressive curved path of contact | |
| WO2020145215A1 (ja) | 情報処理装置、情報処理方法及びプログラム | |
| JP6580532B2 (ja) | 歯車装置のかみ合い状態推定方法およびプログラム | |
| de Souza et al. | Performance comparison of non-adaptive and adaptive optimization algorithms for artificial neural network training applied to damage diagnosis in civil structures | |
| Huang et al. | A kernel canonical correlation analysis approach for removing environmental and operational variations for structural damage identification | |
| US20210248293A1 (en) | Optimization device and optimization method | |
| Tang et al. | The research of soft yoke single point mooring tower system damage identification based on long-term monitoring data | |
| Wu et al. | Information reconstruction method for improved clustering and diagnosis of generic gearbox signals | |
| Sharma | Application of support vector machines for damage detection in structures | |
| Qiao | Structural damage detection using signal-based pattern recognition | |
| US10867369B2 (en) | Image data restoration apparatus and image data restoration method | |
| Talaei et al. | Transfer learning based bridge damage detection: Leveraging time-frequency features | |
| Harvey et al. | Structural health monitoring feature design by genetic programming | |
| JP2021179906A (ja) | 影響度算出プログラム、影響度算出装置、影響度算出方法 | |
| Tran et al. | Fault diagnosis of rotating machinery using wavelet-based feature extraction and support vector machine classifier | |
| Madabhushi | Quantification of Damage Using Indirect Structural Health Monitoring | |
| WO2022004662A1 (ja) | 要因分析装置、要因分析方法、及び要因分析プログラム | |
| Vazquez et al. | Fault Diagnosis Approach for Pedelec Drive Units Based on Support Vector Machines | |
| Moynihan et al. | Virtual sensing via Gaussian Process for bending moment response prediction of an offshore wind turbine using SCADA data |
Legal Events
| Date | Code | Title | Description |
|---|---|---|---|
| 121 | Ep: the epo has been informed by wipo that ep was designated in this application |
Ref document number: 19909459 Country of ref document: EP Kind code of ref document: A1 |
|
| ENP | Entry into the national phase |
Ref document number: 2020565726 Country of ref document: JP Kind code of ref document: A |
|
| NENP | Non-entry into the national phase |
Ref country code: DE |
|
| 122 | Ep: pct application non-entry in european phase |
Ref document number: 19909459 Country of ref document: EP Kind code of ref document: A1 |