WO2020136896A1 - 評価装置、及び、評価方法 - Google Patents
評価装置、及び、評価方法 Download PDFInfo
- Publication number
- WO2020136896A1 WO2020136896A1 PCT/JP2018/048568 JP2018048568W WO2020136896A1 WO 2020136896 A1 WO2020136896 A1 WO 2020136896A1 JP 2018048568 W JP2018048568 W JP 2018048568W WO 2020136896 A1 WO2020136896 A1 WO 2020136896A1
- Authority
- WO
- WIPO (PCT)
- Prior art keywords
- cell
- cells
- light
- cell mass
- unit
- Prior art date
- Legal status (The legal status is an assumption and is not a legal conclusion. Google has not performed a legal analysis and makes no representation as to the accuracy of the status listed.)
- Ceased
Links
Images




Classifications
-
- C—CHEMISTRY; METALLURGY
- C12—BIOCHEMISTRY; BEER; SPIRITS; WINE; VINEGAR; MICROBIOLOGY; ENZYMOLOGY; MUTATION OR GENETIC ENGINEERING
- C12M—APPARATUS FOR ENZYMOLOGY OR MICROBIOLOGY; APPARATUS FOR CULTURING MICROORGANISMS FOR PRODUCING BIOMASS, FOR GROWING CELLS OR FOR OBTAINING FERMENTATION OR METABOLIC PRODUCTS, i.e. BIOREACTORS OR FERMENTERS
- C12M1/00—Apparatus for enzymology or microbiology
- C12M1/34—Measuring or testing with condition measuring or sensing means, e.g. colony counters
-
- G—PHYSICS
- G01—MEASURING; TESTING
- G01N—INVESTIGATING OR ANALYSING MATERIALS BY DETERMINING THEIR CHEMICAL OR PHYSICAL PROPERTIES
- G01N21/00—Investigating or analysing materials by the use of optical means, i.e. using sub-millimetre waves, infrared, visible or ultraviolet light
- G01N21/62—Systems in which the material investigated is excited whereby it emits light or causes a change in wavelength of the incident light
- G01N21/63—Systems in which the material investigated is excited whereby it emits light or causes a change in wavelength of the incident light optically excited
Definitions
- the present invention relates to an evaluation device and an evaluation method.
- Patent Document 1 Japanese Patent Document 2 is known.
- the acquisition part which acquires the positional information on the cells contained in the cell cluster
- the light receiving part which receives the scattered light of the light emitted based on the positional information on the cells.
- An evaluation device is provided.
- the second aspect of the present embodiment based on the light receiving unit that receives the scattered light of the light irradiated to the cell mass by the cells included in the cell mass, and the signal related to the scattered light from the light receiving unit.
- An evaluation device is provided which includes an evaluation unit that evaluates a cell state.
- the 3rd aspect of this embodiment it is provided with the positional information on the cells contained in the cell cluster, and receiving the scattered light of the light emitted based on the positional information on the cells. , Evaluation methods are provided.
- the scattered light by the cells contained in the cell mass of the light with which the cell mass is irradiated is received, and the scattered light of the cell is detected based on the received scattered light signal. Evaluating the condition is provided.
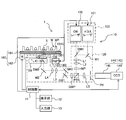
- FIG. 1 is a schematic diagram of an evaluation device 1 according to the present embodiment.
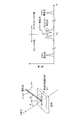
- FIG. 2 is an explanatory diagram for explaining scattered light generated when the sample is irradiated with light.
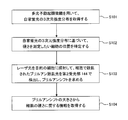
- FIG. 3 is a flowchart showing the procedure of a method for evaluating the state of cells contained in a cell mass.
- FIG. 4 is an explanatory diagram for explaining that the microscope apparatus 10 is used as a multiphoton excitation microscope and that the microscope apparatus 10 is used as a Burrian scattering microscope.
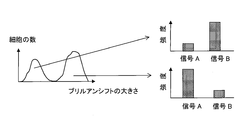
- FIG. 5 is an explanatory diagram showing that cells are classified based on information about their hardness by creating a histogram with the magnitude of Brillouin shift on the horizontal axis.
- FIG. 1 is a schematic diagram of an evaluation device 1 according to the present embodiment.
- FIG. 2 is an explanatory diagram for explaining scattered light generated when the sample is irradiated with light.
- FIG. 3 is a flowchart showing the procedure of a method for evaluating the state of cells contained in a cell mass.
- FIG. 6A is an explanatory diagram showing that the Brillouin scattered light scattered by a plurality of cells is received to obtain information on the hardness of the plurality of cells as a whole
- FIG. It is explanatory drawing which shows the frequency distribution of the spectrally separated Brillouin scattered light.
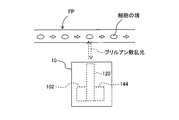
- FIG. 7 is an explanatory diagram for explaining acquisition of information regarding the hardness of cells flowing in the flow path using Brillouin scattered light.
- FIG. 8 is a schematic diagram of the evaluation device 1 according to the modification.
- FIG. 9A is a cross-sectional view in a predetermined cross section of a cell mass, and FIG. 9B shows the position of each region and the shift amount of Brillouin shift measured in the cells included in each region.
- FIG. 9(c) is a graph in which the average value is plotted, and Fig. 9(c) is the average value of the shift amount of the Brillouin shift measured in the position of the small area included in one area and the cells included in the small area.
- FIG. 9(d) is a graph showing the frequency distribution of Brillouin scattered light when measured for one of the cells, and FIG. 9(e) is for the one of the cells. Is an image showing the outline of cells obtained by measuring autofluorescence with a multiphoton excitation microscope, and FIG. 9(f) shows the distribution of the Brillouin shift amount in the image of FIG. 9(e). It is a superimposed composite image.
- FIG. 10 is an example of a screen displayed on the display unit 12.
- FIG. 11 is another example of the screen displayed on the display unit 12.
- an XYZ rectangular coordinate system is set and the positional relationship is explained based on this XYZ rectangular coordinate system.
- the Z-axis direction is set, for example, in the vertical direction
- the X-axis direction and the Y-axis direction are set, for example, in directions parallel to the horizontal direction and orthogonal to each other.
- a three-dimensional aggregate of a plurality of cells is referred to as a cell mass.
- the cell mass include tissue slices, cell spheroids, organoids and the like.
- the cell spheroid is a three-dimensional mass of three-dimensionally cultivated cells, and the organoid is a collection of small and simplified cells having some of the features of an organ.
- Organoids can be produced three-dimensionally in vitro by, for example, using pluripotent stem cells such as iPS cells and ES cells as raw materials and differentiating the cells while controlling the cell culture conditions. it can.
- the cell mass also includes cells that have spread two-dimensionally (for example, cell sheets).
- the cell sheet may be a single layer, may be laminated or may have a plurality of layers.
- three-dimensional culture is capable of constructing a more complex system having a three-dimensional structure, as compared to two-dimensional culture, and it is possible to construct a more similar environment in the living body. Therefore, there is a demand to apply a three-dimensionally cultured cell mass such as cell spheroids and organoids to fields such as basic research, drug discovery research, and regenerative medicine. Accordingly, it is desired to evaluate the state of cells contained in the cell mass.
- Detecting cell hardness is one of the methods for evaluating the state of cells contained in a cell mass.
- Cell hardness is an important factor in cell processes such as cell proliferation, cell death induction, and cancer cell metastasis.
- the hardness of cells changes depending on the density and structure of the constituents of cells including the cytoskeleton.
- an evaluation device 1 that can be applied to cells contained inside a cell mass will be described.
- the evaluation device 1 mainly includes a microscope device 10, a control unit 11, a display unit 12, and an input unit 13.
- the microscope device 10 mainly includes an illumination unit 100, an optical system 120, a light receiving unit 140, and a movable stage 160 on which the sample S is placed.
- the microscope apparatus 10 has two functions of a multiphoton excitation microscope and a Brillouin scattering microscope, and these functions can be switched.
- the microscope device 10 is an example of the acquisition unit of the present embodiment and an example of the light receiving unit of the present embodiment.
- the illumination unit 100 has a pulse laser 101 and a CW laser 102.
- the pulse laser 101 is a so-called femtosecond laser and can generate laser light with a pulse width of several tens of femtoseconds to several hundreds of femtoseconds.
- a titanium sapphire laser is used.
- the pulsed laser 101 can generate laser light in the infrared to near infrared region (wavelength of about 700 nm to about 1300 nm).
- the CW laser 102 is a continuous wave laser having a wavelength of 532 nm, and a semiconductor laser is used in this embodiment. A linearly polarized laser beam is emitted from the CW laser 102.
- the optical system 120 includes two dichroic mirrors DM1 and DM2, two mirrors M1 and M2, two galvano mirrors GM1 and GM2, five lenses L1 to L5, and ⁇ /2.
- the phase difference plate HWP, the ⁇ /4 phase difference plate QWP, the polarization beam splitter PBS, the objective lens OB, and the pinhole PH are provided.
- the objective lens OB includes a moving mechanism OB1 that moves the objective lens OB in the Z-axis direction. By moving the objective lens OB in the Z-axis direction by the moving mechanism OB1, the focal position of the objective lens OB can be moved in the Z direction.
- the optical path of the laser light will be described when the microscope device 10 is used as a Brillouin scattering microscope.
- the dichroic mirror DM2 is removed from the optical path by the turret TR.
- the linearly polarized laser light emitted from the CW laser 102 passes through the dichroic mirror DM1 and goes straight toward the lenses L1 and L2.
- the lenses L1 and L2 have a role of a beam expander, and a beam having a diameter larger than the diameter of the beam of light incident on the lens L1 can be emitted from L2.
- the dichroic mirror DM1 has a characteristic of transmitting the laser light (wavelength 532 nm) from the CW laser 102 and reflecting the laser light (wavelength about 700 nm to about 1300 nm) from the pulse laser 101.
- the laser light passing through the lenses L1 and L2 passes through the ⁇ /2 retardation plate HWP, and the polarization direction is adjusted so that it becomes S-polarized with respect to the polarization beam splitter PBS.
- the polarization beam splitter PBS has a characteristic of reflecting S polarized light and transmitting P polarized light.
- the laser light is reflected by the polarization beam splitter PBS, passes through the ⁇ /4 phase plate QWP, and is incident on the pair of galvanometer mirrors GM1 and GM2.
- the galvanomirrors GM1 and GM2 are reciprocating scanning scan mirrors, and by combining the two galvanomirrors GM1 and GM2, laser light can be scanned in the XY directions.
- the laser light emitted from the two Galvano mirrors GM1 and GM2 passes through the lenses L3 and L4, is reflected upward by the mirror M2, and enters the objective lens OB.
- the lenses L3 and L4 are a relay lens optical system.
- the scattered light scattered by the sample S travels in the opposite optical path and enters the ⁇ /4 retardation plate QWP. Since the light passes through the ⁇ /4 retardation plate QWP twice, the polarization state of the scattered light becomes P-polarized with respect to the polarization beam splitter PBS. Therefore, the scattered light passes through the polarization beam splitter PBS and goes straight.
- the scattered light that has passed through the polarization beam splitter PBS is condensed at the position of the pinhole PH by the lens L5, and then the scattered light that has passed through the pinhole PH enters the second light receiving section 144 of the light receiving section 140 described later.
- the optical path of the laser light will be described when the microscope apparatus 10 is used as a multiphoton excitation microscope.
- the dichroic mirror DM2 is inserted on the optical path by the turret TR.
- the laser light emitted from the pulse laser 101 is reflected by the mirror M1, then by the dichroic mirror DM1, and travels toward the lenses L1 and L2.
- the dichroic mirror DM1 has a characteristic of transmitting the laser light (wavelength 532 nm) from the CW laser 102 and reflecting the laser light (wavelength about 700 nm to about 1300 nm) from the pulse laser 101.
- the laser light from the pulse laser 101 travels along the same optical path as described above, passes through another dichroic mirror DM2, and is irradiated onto the sample S.
- the dichroic mirror DM2 transmits the laser light from the pulse laser 101 (wavelength about 700 nm to about 1300 nm) and has a shorter wavelength than the laser light from the pulse laser 101 (for example, fluorescence generated by a multiphoton excitation process described later). ) Is reflected.
- the fluorescence having a wavelength shorter than the wavelength of the laser light from the pulse laser 101 is emitted by a multiphoton excitation process in which two or more photons collide with one fluorescent molecule almost at the same time to excite the fluorescent molecule. ..
- a part of the fluorescence generated by the multiphoton excitation process travels backward in the optical path, is reflected by the dichroic mirror DM2, and enters the first light receiving section 142 of the light receiving section 140 described later.
- the light receiving section 140 has a first light receiving section 142 and a second light receiving section 144.
- the first light receiving section 142 receives the fluorescence emitted from the cells contained in the sample S when the microscope device 10 is used as a multiphoton excitation microscope when the dichroic mirror DM2 is inserted in the optical path by the turret TR.
- the first light receiving unit 142 has a photomultiplier tube PMT, and measures the intensity of fluorescence emitted from cells contained in the sample S.
- the second light receiving unit 144 detects the Brillouin scattered light when the microscope device 10 is used as a Brillouin scattering microscope because the dichroic mirror DM2 is removed from the optical path by the turret TR.
- the second light receiving section 144 has a spectroscope 145 and a CCD 146.
- the Brillouin scattered light is dispersed by the spectroscope 145 and observed by the CCD 146.
- the CCD 146 outputs a different signal depending on the position where the light is incident. In other words, the CCD 146 outputs a signal including position information of the position where the light is incident.
- the control unit 11 can obtain the Brillouin shift described later by using the output signal that is output from the CCD 146 and that includes the position information of the position where the light is incident.
- the movable stage 160 includes a stage 161 having an upper surface 161U parallel to the XY plane of FIG. 1, and a moving mechanism 162 that moves the stage 161 in the X, Y, and Z directions.
- a well plate WP containing the sample S is arranged on the upper surface 161U of the stage 161.
- the well plate WP is a transparent plate-shaped member, and a plurality of recesses (wells W) are two-dimensionally arranged on the surface thereof. Each well W can be used as a test tube or a petri dish.
- the moving mechanism 162 can adjust the position of the stage 161 in the X direction, the position in the Y direction, and the position in the Z direction under the control of the control unit 11. As a result, the position of the well plate WP placed on the upper surface 161U of the stage 161 can be adjusted, and the sample S placed in a desired well W in the well plate WP can be irradiated with laser light. ..
- the control unit 11 controls the operation of at least one of the illumination unit 100, the optical system 120, the light receiving unit 140, and the movable stage 160 of the microscope device 10.
- the control unit 11 also accepts settings and instructions for each unit of the microscope apparatus 10 through the input unit 13.
- the control unit 11 causes the display unit 12 to display a setting screen for receiving settings and instructions for each unit of the microscope apparatus 10.
- the input unit 13 has a mouse, a keyboard, a joystick, a touch panel, and the like (not shown) for inputting various instruction information.
- the display unit 12 has a setting screen, an instruction screen, a measurement screen, and a display screen for displaying a measurement result and the like.
- the control unit 11 can scan the irradiation position (focus position) of the laser light in the XY directions by controlling the driving of the galvano mirror GM. Further, the control unit 11 can adjust the position of the focal position of the laser light in the Z direction by changing the focal depth of the optical system 120. In this way, the control unit 11 can scan the focal position of the laser light in the XYZ directions.
- the control unit 11 acquires the three-dimensional mapping of the fluorescence intensity distribution and the Brillouin shift by using the fluorescence intensity and the Brillouin shift observed in the light receiving unit 140 when the laser light is irradiated to each position. be able to. For example, as described later, the control unit 11 can display the acquired image of the three-dimensional mapping on the display unit 12.
- the control unit 11 may be formed by dedicated hardware or may be formed by mounting a predetermined program on a personal computer.
- the control unit 11 and the microscope device 10 do not necessarily have to be formed as an integrated device.
- the control unit 11 may be a computer communicably connected to the microscope device 10 by wire or wirelessly.
- a multi-photon excitation microscope is a microscope that uses a multi-photon excitation process in which two or more photons are made to collide with one fluorescent molecule almost at the same time to excite the fluorescent molecule.
- the excitation wavelength can be set twice or more as compared with the one-photon excitation process in which one photon excites one fluorescent molecule. Therefore, it is possible to use a near-infrared laser having a wavelength longer than that of a visible light laser or an ultraviolet light laser and excellent in the transparency of living tissue.
- the multiphoton excitation process is an event that occurs when two or more photons collide with one fluorescent molecule almost at the same time, in order for the multiphoton excitation process to occur, the photons are concentrated temporally and spatially. I have to Therefore, as described above, a pulse laser capable of concentrating photons temporally is used as a light source when the microscope apparatus 10 is used as a multiphoton excitation microscope. Further, the multiphoton excitation process occurs near the focal position where the photons of the laser light are locally concentrated. Therefore, when the microscope apparatus 10 is used as a multiphoton excitation microscope, it is inevitable to observe the fluorescence emitted from the cells located near the focal position of the laser light.
- a Brillouin scattering microscope is a microscope that uses Brillouin scattered light generated when a sample is irradiated with light.
- most of the scattered light generated when the sample is irradiated with light is Rayleigh scattered light (elastically scattered light) having the same wavelength as that of the irradiated light, but as shown in FIG.
- Different scattered light (Raman scattered light and Brillouin scattered light) is also included.
- Raman scattering is inelastic scattering of light by molecules.
- Raman scattering the photon exchanges a part of the energy with the molecular vibration of the molecule in the sample, so that the frequency of the Rayleigh scattered light (the frequency of the irradiation light) and the frequency of the Raman scattered light are There is a difference between them. This difference in frequency is also called Raman shift. Raman scattering when a photon loses energy is called “Stokes”, and Raman scattering when a photon gains energy is called “anti-Stokes”. The chemical bond information of the molecule is reflected in the spectrum of the Raman scattered light.
- Brillouin scattering is inelastic scattering with light by a sound wave (acoustic phonon) propagating in a sample.
- the difference (Blurrian shift ⁇ B ) between the frequency of the illumination light and the frequency of the Brillouin scattered light is expressed by Equation 1 below.
- n is the refractive index of the sample
- ⁇ is the wavelength of the illumination light
- V is the speed of sound in the sample
- ⁇ is the angle between the illumination light and the Brillouin scattered light.
- the Brillouin shift ⁇ B is a physical quantity related to the elastic modulus E of the sample. Therefore, by measuring the Brillouin shift ⁇ B , the elastic modulus E of the sample, that is, the information about the hardness of the sample can be obtained. You can For example, in the present embodiment, a shift of 0.1 to 15 GHz is observed as a Brillouin shift, and if a shift is observed in that range, the sample can be considered to be hard.
- a well plate WP in which the sample S (cell mass) is contained in the well W is placed on the stage 161 (see FIG. 1).
- the control unit 11 controls the turret TR to insert the dichroic mirror DM2 into the optical path so that the microscope apparatus 10 is used as a multiphoton excitation microscope.
- the control unit 11 adjusts the focal depth of the optical system 120 and adjusts the position of the focal position of the laser light in the Z direction to a predetermined position.
- control unit 11 controls the driving of the galvanometer mirror GM to scan the irradiation position (focal position) of the laser light in the XY direction, and detects the autofluorescence of the cells at each position. In this way, the intensity distribution (XY distribution) of autofluorescence in the predetermined Z section is acquired.
- the autofluorescence is the fluorescence generated by the substance existing in the cell.
- control unit 11 adjusts the position of the focus position of the laser light in the Z direction to another position, and acquires the fluorescence intensity distribution (XY distribution) in another Z cross section in the same manner as described above.
- a three-dimensional intensity distribution (XYZ distribution) of autofluorescence is acquired (S101).
- the position resolution of the three-dimensional intensity distribution of autofluorescence depends on the size of the spot of the pulsed laser light from the pulsed laser 101.
- the position resolution in the XY directions is 1-2 ⁇ m
- the position resolution in the Z directions is about 5 ⁇ m. Since the cell size is generally 10 to 30 ⁇ m, the position of the cell in the sample S can be grasped with sufficient position resolution.
- the position of the cell whose hardness is to be measured is specified based on the acquired three-dimensional intensity distribution of autofluorescence (S102).
- the control unit 11 adjusts the depth of focus of the optical system 120 and the galvanometer mirror GM so that the position of the cell whose hardness is to be measured is irradiated with the laser light from the CW laser 102.
- the control unit 11 controls the turret TR to remove the dichroic mirror DM2 from the optical path so that the microscope apparatus 10 is used as a Brillouin scattering microscope.
- the microscope apparatus 10 irradiates the target cell with the laser light from the CW laser 102, detects the Brillouin scattered light scattered by the cell with the second light receiving unit 144, and obtains the Brillouin shift (S103).
- the control unit 11 acquires the information regarding the hardness of the cell from the magnitude of the Brillouin shift based on the above-described mathematical expression 1 (S104).
- the microscope apparatus 10 is used as a multiphoton excitation microscope, autofluorescence is detected to identify the position of the cells in the sample S, and then the microscope apparatus 10 is used as a burrian scattering microscope to measure the hardness of the cells. Information is obtained (see FIG. 4). Since autofluorescence is used, it is not necessary to stain the cells, and the cells can be easily detected. Moreover, since the position of the cell is specified by using the microscope device 10 as a multiphoton excitation microscope, the position of the cell can be surely grasped, and the information about the hardness of the cell at the desired position is acquired. can do. In the above method, a multiphoton excitation microscope was used and autofluorescence was used, but the method is not limited to this. Stained cells may be used.
- the hardness of cells can be evaluated by using the scattered light of the light with which the cells are irradiated. Therefore, the hardness of the cell can be evaluated in a non-contact manner without touching the cell. This makes it possible to suppress damage to cells due to measurement. Moreover, since the scattered light from the cells inside the cell mass can be received, the hardness of the cells inside the cell mass can be evaluated. This allows non-contact evaluation without touching the cells inside.
- a multiphoton excitation microscope was used as the microscope apparatus 10 to analyze the cell state inside the cell mass, but the method is not limited to this.
- OCT Optical Coherence Tomography
- the microscope 10 is used to analyze the cell state inside the cell cluster, but the present invention is not limited to this.
- the contour of the cell mass is imaged, and the diameter of the cell mass is calculated from the captured contour image. In this case, it may be possible to estimate the center position of the cell mass by using the estimation that the cell mass is spherical and obtain the information about the hardness of the cell at the estimated center position.
- the three-dimensional intensity distribution (XYZ distribution) of autofluorescence is acquired by using the microscope apparatus 10 as a multiphoton excitation microscope. Even when the microscope apparatus 10 is used as a Brillouin scattering microscope, it is possible to obtain a three-dimensional Brillouin shift mapping by operating the irradiation position of the laser light. By superimposing the three-dimensional intensity distribution of the autofluorescence and the three-dimensional mapping of the Brillouin shift, it is possible to obtain the information regarding the hardness of the plurality of cells included in the sample S.
- the position resolution of the three-dimensional Brillouin shift distribution depends on the size of the spot of the laser light from the CW laser 102.
- the position resolution in the XY directions is about 260 nm
- the position resolution in the Z directions is about 5 ⁇ m. Can be measured.
- the depth of the focal length of the microscope device 10 can be set up to about 50 ⁇ m. Assuming that the cell mass is substantially spherical and is substantially symmetrical in the Z direction, the entire cell mass can be evaluated by measuring the cell mass having a diameter of about 100 ⁇ m or less. Therefore, when measuring the three-dimensional intensity distribution of autofluorescence, the size of the diameter of the cell cluster is evaluated, and only the cell cluster having a cell cluster diameter of about 100 ⁇ m or less is extracted, and Brillouin scattered light is extracted. The Brillouin shift may be measured.
- a plurality of cells contained in the sample S can be classified based on the information on their hardness by creating a histogram with the magnitude of the Brillouin shift as the horizontal axis. ..
- cell hardness is an important factor in cell processes such as cell proliferation, cell death induction, and cancer cell metastasis. Therefore, it is not possible to classify cells based on information on their hardness. It is useful.
- FIG. 5 it is assumed that two peaks are obtained in the histogram with the magnitude of the Brillouin shift as the horizontal axis.
- the cells corresponding to the respective peaks may differ not only in the hardness of the cells but also in other properties (the properties corresponding to the signals A and B).
- cells can also be classified according to other properties (for example, cell states in cell processes such as cell proliferation, cell death induction, and cancer cell metastasis).
- the hardness of one cell was evaluated using one cell as a basic unit, but the present embodiment is not limited to such a form.
- the diameter of the spot of the pulse laser light from the pulse laser 101 can be 1 to 2 ⁇ m, and the diameter of the spot of the laser light from the CW laser 102 can be about 260 nm.
- the size of a nucleus in a cell is about 5 to 8 ⁇ m in diameter. Therefore, the pulse laser beam from the pulse laser 101 and the laser beam from the CW laser 102 are combined with the position of the nucleus and the nucleus in one cell. It is possible to irradiate separately from other positions. Thus, the hardness distribution inside one cell can be examined.
- DNA is contained in the nucleus, and the hardness of the nucleus is considered to change depending on the state of DNA. For example, in the state where DNA is condensed, it is considered that the DNA plays a role like a spring and contributes to increase the hardness of the nucleus. On the other hand, when the DNA is extended or broken, the hardness of the nucleus is considered to be reduced accordingly. In this way, by obtaining the information regarding the hardness of the nucleus in the cell, the state of the DNA contained in the nucleus can be evaluated.
- the hardness of one cell or the inside (nucleus, etc.) of one cell included in the cell mass was evaluated using one cell as a basic unit. It is not limited to such a form.
- the control unit 11 can adjust the optical system 120 to adjust the size of the spot of the laser beam from the CW laser 102 so that a plurality of cells in the cell mass are simultaneously irradiated. For example, by changing the objective lens, it is possible to change the size of the spot according to the objective lens. Further, it is possible to adjust the irradiation range by changing the swing width of the galvanometer mirror GM. As shown in FIG.
- a plurality of cells in a cell mass are simultaneously irradiated with laser light from the CW laser 102 to receive Brillouin scattered light scattered by the plurality of cells.
- the frequency distribution of the dispersed Brillouin scattered light is one cell as shown in FIG. 6B. Is wider than the frequency distribution of Brillouin scattered light scattered by.
- it is possible to collectively measure a region including a plurality of cells it is possible to shorten the measurement time required to acquire information regarding the hardness of the entire cell mass.
- the microscope apparatus 10 is used as a multiphoton excitation microscope to obtain position information of each cell included in the cell mass, and then the microscope apparatus 10 is used as a Brillouin scattering microscope to include the cell mass in the cell mass. I was getting information about the hardness of the cells.
- the present embodiment is not limited to such a form. For example, as shown in FIG. 7, it is possible to obtain information on the hardness of the cell using the Brillouin scattered light with respect to the cell mass flowing in the channel FP.
- the microscope apparatus 10 may include the optical system 120, the CW laser 102, and the second light receiving section 144.
- the hardness of the cell is evaluated as the evaluation of the state of the cell, but it is not limited to this.
- Information other than cell hardness may be evaluated from Brillouin scattering.
- information about viscosity and refractive index may be extracted and evaluated from Brillouin scattering.
- the microscope apparatus 10 is used as a Brillouin scattering microscope to detect Brillouin scattered light scattered by cells and acquire information on the hardness of the cells.
- the present embodiment is not limited to such a form.
- the microscope device 10 may be used as a Raman scattering microscope that detects Raman scattered light instead of Brillouin scattered light, and may detect Raman scattered light scattered by cells.
- the spectrum of Raman scattered light contains information on the chemical bond of a molecule, the state of the molecule contained in the cell can be evaluated using this.
- each component (illumination unit 100, optical system 120, light receiving unit 140, movable stage 160) of the microscope apparatus 10 can be changed as appropriate.
- the optical system 120 has been described while showing a specific optical element, but the present teaching is not limited to such a mode, and the number, types, and arrangement of the optical elements forming the optical system 120 are not limited thereto. Etc. can be changed appropriately.
- the laser light from the CW laser 102 and the laser light from the pulse laser 101 are configured to travel along the same optical path, but the present embodiment is not limited to such an embodiment. Absent.
- the laser light from the CW laser 102 and the laser light from the pulse laser 101 may be configured to travel different optical paths.
- the ⁇ /2 retardation plate HWP, the polarization beam splitter PBS, and the ⁇ /4 retardation plate QWP are arranged between the lens L2 and the galvano mirror GM1. It is not limited to such a form.
- the mirror M2 and the polarization beam splitter PBS are replaced with each other, and a ⁇ /2 phase difference plate HWP and a ⁇ /4 phase difference plate QWP are arranged upstream and downstream of the polarization beam splitter PBS, respectively. You may.
- the scattered light scattered in the sample S can be transmitted through the polarization beam splitter PBS.
- the lens L5, the pinhole PH, and the second light receiving unit 144 are arranged on the downstream side of the polarization beam splitter PBS as shown in FIG. 8, so that the scattered light transmitted through the polarization beam splitter PBS is transmitted to the second light receiving unit 144. I can guide you.
- control unit 11 uses the fluorescence intensity and the Brillouin shift observed in the light receiving unit 140 when irradiating each position with the laser light, and uses the fluorescence intensity distribution and the Brillouin shift.
- 3D mapping was acquired. As described above, the acquired image of the three-dimensional mapping can be displayed on the display unit 12. An example thereof will be described below.
- FIG. 9A shows a cross-sectional view of a cell mass at a predetermined cross section.
- the cell mass is divided into five regions (regions 91 to 95) according to the distance from the center of the cell mass.
- FIG. 9B is a graph plotting the position (distance from the center) of each region and the average value of the shift amount of Brillouin shift measured in cells included in each region, with respect to the regions 91 to 95. is there. Note that not only cells contained in each region of one cross section displayed on the screen but also cells contained in each region of other cross sections of the cell mass are targeted, and the average value of the shift amount of the Brillouin shift is calculated. Is calculated.
- FIG. 9A shows a cross-sectional view of a cell mass at a predetermined cross section.
- the cell mass is divided into five regions (regions 91 to 95) according to the distance from the center of the cell mass.
- FIG. 9B is a graph plotting the position (distance from the center) of each region
- FIG. 9C shows the position of each small area for a plurality of small areas (here, three small areas 951 to 953 in the area 95) in one of the areas 91 to 95. It is the graph which plotted the average value of the amount of shifts of Brillouin shift measured in the cell contained in each small field.
- FIG. 9D is a spectrum showing the frequency distribution of Brillouin scattered light when measured for one of the cells contained in the cell mass.
- FIG. 9( e) is an image showing the outline of cells obtained by measuring autofluorescence with a multiphoton excitation microscope for one cell included in a cell mass
- FIG. 9( f) is It is a composite image in which the distribution of the Brillouin shift amount is superimposed on the image of FIG.
- the display unit 12 can display at least one figure or plot as shown in FIGS. 9(a) to 9(f).
- the display unit 12 can display different information on each of the four divided screens.
- the screen 1 shown in FIG. 10 corresponds to the left half screen of the screen of the display unit 12 which is divided into two screens, left and right.
- the screen 2 corresponds to the upper screen of the screen on the right side of the screen 1 which is further divided into upper and lower parts.
- the screen 3 corresponds to the screen on the left side of the screen on the lower side of the screen 2 which is further divided into left and right.
- the screen 4 corresponds to the screen on the right side of the screen 3.
- the screen 1 displays a cross-sectional view of a cell mass as shown in FIG.
- FIG. 9A The cross-sectional view of the cell mass displayed on the screen 1 is divided into five regions as described above.
- FIG. 9B On the screen 2, as shown in FIG. 9B, the position of each region (distance from the center) and the average value of the shift amount of the Brillouin shift measured in the cells contained in each region are plotted. The graph is displayed.
- each area and the legend corresponding to each area can be selected by clicking with the mouse or touching with the touch panel.
- the part surrounded by the dotted line on the screen 2 (corresponding to the outermost region of the cell mass) is selected.
- the screen 3 displays a spectrum showing the frequency distribution of Brillouin scattered light of one of the cells included in the selected region as shown in FIG. 9D.
- FIG. 4 an image in which the distribution of the measured shift amount of the Brillouin shift is superimposed on the image showing the outer shape of the cell as shown in FIG. 9F is displayed.
- screens 3 and 4 display spectra and images actually measured in cells in which a shift amount that is substantially the same as the average Brillouin shift amount in the selected region is detected.
- the user can confirm the shift amount of Brillouin shift in each area of the cell mass from the diagram displayed on screen 1 and the plot displayed on screen 2. Also, the user can confirm the measurement data (frequency distribution of Brillouin scattered light and distribution of Brillouin shift amount) for one of the cells included in the region by selecting a desired region. ..
- the screen is divided into four in FIG. 10, this is merely an example, and the present invention is not limited to such an aspect.
- the screen may not be divided, and may be divided into an arbitrary number.
- only the screen 1 and the screen 2 may be initially displayed on the screen divided into two, and the screen is divided into four according to the user selecting the area, and the screen 3 and the screen 4 are Further, it may be displayed.
- the cross section of the cell mass is represented by a circle and is displayed as a quarter of that circle, but this is merely an example.
- the cross section of the cell mass may be illustrated in a shape corresponding to the outer shape of the cell mass.
- the shape of the entire cross section of the cell mass may be displayed, or the shape of a portion at an arbitrary ratio of the entire cross section of the cell mass may be displayed.
- the cross section of the cell mass displayed on the screen 1 the cross section of the cell mass is divided into five concentric regions, but this is merely an example.
- the display unit 12 can increase or decrease the number of divided regions in the cross section of the cell mass according to the size of the cell mass. Further, the display unit 12 can also arbitrarily set the shape of each divided area.
- a graph was displayed that plots the position of each area (distance from the center) and the average Brillouin shift amount measured in cells contained in each area.
- the display unit 12 displays the position of each small area and the cells contained in each small area on the screen 2 for the plurality of small areas 951 to 953 selected by the user as shown in FIG. 9C.
- the display unit 12 can display the shift amount of the Brillouin shift at any position on the cross section selected by the user.
- the control unit 11 When calculating the average value of the shift amount of the Brillouin shift, the control unit 11 removes the shift amount outside the predetermined range as noise and calculates the average value only for those within the predetermined range. May be. Further, instead of the average value of the shift amount of the Brillouin shift, or in addition to the average value of the shift amount of the Brillouin shift, the control unit 11 calculates and displays the median value and mode of the shift amount of the Brillouin shift. It may be displayed on the section 12.
- screens 3 and 4 display spectra and images measured in cells in which the shift amount of the Brillouin shift in the selected region is approximately the same as the average shift amount, but This is merely an example.
- the control unit 11 may calculate an average spectrum and an average image from the spectra and images measured by a plurality of cells included in the selected area, and display the average spectrum and the average image on the display unit 12.
- FIG. 10 a cross-sectional view of a cell mass divided into a plurality of regions and a graph plotting the average value of the shift amount of the Brillouin shift measured in the cells included in each divided region are displayed.
- the display unit 12 divides the shift amount of the Brillouin shift step by step, and the region corresponding to each shift amount is located at which position in the cross section of the cell mass. It is possible to display a diagram showing that.
- an image obtained by measuring the autofluorescence of the cross section shown in the screen 1 with a multiphoton excitation microscope is displayed.
- the image displayed on the screen 2 can be said to be an image showing the localization of the predetermined protein.
- the screen 1 and the screen 2 it is possible to compare the distribution of the shift amount of the Brillouin shift and the distribution of the predetermined protein.
- the image displayed on the screen 2 can be said to be an image showing the distribution of living cells.
- the display unit 12 can also display a composite image in which the screen 1 and the screen 2 are superimposed. In addition, the display unit 12 can delete and display a portion where the screen 1 and the screen 2 do not match each other.
Landscapes
- Chemical & Material Sciences (AREA)
- Health & Medical Sciences (AREA)
- Life Sciences & Earth Sciences (AREA)
- Bioinformatics & Cheminformatics (AREA)
- Engineering & Computer Science (AREA)
- Zoology (AREA)
- Analytical Chemistry (AREA)
- Organic Chemistry (AREA)
- General Health & Medical Sciences (AREA)
- Biotechnology (AREA)
- Biochemistry (AREA)
- Wood Science & Technology (AREA)
- General Engineering & Computer Science (AREA)
- Sustainable Development (AREA)
- Microbiology (AREA)
- Biomedical Technology (AREA)
- Genetics & Genomics (AREA)
- Medicinal Chemistry (AREA)
- Nuclear Medicine, Radiotherapy & Molecular Imaging (AREA)
- Physics & Mathematics (AREA)
- General Physics & Mathematics (AREA)
- Immunology (AREA)
- Pathology (AREA)
- Investigating, Analyzing Materials By Fluorescence Or Luminescence (AREA)
Abstract
3次元培養した細胞の塊を評価する評価装置を提供する。顕微鏡装置10は、多光子励起顕微鏡とブリルアン散乱顕微鏡の2つの機能を有している。顕微鏡装置10は、多光子励起顕微鏡として機能して、細胞の塊に含まれる細胞の位置情報を取得する。顕微鏡装置10は、ブリルアン散乱顕微鏡として機能して、前記細胞の位置情報に基づいて照射される光の散乱光を受光する。
Description
本発明は、評価装置、及び、評価方法に関する。
細胞の塊を観察することが知られている。例えば特許文献1もしくは特許文献2が知られている。
本実施形態の第1の態様に従えば、細胞の塊に含まれる細胞の位置情報を取得する取得部と、細胞の位置情報に基づいて照射される光の散乱光を受光する受光部を備える、評価装置が提供される。
本実施形態の第2の態様に従えば、細胞の塊に照射された光の、細胞の塊に含まれる細胞による散乱光を受光する受光部と、受光部からの散乱光に関する信号に基づいて、細胞の状態を評価する評価部を備える、評価装置が提供される。
本実施形態の第3の態様に従えば、細胞の塊に含まれる細胞の位置情報を取得することと、細胞の位置情報に基づいて照射される光の散乱光を受光することと、を備える、評価方法が提供される。
本実施形態の第4の態様に従えば、細胞の塊に照射された光の、細胞の塊に含まれる細胞による散乱光を受光することと、受光した散乱光に関する信号に基づいて、細胞の状態を評価することと、を備える、評価方法が提供される。
以下の記載においては、XYZ直交座標系を設定し、このXYZ直交座標系に基づいて位置関係を説明している。Z軸方向は、例えば鉛直方向に設定され、X軸方向及びY軸方向は、例えば、水平方向に平行で互いに直交する方向に設定される。
本明細書において、複数の細胞が3次元的に凝集したものを細胞の塊と呼んでいる。細胞の塊の例としては、組織切片、細胞スフェロイド、オルガノイド等が挙げられる。なお、細胞スフェロイドとは、3次元培養された細胞の3次元的な塊であり、オルガノイドとは、臓器の特色の一部を備えている、小さくて単純化された細胞の集まりである。オルガノイドは、例えば、iPS細胞やES細胞などの多能性幹細胞を原料として、細胞培養の条件を制御しつつ細胞を分化させることにより、3次元的に試験管内(in vitro)で作製することができる。また、細胞の塊には、2次元的に広がった細胞(例えば、細胞シート)も含まれる。細胞シートは単層でもよいし、積層されたものでも複数の層のあるものでも構わない。
上述のように、3次元培養は2次元培養と比較して、立体構造を持ったより複雑な系を構築することが可能であり、より生体内に類似した環境を構築することが可能である。そのため、細胞スフェロイドやオルガノイドのような3次元培養された細胞の塊を、基礎研究、創薬研究、再生医療などの分野において応用したいという要求がある。それに伴って、細胞の塊に含まれる細胞の状態を評価することが望まれている。
細胞の塊に含まれる細胞の状態を評価するための手法の1つとして、細胞の硬さを検出することが挙げられる。細胞の硬さは、細胞増殖や細胞死の誘導、さらには癌細胞の転移などの細胞過程に重要な因子である。また、細胞骨格をはじめとする細胞の構成物の密度やその構造により細胞の硬さが変わる。
本実施形態においては、細胞の塊の内部に含まれる細胞にも適用可能な評価装置1について説明する。
まず、図1を参照しつつ、本実施形態に係る評価装置1について説明する。評価装置1は、顕微鏡装置10と、制御部11と、表示部12と、入力部13とを主に備えている。
顕微鏡装置10は、照明部100と、光学系120と、受光部140と、試料Sが置かれる可動ステージ160とを主に備えている。顕微鏡装置10は、多光子励起顕微鏡とブリルアン散乱顕微鏡の2つの機能を有しており、これらの機能を切り替えることができる。顕微鏡装置10は、本実施形態の取得部の一例であり、且つ、本実施形態の受光部の一例である。
照明部100は、パルスレーザ101とCWレーザ102とを有している。パルスレーザ101は、いわゆるフェムト秒レーザであり、数十フェムト秒~数百フェムト秒のパルス幅のレーザ光を発生させることができる。本実施形態ではチタンサファイアレーザが用いられている。パルスレーザ101は、赤外から近赤外領域(波長約700nm~約1300nm)のレーザ光を発生させることができる。CWレーザ102は、波長532nmの連続波レーザであり、本実施形態では半導体レーザが用いられている。なお、CWレーザ102からは、直線偏光したレーザ光が発せられる。
図1に示されるように、光学系120は、2つのダイクロイックミラーDM1、DM2と、2つのミラーM1、M2と、2つのガルバノミラーGM1、GM2と、5つのレンズL1~L5と、λ/2位相差板HWPと、λ/4位相差板QWPと、偏光ビームスプリッタPBSと、対物レンズOBと、ピンホールPHとを備える。また、対物レンズOBは、対物レンズOBをZ軸方向に移動させる移動機構OB1を備えている。移動機構OB1が対物レンズOBをZ軸方向に移動させることで、対物レンズOBの焦点位置をZ方向に移動させることができる。
まず、顕微鏡装置10をブリルアン散乱顕微鏡として用いる場合について、レーザ光の光路を説明する。なお、この場合には、ターレットTRによりダイクロイックミラーDM2は光路上から取り除かれる。CWレーザ102から照射された直線偏光したレーザ光は、ダイクロイックミラーDM1を透過してレンズL1、L2に向かって直進する。レンズL1、L2はビームエクスパンダ―の役割を持っており、レンズL1に入射する光のビームの直径よりも大きい直径のビームをL2から出射することができる。ここで、ダイクロイックミラーDM1は、CWレーザ102からのレーザ光(波長532nm)を透過させ、パルスレーザ101からのレーザ光(波長約700nm~約1300nm)を反射する特性を有する。レンズL1,L2を通ったレーザ光は、λ/2位相差板HWPを通ることにより、偏光ビームスプリッタPBSに対してS偏光となるように偏光の向きが調整される。偏光ビームスプリッタPBSは、S偏光を反射し、P偏光を透過させる特性を有している。そのため、レーザ光は偏光ビームスプリッタPBSで反射されて、λ/4位相差板QWPを通って、1対のガルバノミラーGM1,GM2に入射する。ガルバノミラーGM1,GM2は、往復瑶動可能な走査ミラーであり、2つのガルバノミラーGM1,GM2を組み合わせることにより、レーザ光をX-Y方向に走査できる。
2つのガルバノミラーGM1、GM2を出たレーザ光は、レンズL3,L4を通った後、ミラーM2により上方にむけて反射され、対物レンズOBに入射する。なお、レンズL3,L4は、リレーレンズ光学系である。試料Sで散乱した散乱光は、光路を逆に進んでλ/4位相差板QWPに入る。λ/4位相差板QWPを2回通ることになるので、散乱光の偏光状態は、偏光ビームスプリッタPBSに対してP偏光となる。そのため、散乱光は偏光ビームスプリッタPBSを透過して直進する。偏光ビームスプリッタPBSを透過した散乱光はレンズL5によりピンホールPHの位置に集光された後、ピンホールPHを通過した散乱光は、後述の受光部140の第2受光部144に入る。
次に、顕微鏡装置10を多光子励起顕微鏡として用いる場合について、レーザ光の光路を説明する。なお、この場合には、ターレットTRによりダイクロイックミラーDM2は光路上に挿入される。
パルスレーザ101から照射されたレーザ光は、ミラーM1により反射された後、ダイクロイックミラーDM1により反射されて、レンズL1、L2に向かって進む。上述のように、ダイクロイックミラーDM1は、CWレーザ102からのレーザ光(波長532nm)を透過させ、パルスレーザ101からのレーザ光(波長約700nm~約1300nm)を反射する特性を有する。パルスレーザ101からのレーザ光は、上記と同じ光路を進んで、もう一つのダイクロイックミラーDM2を透過して、試料Sに照射される。ダイクロイックミラーDM2は、パルスレーザ101からのレーザ光(波長約700nm~約1300nm)を透過させ、パルスレーザ101からのレーザ光よりも波長の短い光(例えば、後述の多光子励起過程により発生する蛍光)を反射する特性を有する。試料Sにおいて、2つ以上の光子が1つの蛍光分子にほぼ同時に衝突して蛍光分子を励起させる多光子励起過程により、パルスレーザ101からのレーザ光の波長よりも短い波長の蛍光が放出される。多光子励起過程により発生した蛍光の一部は、光路を逆に進んで、ダイクロイックミラーDM2により反射されて、後述の受光部140の第1受光部142に入る。
受光部140は、第1受光部142と第2受光部144とを有する。第1受光部142は、ターレットTRによりダイクロイックミラーDM2が光路上に挿入されて、顕微鏡装置10を多光子励起顕微鏡として用いるときに、試料Sに含まれる細胞から発せられる蛍光を受光する。第1受光部142は、光電子増倍管PMTを有し、試料Sに含まれる細胞から発せられる蛍光の強度を計測する。第2受光部144は、ターレットTRによりダイクロイックミラーDM2が光路上から取り除かれて、顕微鏡装置10をブリルアン散乱顕微鏡として用いるときに、ブリルアン散乱光を検出する。第2受光部144は、分光器145とCCD146とを有する。ブリルアン散乱光は、分光器145によって分光され、CCD146で観測される。CCD146は、光が入射した位置に応じて異なる信号を出力する。言い換えると、CCD146は、光が入射した位置の位置情報を含む信号を出力する。CCD146から出力される、光が入射した位置の位置情報を含む出力信号を用いて、制御部11は、後述のブリルアンシフトを求めることができる。
可動ステージ160は、図1のXY平面に平行な上面161Uを有するステージ161と、ステージ161をX方向、Y方向及びZ方向に移動させる移動機構162とを備えている。ステージ161の上面161Uには、試料Sが入ったウェルプレートWPが配置される。ウェルプレートWPは、透明な板状の部材であり、その表面には複数のくぼみ(ウェルW)が2次元的に配置されている。それぞれのウェルWは、試験管またはシャーレとして利用することができる。移動機構162は、制御部11の制御のもとで、ステージ161のX方向の位置、Y方向の位置、Z方向の位置をそれぞれ調整することができる。これにより、ステージ161の上面161Uに置かれたウェルプレートWPの位置を調整することができ、ウェルプレートWP内の所望のウェルWに入れられた試料Sに対してレーザ光を照射することができる。
制御部11は、顕微鏡装置10の照明部100、光学系120、受光部140、可動ステージ160の各部の少なくとも一つの動作を制御する。また、制御部11は、入力部13を通じて顕微鏡装置10の各部に対する設定及び指示を受け付ける。制御部11は顕微鏡装置10の各部に対する設定及び指示を受け付けるための設定画面を表示部12に表示させる。入力部13は、各種指示情報を入力する不図示のマウス、キーボード、ジョイスティック、タッチパネルなどを有する。表示部12は設定画面、指示画面、計測画面、計測結果などを表示する表示画面を有する。
制御部11は、ガルバノミラーGMの駆動を制御することによってレーザ光の照射位置(焦点位置)をX-Y方向に走査することができる。さらに、制御部11は、光学系120の焦点深さを変えることによって、レーザ光の焦点位置のZ方向の位置を調整することができる。このようにして、制御部11は、レーザ光の焦点位置をX-Y-Z方向に走査させることができる。これにより、制御部11は、レーザ光を各位置に照射したときに、受光部140で観測される蛍光の強度及びブリルアンシフトを用いて、蛍光の強度分布及びブリルアンシフトの3次元マッピングを取得することができる。例えば、後述のように、制御部11は、取得した3次元マッピングの画像を表示部12に表示させることができる。
なお、制御部11は、専用のハードウェアにより形成されていてもよく、パーソナルコンピュータに所定のプログラムを実装することにより形成されていてもよい。制御部11と顕微鏡装置10とは、必ずしも一体の装置として形成されていなくてもよい。例えば、制御部11は、有線又は無線により顕微鏡装置10に通信可能に接続されたコンピュータであってもよい。
次に、顕微鏡装置10が有する機能である多光子励起顕微鏡とブリルアン散乱顕微鏡について、詳細に説明する。
多光子励起顕微鏡とは、2つ以上の光子を1つの蛍光分子にほぼ同時に衝突させて蛍光分子を励起させる多光子励起過程を利用した顕微鏡である。多光子励起過程を利用する場合には、1つの蛍光分子を1光子が励起させる1光子励起過程と比べて、励起波長を2倍以上に設定することができる。そのため、可視光レーザや紫外光レーザよりも波長が長く、生体組織の透過性に優れる近赤外光レーザを用いることができる。
また、多光子励起過程は、2つ以上の光子が1つの蛍光分子にほぼ同時に衝突したときに起こる事象であるので、多光子励起過程が起きるためには、光子が時間的、場所的に集中していなければならない。そのため、顕微鏡装置10を多光子励起顕微鏡として用いるときの光源として、前述のように、光子を時間的に集中させることができるパルスレーザが用いられる。さらに、多光子励起過程は、レーザ光の光子が局所的に集中する焦点位置近傍で発生する。そのため、顕微鏡装置10を多光子励起顕微鏡として用いる場合には、必然的に、レーザ光の焦点位置近傍に位置する細胞から発せられる蛍光を観測することができる。
ブリルアン散乱顕微鏡とは、試料に光を照射した際に発生するブリルアン散乱光を利用した顕微鏡である。ここで、試料に光を照射した際に発生する散乱光のほとんどは、照射光と同じ波長のレイリー散乱光(弾性散乱光)であるが,図2に示されるように、照射光と波長の異なる散乱光(ラマン散乱光とブリルアン散乱光)も含まれている。なお、ラマン散乱とは、分子による光との非弾性散乱である。ラマン散乱においては、光子がエネルギーの一部を試料内の分子の分子振動と交換することに起因して、レイリー散乱光の振動数(照射光の振動数)とラマン散乱光の振動数との間に差が生じる。この振動数の差は、ラマンシフトとも呼ばれる。光子がエネルギーを損失した場合のラマン散乱は「ストークス」と呼ばれ、光子がエネルギーを獲得した場合のラマン散乱は「アンチストークス」と呼ばれる。ラマン散乱光を分光したスペクトルには分子の化学結合情報が反映される。
これに対して、ブリルアン散乱は、試料中を伝搬する音波(音響フォノン)による光との非弾性散乱である。照明光の振動数とブルリアン散乱光の振動数との差(ブルリアンシフトνB)は、以下の数式1で表される。なお、数式1において、nは試料の屈折率であり、λは照明光の波長であり、Vは試料中の音速であり、θは照明光とブルリアン散乱光との角度である。試料中の音速Vは試料の弾性率Eと試料の密度ρを用いて、V=(E/ρ)1/2と表すことができる。

このように、ブリルアンシフトνBは、試料の弾性率Eに関連する物理量であるため、ブリルアンシフトνBを測定することにより、試料の弾性率E、すなわち、試料の硬さに関する情報を得ることができる。例えば、本実施形態においては、0.1から15GHzのシフトをブリルアンシフトとして観測し、その範囲において、シフトが観測された場合には、試料が硬くなったものとすることが可能である。
次に、評価装置1を用いて、細胞の塊に含まれる細胞の状態を評価する方法について図3を参照しつつ説明する。ウェルWに試料S(細胞の塊)が入ったウェルプレートWPを、ステージ161に配置する(図1参照)。顕微鏡装置10を多光子励起顕微鏡として用いるように、制御部11はターレットTRを制御してダイクロイックミラーDM2を光路上に挿入する。制御部11が、光学系120の焦点深さを調整し、レーザ光の焦点位置のZ方向の位置を所定の位置に調整する。そして、制御部11が、ガルバノミラーGMの駆動を制御して、レーザ光の照射位置(焦点位置)をX-Y方向に走査しつつ、各位置において、細胞の自家蛍光を検出する。このようにして、所定のZ断面における自家蛍光の強度分布(X-Y分布)を取得する。なお、自家蛍光とは、細胞内に存在する物質が発生する蛍光のことである。次に、制御部11が、レーザ光の焦点位置のZ方向の位置を別の位置に調整し、上述と同様にして別のZ断面における蛍光の強度分布(X-Y分布)を取得する。これをZ位置の所望の範囲にわたって繰り返すことにより、自家蛍光の3次元強度分布(X-Y-Z分布)を取得する(S101)。これにより、試料S中の細胞の位置を把握することができる。なお、自家蛍光の3次元強度分布の位置分解能は、パルスレーザ101からのパルスレーザ光のスポットの大きさに依存する。本実施形態においては、XY方向の位置分解能は1~2μmであり、Z方向の位置分解能は約5μmである。なお、一般に細胞の大きさは10~30μmであるので、十分な位置分解能で試料S中の細胞の位置を把握することができる。
次に、取得した自家蛍光の3次元強度分布に基づいて、硬さを測定したい細胞の位置を特定する(S102)。制御部11は、硬さを測定したい細胞の位置に、CWレーザ102からのレーザ光が照射されるように、光学系120の焦点深さ及びガルバノミラーGMを調整する。そして、顕微鏡装置10をブリルアン散乱顕微鏡として用いるように、制御部11はターレットTRを制御してダイクロイックミラーDM2を光路上から取り除く。顕微鏡装置10は、CWレーザ102からのレーザ光を目的の細胞に照射して、細胞によって散乱されたブリルアン散乱光を第2受光部144で検出し、ブリルアンシフトを求める(S103)。制御部11は、ブリルアンシフトの大きさから、上記の数式1に基づいて、細胞の硬さに関する情報を取得する(S104)。
上記の方法においては、顕微鏡装置10を多光子励起顕微鏡として用いて、自家蛍光を検出して試料S中の細胞の位置を特定した後、顕微鏡装置10をブルリアン散乱顕微鏡として用いてその細胞の硬さに関する情報を取得している(図4参照)。自家蛍光を利用しているので、細胞を染色する必要がなく、容易に細胞を検出できる。また、先に顕微鏡装置10を多光子励起顕微鏡として用いて、細胞の位置を特定しているので、細胞の位置を確実に把握することができ、所望の位置の細胞の硬さに関する情報を取得することができる。なお、上記方法では、多光子励起顕微鏡を用い、自家蛍光を用いていたがこれに限られない。染色された細胞を用いても構わない。
本実施形態においては、細胞に照射された光の散乱光を用い、細胞の硬さを評価することができる。従って、細胞の硬さを細胞に触れることなく非接触で評価することができる。これにより、計測による細胞への損傷を抑制することができる。また、細胞の塊の内部の細胞からの散乱光を受光することができるので、細胞の塊の内部の細胞の硬さを評価することができる。これにより、内部の細胞に触れることなく非接触で評価することができる。
なお、上記方法では、顕微鏡装置10に多光子励起顕微鏡を用い、細胞塊の内部の細胞状態を解析していたがこれに限られない。例えば、OCT(Optical Coherence Tomography:光干渉断層撮影)でも構わない。なお、上記方法では、顕微鏡装置10を用い、細胞塊の内部の細胞状態を解析していたが、これに限られない。例えば、細胞塊の輪郭を撮像し、撮像された輪郭画像から、細胞の塊の直径を算出する。この場合に細胞塊を球状であるとの推定を用い、細胞の塊の中心位置を推定し、推定された中心位置における細胞の硬さに関する情報を取得しても構わない。なお、上記方法では、所望の位置にある細胞を特定し、特定された細胞について、細胞の硬さに関する情報を取得していた。しかしながら、硬さに関する情報を取得する細胞を必ずしも特定しなくてもよい。上記方法では、顕微鏡装置10を多光子励起顕微鏡として用いて、自家蛍光の3次元強度分布(X-Y-Z分布)を取得している。顕微鏡装置10をブリルアン散乱顕微鏡として用いた場合にも、レーザ光の照射位置を操作することにより、ブリルアンシフトの3次元マッピングを取得することができる。自家蛍光の3次元強度分布とブリルアンシフトの3次元マッピングとを重ね合わせることにより、試料Sに含まれる複数の細胞についての硬さに関する情報を取得することができる。なお、ブリルアンシフトの3次元分布の位置分解能は、CWレーザ102からのレーザ光のスポットの大きさに依存する。本実施形態においては、XY方向の位置分解能は約260nmであり、Z方向の位置分解能は約5μmであるので、十分な位置分解能で試料S中の細胞によって散乱されたブリルアン散乱光のブリルアンシフトを測定することができる。
なお、顕微鏡装置10の焦点距離の深さは約50μmまで設定することができる。細胞の塊が略球形であって、Z方向にほぼ対称であると仮定すると、約100μm以下の径の細胞の塊を測定対象とすることにより、細胞の塊の全体を評価することができる。そこで、自家蛍光の3次元強度分布を測定した際に、細胞の塊の径の大きさを評価して、細胞の塊の径が約100μm以下の細胞の塊だけを抽出して、ブリルアン散乱光のブリルアンシフトの測定を行うようにしてもよい。
また、図5に示されるように、ブリルアンシフトの大きさを横軸にしたヒストグラムを作成することにより、試料Sに含まれる複数の細胞を、その硬さに関する情報に基づいて分類することができる。細胞の硬さは、上述のように、細胞増殖や細胞死の誘導、癌細胞の転移などの細胞過程等に重要な因子であるため、細胞をその硬さに関する情報に基づいて分類することは有用である。また、図5に示されるように、ブリルアンシフトの大きさを横軸にしたヒストグラムにおいて、2つのピークが得られたとする。それぞれのピークに対応する細胞は、細胞の硬さが異なるだけではなく、別の性質(信号A、Bに対応する性質)においても、互いに異なっていることがある。例えば、細胞をその硬さで分類することにより、別の性質(例えば、細胞増殖や細胞死の誘導、癌細胞の転移などの細胞過程における細胞の状態)においても細胞を分類することができる。
以上説明した実施形態は、あくまでも例示であって、請求の範囲に係る発明を限定するものではない。また、上記の実施形態の中で説明された特徴の組み合わせの全てが必須であるとは限らない。また、上記実施形態には種々の変更を加えることが可能である。以下に、実施形態の変更形態について説明する。
上記実施形態においては、1つの細胞を基本単位として、1つの細胞の硬さを評価していたが、本実施形態はそのような形態には限られない。パルスレーザ101からのパルスレーザ光のスポットの径は、1~2μmにすることができ、CWレーザ102からのレーザ光のスポットの径は、約260nmにすることができる。一般に細胞の中にある核の大きさは、直径約5~8μmであるので、パルスレーザ101からのパルスレーザ光及びCWレーザ102からのレーザ光を、1つの細胞内で、核の位置と核以外の位置とに分けて照射することが可能である。これにより、1つの細胞の内部における硬さの分布を調べることができる。特に、細胞内の核の硬さに関する情報を得ることも可能である。核の中にはDNAが収納されており、核の硬さはDNAの状態によって変わると考えられている。例えば、DNAが凝縮した状態では、DNAがバネのような役割を果たして、核の硬さを大きくすることに寄与していると考えられる。これに対して、DNAが延びたり、切れたりしている場合には、それに伴って、核の硬さが小さくなると考えられる。このように、細胞内の核の硬さに関する情報を得ることにより、核の内部に収納されているDNAの状態を評価することができる。
上記実施形態においては、1つの細胞を基本単位として、細胞の塊に含まれる1つの細胞の硬さ又は1つの細胞の内部(核など)の硬さを評価していたが、本実施形態はそのような形態には限られない。制御部11は、光学系120を調整して、細胞の塊の中の複数の細胞に同時に照射されるように、CWレーザ102からのレーザ光のスポットの大きさを調整することができる。例えば、対物レンズを変えることで、対物レンズに応じてスポットの大きさを変えることが可能である。また、ガルバノミラーGMによる振り幅を変えることにより、照射する範囲を調整することが可能である。図6(a)に示されるように、CWレーザ102からのレーザ光を、細胞の塊の中の複数の細胞に同時に照射することにより、複数の細胞によって散乱されたブリルアン散乱光を受光して、複数の細胞全体としての硬さの情報を取得することができる。硬さの異なる複数の細胞によってそれぞれ散乱されたブリルアン散乱光が同時に分光器145に入るため、図6(b)に示されるように、分光されたブリルアン散乱光の振動数分布は、1つの細胞によって散乱されたブリルアン散乱光の振動数分布と比べて幅広になる。しかしながら、複数の細胞を含む領域をまとめて測定することができるため、細胞の塊全体の硬さに関する情報を取得するために必要な測定時間を短縮することができる。
上記実施形態においては、顕微鏡装置10を多光子励起顕微鏡として用いて、細胞の塊に含まれる各細胞の位置情報を取得した後、顕微鏡装置10をブリルアン散乱顕微鏡として用いて、細胞の塊に含まれる細胞の硬さに関する情報を取得していた。しかしながら、本実施形態はそのような形態には限られない。例えば図7に示されるように、流路FP中を流れる細胞の塊に対して、ブリルアン散乱光を用いて細胞の硬さに関する情報を取得することができる。例えば、ウェルプレートWPに代えて、流路FPを有する公知のマイクロ流路チップを可動ステージ160に配置して、上述の手法と同様の手法により、評価装置1を用いて、ブリルアン散乱光を検出して流路中を流れる細胞の硬さに関する情報を取得することができる。これにより、複数の細胞の塊について、連続的に効率よく細胞の硬さに関する情報を取得することができる。また、この場合には、顕微鏡装置10を多光子励起顕微鏡として用いる必要はない。そのため、図7に示されるように、顕微鏡装置10は光学系120、CWレーザ102、第2受光部144を備えていればよい。
なお、上述の実施形態においては、細胞の状態の評価として、細胞の硬さを評価したが、これに限られない。ブリルアン散乱から、細胞の硬さ以外の情報を評価しても構わない。例えば、粘性、屈折率に関する情報をブリルアン散乱より抽出し評価しても構わない。
上記実施形態においては、顕微鏡装置10をブリルアン散乱顕微鏡として用いて、細胞によって散乱されたブリルアン散乱光を検出して、細胞の硬さに関する情報を取得していた。しかしながら、本実施形態はそのような形態には限られない。例えば、顕微鏡装置10をブリルアン散乱光ではなく、ラマン散乱光を検出するラマン散乱顕微鏡として用いて、細胞によって散乱されたラマン散乱光を検出してもよい。上述のように、ラマン散乱光を分光したスペクトルには分子の化学結合情報が含まれるので、これを用いて、細胞内に含まれる分子の状態等を評価することができる。
上述の実施形態において、顕微鏡装置10の各構成要素(照明部100、光学系120、受光部140、可動ステージ160)の構造、配置等は適宜変更しうる。例えば、上記実施形態においては、光学系120について具体的な光学素子を示しつつ説明したが、本教示はこのような形態には限られず、光学系120を構成する光学素子の数、種類、配置等を適宜変更しうる。例えば、上記実施形態においては、CWレーザ102からのレーザ光と、パルスレーザ101からのレーザ光とが同じ光路を進むように構成されていたが、本実施形態はそのような形態には限られない。例えば、CWレーザ102からのレーザ光と、パルスレーザ101からのレーザ光とが、別々の光路を進むように構成されていてもよい。また、上記実施形態においては、λ/2位相差板HWP、偏光ビームスプリッタPBS、λ/4位相差板QWPが、レンズL2とガルバノミラーGM1との間に配置されていたが、本実施形態はそのような形態には限られない。例えば、図8に示されるように、ミラーM2と偏光ビームスプリッタPBSを入れ替えて、偏光ビームスプリッタPBSの上流及び下流に、それぞれ、λ/2位相差板HWP及びλ/4位相差板QWPを配置してもよい。この場合にも、試料Sにおいて散乱した散乱光は偏光ビームスプリッタPBSを透過することができる。なお、レンズL5、ピンホールPH、第2受光部144は、図8のように偏光ビームスプリッタPBSの下流側に配置することにより、偏光ビームスプリッタPBSを透過した散乱光を第2受光部144に導くことができる。
上記実施形態及びその変更形態においては、制御部11が、レーザ光を各位置に照射したときに、受光部140で観測される蛍光の強度及びブリルアンシフトを用いて、蛍光の強度分布及びブリルアンシフトの3次元マッピングを取得していた。上述のように、取得された3次元マッピングの画像は、表示部12に表示することができる。以下に、その一例について説明する。
図9(a)は、細胞の塊の、所定の断面における断面図を図示したものである。図9(a)に示される細胞の塊の断面図においては、細胞の塊の中心からの距離に応じて5つの領域(領域91~95)に分割されている。図9(b)は、領域91~95について、各領域の位置(中心からの距離)と、各領域に含まれる細胞において測定された、ブリルアンシフトのシフト量の平均値とをプロットしたグラフである。なお、単に画面に表示されている1つの断面の各領域に含まれる細胞だけではなく、細胞の塊の他の断面の各領域に含まれる細胞も対象にして、ブリルアンシフトのシフト量の平均値を算出している。図9(c)は、領域91~95のうちの1つの領域の中の複数の小領域(ここでは領域95の中の、3つの小領域951~953)について、各小領域の位置と、各小領域に含まれる細胞において測定された、ブリルアンシフトのシフト量の平均値とをさらにプロットしたグラフである。図9(d)は、細胞の塊に含まれる、細胞の1つについて測定したときのブリルアン散乱光の振動数分布を示したスペクトルである。図9(e)は、細胞の塊に含まれる1つの細胞について、多光子励起顕微鏡で自家蛍光を測定することによって得られた、細胞の外形を示す画像であり、図9(f)は、図9(e)の画像にブリルアンシフトのシフト量の分布を重ね合わせた合成画像である。
表示部12は、図9(a)~9(f)に示されるような図又はプロットを、少なくとも1つ表示することができる。例えば、図10に示されるように、表示部12は、4分割した画面にそれぞれ別の情報を表示することができる。図10に示される画面1は、表示部12の画面を左右に2分割したうちの、左半分の画面に対応する。画面2は、画面1の右側の画面をさらに上下に2分割したうちの、上側の画面に対応する。画面3は、画面2の下側の画面をさらに左右に2分割したうちの、左側の画面に対応する。画面4は、画面3の右側の画面に対応する。図10に示されるように、画面1には、図9(a)に示されるような、細胞の塊の断面図が表示される。画面1に表示される細胞の塊の断面図は、前述のように、5つの領域に分割されている。画面2には、図9(b)に示されるような、各領域の位置(中心からの距離)と、各領域に含まれる細胞において測定された、ブリルアンシフトのシフト量の平均値とをプロットしたグラフが表示される。
画面1又は画面2において、各領域及び各領域に対応する凡例は、マウスでクリックしたり、タッチパネルでタッチしたりすることによって、選択することができる。図10においては、画面2の点線で囲まれた部分(細胞の塊の最も外側の領域に対応)が選択されている。これに伴って、画面3には、図9(d)に示されたような、選択された領域に含まれる細胞の1つの、ブリルアン散乱光の振動数分布を示したスペクトルが表示され、画面4には、図9(f)に示されたような、その細胞の外形を示す画像に、測定されたブリルアンシフトのシフト量の分布を重ね合わせた画像が表示される。なお、画面3及び画面4には、選択された領域におけるブリルアンシフトのシフト量の平均値とほぼ同じシフト量が検出された細胞において実際に測定されたスペクトル及び画像が表示される。
ユーザは、画面1に表示される図及び画面2に表示されるプロットによって、細胞の塊の各領域における、ブリルアンシフトのシフト量を確認することができる。また、ユーザは、所望の領域を選択することにより、その領域に含まれる細胞の1つについての測定データ(ブリルアン散乱光の振動数分布及びブリルアンシフトのシフト量の分布)を確認することができる。
なお、図10においては、画面が4分割されていたが、これはあくまでも例示であり、本発明はそのような態様には限られない。例えば、画面は分割されていなくてもよく、任意の数に分割されていてもよい。また、例えば、最初は2分割された画面に、画面1及び画面2のみが表示されてもよく、ユーザが領域を選択することに応じて、画面が4分割されて、画面3及び画面4がさらに表示されてもよい。
画面1に表示される細胞の塊の断面図においては、細胞の塊の断面を円で表され、その1/4の円で表示されているが、これは例示にすぎない。例えば、細胞の塊の断面が、細胞の塊の外形に応じた形状で図示されてもよい。また、細胞の塊の断面全体の形状が表示されてもよく、細胞の塊の断面全体のうちの、任意の割合の部分の形状が表示されてもよい。また、画面1に表示される細胞の塊の断面図においては、細胞の塊の断面が同心円状の5つの領域に分割されていたが、これも例示に過ぎない。例えば、表示部12は、細胞の塊の大きさに応じて、細胞の塊の断面の分割領域の数を増減することができる。また、表示部12は、各分割領域の形状も任意に設定することができる。
画面2においては、各領域の位置(中心からの距離)と、各領域に含まれる細胞において測定された、ブリルアンシフトのシフト量の平均値とをプロットしたグラフが表示されていた。上述のように、単に画面に表示されている1つの断面の各領域に含まれる細胞だけではなく、細胞の塊の他の断面の各領域に含まれる細胞も対象にして、ブリルアンシフトのシフト量の平均値が算出されていた。しかしながら、これはあくまでも例示であり、画面に表示されている1つの断面の各領域に含まれる細胞だけを対象にして、ブリルアンシフトのシフト量の平均値が算出されてもよい。このとき、表示部12は、画面2において、図9(c)に示されるような、ユーザが選択した複数の小領域951~953について、各小領域の位置と、各小領域に含まれる細胞において測定された、ブリルアンシフトのシフト量の平均値とをさらにプロットしたグラフを表示することもできる。これにより、表示部12は、ユーザが選択した断面の、任意の位置でのブリルアンシフトのシフト量を表示することができる。
なお、制御部11は、ブリルアンシフトのシフト量の平均値を算出する際に、所定範囲を外れたシフト量はノイズとして取り除いて、所定範囲内にあるものだけを対象にして平均値を算出してもよい。また、ブリルアンシフトのシフト量の平均値に代えて、あるいは、ブリルアンシフトのシフト量の平均値に加えて、制御部11は、ブリルアンシフトのシフト量の中央値、最頻値を算出して表示部12に表示させてもよい。
上述のように、画面3及び画面4には、選択された領域におけるブリルアンシフトのシフト量の平均値とほぼ同じシフト量が検出された細胞において測定されたスペクトル及び画像が表示されていたが、これはあくまでも例示に過ぎない。例えば、制御部11は、選択された領域に含まれる複数の細胞で測定されたスペクトル及び画像から、平均のスペクトル及び平均の画像を算出し、表示部12に表示させてもよい。
図10においては、複数の領域に分割された細胞塊の断面図と、分割された各領域に含まれる細胞において測定された、ブリルアンシフトのシフト量の平均値とをプロットしたグラフが表示されていたが、これは、あくまでも例示に過ぎない。例えば、表示部12は、図11の画面1に示されるように、ブリルアンシフトのシフト量を段階的に区分けして、各シフト量に対応する領域が、細胞の塊の断面のどの位置にあるかを示す図を表示することができる。ここで、図11の画面2には、画面1で示されている断面について、多光子励起顕微鏡で自家蛍光を測定することによって得られた画像が表示される。細胞に含まれる所定のタンパク質から放出される蛍光を測定している場合には、画面2に表示される画像は、所定のタンパク質の局在化を示す画像であるといえる。画面1と画面2とを比較することにより、ブリルアンシフトのシフト量の分布と、所定のタンパク質の分布とを比較することができる。また、生きている細胞のみから放出される蛍光を測定している場合には、画面2に表示される画像は、生きている細胞の分布を示す画像であるといえる。画面1と画面2とを比較することにより、ブリルアンシフトのシフト量の分布と、生きている細胞の分布とを比較することができる。なお、表示部12は、画面1と画面2とを重ね合わせた合成画像を表示することもできる。また、表示部12は、画面1と画面2とで一致していない部分がある場合には、その部分を削除して表示することもできる。
以上、添付図面を参照しながら、本発明に係る好適な実施形態や変形例について説明したが、本発明は係る例に限定されないことは言うまでもない。上述した例において示した各構成部材の諸形状や組み合わせ等は一例であって、本発明の主旨から逸脱しない範囲において設計要求等に基づき種々変更可能である。前述の実施形態の各構成要素は、適宜組み合わせることができる。また、一部の構成要素を用いない場合もある。また、法令が許容される限りにおいて、前述の各実施形態及び変形例などに関するすべての公開広報および米国特許の開示を援用して本文の記載の一部とする。前述した実施形態に基づいて当業者等によりなされる他の実施形態及び運用技術等は、すべて本実施形態の範囲に含まれる。
1 評価装置
10 顕微鏡装置
11 制御部
12 表示部
13 入力部
100 照明部
120 光学系
140 受光部
160 可動ステージ
10 顕微鏡装置
11 制御部
12 表示部
13 入力部
100 照明部
120 光学系
140 受光部
160 可動ステージ
Claims (16)
- 細胞の塊に含まれる細胞の位置情報を取得する取得部と、
前記細胞の位置情報に基づいて照射される光の散乱光を受光する受光部を備える、評価装置。 - 前記取得部は、前記細胞の塊に含まれる前記細胞の像を撮像する撮像部を備え、
前記撮像部により撮像された前記像に基づいて前記細胞の位置情報を取得する、請求項1に記載の評価装置。 - 前記受光部は、前記細胞とは異なる部分からの散乱光の受光を抑制する遮蔽部を備える、請求項1または2に記載の評価装置。
- 前記受光部からの散乱光に関する信号に基づいて、前記細胞の状態を評価する評価部を備える、請求項1から3のいずれか一項に記載の評価装置。
- 前記評価部は、前記細胞の状態を用いて、前記細胞の塊の状態を評価する、請求項4に記載の評価装置。
- 細胞の塊に照射された光の、前記細胞の塊に含まれる細胞による散乱光を受光する受光部と、
前記受光部からの散乱光に関する信号に基づいて、前記細胞の状態を評価する評価部を備える、評価装置。 - 前記散乱光は、ブリルアン散乱により散乱されたブリルアン散乱光である、請求項5又は6に記載の評価装置。
- 前記評価部は、前記細胞の照射される光の波長と、前記受光部で受光するブリルアン散乱の波長差に基づいて、前記細胞の硬さを評価する、請求項7に記載の評価装置。
- 前記評価部は、前記評価した前記細胞の塊に含まれる前記細胞の硬さに基づいて、前記細胞の塊に含まれる前記細胞を分類する、請求項8に記載の評価装置。
- 前記評価部は、前記波長差に基づいて、前記細胞の塊に含まれる前記細胞の核の硬さを評価する、請求項8または請求項9に記載の評価装置。
- 前記評価部は、前記評価した、前記細胞の塊の中に含まれる前記細胞の前記核の硬さに基づいて、前記細胞の塊の中に含まれる前記細胞を分類する、請求項10に記載の評価装置。
- 前記細胞の位置情報と、前記細胞の硬さ情報とに基づいて、前記細胞の硬さの分布図を作成する作成部を備える、請求項9~11のいずれか一項に記載の評価装置。
- 前記受光部は、前記細胞の塊に含まれる複数の細胞からの散乱光を受光し、
前記評価部は、前記受光部からの散乱光に関する信号に基づいて、前記複数の細胞の状態を評価する、請求項5~12のいずれか一項に記載の評価装置。 - さらに、前記細胞の塊が流れる流路を備え、
前記照射部は、前記流路を流れる前記細胞の塊に前記光を照射し、
前記受光部は、前記流路を流れる前記細胞の塊又は前記流路を流れる前記細胞の塊の中に含まれる細胞で散乱された前記散乱光を受光する、請求項1~13のいずれか一項に記載の評価装置。 - 細胞の塊に含まれる細胞の位置情報を取得することと、
前記細胞の位置情報に基づいて照射される光の散乱光を受光することと、を備える、評価方法。 - 細胞の塊に照射された光の、前記細胞の塊に含まれる細胞による散乱光を受光することと、
前記受光した散乱光に関する信号に基づいて、前記細胞の状態を評価することと、を備える、評価方法。
Priority Applications (1)
| Application Number | Priority Date | Filing Date | Title |
|---|---|---|---|
| PCT/JP2018/048568 WO2020136896A1 (ja) | 2018-12-28 | 2018-12-28 | 評価装置、及び、評価方法 |
Applications Claiming Priority (1)
| Application Number | Priority Date | Filing Date | Title |
|---|---|---|---|
| PCT/JP2018/048568 WO2020136896A1 (ja) | 2018-12-28 | 2018-12-28 | 評価装置、及び、評価方法 |
Publications (1)
| Publication Number | Publication Date |
|---|---|
| WO2020136896A1 true WO2020136896A1 (ja) | 2020-07-02 |
Family
ID=71127869
Family Applications (1)
| Application Number | Title | Priority Date | Filing Date |
|---|---|---|---|
| PCT/JP2018/048568 Ceased WO2020136896A1 (ja) | 2018-12-28 | 2018-12-28 | 評価装置、及び、評価方法 |
Country Status (1)
| Country | Link |
|---|---|
| WO (1) | WO2020136896A1 (ja) |
Citations (3)
| Publication number | Priority date | Publication date | Assignee | Title |
|---|---|---|---|---|
| WO2007034802A1 (ja) * | 2005-09-20 | 2007-03-29 | Sumitomo Electric Industries, Ltd. | 弾性粘性測定装置 |
| US20090323056A1 (en) * | 2007-05-04 | 2009-12-31 | The General Hospital Corporation | Methods, arrangements and systems for obtaining information associated with a sample using optical microscopy |
| WO2018226863A1 (en) * | 2017-06-06 | 2018-12-13 | University Of Maryland, College Park | Analysis of single cell mechanical phenotyping for metastatic detection |
-
2018
- 2018-12-28 WO PCT/JP2018/048568 patent/WO2020136896A1/ja not_active Ceased
Patent Citations (3)
| Publication number | Priority date | Publication date | Assignee | Title |
|---|---|---|---|---|
| WO2007034802A1 (ja) * | 2005-09-20 | 2007-03-29 | Sumitomo Electric Industries, Ltd. | 弾性粘性測定装置 |
| US20090323056A1 (en) * | 2007-05-04 | 2009-12-31 | The General Hospital Corporation | Methods, arrangements and systems for obtaining information associated with a sample using optical microscopy |
| WO2018226863A1 (en) * | 2017-06-06 | 2018-12-13 | University Of Maryland, College Park | Analysis of single cell mechanical phenotyping for metastatic detection |
Non-Patent Citations (9)
| Title |
|---|
| ANDREW J. TRAVERSO, JONATHAN V. THOMPSON, ZACHARY A. STEELMAN, ZHAOKAI MENG, MARLAN O. SCULLY, VLADISLAV V. YAKOVLEV: "Dual Raman-Brillouin Microscope for Chemical and Mechanical Characterization and Imaging", ANALYTICAL CHEMISTRY, vol. 87, no. 15, 21 July 2015 (2015-07-21), pages 7519 - 7523, XP055723961 * |
| CARLO BEVILACQUA, SÁNCHEZ IRANZO HÉCTOR, RICHTER DMITRY, DIZ-MUÑOZ ALBA, PREVEDEL ROBERT: "Imaging mechanical properties of sub-micron ECM in live zebrafish using Brillouin microscopy", BIORXIV, no. 494803, 10 December 2018 (2018-12-10), pages 1 - 12, XP055723948, DOI: 10.1101/491803 * |
| GIULIANO SCARCELLI: "Brillouin microscopy", ADVANCES IN OPTICS FOR BIOTECHNOLOGY, MEDICINE AND SURGERY XV, 22 December 2017 (2017-12-22), XP055723942, Retrieved from the Internet <URL:https://dc.engconfintl.org/biotech_med_xv/33/> * |
| GIULIANO SCARCELLI; WILLIAM J POLACHECK; HADI T NIA; KRIPA PATEL; ALAN J GRODZINSKY; ROGER D KAMM & SEOK HYUN YUN: "Noncontact three-dimensional mapping of intracellular hydromechanical properties by Brillouin microscopy", NATURE METHODS, vol. 12, 5 October 2015 (2015-10-05), pages 1132 - 1134, XP009514134 * |
| GIUSEPPE ANTONACCI, RYAN M. PEDRIGI, AVINASH KONDIBOYINA, VIKRAM V. MEHTA, RANIL DE SILVA, CARL PATERSON, ROB KRAMS, PETER TÖRÖK: "Quantification of plaque stiffness by Brillouin microscopy in experimental thin cap fibroatheroma", JOURNAL OF THE ROYAL SOCIETY INTERFACE, vol. 12, no. 112, 15 November 2015 (2015-11-15), pages 1 - 4, XP055723944 * |
| GIUSEPPE ANTONACCI; BRAAKMAN SIETSE: "Biomechanics of subcellular structures by non-invasive Brillouin microscopy", SCIENTIFIC REPORTS, vol. 6, no. 37217, 15 November 2016 (2016-11-15), pages 1 - 6, XP055538209 * |
| IULIANO SCARCELLI, SEOK-HYUN (ANDY) YUN: "All-optical mapping of the mechanical properties of cells", SPIE, 22 March 2017 (2017-03-22), XP055723937, Retrieved from the Internet <URL:https://spie.org/news/6698-all-optical-mapping-of-the-mechanical-properties-of-cells?SSO=1> * |
| KAREEM ELSAYAD, STEPHANIE WERNER, MARÇAL GALLEMÍ, JIXIANG KONG, EDMUNDO R. SÁNCHEZ GUAJARDO, LIJUAN ZHANG, YVON JAILLAI: "Mapping the subcellular mechanical properties of live cells in tissues with fluorescence emission-Brillouin imaging", SCIENCE SIGNALING, vol. 9, no. 435, 5 July 2016 (2016-07-05), pages 1 - 12, DOI: 10.1126/scisignal.aaf6326 * |
| PEI-JUNG WU, IRINA KABAKOVA, JEFFREY RUBERTI, JOSEPH M. SHERWOOD, IAIN E. DUNLOP, CARL PATERSON, PETER TÖRÖK, DARRYL R. OVERBY: "Brillouin microscopy, what is it really measuring?", ARXIV:1711.03312V2, 14 May 2018 (2018-05-14), XP055723958 * |
Similar Documents
| Publication | Publication Date | Title |
|---|---|---|
| US8619237B2 (en) | Laser-scanning intersecting plane tomography such as for high speed volumetric optical imaging | |
| US10337995B2 (en) | Systems and methods for oblique laser scanning | |
| Chen et al. | Optical and digital microscopic imaging techniques and applications in pathology | |
| CN104880445B (zh) | 一种自体荧光寿命成像和荧光光谱结合用于癌症早期诊断的装置 | |
| EP3752815B1 (en) | Systems, devices and methods for three-dimensional imaging of moving particles | |
| JP2010507828A (ja) | 物体を結像させるためのシステム | |
| US20180088308A1 (en) | Inverted light-sheet microscope | |
| CN204731160U (zh) | 一种自体荧光寿命成像和荧光光谱结合用于癌症早期诊断的装置 | |
| CN110824684B (zh) | 一种高速立体三维多模态成像系统和方法 | |
| JP2019508710A (ja) | ブリルアン光散乱に基づくラベルフリーサイトメトリーのシステム及び方法 | |
| CN104390943B (zh) | 一种同时获得外观图像和元素分布影像的显微成像系统 | |
| CN105247346A (zh) | 光谱显微镜装置 | |
| WO2014061147A1 (ja) | Cars顕微鏡 | |
| TW201500727A (zh) | 利用超頻譜影像分析組織細胞的系統及方法 | |
| JP5914242B2 (ja) | 観察装置 | |
| JP2015504177A (ja) | 成形されたビームを用いた定量用非線形光学顕微鏡 | |
| CN104677830A (zh) | 分光瞳共焦-光声显微成像装置与方法 | |
| JP7275849B2 (ja) | 細胞の数、形態又は形状を測定する方法及び装置 | |
| WO2016126250A1 (en) | Particle tracking using spatiotemporal offset light beams | |
| JP2015007620A (ja) | 分光顕微鏡装置 | |
| JP2011191199A (ja) | 顕微鏡システム | |
| US12313829B2 (en) | Fast scanning microscope systems, and related optics and methods | |
| Wang et al. | Divided-aperture differential confocal fast-imaging microscopy | |
| JP2004361087A (ja) | 生体分子解析装置 | |
| JP4572162B2 (ja) | 顕微鏡装置 |
Legal Events
| Date | Code | Title | Description |
|---|---|---|---|
| 121 | Ep: the epo has been informed by wipo that ep was designated in this application |
Ref document number: 18944202 Country of ref document: EP Kind code of ref document: A1 |
|
| NENP | Non-entry into the national phase |
Ref country code: DE |
|
| 122 | Ep: pct application non-entry in european phase |
Ref document number: 18944202 Country of ref document: EP Kind code of ref document: A1 |
|
| NENP | Non-entry into the national phase |
Ref country code: JP |