WO2020097944A1 - Real power curve-based method for discriminating and compensating yaw error inherent deviation of wind turbine generator set - Google Patents
Real power curve-based method for discriminating and compensating yaw error inherent deviation of wind turbine generator set Download PDFInfo
- Publication number
- WO2020097944A1 WO2020097944A1 PCT/CN2018/116072 CN2018116072W WO2020097944A1 WO 2020097944 A1 WO2020097944 A1 WO 2020097944A1 CN 2018116072 W CN2018116072 W CN 2018116072W WO 2020097944 A1 WO2020097944 A1 WO 2020097944A1
- Authority
- WO
- WIPO (PCT)
- Prior art keywords
- yaw error
- interval
- data set
- inherent deviation
- wind speed
- Prior art date
Links
- 238000000034 method Methods 0.000 title claims abstract description 73
- 238000005259 measurement Methods 0.000 claims abstract description 6
- 238000004458 analytical method Methods 0.000 claims description 124
- 238000013450 outlier detection Methods 0.000 claims description 32
- 238000004364 calculation method Methods 0.000 claims description 21
- 238000004422 calculation algorithm Methods 0.000 claims description 20
- 238000001514 detection method Methods 0.000 claims description 14
- 238000013139 quantization Methods 0.000 claims description 5
- 230000001186 cumulative effect Effects 0.000 claims description 3
- 238000005315 distribution function Methods 0.000 claims description 3
- 238000005457 optimization Methods 0.000 claims description 3
- 230000000153 supplemental effect Effects 0.000 claims description 3
- 238000012850 discrimination method Methods 0.000 abstract 1
- 238000007781 pre-processing Methods 0.000 abstract 1
- 238000004445 quantitative analysis Methods 0.000 abstract 1
- 238000004088 simulation Methods 0.000 description 7
- 238000007405 data analysis Methods 0.000 description 4
- 238000010248 power generation Methods 0.000 description 4
- 238000011217 control strategy Methods 0.000 description 3
- 238000010586 diagram Methods 0.000 description 3
- 238000005516 engineering process Methods 0.000 description 3
- 238000011160 research Methods 0.000 description 3
- 239000012080 ambient air Substances 0.000 description 2
- 238000010276 construction Methods 0.000 description 2
- 238000013211 curve analysis Methods 0.000 description 2
- 230000000694 effects Effects 0.000 description 2
- 238000009434 installation Methods 0.000 description 2
- 238000009825 accumulation Methods 0.000 description 1
- 230000015556 catabolic process Effects 0.000 description 1
- 238000006731 degradation reaction Methods 0.000 description 1
- 238000011156 evaluation Methods 0.000 description 1
- 238000009472 formulation Methods 0.000 description 1
- 238000012423 maintenance Methods 0.000 description 1
- 238000000691 measurement method Methods 0.000 description 1
- 239000000203 mixture Substances 0.000 description 1
- 238000005070 sampling Methods 0.000 description 1
- 238000011179 visual inspection Methods 0.000 description 1
Images


Classifications
-
- F—MECHANICAL ENGINEERING; LIGHTING; HEATING; WEAPONS; BLASTING
- F03—MACHINES OR ENGINES FOR LIQUIDS; WIND, SPRING, OR WEIGHT MOTORS; PRODUCING MECHANICAL POWER OR A REACTIVE PROPULSIVE THRUST, NOT OTHERWISE PROVIDED FOR
- F03D—WIND MOTORS
- F03D7/00—Controlling wind motors
- F03D7/02—Controlling wind motors the wind motors having rotation axis substantially parallel to the air flow entering the rotor
- F03D7/0204—Controlling wind motors the wind motors having rotation axis substantially parallel to the air flow entering the rotor for orientation in relation to wind direction
-
- F—MECHANICAL ENGINEERING; LIGHTING; HEATING; WEAPONS; BLASTING
- F03—MACHINES OR ENGINES FOR LIQUIDS; WIND, SPRING, OR WEIGHT MOTORS; PRODUCING MECHANICAL POWER OR A REACTIVE PROPULSIVE THRUST, NOT OTHERWISE PROVIDED FOR
- F03D—WIND MOTORS
- F03D17/00—Monitoring or testing of wind motors, e.g. diagnostics
-
- F—MECHANICAL ENGINEERING; LIGHTING; HEATING; WEAPONS; BLASTING
- F03—MACHINES OR ENGINES FOR LIQUIDS; WIND, SPRING, OR WEIGHT MOTORS; PRODUCING MECHANICAL POWER OR A REACTIVE PROPULSIVE THRUST, NOT OTHERWISE PROVIDED FOR
- F03D—WIND MOTORS
- F03D7/00—Controlling wind motors
- F03D7/02—Controlling wind motors the wind motors having rotation axis substantially parallel to the air flow entering the rotor
- F03D7/04—Automatic control; Regulation
-
- F—MECHANICAL ENGINEERING; LIGHTING; HEATING; WEAPONS; BLASTING
- F05—INDEXING SCHEMES RELATING TO ENGINES OR PUMPS IN VARIOUS SUBCLASSES OF CLASSES F01-F04
- F05B—INDEXING SCHEME RELATING TO WIND, SPRING, WEIGHT, INERTIA OR LIKE MOTORS, TO MACHINES OR ENGINES FOR LIQUIDS COVERED BY SUBCLASSES F03B, F03D AND F03G
- F05B2260/00—Function
- F05B2260/80—Diagnostics
-
- F—MECHANICAL ENGINEERING; LIGHTING; HEATING; WEAPONS; BLASTING
- F05—INDEXING SCHEMES RELATING TO ENGINES OR PUMPS IN VARIOUS SUBCLASSES OF CLASSES F01-F04
- F05B—INDEXING SCHEME RELATING TO WIND, SPRING, WEIGHT, INERTIA OR LIKE MOTORS, TO MACHINES OR ENGINES FOR LIQUIDS COVERED BY SUBCLASSES F03B, F03D AND F03G
- F05B2270/00—Control
- F05B2270/30—Control parameters, e.g. input parameters
- F05B2270/32—Wind speeds
-
- F—MECHANICAL ENGINEERING; LIGHTING; HEATING; WEAPONS; BLASTING
- F05—INDEXING SCHEMES RELATING TO ENGINES OR PUMPS IN VARIOUS SUBCLASSES OF CLASSES F01-F04
- F05B—INDEXING SCHEME RELATING TO WIND, SPRING, WEIGHT, INERTIA OR LIKE MOTORS, TO MACHINES OR ENGINES FOR LIQUIDS COVERED BY SUBCLASSES F03B, F03D AND F03G
- F05B2270/00—Control
- F05B2270/30—Control parameters, e.g. input parameters
- F05B2270/329—Azimuth or yaw angle
-
- F—MECHANICAL ENGINEERING; LIGHTING; HEATING; WEAPONS; BLASTING
- F05—INDEXING SCHEMES RELATING TO ENGINES OR PUMPS IN VARIOUS SUBCLASSES OF CLASSES F01-F04
- F05B—INDEXING SCHEME RELATING TO WIND, SPRING, WEIGHT, INERTIA OR LIKE MOTORS, TO MACHINES OR ENGINES FOR LIQUIDS COVERED BY SUBCLASSES F03B, F03D AND F03G
- F05B2270/00—Control
- F05B2270/80—Devices generating input signals, e.g. transducers, sensors, cameras or strain gauges
- F05B2270/802—Calibration thereof
-
- Y—GENERAL TAGGING OF NEW TECHNOLOGICAL DEVELOPMENTS; GENERAL TAGGING OF CROSS-SECTIONAL TECHNOLOGIES SPANNING OVER SEVERAL SECTIONS OF THE IPC; TECHNICAL SUBJECTS COVERED BY FORMER USPC CROSS-REFERENCE ART COLLECTIONS [XRACs] AND DIGESTS
- Y02—TECHNOLOGIES OR APPLICATIONS FOR MITIGATION OR ADAPTATION AGAINST CLIMATE CHANGE
- Y02E—REDUCTION OF GREENHOUSE GAS [GHG] EMISSIONS, RELATED TO ENERGY GENERATION, TRANSMISSION OR DISTRIBUTION
- Y02E10/00—Energy generation through renewable energy sources
- Y02E10/70—Wind energy
- Y02E10/72—Wind turbines with rotation axis in wind direction
Definitions
- the invention relates to a method for identifying and compensating the inherent deviation of the yaw error of a wind turbine, in particular to a method for identifying and compensating the inherent deviation of the yaw error of a wind turbine based on a true power curve.
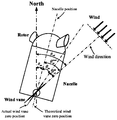
- Figure 2 is a schematic diagram of the yaw control strategy of the wind turbine.
- the specific control strategy of the yaw system and actuator is to ensure that the value of the yaw error is as small as possible.
- the physical meaning in practice is to control as much as possible.
- the sweep surface of the blades of the wind turbine is directly facing the incoming wind direction, that is, the angle of controlling the yaw error ⁇ is as close to 0 ° as possible.
- the determination of the yaw error angle of the wind turbine adopts a direct measurement method: that is, the wind direction indicator is installed behind the nacelle and the zero line of the wind direction indicator is calibrated to be parallel to the direction of the nacelle; Under normal operating conditions, the sensor feeds back the measured wind direction value to the yaw system. Based on its own yaw control strategy, the yaw system controls the cabin to adjust to the direction of the incoming wind.
- the yaw system controls the cabin to adjust to the direction of the incoming wind.
- the zero error of the wind turbine cabin wind direction indicator needs to be determined. For this problem, it is very meaningful to identify the inherent deviation value of yaw error and feedback and compensate it to the yaw system, so as to achieve the purpose of improving the output performance of the wind power generation system.
- the purpose of the present invention is to fill the technical gap in the field of performance improvement of wind turbines based on intelligent identification and compensation technology based on data analysis, and to propose a method for identifying and compensating the inherent deviation of yaw errors of wind turbines based on real power curves.
- This method is based on data analysis and fits the true power curve of the wind turbine in different yaw error intervals under the premise of considering the power curve outlier detection and designs corresponding indicators to quantify the performance, and finally combines simple and effective yaw
- the identification criterion of inherent deviation of error and the compensation strategy of inherent deviation of yaw error realize the identification and compensation of inherent deviation of yaw error, and have high practical application value for improving the power generation performance of wind turbine.
- a method for identifying and compensating the inherent deviation of yaw error of a wind turbine based on a true power curve including the following steps:
- the identification criterion of yaw error inherent deviation is defined as follows: the quantitative performance index PI k of the true power curve ⁇ PC k ⁇ under all M yaw error intervals in step 4) is arranged from large to small, and the maximum quantization performance is determined The index of the interval corresponding to the index PI max is k ′, then the calculation formula of the identification result of the inherent deviation value of yaw error ⁇ im is as follows
- ⁇ lb and ⁇ ub are the lower and upper bounds of the yaw error range to be analyzed, respectively.
- step 2) of the method the method of dividing the interval of the yaw error inherent deviation analysis data set ⁇ X i ⁇ is as follows:
- step 3 the process of acquiring the true power curve of the wind turbine under M yaw error intervals is as follows:
- step 3-d) Use the mean distance discrimination (AVDC) outlier detection algorithm to detect the 2M ′ intervals in step 3-c) respectively Perform suspected outlier detection and record the number of suspected outliers in the jth interval as
- the set of suspected outliers in the normalized yaw error inherent deviation analysis data set is
- the mean distance discrimination (AVDC) outlier detection algorithm is specifically: for the interval where the number of data M ′ k, seg, j is less than the given minimum threshold ⁇ M ′ , it is considered that the interval is normalized to the inherent deviation analysis of yaw error Set of suspected outliers in the data set for Otherwise, for the jth wind speed interval or the jth power interval, the normalized yaw error inherent deviation analysis data set within the interval is first calculated Various wind speed-power data points Discriminant distance Further set the proportion of suspected outliers And determine the number of suspected outliers in the j-th interval Judging the distance from big to small Before the sorting method is determined The data constitute the set of suspected outliers in the normalized yaw error inherent deviation analysis data set of the j-th interval
- n 1, 2, 3, ..., M ′ k, seg, j ;
- the criterion for determining true outliers is defined as: the data set for inherent deviation analysis of the yaw error of the j-th interval Any data point Q in, if it belongs to a set of suspected outliers And belong to the set of LOF discriminating outliers Or DBSCAN to distinguish outlier sets One, then point Q is the true outlier in the jth interval;
- the final outlier judgment criterion is defined as: analysis data set for inherent deviation of yaw error Any data point in Q ′, if it is in the normalized yaw error inherent deviation analysis data set The corresponding data point Q in is a true outlier in a wind speed interval or a power interval, then point Q ′ is the yaw error inherent deviation analysis data set The final outlier.
- step 3-h) Determine the standard data set for the analysis of the inherent deviation of yaw error obtained in step 3-g) The maximum value v max corresponding to the wind speed in, and divide the interval with the fixed wind speed interval ⁇ v as the wind speed interval, and analyze the standard data set of the inherent deviation of the yaw error under the kth yaw error interval Based on the further division of wind speed information, the standard data set for inherent deviation analysis of yaw error in the qth wind speed interval defined as
- M k, q is the standard data set for inherent deviation analysis of yaw error at the qth wind speed interval
- M k is the standard data set for the analysis of the inherent deviation of yaw error in the k-th yaw error interval
- the number of the wind speed interval is divided, the calculation formula is as follows
- the function is an upward rounding function
- d k is the total chord length normalized by the coordinates corresponding to the center points of all power curve fittings, ie
- the least square B spline fitting algorithm is used to fit the power curve under the k-th yaw error interval, and the fitting function B k (t) is defined as follows:
- step 3-c) of the method the normalized yaw error inherent deviation analysis data set
- the division method is as follows:
- step 3-d) of the method the mean distance discrimination (AVDC) outlier detection algorithm is used.
- AVDC mean distance discrimination
- the function is an upward rounding function
- step 4) of the method the definition of the quantitative performance indicator PI k is as follows:
- N h is the value converted from 1 year to hours;
- CAP is the rated power of the wind turbine to be analyzed; Is the median wind speed in the k-th yaw error interval and in the j-th wind speed interval, ie And Is the true power curve ⁇ PC k ⁇ of the k-th yaw error interval
- the F ( ⁇ ) function is the cumulative probability distribution function of Rayleigh distribution, the specific formula is as follows
- v ave is the average annual wind speed of the wind turbine to be analyzed.
- the present invention has the following innovative advantages and significant effects:
- the method of restricting the operating conditions is carried out by dividing the wind speed and power interval Sectional research to ensure that the power curve data is unified to a certain extent in the operating conditions of the wind turbine; at the same time, combining the advantages of multiple outlier detection algorithms, it breaks through the application limit of a single outlier detection algorithm and makes the wind turbine power curve fit The result is more true and accurate;
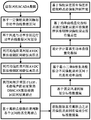
- FIG. 1 is a flowchart of a method for identifying and compensating the inherent deviation of yaw error of a wind turbine based on power curve analysis of the present invention
- FIG. 2 is a schematic diagram of the angle correlation relationship of the inherent deviation of the yaw error of the wind turbine in the application field of the present invention
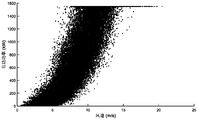
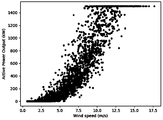
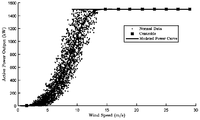
- FIG. 3 is a scatter diagram of the original data of the power curve of the wind turbine in step 1) in the embodiment of the present invention
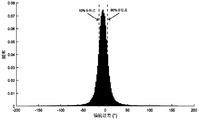
- step 2-a is a histogram of the frequency distribution of yaw error before compensation in step 2-a) in the embodiment of the present invention
- FIG. 5 is a graph showing the original scatter of the normalized power curve and the related results of wind speed & power division in the step 2-c) to step 3-c) in the embodiment of the present invention with a yaw error interval of [-1 °, 0 °] ;
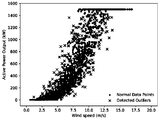
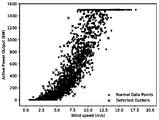
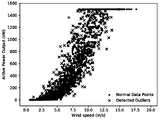
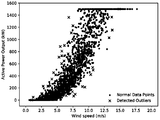
- FIG. 6 is an AVDC suspected outlier detection result graph under yaw error interval of [-1 °, 0 °] and wind speed division data in the embodiment;
- FIG. 10 and FIG. 11 are the LOF discriminating outlier detection result graph and the DBSCAN discriminating outlier detection result graph under the yaw error interval of [-1 °, 0 °] and power division data respectively in the embodiment;
- 13 is a graph of detection results of real outliers under power division data in an embodiment with a yaw error interval of [-1 °, 0 °];
- 15 is a graph showing the correlation results of the true power curve of the standard data set for the analysis of the inherent deviation of the yaw error in the embodiment where the yaw error interval is [-1 °, 0 °];
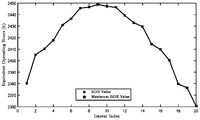
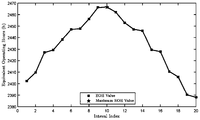
- 16 and 17 are graphs showing the results of the quantized performance index of the power curve in the yaw error interval before and after the compensation of the inherent deviation of the yaw error in the embodiment.
- the data used in this embodiment is GH Bladed 3.82.
- the simulation data in the wind file is used to analyze and study the identification and compensation method of the inherent deviation of the yaw error of the wind turbine.
- the data sampling interval is 10 minutes, and the data information lasts 5 years, with a total of 284,405 entries.
- the relevant information included in the data set is shown in Table 1 and Table 2:
- Variable name Variable meaning Variable unit Wind speed v Current wind speed of wind turbine cabin m / s Active power P Current active power of wind turbine kW Ambient temperature T Wind turbine operating ambient temperature °C Ambient air pressure B Operating pressure of wind turbine Pa Yaw error ⁇ Current wind turbine yaw error °
- the yaw error measured in GH Bladed does not have the inherent deviation of the yaw error in the measurement process of the wind vane during the actual application process, so the measured value is artificially +5 in the simulation process ° way to simulate the actual deviation of -5 ° yaw error in the actual process.
- all the above simulation data is used by default to implement the identification and compensation method of the inherent deviation of the yaw error.
- the method result is the identification result of the inherent deviation of the yaw error of the wind turbine module and the method is verified by the compensation
- the detailed implementation steps are as follows:
- the function is an upward rounding function
- the criterion for determining true outliers is defined as: the data set for inherent deviation analysis of the yaw error of the j-th interval Any data point Q in, if it belongs to a set of suspected outliers And belong to the set of LOF discriminating outliers Or DBSCAN to distinguish outlier sets One, then point Q is the true outlier in the jth interval; for this embodiment, the normalized yaw error under the wind speed interval (ws) and power interval (ap) determined based on the true outlier judgment criteria
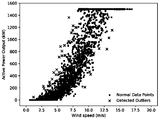
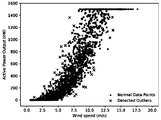
- the detection results of the true outliers in the inherent deviation analysis data set are shown as “ ⁇ ” symbols in FIG. 12 and FIG. 13, respectively, and the remaining normal data points are indicated by “•” symbols.
- the final outlier judgment criterion is defined as: analysis data set for inherent deviation of yaw error Any data point in Q ′, if it is in the normalized yaw error inherent deviation analysis data set The corresponding data point Q in is a real outlier in a wind speed interval or a real outlier in a power interval, then point Q ′ is the yaw error inherent deviation analysis data set The final outlier.
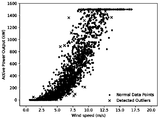
- the true outlier detection result of the normalized yaw error inherent deviation analysis data set is judged based on the final outlier judgment criterion, that is, the result of the ⁇ Outlier k ⁇ data set is shown by the “ ⁇ ” symbol in FIG. 14 It shows that the final normal data points are all indicated by the " ⁇ " symbol.
- step 3-h) Determine the standard data set for the analysis of the inherent deviation of the yaw error obtained in step 3-g) The maximum value v max corresponding to the wind speed in, and divide the interval with the fixed wind speed interval ⁇ v as the wind speed interval, and analyze the standard data set of the inherent deviation of the yaw error under the kth yaw error interval Based on the further division of wind speed information, the standard data set for inherent deviation analysis of yaw error in the qth wind speed interval defined as
- M k, q is the standard data set for inherent deviation analysis of yaw error at the qth wind speed interval
- M k is the standard data set for the analysis of the inherent deviation of yaw error in the k-th yaw error interval
- the number of the wind speed interval is divided, the calculation formula is as follows
- the function is an upward rounding function
- d k is the total chord length normalized by the coordinates corresponding to the center points of all power curve fittings, ie
- the least square B spline fitting algorithm is used to fit the power curve under the k-th yaw error interval, and the fitting function B k (t) is defined as follows:
- N h is the value converted from 1 year to hours;
- CAP is the rated power of the wind turbine to be analyzed; Is the median wind speed in the k-th yaw error interval and in the j-th wind speed interval, ie And Is the true power curve ⁇ PC k ⁇ of the k-th yaw error interval
- the F ( ⁇ ) function is the cumulative probability distribution function of Rayleigh distribution, the specific formula is as follows
- v ave is the average annual wind speed of the wind turbine to be analyzed.
- the values of relevant important parameters are as follows: N h is calculated as 8760 according to 365 days in a year; CAP is the rated power value of this type of wind turbine, which is 1550kW; v ave is the average wind speed of the simulated wind file 7m / s , Corresponding to the calculation results of the quantized performance index PI k of the true power curve under 20 yaw error intervals, as shown in FIG. 16.
- the identification criterion of yaw error inherent deviation is defined as follows: the quantitative performance index PI k of the true power curve ⁇ PC k ⁇ under all M yaw error intervals in step 4) is arranged from large to small, and the maximum quantization performance is determined The index of the interval corresponding to the index PI max is k ′, then the calculation formula of the identification result of the inherent deviation value of yaw error ⁇ im is as follows
- ⁇ lb and ⁇ ub are the lower and upper bounds of the yaw error range to be analyzed, respectively.
- the method for identifying and compensating the inherent deviation of the yaw error of the wind turbine based on the real power curve mainly includes the division of the yaw error interval, the detection of the outliers of the power curve data of the wind turbine, the fitting of the true power curve of the wind turbine, and the quantitative index of the power curve It is composed of calculation and identification and compensation of inherent deviation of yaw error.
- Figure 1 is the specific flow of real-time and application of the identification and compensation method of the inherent deviation of the yaw error of the wind turbine based on the real power curve. The entire embodiment is analyzed based on the SCADA data of the wind turbine according to the process shown in FIG.
- Figures 2 to 17 are the results of various links in the process of identifying and compensating the inherent deviation of the yaw error of the wind turbine using the method based on the real power curve of the present invention for identifying and compensating the inherent deviation of the yaw error of the wind turbine.
- Enterprises that increase demand have strong application value and significance.
Landscapes
- Engineering & Computer Science (AREA)
- Life Sciences & Earth Sciences (AREA)
- Sustainable Development (AREA)
- Sustainable Energy (AREA)
- Chemical & Material Sciences (AREA)
- Combustion & Propulsion (AREA)
- Mechanical Engineering (AREA)
- General Engineering & Computer Science (AREA)
- Wind Motors (AREA)
Abstract
A real power curve-based method for discriminating and compensating a yaw error inherent deviation of a wind turbine generator set. Said method comprises: on the basis of real-time operation data, including wind speed, active power, yaw error, etc., of a supervisory control and data acquisition (SCADA) system of a wind turbine generator set, first performing a certain degree of preprocessing on the data and then dividing power curve data according to a certain yaw error interval; in combination with an outlier discrimination method, fitting power curves of different yaw error intervals by means of a real power curve fitting process; further performing a quantitative analysis on different power curves and determining, on the basis of a section determination criterion, the section range of an yaw error inherent deviation value; and finally, compensating the discriminated inherent deviation value to a yaw error measurement value. Said method is based on data driving, and has no special requirements on the operation data of the wind turbine generator set, having strong universality and having a strong application value for improving the performance of the wind turbine generator set.
Description
本发明涉及一种风电机组偏航误差固有偏差辨识及补偿方法,特别涉及一种基于真实功率曲线的风电机组偏航误差固有偏差辨识及补偿方法。The invention relates to a method for identifying and compensating the inherent deviation of the yaw error of a wind turbine, in particular to a method for identifying and compensating the inherent deviation of the yaw error of a wind turbine based on a true power curve.
在传统化石能源资源匮乏和污染严重的现代社会,风能作为一种无污染、可再生的新能源而广泛为大众所青睐,风电产业也由此成为国内外大力发展的新型可再生能源产业之一。在我国,近十年来有关风电场的建设与相关研究工作无论是从数量上还是质量上来说都有着显著的提升,但在大力发展风力发电行业的同时,也伴随着风电机组自身的不断退化所导致的一系列负面因素。现今风电机组在使用的过程中,由于风速具有间歇性与高度不确定性的特点,对风电机组本身的性能评估造成了较大的影响,而准确对风电机组的性能状况进行评估并积极探究风电机组的性能提升有效手段则是提高风电在新能源发电中竞争力的重中之重。In a modern society where traditional fossil energy resources are scarce and heavily polluted, wind energy is widely favored by the public as a non-polluting and renewable new energy source, and the wind power industry has thus become one of the new renewable energy industries vigorously developed at home and abroad . In China, the construction of wind farms and related research work in the past ten years have been significantly improved both in terms of quantity and quality, but while vigorously developing the wind power industry, it has also been accompanied by the continuous degradation of wind turbines themselves. A series of negative factors. In the process of using wind turbines today, due to the characteristics of intermittent and high uncertainty of wind speed, it has a greater impact on the performance evaluation of the wind turbine itself, and accurately assess the performance of the wind turbine and actively explore wind power The effective means to improve the performance of the unit is the top priority to improve the competitiveness of wind power in new energy power generation.
目前,风力发电系统在应对风向变化时,通过偏航系统进行调整的方式来获得最大的风能捕获效率。如图2所示为风电机组偏航控制策略示意图,其中偏航系统及执行器的具体控制策略是希望保证偏航误差的值尽可能的小,体现到实际中的物理意义即为尽可能控制风电机组的叶片扫掠面正对来流风向,即控制偏航误差θ的角度尽可能的接近0°。在当今风电行业的相关应用中,风电机组对于偏航误差角度的确定采用直接测量的方式:即在机舱后方安装风向仪并将风向仪零刻线的位置校准至与机舱方向平行;在风电机组的正常运行状况下,传感器将测量得到的风向值反馈给偏航系统,偏航系统基于自身的偏航控制策略,控制机舱向正对来流风方向调整。但风向仪在实际安装与运行维护时主要存在着以下两大问题:At present, when the wind power generation system responds to changes in the wind direction, it can adjust the yaw system to obtain the maximum wind energy capture efficiency. Figure 2 is a schematic diagram of the yaw control strategy of the wind turbine. The specific control strategy of the yaw system and actuator is to ensure that the value of the yaw error is as small as possible. The physical meaning in practice is to control as much as possible. The sweep surface of the blades of the wind turbine is directly facing the incoming wind direction, that is, the angle of controlling the yaw error θ is as close to 0 ° as possible. In the related applications of the wind power industry today, the determination of the yaw error angle of the wind turbine adopts a direct measurement method: that is, the wind direction indicator is installed behind the nacelle and the zero line of the wind direction indicator is calibrated to be parallel to the direction of the nacelle; Under normal operating conditions, the sensor feeds back the measured wind direction value to the yaw system. Based on its own yaw control strategy, the yaw system controls the cabin to adjust to the direction of the incoming wind. However, in the actual installation, operation and maintenance of the wind vane, there are two major problems:
(1)装机工人往往不会借助测量设备,而是仅凭经验或目测的方式进行风向仪零刻线位置的校准;(1) The installation workers often do not rely on measuring equipment, but only calibrate the position of the zero line of the wind vane based on experience or visual inspection;
(2)风向仪在实际运行下的反复转动过程中同样可能由于机械原因出现回程误差。这两方面的逐渐积累往往会给偏航误差角度的测量带来较大的误差,从而影响偏航系统的性能。(2) During the repeated rotation of the wind vane in actual operation, the return error may also occur due to mechanical reasons. The gradual accumulation of these two aspects will often bring a large error to the measurement of the yaw error angle, thereby affecting the performance of the yaw system.
因此,在基于数据分析的智能辨识与补偿技术在风电机组的性能提升领域的相关研究仍然处于技术空白的背景下,基于控制器改进的研究思路,需要针对风电机组机舱风向仪零位误差的确定这一问题,将偏航误差固有偏差值进行辨识并反馈补偿至偏航系统中,从而达到提升风力发电系统出力性能的目的是十分有意义的。Therefore, in the field of performance improvement of wind turbines based on the intelligent identification and compensation technology based on data analysis, the research is still in the background of technical blanks. Based on the improvement of the controller, the zero error of the wind turbine cabin wind direction indicator needs to be determined. For this problem, it is very meaningful to identify the inherent deviation value of yaw error and feedback and compensate it to the yaw system, so as to achieve the purpose of improving the output performance of the wind power generation system.
发明内容Summary of the invention
本发明目的在于填补基于数据分析的智能辨识与补偿技术在风电机组的性能提升领域的技术空白,提出一种基于真实功率曲线的风电机组偏航误差固有偏差辨识及补偿方法。该方法基于数据分析,在考虑功率曲线离群点检测的前提下对风电机组在不同偏航误差区间下的真实功率曲线进行拟合并设计相应的指标进行性能量化,最终结合简单有效的偏航误差固有偏差辨识准则及偏航误差固有偏差补偿策略实现对偏航误差固有偏差的辨识与补偿,对风电机组的发电出力性能提升具有很高的实际应用价值。The purpose of the present invention is to fill the technical gap in the field of performance improvement of wind turbines based on intelligent identification and compensation technology based on data analysis, and to propose a method for identifying and compensating the inherent deviation of yaw errors of wind turbines based on real power curves. This method is based on data analysis and fits the true power curve of the wind turbine in different yaw error intervals under the premise of considering the power curve outlier detection and designs corresponding indicators to quantify the performance, and finally combines simple and effective yaw The identification criterion of inherent deviation of error and the compensation strategy of inherent deviation of yaw error realize the identification and compensation of inherent deviation of yaw error, and have high practical application value for improving the power generation performance of wind turbine.
本发明的目的通过以下的技术方案实现:一种基于真实功率曲线的风电机组偏航误差固有偏差辨识及补偿方法,包括以下步骤:The object of the present invention is achieved by the following technical solution: A method for identifying and compensating the inherent deviation of yaw error of a wind turbine based on a true power curve, including the following steps:
1)根据待分析风电机组偏航误差固有偏差辨识及补偿需求,读取相应需求周期内总计N条待分析风电机组的SCADA系统中测量得到的风电机组运行数据信息,该信息包含风速{v
i}、有功功率{P
i}以及偏航误差{θ
i},将信息数据集记为风电机组偏航误差固有偏差分析数据集{X
i},其中i=1,2,3,…,N;
1) According to be analyzed wind turbine yaw error inherent bias identification and compensation needs to read the wind turbine operating data within the corresponding demand cycles total SCADA system the N analysis wind turbine to be measured obtained, the information containing Winds {v i }, Active power {P i } and yaw error {θ i }, record the information data set as the wind turbine yaw error inherent deviation analysis data set {X i }, where i = 1, 2, 3, ..., N ;
2)将步骤1)中的风电机组偏航误差固有偏差分析数据集{X
i}以一定的偏航误差间隔划分为M个区间,记第k个偏航误差划分区间中的数据个数为N
k、偏航误差固有偏差分析数据集为
 其中k=1,2,3,…,M,l=1,2,3,…,N
k;
2) Divide the yaw error inherent deviation analysis data set {X i } in step 1) into M intervals at a certain yaw error interval, and record the number of data in the kth yaw error division interval as N k , the yaw error inherent deviation analysis data set is Where k = 1, 2, 3, ..., M, l = 1, 2, 3, ..., N k ;
其中k=1,2,3,…,M,l=1,2,3,…,N
k;
2) Divide the yaw error inherent deviation analysis data set {X i } in step 1) into M intervals at a certain yaw error interval, and record the number of data in the kth yaw error division interval as N k , the yaw error inherent deviation analysis data set is Where k = 1, 2, 3, ..., M, l = 1, 2, 3, ..., N k ;
3)基于步骤2)中M个区间的偏航误差固有偏差分析数据集
 分别拟合出M条真实功率曲线,记第k个偏航误差区间下的真实功率曲线为{PC
k},其中k=1,2,3,…,M;
3) Analysis data set based on the inherent deviation of yaw error in M intervals in step 2) Fit the M real power curves separately, and record the real power curve under the k-th yaw error interval as {PC k }, where k = 1, 2, 3, ..., M;
分别拟合出M条真实功率曲线,记第k个偏航误差区间下的真实功率曲线为{PC
k},其中k=1,2,3,…,M;
3) Analysis data set based on the inherent deviation of yaw error in M intervals in step 2) Fit the M real power curves separately, and record the real power curve under the k-th yaw error interval as {PC k }, where k = 1, 2, 3, ..., M;
4)分别计算步骤3)中M个偏航误差区间下的真实功率曲线{PC
k}各自的量化性能指标PI
k,其中k=1,2,3,…,M;
4) Calculate the respective quantitative performance index PI k of the true power curve {PC k } under M yaw error intervals in step 3), where k = 1, 2, 3, ..., M;
5)通过偏航误差固有偏差辨识准则确定该风电机组的偏航误差固有偏差值θ
im的辨识结果,并将该偏差值θ
im直接以增量形式补偿到偏航误差实际测量值θ上,得到最终补偿后的偏航误差真实值θ′,即θ′=θ+θ
im;
5) Determine the identification result of the yaw error inherent deviation value θ im of the wind turbine by the yaw error inherent deviation identification criterion, and directly compensate the deviation value θ im to the actual yaw error measurement value θ in incremental form, The true value of yaw error θ ′ after the final compensation is obtained, that is, θ ′ = θ + θ im ;
所述偏航误差固有偏差辨识准则定义如下:将步骤4)中所有M个偏航误差区间下真实功率曲线{PC
k}的量化性能指标PI
k由大到小进行排列,并确定最大量化性能指标PI
max对应的区间下标k′,则偏航误差固有偏差值θ
im的辨识结果计算公式如下
The identification criterion of yaw error inherent deviation is defined as follows: the quantitative performance index PI k of the true power curve {PC k } under all M yaw error intervals in step 4) is arranged from large to small, and the maximum quantization performance is determined The index of the interval corresponding to the index PI max is k ′, then the calculation formula of the identification result of the inherent deviation value of yaw error θ im is as follows
其中θ
lb和θ
ub分别为待分析偏航误差范围的下界和上界。
Where θ lb and θ ub are the lower and upper bounds of the yaw error range to be analyzed, respectively.
作为更进一步描述,所述方法步骤2)中,偏航误差固有偏差分析数据集{X
i}区间划分方法步骤如下:
As a further description, in step 2) of the method, the method of dividing the interval of the yaw error inherent deviation analysis data set {X i } is as follows:
2-a)绘制偏航误差{θ
i}的频率分布直方图,并基于频率分布直方图的分布情况设定待分析偏航误差范围的下界θ
lb和上界θ
ub;
2-a) Plot the frequency distribution histogram of yaw error {θ i }, and set the lower bound θ lb and the upper bound θ ub of the yaw error range to be analyzed based on the distribution of the frequency distribution histogram;
2-b)设定偏航误差固有偏差分析数据集{X
i}的区间划分个数M;
2-b) Set the interval division number M of the yaw error inherent deviation analysis data set {X i };
2-c)以
 为偏航误差区间划分间隔,对偏航误差固有偏差分析数据集{X
i}进行划分,并仅保留风速和功率信息作为偏航误差固有偏差分析数据集
为偏航误差区间划分间隔,对偏航误差固有偏差分析数据集{X
i}进行划分,并仅保留风速和功率信息作为偏航误差固有偏差分析数据集
 2-c) to To divide the interval for the yaw error interval, divide the yaw error inherent deviation analysis data set {X i }, and keep only the wind speed and power information as the yaw error inherent deviation analysis data set
作为更进一步描述,所述方法步骤3)中,M个偏航误差区间下风电机组真实功率曲线获取流程如下:As a further description, in step 3) of the method, the process of acquiring the true power curve of the wind turbine under M yaw error intervals is as follows:
3-a)设定真实功率曲线获取初始区间k=1;3-a) Set the real power curve to obtain the initial interval k = 1;
3-b)将第k个偏航误差区间下偏航误差固有偏差分析数据集
 中的风速信息和功率信息分别进行最大值-最小值归一化处理,记归一化偏航误差固有偏差分析数据集为
 其中l=1,2,3,…,N
k;
3-b) Analyze the data set of the inherent deviation of yaw error in the k-th yaw error interval The wind speed information and power information in are respectively normalized by the maximum-minimum value, and the normalized yaw error inherent deviation analysis data set is Where l = 1, 2, 3, ..., N k ;
其中l=1,2,3,…,N
k;
3-b) Analyze the data set of the inherent deviation of yaw error in the k-th yaw error interval The wind speed information and power information in are respectively normalized by the maximum-minimum value, and the normalized yaw error inherent deviation analysis data set is Where l = 1, 2, 3, ..., N k ;
3-c)分别按照一定的风速间隔(ws)和功率间隔(ap)将步骤3-b)中的归一化偏航误差固有偏差分析数据集
 划分为M′个区间,并分别记第j个区间中的数据个数为M′
k,seg,j、归一化偏航误差固有偏差分析数据集为
划分为M′个区间,并分别记第j个区间中的数据个数为M′
k,seg,j、归一化偏航误差固有偏差分析数据集为
 其中seg={ws,ap},j=1,2,3,…,M′,n=1,2,3,…,M′
k,seg,j;
3-c) Analyze the data set of the normalized yaw error inherent deviation in step 3-b) according to a certain wind speed interval (ws) and power interval (ap) respectively Divide into M ′ intervals, and record the number of data in the j-th interval as M ′ k, seg, j , and the normalized yaw error inherent deviation analysis data set as Where seg = {ws, ap}, j = 1, 2, 3, ..., M ', n = 1, 2, 3, ..., M' k, seg, j ;
其中seg={ws,ap},j=1,2,3,…,M′,n=1,2,3,…,M′
k,seg,j;
3-c) Analyze the data set of the normalized yaw error inherent deviation in step 3-b) according to a certain wind speed interval (ws) and power interval (ap) respectively Divide into M ′ intervals, and record the number of data in the j-th interval as M ′ k, seg, j , and the normalized yaw error inherent deviation analysis data set as Where seg = {ws, ap}, j = 1, 2, 3, ..., M ', n = 1, 2, 3, ..., M' k, seg, j ;
3-d)利用均值距离判别(AVDC)离群点检测算法分别对步骤3-c)中的2M′个区间
 进行疑似离群点检测,并分别记第j个区间的疑似离群点个数为
 归一化偏航误差固有偏差分析数据集中的疑似离群点集为
 其中seg={ws,ap},j=1,2,3,…,M′,n=1,2,3,…,M′
k,seg,j;
3-d) Use the mean distance discrimination (AVDC) outlier detection algorithm to detect the 2M ′ intervals in step 3-c) respectively Perform suspected outlier detection and record the number of suspected outliers in the jth interval as The set of suspected outliers in the normalized yaw error inherent deviation analysis data set is Where seg = {ws, ap}, j = 1, 2, 3, ..., M ', n = 1, 2, 3, ..., M' k, seg, j ;
其中seg={ws,ap},j=1,2,3,…,M′,n=1,2,3,…,M′
k,seg,j;
3-d) Use the mean distance discrimination (AVDC) outlier detection algorithm to detect the 2M ′ intervals in step 3-c) respectively Perform suspected outlier detection and record the number of suspected outliers in the jth interval as The set of suspected outliers in the normalized yaw error inherent deviation analysis data set is Where seg = {ws, ap}, j = 1, 2, 3, ..., M ', n = 1, 2, 3, ..., M' k, seg, j ;
所述均值距离判别(AVDC)离群点检测算法具体为:对于数据个数M′
k,seg,j小于给定最小阈值δ
M′的区间,认为该区间归一化偏航误差固有偏差分析数据集中的疑似离群点集
 为
为
 ;否则对于第j个风速区间或第j个功率区间,首先计算区间内归一化偏航误差固有偏差分析数据集
 中各风速-功率数据点
 的判别距离
的判别距离
 进一步设定疑似离群点的占比
 并确定第j个区间中疑似离群点个数
 通过由大到小对判别距离
 进行排序的方式确定前
 个数据构成第j个区间的归一化偏航误差固有偏差分析数据集中的疑似离群点集
 The mean distance discrimination (AVDC) outlier detection algorithm is specifically: for the interval where the number of data M ′ k, seg, j is less than the given minimum threshold δ M ′ , it is considered that the interval is normalized to the inherent deviation analysis of yaw error Set of suspected outliers in the data set for Otherwise, for the jth wind speed interval or the jth power interval, the normalized yaw error inherent deviation analysis data set within the interval is first calculated Various wind speed-power data points Discriminant distance Further set the proportion of suspected outliers And determine the number of suspected outliers in the j-th interval Judging the distance from big to small Before the sorting method is determined The data constitute the set of suspected outliers in the normalized yaw error inherent deviation analysis data set of the j-th interval
所述判别距离
 的计算方式具体如下:
Discriminant distance The calculation method is as follows:
的计算方式具体如下:
Discriminant distance The calculation method is as follows:

其中
 分别为归一化偏航误差固有偏差分析数据集第j个风速区间内的功率平均值和第j个功率区间内的风速平均值,其中n=1,2,3,…,M′
k,seg,j;
among them Are the average power value in the jth wind speed interval and the average wind speed in the jth power interval of the normalized yaw error inherent deviation analysis data set, respectively, where n = 1, 2, 3, ..., M ′ k, seg, j ;
分别为归一化偏航误差固有偏差分析数据集第j个风速区间内的功率平均值和第j个功率区间内的风速平均值,其中n=1,2,3,…,M′
k,seg,j;
among them Are the average power value in the jth wind speed interval and the average wind speed in the jth power interval of the normalized yaw error inherent deviation analysis data set, respectively, where n = 1, 2, 3, ..., M ′ k, seg, j ;
3-e)分别利用局部异常因子(LOF)以及考虑噪声的基于密度的聚类(DBSCAN)这两种离群点检测算法对步骤3-c)中的2M′个区间
 进行判别离群点检测,并分别记第j个区间的判别离群点个数为
 归一化偏航误差固有偏差分析数据集中的判别离群点集为
 其中seg={ws,ap},j=1,2,3,…,M′,n=1,2,3,…,M′
k,seg,j,method={LOF,DBSCAN};
3-e) Two outlier detection algorithms using local anomaly factor (LOF) and density-based clustering (DBSCAN) considering noise are used for the 2M ′ intervals in step 3-c) Perform discriminant outlier detection and record the number of discriminant outliers in the jth interval as The discriminant outlier set in the normalized yaw error inherent deviation analysis data set is Where seg = {ws, ap}, j = 1, 2, 3, ..., M ', n = 1, 2, 3, ..., M' k, seg, j , method = {LOF, DBSCAN};
其中seg={ws,ap},j=1,2,3,…,M′,n=1,2,3,…,M′
k,seg,j,method={LOF,DBSCAN};
3-e) Two outlier detection algorithms using local anomaly factor (LOF) and density-based clustering (DBSCAN) considering noise are used for the 2M ′ intervals in step 3-c) Perform discriminant outlier detection and record the number of discriminant outliers in the jth interval as The discriminant outlier set in the normalized yaw error inherent deviation analysis data set is Where seg = {ws, ap}, j = 1, 2, 3, ..., M ', n = 1, 2, 3, ..., M' k, seg, j , method = {LOF, DBSCAN};
3-f)基于真实离群点判别准则,从步骤3-d)的归一化偏航误差固有偏差分析数据集中的疑似离群点集
 和步骤3-e)的归一化偏航误差固有偏差分析数据集中的判别离群点集
 中获取真实离群点集
 其中seg={ws,ap},j=1,2,3,…,M′,method={LOF,DBSCAN};
3-f) Based on the true outlier discrimination criteria, analyze the set of suspected outliers in the data set from the normalized yaw error inherent deviation of step 3-d) And step 3-e) the normalized yaw error inherent deviation analysis data set to discriminate outliers Get the set of true outliers in Where seg = {ws, ap}, j = 1, 2, 3, ..., M ', method = {LOF, DBSCAN};
其中seg={ws,ap},j=1,2,3,…,M′,method={LOF,DBSCAN};
3-f) Based on the true outlier discrimination criteria, analyze the set of suspected outliers in the data set from the normalized yaw error inherent deviation of step 3-d) And step 3-e) the normalized yaw error inherent deviation analysis data set to discriminate outliers Get the set of true outliers in Where seg = {ws, ap}, j = 1, 2, 3, ..., M ', method = {LOF, DBSCAN};
所述真实离群点判别准则定义为:对于第j个区间的偏航误差固有偏差分析数据集
 中的任一数据点Q,若其属于疑似离群点集
 并且属于LOF判别离群点集
 或DBSCAN判别离群点集
 之一,则点Q为第j个区间的真实离群点;
The criterion for determining true outliers is defined as: the data set for inherent deviation analysis of the yaw error of the j-th interval Any data point Q in, if it belongs to a set of suspected outliers And belong to the set of LOF discriminating outliers Or DBSCAN to distinguish outlier sets One, then point Q is the true outlier in the jth interval;
之一,则点Q为第j个区间的真实离群点;
The criterion for determining true outliers is defined as: the data set for inherent deviation analysis of the yaw error of the j-th interval Any data point Q in, if it belongs to a set of suspected outliers And belong to the set of LOF discriminating outliers Or DBSCAN to distinguish outlier sets One, then point Q is the true outlier in the jth interval;
3-g)基于步骤3-f)中得到的各风速区间真实离群点集
 以及各功率区间真实离群点集
 利用最终离群点判断准则获得偏航误差固有偏差分析数据集
 的最终离群点判别结果集{Outlier
k}并加以剔除,记剔除离群点后的偏航误差固有偏差分析标准数据集为
的最终离群点判别结果集{Outlier
k}并加以剔除,记剔除离群点后的偏航误差固有偏差分析标准数据集为
 3-g) Based on the set of true outliers in each wind speed interval obtained in step 3-f) And the set of true outliers in each power interval Using the final outlier judgment criterion to obtain the yaw error inherent deviation analysis data set The final outlier discrimination result set {Outlier k } is removed, and the standard data set for analyzing the inherent deviation of yaw error after excluding outliers is
所述最终离群点判断准则定义为:对于偏航误差固有偏差分析数据集
 中的任一数据点Q′,若其在归一化偏航误差固有偏差分析数据集
 中对应的数据点Q是某风速区间或某功率区间的真实离群点,则点Q′为偏航误差固有偏差分析数据集
 的最终离群点。
The final outlier judgment criterion is defined as: analysis data set for inherent deviation of yaw error Any data point in Q ′, if it is in the normalized yaw error inherent deviation analysis data set The corresponding data point Q in is a true outlier in a wind speed interval or a power interval, then point Q ′ is the yaw error inherent deviation analysis data set The final outlier.
的最终离群点。
The final outlier judgment criterion is defined as: analysis data set for inherent deviation of yaw error Any data point in Q ′, if it is in the normalized yaw error inherent deviation analysis data set The corresponding data point Q in is a true outlier in a wind speed interval or a power interval, then point Q ′ is the yaw error inherent deviation analysis data set The final outlier.
3-h)确定步骤3-g)中获取到的偏航误差固有偏差分析标准数据集
 中的风速对应的最大值v
max,并以固定风速间隔Δv为风速区间划分间隔,将第k个偏航误差区间下偏航误差固有偏差分析标准数据集
中的风速对应的最大值v
max,并以固定风速间隔Δv为风速区间划分间隔,将第k个偏航误差区间下偏航误差固有偏差分析标准数据集
 进一步基于风速信息进行划分,则第q个风速区间下的偏航误差固有偏差分析标准数据集
 定义为
3-h) Determine the standard data set for the analysis of the inherent deviation of yaw error obtained in step 3-g) The maximum value v max corresponding to the wind speed in, and divide the interval with the fixed wind speed interval Δv as the wind speed interval, and analyze the standard data set of the inherent deviation of the yaw error under the kth yaw error interval Based on the further division of wind speed information, the standard data set for inherent deviation analysis of yaw error in the qth wind speed interval defined as
定义为
3-h) Determine the standard data set for the analysis of the inherent deviation of yaw error obtained in step 3-g) The maximum value v max corresponding to the wind speed in, and divide the interval with the fixed wind speed interval Δv as the wind speed interval, and analyze the standard data set of the inherent deviation of the yaw error under the kth yaw error interval Based on the further division of wind speed information, the standard data set for inherent deviation analysis of yaw error in the qth wind speed interval defined as
q=1,2,3,…,M
k m=1,2,3,…,M
k,q
q = 1, 2, 3, ..., M k m = 1, 2, 3, ..., M k, q
其中M
k,q为第q个风速区间下的偏航误差固有偏差分析标准数据集
 中的数据个数;M
k 为第k个偏航误差区间下偏航误差固有偏差分析标准数据集
中的数据个数;M
k 为第k个偏航误差区间下偏航误差固有偏差分析标准数据集
 的风速区间划分个数,计算公式如下
Where M k, q is the standard data set for inherent deviation analysis of yaw error at the qth wind speed interval The number of data in; M k is the standard data set for the analysis of the inherent deviation of yaw error in the k-th yaw error interval The number of the wind speed interval is divided, the calculation formula is as follows
的风速区间划分个数,计算公式如下
Where M k, q is the standard data set for inherent deviation analysis of yaw error at the qth wind speed interval The number of data in; M k is the standard data set for the analysis of the inherent deviation of yaw error in the k-th yaw error interval The number of the wind speed interval is divided, the calculation formula is as follows

其中
 函数为向上取整函数;
among them The function is an upward rounding function;
函数为向上取整函数;
among them The function is an upward rounding function;
3-i)计算每个风速区间下的偏航误差固有偏差分析数据集
 中的平均风速
 以及平均功率
 并将所有平均风速和平均功率分别进行最大值-最小值归一化处理,得到归一化后的平均风速
 和平均功率
和平均功率
 3-i) Calculate the yaw error inherent deviation analysis data set for each wind speed interval Average wind speed in And average power All the average wind speed and average power are normalized to the maximum value-minimum value respectively to obtain the normalized average wind speed And average power
3-j)基于平均风速
 以及平均功率
 确定每个风速区间下的功率曲线拟合中心点
 方式如下:若第j个风速区间下的偏航误差固有偏差分析标准数据集
 中的数据个数M
k,q=0,则认为无功率曲线拟合中心点;反之则认为功率曲线拟合中心点
中的数据个数M
k,q=0,则认为无功率曲线拟合中心点;反之则认为功率曲线拟合中心点
 3-j) Based on average wind speed And average power Determine the center point of the power curve fit in each wind speed interval The method is as follows: if the standard data set for inherent deviation analysis of yaw error in the jth wind speed interval The number of data in M k, q = 0, it is considered that no power curve fits the center point; otherwise, the power curve fits the center point
3-k)补充定义中心点
 并记第k个偏航误差区间下的功率曲线拟合中心点个数为M′
k,计算每个功率曲线拟合中心点
并记第k个偏航误差区间下的功率曲线拟合中心点个数为M′
k,计算每个功率曲线拟合中心点
 对应的参数值
 公式为
3-k) Supplemental definition of center point And remember that the number of power curve fitting center points under the kth yaw error interval is M ′ k , calculate the center point of each power curve fitting Corresponding parameter value The formula is
公式为
3-k) Supplemental definition of center point And remember that the number of power curve fitting center points under the kth yaw error interval is M ′ k , calculate the center point of each power curve fitting Corresponding parameter value The formula is

其中
 为两个相邻的功率曲线拟合中心点
 与
与
 对应坐标归一化后的弦长,即
among them Fit the center point of two adjacent power curves versus The chord length normalized to the corresponding coordinates, ie
对应坐标归一化后的弦长,即
among them Fit the center point of two adjacent power curves versus The chord length normalized to the corresponding coordinates, ie
d
k为所有功率曲线拟合中心点对应坐标归一化后的总弦长,即
 d k is the total chord length normalized by the coordinates corresponding to the center points of all power curve fittings, ie
3-1)采用最小二乘B样条拟合算法对第k个偏航误差区间下的功率曲线进行拟合,其拟合函数B
k(t)定义如下:
3-1) The least square B spline fitting algorithm is used to fit the power curve under the k-th yaw error interval, and the fitting function B k (t) is defined as follows:
其中N
r,p(t)为阶数为p的第r段B样条拟合函数的标准函数,t为最小二乘B样条拟合函数的自变量,
 为该最小二乘B样条拟合函数的第r个控制点;
 为分段节点,s=0,1,2,…,p-1,p,p+1,…,M′
k-1,M′
k,M′
k+1,…,M′
k+p,其计算公式如下:
Where N r, p (t) is the standard function of the r-th B-spline fitting function of order p, and t is the independent variable of the least-square B-spline fitting function, The rth control point of the least square B-spline fitting function; For a segmented node, s = 0, 1, 2, ..., p-1, p, p + 1, ..., M ′ k -1, M ′ k , M ′ k +1, ..., M ′ k + p , The calculation formula is as follows:
为分段节点,s=0,1,2,…,p-1,p,p+1,…,M′
k-1,M′
k,M′
k+1,…,M′
k+p,其计算公式如下:
Where N r, p (t) is the standard function of the r-th B-spline fitting function of order p, and t is the independent variable of the least-square B-spline fitting function, The rth control point of the least square B-spline fitting function; For a segmented node, s = 0, 1, 2, ..., p-1, p, p + 1, ..., M ′ k -1, M ′ k , M ′ k +1, ..., M ′ k + p , The calculation formula is as follows:

3-m)基于如下最小二乘优化函数确定B样条拟合函数B
k(t)中的所有控制点
 3-m) Determine all control points in the B-spline fitting function B k (t) based on the following least squares optimization function

3-n)将求解得到的最小二乘B样条拟合函数B
k(t)转换为自变量为风速v的多项式形式,作为第k个偏航误差区间下的真实功率曲线结果{PC
k};
3-n) Convert the obtained least squares B-spline fitting function B k (t) into a polynomial form whose independent variable is wind speed v as the true power curve result under the k-th yaw error interval {PC k };
3-o)设置待分析区间k=k+1,并重复进行步骤3-b)至步骤4-n),直到j>M为止。3-o) Set the interval k = k + 1 to be analyzed, and repeat steps 3-b) to 4-n) until j> M.
作为更进一步描述,所述方法步骤3-c)中,归一化偏航误差固有偏差分析数据集
 的划分方法具体如下:
As a further description, in step 3-c) of the method, the normalized yaw error inherent deviation analysis data set The division method is as follows:
的划分方法具体如下:
As a further description, in step 3-c) of the method, the normalized yaw error inherent deviation analysis data set The division method is as follows:
3-c-a)确定归一化偏航误差固有偏差分析数据集
 的区间划分个数M′;
3-ca) Determine the normalized yaw error inherent deviation analysis data set The number of intervals divided by M ′;
的区间划分个数M′;
3-ca) Determine the normalized yaw error inherent deviation analysis data set The number of intervals divided by M ′;
3-c-b)以
 为划分间隔,将数据集
 分别按照风速和功率进行均匀划分,得到各风速区间和各功率区间下的归一化偏航误差固有偏差分析数据集
 和
和
 3-cb) to To divide the interval, the data set According to the wind speed and power, it is divided evenly, and the normalized yaw error inherent deviation analysis data set under each wind speed section and each power section is obtained. with
作为更进一步描述,所述方法步骤3-d)中,利用均值距离判别(AVDC)离群点检测算法进行
 中各区间内疑似离群点检测,算法详细流程如下:
As a further description, in step 3-d) of the method, the mean distance discrimination (AVDC) outlier detection algorithm is used In the detection of suspected outliers in each interval in the middle, the detailed process of the algorithm is as follows:
中各区间内疑似离群点检测,算法详细流程如下:
As a further description, in step 3-d) of the method, the mean distance discrimination (AVDC) outlier detection algorithm is used In the detection of suspected outliers in each interval in the middle, the detailed process of the algorithm is as follows:
3-d-a)设定初始离群点检测区间j=1;3-d-a) Set the initial outlier detection interval j = 1;
3-d-b)若第j个区间对应归一化偏航误差固有偏差分析数据集
 中的数据个数M′
k,seg,j小于给定最小阈值δ
M′,则认为第j个区间的疑似离群点个数
中的数据个数M′
k,seg,j小于给定最小阈值δ
M′,则认为第j个区间的疑似离群点个数
 为0、归一化偏航误差固有偏差分析数据集中的疑似离群点集
 为
为
 并跳至步骤3-d-g)继续执行;反之则继续执行步骤3-d-c);
3-db) If the j-th interval corresponds to the normalized yaw error inherent deviation analysis data set The number of data in M ′ k, seg, j is less than the given minimum threshold δ M ′ , then the number of suspected outliers in the j-th interval is considered 0, normalized yaw error inherent deviation analysis data set of suspected outliers for And skip to step 3-dg) to continue execution; otherwise, continue to step 3-dc);
并跳至步骤3-d-g)继续执行;反之则继续执行步骤3-d-c);
3-db) If the j-th interval corresponds to the normalized yaw error inherent deviation analysis data set The number of data in M ′ k, seg, j is less than the given minimum threshold δ M ′ , then the number of suspected outliers in the j-th interval is considered 0, normalized yaw error inherent deviation analysis data set of suspected outliers for And skip to step 3-dg) to continue execution; otherwise, continue to step 3-dc);
3-d-c)设定疑似离群点在第j个区间归一化偏航误差固有偏差分析数据集
 中的占比
中的占比
 并计算第j个区间中疑似离群点个数
 计算公式定义为
3-dc) Set the normalized yaw error inherent deviation analysis data set for the suspected outlier in the j-th interval % Of And calculate the number of suspected outliers in the jth interval The calculation formula is defined as
计算公式定义为
3-dc) Set the normalized yaw error inherent deviation analysis data set for the suspected outlier in the j-th interval % Of And calculate the number of suspected outliers in the jth interval The calculation formula is defined as
其中
 函数为向上取整函数;
among them The function is an upward rounding function;
函数为向上取整函数;
among them The function is an upward rounding function;
3-d-d)计算第j个风速区间归一化偏航误差固有偏差分析数据集
 中各数据点
中各数据点
 的风速判别距离
 计算公式如下
3-dd) Calculate the normalized yaw error inherent deviation analysis data set of the jth wind speed interval Data points Discriminating distance Calculated as follows
计算公式如下
3-dd) Calculate the normalized yaw error inherent deviation analysis data set of the jth wind speed interval Data points Discriminating distance Calculated as follows
其中
 为第j个风速区间内归一化偏航误差固有偏差分析数据集的功率平均值;
among them The average power of the analysis data set for the normalized yaw error inherent deviation in the jth wind speed interval;
为第j个风速区间内归一化偏航误差固有偏差分析数据集的功率平均值;
among them The average power of the analysis data set for the normalized yaw error inherent deviation in the jth wind speed interval;
3-d-e)计算第j个功率区间归一化偏航误差固有偏差分析数据集
 中各数据点
中各数据点
 的风速判别距离
 计算公式如下
3-de) Calculate the normalized yaw error inherent deviation analysis data set of the jth power interval Data points Discriminating distance Calculated as follows
计算公式如下
3-de) Calculate the normalized yaw error inherent deviation analysis data set of the jth power interval Data points Discriminating distance Calculated as follows
其中
 为第j个功率区间内归一化偏航误差固有偏差分析数据集的风速平均值;
among them The wind speed average value of the normalized yaw error inherent deviation analysis data set in the jth power interval;
为第j个功率区间内归一化偏航误差固有偏差分析数据集的风速平均值;
among them The wind speed average value of the normalized yaw error inherent deviation analysis data set in the jth power interval;
3-d-f)将第j个区间的判别距离数据集
 分别由大到小进行排序,并分别选取排序后的判别距离数据集中的前
 个数据,构成第j个区间的归一化偏航误差固有偏差分析数据集中的疑似离群点集
 其中n=1,2,3,…,M′
k,ap,j;
3-df) The discriminant distance data set of the jth interval Sort from large to small, and select the sorted discriminant distance before the data set Data, which constitute the set of suspected outliers in the normalized yaw error inherent deviation analysis data set of the j-th interval Where n = 1, 2, 3, ..., M ′ k, ap, j ;
其中n=1,2,3,…,M′
k,ap,j;
3-df) The discriminant distance data set of the jth interval Sort from large to small, and select the sorted discriminant distance before the data set Data, which constitute the set of suspected outliers in the normalized yaw error inherent deviation analysis data set of the j-th interval Where n = 1, 2, 3, ..., M ′ k, ap, j ;
3-d-g)设置检测区间j=j+1,并重复进行步骤3-d-b)至步骤3-d-f),直到j>M′为止。3-d-g) Set the detection interval j = j + 1, and repeat steps 3-d-b) to 3-d-f) until j> M ′.
作为更进一步描述,所述方法步骤4)中,量化性能指标PI
k的定义如下:
As a further description, in step 4) of the method, the definition of the quantitative performance indicator PI k is as follows:
其中N
h为1年时间转化为小时的数值;CAP为待分析风电机组的额定功率;
 为第k个偏航误差区间下、第j个风速区间中的风速中值,即
 且
且
 为第k个偏航误差区间的真实功率曲线{PC
k}上
为第k个偏航误差区间的真实功率曲线{PC
k}上
 对应的功率值,且
 F(·)函数为Rayleigh分布的累计概率分布函数,具体公式如下
Where N h is the value converted from 1 year to hours; CAP is the rated power of the wind turbine to be analyzed; Is the median wind speed in the k-th yaw error interval and in the j-th wind speed interval, ie And Is the true power curve {PC k } of the k-th yaw error interval The corresponding power value, and The F (·) function is the cumulative probability distribution function of Rayleigh distribution, the specific formula is as follows
F(·)函数为Rayleigh分布的累计概率分布函数,具体公式如下
Where N h is the value converted from 1 year to hours; CAP is the rated power of the wind turbine to be analyzed; Is the median wind speed in the k-th yaw error interval and in the j-th wind speed interval, ie And Is the true power curve {PC k } of the k-th yaw error interval The corresponding power value, and The F (·) function is the cumulative probability distribution function of Rayleigh distribution, the specific formula is as follows
其中v
ave为待分析风电机组的年平均风速。
Where v ave is the average annual wind speed of the wind turbine to be analyzed.
与现有技术相比,本发明具有以下创新优势及显著效果:Compared with the prior art, the present invention has the following innovative advantages and significant effects:
1)针对现有风电机组功率曲线离群点检测及判别算法中未考虑不同工况给判别流程带来的影响这一问题,通过风速及功率区间划分的方式来约束运行工况的方式来进行分段研究,保证功率曲线数据在风电机组运行工况方面一定程度的统一;同时结合多种离群点检测算法的优势,突破单一离群点检测算法的应用限制,使风电机组功率曲线拟合结果更真实、准确;1) For the problem that the existing wind turbine power curve outlier detection and discrimination algorithm does not consider the impact of different operating conditions on the discrimination process, the method of restricting the operating conditions is carried out by dividing the wind speed and power interval Sectional research to ensure that the power curve data is unified to a certain extent in the operating conditions of the wind turbine; at the same time, combining the advantages of multiple outlier detection algorithms, it breaks through the application limit of a single outlier detection algorithm and makes the wind turbine power curve fit The result is more true and accurate;
2)创新性地提出一种基于功率曲线分析的风电机组偏航误差固有偏差辨识及补偿方法,填补基于数据分析的智能辨识与补偿技术在风电机组的性能提升领域的技术空白。2) Innovatively propose a method for identifying and compensating the inherent deviation of yaw error of wind turbine based on power curve analysis to fill the technical gap in the field of performance improvement of wind turbine based on intelligent identification and compensation technology based on data analysis.
3)设计了包括风电机组真实功率曲线拟合、功率曲线性能量化指标构建、偏航误差固有偏差辨识以及偏航误差固有偏差补偿策略制定等步骤在内的风电机组性能提升流程,具有较强的实用性、可靠性与扩展性。3) Designed a wind turbine performance improvement process including steps such as true power curve fitting of wind turbines, construction of power curve performance quantitative indicators, identification of inherent deviation of yaw error and formulation of compensation strategy for inherent deviation of yaw error Practicability, reliability and scalability.
图1是本发明基于功率曲线分析的风电机组偏航误差固有偏差辨识及补偿方法流程图;1 is a flowchart of a method for identifying and compensating the inherent deviation of yaw error of a wind turbine based on power curve analysis of the present invention;
图2是本发明应用领域内风电机组偏航误差固有偏差等角度相关关系示意图;2 is a schematic diagram of the angle correlation relationship of the inherent deviation of the yaw error of the wind turbine in the application field of the present invention;
图3是本发明实施例中步骤1)中风电机组功率曲线原始数据散点图;FIG. 3 is a scatter diagram of the original data of the power curve of the wind turbine in step 1) in the embodiment of the present invention;
图4是本发明实施例中步骤2-a)中补偿前的偏航误差频率分布直方图;4 is a histogram of the frequency distribution of yaw error before compensation in step 2-a) in the embodiment of the present invention;
图5是本发明实施例中步骤2-c)至步骤3-c)中偏航误差区间为[-1°,0°]的归一化功率曲线原始散点以及风速&功率划分相关结果图;FIG. 5 is a graph showing the original scatter of the normalized power curve and the related results of wind speed & power division in the step 2-c) to step 3-c) in the embodiment of the present invention with a yaw error interval of [-1 °, 0 °] ;
图6是实施例中偏航误差区间为[-1°,0°]、风速划分数据下的AVDC疑似离群点检测结果图;FIG. 6 is an AVDC suspected outlier detection result graph under yaw error interval of [-1 °, 0 °] and wind speed division data in the embodiment;
图7是实施例中偏航误差区间为[-1°,0°]、功率划分数据下的AVDC疑似离群点检测结果图;7 is a graph of the detection result of AVDC suspected outliers under the power division data in the yaw error interval of [-1 °, 0 °] in the embodiment;
图8、图9分别是实施例中偏航误差区间为[-1°,0°]、风速划分数据下的LOF判别离群点检测结果图和DBSCAN判别离群点检测结果图;8 and 9 are the LOF discriminating outlier detection result graph and DBSCAN discriminating outlier detection result graph under the yaw error interval of [-1 °, 0 °] and wind speed division data in the embodiment, respectively;
图10、图11分别是实施例中偏航误差区间为[-1°,0°]、功率划分数据下的LOF判别离群点检测结果图和DBSCAN判别离群点检测结果图;FIG. 10 and FIG. 11 are the LOF discriminating outlier detection result graph and the DBSCAN discriminating outlier detection result graph under the yaw error interval of [-1 °, 0 °] and power division data respectively in the embodiment;
图12是实施例中偏航误差区间为[-1°,0°]、风速划分数据下的真实离群点检测结果图;12 is a graph of detection results of real outliers under the yaw error interval of [-1 °, 0 °] and wind speed division data in the embodiment;
图13是实施例中偏航误差区间为[-1°,0°]、功率划分数据下的真实离群点检测结果图;13 is a graph of detection results of real outliers under power division data in an embodiment with a yaw error interval of [-1 °, 0 °];
图14是实施例中偏航误差区间为[-1°,0°]下偏航误差固有偏差分析数据集的最终离群点检测结果图;14 is a graph of the final outlier detection result of the yaw error inherent deviation analysis data set in the embodiment where the yaw error interval is [-1 °, 0 °];
图15是实施例中偏航误差区间为[-1°,0°]下偏航误差固有偏差分析标准数据集的真实功率曲线相关结果图;15 is a graph showing the correlation results of the true power curve of the standard data set for the analysis of the inherent deviation of the yaw error in the embodiment where the yaw error interval is [-1 °, 0 °];
图16、图17分别是实施例中偏航误差固有偏差补偿前、后各偏航误差区间下功率曲线量化性能指标结果图。16 and 17 are graphs showing the results of the quantized performance index of the power curve in the yaw error interval before and after the compensation of the inherent deviation of the yaw error in the embodiment.
以下结合附图对本发明的具体实施方法与工作原理作如下详述:The specific implementation method and working principle of the present invention will be described in detail below with reference to the drawings:
实施例Examples
由于风电场中的风电机组在不同时段内运行时的风况很难完全一致,出于对本发明专利方法有效性的验证,本实施例中采用的数据为GH Bladed 3.82在同一型号风电机组、同一风文件下的仿真数据来对风电机组偏航误差固有偏差辨识及补偿方法进行分析研究。数据采样间隔为10min,数据信息为期5年,总计284405条。数据集包括的相关信息如表1、表2所示:Since the wind conditions of the wind turbines in the wind farm are difficult to be consistent during different periods of time, for the purpose of verifying the effectiveness of the patent method of the present invention, the data used in this embodiment is GH Bladed 3.82. The simulation data in the wind file is used to analyze and study the identification and compensation method of the inherent deviation of the yaw error of the wind turbine. The data sampling interval is 10 minutes, and the data information lasts 5 years, with a total of 284,405 entries. The relevant information included in the data set is shown in Table 1 and Table 2:
表1 GH Bladed 3.82下对某型号风电机组在某风文件下的部分仿真数据Table 1 Partial simulation data of a certain type of wind turbine under a wind file under GH Bladed 3.82
| 数据序号Data number | 风速Wind speed | 有功功率Active power | 环境温度Ambient temperature | 环境气压Ambient air pressure | 偏航误差Yaw error |
| …… | …… | …… | …… | …… | …… |
| 105679105679 | 4.29924.2992 | 81.029081.0290 | 25.000025.0000 | 100463.2887100463.2887 | 5.78525.7852 |
| 105680105680 | 4.54174.5417 | 81.881081.8810 | 25.000025.0000 | 100463.2887100463.2887 | 15.298015.2980 |
| 105681105681 | 4.96674.9667 | 82.870082.8700 | 25.000025.0000 | 100463.2887100463.2887 | 1.66411.6641 |
| …… | …… | …… | …… | …… | …… |
| 235640235640 | 11.699011.6990 | 1504.70001504.7000 | 25.000025.0000 | 100463.2887100463.2887 | 6.06196.0619 |
| 235641235641 | 11.520011.5200 | 1549.50001549.5000 | 25.000025.0000 | 100463.2887100463.2887 | 9.13179.1317 |
| 235642235642 | 11.147011.1470 | 1550.00001550.0000 | 25.000025.0000 | 100463.2887100463.2887 | -0.0520-0.0520 |
| …… | …… | …… | …… | …… | …… |
表2 GH Bladed 3.82下对某型号风电机组的仿真数据集变量信息Table 2 Variable information of simulation data set for a certain type of wind turbine under GH Bladed 3.82
| 变量名称Variable name | 变量含义Variable meaning | 变量单位Variable unit |
| 风速vWind speed v | 当前风电机组机舱风速Current wind speed of wind turbine cabin | m/sm / s |
| 有功功率PActive power P | 当前风电机组有功功率Current active power of wind turbine | kWkW |
| 环境温度TAmbient temperature T | 风电机组运行环境温度Wind turbine operating ambient temperature | ℃℃ |
| 环境气压BAmbient air pressure B | 风电机组运行环境气压Operating pressure of wind turbine | PaPa |
| 偏航误差θYaw error θ | 当前风电机组偏航误差Current wind turbine yaw error | °° |
值得一提的是,GH Bladed中测量得到的偏航误差并没有实际应用过程中风向仪在测量过程中测量过程中存在的偏航误差固有偏差,因此在仿真过程中采用将测量值人为+5°的方式来模拟实际过程中存在-5°偏航误差固有偏差的现象。本实施例中默认利用上述全部仿真数据来进行偏航误差固有偏差辨识与补偿方法的实施,方法结果为得到的风电机组片偏航误差固有偏差的辨识结果并通过补偿手段进行方法有效性的验证,其详细实施步骤具体如下:It is worth mentioning that the yaw error measured in GH Bladed does not have the inherent deviation of the yaw error in the measurement process of the wind vane during the actual application process, so the measured value is artificially +5 in the simulation process ° way to simulate the actual deviation of -5 ° yaw error in the actual process. In this embodiment, all the above simulation data is used by default to implement the identification and compensation method of the inherent deviation of the yaw error. The method result is the identification result of the inherent deviation of the yaw error of the wind turbine module and the method is verified by the compensation The detailed implementation steps are as follows:
1)根据待分析风电机组偏航误差固有偏差辨识及补偿需求,读取相应需求周期内总计N条待分析风电机组的SCADA系统中测量得到的风电机组运行数据信息,该信息包含风速{v
i}、有功功率{P
i}以及偏航误差{θ
i},将信息数据集记为风电机组偏航误差固有偏差分析数据集{X
i},其中i=1,2,3,…,N;根据表1以及表2所列出的数据集变量信息描述,本实施例中的数据集包括了本步骤中的所有必要信息,图3所示的结果为本步骤中风电机组功率曲线原始数据散点图;
1) According to be analyzed wind turbine yaw error inherent bias identification and compensation needs to read the wind turbine operating data within the corresponding demand cycles total SCADA system the N analysis wind turbine to be measured obtained, the information containing Winds {v i }, Active power {P i } and yaw error {θ i }, record the information data set as the wind turbine yaw error inherent deviation analysis data set {X i }, where i = 1, 2, 3, ..., N ; According to the description of the variable information of the data set listed in Table 1 and Table 2, the data set in this embodiment includes all the necessary information in this step. Scatter plot
2)将步骤1)中的风电机组偏航误差固有偏差分析数据集{X
i}以一定的偏航误差间隔划分为M个区间,记第k个偏航误差划分区间中的数据个数为N
k、偏航误差固有偏差分析数据集为
 其中k=1,2,3,…,M,l=1,2,3,…,N
k;偏航误差固有偏差分析数据集{X
i}区间划分的一种优选方法步骤如下,但不限于此:
2) Divide the yaw error inherent deviation analysis data set {X i } in step 1) into M intervals at a certain yaw error interval, and record the number of data in the kth yaw error division interval as N k , the yaw error inherent deviation analysis data set is Where k = 1, 2, 3, ..., M, l = 1, 2, 3, ..., N k ; a preferred method for dividing the interval of the yaw error inherent deviation analysis data set {X i } is as follows, but not Limited to this:
其中k=1,2,3,…,M,l=1,2,3,…,N
k;偏航误差固有偏差分析数据集{X
i}区间划分的一种优选方法步骤如下,但不限于此:
2) Divide the yaw error inherent deviation analysis data set {X i } in step 1) into M intervals at a certain yaw error interval, and record the number of data in the kth yaw error division interval as N k , the yaw error inherent deviation analysis data set is Where k = 1, 2, 3, ..., M, l = 1, 2, 3, ..., N k ; a preferred method for dividing the interval of the yaw error inherent deviation analysis data set {X i } is as follows, but not Limited to this:
2-a)绘制偏航误差{θ
i}的频率分布直方图,并基于频率分布直方图的分布情况设定待分析偏航误差范围的下界θ
lb和上界θ
ub;本实施例中的偏航误差频率分布直方图如图4所示,从图中选取10%分位数与90%分位数就近取整值作为待分析偏航误差的下界θ
lb和上界θ
ub,10%和90%分位数值为-13.984°和5.273°,进一步通过就进取整方式后确定θ
lb为-14°,θ
ub为5°;
2-a) Draw a frequency distribution histogram of yaw error {θ i }, and set the lower bound θ lb and the upper bound θ ub of the yaw error range to be analyzed based on the distribution of the frequency distribution histogram; The histogram of the frequency distribution of yaw error is shown in Fig. 4. The 10% quantile and the 90% quantile are selected from the figure to take the nearest integer as the lower bound θ lb and upper bound θ ub of the yaw error to be analyzed, 10% And the 90% quantile values are -13.984 ° and 5.273 °, and the θ lb is -14 ° and θ ub is 5 ° after further adopting the aggressive rounding method;
2-b)设定偏航误差固有偏差分析数据集{X
i}的区间划分个数M;在本实施例中,M取20;
2-b) Set the interval division number M of the yaw error inherent deviation analysis data set {X i }; in this embodiment, M takes 20;
2-c)以
 为偏航误差区间划分间隔,对偏航误差固有偏差分析数据集{X
i}进行划分,并仅保留风速和功率信息作为偏航误差固有偏差分析数据集
为偏航误差区间划分间隔,对偏航误差固有偏差分析数据集{X
i}进行划分,并仅保留风速和功率信息作为偏航误差固有偏差分析数据集
 在本实施例中,由 于篇幅限制原因,仅给出对应偏航误差区间为[-1°,0°]的功率曲线散点数据图,如图5所示。
2-c) to To divide the interval for the yaw error interval, divide the yaw error inherent deviation analysis data set {X i }, and keep only the wind speed and power information as the yaw error inherent deviation analysis data set In this embodiment, due to space limitations, only the power curve scatter data graph corresponding to the yaw error interval [-1 °, 0 °] is given, as shown in FIG.
在本实施例中,由 于篇幅限制原因,仅给出对应偏航误差区间为[-1°,0°]的功率曲线散点数据图,如图5所示。
2-c) to To divide the interval for the yaw error interval, divide the yaw error inherent deviation analysis data set {X i }, and keep only the wind speed and power information as the yaw error inherent deviation analysis data set In this embodiment, due to space limitations, only the power curve scatter data graph corresponding to the yaw error interval [-1 °, 0 °] is given, as shown in FIG.
3)基于步骤2)中M个区间的偏航误差固有偏差分析数据集
 分别拟合出M条真实功率曲线,记第k个偏航误差区间下的真实功率曲线为{PC
k},其中k=1,2,3,…,M;风电机组真实功率曲线获取的一种优选算法流程如下:
3) Analysis data set based on the inherent deviation of yaw error in M intervals in step 2) Fit the M real power curves separately, and record the real power curve under the k-th yaw error interval as {PC k }, where k = 1, 2, 3, ..., M; the one obtained by the real power curve of the wind turbine The flow of this preferred algorithm is as follows:
分别拟合出M条真实功率曲线,记第k个偏航误差区间下的真实功率曲线为{PC
k},其中k=1,2,3,…,M;风电机组真实功率曲线获取的一种优选算法流程如下:
3) Analysis data set based on the inherent deviation of yaw error in M intervals in step 2) Fit the M real power curves separately, and record the real power curve under the k-th yaw error interval as {PC k }, where k = 1, 2, 3, ..., M; the one obtained by the real power curve of the wind turbine The flow of this preferred algorithm is as follows:
3-a)设定真实功率曲线获取初始区间k=1;3-a) Set the real power curve to obtain the initial interval k = 1;
3-b)将第k个偏航误差区间下偏航误差固有偏差分析数据集
 中的风速信息和功率信息分别进行最大值-最小值归一化处理,记归一化偏航误差固有偏差分析数据集为
 其中l=1,2,3,…,N
k;在本实施例中,归一化后的偏航误差固有偏差分析数据集为
其中l=1,2,3,…,N
k;在本实施例中,归一化后的偏航误差固有偏差分析数据集为
 散点图如图5中黑色数据点所示;
3-b) Analyze the data set of the inherent deviation of yaw error in the k-th yaw error interval The wind speed information and power information in are respectively normalized by the maximum-minimum value, and the normalized yaw error inherent deviation analysis data set is Where l = 1, 2, 3, ..., N k ; in this embodiment, the normalized yaw error inherent deviation analysis data set is The scatterplot is shown in black data points in Figure 5;
散点图如图5中黑色数据点所示;
3-b) Analyze the data set of the inherent deviation of yaw error in the k-th yaw error interval The wind speed information and power information in are respectively normalized by the maximum-minimum value, and the normalized yaw error inherent deviation analysis data set is Where l = 1, 2, 3, ..., N k ; in this embodiment, the normalized yaw error inherent deviation analysis data set is The scatterplot is shown in black data points in Figure 5;
3-c)分别按照一定的风速间隔(ws)和功率间隔(ap)将步骤3-b)中的归一化偏航误差固有偏差分析数据集
 划分为M′个区间,并分别记第j个区间中的数据个数为M′
k,seg,j、归一化偏航误差固有偏差分析数据集为
划分为M′个区间,并分别记第j个区间中的数据个数为M′
k,seg,j、归一化偏航误差固有偏差分析数据集为
 其中seg={ws,ap},j=1,2,3,…,M′,n=1,2,3,…,M′
k,seg,j;归一化偏航误差固有偏差分析数据集
其中seg={ws,ap},j=1,2,3,…,M′,n=1,2,3,…,M′
k,seg,j;归一化偏航误差固有偏差分析数据集
 的一种优选划分方法具体如下,但不限于此:
3-c) The normalized yaw error inherent deviation analysis data set in step 3-b) is analyzed according to a certain wind speed interval (ws) and power interval (ap) Divide into M ′ intervals, and record the number of data in the j-th interval as M ′ k, seg, j , and the normalized yaw error inherent deviation analysis data set as Where seg = {ws, ap}, j = 1, 2, 3, ..., M ', n = 1, 2, 3, ..., M' k, seg, j ; normalized yaw error inherent deviation analysis data set A preferred division method is as follows, but not limited to this:
的一种优选划分方法具体如下,但不限于此:
3-c) The normalized yaw error inherent deviation analysis data set in step 3-b) is analyzed according to a certain wind speed interval (ws) and power interval (ap) Divide into M ′ intervals, and record the number of data in the j-th interval as M ′ k, seg, j , and the normalized yaw error inherent deviation analysis data set as Where seg = {ws, ap}, j = 1, 2, 3, ..., M ', n = 1, 2, 3, ..., M' k, seg, j ; normalized yaw error inherent deviation analysis data set A preferred division method is as follows, but not limited to this:
3-c-a)确定归一化偏航误差固有偏差分析数据集
 的区间划分个数M′;在本实施例中,M′取20;
3-ca) Determine the normalized yaw error inherent deviation analysis data set The number of intervals is divided by M ′; in this embodiment, M ′ takes 20;
的区间划分个数M′;在本实施例中,M′取20;
3-ca) Determine the normalized yaw error inherent deviation analysis data set The number of intervals is divided by M ′; in this embodiment, M ′ takes 20;
3-c-b)以
 为划分间隔,将数据集
 分别按照风速和功率进行均匀划分,得到各风速区间和各功率区间下的归一化偏航误差固有偏差分析数据集
 和
和
 在本实施例中,风速&功率划分相关结果如图5中虚线及点虚线所示。
3-cb) to To divide the interval, the data set According to the wind speed and power, it is divided evenly, and the normalized yaw error inherent deviation analysis data set under each wind speed section and each power section is obtained. with In this embodiment, the results of the division of wind speed & power are shown in broken lines and dotted lines in FIG. 5.
在本实施例中,风速&功率划分相关结果如图5中虚线及点虚线所示。
3-cb) to To divide the interval, the data set According to the wind speed and power, it is divided evenly, and the normalized yaw error inherent deviation analysis data set under each wind speed section and each power section is obtained. with In this embodiment, the results of the division of wind speed & power are shown in broken lines and dotted lines in FIG. 5.
3-d)利用均值距离判别(AVDC)离群点检测算法分别对步骤3-c)中的2M′个区间
 进行疑似离群点检测,并分别记第j个区间的疑似离群点个数为
 归一化偏航误差固有偏差分析数据集中的疑似离群点集为
 其中seg={ws,ap},j=1,2,3,…,M′,n=1,2,3,…,M′
k,seg,j;利用均值距离判别(AVDC)离群点检测算法进行
其中seg={ws,ap},j=1,2,3,…,M′,n=1,2,3,…,M′
k,seg,j;利用均值距离判别(AVDC)离群点检测算法进行
 中各区间内疑似离群点检测,算法详细流程如下:
3-d) Use the mean distance discrimination (AVDC) outlier detection algorithm to detect the 2M ′ intervals in step 3-c) respectively Perform suspected outlier detection and record the number of suspected outliers in the jth interval as The set of suspected outliers in the normalized yaw error inherent deviation analysis data set is Where seg = {ws, ap}, j = 1, 2, 3, ..., M ', n = 1, 2, 3, ..., M' k, seg, j ; use of mean distance discrimination (AVDC) outliers Detection algorithm In the detection of suspected outliers in each interval in the middle, the detailed process of the algorithm is as follows:
中各区间内疑似离群点检测,算法详细流程如下:
3-d) Use the mean distance discrimination (AVDC) outlier detection algorithm to detect the 2M ′ intervals in step 3-c) respectively Perform suspected outlier detection and record the number of suspected outliers in the jth interval as The set of suspected outliers in the normalized yaw error inherent deviation analysis data set is Where seg = {ws, ap}, j = 1, 2, 3, ..., M ', n = 1, 2, 3, ..., M' k, seg, j ; use of mean distance discrimination (AVDC) outliers Detection algorithm In the detection of suspected outliers in each interval in the middle, the detailed process of the algorithm is as follows:
3-d-a)设定初始离群点检测区间j=1;3-d-a) Set the initial outlier detection interval j = 1;
3-d-b)若第j个区间对应归一化偏航误差固有偏差分析数据集
 中的数据个数M′
k,seg,j小于给定最小阈值δ
M′,则认为第j个区间的疑似离群点个数
中的数据个数M′
k,seg,j小于给定最小阈值δ
M′,则认为第j个区间的疑似离群点个数
 为0、归一化偏航误差固有偏差分析数据集中的疑似离群点集
 为
为
 并跳至步骤3-d-g)继续执行;反之则继续执行步骤3-d-c);
3-db) If the j-th interval corresponds to the normalized yaw error inherent deviation analysis data set The number of data in M ′ k, seg, j is less than the given minimum threshold δ M ′ , then the number of suspected outliers in the j-th interval is considered 0, normalized yaw error inherent deviation analysis data set of suspected outliers for And skip to step 3-dg) to continue execution; otherwise, continue to step 3-dc);
并跳至步骤3-d-g)继续执行;反之则继续执行步骤3-d-c);
3-db) If the j-th interval corresponds to the normalized yaw error inherent deviation analysis data set The number of data in M ′ k, seg, j is less than the given minimum threshold δ M ′ , then the number of suspected outliers in the j-th interval is considered 0, normalized yaw error inherent deviation analysis data set of suspected outliers for And skip to step 3-dg) to continue execution; otherwise, continue to step 3-dc);
3-d-c)设定疑似离群点在第j个区间归一化偏航误差固有偏差分析数据集
 中的 占比
中的 占比
 并计算第j个区间中疑似离群点个数
 计算公式定义为
3-dc) Set the normalized yaw error inherent deviation analysis data set for the suspected outlier in the j-th interval % Of And calculate the number of suspected outliers in the jth interval The calculation formula is defined as
计算公式定义为
3-dc) Set the normalized yaw error inherent deviation analysis data set for the suspected outlier in the j-th interval % Of And calculate the number of suspected outliers in the jth interval The calculation formula is defined as
其中
 函数为向上取整函数;
among them The function is an upward rounding function;
函数为向上取整函数;
among them The function is an upward rounding function;
3-d-d)计算第j个风速区间归一化偏航误差固有偏差分析数据集
 中各数据点
中各数据点
 的风速判别距离
 计算公式如下
3-dd) Calculate the normalized yaw error inherent deviation analysis data set of the jth wind speed interval Data points Discriminating distance Calculated as follows
计算公式如下
3-dd) Calculate the normalized yaw error inherent deviation analysis data set of the jth wind speed interval Data points Discriminating distance Calculated as follows
其中
 为第j个风速区间内归一化偏航误差固有偏差分析数据集的功率平均值;
among them The average power of the analysis data set for the normalized yaw error inherent deviation in the jth wind speed interval;
为第j个风速区间内归一化偏航误差固有偏差分析数据集的功率平均值;
among them The average power of the analysis data set for the normalized yaw error inherent deviation in the jth wind speed interval;
3-d-e)计算第j个功率区间归一化偏航误差固有偏差分析数据集
 中各数据点
中各数据点
 的风速判别距离
 计算公式如下
3-de) Calculate the normalized yaw error inherent deviation analysis data set of the jth power interval Data points Discriminating distance Calculated as follows
计算公式如下
3-de) Calculate the normalized yaw error inherent deviation analysis data set of the jth power interval Data points Discriminating distance Calculated as follows
其中
 为第j个功率区间内归一化偏航误差固有偏差分析数据集的风速平均值;
among them The wind speed average value of the normalized yaw error inherent deviation analysis data set in the jth power interval;
为第j个功率区间内归一化偏航误差固有偏差分析数据集的风速平均值;
among them The wind speed average value of the normalized yaw error inherent deviation analysis data set in the jth power interval;
3-d-f)将第j个区间的判别距离数据集
 分别由大到小进行排序,并分别选取排序后的判别距离数据集中的前
 个数据,构成第j个区间的归一化偏航误差固有偏差分析数据集中的疑似离群点集
 其中n=1,2,3,…,M′
k,ap,j;
3-df) The discriminant distance data set of the jth interval Sort from large to small, and select the sorted discriminant distance before the data set Data, which constitute the set of suspected outliers in the normalized yaw error inherent deviation analysis data set of the j-th interval Where n = 1, 2, 3, ..., M ′ k, ap, j ;
其中n=1,2,3,…,M′
k,ap,j;
3-df) The discriminant distance data set of the jth interval Sort from large to small, and select the sorted discriminant distance before the data set Data, which constitute the set of suspected outliers in the normalized yaw error inherent deviation analysis data set of the j-th interval Where n = 1, 2, 3, ..., M ′ k, ap, j ;
3-d-g)设置检测区间j=j+1,并重复进行步骤3-d-b)至步骤3-d-f),直到j>M′为止。由于篇幅限制,本实施例中有关离群点的相关分析均略去各过程参数的计算过程及结果,相关重要参数取值如下:给定最小阈值δ
M′取10,疑似离群点占比
 均取0.02。最终基于风速间隔(ws)和功率间隔(ap)的归一化偏航误差固有偏差分析数据集中的疑似离群点检测结果分别如图6、图7中的“×”符号所示,其余正常数据点以“·”符号表示。
3-dg) Set the detection interval j = j + 1, and repeat steps 3-db) to 3-df) until j> M ' Due to space limitations, the relevant analysis of outliers in this embodiment omits the calculation process and results of each process parameter. The relevant important parameters take the following values: the given minimum threshold δ M ′ takes 10, and the proportion of suspected outliers Take 0.02. The final detection results of the suspected outliers in the normalized yaw error inherent deviation analysis data set based on the wind speed interval (ws) and power interval (ap) are shown as "×" symbols in Figures 6 and 7 Data points are indicated by the "·" symbol.
均取0.02。最终基于风速间隔(ws)和功率间隔(ap)的归一化偏航误差固有偏差分析数据集中的疑似离群点检测结果分别如图6、图7中的“×”符号所示,其余正常数据点以“·”符号表示。
3-dg) Set the detection interval j = j + 1, and repeat steps 3-db) to 3-df) until j> M ' Due to space limitations, the relevant analysis of outliers in this embodiment omits the calculation process and results of each process parameter. The relevant important parameters take the following values: the given minimum threshold δ M ′ takes 10, and the proportion of suspected outliers Take 0.02. The final detection results of the suspected outliers in the normalized yaw error inherent deviation analysis data set based on the wind speed interval (ws) and power interval (ap) are shown as "×" symbols in Figures 6 and 7 Data points are indicated by the "·" symbol.
3-e)分别利用局部异常因子(LOF)以及考虑噪声的基于密度的聚类(DBSCAN)这两种离群点检测算法对步骤3-c)中的2M′个区间
 进行判别离群点检测,并分别记第j个区间的判别离群点个数为
 归一化偏航误差固有偏差分析数据集中的判别离群点集为
 其中seg={ws,ap},j=1,2,3,…,M′,n=1,2,3,…,M′
k,seg,j,method={LOF,DBSCAN};本实施例中,有关LOF判别离群点检测的相关重要参数取值如下:给定最小阈值δ
M′取10,LOF判别离群点占比
其中seg={ws,ap},j=1,2,3,…,M′,n=1,2,3,…,M′
k,seg,j,method={LOF,DBSCAN};本实施例中,有关LOF判别离群点检测的相关重要参数取值如下:给定最小阈值δ
M′取10,LOF判别离群点占比
 均取0.02,k距离计算中的邻域参数k取10;有关DBSCAN判别离群点检测的相关重要参数取值如下:给定最小阈值δ
M′取10,ε邻域判别半径eps取0.02,核心点判别参数MinPts取10。最终基于风速间隔(ws)和功率间隔(ap)的归一化偏航误差固有偏差分析数据集中的LOF及DBSCAN判别离群点检测结果分别如图8、图9、图10和图11中的“×”符号所示,其余正常数据点均以“·”符号表示。
3-e) Two outlier detection algorithms using local anomaly factor (LOF) and density-based clustering (DBSCAN) considering noise are used for the 2M ′ intervals in step 3-c) Perform discriminant outlier detection and record the number of discriminant outliers in the jth interval as The discriminant outlier set in the normalized yaw error inherent deviation analysis data set is Where seg = {ws, ap}, j = 1, 2, 3, ..., M ', n = 1, 2, 3, ..., M' k, seg, j , method = {LOF, DBSCAN}; this implementation In the example, the relevant important parameters related to the detection of LOF discrimination outliers are as follows: given a
均取0.02,k距离计算中的邻域参数k取10;有关DBSCAN判别离群点检测的相关重要参数取值如下:给定最小阈值δ
M′取10,ε邻域判别半径eps取0.02,核心点判别参数MinPts取10。最终基于风速间隔(ws)和功率间隔(ap)的归一化偏航误差固有偏差分析数据集中的LOF及DBSCAN判别离群点检测结果分别如图8、图9、图10和图11中的“×”符号所示,其余正常数据点均以“·”符号表示。
3-e) Two outlier detection algorithms using local anomaly factor (LOF) and density-based clustering (DBSCAN) considering noise are used for the 2M ′ intervals in step 3-c) Perform discriminant outlier detection and record the number of discriminant outliers in the jth interval as The discriminant outlier set in the normalized yaw error inherent deviation analysis data set is Where seg = {ws, ap}, j = 1, 2, 3, ..., M ', n = 1, 2, 3, ..., M' k, seg, j , method = {LOF, DBSCAN}; this implementation In the example, the relevant important parameters related to the detection of LOF discrimination outliers are as follows: given a minimum threshold δ M ′ of 10, the proportion of LOF discrimination outliers Both take 0.02, and the neighborhood parameter k in the calculation of k distance takes 10; the relevant important parameters related to DBSCAN discrimination outlier detection are as follows: the given minimum threshold δ M ′ takes 10, and the epsilon neighborhood discrimination radius eps takes 0.02, The core point discrimination parameter MinPts takes 10. The final LOF and DBSCAN discrimination outlier detection results in the normalized yaw error inherent deviation analysis data set based on wind speed interval (ws) and power interval (ap) are shown in Figures 8, 9, 9, 10, and 11 respectively. The “×” symbol indicates that the remaining normal data points are indicated by the “·” symbol.
3-f)基于真实离群点判别准则,从步骤3-d)的归一化偏航误差固有偏差分析数据集中的疑似离群点集
 和步骤3-e)的归一化偏航误差固有偏差分析数据集中的判别离群点集
 中获取真实离群点集
 其中seg={ws,ap},j=1,2,3,…,M′,method={LOF,DBSCAN};
3-f) Based on the true outlier discrimination criteria, analyze the set of suspected outliers in the data set from the normalized yaw error inherent deviation of step 3-d) And step 3-e) the normalized yaw error inherent deviation analysis data set to discriminate outliers Get the set of true outliers in Where seg = {ws, ap}, j = 1, 2, 3, ..., M ', method = {LOF, DBSCAN};
其中seg={ws,ap},j=1,2,3,…,M′,method={LOF,DBSCAN};
3-f) Based on the true outlier discrimination criteria, analyze the set of suspected outliers in the data set from the normalized yaw error inherent deviation of step 3-d) And step 3-e) the normalized yaw error inherent deviation analysis data set to discriminate outliers Get the set of true outliers in Where seg = {ws, ap}, j = 1, 2, 3, ..., M ', method = {LOF, DBSCAN};
所述真实离群点判别准则定义为:对于第j个区间的偏航误差固有偏差分析数据集
 中的任一数据点Q,若其属于疑似离群点集
 并且属于LOF判别离群点集
 或DBSCAN判别离群点集
 之一,则点Q为第j个区间的真实离群点;针对本实施例,基于真实离群点判断准则判断出的风速间隔(ws)和功率间隔(ap)下归一化偏航误差固有偏差分析数据集真实离群点检测结果分别如图12和图13中的“×”符号所示,其余正常数据点均以“·”符号表示。
The criterion for determining true outliers is defined as: the data set for inherent deviation analysis of the yaw error of the j-th interval Any data point Q in, if it belongs to a set of suspected outliers And belong to the set of LOF discriminating outliers Or DBSCAN to distinguish outlier sets One, then point Q is the true outlier in the jth interval; for this embodiment, the normalized yaw error under the wind speed interval (ws) and power interval (ap) determined based on the true outlier judgment criteria The detection results of the true outliers in the inherent deviation analysis data set are shown as “×” symbols in FIG. 12 and FIG. 13, respectively, and the remaining normal data points are indicated by “•” symbols.
之一,则点Q为第j个区间的真实离群点;针对本实施例,基于真实离群点判断准则判断出的风速间隔(ws)和功率间隔(ap)下归一化偏航误差固有偏差分析数据集真实离群点检测结果分别如图12和图13中的“×”符号所示,其余正常数据点均以“·”符号表示。
The criterion for determining true outliers is defined as: the data set for inherent deviation analysis of the yaw error of the j-th interval Any data point Q in, if it belongs to a set of suspected outliers And belong to the set of LOF discriminating outliers Or DBSCAN to distinguish outlier sets One, then point Q is the true outlier in the jth interval; for this embodiment, the normalized yaw error under the wind speed interval (ws) and power interval (ap) determined based on the true outlier judgment criteria The detection results of the true outliers in the inherent deviation analysis data set are shown as “×” symbols in FIG. 12 and FIG. 13, respectively, and the remaining normal data points are indicated by “•” symbols.
3-g)基于步骤3-f)中得到的各风速区间真实离群点集
 以及各功率区间真实离群点集
 利用最终离群点判断准则获得偏航误差固有偏差分析数据集
 的最终离群点判别结果集{Outlier
k}并加以剔除,记剔除离群点后的偏航误差固有偏差分析标准数据集为
的最终离群点判别结果集{Outlier
k}并加以剔除,记剔除离群点后的偏航误差固有偏差分析标准数据集为
 3-g) Based on the set of true outliers in each wind speed interval obtained in step 3-f) And the set of true outliers in each power interval Using the final outlier judgment criterion to obtain the yaw error inherent deviation analysis data set The final outlier discrimination result set {Outlier k } is removed, and the standard data set for analyzing the inherent deviation of yaw error after excluding outliers is
所述最终离群点判断准则定义为:对于偏航误差固有偏差分析数据集
 中的任一数据点Q′,若其在归一化偏航误差固有偏差分析数据集
 中对应的数据点Q是某风速区间的真实离群点或某功率区间的真实离群点,则点Q′为偏航误差固有偏差分析数据集
 的最终离群点。针对本实施例,基于最终离群点判断准则判断出归一化偏航误差固有偏差分析数据集真实离群点检测结果,即{Outlier
k}数据集结果如图14中的“×”符号所示,最终的正常数据点均以“·”符号表示。
The final outlier judgment criterion is defined as: analysis data set for inherent deviation of yaw error Any data point in Q ′, if it is in the normalized yaw error inherent deviation analysis data set The corresponding data point Q in is a real outlier in a wind speed interval or a real outlier in a power interval, then point Q ′ is the yaw error inherent deviation analysis data set The final outlier. For this embodiment, the true outlier detection result of the normalized yaw error inherent deviation analysis data set is judged based on the final outlier judgment criterion, that is, the result of the {Outlier k } data set is shown by the “×” symbol in FIG. 14 It shows that the final normal data points are all indicated by the "·" symbol.
的最终离群点。针对本实施例,基于最终离群点判断准则判断出归一化偏航误差固有偏差分析数据集真实离群点检测结果,即{Outlier
k}数据集结果如图14中的“×”符号所示,最终的正常数据点均以“·”符号表示。
The final outlier judgment criterion is defined as: analysis data set for inherent deviation of yaw error Any data point in Q ′, if it is in the normalized yaw error inherent deviation analysis data set The corresponding data point Q in is a real outlier in a wind speed interval or a real outlier in a power interval, then point Q ′ is the yaw error inherent deviation analysis data set The final outlier. For this embodiment, the true outlier detection result of the normalized yaw error inherent deviation analysis data set is judged based on the final outlier judgment criterion, that is, the result of the {Outlier k } data set is shown by the “×” symbol in FIG. 14 It shows that the final normal data points are all indicated by the "·" symbol.
3-h)确定步骤3-g)中获取到的偏航误差固有偏差分析标准数据集
 中的风速对应的最大值v
max,并以固定风速间隔Δv为风速区间划分间隔,将第k个偏航误差区间下偏航误差固有偏差分析标准数据集
中的风速对应的最大值v
max,并以固定风速间隔Δv为风速区间划分间隔,将第k个偏航误差区间下偏航误差固有偏差分析标准数据集
 进一步基于风速信息进行划分,则第q个风速区间下的偏航误差固有偏差分析标准数据集
 定义为
3-h) Determine the standard data set for the analysis of the inherent deviation of the yaw error obtained in step 3-g) The maximum value v max corresponding to the wind speed in, and divide the interval with the fixed wind speed interval Δv as the wind speed interval, and analyze the standard data set of the inherent deviation of the yaw error under the kth yaw error interval Based on the further division of wind speed information, the standard data set for inherent deviation analysis of yaw error in the qth wind speed interval defined as
定义为
3-h) Determine the standard data set for the analysis of the inherent deviation of the yaw error obtained in step 3-g) The maximum value v max corresponding to the wind speed in, and divide the interval with the fixed wind speed interval Δv as the wind speed interval, and analyze the standard data set of the inherent deviation of the yaw error under the kth yaw error interval Based on the further division of wind speed information, the standard data set for inherent deviation analysis of yaw error in the qth wind speed interval defined as
q=1,2,3,…,Mk m=1,2,3,…,M
k,q
q = 1, 2, 3, ..., Mk m = 1, 2, 3, ..., M k, q
其中M
k,q为第q个风速区间下的偏航误差固有偏差分析标准数据集
 中的数据个数;M
k为第k个偏航误差区间下偏航误差固有偏差分析标准数据集
中的数据个数;M
k为第k个偏航误差区间下偏航误差固有偏差分析标准数据集
 的风速区间划分个数,计算公式如下
Where M k, q is the standard data set for inherent deviation analysis of yaw error at the qth wind speed interval The number of data in; M k is the standard data set for the analysis of the inherent deviation of yaw error in the k-th yaw error interval The number of the wind speed interval is divided, the calculation formula is as follows
的风速区间划分个数,计算公式如下
Where M k, q is the standard data set for inherent deviation analysis of yaw error at the qth wind speed interval The number of data in; M k is the standard data set for the analysis of the inherent deviation of yaw error in the k-th yaw error interval The number of the wind speed interval is divided, the calculation formula is as follows

其中
 函数为向上取整函数;
among them The function is an upward rounding function;
函数为向上取整函数;
among them The function is an upward rounding function;
3-i)计算每个风速区间下的偏航误差固有偏差分析数据集
 中的平均风速
 以及平均功率
 并将所有平均风速和平均功率分别进行最大值-最小值归一化处理,得到归一化后的平均风速
 和平均功率
和平均功率
 3-i) Calculate the yaw error inherent deviation analysis data set for each wind speed interval Average wind speed in And average power And normalize the maximum and minimum values of all average wind speeds and average powers to obtain the normalized average wind speed And average power
3-j)基于平均风速
 以及平均功率
 确定每个风速区间下的功率曲线拟合中心点
 确定方式如下:若第j个风速区间下的偏航误差固有偏差分析标准数据集
 中的数据个数M
k,q=0,则认为该区间内无功率曲线拟合中心点;反之则认为该区间内的功率曲线拟合中心点
中的数据个数M
k,q=0,则认为该区间内无功率曲线拟合中心点;反之则认为该区间内的功率曲线拟合中心点
 3-j) Based on average wind speed And average power Determine the center point of the power curve fit in each wind speed interval The determination method is as follows: if the yaw error inherent deviation analysis standard data set under the jth wind speed interval The number of data in M k, q = 0, it is considered that there is no power curve fitting center point in this interval; otherwise, it is considered that the power curve fitting center point in this interval
3-k)补充定义中心点
 并记第k个偏航误差区间下的功率曲线拟合中心点个数为M′
k,计算每个功率曲线拟合中心点
并记第k个偏航误差区间下的功率曲线拟合中心点个数为M′
k,计算每个功率曲线拟合中心点
 对应的参数值
 公式为
3-k) Supplemental definition of center point And remember that the number of power curve fitting center points under the kth yaw error interval is M ′ k , calculate the center point of each power curve fitting Corresponding parameter value The formula is
公式为
3-k) Supplemental definition of center point And remember that the number of power curve fitting center points under the kth yaw error interval is M ′ k , calculate the center point of each power curve fitting Corresponding parameter value The formula is

其中
 为两个相邻的功率曲线拟合中心点
 与
与
 对应坐标归一化后的弦长,即
among them Fit the center point of two adjacent power curves versus The chord length normalized to the corresponding coordinates, ie
对应坐标归一化后的弦长,即
among them Fit the center point of two adjacent power curves versus The chord length normalized to the corresponding coordinates, ie
d
k为所有功率曲线拟合中心点对应坐标归一化后的总弦长,即
 d k is the total chord length normalized by the coordinates corresponding to the center points of all power curve fittings, ie
3-1)采用最小二乘B样条拟合算法对第k个偏航误差区间下的功率曲线进行拟合,其拟合函数B
k(t)定义如下:
3-1) The least square B spline fitting algorithm is used to fit the power curve under the k-th yaw error interval, and the fitting function B k (t) is defined as follows:
其中N
r,p(t)为阶数为p的第r段B样条拟合函数的标准函数,t为最小二乘B样条拟合函数的自变量,
 为该最小二乘B样条拟合函数的第r个控制点;
 为分段节点,s=0,1,2,…,p-1,p,p+1,…,M′
k-1,M′
k,M′
k+1,…,M′
k+p,其计算公式如下:
Where N r, p (t) is the standard function of the r-th B-spline fitting function of order p, and t is the independent variable of the least-square B-spline fitting function, The rth control point of the least square B-spline fitting function; For a segmented node, s = 0, 1, 2, ..., p-1, p, p + 1, ..., M ′ k -1, M ′ k , M ′ k +1, ..., M ′ k + p , The calculation formula is as follows:
为分段节点,s=0,1,2,…,p-1,p,p+1,…,M′
k-1,M′
k,M′
k+1,…,M′
k+p,其计算公式如下:
Where N r, p (t) is the standard function of the r-th B-spline fitting function of order p, and t is the independent variable of the least-square B-spline fitting function, The rth control point of the least square B-spline fitting function; For a segmented node, s = 0, 1, 2, ..., p-1, p, p + 1, ..., M ′ k -1, M ′ k , M ′ k +1, ..., M ′ k + p , The calculation formula is as follows:

3-m)基于如下最小二乘优化函数确定B样条拟合函数B
k(t)中的所有控制点
 3-m) Determine all control points in the B-spline fitting function B k (t) based on the following least squares optimization function

3-n)将求解得到的最小二乘B样条拟合函数B
k(t)转换为自变量为风速v的多项式形式,作为第k个偏航误差区间下的真实功率曲线结果{PC
k};
3-n) Convert the obtained least squares B-spline fitting function B k (t) into a polynomial form whose independent variable is wind speed v as the true power curve result under the k-th yaw error interval {PC k };
3-o)设置待分析区间k=k+1,并重复进行步骤3-b)至步骤4-n),直到j>M为止。由于篇幅限制,本实施例中有关功率曲线的拟合均略去各过程参数的计算过程及次要结果,相关重要参数取值如下:风速对应最大值为v
max=28.9760m/s,固定风速间隔Δv=2m/s,第14个偏航误差区间为[-1°,0°]的功率曲线相关数据中风速区间划分个数为15,对应真实功率曲线拟合中心点及拟合结果如图15中“■”符号及曲线所示。
3-o) Set the interval k = k + 1 to be analyzed, and repeat steps 3-b) to 4-n) until j> M. Due to space limitation, the fitting of the power curve in this embodiment omits the calculation process and secondary results of each process parameter. The relevant important parameters take the following values: the maximum value of the wind speed is v max = 28.9760m / s, the fixed wind speed The interval Δv = 2m / s, the 14th yaw error interval is [-1 °, 0 °] in the power curve related data, the number of wind speed intervals is divided into 15, corresponding to the true power curve fitting center point and fitting results such as The "■" symbol and curve in Figure 15 are shown.
4)分别计算步骤3)中M个偏航误差区间下的真实功率曲线{PC
k}各自的量化性能指标PI
k,其中k=1,2,3,…,M;量化性能指标PIk的一种优选定义如下,但不限于此:
4) Calculate the respective quantitative performance indicators PI k of the true power curve {PC k } under M yaw error intervals in step 3) respectively, where k = 1, 2, 3, ..., M; one of the quantitative performance indicators PIk The preferred definitions are as follows, but not limited to this:
其中N
h为1年时间转化为小时的数值;CAP为待分析风电机组的额定功率;
 为第k个偏航误差区间下、第j个风速区间中的风速中值,即
 且
且
 为第k个偏航误差区间的真实功率曲线{PC
k}上
为第k个偏航误差区间的真实功率曲线{PC
k}上
 对应的功率值,且
 F(·)函数为Rayleigh分布的累计概率分布函数,具体公式如下
Where N h is the value converted from 1 year to hours; CAP is the rated power of the wind turbine to be analyzed; Is the median wind speed in the k-th yaw error interval and in the j-th wind speed interval, ie And Is the true power curve {PC k } of the k-th yaw error interval The corresponding power value, and The F (·) function is the cumulative probability distribution function of Rayleigh distribution, the specific formula is as follows
F(·)函数为Rayleigh分布的累计概率分布函数,具体公式如下
Where N h is the value converted from 1 year to hours; CAP is the rated power of the wind turbine to be analyzed; Is the median wind speed in the k-th yaw error interval and in the j-th wind speed interval, ie And Is the true power curve {PC k } of the k-th yaw error interval The corresponding power value, and The F (·) function is the cumulative probability distribution function of Rayleigh distribution, the specific formula is as follows
其中v
ave为待分析风电机组的年平均风速。在本实施例中,相关重要参数取值如下:N
h按照1年365天计算取8760;CAP为该型号风电机组的额定功率值,取1550kW;v
ave取仿真风文件的平均风速7m/s,对应20个偏航误差区间下的真实功率曲线各自量化性能指标PI
k计算结果如图16所示。
Where v ave is the average annual wind speed of the wind turbine to be analyzed. In this embodiment, the values of relevant important parameters are as follows: N h is calculated as 8760 according to 365 days in a year; CAP is the rated power value of this type of wind turbine, which is 1550kW; v ave is the average wind speed of the simulated wind file 7m / s , Corresponding to the calculation results of the quantized performance index PI k of the true power curve under 20 yaw error intervals, as shown in FIG. 16.
5)通过偏航误差固有偏差辨识准则确定该风电机组的偏航误差固有偏差值θ
im的辨识结果,并将该偏差值θ
im直接以增量形式补偿到偏航误差实际测量值θ上,得到最终补偿后的偏航误差真实值θ′,即θ′=θ+θ
im;
5) Determine the identification result of the yaw error inherent deviation value θ im of the wind turbine by the yaw error inherent deviation identification criterion, and directly compensate the deviation value θ im to the actual yaw error measurement value θ in incremental form, The true value of yaw error θ ′ after the final compensation is obtained, that is, θ ′ = θ + θ im ;
所述偏航误差固有偏差辨识准则定义如下:将步骤4)中所有M个偏航误差区间下真实功率曲线{PC
k}的量化性能指标PI
k由大到小进行排列,并确定最大量化性能指标PI
max对应的区间下标k′,则偏航误差固有偏差值θ
im的辨识结果计算公式如下
The identification criterion of yaw error inherent deviation is defined as follows: the quantitative performance index PI k of the true power curve {PC k } under all M yaw error intervals in step 4) is arranged from large to small, and the maximum quantization performance is determined The index of the interval corresponding to the index PI max is k ′, then the calculation formula of the identification result of the inherent deviation value of yaw error θ im is as follows
其中θ
lb和θ
ub分别为待分析偏航误差范围的下界和上界。在本实施例中,图16中真实功率曲线的量化性能指标PIk的最大值PI
max使用“★”符号标注出,可以看出最大值对应的区间序 号为9号,即偏航误差区间为[-6°,-5°],则可以根据偏航误差固有偏差值θ
im的辨识结果计算公式计算出偏航误差固有偏差值的辨识结果为-5.5°;进一步基于偏航误差固有偏差补偿策略,通过将偏航误差测量值θ人为加5.5°变为修正后的θ′,即θ′=θ+5.5°;将修正后的结果作为偏航控制输入重新对该风电机组在同一风文件下进行补偿后的数据仿真,经过同样的分析流程可以得到如图17所示的真实功率曲线各自量化性能指标PI
k计算结果,相关重要参数如下:偏航误差的频率分布直方图的10%和90%分位数分别为-9.681°和10.498°,即偏航误差下界θ
lb和上界θ
ub分别为-10°和10°;区间划分个数M取20;风速对应最大值为v
max=28.9760m/s,固定风速间隔Δv=2m/s,其他关键参数与补偿前的参数相同。从图17中可以看出,经过偏航误差固有偏差的辨识及补偿之后,最大值对应的区间序号为10号,即补偿后偏航误差固有偏差的辨识区间为[0°,1°],由此可见固有偏差的补偿提升了在固有偏差存在下的偏航控制的效果,从功率曲线量化指标结果值上同样也可以看出,相同偏航位置下的功率曲线量化指标结果也有20~30h不等的显著提升,相比与辨识补偿前的性能提升约0.8%~1.2%。
Where θ lb and θ ub are the lower and upper bounds of the yaw error range to be analyzed, respectively. In this embodiment, the maximum value PI max of the quantized performance index PIk of the real power curve in FIG. 16 is marked with a “★” symbol, and it can be seen that the interval number corresponding to the maximum value is 9, that is, the yaw error interval is [ -6 °, -5 °], then the identification result of the inherent deviation value of yaw error can be calculated according to the calculation formula of the identification result of the inherent deviation value of yaw error θ im as -5.5 °; , By artificially adding the measured value of yaw error θ to 5.5 ° to the corrected θ ′, ie θ ′ = θ + 5.5 °; using the corrected result as the yaw control input to re-connect the wind turbine to the same wind file After the data simulation after compensation, through the same analysis process, the calculation results of the respective quantitative performance indicators PI k of the real power curve shown in FIG. 17 can be obtained. The relevant important parameters are as follows: 10% and 90 of the histogram of the frequency distribution of yaw error The% quantiles are -9.681 ° and 10.498 ° respectively, that is, the lower bound of yaw error θ lb and the upper bound θ ub are -10 ° and 10 °, respectively; the number of interval division M is 20; the maximum value of wind speed is v max = 28.9760m / s, fixed wind speed interval Δv = 2m / s, other key parameters are the same as those before compensation. As can be seen from Figure 17, after the identification and compensation of the inherent deviation of yaw error, the interval number corresponding to the maximum value is 10, that is, the identification interval of the inherent deviation of yaw error after compensation is [0 °, 1 °], It can be seen that the compensation of the inherent deviation improves the effect of yaw control in the presence of the inherent deviation. It can also be seen from the result value of the power curve quantization index that the power curve quantization index result under the same yaw position also has 20 ~ 30h Significant improvements ranging from 0.8% to 1.2% compared to performance before identification compensation.
至此,基于真实功率曲线的风电机组偏航误差固有偏差辨识及补偿方法的有效性与实用性在GH Bladed 3.82仿真软件的仿真数据集上成功验证。So far, the validity and practicability of the identification and compensation method of the inherent deviation of the yaw error of the wind turbine based on the real power curve have been successfully verified on the simulation data set of the GH Bladed 3.82 simulation software.
本发明基于真实功率曲线的风电机组偏航误差固有偏差辨识及补偿方法,主要包括基于偏航误差区间划分、风电机组功率曲线数据离群点检测、风电机组真实功率曲线拟合、功率曲线量化指标计算以及偏航误差固有偏差的辨识与补偿等环节组成。图1为基于真实功率曲线的风电机组偏航误差固有偏差辨识及补偿方法实时与应用的具体流程。整个实施例按照图1中所示的流程,基于风电机组SCADA数据进行分析,通过对不同偏航误差区间下风电机组的真实功率曲线进行拟合并最终基于偏航误差固有偏差的辨识准则与补偿策略来实现风电机组的性能提升需求。图2-图17为使用本发明基于真实功率曲线的风电机组偏航误差固有偏差辨识及补偿方法进行风电机组偏航误差固有偏差的辨识与补偿流程中各个环节的结果,对具有风电机组的性能提升需求的企业有着很强的应用价值及意义。The method for identifying and compensating the inherent deviation of the yaw error of the wind turbine based on the real power curve mainly includes the division of the yaw error interval, the detection of the outliers of the power curve data of the wind turbine, the fitting of the true power curve of the wind turbine, and the quantitative index of the power curve It is composed of calculation and identification and compensation of inherent deviation of yaw error. Figure 1 is the specific flow of real-time and application of the identification and compensation method of the inherent deviation of the yaw error of the wind turbine based on the real power curve. The entire embodiment is analyzed based on the SCADA data of the wind turbine according to the process shown in FIG. 1, by fitting the true power curve of the wind turbine under different yaw error intervals and finally based on the identification criteria and compensation of the inherent deviation of the yaw error Strategies to meet the performance improvement needs of wind turbines. Figures 2 to 17 are the results of various links in the process of identifying and compensating the inherent deviation of the yaw error of the wind turbine using the method based on the real power curve of the present invention for identifying and compensating the inherent deviation of the yaw error of the wind turbine. Enterprises that increase demand have strong application value and significance.
Claims (6)
- 一种基于真实功率曲线的风电机组偏航误差固有偏差辨识及补偿方法,其特征在于,包括以下步骤:A method for identifying and compensating the inherent deviation of the yaw error of a wind turbine based on a true power curve, characterized in that it includes the following steps:1)根据待分析风电机组偏航误差固有偏差辨识及补偿需求,读取相应需求周期内总计N条待分析风电机组的SCADA系统中测量得到的风电机组运行数据信息,该信息包含风速{v i}、有功功率{P i}以及偏航误差{θ i},将信息数据集记为风电机组偏航误差固有偏差分析数据集{X i},其中i=1,2,3,…,N; 1) According to be analyzed wind turbine yaw error inherent bias identification and compensation needs to read the wind turbine operating data within the corresponding demand cycles total SCADA system the N analysis wind turbine to be measured obtained, the information containing Winds {v i }, Active power {P i } and yaw error {θ i }, record the information data set as the wind turbine yaw error inherent deviation analysis data set {X i }, where i = 1, 2, 3, ..., N ;2)将步骤1)中的风电机组偏航误差固有偏差分析数据集{X i}以一定的偏航误差间隔划分为M个区间,记第k个偏航误差划分区间中的数据个数为N k、偏航误差固有偏差分析数据集为其中k=1,2,3,…,M,l=1,2,3,…,N k; 2) Divide the yaw error inherent deviation analysis data set {X i } in step 1) into M intervals at a certain yaw error interval, and record the number of data in the kth yaw error division interval as N k , the yaw error inherent deviation analysis data set is
 Where k = 1, 2, 3, ..., M, l = 1, 2, 3, ..., N k ;3)基于步骤2)中M个区间的偏航误差固有偏差分析数据集分别拟合出M条真实功率曲线,记第k个偏航误差区间下的真实功率曲线为{PC k},其中k=1,2,3,…,M; 3) Analysis data set based on the inherent deviation of yaw error in M intervals in step 2)
 Fit the M real power curves separately, and record the real power curve under the k-th yaw error interval as {PC k }, where k = 1, 2, 3, ..., M;4)分别计算步骤3)中M个偏航误差区间下的真实功率曲线{PC k}各自的量化性能指标PI k,其中k=1,2,3,…,M; 4) Calculate the respective quantitative performance index PI k of the true power curve {PC k } under M yaw error intervals in step 3), where k = 1, 2, 3, ..., M;5)通过偏航误差固有偏差辨识准则确定该风电机组的偏航误差固有偏差值θ im的辨识结果,并将该偏差值θ im直接以增量形式补偿到偏航误差实际测量值θ上,得到最终补偿后的偏航误差真实值θ′,即θ′=θ+θ im; 5) Determine the identification result of the yaw error inherent deviation value θ im of the wind turbine by the yaw error inherent deviation identification criterion, and directly compensate the deviation value θ im to the actual yaw error measurement value θ in incremental form, The true value of yaw error θ ′ after the final compensation is obtained, that is, θ ′ = θ + θ im ;所述偏航误差固有偏差辨识准则定义如下:将步骤4)中所有M个偏航误差区间下真实功率曲线{PC k}的量化性能指标PI k由大到小进行排列,并确定最大量化性能指标PI max对应的区间下标k′,则偏航误差固有偏差值θ im的辨识结果计算公式如下 The identification criterion of yaw error inherent deviation is defined as follows: the quantitative performance index PI k of the true power curve {PC k } under all M yaw error intervals in step 4) is arranged from large to small, and the maximum quantization performance is determined The index of the interval corresponding to the index PI max is k ′, then the calculation formula of the identification result of the inherent deviation value of yaw error θ im is as follows
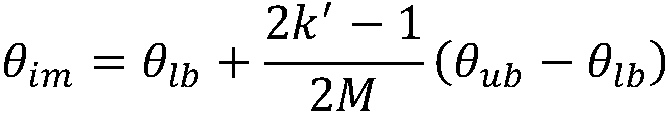 其中θ lb和θ ub分别为待分析偏航误差范围的下界和上界。 Where θ lb and θ ub are the lower and upper bounds of the yaw error range to be analyzed, respectively.
 - 根据权利要求1所述的一种基于真实功率曲线的风电机组偏航误差固有偏差辨识及补偿方法,其特征在于,所述步骤2)中,偏航误差固有偏差分析数据集{X i}区间划分方法步骤如下: The method for identifying and compensating the inherent deviation of the yaw error of the wind turbine based on the true power curve according to claim 1, characterized in that in step 2), the analysis dataset of the inherent deviation of the yaw error {X i } interval The division method steps are as follows:2-a)绘制偏航误差{θ i}的频率分布直方图,并基于频率分布直方图的分布情况设定待分析偏航误差范围的下界θ lb和上界θ ub; 2-a) Plot the frequency distribution histogram of yaw error {θ i }, and set the lower bound θ lb and the upper bound θ ub of the yaw error range to be analyzed based on the distribution of the frequency distribution histogram;2-b)设定偏航误差固有偏差分析数据集{X i}的区间划分个数M; 2-b) Set the interval division number M of the yaw error inherent deviation analysis data set {X i };2-c)以为偏航误差区间划分间隔,对偏航误差固有偏差分析数据集{X i}进行划分,并仅保留风速和功率信息作为偏航误差固有偏差分析数据集
 2-c) to
 To divide the interval for the yaw error interval, divide the yaw error inherent deviation analysis data set {X i }, and keep only the wind speed and power information as the yaw error inherent deviation analysis data set
 - 根据权利要求1所述的一种基于真实功率曲线的风电机组偏航误差固有偏差辨识及补偿方法,其特征在于,所述步骤3)中,M个偏航误差区间下风电机组真实功率曲线获取流程如下:The method for identifying and compensating the inherent deviation of the yaw error of the wind turbine based on the real power curve according to claim 1, wherein in step 3), the true power curve of the wind turbine is acquired under M yaw error intervals The process is as follows:3-a)设定真实功率曲线获取初始区间k=1;3-a) Set the real power curve to obtain the initial interval k = 1;3-b)将第k个偏航误差区间下偏航误差固有偏差分析数据集中的风速信息和功率信息分别进行最大值-最小值归一化处理,记归一化偏航误差固有偏差分析数据集为
 其中l=1,2,3,…,N k; 3-b) Analyze the data set of the inherent deviation of yaw error in the k-th yaw error interval
 The wind speed information and power information in are respectively normalized by the maximum-minimum value, and the normalized yaw error inherent deviation analysis data set isWhere l = 1, 2, 3, ..., N k ;3-c)分别按照一定的风速间隔(ws)和功率间隔(ap)将步骤3-b)中的归一化偏航误差固有偏差分析数据集划分为M′个区间,并分别记第j个区间中的数据个数为M′ k,seg,j、归一化偏航误差固有偏差分析数据集为
 其中seg={ws,ap},j=1,2,3,…,M′,n=1,2,3,…,M′ k,seg,j; 3-c) Analyze the data set of the normalized yaw error inherent deviation in step 3-b) according to a certain wind speed interval (ws) and power interval (ap) respectively
 Divide into M ′ intervals, and record the number of data in the j-th interval as M ′ k, seg, j , and the normalized yaw error inherent deviation analysis data set asWhere seg = {ws, ap}, j = 1, 2, 3, ..., M ', n = 1, 2, 3, ..., M' k, seg, j ;3-d)利用均值距离判别(AVDC)离群点检测算法分别对步骤3-c)中的2M′个区间进行疑似离群点检测,并分别记第j个区间的疑似离群点个数为
 归一化偏航误差固有偏差分析数据集中的疑似离群点集为
 其中seg={ws,ap},j=1,2,3,…,M′,n=1,2,3,…,M′ k,seg,j; 3-d) Use the mean distance discrimination (AVDC) outlier detection algorithm to detect the 2M ′ intervals in step 3-c) respectively
 Perform suspected outlier detection and record the number of suspected outliers in the jth interval asThe set of suspected outliers in the normalized yaw error inherent deviation analysis data set isWhere seg = {ws, ap}, j = 1, 2, 3, ..., M ', n = 1, 2, 3, ..., M' k, seg, j ;所述均值距离判别(AVDC)离群点检测算法具体为:对于数据个数M′ k,seg,j小于给定最小阈值δ M′的区间,认为该区间归一化偏航误差固有偏差分析数据集中的疑似离群点集为
 否则对于第j个风速区间或第j个功率区间,首先计算区间内归一化偏航误差固有偏差分析数据集
 中各风速-功率数据点
 的判别距离
的判别距离 进一步设定疑似离群点的占比
 并确定第j个区间中疑似离群点个数
 通过由大到小对判别距离
 进行排序的方式确定前
 个数据构成第j个区间的归一化偏航误差固有偏差分析数据集中的疑似离群点集
 The mean distance discrimination (AVDC) outlier detection algorithm is specifically: for the interval where the number of data M ′ k, seg, j is less than the given minimum threshold δ M ′ , it is considered that the interval is normalized to the inherent deviation analysis of yaw error Set of suspected outliers in the data set
 forOtherwise, for the jth wind speed interval or jth power interval, the normalized yaw error inherent deviation analysis data set within the interval is first calculatedVarious wind speed-power data pointsDiscriminant distanceFurther set the proportion of suspected outliersAnd determine the number of suspected outliers in the j-th intervalJudging the distance from big to smallBefore the sorting method is determinedThe data constitute the set of suspected outliers in the normalized yaw error inherent deviation analysis data set of the j-th interval所述判别距离的计算方式具体如下: Discriminant distance
 The calculation method is as follows:
 其中分别为归一化偏航误差固有偏差分析数据集第j个风速区间内的功率平均值和第j个功率区间内的风速平均值,其中n=1,2,3,…,M′ k,seg,j; among them
 Are the average power value in the jth wind speed interval and the average wind speed in the jth power interval of the normalized yaw error inherent deviation analysis data set, respectively, where n = 1, 2, 3, ..., M ′ k, seg, j ;3-e)分别利用局部异常因子(LOF)以及考虑噪声的基于密度的聚类(DBSCAN)这两种离群点检测算法对步骤3-c)中的2M′个区间进行判别离群点检测,并分别记第j个区间的判别离群点个数为
 归一化偏航误差固有偏差分析数据集中的判别离群点集为
 其中seg={ws,ap},j=1,2,3,…,M′,n=1,2,3,…,M′ k,seg,j,method={LOF,DBSCAN}; 3-e) Two outlier detection algorithms using local anomaly factor (LOF) and density-based clustering (DBSCAN) considering noise are used for the 2M ′ intervals in step 3-c)
 Perform discriminant outlier detection and record the number of discriminant outliers in the jth interval asThe discriminant outlier set in the normalized yaw error inherent deviation analysis data set isWhere seg = {ws, ap}, j = 1, 2, 3, ..., M ', n = 1, 2, 3, ..., M' k, seg, j , method = {LOF, DBSCAN};3-f)基于真实离群点判别准则,从步骤3-d)的归一化偏航误差固有偏差分析数据集中的疑似离群点集和步骤3-e)的归一化偏航误差固有偏差分析数据集中的判别离群点集
 中获取真实离群点集
 其中seg={ws,ap},j=1,2,3,…,M′,method={LOF,DBSCAN}; 3-f) Based on the true outlier discrimination criteria, analyze the set of suspected outliers in the data set from the normalized yaw error inherent deviation of step 3-d)
 And step 3-e) the normalized yaw error inherent deviation analysis data set to discriminate outliersGet the set of true outliers inWhere seg = {ws, ap}, j = 1, 2, 3, ..., M ', method = {LOF, DBSCAN};所述真实离群点判别准则定义为:对偏航误差固有偏差分析数据集中的任一数据点Q,若其属于疑似离群点集
 且属于LOF判别离群点集
 或DBSCAN判别离群点集
 之一,则点Q为第j个区间的真实离群点; The criterion for discriminating the true outliers is defined as: analyzing the data set of inherent deviation of yaw error
 Any data point Q in, if it belongs to a set of suspected outliersAnd belong to the set of LOF discriminating outliersOr DBSCAN to distinguish outlier setsOne, then point Q is the true outlier in the jth interval;3-g)基于步骤3-f)中得到的各风速区间真实离群点集以及各功率区间真实离群点集
 利用最终离群点判断准则获得偏航误差固有偏差分析数据集
 的最终离群点判别结果集{Outlier k}并加以剔除,记剔除离群点后的偏航误差固有偏差分析标准数据集为
 3-g) Based on the set of true outliers in each wind speed interval obtained in step 3-f)
 And the set of true outliers in each power intervalUsing the final outlier judgment criterion to obtain the yaw error inherent deviation analysis data setThe final outlier discrimination result set {Outlier k } is removed, and the standard data set for analyzing the inherent deviation of yaw error after excluding outliers is所述最终离群点判断准则定义为:对于偏航误差固有偏差分析数据集中的任一数据点Q′,若其在归一化偏航误差固有偏差分析数据集
 中对应的数据点Q是某风速区间或某功率区间的真实离群点,则点Q′为偏航误差固有偏差分析数据集
 的最终离群点。 The final outlier judgment criterion is defined as: analysis data set for inherent deviation of yaw error
 Any data point in Q ′, if it is in the normalized yaw error inherent deviation analysis data setThe corresponding data point Q in is a true outlier in a wind speed interval or a power interval, then point Q ′ is the yaw error inherent deviation analysis data setThe final outlier.3-h)确定步骤3-g)中获取到的偏航误差固有偏差分析标准数据集中的风速对应的最大值v max,并以固定风速间隔Δv为风速区间划分间隔,将第k个偏航误差区间下偏航误差固有偏差分析标准数据集
 进一步基于风速信息进行划分,则第q个风速区间下的偏航误差固有偏差分析标准数据集
 定义为 3-h) Determine the standard data set for the analysis of the inherent deviation of yaw error obtained in step 3-g)
 The maximum value v max corresponding to the wind speed in, and divide the interval with the fixed wind speed interval Δv as the wind speed interval, and analyze the standard data set of the inherent deviation of the yaw error under the kth yaw error intervalBased on the further division of wind speed information, the standard data set for inherent deviation analysis of yaw error in the qth wind speed intervaldefined as
 其中M k,q为第q个风速区间下的偏航误差固有偏差分析标准数据集中的数据个数;Mk为第k个偏航误差区间下偏航误差固有偏差分析标准数据集
 的风速区间划分个数,计算公式如下 Where M k, q is the standard data set for inherent deviation analysis of yaw error at the qth wind speed interval
 The number of data in; Mk is the standard data set for analyzing the inherent deviation of yaw error in the k-th yaw error intervalThe number of the wind speed interval is divided, the calculation formula is as follows
 其中函数为向上取整函数; among them
 The function is an upward rounding function;3-i)计算每个风速区间下的偏航误差固有偏差分析数据集中的平均风速
 以及 平均功率
 并将所有平均风速和平均功率分别进行最大值-最小值归一化处理,得到归一化后的平均风速
 和平均功率
和平均功率 3-i) Calculate the yaw error inherent deviation analysis data set for each wind speed interval
 Average wind speed inAnd average powerAnd normalize the maximum and minimum values of all average wind speeds and average powers to obtain the normalized average wind speedAnd average power3-j)基于平均风速以及平均功率
 确定每个风速区间下的功率曲线拟合中心点
 方式如下:若第j个风速区间下的偏航误差固有偏差分析标准数据集
 中的数据个数M k,q=0,则认为无功率曲线拟合中心点;反之则认为功率曲线拟合中心点
 3-j) Based on average wind speed
 And average powerDetermine the center point of the power curve fit in each wind speed intervalThe method is as follows: if the standard data set for inherent deviation analysis of yaw error in the jth wind speed intervalThe number of data in M k, q = 0, it is considered that no power curve fits the center point; otherwise, the power curve fits the center point3-k)补充定义中心点并记第k个偏航误差区间下的功率曲线拟合中心点个数为M′ k,计算每个功率曲线拟合中心点
 对应的参数值
 公式为 3-k) Supplemental definition of center point
 And remember that the number of power curve fitting center points under the kth yaw error interval is M ′ k , calculate the center point of each power curve fittingCorresponding parameter valueThe formula is
 其中为两个相邻的功率曲线拟合中心点
 与
与 对应坐标归一化后的弦长,即 among them
 Fit the center point of two adjacent power curvesversusThe chord length normalized to the corresponding coordinates, ie
 d k为所有功率曲线拟合中心点对应坐标归一化后的总弦长,即d k is the total chord length normalized by the coordinates corresponding to the center points of all power curve fittings, ie
 3-1)采用最小二乘B样条拟合算法对第k个偏航误差区间下的功率曲线进行拟合,其拟合函数B k(t)定义如下: 3-1) The least square B spline fitting algorithm is used to fit the power curve under the k-th yaw error interval, and the fitting function B k (t) is defined as follows:
 其中N r,p(t)为阶数为p的第r段B样条拟合函数的标准函数,t为最小二乘B样条拟合函数的自变量,为该最小二乘B样条拟合函数的第r个控制点;
 为分段节点,s=0,1,2,…,p-1,p,p+1,…,M′ k-1,M′ k,M′ k+1,…,M′ k+p,其计算公式如下: Where N r, p (t) is the standard function of the r-th B-spline fitting function of order p, and t is the independent variable of the least-square B-spline fitting function,
 The rth control point of the least square B-spline fitting function;For a segmented node, s = 0, 1, 2, ..., p-1, p, p + 1, ..., M ′ k -1, M ′ k , M ′ k +1, ..., M ′ k + p , The calculation formula is as follows:
 3-m)基于如下最小二乘优化函数确定B样条拟合函数B k(t)中的所有控制点3-m) Determine all control points in the B-spline fitting function B k (t) based on the following least squares optimization function
 3-n)将求解得到的最小二乘B样条拟合函数B k(t)转换为自变量为风速v的多项式形式,作为第k个偏航误差区间下的真实功率曲线结果{PC k}; 3-n) Convert the obtained least squares B-spline fitting function B k (t) into a polynomial form whose independent variable is wind speed v as the true power curve result under the k-th yaw error interval {PC k };3-o)设置待分析区间k=k+1,并重复进行步骤3-b)至步骤3-n),直到j>M为止。3-o) Set the interval k = k + 1 to be analyzed, and repeat steps 3-b) to 3-n) until j> M.
 - 根据权利要求3所述的一种基于真实功率曲线的风电机组偏航误差固有偏差辨识及补偿方法,其特征在于,所述步骤3-c)中,归一化偏航误差固有偏差分析数据集的划分方 法具体如下: The method for identifying and compensating the inherent deviation of yaw error of a wind turbine based on a true power curve according to claim 3, characterized in that in step 3-c), the normalized yaw error inherent deviation analysis dataset
 The division method is as follows:3-c-a)确定归一化偏航误差固有偏差分析数据集的区间划分个数M′; 3-ca) Determine the normalized yaw error inherent deviation analysis data set
 The number of intervals divided by M ′;3-c-b)以为划分间隔,将数据集
 分别按照风速和功率进行均匀划分,得到各风速区间和各功率区间下的归一化偏航误差固有偏差分析数据集
 和
和 3-cb) to
 To divide the interval, the data setAccording to the wind speed and power, it is divided evenly, and the normalized yaw error inherent deviation analysis data set under each wind speed section and each power section is obtained.with
 - 根据权利要求3所述的一种基于真实功率曲线的风电机组偏航误差固有偏差辨识及补偿方法,其特征在于,所述步骤3-d)中,利用均值距离判别(AVDC)离群点检测算法进行中各区间内疑似离群点检测,算法详细流程如下: The method for identifying and compensating the inherent deviation of yaw error of a wind turbine based on a real power curve according to claim 3, characterized in that in step 3-d), mean distance discrimination (AVDC) outlier detection Algorithmic
 In the detection of suspected outliers in each interval in the middle, the detailed process of the algorithm is as follows:3-d-a)设定初始离群点检测区间j=1;3-d-a) Set the initial outlier detection interval j = 1;3-d-b)若第j个区间对应归一化偏航误差固有偏差分析数据集中的数据个数M′ k,seg,j小于给定最小阈值δ M′,则认为第j个区间的疑似离群点个数
 为0、归一化偏航误差固有偏差分析数据集中的疑似离群点集
 为
为 并跳至步骤3-d-g)继续执行;反之则继续执行步骤3-d-c); 3-db) If the j-th interval corresponds to the normalized yaw error inherent deviation analysis data set
 The number of data in M ′ k, seg, j is less than the given minimum threshold δ M ′ , then the number of suspected outliers in the j-th interval is considered0, normalized yaw error inherent deviation analysis data set of suspected outliersforAnd skip to step 3-dg) to continue execution; otherwise, continue to step 3-dc);3-d-c)设定疑似离群点在第j个区间归一化偏航误差固有偏差分析数据集中的占比
 并计算第j个区间中疑似离群点个数
 计算公式定义为 3-dc) Set the normalized yaw error inherent deviation analysis data set for the suspected outlier in the j-th interval
 % OfAnd calculate the number of suspected outliers in the jth intervalThe calculation formula is defined as
 其中函数为向上取整函数; among them
 The function is an upward rounding function;3-d-d)计算第j个风速区间归一化偏航误差固有偏差分析数据集中各数据点
 的风速判别距离
 计算公式如下 3-dd) Calculate the normalized yaw error inherent deviation analysis data set of the jth wind speed interval
 Data pointsDiscriminating distanceCalculated as follows
 其中为第j个风速区间内归一化偏航误差固有偏差分析数据集的功率平均值; among them
 The average power of the analysis data set for the normalized yaw error inherent deviation in the jth wind speed interval;3-d-e)计算第j个功率区间归一化偏航误差固有偏差分析数据集中各数据点
 的风速判别距离
 计算公式如下 3-de) Calculate the normalized yaw error inherent deviation analysis data set of the jth power interval
 Data pointsDiscriminating distanceCalculated as follows
 其中为第j个功率区间内归一化偏航误差固有偏差分析数据集的风速平均值; among them
 The wind speed average value of the normalized yaw error inherent deviation analysis data set in the jth power interval;3-d-f)将第j个区间的判别距离数据集分别由大到小进行排序,并分别选取排序后的判别距离数据集中的前
 个数据,构成第j个区间的归一化偏航误差固有偏差分析数据集中的疑似离群点集
 其中n=1,2,3,…,M′ k,ap,j; 3-df) The discriminant distance data set of the jth interval
 Sort from large to small, and select the sorted discriminant distance before the data setData, which constitute the set of suspected outliers in the normalized yaw error inherent deviation analysis data set of the j-th intervalWhere n = 1, 2, 3, ..., M ′ k, ap, j ;3-d-g)设置检测区间j=j+1,并重复进行步骤3-d-b)至步骤3-d-f),直到j>M′为止。3-d-g) Set the detection interval j = j + 1, and repeat steps 3-d-b) to 3-d-f) until j> M ′.
 - 根据权利要求1所述的一种基于真实功率曲线的风电机组偏航误差固有偏差辨识及补偿方 法,其特征在于,所述步骤4)中,量化性能指标PI k的定义如下: The method for identifying and compensating the inherent deviation of the yaw error of a wind turbine based on a real power curve according to claim 1, wherein in step 4), the quantitative performance index PI k is defined as follows:
 其中N h为1年时间转化为小时的数值;CAP为待分析风电机组的额定功率;为第k个偏航误差区间下、第j个风速区间中的风速中值,即
 且
且 为第k个偏航误差区间的真实功率曲线{PC k}上
 对应的功率值,且
 F(·)函数为Rayleigh分布的累计概率分布函数,具体公式如下 Where N h is the value converted from 1 year to hours; CAP is the rated power of the wind turbine to be analyzed;
 Is the median wind speed in the k-th yaw error interval and in the j-th wind speed interval, ieAndIs the true power curve {PC k } of the k-th yaw error intervalThe corresponding power value, andThe F (·) function is the cumulative probability distribution function of Rayleigh distribution, the specific formula is as follows
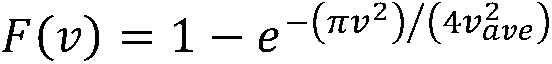 其中v ave为待分析风电机组的年平均风速。 Where v ave is the average annual wind speed of the wind turbine to be analyzed.
Priority Applications (2)
| Application Number | Priority Date | Filing Date | Title |
|---|---|---|---|
| PCT/CN2018/116072 WO2020097944A1 (en) | 2018-11-18 | 2018-11-18 | Real power curve-based method for discriminating and compensating yaw error inherent deviation of wind turbine generator set |
| US17/319,120 US11649803B2 (en) | 2018-11-18 | 2021-05-13 | Method of identification and compensation of inherent deviation of yaw error of wind turbine based on true power curve |
Applications Claiming Priority (1)
| Application Number | Priority Date | Filing Date | Title |
|---|---|---|---|
| PCT/CN2018/116072 WO2020097944A1 (en) | 2018-11-18 | 2018-11-18 | Real power curve-based method for discriminating and compensating yaw error inherent deviation of wind turbine generator set |
Related Child Applications (1)
| Application Number | Title | Priority Date | Filing Date |
|---|---|---|---|
| US17/319,120 Continuation US11649803B2 (en) | 2018-11-18 | 2021-05-13 | Method of identification and compensation of inherent deviation of yaw error of wind turbine based on true power curve |
Publications (1)
| Publication Number | Publication Date |
|---|---|
| WO2020097944A1 true WO2020097944A1 (en) | 2020-05-22 |
Family
ID=70731302
Family Applications (1)
| Application Number | Title | Priority Date | Filing Date |
|---|---|---|---|
| PCT/CN2018/116072 WO2020097944A1 (en) | 2018-11-18 | 2018-11-18 | Real power curve-based method for discriminating and compensating yaw error inherent deviation of wind turbine generator set |
Country Status (2)
| Country | Link |
|---|---|
| US (1) | US11649803B2 (en) |
| WO (1) | WO2020097944A1 (en) |
Cited By (9)
| Publication number | Priority date | Publication date | Assignee | Title |
|---|---|---|---|---|
| CN111260503A (en) * | 2020-01-13 | 2020-06-09 | 浙江大学 | Wind turbine generator power curve outlier detection method based on cluster center optimization |
| CN112267972A (en) * | 2020-10-22 | 2021-01-26 | 华能国际电力股份有限公司 | Intelligent judgment method for abnormity of power curve of wind turbine generator |
| CN112380699A (en) * | 2020-11-13 | 2021-02-19 | 龙源(北京)风电工程技术有限公司 | Wind turbine generator yaw error early warning analysis method based on multidimensional analysis |
| CN112800103A (en) * | 2020-12-09 | 2021-05-14 | 华能陕西发电有限公司 | System and method for acquiring power curve of wind turbine generator based on SCADA data mining |
| CN112879220A (en) * | 2021-03-16 | 2021-06-01 | 上海电气风电集团股份有限公司 | Fan control method and system and readable storage medium |
| CN112966395A (en) * | 2021-03-31 | 2021-06-15 | 华能国际电力股份有限公司 | Method for calculating static error of wind turbine generator yaw system |
| CN113236507A (en) * | 2021-05-28 | 2021-08-10 | 中南大学 | Yaw static error diagnosis method and system for wind turbine generator |
| CN113848347A (en) * | 2021-07-29 | 2021-12-28 | 尚特杰电力科技有限公司 | Health state detection method for wind meter of wind driven generator |
| CN115422503A (en) * | 2022-07-22 | 2022-12-02 | 中广核新能源(定远)有限公司 | Method for drawing power curve of wind generating set |
Families Citing this family (5)
| Publication number | Priority date | Publication date | Assignee | Title |
|---|---|---|---|---|
| EP3791062B1 (en) * | 2018-09-17 | 2022-03-16 | American Superconductor Corporation | Yaw auto-calibration for a wind turbine generator |
| CN113931808A (en) * | 2021-10-25 | 2022-01-14 | 中国华能集团清洁能源技术研究院有限公司 | Method and device for diagnosing yaw error of wind turbine generator |
| CN114638312B (en) * | 2022-03-24 | 2024-07-19 | 申能新能源(青海)有限公司 | Wind power unsupervised learning classification algorithm |
| CN114841021B (en) * | 2022-07-04 | 2022-10-11 | 北京航空航天大学杭州创新研究院 | Method and device for correcting digital twin model, electronic device and storage medium |
| CN117436024B (en) * | 2023-12-19 | 2024-03-08 | 湖南翰文云机电设备有限公司 | Fault diagnosis method and system based on drilling machine operation data analysis |
Citations (6)
| Publication number | Priority date | Publication date | Assignee | Title |
|---|---|---|---|---|
| CN102213182A (en) * | 2011-05-12 | 2011-10-12 | 北京金风科创风电设备有限公司 | Method for obtaining yaw error angle, yaw control method/device and wind generating set |
| US8890349B1 (en) * | 2012-01-19 | 2014-11-18 | Northern Power Systems, Inc. | Load reduction system and method for a wind power unit |
| CN105909466A (en) * | 2016-04-18 | 2016-08-31 | 华电电力科学研究院 | Yaw error analysis method for wind generating set |
| CN106014878A (en) * | 2016-06-30 | 2016-10-12 | 华北电力科学研究院有限责任公司 | Method and system for testing action errors of yaw system of wind generator unit |
| CN106150904A (en) * | 2016-07-01 | 2016-11-23 | 华北电力科学研究院有限责任公司 | A kind of wind driven generator unit yaw system control performance optimization method and system |
| CN107944175A (en) * | 2017-12-06 | 2018-04-20 | 浙江大学 | A kind of wind turbine real power curve acquisition method for considering wind turbulence intensity |
Family Cites Families (2)
| Publication number | Priority date | Publication date | Assignee | Title |
|---|---|---|---|---|
| EP2175129A1 (en) * | 2008-10-10 | 2010-04-14 | Siemens Aktiengesellschaft | Adaptive adjustment of the blade pitch angle of a wind turbine |
| EP3791062B1 (en) * | 2018-09-17 | 2022-03-16 | American Superconductor Corporation | Yaw auto-calibration for a wind turbine generator |
-
2018
- 2018-11-18 WO PCT/CN2018/116072 patent/WO2020097944A1/en active Application Filing
-
2021
- 2021-05-13 US US17/319,120 patent/US11649803B2/en active Active
Patent Citations (6)
| Publication number | Priority date | Publication date | Assignee | Title |
|---|---|---|---|---|
| CN102213182A (en) * | 2011-05-12 | 2011-10-12 | 北京金风科创风电设备有限公司 | Method for obtaining yaw error angle, yaw control method/device and wind generating set |
| US8890349B1 (en) * | 2012-01-19 | 2014-11-18 | Northern Power Systems, Inc. | Load reduction system and method for a wind power unit |
| CN105909466A (en) * | 2016-04-18 | 2016-08-31 | 华电电力科学研究院 | Yaw error analysis method for wind generating set |
| CN106014878A (en) * | 2016-06-30 | 2016-10-12 | 华北电力科学研究院有限责任公司 | Method and system for testing action errors of yaw system of wind generator unit |
| CN106150904A (en) * | 2016-07-01 | 2016-11-23 | 华北电力科学研究院有限责任公司 | A kind of wind driven generator unit yaw system control performance optimization method and system |
| CN107944175A (en) * | 2017-12-06 | 2018-04-20 | 浙江大学 | A kind of wind turbine real power curve acquisition method for considering wind turbulence intensity |
Non-Patent Citations (1)
| Title |
|---|
| ZAHNG, WEI ET AL.: "Non-official translation: Research on Yaw Correction Analysis Method for Wind Turbine", HUADAIN TECHNOLOGY, vol. 39, no. 4, 30 April 2017 (2017-04-30), pages 71 - 73, ISSN: 1674-1951 * |
Cited By (17)
| Publication number | Priority date | Publication date | Assignee | Title |
|---|---|---|---|---|
| CN111260503A (en) * | 2020-01-13 | 2020-06-09 | 浙江大学 | Wind turbine generator power curve outlier detection method based on cluster center optimization |
| CN111260503B (en) * | 2020-01-13 | 2023-10-27 | 浙江大学 | Wind turbine generator power curve outlier detection method based on cluster center optimization |
| CN112267972A (en) * | 2020-10-22 | 2021-01-26 | 华能国际电力股份有限公司 | Intelligent judgment method for abnormity of power curve of wind turbine generator |
| CN112267972B (en) * | 2020-10-22 | 2023-05-05 | 华能国际电力股份有限公司 | Intelligent judging method for abnormal power curve of wind turbine generator |
| CN112380699A (en) * | 2020-11-13 | 2021-02-19 | 龙源(北京)风电工程技术有限公司 | Wind turbine generator yaw error early warning analysis method based on multidimensional analysis |
| CN112380699B (en) * | 2020-11-13 | 2024-05-17 | 龙源(北京)风电工程技术有限公司 | Wind turbine yaw error early warning analysis method based on multidimensional analysis |
| CN112800103B (en) * | 2020-12-09 | 2023-03-03 | 华能陕西发电有限公司 | System and method for acquiring power curve of wind turbine generator based on SCADA data mining |
| CN112800103A (en) * | 2020-12-09 | 2021-05-14 | 华能陕西发电有限公司 | System and method for acquiring power curve of wind turbine generator based on SCADA data mining |
| CN112879220A (en) * | 2021-03-16 | 2021-06-01 | 上海电气风电集团股份有限公司 | Fan control method and system and readable storage medium |
| CN112879220B (en) * | 2021-03-16 | 2022-11-01 | 上海电气风电集团股份有限公司 | Fan control method and system and readable storage medium |
| CN112966395B (en) * | 2021-03-31 | 2023-09-19 | 华能国际电力股份有限公司 | Method for calculating static error of yaw system of wind turbine generator |
| CN112966395A (en) * | 2021-03-31 | 2021-06-15 | 华能国际电力股份有限公司 | Method for calculating static error of wind turbine generator yaw system |
| CN113236507B (en) * | 2021-05-28 | 2022-08-19 | 中南大学 | Yaw static error diagnosis method and system for wind turbine generator |
| CN113236507A (en) * | 2021-05-28 | 2021-08-10 | 中南大学 | Yaw static error diagnosis method and system for wind turbine generator |
| CN113848347A (en) * | 2021-07-29 | 2021-12-28 | 尚特杰电力科技有限公司 | Health state detection method for wind meter of wind driven generator |
| CN115422503A (en) * | 2022-07-22 | 2022-12-02 | 中广核新能源(定远)有限公司 | Method for drawing power curve of wind generating set |
| CN115422503B (en) * | 2022-07-22 | 2023-10-17 | 中广核新能源(定远)有限公司 | Method for drawing power curve of wind generating set |
Also Published As
| Publication number | Publication date |
|---|---|
| US20210262439A1 (en) | 2021-08-26 |
| US11649803B2 (en) | 2023-05-16 |
Similar Documents
| Publication | Publication Date | Title |
|---|---|---|
| WO2020097944A1 (en) | Real power curve-based method for discriminating and compensating yaw error inherent deviation of wind turbine generator set | |
| CN109667727B (en) | Wind turbine generator yaw error inherent deviation identification and compensation method based on power curve analysis | |
| CN109740175B (en) | Outlier discrimination method for power curve data of wind turbine generator | |
| CN103631681B (en) | A kind of method of online reparation abnormal data of wind power plant | |
| CN107944175B (en) | Method for acquiring real power curve of fan by considering wind turbulence intensity | |
| CN111322205A (en) | Wind turbine generator set wind vane zero error identification method and correction method | |
| CN110503153B (en) | Photovoltaic system fault diagnosis method based on differential evolution algorithm and support vector machine | |
| WO2023201552A1 (en) | County-wide photovoltaic prediction method based on cluster division and data enhancement | |
| CN110674864B (en) | Wind power abnormal data identification method comprising synchronous phasor measurement device | |
| CN106529741B (en) | Ultra-short-term wind power prediction method based on spatial correlation characteristics | |
| CN105512766A (en) | Wind power plant power predication method | |
| CN109779848B (en) | Method and device for obtaining full-field wind speed correction function and wind power plant | |
| CN109167387A (en) | Wind field wind power forecasting method | |
| CN103489046A (en) | Method for predicting wind power plant short-term power | |
| CN102684223A (en) | Optimized evaluating method for wind power output under multi-constraint condition for reducing transmission loss | |
| CN111260503A (en) | Wind turbine generator power curve outlier detection method based on cluster center optimization | |
| CN111342499B (en) | Wind farm real-time scheduling method based on wind power prediction data | |
| CN113153633A (en) | Static deviation calibration method for wind direction instrument of wind turbine generator | |
| CN115314406A (en) | Intelligent defect detection method of power transmission line based on image analysis | |
| CN115408860A (en) | Abnormal value monitoring and correcting method for wind speed-power data of wind power plant | |
| CN112800103B (en) | System and method for acquiring power curve of wind turbine generator based on SCADA data mining | |
| CN116662829B (en) | Standard power curve definition rule and deviation verification method for field group fan | |
| CN117610449A (en) | GRA-XGBoost-based wind turbine generator inflow wind speed estimation method | |
| CN115898787A (en) | Method and device for dynamically identifying static yaw error of wind turbine generator | |
| CN107977727B (en) | Method for predicting blocking probability of optical cable network based on social development and climate factors |
Legal Events
| Date | Code | Title | Description |
|---|---|---|---|
| 121 | Ep: the epo has been informed by wipo that ep was designated in this application |
Ref document number: 18940250 Country of ref document: EP Kind code of ref document: A1 |
|
| NENP | Non-entry into the national phase |
Ref country code: DE |
|
| 122 | Ep: pct application non-entry in european phase |
Ref document number: 18940250 Country of ref document: EP Kind code of ref document: A1 |