WO2020090143A1 - 電流パルス法による電池診断装置及び電池診断方法 - Google Patents
電流パルス法による電池診断装置及び電池診断方法 Download PDFInfo
- Publication number
- WO2020090143A1 WO2020090143A1 PCT/JP2019/022129 JP2019022129W WO2020090143A1 WO 2020090143 A1 WO2020090143 A1 WO 2020090143A1 JP 2019022129 W JP2019022129 W JP 2019022129W WO 2020090143 A1 WO2020090143 A1 WO 2020090143A1
- Authority
- WO
- WIPO (PCT)
- Prior art keywords
- battery
- data
- current pulse
- pulse
- current
- Prior art date
Links
Images


Classifications
-
- G—PHYSICS
- G01—MEASURING; TESTING
- G01R—MEASURING ELECTRIC VARIABLES; MEASURING MAGNETIC VARIABLES
- G01R31/00—Arrangements for testing electric properties; Arrangements for locating electric faults; Arrangements for electrical testing characterised by what is being tested not provided for elsewhere
- G01R31/36—Arrangements for testing, measuring or monitoring the electrical condition of accumulators or electric batteries, e.g. capacity or state of charge [SoC]
- G01R31/367—Software therefor, e.g. for battery testing using modelling or look-up tables
-
- G—PHYSICS
- G01—MEASURING; TESTING
- G01R—MEASURING ELECTRIC VARIABLES; MEASURING MAGNETIC VARIABLES
- G01R31/00—Arrangements for testing electric properties; Arrangements for locating electric faults; Arrangements for electrical testing characterised by what is being tested not provided for elsewhere
- G01R31/36—Arrangements for testing, measuring or monitoring the electrical condition of accumulators or electric batteries, e.g. capacity or state of charge [SoC]
- G01R31/378—Arrangements for testing, measuring or monitoring the electrical condition of accumulators or electric batteries, e.g. capacity or state of charge [SoC] specially adapted for the type of battery or accumulator
-
- G—PHYSICS
- G01—MEASURING; TESTING
- G01R—MEASURING ELECTRIC VARIABLES; MEASURING MAGNETIC VARIABLES
- G01R31/00—Arrangements for testing electric properties; Arrangements for locating electric faults; Arrangements for electrical testing characterised by what is being tested not provided for elsewhere
- G01R31/36—Arrangements for testing, measuring or monitoring the electrical condition of accumulators or electric batteries, e.g. capacity or state of charge [SoC]
- G01R31/382—Arrangements for monitoring battery or accumulator variables, e.g. SoC
- G01R31/3835—Arrangements for monitoring battery or accumulator variables, e.g. SoC involving only voltage measurements
-
- G—PHYSICS
- G01—MEASURING; TESTING
- G01R—MEASURING ELECTRIC VARIABLES; MEASURING MAGNETIC VARIABLES
- G01R31/00—Arrangements for testing electric properties; Arrangements for locating electric faults; Arrangements for electrical testing characterised by what is being tested not provided for elsewhere
- G01R31/36—Arrangements for testing, measuring or monitoring the electrical condition of accumulators or electric batteries, e.g. capacity or state of charge [SoC]
- G01R31/385—Arrangements for measuring battery or accumulator variables
- G01R31/387—Determining ampere-hour charge capacity or SoC
- G01R31/388—Determining ampere-hour charge capacity or SoC involving voltage measurements
-
- G—PHYSICS
- G01—MEASURING; TESTING
- G01R—MEASURING ELECTRIC VARIABLES; MEASURING MAGNETIC VARIABLES
- G01R31/00—Arrangements for testing electric properties; Arrangements for locating electric faults; Arrangements for electrical testing characterised by what is being tested not provided for elsewhere
- G01R31/36—Arrangements for testing, measuring or monitoring the electrical condition of accumulators or electric batteries, e.g. capacity or state of charge [SoC]
- G01R31/389—Measuring internal impedance, internal conductance or related variables
-
- G—PHYSICS
- G01—MEASURING; TESTING
- G01R—MEASURING ELECTRIC VARIABLES; MEASURING MAGNETIC VARIABLES
- G01R31/00—Arrangements for testing electric properties; Arrangements for locating electric faults; Arrangements for electrical testing characterised by what is being tested not provided for elsewhere
- G01R31/36—Arrangements for testing, measuring or monitoring the electrical condition of accumulators or electric batteries, e.g. capacity or state of charge [SoC]
- G01R31/392—Determining battery ageing or deterioration, e.g. state of health
-
- H—ELECTRICITY
- H01—ELECTRIC ELEMENTS
- H01M—PROCESSES OR MEANS, e.g. BATTERIES, FOR THE DIRECT CONVERSION OF CHEMICAL ENERGY INTO ELECTRICAL ENERGY
- H01M10/00—Secondary cells; Manufacture thereof
- H01M10/42—Methods or arrangements for servicing or maintenance of secondary cells or secondary half-cells
- H01M10/4285—Testing apparatus
-
- H—ELECTRICITY
- H01—ELECTRIC ELEMENTS
- H01M—PROCESSES OR MEANS, e.g. BATTERIES, FOR THE DIRECT CONVERSION OF CHEMICAL ENERGY INTO ELECTRICAL ENERGY
- H01M10/00—Secondary cells; Manufacture thereof
- H01M10/42—Methods or arrangements for servicing or maintenance of secondary cells or secondary half-cells
- H01M10/48—Accumulators combined with arrangements for measuring, testing or indicating the condition of cells, e.g. the level or density of the electrolyte
-
- Y—GENERAL TAGGING OF NEW TECHNOLOGICAL DEVELOPMENTS; GENERAL TAGGING OF CROSS-SECTIONAL TECHNOLOGIES SPANNING OVER SEVERAL SECTIONS OF THE IPC; TECHNICAL SUBJECTS COVERED BY FORMER USPC CROSS-REFERENCE ART COLLECTIONS [XRACs] AND DIGESTS
- Y02—TECHNOLOGIES OR APPLICATIONS FOR MITIGATION OR ADAPTATION AGAINST CLIMATE CHANGE
- Y02E—REDUCTION OF GREENHOUSE GAS [GHG] EMISSIONS, RELATED TO ENERGY GENERATION, TRANSMISSION OR DISTRIBUTION
- Y02E60/00—Enabling technologies; Technologies with a potential or indirect contribution to GHG emissions mitigation
- Y02E60/10—Energy storage using batteries
Definitions
- the present invention relates to a battery diagnosing device and a battery diagnosing method by a current pulse method for diagnosing battery status including deterioration judgment, temperature judgment and charge status of a lithium ion secondary battery (LIB) or the like.
- LIB lithium ion secondary battery
- the SOH is an index of the health condition or deterioration condition of the battery.
- the deterioration of a battery is roughly divided into a decrease in full charge capacity and an increase in resistance. Therefore, in the definition of SOH, the rate of decrease of the full charge capacity compared to the initial state is referred to as the deterioration state (capacity maintenance rate), or the rate of change of the resistance compared to the initial state is referred to as the deterioration state (resistance increase rate). It has been known.
- SOH refers to the capacity retention rate. That is, SOH is an index of the rate of capacity decrease, which is a capacity maintenance rate, and is a percentage (or percentage) display of full charge capacity at a certain point in use / initial full charge capacity.
- the capacity of the capacity maintenance ratio may represent the amount of charge (unit Ah) or the amount of work (unit Wh). In the following description, the amount of charge will be represented for convenience.
- the resistance increase rate may be AC resistance or DC resistance, so caution is required in this case.
- test temperature it is known that many parameters such as test temperature, current value, SOC (such as energization time when measuring DC resistance) must be considered, and it is possible to optimize the test conditions. Desired.
- SOC Sty of Charge
- a fully charged state is defined as 100% and a fully discharged state is defined as 0%.
- SOC States of Charge
- the SOC-OCV open circuit voltage
- the resistance value of the positive electrode and the negative electrode generally has a value smaller by about one digit than the resistance value of the electrolyte, so that it is difficult to observe the change in the resistance value due to the deterioration of the electrode.
- the deterioration of the battery is often in a considerably advanced state.
- the LIB diagnostic device is required to have a diagnostic algorithm for each LIB type.
- the electrical characteristics of the battery reflect the phenomenon of the electrochemical reaction inside the battery, and thus depend largely on the temperature during operation. Therefore, the temperature correction is also necessary.
- the DC method such as measuring the output voltage value (that is, observing the change of the internal resistance) is used to evaluate the deterioration of the secondary battery including the LIB, and the voltage, current, and temperature are measured. Many are based on the measurement of the three state diagnosis parameters. Among them, there is a method of applying a discharge pulse having a constant current in seconds to the battery and determining deterioration of the battery from the voltage drop characteristic. In this case, the deterioration state can be grasped on a cell-by-cell basis.
- the output potential of LIB has a hysteresis phenomenon that is peculiar to solid-state reactions in battery reactions. That is, it is a hysteresis phenomenon in which a potential difference of several tens of millivolts (mV) per LIB occurs depending on the current operation direction after the charging process and the discharging process even when the SOC is the same.
- mV millivolts
- the transient response of the DC pulse includes the above-mentioned hysteresis phenomenon factor, but no diagnostic method considering this phenomenon has been published or published. In other words, it can be said that there has never been a highly accurate diagnostic method that takes this into consideration. For example, even in the diagnosis by the in-car Kalman method, which is considered to be a diagnostic method using advanced technology, there are many cases in which changes in the output voltage are directly monitored and used as time series data. The hysteresis phenomenon is not taken into consideration, and it does not lead to the improvement of the accuracy of battery SOC or SOH evaluation.
- the characteristics of LIB are generally expressed by a charge / discharge curve, and when the full charge capacity gradually decreases due to the change of the characteristics of the constituent materials inside the battery with time, and when there is deterioration, the characteristics change suddenly and greatly, resulting in an inoperable life. May be. Although extremely rare, it may cause sudden heat generation or ignition. It is difficult to determine the state of this deterioration from the outside due to the deformation of the battery, etc., and there is currently no effective means.
- Table 2 shows the current evaluation method for LIB. However, this is not yet sufficient, and there is a point that a solution is required. Below, the common problems are shown and the solutions are arranged.
- LIB is said to have no such memory effect.
- the observed output voltage has a fluctuation of several tens of millivolts per cell depending on the direction of current operation, so this potential difference is not a negligible value.
- the output potential of LIB widely used in Japan and overseas as shown in Table 3 is a hysteresis phenomenon peculiar to the solid reaction of the battery reaction (see FIG. 4), that is, Even if the SOC is the same, a potential difference of several tens of millivolts (mV) occurs depending on the control direction after the charging and discharging processes, and this factor is included in the transient response of the DC pulse (Non-Patent Document 1).
- the value of the output voltage will differ due to the difference in the battery constituent materials and the charging / discharging directionality of the battery operation immediately before the potential measurement. That is, even if the SOC is the same, a potential difference of several tens of millivolts (mV) per LIB occurs due to the control direction after the charging and discharging processes, and this factor is included in the transient response of the DC pulse. Without consideration, improvement of diagnostic accuracy cannot be expected. Therefore, in this pulse method, the experimental conditions and confirmation method that minimize the influence of the above hysteresis phenomenon are devised and adopted in this proposal. At this time, the experimental conditions that reduce the effect of heat change due to the pulse current application are adopted.
- mV millivolts
- Table 3 shows the performance outline of various LIBs that are the targets of the status diagnosis in the present invention.
- Sample cell numbers (1) to (7) are 18650 type made in Korea, 26650 type made in Japan, S type made in Japan, P type made in Japan, 20700 type made in Japan, T type made in Japan made in Japan. , A Japanese company A laminated square, and a Chinese laminated square.
- FIG. 4 shows an example of the memory effect observed in the LIB, but at a low rate (0.1 C rate constant current (CC mode) and CV mode) for various general-purpose LIBs shown in Table 3, measurement environment is shown. It is a charge / discharge characteristic at a temperature of 25.0 ° C.
- one of the main purposes is to minimize the influence of the above hysteresis phenomenon.
- the purpose is to realize a battery diagnosis device and method using the current pulse method for more accurate diagnosis of secondary batteries.
- the battery diagnosis device by the current pulse method of the present invention is A pulse current generator that applies a single current pulse to the secondary battery to be measured, A voltage measuring device that measures the voltage response obtained by applying the single current pulse, A first data processing device for obtaining a chronopotentiogram showing the change over time of the voltage response and normalizing the chronopotentiogram; A second data processing device for inputting data of the normalized chronopotentiogram, In the second data processing device, the battery diagnosis is performed by using the correlation between the normalized data of the secondary battery for extracting the battery state expression factor prepared in advance and the battery state expression factor.
- the constant current pulse is the easiest to handle in terms of analysis as a current pulse.
- the battery diagnostic device by the current pulse method of the present invention, A pulse current generator for applying a current pulse composed of a plurality of current pulses to the secondary battery to be measured, A voltage measuring device that measures the voltage response obtained by applying the current pulse, A first data processing device for obtaining a chronopotentiogram showing the change over time of the voltage response and normalizing the chronopotentiogram; A second data processing device for inputting data of the normalized ronopotentiogram, In the second data processing device, the battery diagnosis is performed by using the correlation between the normalized data of the secondary battery for extracting the battery state expression factor prepared in advance and the battery state expression factor.
- a predetermined SOH value of various LIBs may be determined as the life value and life remaining determination may be performed.
- the second data processing device be equipped with a diagnostic algorithm in which the above-mentioned correlation is machine-learned.
- the first data processing device and the second data processing device may also serve as the same data processing device.
- the above-mentioned current pulse is characterized in that it is a current pulse that is interrupted after changing from a predetermined current value including zero to a predetermined constant current value in the charging direction of the secondary battery.
- the above-mentioned current pulse is characterized in that it is a current pulse that is interrupted after changing from a predetermined current value including zero in the discharge direction of the secondary battery to a predetermined constant current value.
- the battery state expression factor using a device having the same configuration as the battery diagnosis device, a secondary battery for extracting the battery state expression factor, the soundness, the state of charge, or the secondary battery to be measured. It is characterized by being extracted from the data of the chronopotentiogram including the temperature of the battery.
- a noise filter for suppressing noise of the input signal of the voltage measuring device and a data resampling means for suppressing the number of input data to the first data processing device.
- the second data processing device is equipped with a diagnostic algorithm that machine-learns the above-mentioned correlation regarding the battery state expression factors including the soundness, the state of charge, and the temperature of the secondary battery to be measured. It is characterized in that it diagnoses the soundness, the state of charge, or the temperature of the secondary battery to be measured.
- a battery diagnostic method using current pulses comprising: In extracting the battery state expression factor, (A1) measuring the battery state expression factor, (A2) applying a predetermined current pulse to the secondary battery for extracting the battery state expression factor, Measure the change over time of the response voltage to the applied voltage with a voltage measuring instrument, Normalizing a series of data of the chronopotentiogram that is the measurement result, and an operation including a step, (A3) A plurality of normalized data and a plurality of battery state expressions obtained by performing an operation including the A1 step and the A2 step on a plurality of secondary batteries having different battery state expression factors.
- the battery diagnosis device according to the current pulse method described in any one of the above-mentioned battery pulse methods can be used.
- the battery diagnosis it is not always necessary to limit the use of the same battery or the same type of battery to the data acquisition and the battery diagnosis, and in the battery diagnosis, if a diagnosis result within an allowable error is obtained, the battery diagnosis In some cases, it is possible to perform battery diagnosis by applying the above correlation obtained from a battery of a type different from the target. If that is possible, the amount of work to get the data can be reduced.
- the battery diagnosing device or the battery diagnosing method of the present invention it is possible to perform a highly accurate diagnosis in a short time in the diagnosis such as the deterioration judgment of the battery.
- ATRF normalization function
- diagnostic algorithm function single factor or multiple factors of SOH, temperature, SOC, SOP, and SOL
- An example of the memory effect observed in the LIB is shown below.
- the measurement environment temperature is 25.0. This is the charge / discharge characteristic at ° C.
- 4 (a), 4 (b), 4 (c), 4 (d), 4 (e), 4 (f), and 4 (g) show the measurement of cells 1 to 7, respectively.
- the data It is an example of a potential hysteresis phenomenon that represents a change in OCV value after a current pulse is repeatedly applied in one direction. It is an actual example of a potential hysteresis phenomenon showing an OCV value change (response when the application time and the applied current value are changed when the current pulse is repeated in the charging and discharging directions) after the current pulse is repeatedly applied.
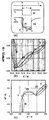
- FIG. 8A is a diagram showing an example of resampling of measurement data. In this example, resampling is performed so that the intervals are equal in logarithm of the time axis.
- FIG. 8B and FIG. 8C are enlarged views of the voltage falling portion and the voltage rising portion, respectively. It is a figure which shows the example of a plot with respect to log (t) of ATRF (t) obtained when it measures continuously by changing the pulse width of an applied electric current with a fixed wave height (-2.00A).
- FIG. 12 (a) is a constant current pulse applied to the battery and its chronopotentiogram (CP) response
- FIG. 12 (b) is its normalized curve (ATRF (t)) conversion
- FIG. 12 (c) is It is a figure which shows the example of the Nyquist plot produced using the equivalent circuit parameter value obtained by the simulation analysis of ATRF (t).
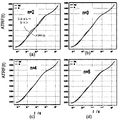
- FIG. 14 (a1), FIG. 14 (b1), FIG. 14 (c1), and FIG. 14 (d1) respectively show the plot result (+ sign) from the actual measurement data from the AC impedance measurement and its fitting curve.
- FIG. 16 (b) low temperature degradation
- FIG. 16 (c) It is a figure which shows the example of SOH dependence in high temperature deterioration). It is a figure which shows the SOC dependence characteristic with respect to ATRF (t) about LIB of the sample number 1 of Table 1.
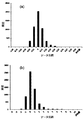
- FIG. 18A is an error distribution example of machine learning SOH estimation using the normalized raw data of the normalized curve (ATRF (t)) of the pulse response CP (when current is applied) shown in Table 4 as time series data.
- FIG. FIG. 18B is an error distribution example of the machine learning temperature estimation using the normalized raw data of the normalized curve (ATRF (t)) of the pulse response CP (when current is applied) shown in Table 6 as time series data.
- FIG. 18A is an error distribution example of machine learning SOH estimation using the normalized raw data of the normalized curve (ATRF (t)) of the pulse response CP (when current is applied) shown in Table 4 as time series data.
- FIG. 18B is an error distribution example of the machine learning
- ATRF (t) characteristic example at the time of performing pulse measurement by LIB during charge operation It is an ATRF (t) characteristic example at the time of performing pulse measurement by LIB during charge operation.
- the difference between the ATRF (t) curve corrected for the pulse under the charging current of 1 A and 0.5 A and the ATRF (t) curve for the pulse at the charging stop (current of 0 A) is shown.
- the difference (%) in ATRF (t) value before and after correcting the voltage change due to the charging current is shown.
- the measurement conditions were as follows: charging current 1 A, pulse wave height 2 A, width 2 s, sampling rate 100 kS / s, measurement temperature: room temperature (25 ° C.), the test battery was # 397 (18650).
- FIG. 1 shows an example of a block diagram of a battery diagnosis device assumed in the following description.
- a constant current pulse is mainly assumed to simplify the description.
- a current pulse source 1 is a constant current pulse generator for applying a constant current pulse consisting of a series of pulses including a single pulse or a plurality of single pulses to a secondary battery serving as a test battery 2. is there.
- the response voltage due to the application is measured by the voltmeter 4 at a predetermined time interval, and the noise filter 3 is used as necessary to remove noise from the input signal.
- the output of the voltmeter 4 is assumed to be a digital output, and a digital filter 5 is used as necessary to remove the noise contained in this digital output.
- the output of the digital filter 5 is input to the first data processing unit 6 that performs resampling, and the output thereof is input to the second data processing unit 7.
- the second data processing unit 7 is equipped with an algorithm formula obtained by learning a part of the database 8 such as the secondary battery deterioration data prepared in advance and the data extracted therefrom, and the battery diagnosis is performed using the algorithm formula. Is performed and the result is output.
- FIG. 2 shows a flowchart of a battery diagnosis method assumed in the following description.
- FIG. 2 is a diagram showing a battery state factor value evaluated in a short time by devising a diagnostic algorithm in which the pulse transient response of the present invention is used as a normalization function and the correlation between the normalized function value and the battery state factor is machine-learned.
- FIG. 3 is a schematic configuration diagram of an operation of a battery diagnostic device and a battery diagnostic method that are made possible.
- the battery state factor is a factor of SOH, temperature, SOC, SOP, and SOL. In estimating the value of each singular factor or multiple factors, highly accurate estimation can be performed at high speed.
- the chronopotentiogram response (also called galvanostatic response) transient response curve obtained from an externally applied constant current pulse is used for resampling and noise reduction methods from continuous measurement data, and the true response from a signal buried in noise is adopted.
- the data processing method for extracting the signal was applied. In order to remove noise, the data obtained after pulse transient response measurement was compressed and smoothed by digital processing. In this compression / smoothing, the signal was smoothed within the thinning interval of the data while resampling at several tens of points / digit from the continuous measurement data. By doing so, the noise level of the signal was reduced and the amount of data was made compact.
- the compacted data was recorded in a csv format file by adding header information.
- the current before and after the pulse is applied to the transient resistance curve so that the temperature (T), the pulse size (h), and the pulse width ( ⁇ ) at the time of measurement can be uniformly evaluated under different measurement conditions.
- Normalization was performed using an apparent transient response resistance change function (ATRF (t) described later) calculated from the transient response values of the value and the voltage.
- ATRF (t) apparent transient response resistance change function
- the validity of this method is determined by using the identity of each curve obtained by the above-mentioned normalized transient response resistance change function, or the circuit parameter value for analysis calculated by the simulation least squares fitting for the obtained curve.
- the Nyquist plot display (including Bode plot display) of the converted impedance response is performed, and the error of the curve fitting is evaluated by the least squares method, and the accuracy can be confirmed.
- a kernel model a machine learning model using a kernel function
- the raw data and the temperature at the time of measurement are input to the kernel model, and the teacher learning is performed using the SOH and the temperature as outputs. Since the kernel model is linear with respect to the parameters to be obtained, the solution can be obtained analytically by using the least squares method.
- FIG. 4 shows the electromotive force in the charge / discharge path in the cells 1 to 7 in Table 3.
- the electromotive force on the vertical axis is voltage and the unit is V, and the capacity on the horizontal axis is charge and discharge charge amount and the unit is mAh. It can be seen that in any of these cells, the paths during charging and discharging are different and have hysteresis characteristics.
- the measured transient response that is, CP
- the measured transient response that is, CP
- the pulse width ⁇
- the directionality of the applied pulse ⁇
- the mode of the applied pulse ⁇
- the obtained response can be expressed by the same transient response resistance function under what measurement condition, and the data is stored in the database.
- B In particular, it was found that when a current value corresponding to a high rate is applied, the value of the transient response resistance function gradually decreases as the current value increases. This cause can be interpreted as the induction of the potential hysteresis phenomenon related to the transient response resistance function term and the influence of temperature, and (c) optimization of the measurement conditions at the time of applying the constant current pulse is desired.
- the constant current pulse measuring device used in the present embodiment has a noise reduction as low as possible and is capable of measuring in a short time.
- each sampling is performed in an extremely short time (10 ⁇ s / sampling) with the sampling speed of voltage measurement being, for example, 100 kS / s.
- High-speed sampling is performed in this manner in order to reduce quantization error on the time axis due to sampling.
- pulse measurement conditions are improved, such as statistical noise removal by duplicate measurement and S / N ratio improvement by increasing the wave height of the applied constant current pulse.
- performing noise reduction and resampling of measurement data can be realized by applying digital noise reduction data processing, for example.
- the transient response waveform to the application of a current pulse differs depending on the battery temperature (T) at the time of measurement, the wave height (h), the wave width ( ⁇ ) and the number of repetitions of the applied current pulse. Therefore, index parameters are used in order to enable unified evaluation under various measurement conditions. That is, the pulse is normalized to the apparent transient response resistance function calculated from the current value and the voltage response value measured over a certain time period before and after the application of the pulse, and the index parameter is obtained.
- the transient response obtained under the measurement conditions in which the wave height and the wave width of the applied current pulse are different can be expressed by a unique curve (normalized curve) on the same coordinate axis plane.
- a pseudo equivalent circuit for simulating the battery reaction is fitted to the above-mentioned normalized curve to obtain various parameters of the pseudo equivalent circuit. Since this is the most suitable for the analysis of the change over time of the battery reaction, it is possible to make a database of the various parameters and utilize it for the diagnosis of SOH, SOC, etc. of the secondary battery. ⁇ Example> 1
- FIG. 12 is a conceptual diagram showing the contribution on the time axis of each element parameter of the pseudo equivalent circuit in the voltage transient response obtained when the constant current pulse is applied. Since each element of the above pseudo circuit has a unique time constant, the transition of its contribution can be known by arranging them on the time axis. From FIG. 12A, it can be estimated that there is a time zone in which the influence can be ignored because the response from the RC circuit group and the Warburg element is still small after the L component response is sufficiently attenuated.
- a frequency response analyzer (FRA: Frequency Response Analyzer) is used to measure an impedance spectrum of a general alternating current method, and a sine amplitude of a current or a voltage is continuously and alternately measured in a charging direction and a discharging direction. Since it is a method of applying, the observed impedance output is derived from the electrochemical phenomenon in the steady state.
- the influence of the L component and the potential hysteresis phenomenon can be minimized by selecting the conditions of the applied pulse.
- a curve obtained by normalizing the CP response was created, and each of the R 0 , L 1 R 1 , W 6 , and C int components was included in the simulation of the curve. Obtain parameter values with high accuracy.
- the above CPE method uses commercial software and has been widely used in academic fields, but the physicochemical meaning of scientific phenomena related to the coefficient is not clear. For this reason, here, a method of improving the fitting accuracy by increasing or decreasing the number of RC (resistance component, capacitance component) factors is used without adopting the CPE method.
- RC resistance component, capacitance component
- the temperature (T) at the time of measurement, the magnitude (h) of the constant current pulse to be applied, and the pulse width ( ⁇ ) are unified under different measurement conditions, so that they are unified.
- the transient resistance calculated from the transient response values of the current value and the voltage before and after the pulse application is used as an index parameter for enabling the dynamic evaluation. Moreover, since the number of measurement data points becomes huge, data resampling is performed.
- the DC current-voltage-time curve in the analysis equivalent circuit shown in FIG. 13 can be expressed by Equation 1.
- the theoretical formula of the impedance of the equivalent circuit for analysis can be expressed by Equation 2.
- the real part and the imaginary part are Z ′ and Z ′′ of the equation 3, respectively, and the equation 4 is W 6 in the equation 1 and corresponds to the above Warburg factor.
- This ATRF (t) value can be expressed as in Equation 6 using Equation 1 in the theoretical analysis formula.
- the ATRF (t) value is characterized by the following standardization, where it is observed as a single analysis curve for the same battery under test, regardless of the experimental conditions of constant current pulse application.
- Equation 6 When a single constant current pulse is applied for a period of ⁇ and then cut off, it is assumed that a reverse constant current pulse is applied, and Equation 6 is expanded to the region after the cutoff. be able to. In other words, it can be applied as Expression 7 (when it is necessary to distinguish from Expression 6, it is called “extended ATRF”). This CP analysis method using Equation 7 can also standardize the data.
- Equation 6 a series of constant current pulses consisting of multiple single pulses can be handled by expanding Equation 6 to the area after the interruption.
- a DB converted into the parameters of the constituent factors of the equivalent circuit for analysis is also created.
- the least squares method is applied to the fitting of the standardized curve to determine the optimum value.
- the correlation equation of time, temperature, charge degree and deterioration degree is derived,
- Machine learning based on this correlation equation is performed, and
- deterioration degree, temperature and charge degree of The effectiveness of this method can be verified by the least-squares method error evaluation as an evaluation method.
- the battery to be measured is exposed to various environments (high temperature, low temperature, left unattended, continuous, high rate use) to induce deterioration of charge / discharge characteristics.
- various environments high temperature, low temperature, left unattended, continuous, high rate use
- ATRF (t) characteristics of each battery under that environment it is desirable to measure the ATRF (t) characteristics of each battery under that environment.
- FIG. 2 shows an example of a flowchart of making a database of ATRF (t) parameters assumed in the following description.
- FIG. 2 shows creation of a database of a normalization function (ATRF) and creation of diagnostic algorithm expressions (single factors or multiple factors of SOH, temperature, SOC, SOP, and SOL) by machine learning and their loading in a diagnostic device. It is a flowchart. At each step of this flowchart, the following procedure is performed. START: Start G0: Set the test battery. G1: Set the temperature. G2: A charge / discharge characteristic test is performed. G3: SOH value calculation is performed. G4: Set the SOC value.
- G5 Measure the response (current, voltage, temperature, time) by applying a pulse.
- G6 A normalization function (ATRF) calculation is performed.
- G7 Collect and select data, return to G1 and repeat. When the predetermined number of data can be accumulated, the process moves to the next step.
- G8 Database (each factor (SOH, temperature, SOC, SOP and English
- G9 machine learning (creating an algorithm function).
- G10 The algorithm function is installed in the diagnostic machine. STOP: Stop
- the above measurements should be performed with multiple batteries under the same conditions to confirm their reproducibility.
- the measurement target battery is exposed to various environments (high temperature, low temperature, left standing, continuous use at high rate) to induce deterioration of charge / discharge characteristics, and ATRF (t ) Measure data and impedance characteristics and perform the same analysis as above.
- ATRF (t ) Measure data and impedance characteristics and perform the same analysis as above.
- the temperature dependence of various parameter values and the deterioration pattern high temperature history, low temperature history, high-speed rate charge / discharge
- it is possible to increase the versatility of the diagnostic method of the present invention by selecting a plurality of general-purpose batteries to be made into a database by changing the battery material, manufacturer and size.
- the machine learning SOH, temperature (T) and SOC diagnosis using the DB of the measurement data is performed by using the diagnosis method using the AC impedance method described in Patent Document 1, for example. Can be done by applying.
- a pseudo-equivalent circuit that is common to both the constant current pulse method and the AC impedance method is used, and a diagnostic algorithm that uses the equivalent circuit parameters obtained by both measurement methods as deterioration diagnosis, and pseudo-equivalent
- a diagnostic algorithm that machine-learned the correlation between the raw database and battery deterioration without conversion into circuit parameters is used to compare the above two measurement methods and show that the deterioration degree can be evaluated numerically at high speed and with high accuracy. it can.
- Part 2 Learning of correlation model using measured raw data
- the purpose of this function is (b) CP raw data of response to constant current pulse (time series data after noise processing and downsampling, and impedance data) To construct a correlation model with SOH, T, and SOC, and (b) estimate SOH, T, and SOC from the model.
- the program for the machine learning method created here uses a kernel model as a correlation model. Then, the raw data and the temperature at the time of measurement are input to the kernel model, and teacher learning is performed using SOH, T, and SOC as outputs.
- Kernel parameters are linear with respect to the parameters to be obtained, so an analytical solution can be obtained by using the least squares method.
- the mathematical expression of the kernel model and the calculation expression of learning are omitted here.
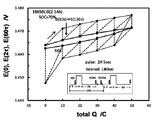
- FIG. 5 shows the results of pulse setting conditions in which the pulse widths are 2 seconds and 10 seconds and the applied current value is 2.00 A (corresponding to 0.67 C rate). Under this condition, when the pulse was applied in the same direction in the charge and discharge modes, a difference of 1 to 2 mV was observed as a change in the E (0) value 2 minutes after the application was completed. The behavior of the E (0) value when the pulse was applied in the same direction was similar to the behavior of the experimental results measured in different battery systems.
- FIG. 5 is an example of a potential hysteresis phenomenon that represents a change in OCV value after a current pulse is repeatedly applied in one direction. Influence of pulse width (5.0s), wave height (2.0A), repeated 5 times, (electricity: ⁇ 0.95C), waiting time (120s) measured temperature 25 ° C (18650 type LIB (2,200mAh) )).
- FIG. 6 shows changes in the OCV value (E (0)) 60 seconds after the end of pulse application when reversing the current pulse direction is repeatedly applied. From this experiment, it was found that the voltage fluctuates up and down depending on the pulse direction, and its magnitude depends on the pulse height and width.
- FIG. 6 is a potential hysteresis showing OCV value change (response when the application time and the applied current value are changed in the case where the current pulse is repeated in the charging and discharging directions) after the current pulse is repeatedly applied. It is an example of a phenomenon. Pulse width (0.2, 0.5, 1s), influence of wave height (1, 2, 3, 4A), (electricity: ⁇ 0.2 to ⁇ 3.0C), waiting time (60s) Measurement temperature 5 0.1 ° C., SOC 50%, SOH 0.95, (26650 type LIB (3000 mAh)).
- the current value of the pulse height was the value of rate 2C, and the fluctuation of about 10 mV was observed by applying the pulse for 1 second. From this, the effect of the potential memory effect and the temperature change on the height of the applied pulse, that is, the magnitude of the current value was investigated.
- the pulse width was applied for 2 seconds
- the magnitude of the applied current value was 0.37 to 11.1 C rate.
- the curve obtained by converting the CP response obtained at each applied current value into the normalized data (ATRF (t) term) is shown in Fig. 7.
- the applied current up to the 3.7C rate value is ATRF ( t)
- the curves were well superimposed.
- FIG. 7 shows a curve obtained by conducting a negative current pulse application experiment study from 0.37 to 11.1 C rate and converting the CP response obtained at each applied current value into an ATRF (t) term. Show changes.
- a pulse width of 2 s is applied, a measurement temperature is 25 ° C., a test cell is SOH 1.00, and SOC is 100% (square type 5552524 type LIB (270 mAh).
- the battery diagnosis apparatus can directly estimate and estimate the deterioration degree value by the deterioration degree value calculation unit based on the least square method as a machine learning method.
- the machine learning in the present invention is based on the method described in Patent Document 1, but instead of the measured impedance data or the pseudo equivalent circuit parameter value data analyzed from the impedance as the variable of Patent Document 1, As the variable, time-series normalized data (ATRF (t)) obtained by normalizing, down-sampling and smoothing the applied pulse transient response or pseudo equivalent circuit parameter value data analyzed from the transient response is used.
- ATRF (t) time-series normalized data obtained by normalizing, down-sampling and smoothing the applied pulse transient response or pseudo equivalent circuit parameter value data analyzed from the transient response
- the deterioration degree value calculation unit learns the linear coefficient of the deterioration degree value by the least square method, and directly calculates and estimates the deterioration degree value.
- the SOH value (deterioration value) is known and the ATRF (t) is measured or the analysis equivalent circuit parameter thereof is known according to the flowchart shown in FIG.
- the estimated value ⁇ of the kernel coefficient is calculated and learned.
- an SOH estimation algorithm that implements this estimated value ⁇ is constructed. Using this algorithm, the SOH value for the measured ATRF (t) or its analysis equivalent circuit parameter is calculated for the test battery whose SOH value is unknown.
- the deterioration of the battery can be directly determined from the measured ATRF (t) or its analysis equivalent circuit parameter.
- y can be approximated by a linear combination of the following one-dimensional kernel function K (x, x i ) (Equations 8 and 9).
- This coefficient ⁇ can be determined by learning from the input / output data x and y by the method of least squares.
- the estimated value y k (such as SOH, T, and SOC) can be estimated from Equation 12 using the learned coefficient estimated value ⁇ .
- the method of learning the linear coefficient of the deterioration degree value by the least squares method and directly estimating the deterioration degree value is explained, but the method of machine learning is provided with a pattern classification algorithm based on the least squares method.
- a least-squares stochastic classifier can also be used for diagnosis.
- the least-squares probabilistic classifier for this purpose is the process shown in G1 to G6 of FIG. 3, and first, from ATRF (t) or its analysis equivalent circuit parameter whose deterioration degree value is known by the learning algorithm, to several classification categories.
- the estimated value ⁇ (y) of the Gaussian kernel coefficient is calculated and learned.
- a classification algorithm is constructed which implements the estimated value ⁇ (y) of the Gaussian kernel coefficient thus obtained.
- This algorithm can be used to calculate the posterior probability p (y
- the deterioration of the battery can be determined by using ATRF (t) obtained from the measured CP response in F5 of FIG. 2 or its analysis equivalent circuit parameter.
- a spline curve was created by the spline method and data processing was performed.
- From the transient response measurement data it was decided to perform resampling at 20 to 100 points / digit and at the same time smooth the signal within the thinning section of the data. By doing so, the noise level of the signal and the amount of data were reduced. Header information is added to the obtained downsized data and output as a csv format file.
- Table 2 shows an example of the result of the number of data obtained by the down sampling.
- FIG. 8 is a diagram showing an example of resampling of measurement data.
- resampling is performed so that the intervals are equal in logarithm of the time axis.
- the CP transient response of FIG. 9 is the same as ATRF (t) vs. ATRF (t) plot analysis of the results of continuous measurement at a pulse height of 2 A with an applied pulse width of 0.2 seconds to 10 seconds. It is shown on the log (t) axis graph, and it was found that the measurement results of both of which the pulse widths are 10 times different are completely in agreement. From this, it was found that the apparent transient resistance function (ATRF (t)) analysis was effective.
- FIG. 10 shows the SOC dependence of the ATRF (t) plot of the LIB shown in FIG. It was found that the ATRF (t) curve was remarkably changed when the SOC was 0.25 or less in this measurement target battery.
- FIG. 9 shows a plot of ATRF (t) with respect to log (t) obtained when the pulse width of the applied current is changed and the wave height is continuously measured ( ⁇ 2.00 A).
- (a) is a constant current pulse applied to the battery and its chronopotentiogram (CP) response
- (b) is its normalized curve (ATRF (t)) conversion
- (c) is ATRF ( It is a figure which shows the example of the Nyquist plot created using the equivalent circuit parameter value obtained by the simulation analysis of t).
- I to V in the response regions described in (a) and (b) above represent the main contributions of the equivalent circuit parameters shown in FIG. 13 to the CP response.
- FIG. 13 shows the equivalent circuit modeling (ECM) of the all-electrode reaction mechanism of the battery used for the analysis of the chronopotentiogram (CP).
- ECM equivalent circuit modeling
- CP chronopotentiogram
- the upper part shows the plot result (+ sign) from the measured data from the AC impedance measurement and its fitting curve, and the lower part shows ATRF (t) (pulse measurement condition; current; 1.00A, application time; 2.00 seconds).
- the equivalent circuit parameter fitting in the ATRF (t) plot is shown.
- the results of the simulation curve and the measured ATRF (t) plot are shown.
- the observation sensitivities to W 6 , C int , L 1 , and R 0 that overlap with the observation time period of the R n C n parameter are different in both methods, and depend on the strength, width, and mode of the external signal. It can be inferred that the generated heat behavior inside the battery was also different, which affected the value of the R n C n parameter.
- FIG. 16 shows that for LIB of sample No. 1 in Table 3, about 25% of undegraded battery, cycle history degradation at low temperature, and cycle history degradation at high temperature.
- the temperature dependence (5, 25, and 45 ° C.) of the ATRF (t) term curve obtained for the advanced battery is shown. From this figure, it is clear that the shape of the ATRF (t) curve at each temperature differs depending on the deterioration history. In particular, it can be seen that the difference becomes remarkable at low temperatures.
- ATRF (t) obtained from a battery with cycle history deterioration at low temperature and cycle history deterioration at high temperature has a large difference in response curve even at the same measurement temperature, and an equivalent circuit analysis is performed. As a result, a difference was found in the temperature dependence for various parameter values such as W 6 , C int and R 0 . Here, the result is omitted.
- FIG. 17 shows the dependence of the LIB of sample number 1 in Table 3 on the SOC of ATRF (t) with respect to 5 to 100%. From this figure, the SOC dependence on ATRF (t) becomes large when the SOC is 25% or less, and the difference becomes remarkable especially in the time period longer than 10 ms. Therefore, the equivalent response in this time constant band is obtained. It can be seen that the temperature dependence of the circuit parameters is large.
- the kernel model of the machine learning method is used as an input vector, and (1) impedance characteristic database (DB) When (2) DB of equivalent circuit parameters calculated from the impedance characteristics is used, (3) Normalized database (DB) of chronopotentiogram (CP) characteristics obtained by the pulse method is used. And (4) the results of the case where the equivalent circuit parameter DB calculated from the normalized data is used are examined, and the optimum and practical state evaluation method such as the degree of deterioration in this fast pulse method is examined. Was selected.
- the correlation model between the equivalent circuit parameters obtained by analysis and evaluation and the battery characteristic state factor such as SOH is constructed, and the value of the factor such as SOH is estimated from the model.
- the estimation program uses a kernel model as the correlation model.
- the equivalent circuit parameters obtained by the analysis and the temperature at the time of measurement are input to the kernel model, and SOH is output to perform teacher learning. Since the kernel model is linear with respect to the parameters to be obtained, the solution can be obtained analytically by using the least squares method.
- the formulas of the kernel model and the calculation formulas of learning are separately described in Formulas 8 to 15. In the above, the present invention was applied to the LIBs shown in Table 3 and examined.
- the CP raw data used here refers to time-series data obtained by performing downsampling processing, smoothing processing, and normalization processing on measurement data as described above.
- the time-series data after down-sampling processing of raw data and normalized data it is necessary to match the sampling time of each data. Therefore, in this program, the sampling times of the data are matched by using the smoothing spline interpolation method.
- FIG. 6 shows the change of OCV value when the current pulse is repeatedly charged and discharged and in one direction.
- the potential hysteresis phenomenon is introduced. Therefore, in this method, in order to avoid the influence of this potential hysteresis phenomenon, in the CP measurement, the method of applying the current pulse in one direction to perform the CP measurement and the method of performing the CP measurement when the pulse current is cut off are adopted. The validity was confirmed by the obtained ATRF (t) curve, and machine learning SOH estimation was performed using those time series data.
- Table 6 shows an example of the examination results. This is the estimation result of the SOH value for the LIB of sample number 1 in Table 3.
- the RMSE at that time was calculated.
- the RMSE which is the mean square error, was 0.011 and 0.015 with respect to the estimation from the raw data when the current was applied and when the current was cut off. It can be concluded that both methods have established a method capable of diagnosing deterioration of the SOH of the battery within an estimated accuracy of 2% (diagnosis time is within 1 second).
- the normalized raw data is used as the input of the kernel model, but the result of the teacher learning with SOH as the output is the same regardless of whether the temperature at the time of measurement is added to the input of the kernel model at this time. It was the result.
- Table 6 shows RMSE (50 µ s-0.5s data of machine learning SOH estimation using time-series data in which the pulse response CP (current application and current interruption) is normalized to 100 at even intervals on a logarithmic scale. Not used for point generation and temperature data input, 18650 LIB; SOH: 1.00 to 0.60 with history of high temperature deterioration and low temperature deterioration, temperature: 5 to 45 ° C., total data 347 x 2; learning data 173 x 2 and 174 pieces of evaluation data x2) are shown.
- Table 7 shows the effect on SOH estimation value when the ratio of the number of evaluation data and the number of learning data is constant with the total number of data 347 being constant. The results of the examination are shown.
- the number of learning data is preferably 100 or more.
- Table 7 shows RMSE (50 µ s-0.5s data of machine learning SOH estimation using time-series data obtained by normalizing the pulse response CP (when the current is cut off), and 100 points are generated at equal intervals on a logarithmic scale.
- RMSE 50 µ
- 100 points are generated at equal intervals on a logarithmic scale.
- FIG. 16 has already shown an example of the temperature dependence of the CP transient response with respect to ATRF (t).
- Table 8 shows an example of the results of estimation and investigation of temperature during temperature measurement.
- the RMSE at that time was calculated.
- the RMSE error was 1.0 ° C in temperature display.
- An example of the temperature estimation error distribution is shown in FIG. It can be concluded that a method for diagnosing the temperature of a battery whose temperature at measurement is 5 to 45 ° C with an estimated accuracy within 4% (diagnosis time is within 1 second) has been established.
- the time-series data 100 points of 50 µ s to 1s / 0.5s data were generated at a log scale and used.
- the estimation accuracy improves as the number of learning increases.
- the ATRF (t) dependency of the temperature of 5 points was used as the time series data in the DB. It is expected that the estimation accuracy will improve as the temperature variable increases.
- Table 8 shows RMSE (50 µ s-0.5s data of machine learning temperature estimation using time-series data obtained by normalizing pulse response CP (when current is cut off), and 100 points are generated at equal intervals on a logarithmic scale.
- RMSE 50 µ
- 100 points are generated at equal intervals on a logarithmic scale.
- SOH, temperature, and SOC multiple outputs (SOH, temperature, and SOC) estimation can be executed simultaneously.
- the purpose of this function is to construct a correlation model between the normalized raw CP pulse data (time-series data after down-sampling) obtained in the experiment and SOH and measurement temperature, and from that model, build SOH and measurement temperature. Is to estimate.
- This estimation program uses a kernel model as a correlation model. Then, the normalization raw data and the temperature at the time of measurement are input to the kernel model, and the teacher learning is performed using the SOH and the temperature at the time of measurement as outputs.
- the solution can be obtained analytically by using the least squares method.
- it is the estimation result of the SOH value and the temperature for the LIB of sample number 1 in Table 3.
- the RMSE at that time was calculated.
- the RMSE which is the mean square error of each estimation factor, was 0.011 and 1.0 ° C. It can be concluded that a method capable of diagnosing deterioration with a battery SOH estimation accuracy of 1.1% or less and a temperature estimation accuracy of 1.0 ° C. (4% or less, diagnosis time of 1 second) was established.
- Table 9 shows RMSE (50 µ s-0.5s data) for simultaneous estimation of machine learning SOH value and temperature using time series data with normalized pulse response CP (current interruption) at equal intervals on a logarithmic scale. 100 points generated, not used for temperature data input, the total number of data 347 is constant, when the ratio of the number of evaluation data and the number of learning data is changed, and when it is executed three times, change of RMSE average value / minimum value / maximum value, 18650 LIB; SOH: 1.00 to 0.600 has a history of high temperature deterioration and low temperature deterioration, and temperature: 5 to 45 ° C.).
- FIG. 17 shows an example of the SOC dependence characteristic of the CP transient response with respect to ATRF (t). It can be seen that the SOC dependence characteristic of the present battery is remarkable when the SOC is 30% or less.
- SOC estimation examination result of the present embodiment is shown (see Table 8).
- the SOC of the LIB of sample number 1 in Table 3 was estimated, and the RMSE at that time was calculated.
- RMSE which is the mean square error, was 0.030 when SOC was 0.25 or less. It can be concluded that a method capable of diagnosing deterioration of the SOC of the battery with an estimated accuracy of 3% or less (diagnosis time is 1 second or less) was established.
- Table 10 shows RMSE (50 µ s-0.5s data of machine learning SOC value estimation using time series data in which the pulse response CP (current interruption) is normalized is generated at 100 points at equal intervals on a logarithmic scale, Total number of data 347 not used for temperature data input is constant, and when evaluation data 173 is learning data 174, change of RMSE average value / minimum value / maximum value when executed 3 times, 18650 LIB; SOH: 1 It has a history of high temperature deterioration and low temperature deterioration of 0.000 to 0.600, and the temperature is 5 to 45 ° C.).
- the normalized raw data of the normalized curve (ATRF (t)) of the pulse response CP (when current is applied) shown in Table 6 is time-series data.
- Error distribution of machine learning SOH estimation used for (50 µ s to 0.1s data is generated at 100 logarithmic intervals at equal intervals, is not used for temperature data input, and is executed 3 times, 18650 LIB; SOH: 1.
- the ratio of (full charge capacity / initial full charge capacity) can be obtained from the charge / discharge capacity curve at a low rate (for example, 0.1 C rate).
- the ratio has been considered as an index (SOH) indicating the health of the battery.
- SOH index
- the ratio of (full charge capacity / initial full charge capacity) calculated from the charge / discharge curve at a medium to high rate (for example, 0.5 to 3 C rate) is an index of decrease in power density (SOP). can do.
- FIG. 21 shows a plurality of LIBs (initial capacity: 5.19 Ah) using hard carbon as a negative electrode, which are used as in-vehicle batteries, in which the charge and discharge rates in the constant current mode are the same in each battery having different degrees of deterioration.
- the change in discharge capacity (observation capacity) with respect to the value is shown.
- the terminal voltages of charge and discharge were set to 4.200V and 2.500V, respectively.
- the present invention can also be applied to LIB during charging as described above.
- E (t) in Equation 7 has a drift component proportional to time
- ATRF (t) obtained by replacing E (t) with E (t) - ⁇ t ( ⁇ is a proportional coefficient) is obtained. To use.
- the linear approximation formula of the voltage change due to charge / discharge is calculated from the time domain immediately before the pulse application (pre-trigger), and the effect of charge / discharge is removed by correcting the pulse response voltage value using the approximate formula. To do.
- the net normalization function ATRF (t) value excluding the effect of charge / discharge can be obtained.
- FIG. 19 shows an example of ATRF (t) characteristics when pulse measurement is performed in LIB during charging operation.
- the difference between the ATRF (t) curve corrected for the pulse under the charging current of 1 A and 0.5 A and the ATRF (t) curve for the pulse at the charging stop (current of 0 A) is shown.
- SOC sulfur dioxide
- a transient response was measured by applying a pulse having a wave height of 2 A and a width of 2 s.
- the rate was changed to 0.5 A (corresponding to 1/4 C rate)
- pulse measurement was similarly performed 5 minutes later, and pulse measurement was also performed 20 minutes after the stop.
- the former two measurement data were corrected by the method of the present invention, and the stopped ones were not corrected, and the respective normalized curves were prepared.
- FIG. 20 shows an example of the influence of voltage correction on the normalization function of the pulse response of LIB during charging.
- the difference (%) in ATRF (t) value before and after correcting the voltage change due to the charging current is shown.
- the measurement conditions were as follows: charging current 1 A, pulse wave height 2 A, width 2 s, sampling rate 100 kS / s, measurement temperature: room temperature (25 ° C.), the test battery was # 397 (18650).
Abstract
正確な二次電池の診断を行うための、電池診断装置とその方法を、提案する。 パルス電流発生器と、電流パルス印加の電圧応答を計測する電圧計測器、その電圧応答の経時変化を示すクロノポテンショグラム(CP)を得て上記CPを正規化する第1データ処理装置と、正規化したデータを保存するデータベースと、保存されたデータと予め用意された電池状態表現因子との相関性を用いて電池診断を行う第2データ処理装置を、用いる。電流パルスは、データ取得時と診断時とで同方向の電流が望ましい。また、上記CPの入力信号用のノイズフィルタと、第1データ処理装置への入力データ数を抑制するリサンプリング手段を備える。
Description
本発明は、リチウムイオン二次電池(LIB)等の、劣化判定、温度判定、および充電状態を含む電池状態診断を行う、電流パルス法による電池診断装置及び電池診断方法に関する。
有力なエネルギー貯蔵手段の一つである高性能リチウムイオン二次電池の用途は、低炭素化社会の実現の課題との関連で電気自動車や定置型電源などの市場で大型・中型の電源として拡大を続けている。各電池メーカーが製造するLIBは同一ではなく、構成材料、サイズ、外形、容量、出力電圧が異なり、また電池の使用条件と環境により劣化進行の度合い、寿命の長短、安全性も異なる。
現在、蓄電池一般に広く用いられている劣化診断では、単電池や組電池全体の内部抵抗の増大で評価する手法がとられている。また、電池のSOH(State of Health:健全度)やSOC(State of Charge:充電状態)についての評価には、それぞれについて出力電圧計測や電流積算法で推定するという直流法を用いたものである。これらの手法は,鉛蓄電池では大変有効な診断法である。しかし、LIBでは、動作原理や構成材料が鉛蓄電池と異なるために、正しい方法ではないことが知られている。
ここで、上記SOHは、電池の健康状態または劣化状態の指標である。一般に、電池の劣化の尺度には大きく分けて、満充電容量の減少と抵抗の上昇が挙げられる。このため、SOHの定義には、満充電容量の初期と比べた減少の割合を劣化状態(容量維持率)、または抵抗の初期と比べた変化の割合を劣化状態(抵抗上昇率)として指すことが知られている。
以下では、便宜的に、SOHは容量維持率を指すものとする。つまり、SOHは、容量減少の割合の指標で、容量維持率であり、使用中のある時点での満充電容量÷初期の満充電容量、のパーセント(又は百分率)表示である。
ここで、上記の容量維持率の容量とは、電荷量(単位Ah)を表す場合と、仕事量(単位Wh)を表す場合とがある。以下の説明では、便宜的に電荷量を表わすものとする。
また、抵抗上昇率を定義に用いる場合でも、交流抵抗または直流抵抗の場合があるため、この場合には、注意が必要である。
SOHを実測する場合は、試験温度や電流値、SOCなど(直流抵抗の測定では通電時間など)の多くのパラメータを考慮しなければならない事が知られており、試験条件を最適化することが求められる。
また、上記のSOC(States Of Charge)は、充電状態の指標である。満充電時を100%、完全放電時を0%と定義する。一般的にSOCの定義として、満充電状態を100%として、放電で流れた電流を積算して求められる。また、簡易的にSOCを測定したい場合は、電池の電圧を測定し、SOC-OCV(開回路電圧)曲線と照らし合わせることで、SOCの概算が出来ると考えられている。
因みに、二次電池の従来の安全評価と管理手法の手順は、次の表1の通りである。

上記表1に示すような直流抵抗値の計測による診断、あるいは、それと上記表1の4に示す1kHzのインピーダンス値とを組み合わせた劣化診断法を用いた診断器で鉛蓄電池の評価に使えるものが市販されている。しかし、この診断器をLIB診断に適用した場合には、診断確度は不十分なものである。その理由は、LIBでは電池が劣化して容量が低下しても、上記抵抗値がほとんど変化しない場合があったり、1kHzの周波数帯域で得られるインピーダンス特性の値については、この値が主に電池内の電解質の抵抗変化を反映するが、電極である正極や負極の特性変化を反映していなかったりするためである。即ち、LIBでは正極や負極の抵抗値は電解質の抵抗値と比べて一般に一桁程度小さい値を持つため、電極の劣化による抵抗値の変化は観測しにくい。また、電解質の抵抗値変化が観察される場合には、電池の劣化はかなり進んだ状態にあることが多い。
鉛電池の場合と異なり、例えば市販のLIBの場合は、構成材料、形、容量等が各社で異なる個々に別ものの電池であり、電圧、電流、抵抗を計測するテスターのような市販の診断器で、各種のLIBの劣化度を計測することは不可能である。すなわち、LIBの診断器では、LIBの種類毎の診断用アルゴリズムを搭載することが求められる。また、一般に、電池の電気特性は、電池内部での電気化学反応の現象を反映することから、動作時の温度に大きく依存する。このため、その温度補正も必要である。
また、上記のように、LIBを含めた二次電池の劣化評価には、出力電圧値の計測(すなわち、内部抵抗の変化を観察する)などの直流法が使用され、電圧、電流、および温度という3つの状態診断パラメータの測定を基本にしたものが多い。この中には、電池に秒単位の一定電流の放電パルスを印加して、その電圧降下特性から電池の劣化を判断する手法がある。この場合、1セル単位で劣化状態の把握が可能となる。
また、その類似の直流法として、充電中や放電中の二次電池の電流を数十秒間ほど遮断し、その時の端子電圧の変化(電圧 vs 遮断時間)から電池の状態を判断する手法がある。
ただし、LIBの場合は、これらの手法で得られた出力電圧の変化とSOCまたはSOHとの比例性等の相関性に関する把握は不十分なものであった。その主な原因の一つは、LIBの出力電位には電池反応に固体反応特有のヒステリシス現象があるためである。すなわち、SOCが同じ場合でも充電過程や放電過程後の電流動作方向によりLIB1個当たり数十ミリボルト(mV)の電位差が生じるヒステリシス現象のことである。
一般に、直流パルスの過渡応答に上記ヒステリシス現象の因子が含まれているが、この現象を考慮した診断方法は公開や公表がなされていない。つまり、これを考慮した高精度の診断方法はこれまでなかったと言える。例えば、高度な技術を用いた診断方法と考えられている車載用のカルマン(Kalman)法での診断でも、出力電圧の変化をそのままモニタリングして時系列データとして使用しているものが多く、このヒステリシス現象は考慮されておらず電池のSOCやSOH評価の精度向上にはつながっていない。
LIBの特性は、一般に充放電曲線で表現され、電池内部の構成材料特性の経時変化により、満充電容量が徐々に減少する場合と、その劣化がある時に突然大きく変化し、動作不能な寿命となる場合がある。また、非常に希ではあるが、急な発熱や発火を引き起こすことがある。この劣化の様子は電池の変形等でその外部から判定することは難しく、有効な手段はないのが現状である。
従来、電池状態の劣化状態や充電状態判断のマーカーとして、(イ)電流または電圧パルス印加による内部抵抗の変化、(ロ)開回路電圧及び動作時の出力電圧の変化、(ハ)動作時での急な温度上昇観測などが用いられてきた(表2参照)。ここで、電池の劣化度合い(劣化状態)を表す尺度として、単位電気量放電あたりの開回路電圧の変化量、満充電状態での開回路電圧値の変化がしばしば用いられる。また、(満充電容量/初期満充電容量)の比が電池の健全度又は劣化度(つまりSOH)を表すパラメータとして、劣化状態を表す指標と考えられてきた。また、パワー密度(State of Power; SOP)の減少などもその指標となってきた。
LIB劣化度合いと関係づけられる満充電容量の減少の計測は、長時間を要する低レートでの充放電特性を調べる(例えば、0.1Cレートで約20時間以上が必要)方法以外に手法はなく、現状では簡便な手法はない。
LIBに関する現時点での評価法を表2に示す。しかし、これは未だに充分なものでなく、解決が必要とされる点がある。下記では、その共通の課題を示し、その解決法を整理する。

ニッケル・カドミウム蓄電池やニッケル水素電池では、充放電条件によりメモリー効果と呼ばれる現象が起こることが知られている。これは、継ぎ足し充電等により、それらの電池での機器の作動時間が短くなる現象である。そのメモリー効果の解消には、深い放電と深い充電を繰り返すことが求められる。
これに対して、LIBにはこのようなメモリー効果はないと言われている。しかし、注意深く観測すると、LIBの場合には、観測される出力電圧には、電流動作方向により1セル当たり数十ミリボルトの出力電圧の変動があることから、この電位差は無視できる値ではない。
LIB特有の電位ヒステリシス現象の影響についは、一般に、表3に示したような国内外で汎用されているLIBの出力電位は、電池反応が固体反応特有のヒステリシス現象(図4参照)、すなわち、SOCが同一状態でも充電と放電過程後の制御方向により数十ミリボルト(mV)の電位差が生じ、直流パルスの過渡応答にこの因子が含まれてくる(非特許文献1)。
LIBの場合は、電池構成材料の違いおよび電位計測直前の電池動作の充放電方向性によって、出力電圧の値に違いが出てくる。すなわち、SOCが同一状態でも充電と放電過程後の制御方向によりLIBの1個当たり数十ミリボルト(mV)の電位差が生じ、直流パルスの過渡応答にこの因子が含まれてくるので、この現象を考慮しなければ診断精度の向上は望めない。よって、本パルス法では上記のヒステリシス現象の影響を最小化する実験条件と確認法が本提案では考案し採用される。この際、パルス電流印加による熱変化の影響も軽減する実験条件が採用される。

表3は、本発明で状態診断の評価対象とした各種LIBの性能概要を示す。サンプルセル番号(1)から(7)はそれぞれ、韓国製の18650型、日本製S社の26650型、日本製P社の角型、日本製P社の20700型、日本製T社の角型、日本製A社のラミネートの角型、及び中国製ラミネートの角型である。
図4は、LIBで観察されるメモリー効果の例を示すが、表3に示した汎用の各種LIBについての低レート(0.1Cレートの定電流(CCモード)およびCVモード)で、測定環境温度25.0℃の充放電特性である。
このヒステリシス現象は、電池診断において、次に示す問題を引き起こす。すなわち、LIBでSOCが同一状態でも、診断が充電過程後か放電過程後かの制御方向の違いにより上記の電位差が生じるために、一般には、定電流パルスに対する過渡応答にこの因子が含まれてくる。この電位差は出力電圧の変動に対して無視できる値ではなく、この現象を考慮しなければ診断精度の向上は望めない。なお、交流インピーダンス計測にもこのヒステリシス現象が含まれることは明らかであるが、考慮されていない。
よって、本発明では、上記のヒステリシス現象の影響を最小化することを主旨のひとつとするものである。この際、定電流パルスの印加による発熱や吸熱による温度変化があり、電極反応への影響があることから、その影響も軽減される電池診断装置及び電池診断方法とすることが望ましい。
N. Oyama and S. Yamaguchi, J. Electrochem. Soc.,160, A3206-A3212 (2013)&Anal. Chem., 83, 8429-8438 (2011)
従来、直流パルス過渡応答データをインピーダンス挙動に変換したナイキストプロットなどの表現は、同一電池で同一環境の計測条件下で測定した交流インピーダンス計測から直接得られる該当プロットとの間に無視できない相違があり、実験結果が一致しない場合が多かった。この相違の原因は、直流パルス法と交流インピーダンス法の両手法で得られた結果には、観察データそれ自身に誤差が含まれている、あるいは、評価手法とした擬似等価回路の各種パラメータ値の変化が正しく把握されていないことによると推定される。すなわち、現状の直流パルス法と交流インピーダンス法では電池の劣化度合を正しく診断できていないと推定できる。
このため、二次電池の診断をこれまでより正確に行うための、電流パルス法による電池診断装置とその方法を、実現することを目的にする。
そこで、本発明の電流パルス法による電池診断装置は、
測定対象となる二次電池に単一の電流パルスを印加するパルス電流発生器と、
その単一の電流パルス印加で得られる電圧応答を計測する電圧計測器と、
その電圧応答の経時変化を示すクロノポテンショグラムを得て、そのクロノポテンショグラムを正規化する第1データ処理装置と、
正規化された上記クロノポテンショグラムのデータを入力する第2データ処理装置を、備え、
第2データ処理装置において、予め用意された電池状態表現因子抽出用の二次電池についての正規化データと電池状態表現因子との相関性を用いて電池診断を行うものである。
測定対象となる二次電池に単一の電流パルスを印加するパルス電流発生器と、
その単一の電流パルス印加で得られる電圧応答を計測する電圧計測器と、
その電圧応答の経時変化を示すクロノポテンショグラムを得て、そのクロノポテンショグラムを正規化する第1データ処理装置と、
正規化された上記クロノポテンショグラムのデータを入力する第2データ処理装置を、備え、
第2データ処理装置において、予め用意された電池状態表現因子抽出用の二次電池についての正規化データと電池状態表現因子との相関性を用いて電池診断を行うものである。
因みに、電流パルスとして、解析上最も取扱いが容易であるのは、定電流パルスである。
また、本発明の電流パルス法による電池診断装置は、
測定対象となる二次電池に複数の電流パルスからなる電流パルスを印加するパルス電流発生器と、
その電流パルス印加で得られる電圧応答を計測する電圧計測器と、
その電圧応答の経時変化を示すクロノポテンショグラムを得て、そのクロノポテンショグラムを正規化する第1データ処理装置と、
正規化された上記ロノポテンショグラムのデータを入力する第2データ処理装置を、備え、
第2データ処理装置において、予め用意された電池状態表現因子抽出用の二次電池についての正規化データと電池状態表現因子との相関性を用いて電池診断を行うものである。
測定対象となる二次電池に複数の電流パルスからなる電流パルスを印加するパルス電流発生器と、
その電流パルス印加で得られる電圧応答を計測する電圧計測器と、
その電圧応答の経時変化を示すクロノポテンショグラムを得て、そのクロノポテンショグラムを正規化する第1データ処理装置と、
正規化された上記ロノポテンショグラムのデータを入力する第2データ処理装置を、備え、
第2データ処理装置において、予め用意された電池状態表現因子抽出用の二次電池についての正規化データと電池状態表現因子との相関性を用いて電池診断を行うものである。
ここで、1つの電流パルス波形を、近似的に複数の定電流パルスの連続として取り扱うことも可能である。
なお、これらの電池診断装置を用いた寿命(SOL)判定では、各種LIBの所定のSOH値を寿命値と決めて余命判定を行うものでもよい。また、第2データ処理装置は、上記の相関性を機械学習した診断アルゴリズムを搭載するものである事が望ましい。また、第1データ処理装置と第2データ処理装置は、同一のデータ処理装置を兼用するものでもよい。
また、上記の電流パルスは、上記二次電池の充電方向の、ゼロを含む所定の電流値から所定の定電流値に変化した後に遮断される電流パルスであることを特徴とする。
また、上記の電流パルスは、上記二次電池の放電方向の、ゼロを含む所定の電流値から所定の定電流値に変化した後に遮断される電流パルスであることを特徴とする。
また、上記電池状態表現因子は、上記の電池診断装置と同様の構成の装置を用いて、電池状態表現因子抽出用の二次電池についての、健全度、充電状態、または測定対象となる二次電池の温度を含むクロノポテンショグラムのデータから抽出したものであることを特徴とする。
また、上記電圧計測器の入力信号のノイズを抑制するノイズフィルタと、第1データ処理装置への入力データ数を抑制するデータリサンプリング手段を備えることを特徴とする。
また、第2データ処理装置は、健全度、充電状態、および測定対象となる二次電池の温度を含めた電池状態表現因子についての上記相関性を機械学習した診断アルゴリズムを搭載するものであり、健全度、充電状態、あるいは測定対象となる二次電池の温度について診断するものであることを特徴とする。
また、本発明の電流パルス法による電池診断方法は、
電流パルスを用いる電池診断方法であって、
電池状態表現因子の抽出においては、
(A1)上記電池状態表現因子を測定するステップと、
(A2)電池状態表現因子の抽出用二次電池に所定の電流パルスを印加し、
上記印加に対する応答電圧の経時変化を電圧計測器で計測し、
その計測結果であるクロノポテンショグラムの一連のデータを正規化するステップと、を含む操作について、
(A3)異なる電池状態表現因子をもった複数の二次電池について、上記A1ステップとA2ステップとを含む操作を行って得られた、複数の正規化された上記データと複数の上記電池状態表現因子との相関性を抽出し、
電池診断においては、
(B1)測定対象となる二次電池に電流パルスを印加し、
(B2)その電流パルス印加に対する電圧応答の経時変化を示すクロノポテンショグラムを得て、
(B3)上記クロノポテンショグラムを正規化し、
(B4)正規化された上記クロノポテンショグラムのデータに上記相関性を適用して、電池状態表現因子の推定を行うことを特徴とする。
この電池診断においては、上記の電流パルス法による電池診断装置のいずれか1つに記載の電流パルス法による電池診断装置を用いることができる。
ここで、データ取得時と電池診断時とで同じ電池または同じ型の電池を用いることに必ずしも限定する必要はなく、電池診断において許容範囲の誤差に入る診断結果が得られる場合は、電池診断の対象と異なる型の電池から得られた上記相関性を適用して、電池診断を行うことが可能な場合もある。それが可能である場合は、データを取得するための作業量を減らすことができる。
本発明の電池診断装置または電池診断方法によれば、電池の劣化判定等の診断において、高精度な診断を短時間で行うことができる
図1に、以下の説明において想定する電池診断装置のブロック図の例を示す。なお、以下においては、説明を簡単にするために、主に定電流パルスを想定している。この図で、電流パルス源1は、被検電池2となる二次電池に単一パルスまたは複数の単一パルスを含む一連のパルスからなる定電流パルスを印加するための定電流パルス発生器である。その印加による応答電圧の測定はその電圧計4により所定の時間間隔で測定するが、その入力信号のノイズ除去のために必要に応じてノイズフィルタ3を用いる。電圧計4の出力にはデジタル出力を想定しており、このデジタル出力に含まれるノイズ除去のために、必要に応じてデジタルフィルタ5を用いる。このデジタルフィルタ5の出力は、リサンプリング等を行う第1データ処理部6に入力され、その出力は第2データ処理部7に入力される。第2データ処理部7では、予め準備された二次電池劣化データやそれから抽出したデータ等のデータベース8の一部を学習して得られたアルゴリズム式を搭載し、そのアルゴリズム式を用いて電池診断を行いその結果を出力する構成である。
また、図2に、以下の説明で想定する電池診断方法のフローチャートを示す。図2は、本発明のパルスの過渡応答を正規化関数とし、その正規化関数値と電池状態因子との相関性を機械学習した診断アルゴリズムを考案して、電池状態因子値を短時間で評価できるようにした電池診断装置の動作および電池診断方法の構成概略図である。上記電池状態因子とは、SOH、温度、SOC、SOP、及びSOLの因子である。その単数各因子または複数因子の値の推定にあたり、高精度な推定を高速で行うことができる。
このフローチャートの各ステップでは、以下の手続きを行う。
START: 開始
F0: 被検電池
F1: パルス印加の最適条件による過渡応答測定を行う。
F2-1: 測定データからパルス印加時刻(t=0)の測定を行う。
F2-2: 測定データの平滑化で、ノイズリダクションを行う。
F2-3: 測定データの圧縮で、データリサンプリングを行う。
F3: 正規化関数(ATRFカーブ)の算出を行う。
F4: 等価回路パラメータの算出を行う。
F5-1: ATRF用診断アルゴリズムによる状態因子値(単数各因子または複数因子)の推定を行う。
F5-2: パラメータ用診断アルゴリズムによる状態因子値(単数各因子または複数因子)の推定を行う。
F6: 診断結果の表示または出力を行う。
STOP: 停止
上記の定電流パルスには、LIB特有の電位ヒステリシス現象や印加パルスによる温度変化の影響を最小化する条件を選択した。外部印加の定電流パルスから得られるクロノポテンショグラム応答(ガルバノスタテック応答とも呼ばれる)の過渡応答カーブの連続計測データからのリサンプリングおよびノイズリダクション方法を採用し、ノイズに埋もれた信号から真の応答信号を抽出するためのデータ処理法を適用した。また、ノイズ除去のためにパルス過渡応答測定後に得られたデータをデジタル処理で圧縮平滑化した。この圧縮平滑化では、上記連続計測データから、数十点/桁でリサンプリングすると同時にデータの間引き区間内で信号を平滑化した。これらにより、信号のノイズレベルの低減とデータ量のコンパクト化を図った。コンパクト化されたデータは、ヘッダー情報を追加してcsv形式ファイルで記録した。
次に、異なる計測条件下でも統一して評価ができる指標パラメータを使用できるようにするために、電池の劣化評価方法として、定電流パルス印加前後の電流値と電圧応答値とから計算された見かけの過渡応答抵抗関数(ATRF; Apparent Transient Resistance Function)カーブを求めた。また、それを擬似等価回路パラメータ値の計算に用いた。
ここでは、測定時の温度(T)、パルスの大きさ(h)、パルス幅(τ)について、異なる測定条件下でも統一した評価ができるように、上記の過渡抵抗曲線にパルス印加前後の電流値と電圧の過渡応答値から計算された見かけの過渡応答抵抗変化関数(後述のATRF(t))を用いて正規化した。この方法の妥当性は、正規化した上記の過渡応答抵抗変化関数により求めた各カーブの同一性、または得られたカーブに対するシミュレーション最小二乗法フィッティングにより計算された解析用回路パラメータ値、を用いて変換したインピーダンス応答のナイキストプロット表示等(ボード線図表示を含む)を行い、それらのカーブフィッティングの最小二乗法による誤差評価を行い、その精度から確かめることができる。
定電流パルス法で得られたクロノポテンショグラム(CP)の(イ)生データ(但し、ダウンサンプリング後の時系列データ)、(ロ)その等価回路パラメータ解析を行った各種パラメータ値のデータ、および(ハ)電池状態表示因子(SOH、T、およびSOC)、との各々の相関モデルを構築し、その相関モデルからSOH、T、およびSOCなどを推定する。これを実現するコンピュータプログラムでは、上記相関モデルとして、例えばカーネルモデル(カーネル関数を用いる機械学習モデル)を使用する。そして、上記生データならびに計測時の温度をカーネルモデルの入力とし、SOHおよび温度などを出力として教師学習を行う。カーネルモデルは求めるべきパラメータに関して線形となるため、最小二乗法を用いることで解析的に解が求まる。
因みに、上記の各々の相関モデルを用いた場合の比較では、SOHおよび温度などの診断の機械学習法の結果の精度には大きな相違はなかった。
また、図4は、表3のセル1からセル7において、充放電経路での起電力を示す。縦軸の起電力は電圧で単位はV、横軸のCapacityは充放電電荷量で単位はmAhである。これらのいずれのセルにおいても充電時と放電時の経路が異なりヒステリシス特性をとることが分かる。
したがって、直流パルスの過渡応答(即ちCP)の高精度な計測を実現するために、(イ)電位ヒステリシス現象および熱変化の影響を軽減する計測条件の設定を行う必要がある。同一温度の条件下の計測でも印加パルスの大きさ(h)、パルス幅(τ)、印加パルスの方向性、および印加パルスの様式の違いにより、その実測の過渡応答(即ちCP)は異なる。このため、得られた応答は、どのような計測条件の場合に同一の過渡応答抵抗関数で表現できているか、の確認を行い、それらのデータベース化を行う。(ロ)特に、高レートに相当する電流値の印加では、電流値の上昇とともに上記過渡応答抵抗関数の値は徐々に減少することが分かった。この原因は、過渡応答抵抗関数項に関する電位ヒステリシス現象の誘起および温度の影響として解釈が可能であり、(ハ)定電流パルス印加時の計測条件の最適化が望まれる。
<計測データのノイズリダクションおよびリサンプリング>
本実施例に用いる定電流パルス計測機器は、できるだけ低ノイズ化し、かつ、短時間での計測が可能なものとした。これに合わせて、電圧測定のサンプリング速度を例えば100kS/秒として、極短時間(十μ秒/サンプリング)で各サンプリングを行う。この様に高速サンプリングを行うのは、サンプリングによる時間軸での量子化誤差を低減するためである。また、重複測定による統計的ノイズ除去、印加する定電流パルスの波高の増大によるS/N比の改善など、パルス測定条件の改善を行っている。
本実施例に用いる定電流パルス計測機器は、できるだけ低ノイズ化し、かつ、短時間での計測が可能なものとした。これに合わせて、電圧測定のサンプリング速度を例えば100kS/秒として、極短時間(十μ秒/サンプリング)で各サンプリングを行う。この様に高速サンプリングを行うのは、サンプリングによる時間軸での量子化誤差を低減するためである。また、重複測定による統計的ノイズ除去、印加する定電流パルスの波高の増大によるS/N比の改善など、パルス測定条件の改善を行っている。
ここで、単一パルス印加が10秒以上の時間となる場合には、
(a)電池自身の持つ微分容量への影響(充電や放電による無視できなくなる信号変化)、
(b)上記パルス印加で誘起される熱発生および放熱による温度変化の影響、
(c)サンプリングデータ数の肥大化による処理データの増大など、上記パルス印加時間が短時間の場合に比べて、電池診断に関する新たに考慮すべき因子が発生する。
(a)電池自身の持つ微分容量への影響(充電や放電による無視できなくなる信号変化)、
(b)上記パルス印加で誘起される熱発生および放熱による温度変化の影響、
(c)サンプリングデータ数の肥大化による処理データの増大など、上記パルス印加時間が短時間の場合に比べて、電池診断に関する新たに考慮すべき因子が発生する。
一般に、パルス印加に対する過渡応答波形には大振幅のノイズが重畳して観測される。このため、測定データから真の応答信号を抽出するためのノイズリダクションが求められる。以下に説明する例では、データ処理の際にデジタルノイズリダクションを行う。さらに、パルス過渡応答の計測レンジに依るが、解析を高精度で行うためにサンプリングレートを高くする必要があり、この場合は計測データが膨大になる。このため、上記計測データの解析を高精度でしかも簡便に実行するためには、データリサンプリング(圧縮平滑化)を行ってデータ数の圧縮を行うことが望ましい。
上記の様に、計測データのノイズリダクションおよびリサンプリングを行うことは、例えば、デジタルノイズリダクションのデータ処理を適用することで実現できる。
また、データリサンプリングについては、例えば、過渡応答測定データから20点/桁でリサンプリングすると同時にデータの間引き区間内で信号を平滑化することとする。こうして、信号のノイズレベルの低減とデータ数量の低減を図る。得られたダウンサイズドデータは、ヘッダー情報を追加してcsv形式ファイルで出力する。これはつまり、例えば、100kS/sサンプリングレートでのパルス幅2sの測定データのケースでは、対数時間軸に対して等間隔の20点/桁でリサンプリングする。
<クロノポテンショグラム(CP)の正規化>
一般に、電流パルス印加に対する過渡応答波形は、測定時の電池温度(T)、印加する電流パルスの波高(h)、波幅(τ)およびくり返し数によって異なる。このため、種々の計測条件下でも統一的な評価を可能にするために、指標パラメータを用いる。つまり、パルスを印加前から印加終了後も一定時間にわたって計測された電流値と電圧応答値とから計算された見かけの過渡応答抵抗関数に正規化して上記指標パラメータとする。この方法により、印加する電流パルスの波高や波幅の異なる計測条件で得られる上記過渡応答を同じ座標軸平面での特有のカーブ(正規化曲線)で表現できる。また、それらのカーブのデータベース化を行う。さらに、そのデータベースのデータを生データ(ダウンサンプリング後の時系列データ)として、SOHとの相関モデルを作成し、そのモデルから電池診断、つまりSOH、TおよびSOCの推定、を行う。
一般に、電流パルス印加に対する過渡応答波形は、測定時の電池温度(T)、印加する電流パルスの波高(h)、波幅(τ)およびくり返し数によって異なる。このため、種々の計測条件下でも統一的な評価を可能にするために、指標パラメータを用いる。つまり、パルスを印加前から印加終了後も一定時間にわたって計測された電流値と電圧応答値とから計算された見かけの過渡応答抵抗関数に正規化して上記指標パラメータとする。この方法により、印加する電流パルスの波高や波幅の異なる計測条件で得られる上記過渡応答を同じ座標軸平面での特有のカーブ(正規化曲線)で表現できる。また、それらのカーブのデータベース化を行う。さらに、そのデータベースのデータを生データ(ダウンサンプリング後の時系列データ)として、SOHとの相関モデルを作成し、そのモデルから電池診断、つまりSOH、TおよびSOCの推定、を行う。
また、上記正規化曲線に電池反応をシュミレーションする擬似等価回路をフィッティングして、その疑似等価回路の各種パラメータを求める。これは電池反応の経時変化の解析に最適なものであるので、その各種パラメータをデータベース化して、二次電池のSOHやSOC等の診断に活用することができる。
<実施例>1
<実施例>1
解析のための擬似等価回路およびその理論式
LIBの場合の擬似等価回路を図13に示す。この擬似等価回路では、上記定電流パルス法は直流法である性質上、その定電流パルスの印加と同時に図13に示した解析用の擬似等価回路の全ての素子が動作を開始し、各素子の応答電圧の総計が過渡応答電圧として出力されると見做すことになる。
LIBの場合の擬似等価回路を図13に示す。この擬似等価回路では、上記定電流パルス法は直流法である性質上、その定電流パルスの印加と同時に図13に示した解析用の擬似等価回路の全ての素子が動作を開始し、各素子の応答電圧の総計が過渡応答電圧として出力されると見做すことになる。
また、図12に、上記定電流パルスを印加したとき得られる電圧過渡応答における上記疑似等価回路の各要素パラメータの時間軸上での寄与を表す概念図を示す。上記疑似回路の各素子は固有の時定数を持つため、時間軸に並べてみるとその寄与の変遷を知ることができる。図12(a)から、L成分応答が十分に減衰した後で、未だRC回路群やワールブルグ要素からの応答が微小であるために、その影響を無視できるような時間帯が存在すると推定できる。
従来のパルス法での計測からは、図12(c)の実線に示すようなナイキストプロットが得られる。しかし、この結果を交流法での解析結果(図中+印で示す)と較べると、半円部は類似しているものの、両者の解析結果は一致していないことが多い。
その原因は、上記パルス法や交流法で得られる計測データから、図13に示す解析用等価回路の各成分を求めることで明らかになった。つまり、R0、L1R1、RnCn(n=2~5)、W6、Cint成分を求めると、上記パルス法と交流法とで食い違いが顕著であった。これから、上記の測定法から得られたデータでは、図12(a)の時間軸上での各要素パラメータの関与に問題があることが分かった。
特に、交流法との比較を行うと、本発明の適用で得られるCP応答では、R0、L1R1、W6、Cint成分の解析評価が重要因子となる。すなわち、一般の交流法のインピーダンススペクトルの測定は、周波数応答解析装置(FRA: Frequency Response Analyzer)を用いており、電流または電圧の正弦振幅を充電方向および放電方向の交互に連続的に測定系に印加する手法であることから、観測されるインピーダンス出力は定常状態の電気化学現象から誘起されることになる。
一般に、直流パルス法では、印加するパルスの条件を選ぶことにより、L成分や電位ヒステリシス現象の影響を最小化できる。また、印加パルスによるCP応答の同一性を確かめるために、CP応答を正規化した曲線を作成して、その曲線のシミュレーションからR0、L1R1、W6、Cint成分を含めた各パラメータ値を精度良く求める。
そのために、先ず、パルス過渡応答解析に必要と考えられる印加パルス幅(時間幅)に適合した等価回路モデルとその解析式を算出する。ここで、良好な全体的な評価精度の向上を達成するために、EIS(Electrochemical Impedance Spectroscopy:電気化学インピーダンス解析)によって測定された全ての周波数帯の範囲でのモデル化する事が究極であるが、低周波数帯での電圧損失寄与の解析においては前記のヒステリシス現象の影響を考慮する必要が生じるので、本実施例ではこの低周波数帯(≦5mHz)に対応する時間帯は除外し、そこでの実験や詳しい解析は一旦除外する。
ただし、LIBの全電池反応を表す最適な擬似等価回路(図13)の選定を行うために、(イ)時定数から考えた超高速領域(十から数百μ秒)での抵抗成分とリアクタンス(ωL)成分、(ロ)高速および中速領域(数m秒から数秒)での電極反応速度成分のWarburg(ワールブルグ;W)因子および(ハ)低速および極低速側での電池容量の充放電反応のキャパシタンス(Cint)成分パラメータを考慮した評価は行う。このような評価は、これまで殆ど行なわれてこなかった。これらの因子も考慮した上記疑似等価回路を用いることは本発明の特徴の1つである。
本実施例の解析では、伝送線路モデルより複雑でなくフィッティングの信頼度および品質は十分であると推定できる解析用等価回路を採用する。図13はこの一1例である。ただし、上記解析のフィッティングでは、汎用のCPE(constant phase element)という手法でなく、下記方法を用いる。
上記CPE手法は、市販ソフトウェアを使うもので、学術分野で広く用いられてきているが、その係数の関わる科学的現象の物理化学的意味が明確でない。このために、ここでは上記CPE手法を採用せずに、RC(抵抗成分、容量成分)因子数の増減によりフィッティング精度を向上させる手法を用いる。
この実施例では、まず、測定時の温度(T)、印加する定電流パルスの大きさ(h)、パルス幅(τ)について、異なる測定条件下で統一した評価ができるようにするため、統一的な評価を可能にするための指標パラメータとして、パルス印加前後の電流値と電圧の過渡応答値から計算された過渡抵抗を用いる。また、測定データ点数が膨大となるため、データリサンプリングを行う。
このデータリサンプリングでは、CP特性の特徴を失わないように対数時間軸上でほぼ等間隔となるような計測データの削減を行った。また、選定データを規格化してCPデータとしたデータベース(DB)を作成した。
一般に、図13に示す解析用等価回路での直流の電流-電圧-時間曲線は数1で示すことができる。また、その解析用等価回路のインピーダンスの理論式は数2で示すことができる。その実数部と虚数部は、それぞれ数3のZ′とZ″であり、数4は数1におけるW6で、上記のワールブルグ因子に相当する。


これらの式を用いる電池の状態診断においては、まず、上記の方法に沿って電池特性の詳細な解析や評価を行い、二次電池の使用履歴に伴う劣化因子、測定時温度および状態診断因子を選定し明確化する。これにより、劣化、温度または状態診断因子と各種パラメータ値との相関性を把握することができる。
次に、上記の各種パラメータの各々のデータのSOH、TおよびSOCに関する依存性を調べて、適切な相関式を導出する。このためには、例えば、機械学習法に基づき、5%以内の診断精度を得る。すなわち、電池のSOH、T、SOC、およびSOLを高精度で評価する手法を提供することができる。
次に、定電流パルスに対する過渡応答の解析方法を説明する。図4に示すように、パルス印加直前の電圧をE0および電流をI0とすると、定電流パルス印加後の経過時間tにおける変化分の電圧値および電流値をそれぞれv(t)およびu(t)で表すと、数5となる。

時間tでの見かけの抵抗値が先述の見かけの過渡応答抵抗関数ATRF(t)であって、これは、オームの法則に従って、ATRF(t)=v(t)/u(t)として算出できる。
このATRF(t)値は、先の理論的解析式の数1を用いて数6のように表すことができる。

このATRF(t)値は、下記の規格化により、同じ被計測電池について、定電流パルス印加の実験条件によらず一本の解析曲線として観察されるという特長がある。
また、単一の定電流パルスがτ時間の長さ印加された後に遮断された場合については、逆向きの定電流パルスが印加されたものとして、数6をその遮断後の領域にまで拡張することができる。つまり、数7(数6と区別する必要があるときは、「拡張されたATRF」と呼ぶ)として適用が可能である。数7を用いるこのCP解析法でもデータの規格化が可能になる。

また、複数の単一パルスからなる一連の定電流パルスについても、数6をその遮断後の領域にまで拡張することで取り扱うことができる。
異なる劣化パターン履歴電池の時系列データの蓄積
測定時の温度(T)、パルスの大きさ(h)、パルス幅(τ)等についての異なる測定条件下でも統一した評価ができるようにするため、(イ)定電流パルス印加前後のその定電流パルスの電流値と、その定電流パルスに対する電圧の過渡応答値から計算されたATRF(t)値をDBに記録する。また、(ロ)μ秒オーダーのサンプリングでは測定データ点数が膨大となるため、測定データ点数減縮を、CPの特徴を失わないように対数時間軸上でほぼ等間隔となるように行うことで計測データの削減を行う。さらに、(ハ)その計測データから選定した選定データについて、それを規格化したデータのDBを作成する。また、(ニ)解析用等価回路の構成因子のパラメータに変換したDBも作成する。この際に、(ホ)等価回路パラメータのDB作成では規格化カーブのフィッティングに最小二乗法を適用して最適値を決める。(ヘ)作成したDBにおいて、時間、温度、充電度と劣化度の相関式を導出し、(ト)この相関式を基礎とする機械学習を行い、(チ)劣化度、温度および充電度の評価法としての最小二乗法誤差評価により、本手法の有効性を実証することができる。
測定時の温度(T)、パルスの大きさ(h)、パルス幅(τ)等についての異なる測定条件下でも統一した評価ができるようにするため、(イ)定電流パルス印加前後のその定電流パルスの電流値と、その定電流パルスに対する電圧の過渡応答値から計算されたATRF(t)値をDBに記録する。また、(ロ)μ秒オーダーのサンプリングでは測定データ点数が膨大となるため、測定データ点数減縮を、CPの特徴を失わないように対数時間軸上でほぼ等間隔となるように行うことで計測データの削減を行う。さらに、(ハ)その計測データから選定した選定データについて、それを規格化したデータのDBを作成する。また、(ニ)解析用等価回路の構成因子のパラメータに変換したDBも作成する。この際に、(ホ)等価回路パラメータのDB作成では規格化カーブのフィッティングに最小二乗法を適用して最適値を決める。(ヘ)作成したDBにおいて、時間、温度、充電度と劣化度の相関式を導出し、(ト)この相関式を基礎とする機械学習を行い、(チ)劣化度、温度および充電度の評価法としての最小二乗法誤差評価により、本手法の有効性を実証することができる。
また、上記の時系列の計測データの蓄積を行うために、計測対象電池を、種々の環境下(高温、低温、放置、継続、高レートでの使用)に晒し、充放電特性の劣化を誘起しつつ、その環境下にある各々の電池のATRF(t)特性を測定する事が望ましい。これにより、本発明の診断方法を適用できる二次電池の使用状況範囲を拡張することができる。
使用履歴を持つ電池のATRF(t)パラメータのデータベース化
図2に、以下の説明で想定するATRF(t)パラメータのデータベース化のフローチャート例を示す。図2は、正規化関数(ATRF)のデータベース作成および機械学習による診断アルゴリズム式(SOH、温度、SOC、SOP、及びSOLの単数各因子または複数因子)の作成およびそれらの診断器への搭載のフローチャートである。このフローチャートの各ステップでは、以下の手続きを行う。
START: 開始
G0: 被検電池の設定を行う。
G1: 温度の設定を行う。
G2: 充放電特性試験を行う。
G3: SOH値算出を行う。
G4: SOC値の設定を行う。
G5: パルス印加による応答測定(電流・電圧・温度・時間)を行う。
G6: 正規化関数(ATRF)算出を行う。
G7: データの集積および選択を行い、G1に戻って繰り返す。所定のデータ数が集積できた時に、次のステップに移行する。
G8: データベース(各因子(SOH、温度、SOC、SOPおよび英G9: 機械学習(アルゴリズム関数の作成)を行う。
G10: アルゴリズム関数を診断機へ搭載する。
STOP: 停止
本発明の電池診断方法では、(イ)定電流パルス印加によって得られた膨大なデータ(1個の電池でも温度とSOCを変えた条件下で測定。例えば、19×21=399点以上、図11参照)について、(ロ)正規化CP応答からのATRF(t)パラメータのデータベース(DB)化、およびこのDBを用いたカーブフィッティングにより解析用等価回路の各種パラメータの値を求める。(ハ)そのパラメータの持つ物理化学的意味を考察する。また、(ニ)電池特性の詳細な解析・評価を遂行し、履歴に依存した容量劣化のマーカー因子を選定し明確化することにより、(ホ)劣化と正規化計測データや各種パラメータ値との相関性を把握する。
但し、上記測定は、同一条件下にある複数の電池で行ない、その再現性も確かめる。また、計測対象電池を、種々の環境下(高温、低温、放置、継続、高レートでの使用)に晒し、充放電特性の劣化を誘起し、その状態下にある各々の電池のATRF(t)データやインピーダンス特性を測定し、前記と同様の解析を行なう。こうして、各種パラメータ値の温度依存性および劣化パターン(高温履歴、低温履歴、高速レート充放電)依存性を把握し、診断のための精度を高める。また、データベース化する対象の汎用電池を電池材料、メーカーやサイズを変えて複数選び、本発明の診断法の汎用性を高めることができる。
また、種々の使用環境下にあった二次電池の劣化履歴の該当特性のデータベース化を行って活用することで、診断アルゴリズムの精度の検証やその改善を行うことが容易になる。
機械学習による診断
前記の測定データのDBを用いた機械学習的SOH、温度(T)およびSOC診断を行うことは、例えば、特許文献1に記載された交流インピーダンス法を用いた診断手法を本発明に適用することで行うことができる。
前記の測定データのDBを用いた機械学習的SOH、温度(T)およびSOC診断を行うことは、例えば、特許文献1に記載された交流インピーダンス法を用いた診断手法を本発明に適用することで行うことができる。
したがって、解析用として、定電流パルス法と交流インピーダンス法との両測定法に共通の擬似等価回路を用いて、両測定法で得られた等価回路パラメータを劣化診断として用いる診断アルゴリズム、および擬似等価回路パラメータに変換をせずに、その生データベースと電池劣化との相関性を機械学習した診断アルゴリズムによって、上記両測定法の比較を行い、劣化度を高速かつ高精度で数値評価できること示すことができる。
SOH、TおよびSOC値推定の機械学習
(その1)等価回路パラメータを用いた相関モデルの学習
インピーダンス特性からの等価回路パラメータを用いたSOH評価を行う場合に、インピーダンス値のデータベース化を行い、それを劣化診断アルゴリズムに用いることは有効である。この有効性は、例えば特許文献1に示されており、これは、上記インピーダンス値のデータベースの情報を基に、最近の情報工学の進展を導入した機械学習法による劣化診断用アルゴリズムを用いたものである。
(その1)等価回路パラメータを用いた相関モデルの学習
インピーダンス特性からの等価回路パラメータを用いたSOH評価を行う場合に、インピーダンス値のデータベース化を行い、それを劣化診断アルゴリズムに用いることは有効である。この有効性は、例えば特許文献1に示されており、これは、上記インピーダンス値のデータベースの情報を基に、最近の情報工学の進展を導入した機械学習法による劣化診断用アルゴリズムを用いたものである。
上記SOH、TおよびSOC値推定では、機械学習法のカーネルモデルの入力ベクトルとして、3つの場合について検討した。つまり、(イ)インピーダンス特性のデータベース(DB)を用いた場合、(ロ)そのインピーダンス特性から計算された等価回路パラメータのDBを用いた場合、および(ハ)定電流パルス法で得られたCPから計算された正規化データやその解析等価回路パラメータのDBを用いた場合、のそれぞれの結果について検討を行い、定電流パルス法で最適で実用的な劣化度、測定時温度および充電度の評価方法を選定した。
(その2) 計測生データを用いた相関モデルの学習
本機能の目的は、(イ)定電流パルスへの応答のCP生データ(ノイズ処理およびダウンサンプリング後の時系列データ、およびインピーダンスデータ)とSOH、TおよびSOCとの相関モデルを構築し、(ロ)そのモデルからSOH、TおよびSOCを推定することである。ここで作成の機械学習法用のプログラムでは、相関モデルとしてカーネルモデルを使用する。そして、生データならびに計測時の温度を上記カーネルモデルの入力とし、SOH、TおよびSOCを出力として教師学習を行う。
本機能の目的は、(イ)定電流パルスへの応答のCP生データ(ノイズ処理およびダウンサンプリング後の時系列データ、およびインピーダンスデータ)とSOH、TおよびSOCとの相関モデルを構築し、(ロ)そのモデルからSOH、TおよびSOCを推定することである。ここで作成の機械学習法用のプログラムでは、相関モデルとしてカーネルモデルを使用する。そして、生データならびに計測時の温度を上記カーネルモデルの入力とし、SOH、TおよびSOCを出力として教師学習を行う。
カーネルモデルは求めるべきパラメータに関して線形となるため、最小二乗法を用いることで解析的に解が求まる。カーネルモデルの数式、および学習の計算式はここでは略する。
生データとしてダウンサンプリング後の時系列データを用いた場合、各データのサンプリング時刻を合わせる必要がある。そこで、本作成プログラムでは、平滑化スプライン補間を用いてデータのサンプリング時刻を一致させる。
<実施例2>
<実施例2>
パルス測定の最適化条件の選定
直流パルスの過渡応答(CP)の高精度な計測を実現するために、電位ヒステリシス現象および熱変化の影響を軽減、または避けるための計測条件の設定を行う必要がある。そのための実験的検討を行った。ここでは、18650円筒型三元系金属酸化物正極とグラファイト負極から成るLIB電池(A社製の容量;2,200mAh)、および26650円筒型オリビン鉄正極とグラファイト負極から成るLIB電池(B社製の容量;3,000mAh)、及びラミネート角型三元系金属酸化物正極とグラファイト負極から成るLIB電池(C社製の容量;240mAh)に関する検討結果について記載する。図5では、パルス幅が2秒と10秒で、印加電流値を2.00A(0.67Cレート相当)としたパルス設定条件の結果である。この条件下では、充電や放電モードの同一方向にパルスを印加した場合に、印加を終了後2分経過時のE(0)値の変化として1~2mVの相違を観察した。同一方向にパルスを印加した場合のE(0)値の挙動は、異なる電池系で測定された実験結果の挙動でも類似であった。
直流パルスの過渡応答(CP)の高精度な計測を実現するために、電位ヒステリシス現象および熱変化の影響を軽減、または避けるための計測条件の設定を行う必要がある。そのための実験的検討を行った。ここでは、18650円筒型三元系金属酸化物正極とグラファイト負極から成るLIB電池(A社製の容量;2,200mAh)、および26650円筒型オリビン鉄正極とグラファイト負極から成るLIB電池(B社製の容量;3,000mAh)、及びラミネート角型三元系金属酸化物正極とグラファイト負極から成るLIB電池(C社製の容量;240mAh)に関する検討結果について記載する。図5では、パルス幅が2秒と10秒で、印加電流値を2.00A(0.67Cレート相当)としたパルス設定条件の結果である。この条件下では、充電や放電モードの同一方向にパルスを印加した場合に、印加を終了後2分経過時のE(0)値の変化として1~2mVの相違を観察した。同一方向にパルスを印加した場合のE(0)値の挙動は、異なる電池系で測定された実験結果の挙動でも類似であった。
より詳細には、図5は、電流パルスを一方向へ繰り返し印加後のOCV値の変化を表す電位ヒステリシス現象の実例である。パルス幅(5.0s)、波高(2.0A)の影響、5回の繰り返し、(電気量:±0.95C)、待ち時間(120s)測定温度25℃ (18650型LIB(2,200 mAh))である。
次に、充電や放電モードを逆転させた逆方向にパルスを印加した場合に、印加を終了後1分経過時のE(0)値の変化として10mV以上の相違が観察された。図6には、電流パルス方向の反転を繰返し印加した場合のパルス印加終了60秒後のOCV値(E(0))の変化を示す。この実験から、パルス方向により電圧は上下に振れ、かつその大きさはパルス高さおよび幅に依存することが分かった。
より詳細には、図6は、電流パルスを繰り返し印加後のOCV値変化(電流パルスを充電と放電方向で繰り返した場合で、印加時間及び印加電流値を変えた時の応答)を表す電位ヒステリシス現象の実例である。パルス幅(0.2、0.5、1s)、波高(1、2、3、4A)の影響、(電気量:±0.2~±3.0C)、待ち時間(60s)測定温度5.1℃、SOC50%、SOH0.95、(26650型LIB(3000mAh))である。
この図から、パルス高さの電流値がレート2Cの値で、かつ1秒間のパルス印加により10mV程度の振れが観測された。このことから、印加パルスの高さ、すなわち電流値の大きさに関する電位メモリー効果および温度変化の影響について調べた。ここでは、パルス幅として2秒印加した場合で、印加電流値の大きさは、0.37から11.1Cレートで行った。それぞれの印加電流値で得られたCP応答を正規化データ(ATRF(t)項)に変換して得られた曲線を図7に示すが、印加電流が3.7 Cレート値まではATRF(t)曲線は良く重畳した。
高レートでは、レートの上昇とともにATRF(t)の値は徐々に減少することが分かった。この原因はATRF(t)項に関する電位ヒステリシス現象の誘起および温度の影響として解釈が可能である。 5.5から11.1Cまでレートを上げると、2秒印加後の温度変化は、2.0から7.0℃まで上昇した。ここで、5.5 CレートでのATRF(t)値の減少率は約5%であったので、印加電流値は5Cレート以下の電流を選ぶべきと判断した。
図7は、0.37から11.1Cレートまでの負電流パルスの印加実験検討を行い、それぞれの印加電流値で得られたCP応答をATRF(t)項に変換して得られた曲線の変化を示す。ここで、パルス幅2s印加、測定温度25℃、試験セル;SOH1.00、SOC100% (角型5552524型LIB(270mAh)である。
<実施例3>
<実施例3>
上述の機械学習法の診断アルゴリズムについては、以下に説明するように、特許文献1に記載に沿ったものを適用することができる。つまり、本発明に係る電池診断装置は、機械学習の手法として最小二乗法を基本とした劣化度値計算部により劣化度値を直接計算して推定することができる。
なお、本発明での機械学習は、特許文献1に記載の方法に準じるものであるが、特許文献1の変数として計測インピーダンスデータまたはそのインピーダンスから解析された擬似等価回路パラメータ値データの代わりに、変数として印加パルス過渡応答を正規化しダウンサンプリングし平滑化した時系列正規化データ(ATRF(t))またはその過渡応答から解析された擬似等価回路パラメータ値データを用いる。
次に、本発明の電池診断方法について説明する。当該方法では、例えば、劣化度値計算部が最小二乗法により劣化度値の線形係数を学習し、劣化度値を直接計算して推定する。
このためには、まず図3に示すフローチャートに沿ってSOH値(劣化度値)が既知でATRF(t)が計測されたまたはその解析等価回路パラメータが知られた被検電池について、SOH値に対するカーネル係数の推定値αを計算して学習する。次に、この推定値αを実装したSOH推定アルゴリズムを構築する。このアルゴリズムを用いてSOH値が未知の被検電池について、計測したATRF(t)またはその解析等価回路パラメータに対するSOH値を計算する。この方法により、計測ATRF(t)またはその解析等価回路パラメータから直接的に電池の劣化判定ができる。
より一般的なものとして、カーネルモデルを用いて計測ATRF(t)またはその解析等価回路パラメータxから劣化度値yを判定する方法を具体的に説明する。
yは次の一次元カーネル関数K(x,xi)の線形結合で近似することができる(数8及び9)。この係数αは入出力データx、yより学習により最小二乗法で決定できる。


ベクトル表現にすると、以下のように表される。


数13から数15により、二乗誤差が最小になるように係数の推定値αを学習する。


学習された係数の推定値αを用いて、数12から推定値yk(SOH、TおよびSOCなど)を推定できる。
上記では、最小二乗法により劣化度値の線形係数を学習し、劣化度値を直接計算して推定する方法を解説したが、機械学習の手法として最小二乗法を基本としたパターン分類アルゴリズムを備える最小二乗確率的分類器を診断に用いることもできる。
このための最小二乗確率的分類器は、図3のG1からG6に示す処理で、まず学習アルゴリズムにより劣化度値が既知のATRF(t)またはその解析等価回路パラメータから、幾つかの分類カテゴリーに対するガウスカーネル係数の推定値α(y)を計算して学習する。次に、図3のG8からG10に示す処理で、この様にして求めたガウスカーネル係数の推定値α(y)を実装した分類アルゴリズムを構築する。このアルゴリズムを用いて劣化度値が未知の電池の計測インピーダンスが各分類カテゴリーに属する事後確率p(y|x)を計算でき、分類カテゴリーyを推定することができる。この方法により、図2のF5で計測CP応答から得られたATRF(t)またはその解析等価回路パラメータを用いて電池の劣化判定ができる。
<実施例4>
<実施例4>
パルス測定データの平滑化及び圧縮化の処理
インダクタンス(L)成分による影響を最小限とした抵抗値(R0、およびR1)を算出可能な超高速領域でのパルス測定条件を検討した。ここでは測定されるパルス過渡応答に重畳するノイズを除去して真の応答信号を抽出するためのソフトウェアの選択と改良を行い、そのソフトウェアを用いたデータ処理法を確立した。さらに、パルスの計測時間帯に依存するが、サンプリングレートにより計測データの容量が膨大になることから、解析を高精度で簡便に実行するためのデータリサンプリング法を検討した。まず、パルス過渡応答波形の重畳ノイズを除去するための変化点検出機能および平滑化機能の開発を行い、真の応答信号を抽出するためのデータ処理法を確立した。平滑化ではスプライン法によるスプライン曲線を作成してデータ処理を行った。それと同時に、容量が膨大となる計測データを圧縮平滑化するプログラムの作製を行った。過渡応答測定データから、20~100点/桁でリサンプリングすると同時にデータの間引き区間内で信号を平滑化することとした。これらにより、信号のノイズレベルの低減とデータ数量の低減を図った。得られたダウンサイズドデータは、ヘッダー情報を追加してcsv形式ファイルで出力する。100kS/sのサンプリングレートでの測定データのケースで、対数時間軸に対して等間隔の20~90点/桁でリサンプリングし、データの間引き区間内で信号を平滑化して、ノイズの除去程度の検討を行った。考案した試作の計測処理ソフトウェアの機能に関して、その実験的検証では、前述の表3に示したLIBで行った。その実施結果の例については、図8に図解した。
インダクタンス(L)成分による影響を最小限とした抵抗値(R0、およびR1)を算出可能な超高速領域でのパルス測定条件を検討した。ここでは測定されるパルス過渡応答に重畳するノイズを除去して真の応答信号を抽出するためのソフトウェアの選択と改良を行い、そのソフトウェアを用いたデータ処理法を確立した。さらに、パルスの計測時間帯に依存するが、サンプリングレートにより計測データの容量が膨大になることから、解析を高精度で簡便に実行するためのデータリサンプリング法を検討した。まず、パルス過渡応答波形の重畳ノイズを除去するための変化点検出機能および平滑化機能の開発を行い、真の応答信号を抽出するためのデータ処理法を確立した。平滑化ではスプライン法によるスプライン曲線を作成してデータ処理を行った。それと同時に、容量が膨大となる計測データを圧縮平滑化するプログラムの作製を行った。過渡応答測定データから、20~100点/桁でリサンプリングすると同時にデータの間引き区間内で信号を平滑化することとした。これらにより、信号のノイズレベルの低減とデータ数量の低減を図った。得られたダウンサイズドデータは、ヘッダー情報を追加してcsv形式ファイルで出力する。100kS/sのサンプリングレートでの測定データのケースで、対数時間軸に対して等間隔の20~90点/桁でリサンプリングし、データの間引き区間内で信号を平滑化して、ノイズの除去程度の検討を行った。考案した試作の計測処理ソフトウェアの機能に関して、その実験的検証では、前述の表3に示したLIBで行った。その実施結果の例については、図8に図解した。
これらの結果より、平滑化によりノイズが除去できていることが確認できた。また、本データ処理により、その後のデータの取り扱いも秒速で実現できた。ダウンサンプリングによって得られたデータ数の結果の一例を表2に示す。

図8は、計測データのリサンプリング例を示す図であり、この例では時間軸の対数において間隔が等しくなるようにリサンプリングをする。ここでは、パルスの過渡応答(CP)計測データに、変化点検出機能及び平滑化機能の処理法を適用して重畳ノイズを除去し、かつダウンサンプリング処理を行い、真の応答信号を抽出したデータ点を示す。(測定温度25℃、パルス幅2s、波高-2A、SOH=0.982、SOC=50%、(18650LIB(2200mAh))
<実施例5>
<実施例5>
CP過渡応答からの正規化カーブの算出
表3のセル番号1に示した18650型LIBで劣化パターンが異なる電池についての解析結果の一部を以下に記載する。図9のCP過渡応答は印加パルス幅が0.2秒から10秒の波高2Aで連続して測定した結果のATRF(t)プロット解析を行い、同一のATRF(t)vs.log(t)軸グラフに載せたものであり、パルス幅が10倍違う両者の測定結果は完全に一致していることがわかった。このことから見かけの過渡抵抗関数(ATRF(t))解析が有効であることを見いだした。すなわち、本応答の解析から得られる各種パラメータ値は、パルス幅に依存せずに同じ値となることがわかった。図10は、図9に示したLIBのATRF(t)プロットのSOC依存性を示す。本測定対象電池では、SOCが0.25以下でATRF(t)カーブが著しく変化することが分かった。
表3のセル番号1に示した18650型LIBで劣化パターンが異なる電池についての解析結果の一部を以下に記載する。図9のCP過渡応答は印加パルス幅が0.2秒から10秒の波高2Aで連続して測定した結果のATRF(t)プロット解析を行い、同一のATRF(t)vs.log(t)軸グラフに載せたものであり、パルス幅が10倍違う両者の測定結果は完全に一致していることがわかった。このことから見かけの過渡抵抗関数(ATRF(t))解析が有効であることを見いだした。すなわち、本応答の解析から得られる各種パラメータ値は、パルス幅に依存せずに同じ値となることがわかった。図10は、図9に示したLIBのATRF(t)プロットのSOC依存性を示す。本測定対象電池では、SOCが0.25以下でATRF(t)カーブが著しく変化することが分かった。
図9は、印加電流のパルス幅を変えて波高一定(-2.00A)で連続して測定した時に得られるATRF(t)のlog(t)に対するプロットを示す。波高-2A、パルス幅;(a)0.2s,0.5s,(c)1s,(d)2s,(e)5s,及び(f)10s、25℃で測定、(18650LIB(2200mAh)、SOH=0.982、SOC=50%)である。
また、図10は、ATRF(t)に関するSOC依存性を示す。波高-2A、パルス幅(2s及び10s)、及び25℃で測定、(18650LIB(2200mAh)、SOH=0.982、SOC=50%)である。
<実施例6>
<実施例6>
異なる劣化パターン履歴電池特性の時系列データの蓄積
計測対象電池を、種々の環境下(高温及び低温での充放電のサイクル使用、高レートでの充放電のサイクル使用、放置)に晒し、充放電特性の劣化を誘起し、その状態下にある各々の電池のTDRF(t)特性を図11に示した温度及びSOCの条件で測定しデータベース(DB)化する。
計測対象電池を、種々の環境下(高温及び低温での充放電のサイクル使用、高レートでの充放電のサイクル使用、放置)に晒し、充放電特性の劣化を誘起し、その状態下にある各々の電池のTDRF(t)特性を図11に示した温度及びSOCの条件で測定しデータベース(DB)化する。
図11は、ATRF(t)に対するSOCと温度との依存性に関するデータベース化を示し、各々の劣化状態(SOH)についてファイル化する。また、ATRF(t)の解析で求めた等価回路パラメータ値に関するデータベースのファイル化も行う。よって、各劣化状態での測定(例:少なくとも6状態での測定で、単電池の測定点数は(=19(Temp)×21(SOC)×6(SOH))で2394本となるまた、再現性チェック(例:少なくとも4セル)から9576本の計測データとなることが分かる。
図12において、(a)は電池に印加される定電流パルスとそのクロノポテンショグラム(CP)応答、(b)はその正規化カーブ(ATRF(t))への変換、(c)はATRF(t)のシミュレーション解析で得られた等価回路パラメータ値を使って作成されたナイキストプロット例を示す図である。ただし、上記(a)及び(b)に記載の応答領域のI~Vは、図13に示す等価回路パラメータのCP応答への主な寄与を表している。
図13は、クロノポテンショグラム(CP)の解析のために用いられる電池の全電極反応機構の等価回路モデリング(ECM)を表す。ただし、ここではフィッティングにはCPE(Constant Phase Element)という手法を用いない。
解析に必要な等価回路モデルとして、リチウム二次電池(LIB)の電解液、正極、及び負極要素因子に対応するように、抵抗RとインダクタンスLに複数のRC並列回路ブロックを連結した回路を想定した。図13で示したRとCとの並列回路を2から6個まで連結した擬似等価回路(略式表現;〈R0_RnCn(n=2~5)_L1R1_CintRint〉)でのシミュレーション解析をCPEの有無を含めて行った。
評価結果は省略するが、RC並列回路2または3個の等価回路モデル(n=2または3)場合には、そのシミュレーションカーブはCPEを使用しないと実測値のカーブとフィットさせることができないが、並列回路4個の場合(n=4)場合ではCPEの有無に拘わらず良好なフィッティングが可能であった。その結果、CPE(Constant Phase Element)パラメータを使用しない場合でも4個連結したモデルの適用で劣化診断には十分であると結論した。
図14に、等価回路モデル〈R0_RnCn(n=2~5)_L1R1_CintRint〉でのパラメータ評価によるナイキストプロットのRC段数(n)依存性を示す。上段は交流インピーダンス測定からの実測データからのプロット結果(+記号)及びそのフィッテングカーブを示しており、下段はATRF(t)(パルス測定条件;電流;1.00A、印加時間;2.00秒)の等価回路解析で得られたパラメータ値を用いたシミュレーションカーブを示す。ただし、下段の+記号のカーブは、上段の同記号カーブと同じで、比較のために記載した。測定セル;18650型LIB(2200m Ah)、SOH=0.953、SOC=50%、測定温度25℃。
図14から明らかなように、交流インピーダンスおよびCP応答から得られたナイキストプロットでは、円弧の部分では比較的よい一致を示した。ここで、高および中周波数での電圧変化の挙動の解析に最適な擬似等価回路は、RCnのnが4または5であることが分かった。ただし、両測定ではいくつかの回路パラメータ因子の抵抗値およびキャパシタ値には差が存在することがわかった。特に、R0について、交流インピーダンス測定からの結果およびCP応答からの結果に違いが見られた。一般に、高周波数での誘導的挙動は、セル本体、測定系のセットアップ、およびケーブル接続に起因する。オーム抵抗R0は、X軸との交点にほぼ対応すると理解されている。ただし、カソードまたはアノードと集電体の間および粒子間の高周波帯の接触プロセスには、同じ周波数で起こる接触損失のインダクタンスが重畳することから、真のR0の識別化が難しくなる。ここでは、高周波数帯の誘導的挙動については、インダクタンスL1と抵抗R1の並列回路を用いた。
CP応答の規格化から得られたATRF(t)プロットでの等価回路フィッティング解析については、サンプル番号1のLIB電池解析結果の一例を図15に示した。
ATRF(t)プロットでの等価回路パラメータフィッティングを示すが、評価に用いた等価回路モデル〈R0_RnCn(n=2~5)_L1R1_CintRint〉は図14であり、パラメータフィッティングのRnCnのn依存性(n=2(上段左)、n=3(上段右)、n=4(下段左)、n=5(下段右))の結果を表す。ここで、シミュレーションカーブおよび実測ATRF(t)プロットの結果を示す。(測定条件:18650型LIB(2200mA),SOH=0.953、SOC=50%、測定温度25℃、パルス幅2s、波高-1A、サンプリンレート50kS/s)
このATRF(t)プロットでの最適な擬似等価回路は、並列回路4または5個の場合(n=4または5)であることが分かった。ここでは、数6で表される解析式に対してのフィッティングの結果を赤線カーブで示した。このときの二乗平均平方根誤差(RMSE)は1.35×10⁻⁴(n=5の場合)であった。
そのとき求められた等価回路パラメータの比較を行うと、いくつかの等価回路パラメータ因子の抵抗値およびキャパシタ値には両測定法で違いが見られた。その原因は、測定法の原理に起因していると推定される。すなわち、周波数掃引型の交流法では、一般に電流や電圧の印加外部信号は±に振幅され、電極反応に関する情報は反応の定常状態の緩和現象からインピーダンス特性を観察するのに対して、直流パルス法では電極反応に関する情報は電極反応の一方向(充電または放電方向)への推進現象、またはシャットダウンの場合は開放への緩和現象からインピーダンス情報を観察することになる。よって、RnCnパラメータの観察時間帯と重複するW6、Cint、L1、およびR0に対する観察感度が両方法では異なり、また外部信号の強さ、幅、および様式に依存して電池内部での発生熱挙動も異なり、それがRnCnパラメータの値に影響を及ぼしたと推定できる。
ただし、図15のパルス過渡応答の正規化カーブのフィッティングでは、E0の値はパルス印加直前の値、すなわちプレトリガー500点区間での線形性の近似値から求めた。
<実施例7>
<実施例7>
劣化電池のATRF(t)に対する温度依存性
図16には、表3のサンプル番号1のLIBについて、未劣化電池、低温下でのサイクル履歴劣化、および高温下でのサイクル履歴劣化が約25%進行した電池で得られたATRF(t)項曲線の温度依存性(5、25、および45℃)を示した。この図から、各温度でのATRF(t)曲線の形は、劣化履歴の違いにより異なってくることが明らかである。特に、低温では、その相違は著しくなることが分かる。低温下でのサイクル履歴劣化、および高温下でのサイクル履歴劣化の電池で得られたATRF(t)には、同一計測時温度でもその応答曲線には大きな相違があり、その等価回路解析を行った結果、W6、CintおよびR0などの各種パラメータ値に対する温度依存性に相違が見出された。ここでは、その結果については省略する。
図16には、表3のサンプル番号1のLIBについて、未劣化電池、低温下でのサイクル履歴劣化、および高温下でのサイクル履歴劣化が約25%進行した電池で得られたATRF(t)項曲線の温度依存性(5、25、および45℃)を示した。この図から、各温度でのATRF(t)曲線の形は、劣化履歴の違いにより異なってくることが明らかである。特に、低温では、その相違は著しくなることが分かる。低温下でのサイクル履歴劣化、および高温下でのサイクル履歴劣化の電池で得られたATRF(t)には、同一計測時温度でもその応答曲線には大きな相違があり、その等価回路解析を行った結果、W6、CintおよびR0などの各種パラメータ値に対する温度依存性に相違が見出された。ここでは、その結果については省略する。
ただし、上記結果はATRF(t) 温度依存性のDBを用いた機械学習法による電池特性の状態診断、特に温度推定の可能性を示すデータとなるが、その実施の推定結果については後述する。
図17は、CP過渡応答解析ATRF(t)項パラメータに対する温度依存性(5~45℃)およびSOH使用温度履歴を持つLIB(未劣化(左側)、低温劣化(中央)、高温劣化(右側))でのSOH依存性を示す。(劣化度はSOH=0.77で高温劣化LIB(2200mAh)と低温劣化LIB(2200mAh)とで同じ。測定温度5,25,45℃、パルス幅1s及び10s、波高-2A)
<実施例8>
<実施例8>
ATRF(t)に対するSOC依存性
図17には、表3のサンプル番号1のLIBについて、ATRF(t)に対する5~100%のSOCに対する依存特性を示す。この図から、SOCが25%以下ではATRF(t)に対するSOC依存性は大きくなっており、特に10ミリ秒より長い時間帯ではその差は顕著となることから、この時定数帯で応答する等価回路パラメータの温度依存性が大きくなっていることが分かる。
図17には、表3のサンプル番号1のLIBについて、ATRF(t)に対する5~100%のSOCに対する依存特性を示す。この図から、SOCが25%以下ではATRF(t)に対するSOC依存性は大きくなっており、特に10ミリ秒より長い時間帯ではその差は顕著となることから、この時定数帯で応答する等価回路パラメータの温度依存性が大きくなっていることが分かる。
上記結果は、ATRF(t)のSOC依存性のDBを用いた機械学習法による電池特性の状態診断、特にSOC推定の可能性を示すデータとなるが、その実施の推定結果については後述する。
図17は、ATRF(t)に対するSOC依存特性を示す。(18650型LIB(2200mAh)、SOH=0.983、SOC=5~100 (%)、測定温度25℃、パルス幅5s、波高-2A)
<実施例9>
<実施例9>
等価回路パラメータとSOHとの相関モデルの学習ソフトウェアおよびSOH推定
本発明手法による電池状態のSOH因子などの推定では、機械学習法のカーネルモデルを入力ベクトルとして、(1)インピーダンス特性のデータベース(DB)を用いた場合、(2)そのインピーダンス特性から計算された等価回路パラメータのDBを用いた場合、(3)パルス法で得られたクロノポテンショグラム(CP)特性の正規化データベース(DB)を用いた場合、および(4)その正規化データから計算された等価回路パラメータのDBを用いた場合のそれぞれの結果について検討を行い、本高速パルス法で最適で実用的な劣化度などの状態評価法を選定することとした。
本発明手法による電池状態のSOH因子などの推定では、機械学習法のカーネルモデルを入力ベクトルとして、(1)インピーダンス特性のデータベース(DB)を用いた場合、(2)そのインピーダンス特性から計算された等価回路パラメータのDBを用いた場合、(3)パルス法で得られたクロノポテンショグラム(CP)特性の正規化データベース(DB)を用いた場合、および(4)その正規化データから計算された等価回路パラメータのDBを用いた場合のそれぞれの結果について検討を行い、本高速パルス法で最適で実用的な劣化度などの状態評価法を選定することとした。
ここでは、解析評価得られた等価回路パラメータとSOHなどの電池特性状態因子との相関モデルを構築し、そのモデルからSOHなど因子の値を推定することである。推定プログラムでは、相関モデルとしてカーネルモデルを使用する。先ず、解析で得られた等価回路パラメータならびに計測時の温度をカーネルモデルの入力とし、SOHを出力として教師学習を行う。カーネルモデルは求めるべきパラメータに関して線形となるため、最小二乗法を用いることで解析的に解が求まる。カーネルモデルの数式、および学習の計算式は、別途、数8から数15に記載した。上記では、表3に示したLIBに関して本発明を適用してその検討を行った。構成材料が異なる電池系でもその特性の状態診断を行い、ほぼ同じ推定精度で結果が得られたために、その一例を順次以下の実施例で示すこととする。本推定法では、推定因子の平均二乗誤差(RMSE(Root Mean Square Error))を計算し、その手法の妥当性を判断する。ここでは、本手法の適用選定の基準値は、RMSEは0.05以下とする。本評価結果を表5にまとめて示した。

計測生データとSOHとの相関モデルの学習ソフトウェアおよびSOH値の推定
本発明手法による電池状態のSOH因子などの推定では、実験で得られたパルスのCP生データ(ダウンサンプリング後の時系列データ)及びその正規化データとSOHとの相関モデルを構築し、そのモデルからSOHを推定することである。推定プログラムでは、等価回路パラメータのDBを用いた場合と同様に相関モデルとしてカーネルモデルを使用する。そして、生データならびに計測時の温度をカーネルモデルの入力とし、SOHを出力として教師学習を行う。カーネルモデルは求めるべきパラメータに関して線形となるため、最小二乗法を用いることで解析的に解が求まる。ここで用いられるCP生データとは、計測データを前記載のようにダウンサンプリング処理、平滑化処理、及び正規化処理を行った時系列データを示す。ただし、生データ及び正規化データのダウンサンプリング処理後の時系列データを用いている場合、各データのサンプリング時刻を合わせる必要がある。そこで、本プログラムでは、平滑化スプライン補間法を用いてデータのサンプリング時刻を一致させる。
本発明手法による電池状態のSOH因子などの推定では、実験で得られたパルスのCP生データ(ダウンサンプリング後の時系列データ)及びその正規化データとSOHとの相関モデルを構築し、そのモデルからSOHを推定することである。推定プログラムでは、等価回路パラメータのDBを用いた場合と同様に相関モデルとしてカーネルモデルを使用する。そして、生データならびに計測時の温度をカーネルモデルの入力とし、SOHを出力として教師学習を行う。カーネルモデルは求めるべきパラメータに関して線形となるため、最小二乗法を用いることで解析的に解が求まる。ここで用いられるCP生データとは、計測データを前記載のようにダウンサンプリング処理、平滑化処理、及び正規化処理を行った時系列データを示す。ただし、生データ及び正規化データのダウンサンプリング処理後の時系列データを用いている場合、各データのサンプリング時刻を合わせる必要がある。そこで、本プログラムでは、平滑化スプライン補間法を用いてデータのサンプリング時刻を一致させる。
本発明の実施例9及び10の検討結果の一例を示す(表5参照)。ここでは、表3のサンプル番号1のLIBについてのSOH値の推定結果である。その際のRMSEを計算した。その結果、平均平方二乗誤差であるRMSEは、正規化データからの推定及び解析回路パラメータからの推定に関して、それぞれ0.014及び0.047であった。電池のSOHを推定確度5%以内(診断時間は2秒以内)で劣化診断できる手法を確立できたと結論できる。
表5はパルス応答CP(電流印加時)の正規化関数カーブ(ATRF(t))の正規化生データ、およびその解析で求めた擬似等価回路モデル〈R0_RnCn(n=4)_W6_L1R1_CintRint〉の各パラメータ値を時系列データに用いた機械学習的SOH推定のRMSE(50µs~0.5sデータを対数スケールで等間隔に90点生成、温度データ入力に使用しない、3回実行したときRMSE平均値/最小値/最大値の変化、18650LIB;SOH:1.00~0.60で高温劣化および低温劣化の履歴を持つ、温度:5~45℃、総数データ235個;学習データ117個及び評価データ118個)を示す。
<実施例11>
<実施例11>
電流印加時及び電流遮断時に計測したパルス応答を時系列データに用いたSOH推定
すでに図6には、電流パルスを充電と放電方向で繰り返した場合及び一方向へ繰り返し印加後のOCV値の変化を表す電位ヒステリシス現象を紹介した。よって、本手法では、この電位ヒステリシス現象の影響を避けるために、CP計測では電流パルスを一方向に印加してCP測定を行う様式とパルス電流遮断時のCP測定を行う様式を採用した。その妥当性を、取得したATRF(t)曲線で確認し、また、それらの時系列データを用いて機械学習的SOH推定を実施した。その検討結果の一例を表6に示す。これは、表3のサンプル番号1のLIBについてのSOH値の推定結果である。その際のRMSEを計算した。その結果、平均平方二乗誤差であるRMSEは、電流印加時及び電流遮断時の生データからの推定に関して、それぞれ0.011及び0.015であった。両方式が、電池のSOHを推定確度2%以内(診断時間は1秒以内)で劣化診断できる手法を確立できたと結論できる。ただし、ここでは正規化生データをカーネルモデルの入力としたが、この際に計測時の温度をカーネルモデルの入力に加えた場合でも加えない場合でも、SOHを出力とした教師学習の結果は同じで結果であった。
すでに図6には、電流パルスを充電と放電方向で繰り返した場合及び一方向へ繰り返し印加後のOCV値の変化を表す電位ヒステリシス現象を紹介した。よって、本手法では、この電位ヒステリシス現象の影響を避けるために、CP計測では電流パルスを一方向に印加してCP測定を行う様式とパルス電流遮断時のCP測定を行う様式を採用した。その妥当性を、取得したATRF(t)曲線で確認し、また、それらの時系列データを用いて機械学習的SOH推定を実施した。その検討結果の一例を表6に示す。これは、表3のサンプル番号1のLIBについてのSOH値の推定結果である。その際のRMSEを計算した。その結果、平均平方二乗誤差であるRMSEは、電流印加時及び電流遮断時の生データからの推定に関して、それぞれ0.011及び0.015であった。両方式が、電池のSOHを推定確度2%以内(診断時間は1秒以内)で劣化診断できる手法を確立できたと結論できる。ただし、ここでは正規化生データをカーネルモデルの入力としたが、この際に計測時の温度をカーネルモデルの入力に加えた場合でも加えない場合でも、SOHを出力とした教師学習の結果は同じで結果であった。
表6は、パルス応答CP(電流印加時及び電流遮断時)を正規化した時系列データを用いた機械学習的SOH推定のRMSE(50µs~0.5sデータを対数スケールで等間隔に100点生成、温度データ入力に使用しない、18650LIB;SOH:1.00~0.60で高温劣化および低温劣化の履歴を持つ、温度:5~45℃、総数データ347個x2;学習データ173x2個及び評価データ174個x2)を示す。

SOH推定値に関するパルス応答(PC)の時系列データ数の依存性
表7には、総数データ347個一定で、評価データ数と学習データ数の比率を変えた時、SOH推定値に与える影響について調べた結果を示す。
表7には、総数データ347個一定で、評価データ数と学習データ数の比率を変えた時、SOH推定値に与える影響について調べた結果を示す。

表7は、パルス応答CP(電流遮断時)を正規化した時系列データを用いた機械学習的SOH推定のRMSE(50µs~0.5sデータを対数スケールで等間隔に100点生成、温度データ入力に使用しない、総数データ347個一定で、評価データ数と学習データ数の比率を変えた時、3回実行したときRMSE平均値/最小値/最大値の変化、18650 LIB;SOH:1.00~0.60で高温劣化および低温劣化の履歴を持つ、温度:5~45℃)を示す。
<実施例13>
<実施例13>
計測生データと温度との相関モデルの学習ソフトウェアおよび計測時温度の推定
本機能の目的は、実験で得られたパルスのCPの正規化生データと計測時温度との相関モデルを構築し、そのモデルから計測時温度を推定することである。本推定プログラムでは、相関モデルとしてカーネルモデルを使用する。そして、正規化生データならびに計測時の温度をカーネルモデルの入力とし、計測時温度を出力として教師学習を行う。すでに、図16には、CP過渡応答のATRF(t)に対する温度依存特性の一例を示した。
本機能の目的は、実験で得られたパルスのCPの正規化生データと計測時温度との相関モデルを構築し、そのモデルから計測時温度を推定することである。本推定プログラムでは、相関モデルとしてカーネルモデルを使用する。そして、正規化生データならびに計測時の温度をカーネルモデルの入力とし、計測時温度を出力として教師学習を行う。すでに、図16には、CP過渡応答のATRF(t)に対する温度依存特性の一例を示した。
表8に温計測時温度の推定検討結果の一例を示す。ここでは、ここでは、表3のサンプル番号1のLIBについてのSOH値の推定結果である。その際のRMSEを計算した。その結果、RMSE誤差は温度表示で1.0℃であった。温度推定の誤差分布についての一例は図18(b)に示した。計測時温度が5~45℃である電池の計測時温度を推定確度4%以内(診断時間は1秒以内)で温度診断できる手法を確立できたと結論できる。ここで、時系列データは、50µs~1s/0.5sデータをログスケールで等間隔に100点生成させて使用した。表8からわかるように、学習数が増加するにつれて推定精度が向上していることが分かる。また、本実施例では時系列データとして温度5点(5.0、15.0、25.0、35.0、及び45.0℃)のATRF(t)依存性をDBに用いたが、温度の変数を増加するにつれて推定精度が向上すると期待される。

表8は、パルス応答CP(電流遮断時)を正規化した時系列データを用いた機械学習的温度推定のRMSE(50µs~0.5sデータを対数スケールで等間隔に100点生成、温度データ入力に使用しない、総数データ347個一定で、評価データ数と学習データ数の比率を変えた時、3回実行したときRMSE平均値/最小値/最大値の変化、18650LIB;SOH:1.00~0.60で高温劣化および低温劣化の履歴を持つ、温度:5~45℃)である。
<実施例14>
<実施例14>
計測生データとSOH及び温度との相関モデルの学習ソフトウェアおよびSOH値及び温度の同時推定
本発明のパルス診断法では、複数出力(SOH、温度、及びSOC)推定を同時に実行することができる。本機能の目的は、実験で得られたパルスのCPの正規化生データ(ダウンサンプリング後の時系列データ)とSOH及び計測時温度との相関モデルを構築し、そのモデルからSOH及び計測時温度を推定することである。この推定プログラムでは、相関モデルとしてカーネルモデルを使用する。そして、正規化生データならびに計測時の温度をカーネルモデルの入力とし、SOH及び計測時温度を出力として教師学習を行う。カーネルモデルは求めるべきパラメータに関して線形となるため、最小二乗法を用いることで解析的に解が求まる。ここでは、表3のサンプル番号1のLIBについてのSOH値および温度の推定結果である。その際のRMSEを計算した。
本発明のパルス診断法では、複数出力(SOH、温度、及びSOC)推定を同時に実行することができる。本機能の目的は、実験で得られたパルスのCPの正規化生データ(ダウンサンプリング後の時系列データ)とSOH及び計測時温度との相関モデルを構築し、そのモデルからSOH及び計測時温度を推定することである。この推定プログラムでは、相関モデルとしてカーネルモデルを使用する。そして、正規化生データならびに計測時の温度をカーネルモデルの入力とし、SOH及び計測時温度を出力として教師学習を行う。カーネルモデルは求めるべきパラメータに関して線形となるため、最小二乗法を用いることで解析的に解が求まる。ここでは、表3のサンプル番号1のLIBについてのSOH値および温度の推定結果である。その際のRMSEを計算した。
その結果、それぞれの推定因子に関しての平均平方二乗誤差であるRMSEは0.011及び1.0℃であった。電池のSOHを推定確度1.1%以内及び温度を推定確度1.0℃(4%以内、診断時間は1秒以内)で劣化診断できる手法を確立できたと結論できる。

表9は、パルス応答CP(電流遮断時)を正規化した時系列データを用いた機械学習的SOH値及び温度の同時推定のRMSE(50µs~0.5sデータを対数スケールで等間隔に100点生成、温度データ入力に使用しない、総数データ347個一定で、評価データ数と学習データ数の比率を変えた時、3回実行したときRMSE平均値/最小値/最大値の変化、18650 LIB;SOH:1.00~0.600で高温劣化および低温劣化の履歴を持つ、温度:5~45℃)を示す。
<実施例15>
<実施例15>
計測生データとSOCとの相関モデルの学習ソフトウェアおよびSOC推定
本機能の目的は、実験で得られたパルスのCPの正規化生データ(ダウンサンプリング後の時系列データ、図16参照)とSOCとの相関モデルを構築し、そのモデルからSOCを推定することである。本プログラムでは、相関モデルとしてカーネルモデルを使用する。そして、正規化生データならびに計測時の温度をカーネルモデルの入力とし、SOCを出力として教師学習を行う。図17には、CP過渡応答のATRF(t)に対するSOC依存特性の一例を示すが、本電池ではそのSOC依存特性はSOCが30%以下で顕著になっていることが分かる。
本実施例のSOC推定検討結果の一例を示す(表8参照)。ここでは、表3のサンプル番号1のLIBについてのSOCを推定し、その際のRMSEを計算した。その結果、平均平方二乗誤差であるRMSEはSOC=0.25以下で0.030であった。電池のSOCを推定確度3%以内(診断時間は1秒以内)で劣化診断できる手法を確立できたと結論できる。

表10は、パルス応答CP(電流遮断時)を正規化した時系列データを用いた機械学習的SOC値推定のRMSE(50µs~0.5sデータを対数スケールで等間隔に100点生成、温度データ入力に使用しない、総数データ347個一定で、評価データ173個として学習データ174個とした時、3回実行したときRMSE平均値/最小値/最大値の変化、18650 LIB;SOH:1.00~0.600で高温劣化および低温劣化の履歴を持つ、温度:5~45℃)である。
<実施例16>
<実施例16>
計測生データからのSOH値推定の誤差評価
図18(a)に、表6に示したパルス応答CP(電流印加時)の正規化カーブ(ATRF(t))の正規化生データを時系列データに用いた機械学習的SOH推定の誤差分布(50µs~0.1sデータを対数スケールで等間隔に100点生成、温度データ入力に使用しない、3回実行したとき、18650LIB;SOH:1.00~0.60で高温劣化および低温劣化の履歴を持つ、温度:5~45℃、総数データ347個;学習データ173個及び評価データ174個)を示す。
<実施例17>
図18(a)に、表6に示したパルス応答CP(電流印加時)の正規化カーブ(ATRF(t))の正規化生データを時系列データに用いた機械学習的SOH推定の誤差分布(50µs~0.1sデータを対数スケールで等間隔に100点生成、温度データ入力に使用しない、3回実行したとき、18650LIB;SOH:1.00~0.60で高温劣化および低温劣化の履歴を持つ、温度:5~45℃、総数データ347個;学習データ173個及び評価データ174個)を示す。
<実施例17>
計測生データからの温度推定の誤差評価
図18(b)に、表8に示したパルス応答CP(電流印加時)の正規化カーブ(ATRF(t))の正規化生データを時系列データに用いた機械学習的温度推定の誤差分布(50µs~0.1sデータを対数スケールで等間隔に100点生成、温度データ入力に使用しない、3回実行したとき、18650 LIB;SOH:1.00~0.60で高温劣化および低温劣化の履歴を持つ、温度:5~45℃、総数データ347個;学習データ173個及び評価データ174個)を示す。
<実施例18>
図18(b)に、表8に示したパルス応答CP(電流印加時)の正規化カーブ(ATRF(t))の正規化生データを時系列データに用いた機械学習的温度推定の誤差分布(50µs~0.1sデータを対数スケールで等間隔に100点生成、温度データ入力に使用しない、3回実行したとき、18650 LIB;SOH:1.00~0.60で高温劣化および低温劣化の履歴を持つ、温度:5~45℃、総数データ347個;学習データ173個及び評価データ174個)を示す。
<実施例18>
低レート(例えば、0.1Cレート)での充放電容カーブから、(満充電容量/初期満充電容量)の比を求められる。その比は、電池の健全度を表す指標(SOH)と考えられてきた。この比に関して、中から高レート(例えば、0.5~3Cレート)での充放電カーブから計算された(満充電容量/初期満充電容量)の比はパワー密度(SOP)の減少の指標とすることができる。
図21に、車載用電池として使用されているハードカーボンを負極に用いた複数のLIB(初期容量:5.19Ah)に関して、劣化度合いの異なる各電池における同一値の定電流モードでの充放電レート値に対する放電容量(観察容量)の変化を示す。ただし、測定では充電と放電の末端電圧をそれぞれ 4.200V及び2.500Vとした。
これらのLIBで、未劣化電池の1.0Cレートで求めた放電容量をSOP=1.0とした時、最大の劣化電池のSOPは0.76であった。これらのLIBについて、実施例11と同様の方法で得たSOHをSOPと見做し、パルス応答を時系列データに用いて機械学習的SOP推定を実施した。その結果から、電池のSOPを推定確度2%以内(診断時間は1秒以内)で劣化診断できる手法を確立できたと結論した。上記の結果より、汎用性の高い中から高レートでのパワー密度の減少量の推定、すなわち使用中の電池に関しその後の経過における使用可能量の最大値の推定を、本手法で高速でかつ高精度で推定できることがわかった。これは、本発明の優れた効果のうちの1つである。
本発明は、上記の様に、充電中のLIBについても適応可能である。このためには、数7におけるE(t)が時間に比例したドリフト成分を持つとして、E(t)をE(t)-βt(βは比例係数)に置き換えて得られるATRF(t)を用いる。
より具体的には、パルス印加直前(プレトリガー)の時間領域から充放電による電圧変化の線形近似式を求め、その近似式を用いてパルス応答電圧値を補正することで充放電の影響を除去する。このことにより、充放電の影響を排除した正味の正規化関数ATRF(t)値を求めることができる。
図19は、充電動作中のLIBでパルス測定を行った場合のATRF(t)特性例である。充電電流1Aおよび0.5A下でのパルスに対して補正したATRF(t)曲線と、充電停止(電流0A)でのパルスに対するATRF(t)曲線との差 を示す。1A(0.5Cレート相当)で充電中でSOCが50%を超えた時点で、波高2A幅2sのパルスを印加して過渡応答を測定した。その後レートを0.5A(1/4Cレート相当)に変更し5分後に同様にパルス測定を行い、その後停止して20分経過した後にもパルス測定を行った。前者2つの測定データについては本発明の方法で補正し、停止のものは補正せずに、それぞれ正規化曲線を作成した。
図19に示すように、停止での正規化曲線と比較しての差異が全パルス時間にわたって0.5%以内で補正可能であることが分かる。これらのことから、充電中のパルス測定からも、静止と同様に電池状態推定が可能であることがわかった。
また、図20に、充電中のLIBのパルス応答の正規化関数に対する電圧補正の影響例を示す。充電電流による電圧変化を補正する前と後とのATRF(t)値の差(%)を示す。測定条件は、充電電流1A、パルス波高2A,幅2s、サンプリングレート100kS/s、測定温度:室温(25℃)被検電池は、#397(18650)。
図20の場合、充電中の測定では、パルス幅あるいはパルス時間が0.1s以上の時間領域では充電による影響を補償する必要があることがわかる。
1 電流パルス源
2 被検電池
3 ノイズフィルタ
4 電圧計
5 デジタルフィルタ
6 第1データ処理部
7 第2データ処理部
8 データベース
2 被検電池
3 ノイズフィルタ
4 電圧計
5 デジタルフィルタ
6 第1データ処理部
7 第2データ処理部
8 データベース
Claims (12)
- 測定対象となる二次電池に単一の電流パルスを印加するパルス電流発生器と、
その単一の電流パルス印加で得られる電圧応答を計測する電圧計測器と、
その電圧応答の経時変化を示すクロノポテンショグラムを得て、そのクロノポテンショグラムを正規化する第1データ処理装置と、
正規化された上記ロノポテンショグラムのデータを入力する第2データ処理装置を、備え、
第2データ処理装置において、予め用意された電池状態表現因子抽出用の二次電池についての正規化データと電池状態表現因子との相関性を用いて電池診断を行うものである、
ことを特徴とする電流パルス法による電池診断装置。 - 測定対象となる二次電池に複数の電流パルスからなる電流パルスを印加するパルス電流発生器と、
その電流パルス印加で得られる電圧応答を計測する電圧計測器と、
その電圧応答の経時変化を示すクロノポテンショグラムを得て、そのクロノポテンショグラムを正規化する第1データ処理装置と、
正規化された上記ロノポテンショグラムのデータを入力する第2データ処理装置を、備え、
第2データ処理装置において、予め用意された電池状態表現因子抽出用の二次電池についての正規化データと電池状態表現因子との相関性を用いて電池診断を行うものである、ことを特徴とする電流パルス法による電池診断装置。 - 上記の電流パルスは、
上記二次電池の充電方向の、ゼロを含む所定の電流値から所定の定電流値に変化した後に遮断される電流パルスであることを特徴とする請求項1に記載の電流パルス法による電池診断装置。 - 上記の電流パルスは、
上記二次電池の充電方向の、ゼロを含む所定の電流値から所定の定電流値に変化した後に遮断される電流パルスであることを特徴とする請求項2に記載の電流パルス法による電池診断装置。 - 上記の電流パルスは、上記二次電池の放電方向の、ゼロを含む所定の電流値から所定の定電流値に変化した後に遮断される電流パルスであることを特徴とする請求項1に記載の電流パルス法による電池診断装置。
- 上記の電流パルスは、上記二次電池の放電方向の、ゼロを含む所定の電流値から所定の定電流値に変化した後に遮断される電流パルスであることを特徴とする請求項2に記載の電流パルス法による電池診断装置。
- 上記電池状態表現因子は、上記の電池診断装置と同様の構成の装置を用いて、電池状態表現因子抽出用の二次電池についての、健全度、充電状態、または測定対象となる二次電池の温度を含むクロノポテンショグラムデータから抽出したものであることを特徴とする請求項1から6に記載の電流パルス法による電池診断装置。
- 上記電圧計測器の入力信号のノイズを抑制するノイズフィルタと、第1データ処理装置への入力データ数を抑制するデータリサンプリング手段を備えることを特徴とする請求項1あるいは2に記載の電流パルス法による電池診断装置。
- 第2データ処理装置は、健全度、充電状態、および測定対象となる二次電池の温度を含めた電池状態表現因子についての上記相関性を機械学習した診断アルゴリズムを搭載するものであり、健全度、充電状態、あるいは測定対象となる二次電池の温度について診断するものであることを特徴とする請求項1から6のいずれか1つに記載の電流パルス法による電池診断装置。
- 第2データ処理装置は、健全度、充電状態、および測定対象となる二次電池の温度を含めた電池状態表現因子についての上記相関性を機械学習した診断アルゴリズムを搭載するものであり、健全度、充電状態、あるいは測定対象となる二次電池の温度について診断するものであることを特徴とする請求項7に記載の電流パルス法による電池診断装置。
- 第2データ処理装置は、健全度、充電状態、および測定対象となる二次電池の温度を含めた電池状態表現因子についての上記相関性を機械学習した診断アルゴリズムを搭載するものであり、健全度、充電状態、あるいは測定対象となる二次電池の温度について診断するものであることを特徴とする請求項8に記載の電流パルス法による電池診断装置。
- 電流パルスを用いる電池診断方法であって、
電池状態表現因子の抽出においては、
(A1)上記電池状態表現因子を測定するステップと、
(A2)電池状態表現因子の抽出用二次電池に所定の電流パルスを印加し、
上記印加に対する応答電圧の経時変化を電圧計測器で計測し、
その計測結果であるクロノポテンショグラムの一連のデータを正規化するステップと、
を含む操作について、
(A3)異なる電池状態表現因子をもった複数の二次電池について、上記A1ステップとA2ステップとを含む操作を行って得られた、複数の正規化された上記データと複数の上記電池状態表現因子との相関性を抽出し、
電池診断においては、
(B1)測定対象となる二次電池に電流パルスを印加し、
(B2)その電流パルス印加に対する電圧応答の経時変化を示すクロノポテンショグラムを得て、
(B3)上記クロノポテンショグラムを正規化し、
(B4)正規化された上記クロノポテンショグラムのデータに上記相関性を適用して、電池状態表現因子の推定を行うことを特徴とする電流パルス法による電池診断方法。
Priority Applications (3)
| Application Number | Priority Date | Filing Date | Title |
|---|---|---|---|
| US17/290,346 US11422194B2 (en) | 2018-10-30 | 2019-06-04 | Battery diagnosis apparatus and battery diagnosis method based on current pulse method |
| JP2020554753A JP6991616B2 (ja) | 2018-10-30 | 2019-06-04 | 電流パルス法による電池診断装置及び電池診断方法 |
| EP19878312.8A EP3875974A4 (en) | 2019-06-04 | Battery diagnosis device and battery diagnosis method using current pulse method |
Applications Claiming Priority (2)
| Application Number | Priority Date | Filing Date | Title |
|---|---|---|---|
| JP2018204492 | 2018-10-30 | ||
| JP2018-204492 | 2018-10-30 |
Publications (1)
| Publication Number | Publication Date |
|---|---|
| WO2020090143A1 true WO2020090143A1 (ja) | 2020-05-07 |
Family
ID=70462613
Family Applications (1)
| Application Number | Title | Priority Date | Filing Date |
|---|---|---|---|
| PCT/JP2019/022129 WO2020090143A1 (ja) | 2018-10-30 | 2019-06-04 | 電流パルス法による電池診断装置及び電池診断方法 |
Country Status (3)
| Country | Link |
|---|---|
| US (1) | US11422194B2 (ja) |
| JP (1) | JP6991616B2 (ja) |
| WO (1) | WO2020090143A1 (ja) |
Cited By (8)
| Publication number | Priority date | Publication date | Assignee | Title |
|---|---|---|---|---|
| CN113702783A (zh) * | 2021-08-27 | 2021-11-26 | 陕西省地方电力(集团)有限公司 | 一种电缆局部放电检测方法、系统、设备及介质 |
| CN113917341A (zh) * | 2021-11-25 | 2022-01-11 | 中国汽车工程研究院股份有限公司 | 电动汽车动力电池检测方法、系统及存储介质 |
| JP7090949B1 (ja) | 2021-05-19 | 2022-06-27 | 東洋システム株式会社 | 電池状態判定方法および電池状態判定装置 |
| KR20220124900A (ko) * | 2021-03-04 | 2022-09-14 | 한국에너지기술연구원 | 배터리 상태 추정 장치 및 배터리 상태 추정 모델 학습 장치 |
| JP2022179391A (ja) * | 2021-05-19 | 2022-12-02 | 東洋システム株式会社 | 電池状態判定方法および電池状態判定装置 |
| JP2023517587A (ja) * | 2020-10-12 | 2023-04-26 | エルジー エナジー ソリューション リミテッド | バッテリー診断装置及び方法 |
| CN116893354A (zh) * | 2022-03-30 | 2023-10-17 | 本田技研工业株式会社 | 蓄电池状态分析系统及蓄电池状态分析方法 |
| WO2024013938A1 (ja) * | 2022-07-14 | 2024-01-18 | 株式会社Subaru | 電池診断装置 |
Families Citing this family (5)
| Publication number | Priority date | Publication date | Assignee | Title |
|---|---|---|---|---|
| WO2021044635A1 (ja) * | 2019-09-06 | 2021-03-11 | 株式会社 東芝 | 蓄電池評価装置、蓄電池評価方法及び蓄電池評価システム |
| US11498442B2 (en) * | 2019-09-17 | 2022-11-15 | Dr. Ing. H.C. F. Porsche Aktiengesellschaft | Systems and methods for noise cancellation in protective earth resistance check of vehicle onboard battery charger |
| CN114260213A (zh) * | 2021-12-27 | 2022-04-01 | 上海洛轲智能科技有限公司 | 锂离子电池一致性的筛选方法及系统 |
| CN114297904B (zh) * | 2022-03-09 | 2022-05-24 | 四川大学 | 一种基于二次差分温度特征的锂电池健康状态估计方法 |
| CN114843558B (zh) * | 2022-05-20 | 2023-07-21 | 上海捷氢科技股份有限公司 | 一种燃料电池运行特性确定方法和装置 |
Citations (5)
| Publication number | Priority date | Publication date | Assignee | Title |
|---|---|---|---|---|
| JPS6145824B2 (ja) | 1979-04-28 | 1986-10-09 | Toshiba Ceramics Co | |
| JP2000019234A (ja) * | 1998-06-25 | 2000-01-21 | Korea Kumho Petrochem Co Ltd | パルス電流の電圧応答信号を用いた電池容量測定方法及び電池容量測定装置 |
| US20040095143A1 (en) * | 2002-08-13 | 2004-05-20 | Vb Autobatterie Gmbh | Method for determining the amount of charge which can be drawn from a storage battery and a monitoring device for a storage battery |
| WO2016136788A1 (ja) * | 2015-02-24 | 2016-09-01 | 学校法人同志社 | 電池劣化診断方法および電池劣化診断装置 |
| US20180149708A1 (en) * | 2016-11-30 | 2018-05-31 | Cadex Electronics Inc. | Battery state-of-health determination using multi-factor normalization |
Family Cites Families (8)
| Publication number | Priority date | Publication date | Assignee | Title |
|---|---|---|---|---|
| US20030206021A1 (en) | 1997-07-25 | 2003-11-06 | Laletin William H. | Method and apparatus for measuring and analyzing electrical or electrochemical systems |
| US20030184307A1 (en) * | 2002-02-19 | 2003-10-02 | Kozlowski James D. | Model-based predictive diagnostic tool for primary and secondary batteries |
| JP4227814B2 (ja) * | 2003-02-07 | 2009-02-18 | エスペック株式会社 | 電池状態診断装置および電池状態診断方法 |
| US20130069660A1 (en) * | 2010-02-17 | 2013-03-21 | Julien Bernard | Method for in situ battery diagnostic by electrochemical impedance spectroscopy |
| US20120310565A1 (en) * | 2011-05-31 | 2012-12-06 | Laszlo Redey | Apparatus and method for determining battery/cell's performance, age, and health |
| US9989595B1 (en) * | 2013-12-31 | 2018-06-05 | Hrl Laboratories, Llc | Methods for on-line, high-accuracy estimation of battery state of power |
| JP6145824B2 (ja) | 2014-10-31 | 2017-06-14 | エンネット株式会社 | 電池診断装置および電池診断方法 |
| US10838012B2 (en) * | 2017-03-23 | 2020-11-17 | City University Of Hong Kong | Method of diagnosing an electrical energy storage apparatus, an electronic device for use in an electrical energy storage apparatus and an electrical energy storage apparatus |
-
2019
- 2019-06-04 US US17/290,346 patent/US11422194B2/en active Active
- 2019-06-04 JP JP2020554753A patent/JP6991616B2/ja active Active
- 2019-06-04 WO PCT/JP2019/022129 patent/WO2020090143A1/ja active Search and Examination
Patent Citations (5)
| Publication number | Priority date | Publication date | Assignee | Title |
|---|---|---|---|---|
| JPS6145824B2 (ja) | 1979-04-28 | 1986-10-09 | Toshiba Ceramics Co | |
| JP2000019234A (ja) * | 1998-06-25 | 2000-01-21 | Korea Kumho Petrochem Co Ltd | パルス電流の電圧応答信号を用いた電池容量測定方法及び電池容量測定装置 |
| US20040095143A1 (en) * | 2002-08-13 | 2004-05-20 | Vb Autobatterie Gmbh | Method for determining the amount of charge which can be drawn from a storage battery and a monitoring device for a storage battery |
| WO2016136788A1 (ja) * | 2015-02-24 | 2016-09-01 | 学校法人同志社 | 電池劣化診断方法および電池劣化診断装置 |
| US20180149708A1 (en) * | 2016-11-30 | 2018-05-31 | Cadex Electronics Inc. | Battery state-of-health determination using multi-factor normalization |
Non-Patent Citations (2)
| Title |
|---|
| ANAL. CHEM., vol. 83, 2011, pages 8429 - 8438 |
| N. OYAMAS. YAMAGUCHI, J. ELECTROCHEM. SOC., vol. 160, 2013, pages A3206 - A3212 |
Cited By (15)
| Publication number | Priority date | Publication date | Assignee | Title |
|---|---|---|---|---|
| JP2023517587A (ja) * | 2020-10-12 | 2023-04-26 | エルジー エナジー ソリューション リミテッド | バッテリー診断装置及び方法 |
| JP7404612B2 (ja) | 2020-10-12 | 2023-12-26 | エルジー エナジー ソリューション リミテッド | バッテリー診断装置及び方法 |
| KR102620444B1 (ko) * | 2021-03-04 | 2024-01-03 | 한국에너지기술연구원 | 배터리 상태 추정 장치 및 배터리 상태 추정 모델 학습 장치 |
| KR20220124900A (ko) * | 2021-03-04 | 2022-09-14 | 한국에너지기술연구원 | 배터리 상태 추정 장치 및 배터리 상태 추정 모델 학습 장치 |
| JP2022179391A (ja) * | 2021-05-19 | 2022-12-02 | 東洋システム株式会社 | 電池状態判定方法および電池状態判定装置 |
| JP2022178209A (ja) * | 2021-05-19 | 2022-12-02 | 東洋システム株式会社 | 電池状態判定方法および電池状態判定装置 |
| WO2022244378A1 (ja) * | 2021-05-19 | 2022-11-24 | 東洋システム株式会社 | 電池状態判定方法および電池状態判定装置 |
| JP7297339B2 (ja) | 2021-05-19 | 2023-06-26 | 東洋システム株式会社 | 電池状態判定方法および電池状態判定装置 |
| JP7090949B1 (ja) | 2021-05-19 | 2022-06-27 | 東洋システム株式会社 | 電池状態判定方法および電池状態判定装置 |
| CN113702783A (zh) * | 2021-08-27 | 2021-11-26 | 陕西省地方电力(集团)有限公司 | 一种电缆局部放电检测方法、系统、设备及介质 |
| CN113917341A (zh) * | 2021-11-25 | 2022-01-11 | 中国汽车工程研究院股份有限公司 | 电动汽车动力电池检测方法、系统及存储介质 |
| CN116893354A (zh) * | 2022-03-30 | 2023-10-17 | 本田技研工业株式会社 | 蓄电池状态分析系统及蓄电池状态分析方法 |
| JP7385698B2 (ja) | 2022-03-30 | 2023-11-22 | 本田技研工業株式会社 | バッテリ状態分析システム及びバッテリ状態分析方法 |
| CN116893354B (zh) * | 2022-03-30 | 2024-03-08 | 本田技研工业株式会社 | 蓄电池状态分析系统及蓄电池状态分析方法 |
| WO2024013938A1 (ja) * | 2022-07-14 | 2024-01-18 | 株式会社Subaru | 電池診断装置 |
Also Published As
| Publication number | Publication date |
|---|---|
| JPWO2020090143A1 (ja) | 2021-11-25 |
| US20210382114A1 (en) | 2021-12-09 |
| US11422194B2 (en) | 2022-08-23 |
| JP6991616B2 (ja) | 2022-01-12 |
| EP3875974A1 (en) | 2021-09-08 |
Similar Documents
| Publication | Publication Date | Title |
|---|---|---|
| WO2020090143A1 (ja) | 電流パルス法による電池診断装置及び電池診断方法 | |
| CN108037460B (zh) | 一种批产锂离子电池容量实时评估方法 | |
| JP5683175B2 (ja) | 電気化学システムの計測不能な特性を推定する改良された方法 | |
| KR102106775B1 (ko) | 딥러닝을 이용한 전지 진단 방법 | |
| US8984944B2 (en) | Method and system for diagnosis of the internal state of a battery through acoustic emission | |
| JP2008533486A (ja) | バッテリーの充電状態を推定する装置及び方法 | |
| Lyu et al. | SOH estimation of lithium-ion batteries based on fast time domain impedance spectroscopy | |
| CN113138340A (zh) | 电池等效电路模型的建立方法、健康状态估算方法及装置 | |
| CN112485693B (zh) | 一种基于温度概率密度函数的电池健康状态快速评估方法 | |
| CN113884935A (zh) | 基于锂电池在线电化学阻抗谱测量的soh估算系统和方法 | |
| CN111337843B (zh) | 动力电池差分电容的生成方法及容量估计方法、系统 | |
| CN114865117B (zh) | 锂离子电池电极嵌锂量检测方法、装置及电池管理系统 | |
| CN114487846A (zh) | 电池电化学阻抗谱在线估计方法及装置 | |
| CN115754724A (zh) | 一种适用于未来不确定性动态工况放电的动力电池健康状态估计方法 | |
| CN110208702B (zh) | 一种基于神经网络的锂电池超声信息特性提取方法 | |
| CN115616428A (zh) | 一种“充—检”一体电动汽车电池状态检测与评价方法 | |
| Geng et al. | Intermittent current interruption method for commercial lithium-ion batteries aging characterization | |
| CN113687251A (zh) | 一种基于双模型的锂离子电池组电压异常故障诊断方法 | |
| CN116774051B (zh) | 考虑时频域多维数据特征的电池容量快速估计方法 | |
| Stanciu et al. | Extensive EIS characterization of commercially available lithium polymer battery cell for performance modelling | |
| Thanapalan et al. | Advanced EIS techniques for performance evaluation of Li-ion cells | |
| Hu et al. | On-board analysis of degradation mechanisms of lithium-ion battery using differential voltage analysis | |
| Zhao et al. | Investigation into impedance measurements for rapid capacity estimation of lithium-ion batteries in electric vehicles | |
| CN112710959B (zh) | 一种锂离子电池的状态评估方法及系统 | |
| Tairov et al. | The novel method for estimating VRLA battery state of charge |
Legal Events
| Date | Code | Title | Description |
|---|---|---|---|
| 121 | Ep: the epo has been informed by wipo that ep was designated in this application |
Ref document number: 19878312 Country of ref document: EP Kind code of ref document: A1 |
|
| DPE1 | Request for preliminary examination filed after expiration of 19th month from priority date (pct application filed from 20040101) | ||
| ENP | Entry into the national phase |
Ref document number: 2020554753 Country of ref document: JP Kind code of ref document: A |
|
| NENP | Non-entry into the national phase |
Ref country code: DE |
|
| ENP | Entry into the national phase |
Ref document number: 2019878312 Country of ref document: EP Effective date: 20210531 |