WO2019229897A1 - イメージングデータ処理装置 - Google Patents
イメージングデータ処理装置 Download PDFInfo
- Publication number
- WO2019229897A1 WO2019229897A1 PCT/JP2018/020832 JP2018020832W WO2019229897A1 WO 2019229897 A1 WO2019229897 A1 WO 2019229897A1 JP 2018020832 W JP2018020832 W JP 2018020832W WO 2019229897 A1 WO2019229897 A1 WO 2019229897A1
- Authority
- WO
- WIPO (PCT)
- Prior art keywords
- image
- imaging data
- imaging
- unit
- grid
- Prior art date
- Legal status (The legal status is an assumption and is not a legal conclusion. Google has not performed a legal analysis and makes no representation as to the accuracy of the status listed.)
- Ceased
Links
Images



Classifications
-
- G—PHYSICS
- G06—COMPUTING OR CALCULATING; COUNTING
- G06T—IMAGE DATA PROCESSING OR GENERATION, IN GENERAL
- G06T3/00—Geometric image transformations in the plane of the image
- G06T3/18—Image warping, e.g. rearranging pixels individually
-
- G—PHYSICS
- G06—COMPUTING OR CALCULATING; COUNTING
- G06T—IMAGE DATA PROCESSING OR GENERATION, IN GENERAL
- G06T7/00—Image analysis
- G06T7/0002—Inspection of images, e.g. flaw detection
- G06T7/0012—Biomedical image inspection
-
- G—PHYSICS
- G01—MEASURING; TESTING
- G01N—INVESTIGATING OR ANALYSING MATERIALS BY DETERMINING THEIR CHEMICAL OR PHYSICAL PROPERTIES
- G01N21/00—Investigating or analysing materials by the use of optical means, i.e. using sub-millimetre waves, infrared, visible or ultraviolet light
- G01N21/62—Systems in which the material investigated is excited whereby it emits light or causes a change in wavelength of the incident light
- G01N21/63—Systems in which the material investigated is excited whereby it emits light or causes a change in wavelength of the incident light optically excited
- G01N21/64—Fluorescence; Phosphorescence
-
- G—PHYSICS
- G06—COMPUTING OR CALCULATING; COUNTING
- G06T—IMAGE DATA PROCESSING OR GENERATION, IN GENERAL
- G06T2207/00—Indexing scheme for image analysis or image enhancement
- G06T2207/10—Image acquisition modality
- G06T2207/10056—Microscopic image
-
- G—PHYSICS
- G06—COMPUTING OR CALCULATING; COUNTING
- G06T—IMAGE DATA PROCESSING OR GENERATION, IN GENERAL
- G06T2207/00—Indexing scheme for image analysis or image enhancement
- G06T2207/10—Image acquisition modality
- G06T2207/10064—Fluorescence image
Definitions
- the present invention relates to an imaging data processing apparatus that processes data obtained for each micro area in a two-dimensional area on a sample and displays an image showing a two-dimensional intensity distribution of a specific substance, such as an imaging mass spectrometer. .
- An imaging mass spectrometer measures the two-dimensional intensity distribution of ions having a specific mass-to-charge ratio m / z on the same sample surface while observing the morphology of the sample surface such as a biological tissue section with an optical microscope. It is a device that can. By observing a mass spectrometry imaging image of ions derived from a compound characteristically appearing in a specific disease such as cancer using an imaging mass spectrometer, it is possible to grasp the extent of the disease. Therefore, in recent years, using imaging mass spectrometers, pharmacokinetic analysis targeting biological tissue sections and the like, differences in compound distribution in each organ, or between pathological and normal sites such as cancer Many studies have been conducted to analyze differences in compound distribution.
- Non-Patent Document 1 in the imaging mass spectrometer, a heat map-like image showing a two-dimensional intensity distribution of a substance having a specific mass-to-charge ratio in a two-dimensional measurement region on a sample ( Mass spectrometry imaging images) can be created and displayed.
- the optical microscope attached to the imaging mass spectrometer can obtain an optical microscopic image of the sample.
- An image obtained by superimposing the optical microscopic image and a mass spectroscopic imaging image at an arbitrary mass-to-charge ratio is created and displayed. It is also possible to do. In such a superimposed image, the outline and pattern of the biological tissue and the two-dimensional distribution of the specific substance are displayed together, so it is possible to observe what substance is unevenly distributed in which part of the biological tissue. Convenient to.
- an image obtained by observing a stained sample with an optical microscope or observing a fluorescently labeled sample with a fluorescence microscope in order to reveal a specific part in a living tissue that cannot be seen with general optical microscopic observation, and a mass Creating and displaying an image superimposed with an analytical imaging image is also performed.
- measurement (imaging) is performed in the following procedure.
- an operator applies a matrix for MALDI (Matrix Assisted Laser Desorption / Ionization) on the surface of a target sample, performs measurement with an imaging mass spectrometer, and collects mass spectrometry imaging data.
- MALDI Microx Assisted Laser Desorption / Ionization
- the operator removes the sample from the apparatus and removes the matrix on the sample surface using a predetermined solvent.
- the sample is stained with a predetermined staining reagent, and measurement is performed with an optical microscope to collect stained image data.
- the reason why mass spectrometry is performed prior to optical observation is that a stained sample cannot be subjected to accurate mass spectrometry due to the influence of a staining reagent.
- the mass spectrometry imaging image and the reference image correspond to the same part on the sample.
- the position on the image is generally different. This is because a part of the structure of the sample is deformed by the solvent used when removing the matrix on the surface of the sample, in addition to the positional deviation when the sample is set in the apparatus. For this reason, in many cases, the reference image and the mass spectrometry imaging image cannot be superimposed as they are, and at least one of the images is subjected to image processing such as movement, rotation, deformation (expansion / contraction), trimming, and the like. (See Patent Documents 1 to 3, etc.).
- the range in which the image is deformed is within a range connecting a plurality of closest intersections surrounding the selected intersection.
- the amount and range to be deformed are often different depending on the area in one image.
- it is desirable to deform It was necessary for the operator to proceed with the trial and error while changing the grid line intervals in accordance with the range. For this reason, it takes time to properly align the image position, and the work efficiency is poor. In addition, such work was a heavy physical and mental burden for the worker.
- Such problems are not limited to overlaying stained images, fluorescent images, or general optical microscopic images and mass spectrometry imaging images, but are not limited to overlaying imaging images obtained by different measurement techniques. It is a problem that arises.
- Specific examples of the measurement technique here include an infrared imaging method, a laser Raman spectroscopic imaging method, a surface analysis method using an X-ray, an ion beam, an electron beam, and the like.
- the present invention has been made to solve the above-described problems, and an object of the present invention is to deform an image when deforming one image to superimpose an optical microscopic image, a mass spectrometry imaging image, or the like. It is an object of the present invention to provide an imaging data processing apparatus capable of facilitating the operation of an operator for improving the operability.
- a first aspect of the present invention made to solve the above-described problems has an input unit and a display unit which are user interfaces, and each of a plurality of minute regions in a two-dimensional region on a sample is a first Measurement using a second measurement technique different from the first measurement technique for the first imaging data obtained by performing measurement by the measurement technique and a range including at least a part of the two-dimensional region on the sample.
- An image display processing unit that displays the grid points with a predetermined interval superimposed on the superimposed image displayed, b) a deformation range designation receiving unit that allows the user to designate an image deformation range by an operation via the input unit on the image on which the grid points are superimposed and displayed by the image display processing unit; c) The grid points included in the image deformation range designated by the deformation range designation accepting unit among the grid points superimposed on the image by the image display processing unit by the user via the input unit. In response to the selection and movement operation of the selected grid point on the image, an image within the image deformation instruction range in one of the two images displayed in an overlapping manner is selected according to the selection and movement operation.
- An image transformation processing unit to be transformed; It is characterized by having.
- the first and second measurement methods include mass spectrometry imaging method, Raman spectroscopy imaging method, fluorescence imaging method, infrared spectroscopy imaging method, X-ray analysis imaging method, particle beam such as electron beam and ion beam.
- the surface analysis imaging method using a probe the surface analysis imaging method using a probe such as a scanning probe microscope (SPM), or the microscopic observation method using a general microscope such as an optical microscope can be used.
- the image display processing unit when the image display processing unit acquires the first and second imaging data, the image display processing unit creates a first image based on the first imaging data, and converts the first imaging data into the second imaging data. Based on this, a second image is created. And the two images about the substantially same area
- grid points with a predetermined interval are superimposed and displayed on the superimposed image.
- the grid point here may be an intersection of grid-like lines (grid lines), or may be a plurality of points arranged simply in a grid and discretely.
- the grid lines connecting the grid points do not need to be displayed, but the entire grid lines or a part of the grid lines may be displayed so that the relative position of each part on the image can be easily grasped.
- the user can select a deformation target image.
- the user can specify or adjust the interval between grid points to be displayed in a superimposed manner.
- the deformation range designation receiving unit determines the image deformation range in response to an operation of the input unit by the user on the image displayed with the grid points superimposed.
- the input unit is a pointing device such as a mouse, and an area having an arbitrary size and shape designated on the image may be set as the image deformation range.
- the image deformation processing unit recognizes the image deformation range as an image deformation processing target.
- the minute image corresponding to the position of the grid point before movement on the image to be deformed is moved to the position of the grid point after movement, and within the image deformation range including the grid point before the movement.
- the entire image within the image deformation range is deformed by moving the minute image corresponding to the position of each grid point according to a predetermined algorithm.
- the aligned superimposed image is displayed on the screen of the display unit. Since the range to be deformed can be arbitrarily specified according to one grid point moving operation, the image deformation range is appropriately adjusted according to the range and amount to be deformed in one image. Thus, accurate image alignment can be performed with fewer operations than in the past.
- the second aspect of the present invention which has been made to solve the above problems, includes an input unit and a display unit which are user interfaces, and each of a plurality of minute regions in a two-dimensional region on the sample is first. Measurement using a second measurement technique different from the first measurement technique with respect to the first imaging data obtained by executing the measurement according to the measurement technique and a range including at least a part of the two-dimensional region on the sample An imaging data processing apparatus for processing second imaging data obtained by executing a) A first image created on the basis of the first imaging data and a second image created on the basis of the second imaging data for a substantially identical range on the sample are displayed on the screen of the display unit.
- an image display processing unit that displays the superimposed grid points on the superimposed image displayed, b) a grid point interval designation receiving unit that allows the user to designate the interval of the grid points for each different region on the image; c) Selection of grid points displayed on the image by the image display processing unit with an interval designated by the grid point interval designation accepting unit, and movement of the selected grid points on the image
- an image deformation processing unit that deforms an image of a predetermined range in one of the two images displayed in an overlapping manner according to the selection and movement operation; It is characterized by having.
- the grid point interval designation receiving unit in response to the user's operation of the input unit, divides the entire surface of the image displayed by superimposing grid points into a plurality of regions, and for each region Set different (or the same) grid point spacing. That is, the grid points having different grid point intervals can be mixed. Specifically, for example, first, grid points having a large first grid point interval are displayed on the entire surface of the image, and then within a range of one or more predetermined shapes surrounded by three or more grid points that are not positioned on a straight line. It is preferable to provide grid points having a second grid interval that is smaller than the first grid point interval.
- the image transformation processing unit selects an arbitrary grid point from among a large number of grid points having different intervals depending on the area, and moves the selected grid point on the image in the same manner as a conventional grid point having a uniform interval. And deforms the image according to the operation. In the region where the grid point interval is narrow, the range of the image deformed according to the operation of one intersection point is narrowed. Good. As a result, the grid point interval and the range in which the grid point having the interval is appropriately adjusted according to the range and amount to be deformed in one image, so that the number of operations can be reduced more accurately than before. Positioning is possible.
- the first measurement method is a mass spectrometry imaging method using a matrix-assisted laser ionization method
- the second measurement method is a method of microscopic observation after staining or fluorescently labeling a sample. It can be assumed that
- the present invention for example, when one image is deformed in order to superimpose a stained image, a fluorescence microscopic image, and a mass spectrometry imaging image of the same sample with high accuracy, an operator's operation for deforming the image is performed.
- the operability can be improved by smoothing.
- the efficiency of the image alignment operation can be improved and the physical and mental burden on the operator can be reduced.
- FIG. 1 is a schematic configuration diagram of an embodiment of an imaging mass spectrometer including an imaging data processing apparatus according to the present invention.
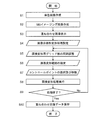
- the flowchart which shows the procedure of the image superimposition operation
- the figure which shows an example of the display screen in the case of the image superimposition work in the imaging mass spectrometer of a present Example.
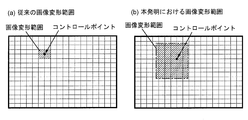
- transformation process in the imaging mass spectrometer of a present Example Explanatory drawing of the image deformation
- FIG. 1 is a schematic configuration diagram of an imaging mass spectrometer according to the present embodiment.
- the imaging mass spectrometer of the present embodiment includes an imaging mass analyzer 1 that performs measurement on a sample by a mass spectrometry imaging method, an optical microscope imaging unit 2 that captures an optical microscope image on the sample, and a data processor 3. And an input unit 4 and a display unit 5 which are user interfaces.
- the imaging mass spectrometer 1 includes, for example, a MALDI ion trap time-of-flight mass spectrometer, and performs mass analysis on each of a number of minute regions (measurement points) in a two-dimensional measurement region on a sample such as a biological tissue section. It executes and acquires mass spectrometry data for every measuring point.
- a MALDI ion trap time-of-flight mass spectrometer performs mass analysis on each of a number of minute regions (measurement points) in a two-dimensional measurement region on a sample such as a biological tissue section. It executes and acquires mass spectrometry data for every measuring point.
- the optical microscopic imaging unit 2 is obtained by adding an imaging unit to an optical microscope, and acquires a microscopic image of a two-dimensional region on the surface of the sample.
- the optical microscopic imaging unit 2 is used for acquiring an optical microscopic image for determining a measurement region when performing measurement by a mass spectrometry imaging method, and for capturing a stained image of a stained sample. .
- the data processing unit 3 receives the mass spectrum data in each micro area collected by the imaging mass analysis unit 1 and the optical microscopic image data input from the optical microscopic imaging unit 2 and performs predetermined processing.
- a unit 31, a data storage unit 32, an imaging image creation unit 33, an optical image creation unit 34, an image overlay processing unit 35, and the like are provided as functional blocks.
- the data storage unit 32 includes a spectral data storage region 321 for storing data collected by the measurement by the imaging mass spectrometry unit 1 and an optical image data storage region for storing data collected by the measurement (imaging) by the optical microscope imaging unit 2.
- the image overlay processing unit 35 includes functional blocks such as an image display processing unit 351, an image deformation range designation receiving unit 352, a grid interval adjustment receiving unit 353, and an image deformation processing unit 354 as lower functional blocks.
- the data processing unit 3 is a personal computer (or a higher-performance workstation). By operating dedicated software installed in the computer on the computer, the functions of the blocks described above are performed. It is the structure achieved.
- the input unit 4 is a pointing device such as a keyboard or a mouse
- the display unit 5 is a display monitor.
- the measurement operation of the sample by the imaging mass spectrometer of the present embodiment will be described.
- the optical microscope imaging unit 2 captures the surface of the sample and displays the image. It is displayed on the screen of part 5.
- An operator designates the measurement area which is the whole sample or a part of the sample on the image by the input unit 4.
- the operator once removes the sample and attaches a MALDI matrix to the surface.
- the sample to which the matrix is attached is set at a predetermined measurement position of the imaging mass spectrometer 1 and a predetermined operation is performed by the input unit 4.
- the imaging mass spectrometer 1 performs mass analysis on each of a number of micro areas in the measurement area designated as described above on the sample, and acquires mass analysis data over a predetermined mass-to-charge ratio range. To do.
- the data collection unit 31 performs so-called profile acquisition, collects profile spectrum data having a continuous waveform in the mass-to-charge ratio direction within the mass-to-charge ratio range, and stores it in the spectrum data storage region 321 of the data storage unit 32. save.
- sample surface pattern between different tissues, etc.
- optical microscopic imaging is performed after the matrix is first attached to the sample surface. Shooting may be performed by the unit 2.
- the operator takes out the sample and removes the matrix adhering to the sample surface using a solvent. Thereafter, the sample is stained with a predetermined staining reagent, and the stained sample is set again at a predetermined measurement position of the optical microscope imaging unit 2.
- the optical microscopic imaging unit 2 images the surface of the sample, and the data collection unit 31 stores the stained image data obtained thereby in the optical data in the data storage unit 32.
- the image data is stored in the image data storage area 322. In this way, mass spectrometry imaging data and stained image data for the same sample are stored in the data storage unit 32.
- FIG. 2 is a flowchart showing a procedure of image superposition work
- FIG. 3 is a diagram showing an example of a display screen at the time of image superposition work
- FIG. 4 is an explanatory diagram of image deformation processing.
- the optical image creation unit 34 reads the stained image data from the optical image data storage area 322 of the data storage unit 32, and creates a stained image of the sample based on the data. (Step S1).
- the imaging image creation unit 33 outputs a signal at the mass-to-charge ratio M corresponding to the compound designated from the spectrum data storage area 321 of the data storage unit 32.
- the intensity value data is read out, and a mass spectrometry imaging image at the mass to charge ratio M for the sample is created based on the data (step S2).
- the image display processing unit 351 displays an image superimposing work screen 60 as shown in FIG. 3 on the screen of the display unit 5 (step S3).
- the image superimposing work screen 60 is provided with an image display area 61 in which a superposed image obtained by superimposing a stained image and a mass spectrometry imaging image on the same sample is arranged.
- the superimposed image displayed in the image display area 61 is simply a semi-transparent one of the two images superimposed, and the images are not aligned at all.
- image alignment by linear image deformation such as affine transformation is possible, but here, nonlinear image deformation is performed.
- the stained image of the two images is deformed, but the operator may select an image that is the object of image deformation.
- the image display processing unit 351 displays the entire superimposed image displayed in the image display area 61 on the entire surface in FIG. 3.
- the grid line 62 as shown is displayed (step S4).
- the intersection 62a of the vertical and horizontal grid lines 62 is the grid point in the present invention.
- the grid points may be indicated by a cross shape instead of the grid lines, or the grid points may be indicated only by simple dots.
- the grid line 62 to be displayed may be different from a simple solid line such as a dotted line, or the color of the grid line 62 may be appropriately changed by an operator.
- a grid interval adjustment slider 63 is arranged in the image superimposing work screen 60.
- the grid interval adjustment receiving unit 353 performs the operation. Accordingly, the interval between the grid lines 62 displayed on the superimposed image 61 is adjusted (step S5).
- the image deformation range designation receiving unit 352 is activated, and a desired range on the superimposed image is designated as the image deformation range by the pointing device. It becomes possible to do.
- the shape of the image deformation range that can be specified is a rectangular shape, and its size is arbitrary. This range can be set regardless of the grid line 62.
- FIG. 4B shows an example in which an image deformation range is designated in the image display area 61. Although a superimposed image is actually displayed, it is omitted here.
- the image deformation range so as to include a large number (or one) of rectangular blocks surrounded by four adjacent intersections (grid points) 62a along the grid line 62.
- a plurality of image deformation ranges can be specified at once.
- the image deformation range is determined in this way, when the operator presses the “determination” button 65 for the image deformation range by the input unit 4, the image deformation range designation receiving unit 352 is the image set on the image at that time. Determine the deformation range.
- the image deformation range is rectangular here, the image deformation range can be made into an arbitrary shape, for example, by moving the cursor with a pointing device and setting the range surrounded by the locus as the image deformation range. It may be.
- step S7 the operator selects one of the intersections 62a of the grid lines 62 on the image in the image display area 61, that is, one grid point as a control point by clicking the pointing device, and arbitrarily selects the control point.
- the operation of dragging and dropping to the direction and an arbitrary position is performed (step S7).
- the image deformation processing unit 354 deforms the stained image within the image deformation range in a non-linear manner according to a predetermined algorithm.
- the selected control point is outside the image deformation range, as shown in FIG. 4A, four rectangular blocks surrounding the control point are set as the image deformation range, and the image is within the image deformation range.
- the stained image is deformed nonlinearly according to a predetermined algorithm (step S8). That is, in the latter case, as in the conventional apparatus, the image deformation range is automatically determined according to the grid line interval, whereas in the former case, the image deformation range can be arbitrarily set by the operator. I can decide.
- step S9 the operator confirms on the displayed image whether or not the position of the stained image after deformation and the mass spectrometry imaging image is aligned (step S9), and if further image deformation is necessary, The process returns from step S9 to S5. Then, by repeating steps S5 to S9, the accuracy of alignment between the stained image and the mass spectrometry imaging image is increased stepwise, and if the operator determines that the deviation is acceptable, the process starts from step S9. Proceeding to S ⁇ b> 10, the worker presses the “Save” button 66 on the input unit 4. As a result, the image display processing unit 351 stores the data constituting the superimposed image at that time in the data storage unit 32.
- Non-Patent Document 2 For the above-described image deformation algorithm itself, for example, a known method disclosed in various documents such as Non-Patent Document 2 may be used, and only the image deformation range is different between FIG. 4 (a) and FIG. 4 (b). It is.
- FIG. 4A since the image deformation range is restricted by the grid line interval, it is necessary to widen the grid line interval in order to greatly deform the image. Then, the control points cannot be set in detail. On the other hand, in order to set the control point finely, it is necessary to narrow the grid line interval, and in this case, the range in which the image is deformed is considerably limited.
- the image deformation range is widened while reducing the grid line interval so that the control points can be set finely. A wide range of can be transformed at once.
- the image deformation range can be set so as to exclude the portion. This makes it possible to perform image alignment efficiently so that the same part on the sample is located at the same position on the two superimposed images.
- the image deformation range can be set regardless of the grid line interval for setting the control point on the image.
- the interval between the displayed grid lines is constant.
- the above-described implementation may be made such that a plurality of types of grid line intervals can be mixed instead of one type of grid line intervals displayed on the superimposed image. The effect similar to the example is obtained.
- FIG. 5 is an explanatory diagram of image deformation processing in an imaging mass spectrometer according to another embodiment of the present invention.
- FIG. 5 is a diagram showing grid lines 62 displayed on a superimposed image (not shown) displayed in the image display area 61 as in FIG.
- the operator sets grid lines 62 that are relatively coarse grid line intervals, and then is formed by the grid lines 62.
- a plurality of rectangular blocks or any two-dimensional shape connecting a plurality of intersections 62a
- the operator further sets a dense grid line interval within the dense grid point range.
- the intersection 62a of the vertical and horizontal grid lines 62 is a grid point
- setting the grid line interval is substantially the same as setting the grid point interval. That is, in this embodiment, it is possible to set coarse and dense two-step grid point intervals.
- FIG. 5B the grid lines having two types of grid line intervals are displayed in the image display area 61 in a mixed state. The operator selects an arbitrary intersection 62a on the grid line 62, that is, a grid point as a control point, and then performs an operation of dragging and dropping the control point in an arbitrary direction and an arbitrary position.
- the image deformation range is a range of four adjacent blocks as shown in FIG. Therefore, the image deformation range is wide in a region where the grid line interval is wide, and the image deformation range is narrow in a region where the grid line interval is narrow. Therefore, by appropriately determining the coarse and dense grid point ranges and the grid line intervals in each range according to the amount and range to be deformed on the image, the work efficiency of image alignment is improved compared to conventional devices. can do.
- the characteristic image deformation processing as described above was performed in the superposition of the optical microscopic image such as the stained image and the mass spectrometry imaging image.
- Mass spectrometry imaging images and imaging images obtained by other measurements such as Raman spectroscopy imaging, infrared spectroscopy imaging, X-ray analysis imaging, surface analysis imaging using particle beams such as electron beams and ion beams.
- the present invention can also be applied to superimposing an imaging image obtained by a surface analysis imaging method using a probe such as a scanning probe microscope (SPM).
- SPM scanning probe microscope
- the present invention is not limited to an imaging mass spectrometer, but is effective when superimposing different imaging images obtained on the same sample using a plurality of various measurement techniques as described above.
- the “same sample” here is not necessarily the same sample.
- different samples may be handled as substantially the same sample.
Landscapes
- Engineering & Computer Science (AREA)
- Health & Medical Sciences (AREA)
- Physics & Mathematics (AREA)
- General Physics & Mathematics (AREA)
- General Health & Medical Sciences (AREA)
- Nuclear Medicine, Radiotherapy & Molecular Imaging (AREA)
- Theoretical Computer Science (AREA)
- Chemical & Material Sciences (AREA)
- Immunology (AREA)
- Life Sciences & Earth Sciences (AREA)
- Analytical Chemistry (AREA)
- Biochemistry (AREA)
- Pathology (AREA)
- Computer Vision & Pattern Recognition (AREA)
- Quality & Reliability (AREA)
- Radiology & Medical Imaging (AREA)
- Medical Informatics (AREA)
- Other Investigation Or Analysis Of Materials By Electrical Means (AREA)
- Investigating, Analyzing Materials By Fluorescence Or Luminescence (AREA)
- Chemical Kinetics & Catalysis (AREA)
- Electrochemistry (AREA)
Abstract
同じ試料について得られた染色画像とMSイメージング画像とを重ね合わせて画像位置合わせを行う際に、画像表示処理部は、重ね合わせ画像上にグリッド間隔調整スライダー(63)の操作に応じた間隔のグリッド線(62)を表示する。また、作業者は画像変形範囲「設定」ボタン(64)を押下してマウスで画像上の任意の範囲を指定した上「決定」ボタン(65)を押下すると、画像変形範囲指定受付部は画像変形範囲を決定する。作業者が画像変形範囲内のグリッド線(62)の交点(グリッド点)を選択して任意の位置まで移動させる操作を行うと、画像変形処理部は画像変形範囲内に含まれる画像を操作に応じて変形させる。グリッド線間隔とは無関係に画像変形範囲を設定可能であるので、画像上の部位毎の変形の量と範囲とに応じた的確な画像変形が行え、作業の効率改善を図ることができる。
Description
本発明は、例えばイメージング質量分析装置といった、試料上の2次元領域内の微小領域毎に得られるデータを処理して特定の物質の2次元強度分布を示す画像などを表示するイメージングデータ処理装置に関する。
イメージング質量分析装置は、生体組織切片などの試料の表面の形態を光学顕微鏡によって観察しながら、同じ試料表面における特定の質量電荷比m/zを有するイオンの2次元的な強度分布を測定することが可能な装置である。イメージング質量分析装置を用いて例えば癌などの特定の疾病に特徴的に現れる化合物由来のイオンについての質量分析イメージング画像を観察することにより、その疾病の拡がり具合などを把握することが可能である。こうしたことから、近年、イメージング質量分析装置を利用し、生体組織切片等を対象とした薬物動態解析や各器官での化合物分布の相違、或いは、癌等の病理部位と正常部位との間での化合物分布の差異などを解析する研究が盛んに行われている。
非特許文献1に開示されているように、上記イメージング質量分析装置では、試料上の2次元的な測定領域における特定の質量電荷比を有する物質の2次元強度分布を示すヒートマップ状の画像(質量分析イメージング画像)を作成して表示することができる。また、イメージング質量分析装置に併設されている光学顕微鏡では試料の光学顕微画像が得られるから、この光学顕微画像と任意の質量電荷比における質量分析イメージング画像とを重ね合わせた画像を作成して表示することも可能である。こうした重ね合わせ画像では、生体組織の輪郭や模様等と特定の物質の2次元分布とが併せて表示されるため、生体組織のどの部分にどのような物質が偏在しているか等を観察するのに便利である。
また一般的な光学顕微観察では見えない生体組織中の特定の部位などを顕在化させるために染色した試料を光学顕微鏡で観察したり蛍光標識した試料を蛍光顕微鏡で観察したりした画像と、質量分析イメージング画像とを重ね合わせた画像を作成して表示することも行われている。例えば同じ生体組織切片である試料について質量分析イメージング画像と染色画像とを取得したい場合には、次のような手順で測定(撮影)を実施する。
まず、作業者は目的とする試料の表面にMALDI(マトリクス支援レーザ脱離イオン化)用のマトリクスを塗布し、イメージング質量分析装置により測定を実施して質量分析イメージングデータを収集する。次に、作業者は試料を装置から取り出し、所定の溶剤を用いて試料表面のマトリクスを除去する。そのあと、所定の染色試薬により該試料を染色し、光学顕微鏡により測定を実施して染色画像データを収集する。光学観察よりも質量分析を先に実施するのは、染色された試料は染色試薬の影響により正確な質量分析が行えないためである。
こうして収集された質量分析イメージングデータに基づく質量分析イメージング画像と、染色画像データに基づく染色画像である参照画像とを重ね合わせる場合、質量分析イメージング画像と参照画像とで試料上の同じ部位に対応する画像上での位置が異なるのが一般的である。これは、試料を装置にセットする際の位置のずれのほか、試料表面のマトリクスを除去する際に使用される溶剤により試料の一部の組織等が変形してしまうためである。そのため、多くの場合、参照画像と質量分析イメージング画像とをそのまま重ね合わせることはできず、少なくとも一方の画像について移動、回転、変形(伸縮)、トリミングなどの画像処理を行ったうえで、重ね合わせを行う必要がある(特許文献1~3等参照)。
上記のような画像の位置合わせを自動的に行う試みもなされているものの、生体組織中の或る部位に対応する画像の位置が合っているか否かを機械的に判断するのはかなり難しいため、作業者がマニュアル操作で画像の位置合わせを行っているのが現状である。こうしたマニュアル操作による画像位置合わせ処理の際には、例えば作業者が所定の操作を行うと、グリッド線を参照画像に重畳して表示させる。このグリッド線の交点が作業者が移動を指示できる点であり、作業者は任意の交点をマウス等のポインティングデバイスで選択して能動化した上で、画像上で所望の位置まで移動させる。すると、その移動前の交点の位置をほぼ中心とする所定の範囲の画像が非線形に変形される。
一般的に、グリッド線の交点を選択して移動させる場合、画像が変形する範囲は選択された交点を囲んで最も近接する複数の交点を結ぶ範囲内である。一般に、1枚の画像の中の領域によって変形させたい量と範囲とは異なることが多いが、このような場合に様々な部分の画像位置が合うように画像変形を行うには、変形させたい範囲に合わせて作業者がグリッド線の間隔を様々に変えながら試行錯誤的に作業を進める必要があった。そのため、画像位置を適切に合わせるのに時間が掛かり、作業効率が悪かった。また、こうした作業は作業者にとっても身体的及び精神的に大きな負担であった。
なお、こうした課題は染色画像や蛍光画像、或いは一般的な光学顕微画像と質量分析イメージング画像とを重ね合わせる際に限るものではなく、異なる測定手法で得られるイメージング画像同士を重ね合わせる際に少なからず生じる課題である。ここでいう測定手法とは、具体的には例えば、赤外イメージング法、レーザーラマン分光イメージング法、X線、イオン線、電子線などを用いた表面分析法、などである。
「iMScope TRIO イメージング質量顕微鏡 光学画像・MSイメージング質量分析の重ね合わせ」、[online]、[平成30年3月20日検索]、株式会社島津製作所、インターネット<URL : https://www.an.shimadzu.co.jp/bio/imscope/overlay.htm>
水田 忍、「マルチモダリティ医用三次元画像の自動位置合わせ手法に関する研究」、[online]、[平成30年3月20日検索]、京都大学、インターネット<URL: https://repository.kulib.kyoto-u.ac.jp/dspace/bitstream/2433/157072/2/D_Mizuta_Shinobu.pdf>
本発明は上記課題を解決するために成されたものであり、その目的とするところ、光学顕微画像や質量分析イメージング画像などを重ね合わせるために一方の画像を変形させる際に、画像を変形させるための作業者の操作を円滑化して操作性を向上させることができるイメージングデータ処理装置を提供することである。
上記課題を解決するために成された本発明の第1の態様は、ユーザインターフェイスである入力部及び表示部を有し、試料上の2次元領域内の複数の微小領域に対しそれぞれ第1の測定手法による測定を実行して得られる第1のイメージングデータと、該試料上の前記2次元領域の少なくとも一部を含む範囲について前記第1の測定手法とは異なる第2の測定手法による測定を実行して得られた第2のイメージングデータと、を処理するイメージングデータ処理装置であって、
a)試料上の略同一の範囲について前記第1のイメージングデータに基づいて作成される第1の画像と前記第2のイメージングデータに基づいて作成される第2の画像とを表示部の画面内に重ねて表示するとともに、その重ねて表示される重ね合わせ画像上に、所定間隔のグリッド点を重畳して表示する画像表示処理部と、
b)前記画像表示処理部により前記グリッド点が重畳して表示されている画像上で、入力部を介した操作により画像変形範囲をユーザに指定させる変形範囲指定受付部と、
c)入力部を介したユーザの、前記画像表示処理部により画像上に重畳して表示されているグリッド点の中で前記変形範囲指定受付部により指定された画像変形範囲に含まれるグリッド点の選択、及び画像上での該選択されたグリッド点の移動操作を受けて、重ねて表示されている二つの画像の一方における前記画像変形指示範囲内の画像を、前記選択及び移動操作に応じて変形させる画像変形処理部と、
を備えることを特徴としている。
a)試料上の略同一の範囲について前記第1のイメージングデータに基づいて作成される第1の画像と前記第2のイメージングデータに基づいて作成される第2の画像とを表示部の画面内に重ねて表示するとともに、その重ねて表示される重ね合わせ画像上に、所定間隔のグリッド点を重畳して表示する画像表示処理部と、
b)前記画像表示処理部により前記グリッド点が重畳して表示されている画像上で、入力部を介した操作により画像変形範囲をユーザに指定させる変形範囲指定受付部と、
c)入力部を介したユーザの、前記画像表示処理部により画像上に重畳して表示されているグリッド点の中で前記変形範囲指定受付部により指定された画像変形範囲に含まれるグリッド点の選択、及び画像上での該選択されたグリッド点の移動操作を受けて、重ねて表示されている二つの画像の一方における前記画像変形指示範囲内の画像を、前記選択及び移動操作に応じて変形させる画像変形処理部と、
を備えることを特徴としている。
本発明において、第1及び第2の測定手法とは、質量分析イメージング法、ラマン分光イメージング法、蛍光イメージング法、赤外分光イメージング法、X線分析イメージング法、電子線やイオン線などの粒子線を用いた表面分析イメージング法、走査型プローブ顕微鏡(SPM)などの探針を用いた表面分析イメージング法、光学顕微鏡などの一般的な顕微鏡による顕微観察法などのいずれかとすることができる。
本発明の第1の態様において、画像表示処理部は、第1及び第2のイメージングデータを取得すると、第1のイメージングデータに基づいて第1の画像を作成するとともに、第2のイメージングデータに基づいて第2の画像を作成する。そして、同じ試料の略同一の領域についてのその二つの画像を重ねて表示部の画面内に表示する。また、その重ね合わせ画像の上に、所定間隔のグリッド点を重畳して表示する。ここでのグリッド点は、格子状の線(グリッド線)の交点でもよいし、単に格子状に且つ離散的に配置された複数の点でもよい。各グリッド点を繋ぐグリッド線は表示されている必要は無いが、画像上の各部位の相対位置が把握し易いようにグリッド線の全体又はその一部が表示されるようにしてもよい。なお、二つの画像が重ねられた重ね合わせ画像上にグリッド点を表示する場合、変形対象の画像をユーザが選択できるようにしておくとよい。さらにまた、重畳して表示するグリッド点の間隔はユーザが指定又は調整できるようにしておくとよい。
変形範囲指定受付部は、グリッド点が重畳して表示されている画像上で、ユーザによる入力部の操作を受けて画像変形範囲を決定する。典型的には入力部はマウス等のポインティングデバイスであり、画像上で指定された任意の大きさ、形状の領域を画像変形範囲とすればよい。画像変形処理部は上記画像変形範囲を画像変形処理対象として認識する。そして、ユーザが入力部により、画像上のグリッド点の中で上記画像変形範囲に含まれるグリッド点のいずれかを選択したうえで該選択したグリッド点を任意の位置まで移動させる操作を行うと、この操作に応じて、変形処理対象の画像上における移動前のグリッド点の位置に対応する微小画像を移動後のグリッド点の位置まで移動させ、その移動前のグリッド点を含む画像変形範囲内の各グリッド点の位置に対応する微小画像をそれぞれ所定のアルゴリズムに従って移動させることで該画像変形範囲内の画像全体を変形させる。
ユーザの操作による、上述したような画像変形処理を一又は複数回実施することで、位置合わせ済みの重ね合わせ画像が表示部の画面上に表示される。一回のグリッド点の移動操作に応じて変形される範囲を任意に指定することができるので、1枚の画像の中での変形させたい範囲と量とに応じて画像変形範囲を適宜調整することで、従来よりも少ない操作回数で正確な画像位置合わせが可能となる。
また上記課題を解決するために成された本発明の第2の態様は、ユーザインターフェイスである入力部及び表示部を有し、試料上の2次元領域内の複数の微小領域に対しそれぞれ第1の測定手法による測定を実行して得られる第1のイメージングデータと、該試料上の前記2次元領域の少なくとも一部を含む範囲について前記第1の測定手法とは異なる第2の測定手法による測定を実行して得られた第2のイメージングデータと、を処理するイメージングデータ処理装置であって、
a)試料上の略同一の範囲について前記第1のイメージングデータに基づいて作成される第1の画像と前記第2のイメージングデータに基づいて作成される第2の画像とを表示部の画面内に重ねて表示するとともに、その重ねて表示される重ね合わせ画像上にグリッド点を重畳して表示する画像表示処理部と、
b)画像上の異なる領域毎にそれぞれ前記グリッド点の間隔をユーザに指定させるグリッド点間隔指定受付部と、
c)前記グリッド点間隔指定受付部により指定された間隔を有して前記画像表示処理部により画像に重畳して表示されたグリッド点の選択、及び画像上での該選択されたグリッド点の移動操作を受けて、重ねて表示されている二つの画像の一方における所定範囲の画像を、前記選択及び移動操作に応じて変形させる画像変形処理部と、
を備えることを特徴としている。
a)試料上の略同一の範囲について前記第1のイメージングデータに基づいて作成される第1の画像と前記第2のイメージングデータに基づいて作成される第2の画像とを表示部の画面内に重ねて表示するとともに、その重ねて表示される重ね合わせ画像上にグリッド点を重畳して表示する画像表示処理部と、
b)画像上の異なる領域毎にそれぞれ前記グリッド点の間隔をユーザに指定させるグリッド点間隔指定受付部と、
c)前記グリッド点間隔指定受付部により指定された間隔を有して前記画像表示処理部により画像に重畳して表示されたグリッド点の選択、及び画像上での該選択されたグリッド点の移動操作を受けて、重ねて表示されている二つの画像の一方における所定範囲の画像を、前記選択及び移動操作に応じて変形させる画像変形処理部と、
を備えることを特徴としている。
本発明の第2の態様では、ユーザの入力部の操作を受けて、グリッド点間隔指定受付部は例えばグリッド点が重畳して表示される画像の全面を複数の領域に区切り、その領域毎にそれぞれ異なる(又は同じ)グリッド点間隔を設定する。即ち、異なるグリッド点間隔であるグリッド点の混在を可能とする。具体的には例えば、まず大きな第1のグリッド点間隔のグリッド点を画像全面に表示したあと、一直線上に位置していない3以上のグリッド点で囲まれる1又は複数の所定形状の範囲内に、上記第1のグリッド点間隔に比べて小さな第2のグリッド間隔のグリッド点を設けるとよい。
画像変形処理部は、従来の均一の間隔のグリッド点と同様に、領域によって異なる間隔の多数のグリッド点のうちの任意のグリッド点の選択及び画像上での該選択されたグリッド点の移動操作を受け付け、その操作に応じて画像を変形させる。グリッド点間隔の狭い領域では一つの交点の操作に応じて変形される画像の範囲を狭くし、グリッド点間隔の広い領域では一つのグリッド点に対する操作に応じて変形される画像の範囲を広くするとよい。これにより、1枚の画像の中での変形させたい範囲と量とに応じてグリッド点間隔とその間隔を有するグリッド点を設ける範囲とを適宜調整することで、従来よりも少ない操作回数で正確な位置合わせが可能となる。
なお、上述したように本発明において第1及び第2の測定手法として様々な測定手法を採り得るが、本発明は、単純な移動や回転、伸縮では十分に正確な位置合わせが難しいような場合に特に有効である。そうしたことから、本発明において、第1の測定手法はマトリクス支援レーザイオン化法を用いた質量分析イメージング法であり、前記第2の測定手法は、試料を染色又は蛍光標識したうえで顕微観察する手法であるものとすることができる。
本発明によれば、例えば同じ試料についての染色画像や蛍光顕微画像と質量分析イメージング画像とを精度良く重ね合わせるために一方の画像を変形させる際に、画像を変形させるための作業者の操作を円滑化して操作性を向上させることができる。それによって、画像位置合わせ作業の効率を改善するとともに、作業者の身体的及び精神的な負担を軽減することができる。
以下、本発明に係るイメージングデータ処理装置を含むイメージング質量分析装置の一実施例について、添付図面を参照して説明する。
図1は本実施例によるイメージング質量分析装置の概略構成図である。
図1は本実施例によるイメージング質量分析装置の概略構成図である。
本実施例のイメージング質量分析装置は、試料に対して質量分析イメージング法による測定を実施するイメージング質量分析部1と、試料上の光学顕微画像を撮影する光学顕微撮像部2と、データ処理部3と、ユーザインターフェイスである入力部4及び表示部5と、を含む。
イメージング質量分析部1は例えばMALDIイオントラップ飛行時間型質量分析装置を含み、生体組織切片などの試料上の2次元的な測定領域内の多数の微小領域(測定点)に対してそれぞれ質量分析を実行して測定点毎に質量分析データを取得するものである。
光学顕微撮像部2は光学顕微鏡に撮像部を付加したものであり、試料上の表面の2次元領域の顕微画像を取得するものである。ここでは、この光学顕微撮像部2を、質量分析イメージング法による測定を行う際の測定領域を決めるための光学顕微画像を取得するため、及び、染色した試料についての染色画像を撮影するために用いる。
データ処理部3は、イメージング質量分析部1で収集された各微小領域におけるマススペクトルデータ及び光学顕微撮像部2から入力される光学顕微画像データを受けて所定の処理を行うものであり、データ収集部31、データ格納部32、イメージング画像作成部33、光学画像作成部34、画像重ね合わせ処理部35など、を機能ブロックとして備える。データ格納部32は、イメージング質量分析部1による測定で収集されたデータを格納するスペクトルデータ格納領域321と光学顕微撮像部2による測定(撮影)で収集されたデータを格納する光学画像データ格納領域322とを含む。また、画像重ね合わせ処理部35は、下位の機能ブロックとして、画像表示処理部351、画像変形範囲指定受付部352、グリッド間隔調整受付部353、画像変形処理部354などの機能ブロックを含む。
なお、通常、データ処理部3の実体はパーソナルコンピュータ(又はより高性能なワークステーション)であり、該コンピュータにインストールされた専用のソフトウェアを該コンピュータ上で動作させることにより、上記各ブロックの機能が達成される構成となっている。その場合、入力部4はキーボードやマウス等のポインティングデバイスであり、表示部5はディスプレイモニタである。
次に、本実施例のイメージング質量分析装置による試料の測定作業について説明する。
まず作業者が目的試料を光学顕微撮像部2の所定の測定位置にセットし、入力部4で所定の操作を行うと、光学顕微撮像部2は該試料の表面を撮影し、その画像を表示部5の画面上に表示する。作業者(ユーザ)はその画像上でその試料全体又は試料の一部である測定領域を入力部4で指示する。作業者は試料を一旦取り出し、その表面にMALDI用のマトリクスを付着させる。そして、マトリクスが付着された試料をイメージング質量分析部1の所定の測定位置にセットし、入力部4で所定の操作を行う。これにより、イメージング質量分析部1は、試料上の、上述したように指示された測定領域内の多数の微小領域についてそれぞれ質量分析を実行し、所定の質量電荷比範囲に亘る質量分析データを取得する。このときデータ収集部31は、いわゆるプロファイルアクイジションを実行し、質量電荷比範囲内で質量電荷比方向に連続的な波形であるプロファイルスペクトルデータを収集してデータ格納部32のスペクトルデータ格納領域321に保存する。
まず作業者が目的試料を光学顕微撮像部2の所定の測定位置にセットし、入力部4で所定の操作を行うと、光学顕微撮像部2は該試料の表面を撮影し、その画像を表示部5の画面上に表示する。作業者(ユーザ)はその画像上でその試料全体又は試料の一部である測定領域を入力部4で指示する。作業者は試料を一旦取り出し、その表面にMALDI用のマトリクスを付着させる。そして、マトリクスが付着された試料をイメージング質量分析部1の所定の測定位置にセットし、入力部4で所定の操作を行う。これにより、イメージング質量分析部1は、試料上の、上述したように指示された測定領域内の多数の微小領域についてそれぞれ質量分析を実行し、所定の質量電荷比範囲に亘る質量分析データを取得する。このときデータ収集部31は、いわゆるプロファイルアクイジションを実行し、質量電荷比範囲内で質量電荷比方向に連続的な波形であるプロファイルスペクトルデータを収集してデータ格納部32のスペクトルデータ格納領域321に保存する。
なお、マトリクスを試料表面に付着させても該試料表面の模様(異なる組織の境界等)が比較的鮮明に観察できる場合には、先に試料の表面にマトリクスを付着させたあとに光学顕微撮像部2で撮影を実施してもよい。
質量分析イメージング法による測定後に作業者は試料を取り出し、溶剤を用いて試料表面に付着しているマトリクスを除去する。そのあと、所定の染色試薬により試料を染色し、染色された試料を光学顕微撮像部2の所定の測定位置に再びセットする。そして、作業者が入力部4で所定の操作を行うと、光学顕微撮像部2は該試料の表面を撮影し、データ収集部31はそれにより得られた染色画像データをデータ格納部32の光学画像データ格納領域322に保存する。こうして、同一試料についての質量分析イメージングデータと染色画像データとがデータ格納部32に保存される。
次に、上述したデータが保存されている状態で実施される画像重ね合わせ作業及びその際の画像変形処理について、図2~図4を参照して説明する。図2は画像重ね合わせ作業の手順を示すフローチャート、図3は画像重ね合わせ作業の際の表示画面の一例を示す図、図4は画像変形処理の説明図である。
作業者が入力部4で所定の操作を行うと、光学画像作成部34はデータ格納部32の光学画像データ格納領域322から染色画像データを読み出し、該データに基づいて試料についての染色画像を作成する(ステップS1)。また、作業者が2次元分布を確認したい化合物を入力部4で指定すると、イメージング画像作成部33はデータ格納部32のスペクトルデータ格納領域321から指定された化合物に対応する質量電荷比Mにおける信号強度値データを読み出し、該データに基づいて試料についての質量電荷比Mにおける質量分析イメージング画像を作成する(ステップS2)。
また画像表示処理部351は、図3に示すような画像重ね合わせ作業画面60を表示部5の画面上に表示する(ステップS3)。画像重ね合わせ作業画面60には、同じ試料についての染色画像と質量分析イメージング画像とを重ね合わせた重ね合わせ画像が配置される画像表示領域61が設けられている。このときに画像表示領域61に表示される重ね合わせ画像は単に2枚の画像の一方を半透明化して重ね合わせたものであり、画像の位置合わせは全くなされていない。本実施例の装置では、アフィン変換等の線形画像変形による画像位置合わせも可能であるが、ここでは、非線形画像変形を行うものとする。また、ここでは2枚の画像のうちの染色画像のほうを変形させるものとするが、画像変形の対象である画像を作業者が選択できるようにしてもよい。
作業者が入力部4で所定の操作を行うことにより非線形画像変形を実施する旨を指示すると、画像表示処理部351は画像表示領域61に表示されている重ね合わせ画像の全面に図3中に示しているようなグリッド線62を表示する(ステップS4)。ここでは、縦と横のグリッド線62の交点62aが本発明におけるグリッド点である。ただし、グリッド線の代わりに十字形状でグリッド点を示したり、単なるドットのみでグリッド点を示したりしてもよい。また、表示するグリッド線62を点線などの単純な実線とは異なる態様としたり、その色を作業者が適宜変更できるようにしたりしてもよい。
画像重ね合わせ作業画面60内にはグリッド間隔調整スライダー63が配置されており、作業者が入力部4により該スライダー63のノブを移動させる操作を行うと、グリッド間隔調整受付部353はその操作に応じて重ね合わせ画像61の上に表示させているグリッド線62の間隔を調整する(ステップS5)。また作業者が、入力部4により画像変形範囲「設定」ボタン64を押下すると、画像変形範囲指定受付部352が能動化され、ポインティングデバイスで重ね合わせ画像上の所望の範囲を画像変形範囲として指定することが可能となる。ここでは、指定可能な画像変形範囲の形状は矩形状であり、その大きさは任意である。この範囲はグリッド線62とは無関係に設定可能である。
図4(b)は画像表示領域61内に画像変形範囲を指定した例である。実際には重ね合わせ画像が表示されるが、ここでは省略している。ここでは、グリッド線62に沿った隣接する4つの交点(グリッド点)62aで囲まれる矩形状のブロックを多数(又は一つ)内包するように画像変形範囲を指定することが可能である。また、複数の画像変形範囲を一度に指定することもできる。そうして画像変形範囲が決まったならば、作業者が入力部4により画像変形範囲「決定」ボタン65を押下すると、画像変形範囲指定受付部352はその時点で画像上に設定されている画像変形範囲を確定させる。なお、ここでは画像変形範囲は矩形状であるが、例えばポインティングデバイスによりカーソルを移動させてその軌跡で囲まれる範囲を画像変形範囲とする等により、画像変形範囲を任意形状とすることができるようにしてもよい。
次に、作業者は画像表示領域61内の画像上のグリッド線62の交点62aの一つ、つまり一つのグリッド点をポインティングデバイスのクリック操作によりコントロールポイントとして選択したうえで、該コントロールポイントを任意の方向及び任意の位置までドラッグ&ドロップする操作を行う(ステップS7)。画像変形処理部354はこの操作を受け、そのコントロールポイントが画像変形範囲内にある場合には、その画像変形範囲内の染色画像を所定のアルゴリズムに従って非線形に変形する。一方、選択されたコントロールポイントが画像変形範囲外にある場合には、図4(a)に示すように、そのコントロールポイントを囲む四つの矩形状のブロックを画像変形範囲として、その画像変形範囲内の染色画像を所定のアルゴリズムに従って非線形に変形する(ステップS8)。即ち、後者の場合には、従来の装置と同様に、画像変形範囲がグリッド線の間隔に応じて自動的に決められるのに対し、前者の場合には、画像変形範囲を作業者が任意に決めることができる。
そして、作業者は変形後の染色画像と質量分析イメージング画像との位置が合っているか否かを表示されている画像上で確認し(ステップS9)、さらに画像変形が必要である場合には、ステップS9からS5へと戻る。そして、ステップS5~S9を繰り返すことで、染色画像と質量分析イメージング画像との位置合わせの精度を段階的に高めてゆき、許容できる程度のずれになったと作業者が判断したならばステップS9からS10へと進み、作業者は入力部4で「保存」ボタン66を押下する。これにより、画像表示処理部351はその時点での重ね合わせ画像を構成するデータをデータ格納部32に保存する。
上述した画像変形のアルゴリズム自体は例えば非特許文献2などの様々な文献に開示されている周知の方法を用いればよく、図4(a)と図4(b)とでは画像変形範囲が異なるだけである。図4(a)の場合、画像変形範囲がグリッド線間隔で以て制約されるので、画像を大きく変形させたい場合にはグリッド線間隔を広げる必要がある。そうすると、コントロールポイントを細かく設定することができない。一方、コントロールポイントを細かく設定するにはグリッド線間隔を狭くする必要があり、そうすると、画像が変形される範囲がかなり限られる。
これに対し、図4(b)の場合、グリッド線間隔と画像変形範囲とが関連しないので、コントロールポイントを細かく設定できるようにグリッド線間隔を狭くしながら、画像変形範囲を広くして画像上の広い範囲を一度に変形させるようにすることができる。また、画像上でコンロールポイントから比較的近い位置に変形させたくない部分が存在する場合に、該部分を除外するように画像変形範囲を設定することもできる。これによって、重ね合わせられている二つの画像上で試料上の同じ部位が同じ位置になるように、効率良く画像位置合わせを行うことができる。
なお、上記実施例では、画像上にコントロールポイントを設定するためのグリッド線の間隔とは無関係に画像変形範囲を設定できるようにしていたが、図3に示したように、重ね合わせ画像上に表示されるグリッド線の間隔自体は一定である。これに対し、次に説明する実施例のように、重ね合わせ画像上に表示されるグリッド線の間隔を一種類ではなく、複数種類のグリッド線間隔の混在を可能とするようにしても上記実施例と類似した効果が得られる。
図5は、本発明の他の実施例によるイメージング質量分析装置における画像変形処理の説明図である。
図5は図4と同様に、画像表示領域61内に表示される重ね合わせ画像(図示せず)上に表示されるグリッド線62を示す図である。この実施例のイメージング質量分析装置では、まず図5(a)に示すように、作業者は、比較的粗いグリッド線間隔であるグリッド線62を設定したあと、そのグリッド線62により形成される1又は複数の矩形状(又は複数の交点62aを結んだ任意の2次元形状)のブロックを密グリッド点範囲として指定する。そのうえで、作業者は、その密グリッド点範囲内における密のグリッド線間隔をさらに設定する。
図5は図4と同様に、画像表示領域61内に表示される重ね合わせ画像(図示せず)上に表示されるグリッド線62を示す図である。この実施例のイメージング質量分析装置では、まず図5(a)に示すように、作業者は、比較的粗いグリッド線間隔であるグリッド線62を設定したあと、そのグリッド線62により形成される1又は複数の矩形状(又は複数の交点62aを結んだ任意の2次元形状)のブロックを密グリッド点範囲として指定する。そのうえで、作業者は、その密グリッド点範囲内における密のグリッド線間隔をさらに設定する。
上記実施例と同様に、縦、横のグリッド線62の交点62aがグリッド点であるから、グリッド線間隔を設定することはグリッド点間隔を設定することと実質的に同じである。即ち、本実施例では、粗密の2段階のグリッド点間隔の設定が可能となっている。これにより、図5(b)に示すような、2種類のグリッド線間隔のグリッド線が混在した状態で画像表示領域61内に表示される。作業者はこのグリッド線62における任意の交点62aつまりグリッド点をコントロールポイントとして選択したうえで、そのコントロールポイントを任意の方向、及び、任意の位置にドラッグ&ドロップする操作を行う。
ここでは、画像変形範囲は図4(a)に示したように、隣接する4ブロックの範囲である。そのため、グリッド線間隔が広い領域では画像変形範囲も広く、グリッド線間隔が狭い領域では画像変形範囲も狭くなる。したがって、画像上において変形させたい量と範囲とに応じて、粗密のグリッド点範囲とその各範囲におけるグリッド線間隔とを適宜に定めることで、従来装置に比べて画像位置合わせの作業効率を改善することができる。
なお、上記実施例のイメージング質量分析装置では、染色画像等の光学顕微画像と質量分析イメージング画像との重ね合わせにおいて上述したような特徴的な画像変形処理を実施していたが、同じ試料についての質量分析イメージング画像と、他の測定によって得られるイメージング画像、例えばラマン分光イメージング法、赤外分光イメージング法、X線分析イメージング法、電子線やイオン線などの粒子線を用いた表面分析イメージング法、或いは、走査型プローブ顕微鏡(SPM)などの探針を用いた表面分析イメージング法などにより得られたイメージング画像などと、を重ね合わせる際にも、本発明を適用可能であることは明らかである。また、イメージング質量分析装置に限らず、上述したような各種の測定手法を複数用いて同じ試料について得られた異なるイメージング画像を重ね合わせる際にも本発明は有効である。
なお、ここで「同じ試料」とは必ずしも全く同一の試料であるとは限らない。例えば生体組織をごく薄くスライスすることで形成した連続切片試料において隣接する切片試料であれば、異なる試料でも実質的に同じ試料として扱えることがある。こうした場合には、同じ試料であるとみなせる互いに異なる試料についてそれぞれ得られたイメージング画像を重ね合わせる際に本発明を適用することは十分に有用である。
さらにまた、上記実施例はあくまでも本発明の一例であり、上記記載の各種の変形例のほか、本発明の趣旨の範囲で適宜に変更、修正、追加を行っても本願特許請求の範囲に包含されることは当然である。
1…イメージング質量分析部
2…光学顕微撮像部
3…データ処理部
31…データ収集部
32…データ格納部
321…スペクトルデータ格納領域
322…光学画像データ格納領域
33…イメージング画像作成部
34…光学画像作成部
35…画像重ね合わせ処理部
351…画像表示処理部
352…画像変形範囲指定受付部
353…グリッド間隔調整受付部
354…画像変形処理部
4…入力部
5…表示部
60…画像重ね合わせ作業画面
61…画像表示領域
62…グリッド
63…グリッド間隔調整スライダー
64…画像変形範囲「設定」ボタン
65…画像変形範囲「決定」ボタン
66…「保存」ボタン
2…光学顕微撮像部
3…データ処理部
31…データ収集部
32…データ格納部
321…スペクトルデータ格納領域
322…光学画像データ格納領域
33…イメージング画像作成部
34…光学画像作成部
35…画像重ね合わせ処理部
351…画像表示処理部
352…画像変形範囲指定受付部
353…グリッド間隔調整受付部
354…画像変形処理部
4…入力部
5…表示部
60…画像重ね合わせ作業画面
61…画像表示領域
62…グリッド
63…グリッド間隔調整スライダー
64…画像変形範囲「設定」ボタン
65…画像変形範囲「決定」ボタン
66…「保存」ボタン
Claims (3)
- ユーザインターフェイスである入力部及び表示部を有し、試料上の2次元領域内の複数の微小領域に対しそれぞれ第1の測定手法による測定を実行して得られる第1のイメージングデータと、該試料上の前記2次元領域の少なくとも一部を含む範囲について前記第1の測定手法とは異なる第2の測定手法による測定を実行して得られた第2のイメージングデータと、を処理するイメージングデータ処理装置であって、
a)試料上の略同一の範囲について前記第1のイメージングデータに基づいて作成される第1の画像と前記第2のイメージングデータに基づいて作成される第2の画像とを表示部の画面内に重ねて表示するとともに、その重ねて表示される重ね合わせ画像上に、所定間隔のグリッド点を重畳して表示する画像表示処理部と、
b)前記画像表示処理部により前記グリッド点が重畳して表示されている画像上で、入力部を介した操作により画像変形範囲をユーザに指定させる変形範囲指定受付部と、
c)入力部を介したユーザの、前記画像表示処理部により画像上に重畳して表示されているグリッド点の中で前記変形範囲指定受付部により指定された画像変形範囲に含まれるグリッド点の選択、及び画像上での該選択されたグリッド点の移動操作を受けて、重ねて表示されている二つの画像の一方における前記画像変形指示範囲内の画像を、前記選択及び移動操作に応じて変形させる画像変形処理部と、
を備えることを特徴とするイメージングデータ処理装置。 - ユーザインターフェイスである入力部及び表示部を有し、試料上の2次元領域内の複数の微小領域に対しそれぞれ第1の測定手法による測定を実行して得られる第1のイメージングデータと、該試料上の前記2次元領域の少なくとも一部を含む範囲について前記第1の測定手法とは異なる第2の測定手法による測定を実行して得られた第2のイメージングデータと、を処理するイメージングデータ処理装置であって、
a)試料上の略同一の範囲について前記第1のイメージングデータに基づいて作成される第1の画像と前記第2のイメージングデータに基づいて作成される第2の画像とを表示部の画面内に重ねて表示するとともに、その重ねて表示される重ね合わせ画像上にグリッド点を重畳して表示する画像表示処理部と、
b)画像上の異なる領域毎にそれぞれ前記グリッド点の間隔をユーザに指定させるグリッド点間隔指定受付部と、
c)前記グリッド点間隔指定受付部により指定された間隔を有して前記画像表示処理部により画像に重畳して表示されたグリッド点の選択、及び画像上での該選択されたグリッド点の移動操作を受けて、重ねて表示されている二つの画像の一方における所定範囲の画像を、前記選択及び移動操作に応じて変形させる画像変形処理部と、
を備えることを特徴とするイメージングデータ処理装置。 - 請求項1又は2に記載のイメージングデータ処理装置であって、
前記第1の測定手法はマトリクス支援レーザイオン化法を用いた質量分析イメージング法であり、前記第2の測定手法は、試料を染色又は蛍光標識したうえで顕微観察する手法であることを特徴とするイメージングデータ処理装置。
Priority Applications (3)
| Application Number | Priority Date | Filing Date | Title |
|---|---|---|---|
| US17/058,003 US11861826B2 (en) | 2018-05-30 | 2018-05-30 | Imaging data processing device |
| PCT/JP2018/020832 WO2019229897A1 (ja) | 2018-05-30 | 2018-05-30 | イメージングデータ処理装置 |
| JP2020522472A JP6973638B2 (ja) | 2018-05-30 | 2018-05-30 | イメージングデータ処理装置 |
Applications Claiming Priority (1)
| Application Number | Priority Date | Filing Date | Title |
|---|---|---|---|
| PCT/JP2018/020832 WO2019229897A1 (ja) | 2018-05-30 | 2018-05-30 | イメージングデータ処理装置 |
Publications (1)
| Publication Number | Publication Date |
|---|---|
| WO2019229897A1 true WO2019229897A1 (ja) | 2019-12-05 |
Family
ID=68697906
Family Applications (1)
| Application Number | Title | Priority Date | Filing Date |
|---|---|---|---|
| PCT/JP2018/020832 Ceased WO2019229897A1 (ja) | 2018-05-30 | 2018-05-30 | イメージングデータ処理装置 |
Country Status (3)
| Country | Link |
|---|---|
| US (1) | US11861826B2 (ja) |
| JP (1) | JP6973638B2 (ja) |
| WO (1) | WO2019229897A1 (ja) |
Cited By (1)
| Publication number | Priority date | Publication date | Assignee | Title |
|---|---|---|---|---|
| JP2021148679A (ja) * | 2020-03-23 | 2021-09-27 | 株式会社島津製作所 | イメージング質量分析システム、及び、イメージング質量分析を利用した分析方法 |
Citations (4)
| Publication number | Priority date | Publication date | Assignee | Title |
|---|---|---|---|---|
| JPH10124535A (ja) * | 1996-09-26 | 1998-05-15 | Commiss Energ Atom | データベースの画像中のサンプルの探索方法 |
| JP2009025275A (ja) * | 2007-07-24 | 2009-02-05 | Shimadzu Corp | 質量分析装置 |
| JP2013257282A (ja) * | 2012-06-14 | 2013-12-26 | Canon Inc | 画像処理方法および装置 |
| WO2017002226A1 (ja) * | 2015-07-01 | 2017-01-05 | 株式会社島津製作所 | データ処理装置 |
Family Cites Families (11)
| Publication number | Priority date | Publication date | Assignee | Title |
|---|---|---|---|---|
| US7224827B2 (en) | 2002-09-27 | 2007-05-29 | The Board Of Trustees Of The Leland Stanford Junior University | Method for matching and registering medical image data |
| JP4863692B2 (ja) * | 2005-11-02 | 2012-01-25 | 株式会社島津製作所 | イメージ質量分析装置 |
| US8119982B2 (en) * | 2007-04-04 | 2012-02-21 | Shimadzu Corporation | Method and system for mass spectrometry data analysis |
| WO2010001439A1 (ja) * | 2008-07-03 | 2010-01-07 | 株式会社島津製作所 | 質量分析装置 |
| US10012572B2 (en) * | 2011-04-28 | 2018-07-03 | Japanese Foundation for Cancer Research, Keio University, National University Corporation Hamamatsu, and Shimadzu Co. | Mass-analysis data processing method and system |
| JP5708400B2 (ja) * | 2011-09-26 | 2015-04-30 | 株式会社島津製作所 | イメージング質量分析装置及び質量分析データ処理方法 |
| JP6004956B2 (ja) * | 2013-01-29 | 2016-10-12 | 株式会社日立ハイテクノロジーズ | パターン評価装置、及び、パターン評価装置を備えた外観検査装置 |
| JP5971184B2 (ja) * | 2013-04-22 | 2016-08-17 | 株式会社島津製作所 | イメージング質量分析データ処理方法及びイメージング質量分析装置 |
| JP2015025758A (ja) * | 2013-07-26 | 2015-02-05 | Hoya株式会社 | 基板検査方法、基板製造方法および基板検査装置 |
| US10094767B2 (en) * | 2014-09-19 | 2018-10-09 | Konica Minolta, Inc. | Image processor, image processing method, and program |
| CN112782140A (zh) * | 2014-12-03 | 2021-05-11 | 伊索普莱西斯公司 | 细胞分泌特征的分析和筛选 |
-
2018
- 2018-05-30 US US17/058,003 patent/US11861826B2/en active Active
- 2018-05-30 WO PCT/JP2018/020832 patent/WO2019229897A1/ja not_active Ceased
- 2018-05-30 JP JP2020522472A patent/JP6973638B2/ja active Active
Patent Citations (4)
| Publication number | Priority date | Publication date | Assignee | Title |
|---|---|---|---|---|
| JPH10124535A (ja) * | 1996-09-26 | 1998-05-15 | Commiss Energ Atom | データベースの画像中のサンプルの探索方法 |
| JP2009025275A (ja) * | 2007-07-24 | 2009-02-05 | Shimadzu Corp | 質量分析装置 |
| JP2013257282A (ja) * | 2012-06-14 | 2013-12-26 | Canon Inc | 画像処理方法および装置 |
| WO2017002226A1 (ja) * | 2015-07-01 | 2017-01-05 | 株式会社島津製作所 | データ処理装置 |
Cited By (3)
| Publication number | Priority date | Publication date | Assignee | Title |
|---|---|---|---|---|
| JP2021148679A (ja) * | 2020-03-23 | 2021-09-27 | 株式会社島津製作所 | イメージング質量分析システム、及び、イメージング質量分析を利用した分析方法 |
| US11469087B2 (en) | 2020-03-23 | 2022-10-11 | Shimadzu Corporation | Imaging mass spectrometry system and analytical method using imaging mass spectrometry |
| JP7375640B2 (ja) | 2020-03-23 | 2023-11-08 | 株式会社島津製作所 | イメージング質量分析システム、及び、イメージング質量分析を利用した分析方法 |
Also Published As
| Publication number | Publication date |
|---|---|
| JPWO2019229897A1 (ja) | 2021-03-11 |
| US20210302369A1 (en) | 2021-09-30 |
| US11861826B2 (en) | 2024-01-02 |
| JP6973638B2 (ja) | 2021-12-01 |
Similar Documents
| Publication | Publication Date | Title |
|---|---|---|
| JP6927416B2 (ja) | イメージングデータ処理装置及びイメージングデータ処理プログラム | |
| JP2009025275A (ja) | 質量分析装置 | |
| JP6176397B2 (ja) | 分析データ処理装置 | |
| JP2022023556A (ja) | 試料分析装置及び方法 | |
| JP7004073B2 (ja) | イメージングデータ処理装置 | |
| WO2019150575A1 (ja) | イメージング質量分析データ解析装置 | |
| JP6927415B2 (ja) | イメージング質量分析におけるデータ処理方法及びデータ処理プログラム | |
| US20110315874A1 (en) | Mass Spectrometer | |
| JP6973638B2 (ja) | イメージングデータ処理装置 | |
| WO2020105102A1 (ja) | イメージングデータ解析装置 | |
| JP7001157B2 (ja) | イメージング質量分析データ処理装置 | |
| WO2021075254A1 (ja) | イメージング質量分析装置 | |
| JP2021009840A (ja) | 電子顕微鏡を用いる生命科学試料の連続微細切片からナノメートル解像度3d画像データを記録するための自動ロバスト法 | |
| JP7040537B2 (ja) | イメージング質量分析装置 | |
| JP6973639B2 (ja) | イメージング質量分析データ処理装置 | |
| CN114556523B (zh) | 成像分析装置以及成像数据解析方法 | |
| WO2022003890A1 (ja) | イメージング質量分析装置及びイメージング質量分析データ処理方法 | |
| EP4679078A1 (en) | Analysis method employing imaging mass spectrometry | |
| JP7753765B2 (ja) | 画像表示方法、分析システムおよびプログラム |
Legal Events
| Date | Code | Title | Description |
|---|---|---|---|
| 121 | Ep: the epo has been informed by wipo that ep was designated in this application |
Ref document number: 18920488 Country of ref document: EP Kind code of ref document: A1 |
|
| ENP | Entry into the national phase |
Ref document number: 2020522472 Country of ref document: JP Kind code of ref document: A |
|
| NENP | Non-entry into the national phase |
Ref country code: DE |
|
| 122 | Ep: pct application non-entry in european phase |
Ref document number: 18920488 Country of ref document: EP Kind code of ref document: A1 |