WO2019216378A1 - 演算装置、検知装置、演算方法、及び、コンピュータプログラム - Google Patents
演算装置、検知装置、演算方法、及び、コンピュータプログラム Download PDFInfo
- Publication number
- WO2019216378A1 WO2019216378A1 PCT/JP2019/018574 JP2019018574W WO2019216378A1 WO 2019216378 A1 WO2019216378 A1 WO 2019216378A1 JP 2019018574 W JP2019018574 W JP 2019018574W WO 2019216378 A1 WO2019216378 A1 WO 2019216378A1
- Authority
- WO
- WIPO (PCT)
- Prior art keywords
- rri
- data
- rri data
- target range
- correction target
- Prior art date
- Legal status (The legal status is an assumption and is not a legal conclusion. Google has not performed a legal analysis and makes no representation as to the accuracy of the status listed.)
- Ceased
Links
Images










Classifications
-
- A—HUMAN NECESSITIES
- A61—MEDICAL OR VETERINARY SCIENCE; HYGIENE
- A61B—DIAGNOSIS; SURGERY; IDENTIFICATION
- A61B5/00—Measuring for diagnostic purposes; Identification of persons
- A61B5/24—Detecting, measuring or recording bioelectric or biomagnetic signals of the body or parts thereof
- A61B5/316—Modalities, i.e. specific diagnostic methods
- A61B5/318—Heart-related electrical modalities, e.g. electrocardiography [ECG]
- A61B5/346—Analysis of electrocardiograms
- A61B5/349—Detecting specific parameters of the electrocardiograph cycle
Definitions
- the present disclosure relates to a calculation device, a detection device, a calculation method, and a computer program.
- This application claims priority based on Japanese Patent Application No. 2018-090592 filed on May 9, 2018, and incorporates all the description content described in the above Japanese application.
- HRV heart rate variability
- Health monitoring techniques such as detection of a sign of epileptic seizure (Japanese Patent Laid-Open No. 2015-112423) and detection of apnea (Japanese Patent Laid-Open No. 2016-214491) are known.
- R-wave false detection and detection omission Another example of a factor that lowers the reliability of R-wave detection is premature contraction (PVC: Premature-Ventricular-Contraction), which is a general arrhythmia that can occur even in healthy individuals. This is because artifacts are mixed into the RRI when PVC occurs.
- PVC Premature-Ventricular-Contraction
- the computing device is a computing device that corrects RRI data, which is data of an interval between adjacent R waves of an electrocardiogram signal, and is configured to reduce noise in the RRI data obtained in time series.
- the RRI data in the correction target range is corrected by detecting the correction target range including the RRI data and inputting the RRI data in the correction target range into a DAE (denoising autoencoder).
- the detection device is equipped with the above arithmetic device, and detects specific biological information based on RRI data obtained in time series including RRI data of the correction target range.
- the calculation method is a calculation method for correcting RRI data that is data of an interval between adjacent R waves of an electrocardiogram signal, and includes noise among the RRI data obtained in time series. And a step of detecting the correction target range including the RRI data and correcting the RRI data of the correction target range by inputting the RRI data of the correction target range to the DAE.
- the computer program is a program that causes a computer to function as an arithmetic unit that corrects RRI data that is data of adjacent R-wave intervals of an electrocardiogram signal.
- FIG. 1 is a diagram illustrating an outline of a configuration of a detection device according to an embodiment.
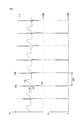
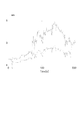
- A) of FIG. 2 is a figure which shows an example of an electrocardiogram signal
- (b) is a figure which shows the R wave data corresponding to the electrocardiogram signal of (a).
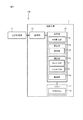
- FIG. 3 is a block diagram illustrating an example of a configuration of an arithmetic device included in the detection device of FIG.
- FIG. 4 is a diagram illustrating an example of an electrocardiogram signal when PVC occurs.
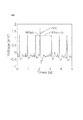
- FIG. 5 is a diagram showing SDNN calculated from RRI data mixed with artificial PVC artifacts.
- FIG. 6 is a diagram showing LF / HF calculated from RRI data mixed with artificial PVC artifacts.
- FIG. 7A is a diagram showing a relationship between two HRV index variables (variable 1, variable 2) and two principal components (first principal component, second principal component).
- FIG. 7B is a diagram for explaining the relationship between two HRV index variables, two principal components, and a T2 statistic.
- FIG. 8A is a diagram illustrating Expression (1) indicating the Hankel matrix.
- FIG. 8B is a diagram for specifically explaining the construction of the model shown in FIG. 9.
- FIG. 8C is a diagram illustrating an outline of the configuration of the DAE and an outline of data input to and output from the DAE.
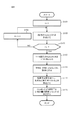
- FIG. 9 is a flowchart illustrating an example of an algorithm for constructing a model used by the processing unit of the arithmetic device to detect PVC artifacts using MSPC-SSA.
- FIG. 9 is a flowchart illustrating an example of an algorithm for constructing a model used by the processing unit of the arithmetic device to detect PVC artifacts using MSPC-SSA.
- FIG. 10 is a flowchart showing an algorithm for detecting a PVC artifact in real time by the processing unit of the arithmetic device using MSPC-SSA.
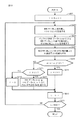
- FIG. 11 is a flowchart showing a correction algorithm in which the processing unit of the arithmetic unit removes PVC artifacts from the RRI data using DAE-RM.
- FIG. 12 is a diagram showing attributes of subjects A to R used by the inventors for verification.
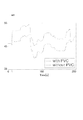
- FIG. 13A is a diagram showing RRI data obtained from the subject M.
- FIG. 13B is meanNN calculated from RRI data obtained from the subject M in FIG. 13A.
- FIG. 13C is SDNN calculated from the RRI data obtained from the subject M in FIG. 13A.
- FIG. 13A is a diagram showing RRI data obtained from the subject M.
- FIG. 13B is meanNN calculated from RRI data obtained from the subject M in FIG. 13A.
- FIG. 13C is SDNN calculated from the RRI data obtained from the subject M in FIG.
- FIG. 14A is a total power calculated from RRI data obtained from the subject M in FIG. 13A.
- FIG. 14B is the RMSSD calculated from the RRI data obtained from the subject M in FIG. 13A.
- FIG. 14C is NN50 calculated from RRI data obtained from the subject M in FIG. 13A.
- FIG. 15A is an LF calculated from RRI data obtained from the subject M in FIG. 13A.
- FIG. 15B is HF calculated from the RRI data obtained from the subject M in FIG. 13A.
- FIG. 15C is LF / HF calculated from RRI data obtained from the subject M in FIG. 13A.
- FIG. 16A is a diagram showing a result when DAE whose activation function is a sigmoid function is applied in the inventors' verification.
- FIG. 16A is a diagram showing a result when DAE whose activation function is a sigmoid function is applied in the inventors' verification.
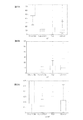
- FIG. 16B is a diagram illustrating a result of applying DAE whose activation function is ReLU in the verification by the inventors.
- FIG. 17A is a diagram illustrating a result of applying the DAE in which the activation function of the intermediate layer is ReLU and setting the number of input variables to 6 in the inventors' verification.
- FIG. 17B is a diagram illustrating a result of applying the DAE in which the activation function of the intermediate layer is ReLU and setting the number of input variables to 8 in the inventors' verification.
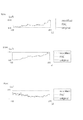
- FIG. 18A is a diagram showing RRI data after correction by applying DAE, PLS, and LW-PLS in the inventors' verification.
- FIG. 18B is a diagram showing meanNN obtained from the RRI data of FIG. 18A in the inventors' verification.
- FIG. 18C is a diagram showing SDNN obtained from the RRI data of FIG. 18A in the inventors' verification.
- FIG. 19A is a diagram showing Total Power obtained from the RRI data of FIG. 18A in the inventors' verification.
- FIG. 19B is a diagram showing RMSSD obtained from the RRI data of FIG. 18A in the inventors' verification.
- FIG. 19C is a diagram showing the NN 50 obtained from the RRI data in FIG. 18A in the inventors' verification.
- FIG. 20A is a diagram showing LF obtained from the RRI data of FIG. 18A in the inventors' verification.
- FIG. 20B is a diagram showing HF obtained from the RRI data of FIG. 18A in the inventors' verification.
- FIG. 19A is a diagram showing Total Power obtained from the RRI data of FIG. 18A in the inventors' verification.
- FIG. 19B is a diagram showing RMSSD obtained from the RRI data of FIG. 18A in the inventors' verification.
- FIG. 20C is a diagram showing LF / HF obtained from the RRI data of FIG. 18A in the inventors' verification.
- FIG. 21A is a diagram showing corrected RRI data by applying ReLUDAE, typicalDAE, PLS, and LW-PLS in the inventors' verification.
- FIG. 21B is a diagram showing meanNN obtained from the corrected RRI data of FIG. 21A in the inventors' verification.
- FIG. 21C is a diagram showing SDNN obtained from the corrected RRI data of FIG. 21A in the inventors' verification.
- FIG. 22A is a diagram showing the total power obtained from the corrected RRI data in FIG. 21A in the inventors' verification.
- FIG. 22B is a diagram showing RMSSD obtained from the corrected RRI data of FIG.
- FIG. 22C is a diagram showing the NN 50 obtained from the corrected RRI data in FIG. 21A in the inventors' verification.
- FIG. 23A is a diagram showing LF obtained from the corrected RRI data in FIG. 21A in the verification by the inventors.
- FIG. 23B is a diagram showing HF obtained from the corrected RRI data of FIG. 21A in the inventors' verification.
- FIG. 23C is a diagram showing LF / HF obtained from the corrected RRI data in FIG. 21A in the inventors' verification.
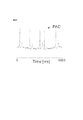
- FIG. 24 is a diagram showing an example of an electrocardiogram waveform in which PAC (Premature Atrial Contraction) occurs.
- FIG. PAC Premature Atrial Contraction
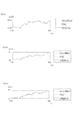
- FIG. 25 is a diagram showing an example of RRI data to which a PAC artificial artifact is added.
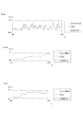
- FIG. 26A is a diagram showing original RRI data, RRI data to which an artificial artifact is added, and RRI data after correction by DAE-RM.
- FIG. 26B is a diagram showing meanNN obtained from the RRI data in FIG. 26A in the inventors' verification.
- FIG. 26C is a diagram showing SDNN obtained from the RRI data of FIG. 26A in the inventors' verification.
- FIG. 27A is a diagram showing Total Power obtained from the RRI data of FIG. 26A in the inventors' verification.
- FIG. 27B is a diagram showing RMSSD obtained from the RRI data of FIG. 26A in the inventors' verification.
- FIG. 26A is a diagram showing original RRI data, RRI data to which an artificial artifact is added, and RRI data after correction by DAE-RM.
- FIG. 26B is a diagram showing meanNN obtained from the RRI data in
- FIG. 27C is a diagram showing the NN 50 obtained from the RRI data of FIG. 26A in the inventors' verification.
- FIG. 28A is a diagram showing LF obtained from the RRI data of FIG. 26A in the inventors' verification.
- FIG. 28B is a diagram showing HF obtained from the RRI data of FIG. 26A in the inventors' verification.
- FIG. 28C is a diagram showing LF / HF obtained from the RRI data of FIG. 26A in the inventors' verification.
- An arithmetic device included in this embodiment is an arithmetic device that corrects RRI data, which is data of an interval between adjacent R waves of an electrocardiogram signal, and includes RRI data obtained in time series. Then, the RRI data in the correction target range is corrected by detecting the correction target range including the RRI data having noise and inputting the RRI data in the correction target range into a DAE (denoisingenautoencoder).
- Noise is, for example, extra-systolic contraction (PVC: PrematureRVentricular Contraction) and lack of R-wave detection.
- the variation of RRI data is heart rate variability (HRV), and HRV analysis is used for various health monitoring techniques. Therefore, the accuracy of the HRV analysis can be improved by correcting the RRI data in the correction target range including the RRI data having noise. As a result, the performance of health monitoring technology using HRV analysis can be improved.
- HRV heart rate variability
- detecting includes detecting a correction target range including RRI data in which noise is caused by PVC.
- the range of the RRI data including noise due to PVC is set as a correction target range, the RRI data excluding the noise due to PVC is obtained from the measured RRI data. As a result, the accuracy of the HRV analysis of the corrected RRI data is improved.
- the activation function of DAE is ReLU (Rectified Linear Unit).
- ReLU Rectified Linear Unit
- the DAE whose activation function is ReLU is applied to the RRI data after the correction, as compared to the case where other activation functions are applied. It has been verified that the degree of follow-up of the RRI data with respect to the RRI data free from noise caused by PVC is high. That is, when the RRI data includes noise due to PVC, the correction function is more accurate when the activation function is ReLU. Therefore, the accuracy of the HRV analysis of the corrected RRI data can be further improved.
- the detecting includes detecting a correction target range including RRI data in which noise is caused by lack of R-wave detection.
- the range of RRI data including noise due to lack of detection of the R wave is set as a correction target range, the RRI data excluding this noise is obtained from the measured RRI data. As a result, the accuracy of the HRV analysis of the corrected RRI data is improved.
- the activation function of DAE is a sigmoid function.
- the activation function is applied to the RRI data by applying the DAE whose activation function is the sigmoid function. It has been verified that the RRI data after correction has a higher degree of follow-up with respect to RRI data free from noise due to lack of R-wave detection. In other words, when the RRI data includes noise due to lack of R-wave detection, the correction function is more accurate when the activation function is a sigmoid function. Therefore, the accuracy of the HRV analysis of the corrected RRI data can be further improved.
- the detected correction target range is a correction target range including RRI data in which noise is caused by PVC, or the noise is an R wave.
- the DAE activation function is switched between the ReLU and the sigmoid function according to the correction target range including the RRI data that is caused by the lack of detection of the RRI. Thereby, optimal correction can be performed according to the noise included in the RRI data.
- the number of RRI data input to the DAE when correcting the RRI data in the correction target range matches the number of RRI data included in the correction target range.
- the number of RRI data included in the correction target range is, for example, when the noise is caused by PVC and the noise appears in two consecutive beats, that is, a total of four beats, two beats and one beat before and after. This makes it possible to correct the necessary range without unnecessarily increasing the correction target range.
- detecting includes detecting a correction target range including RRI data in which noise is caused by PAC.
- the range of RRI data including noise due to PAC is corrected as a correction target range, RRI data in which noise due to PAC is eliminated from the measured RRI data is obtained. As a result, the accuracy of the HRV analysis of the corrected RRI data is improved.
- the detection device included in the present embodiment is equipped with the arithmetic device according to any one of (1) to (7), and the RRI obtained in time series including the RRI data of the correction target range.
- a specific biological state is detected based on the data.
- the specific biological state is, for example, a sign of epileptic seizure, an apnea state, a drowsiness state, or the like. Since the arithmetic device according to any one of (1) to (7) is mounted, this detection device has the same effect as the arithmetic device according to (1) to (7). That is, it is possible to improve the detection accuracy of the above-described biological state using HRV analysis.
- An arithmetic method included in the present embodiment is an arithmetic method executed in the arithmetic device according to any one of (1) to (7). Therefore, this calculation method has the same effects as the calculation devices described in (1) to (7).
- the computer program included in the present embodiment is a program that causes a computer to function as the arithmetic device described in (1) to (7). Therefore, this computer program has the same effects as the arithmetic devices described in (1) to (7).
- the computer program is stored in a computer-readable non-transitory storage medium.
- FIG. 1 is a diagram showing an outline of the configuration of the detection apparatus according to the present embodiment.
- detection device 100 includes a calculation device 1 and a heart rate measuring device 2.
- the detection device according to the present embodiment is a detection device that detects a specific biological state based on a subject's heartbeat.
- the specific biological state is, for example, a sign of epileptic seizure, an apnea state, a drowsiness state, or the like.
- the computing device 1 and the heart rate measuring device 2 can communicate with each other and wirelessly communicate as an example.
- the wireless communication is, for example, short-range wireless communication such as Bluetooth (registered trademark), communication via the Internet, or the like.
- the heartbeat measuring device 2 is a small and lightweight wearable device that is attached to the body of the subject P and measures the heartbeat of the subject P.
- a plurality of (three in FIG. 1) electrodes 21 attached to the body surface of the subject P are connected to the heart rate measuring device 2.
- the three electrodes 21 are, for example, a plus electrode, a minus electrode, and a ground electrode.
- FIG. 2 is a figure which shows an example of an electrocardiogram signal.
- the vertical axis represents potential and the horizontal axis represents time.
- R wave a potential change composed of P to T waves as shown in FIG.
- the peak with the highest potential among potential changes in a unit cycle is called an R wave, and the heart beats at the timing of the R wave.
- the heartbeat measuring device 2 transmits R wave data indicating the R wave to the computing device 1.
- (B) in FIG. 2 shows R wave data corresponding to the electrocardiogram signal in (a) in FIG.
- the period corresponding to the R wave in the electrocardiogram signal (period in which the signal intensity I exceeds a predetermined intensity threshold Ith) is set to “1”, and other periods are “ Data representing a rectangular pulse train set to “0”.
- the arithmetic device 1 functions as a detection device that detects a specific biological state such as an epileptic seizure based on the R wave data transmitted from the heartbeat measuring device 2, and also serves as a correction device that corrects RRI described later. Function.
- the arithmetic device 1 is a communication terminal such as a smartphone or a personal computer.
- FIG. 3 is a block diagram showing an example of the configuration of the arithmetic device 1.
- the arithmetic device 1 includes a processing unit 10 including a dedicated microcomputer.
- the arithmetic device 1 has a memory 12, and a program 121 for performing arithmetic operations in the processing unit 10 is stored in the memory 12.
- the computing device 1 has a communication unit 13 that communicates with the heart rate measuring device 2.
- the communication unit 13 receives a radio signal indicating an R wave transmitted from the heartbeat measuring device 2, generates data indicating the R wave from the received radio signal, and inputs the data to the processing unit 10.
- the communication unit 13 may be a reading device that accesses a recording medium that records data indicating R waves and reads data from the recording medium. Acquiring data includes receiving data by communication and reading data from a recording medium.
- RRI data which is time series data of RRI variables indicating R wave intervals
- RRI data may contain artifacts (noise).
- the cause of the artifact mixed in the RRI data includes the detection failure of the R wave and the occurrence of premature contraction (PVC: Premature Ventricular Contraction) which is an arrhythmia. , PVC artifacts) are detected and corrected.
- An index used for HRV analysis includes a time domain index and a frequency domain index.
- the time domain indicators include the following five indicators.
- the time domain index is calculated directly from the RRI data. 1) meanNN: RRI average value 2) SDNN: RRI standard deviation 3) Total Power: RRI variance 4) RMSSD: root mean square difference of adjacent RRI 5) NN50: adjacent RRI difference of 50 ms Number of times exceeded
- the frequency domain index includes the following three indices.
- the frequency domain index is calculated from the power spectrum density (PSD) of the RRI data. Since RRI data is not sampled at equal intervals, it is necessary to sample in order to obtain PSD.
- PSD is calculated from RRI data after resampling using an Auto Regression (AR) model or Fourier transform. 1) LF: PSD low frequency (0.04 to 0.15 Hz) power 2) HF: High frequency (0.15-0.40Hz) power of PSD 3) LF / HF: Ratio of LF to HF
- FIG. 4 is a diagram showing an example of an electrocardiogram signal when PVC occurs.
- the vertical axis represents potential and the horizontal axis represents time. Comparing FIG. 4 and FIG. 2 (a) (an electrocardiogram signal when no PVC is generated), there is a large fluctuation due to the occurrence of PVC in the RRI that was approximately equally spaced when no PVC was generated. You can see that it has occurred.
- each HRV index calculated from RRI is also affected.
- 5 and 6 are diagrams showing SDNN and LF / HF among the HRV indexes calculated from RRI data mixed with artificial PVC artifacts.
- the horizontal axis indicates the passage of time, and the vertical axis indicates the value of the HRV index.
- Timing t in the figure indicates the timing at which PVC artifacts are mixed.
- the dotted line and the solid line in the figure indicate the HRV index calculated from the original RRI data in which no PVC artifact is mixed, and the HRV index calculated from the PVC-RRI, respectively.
- the process part 10 of the arithmetic unit 1 detects the PVC artifact mixed in the RRI data obtained from the measurement result. Then, the RRI data obtained from the measurement result is corrected so that the RRI data in which the influence of the detected PVC artifact is excluded from the RRI data.
- the processing unit 10 uses the corrected RRI data for detection of a predetermined biological state.
- the processing unit 10 reads out and executes the program 121 from the memory 12 as functions realized by the RRI calculation unit 101, the detection unit 102, the correction unit 103, and the detection unit 104. including.
- the RRI calculation unit 101 generates RRI data based on the R wave data input from the communication unit 13.
- the RRI calculation unit 101 calculates the time interval between the falling times of two rectangular pulses that are temporally adjacent as RRI variables from the R wave data as shown in FIG. 2B, and calculates the calculated RRI.
- RRI data is generated by arranging variables in time series.
- the detection unit 102 detects the mixing of artifacts (noise) into the RRI data.
- the correction unit 103 performs correction to eliminate the influence of the artifact from the RRI data. The detection method and the correction method will be described later.
- the detection unit 104 detects a predetermined biological state from the corrected RRI data.
- the detection method in the detection unit 104 may be a known detection method. For example, when the predetermined biological state is a sign of epileptic seizure, the method described in JP-A-2015-112423 can be employed. Further, for example, when the predetermined biological state is an apnea state, a method described in JP-A-2016-214491 can be employed.
- the processing unit 10 When the detection unit 104 detects a specific biological state, the processing unit 10 inputs a signal indicating that the specific biological state is detected to the communication unit 13 and outputs the signal to a predetermined transmission destination.
- the predetermined transmission destination is a display or a speaker (not shown) connected to the arithmetic device 1, and the processing unit 10 may notify that a specific biological state is detected by them. Further, for example, the predetermined transmission destination is a predetermined address stored in association with the subject P, and notifies the communication terminal associated with the subject P that a specific biological state has been detected. May be.
- MSPC-SSA is used as a PVC artifact detection method in the detection unit 102.
- MSPC-SSA introduced monitoring indicators used in Multivariate Statistical Process Control (MSPC) for Singular Spectrum Analysis (SSA) for anomaly detection techniques. It is a technique.
- MSPC Multivariate Statistical Process Control
- SSA Singular Spectrum Analysis
- PCA Principal Component Analysis
- FIG. 7A is a diagram showing a relationship between two HRV index variables (variable 1, variable 2) and two principal components (first principal component, second principal component), and FIG. 7B shows two HRV index variables.
- FIG. 5 is a diagram for explaining a relationship between two principal components and a T2 statistic.
- Two HRV index variables may be selected from the above HRV indices. For example, meanNN and LF can be selected.
- one direction in a space representing HRV index data is set as a first principal component
- one direction in a space orthogonal to the first principal component is set as a second principal component.
- a plurality of principal components are set by repeating this procedure.
- the first principal component is set in a direction in which the variance of the principal component score is maximized.
- the “principal component score” is a value obtained by projecting the HRV index data onto the coordinates on the principal component axis, that is, the space spanned by the principal component. In this case, a value obtained by projecting the HRV index data onto the first principal component and the second principal component is the principal component score.
- the control limit CL1 shown in FIG. 7A can be set. However, it is not easy to determine a deviation from the control limit CL1 in a multidimensional space. Therefore, the PVC artifact detection method according to the present embodiment employs MSPC that uses the Hotelling'sT2 statistic and the Q statistic.
- the Hotelling'sT2 statistic is the Mahalanobis distance between the sample and the origin in the subspace spanned by the principal component, and is calculated from the principal component score obtained by principal component analysis.
- the Hotelling'sT2 statistic is used for anomaly detection in a subspace spanned by the main component.
- the control limit CL1 shown in FIG. 7A is changed to the control limit CL2 having a perfect circle shape as shown in FIG. 7B. It can be deformed.
- Q statistic is the square distance between the sample and the subspace spanned by the principal component, and is calculated from the principal component score obtained by principal component analysis.
- the Q statistic is used for anomaly detection in the orthogonal complementary space of the subspace spanned by the main component.
- MSPC simultaneously monitors the Hotelling'sT2 statistic and the Q statistic, and determines that it is abnormal when either of them exceeds the control limit. That is, the management limit of the Hotelling'sT2 statistic and the Q statistic is used as a threshold for determining whether or not an abnormal value is included in the RRI column.
- SSA is a technique that creates a Hankel matrix from univariate time-series data and detects anomalies using features extracted by singular value decomposition.
- RRI time series data x ⁇ x1, x2,..., XT ⁇
- the Hankel matrix is expressed by the equation (1) in FIG. 8A.
- Each element of the RRI time series data x is RRI data, and the subscript indicates the measurement order.
- T indicates the total number of RRI data measured.
- m is the number of RRI time-series data constituting the partial RRI sequence, and m ⁇ T.
- the partial RRI sequence yi is regarded as a sample, and the management limit T2 ⁇ of each of the Hotelling's T2 statistic and the Q statistic as threshold values used for determining whether or not the partial RRI sequence yi includes an abnormal value And Q ⁇ .
- FIG. 9 is a flowchart showing an example of an algorithm for constructing a model used by the detection unit 102 for detecting PVC artifacts using MSPC-SSA.
- n represents the total number of RRI columns used for model construction
- variable I represents the number of the RRI column being processed.
- FIG. 8B is a diagram for specifically explaining the construction of the model shown in FIG.
- each frame represents RRI time-series data, and is arranged in time series from left to right.
- a solid line frame represents RRI data constituting the partial RRI sequence, and a dotted line frame represents RRI data not constituting the partial RRI sequence.
- variable I is incremented by 1 (step S101), and the I-th RRI column of the Hankel matrix shown in equation (1) of FIG. 8A is created (step S103).
- Steps S101 and S103 are repeatedly executed (step S106) until the total number n of RRI sequences used for model construction is reached (NO in step S105).
- the first RRI column is an RRI column consisting of x1 to x4, the second RRI column is x2 to x5,...
- the nth RRI column is x
- An RRI sequence consisting of (m ⁇ 3) to xm is created.
- step S105 When a Hankel matrix column is created for the total number n of RRI columns used for model construction (YES in step S105), all the columns from the first to nth are combined into one matrix (step S107), average 0, variance By standardizing to be 1, Hankel matrix X is created (step S109).
- step S111 By performing singular value decomposition on the Hankel matrix X obtained in step S109 to calculate the principal component and the left singular vector (step S111), the management limits T2 ⁇ of the Hotelling's T2 statistic and the Q statistic respectively ( The threshold value ⁇ 1) and Q ⁇ (threshold value ⁇ 1) are determined (step S113).
- At least one of Hotelling's T2 statistic (value ⁇ ) or Q statistic (value ⁇ ) is managed for each partial RRI sequence yi of the model (hereinafter, normal model) constructed by the flowchart of FIG. Whether or not there is a normal or abnormal condition, that is, a PVC artifact is determined depending on whether or not the limit (threshold values ⁇ 1 and ⁇ 1) is exceeded. When it is determined that the partial RRI sequence yi is abnormal, it is considered that a PVC artifact is included in any of the elements included in the partial RRI sequence yi.
- FIG. 8B a method for specifying a range including PVC artifacts will be described.
- Single-shot PVC affects the value of 2 beats of RRI data.
- the hatched frame indicates the RRI time-series data affected by the PVC artifact, and specifically shows an example where the RRI data x4 and x5 are affected by the PVC artifact.
- each partial RRI sequence is composed of a prescribed number (4 in the example of FIG. 8A) of continuous RRI time-series data.
- the RRI time-series data is configured so as to be shifted one by one along the time series. Therefore, at least one of the RRI data x4 and x5 affected by the PVC artifact appears in the first to fifth partial RRI sequences.
- the partial RRI sequence before and after the m-1 partial RRI sequence includes only one PVC artifact. If the two front and rear partial RRI sequences are also determined to be abnormal, a maximum of m + 1 partial RRI sequences (first to fifth in FIG. 8A) are determined to be abnormal continuously.
- a threshold value ⁇ 1 of the number ⁇ of partial RRI sequences in which at least one of the values ⁇ and ⁇ has continuously exceeded the control limit is defined in advance, and the number ⁇ is greater than or equal to the threshold value ⁇ 1, It is determined that a PVC artifact is included in the target partial RRI sequence.
- the threshold value ⁇ 1 depends on the length m of the partial RRI sequence, that is, the number of columns m of the Hankel matrix.
- the values ⁇ and ⁇ of the partial RRI sequence are m + 1 consecutively and exceed the management limit
- one beat of PVC artifact The eyes are x ⁇ j-1. If the control limit is exceeded for m-1 consecutive times, the first beat of the PVC artifact is x ⁇ j. That is, one of the two beats coincides with the first beat of the PVC artifact. Therefore, in MSPC-SSA, it is determined that x ⁇ j-1 and x ⁇ j include PVC artifacts.
- FIG. 10 is a flowchart showing an algorithm in which the detection unit 102 detects PVC artifacts in real time using MSPC-SSA.
- the variable t represents the number at which the RRI data is acquired, and the maximum value of the number of RRI data measurements is MAX.
- the RRI data x_t indicates t-th RRI data
- the partial RRI column y_t indicates an m-dimensional partial RRI column whose first element is x_t.
- step S201 counter ⁇ and variable t are initialized (step S201).
- step S203 a new t-th RRI is measured and recorded in the buffer as RRI data in accordance with a FIFO (First In In First Out) method (step S203).
- FIFO First In In First Out
- the RRI data x_ (t ⁇ m + 1) measured from the buffer to the RRI data x_ (t ⁇ 1) is read from the buffer, and the newly obtained RRI data x_t is added to obtain the RRI data x_t as the final element.
- a partial RRI sequence y_m + 1 is created (step S205). Then, the Hotelling'sT2 statistic (value ⁇ ) and the Q statistic (value ⁇ ) of the partial RRI sequence y_m + 1 are calculated (step S207).
- the partial RRI sequence y_m + 1 may include a PVC artifact. Therefore, in this case, the counter ⁇ is incremented by 1 (step S211).
- the partial RRI sequence y_m + 1 does not include a PVC artifact.
- the counter ⁇ has reached the threshold value ⁇ 1 (YES in step S215), the partial RRI sequence y_m + 1, which includes the number corresponding to the threshold value ⁇ 1 up to the partial RRI sequence y_m and the partial RRI sequence that may include the PVC artifact, continues. The possibility of including PVC artifacts is gone. That is, in the example of FIG.
- the threshold ⁇ 1 is 5, and the partial RRI sequence y_m + 1 corresponds to the partial RRI sequence y6. Therefore, in this case, it is determined that the RRI data x_ (t ⁇ m) and the RRI data x_ (t ⁇ m + 1) include a PVC artifact (step S217).
- the counter ⁇ is initialized (step S219).
- step S213 the variable t is incremented (step S213), and the PVC artifact is detected by repeating the above processing until the variable t reaches the maximum value MAX (NO in step S221). To do.
- the variable t reaches the maximum value MAX of the number of measurements (YES in step S221), the series of processes is terminated.
- the RRI data correction method in the correction unit 103 uses a combination of SAE (sparse autoencoder) and DAE (denoising autoencoder) which is a neural network for noise removal.
- SAE separse autoencoder
- DAE denoising autoencoder
- AE autoencoder
- AE is a dimension compression method and feature extraction method using a neural network. In order to make the output as equal as possible to the input, the AE performs learning so as to minimize the reconstruction error between the input and the output.
- AE is consistent with principal component analysis (PCA: Principal Component Analysis) which is a typical dimensional compression method.
- PCA Principal Component Analysis
- SAE This method is called SAE.
- DAE is a neural network having the same structure as AE, but adds noise to the input during learning and learns to obtain the same output as the input before adding noise. Since learning is performed by adding noise, it is considered that DAE has a noise removal capability.
- DAE-RM DAE-based “RRI” indication
- RRI data to be corrected is input to DAE.
- the RRI data input to the DAE is a correction target range of the RRI data continuous in time series.
- the correction target range is RRI data changed by the PVC artifact detected by the detection method described above, and RRI data for a preset correction width before and after the RRI data. That is, detecting a PVC artifact according to the algorithm shown in FIG. 10 is detecting a correction target range.
- FIG. 8C is a diagram showing an outline of the configuration of the DAE and an outline of data input to and output from the DAE.
- DAE applies an activation function to the input data in the intermediate layer and the output layer, and outputs output variables x1 ⁇ , x2 ⁇ , ... xn ⁇ is output. Since DAE has already been learned as described above, when input variables x1, x2,... Xn contain noises caused by PVC, output variables x1 ⁇ , x2 ⁇ ,. Output.
- the number of input variables x1, x2,... Xn is RRI data including at least noise caused by PVC in the RRI data string.
- it further includes a prescribed number of RRI data before and after the RRI data including noise. This is because the RRI data before and after the beat changed by the PVC artifact is necessary to perform correction by DAE.
- the RRI data string input to these DAEs is set as a correction target range in the RRI data string.
- the RRI data including noise is two beats of data x4 and x5, and data x3 to x6 obtained by adding one beat before and after the beat are set as a correction target range.
- the data x3 to x6 are input to the DAE and are subject to correction.
- FIG. 11 is a flowchart showing a correction algorithm in which the correction unit 103 removes PVC artifacts from the RRI data using DAE-RM.
- the variable t represents the number from which RRI data is acquired, and the maximum value is MAX.
- the RRI data x_t indicates the t-th RRI data
- y indicates the RRI data in the correction range
- y_mean indicates the average of each component of y.
- T represents the number of RRI data changed by PVC artifacts.
- P is a parameter representing a correction range by DAE.
- the P beats before and after the T beat (eg 2 beats) (eg 1 beat before and after) are corrected by DAE.
- variable t is initialized (step S301).
- a new t-th RRI is measured and recorded in the buffer as RRI data according to the FIFO method (step S303).
- the detection unit 102 performs the detection process of FIG. 10 to determine the presence or absence of a PVC artifact.
- the RRI data from the t + 1th to the t + T + P ⁇ 1th Is waited for (step S307).
- the measured RRI data x_ (t ⁇ P) to RRI data x_ (t ⁇ 1) are read from the buffer, and (T + 2P) A dimension partial RRI sequence y is created (step S309).
- the T beat determined to include the PVC artifact and the correction range of the preceding and succeeding P beats are created as the partial RRI sequence y.
- the average value y_mean of the partial RRI sequence y obtained in step S309 is calculated, and the partial RRI sequence y is centered using the difference from the average value y_mean (step S311).
- the partial RRI sequence y centered in step S311 is input to the DAE, and an output partial RRI sequence y ⁇ is obtained (step S313). This removes the effect of PVC artifacts from the centered partial RRI sequence y.
- the average value y_mean obtained in step S311 is added to the obtained partial RRI sequence y to restore the original partial RRI sequence ⁇ (step S315).
- step S317 The difference between the sum of the original partial RRI sequence y obtained in step S309 and the sum of the partial RRI sequence y ⁇ corrected in step S315 is added to the last element of the partial RRI sequence y (step S317). Thereby, the sum total of the elapsed time in this range is the same before and after correction.
- the partial RRI sequence y is set as the corrected partial RRI sequence y ⁇ (step S319), and the variable t is incremented to measure the next RRI data (step S321). Also, if it is not detected that PVC artifacts are mixed in the RRI data measured in step S303 (NO in step S305), the variable t is incremented to measure the next RRI data (step S321). ). Then, until the variable t reaches the maximum value MAX (NO in step S323), the above processing is repeated to correct the RRI data so as to eliminate PVC artifacts from the RRI data. When the variable t reaches the maximum value MAX of the number of measurements (YES in step S323), the series of processes is terminated.
- FIG. 12 is a diagram showing the attributes of the subjects A to R.
- the subjects A to R shown in the figure consist of 5 males (average 33.8 years, standard deviation 7.7) from 26 to 45 years old and 13 females (average from 20 to 50 years old) 35.8 years old, standard quasi-deviation 7.7), all of whom are diagnosed as not having arrhythmia.
- RRI data measured from subjects A to R contained obvious artifacts, and these artifacts were removed because they interfered with the evaluation.
- 166 partial RRI sequences y were created from the subjects A to R from which obvious artifacts were removed, and the total time of the partial RRI sequences y was 375 hours.
- artificial PVC artifacts were added at random positions to these partial RRI sequences y, and DAE-RM was applied to a range where an abnormality was detected by MSPC-SSA.
- the partial RRI sequence y obtained from the subject A was used for the MSPC-SSA model construction.
- the control limit was set so that 99% of normal model construction data was determined to be normal, and the number of principal components was set so that the cumulative contribution rate exceeded 90%.
- sensitivity sensitivity
- FPrate false : positive rate
- the index SEN represents the proportion of PVC detected by MSPC-SSA among the artificial PVC artifacts added to the RRI data.
- the index FPrate represents the number of erroneous detections per unit time (one hour), that is, the number of times that the MSPC-SSA determines that a PVC artifact is included in the partial RRI sequence y that does not include a PVC artifact.
- the partial RRI sequence y obtained from the subject B was used for DAE learning.
- a sigmoid function and an identity map were used for the activation function of the intermediate layer and the output layer, respectively.
- the DAE parameters were determined using the partial RRI sequence y obtained from subjects C and D.
- sparsity was introduced using L2 regularization terms when determining parameters. Therefore, almost all the weights for connecting the units are zero.
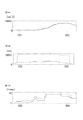
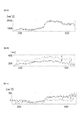
- FIG. 13A is a diagram showing RRI data obtained from the subject M, where RRI data obtained by measuring a solid line (original RRI), RRI with a PVC artifact added (PVC-RRI), and a fine dotted line Shows the RRI after correction (corrected RRI) obtained by correcting PVC-RRI by DAE-RM.
- FIGS. 13B and 13C), FIGS. 14A to 14C, and FIGS. 15A to 15C are HRV indexes calculated from RRI data obtained from the subject M in FIG. 13A.
- Fig. 13B shows meanNN
- Fig. 13C shows SDNN
- Fig. 14A shows Total Power
- Fig. 14B shows RMSSD
- Fig. 14C shows NN50
- Fig. 15A shows LF
- Fig. 15B shows HF
- Fig. 15C shows LF / HF.
- the solid line represents the HRV index calculated from the original RRI
- the rough dotted line represents the HRV index calculated from PVC-RRI
- the fine dotted line represents the HRV index calculated from the corrected RRI.
- the fine dotted lines generally overlap the solid lines, and there is no noticeable discrepancy. That is, the corrected RRI (FIG. 13A) and the HRV index (FIGS. 13B and C, FIGS. 14A to 14C and FIGS. 15A to 15C) calculated from the corrected RRI are both the original RRI or the original RRI. It can be seen that the HRV index calculated from the RRI is followed with high accuracy.
- FIG. 16A shows the result when the DAE whose activation function is a sigmoid function is applied
- FIG. 16B shows the result when the DAE whose activation function is ReLU is applied.
- a square mean square error (RMSE) between the original RRI and the corrected RRI was used as an index of the degree of tracking. It means that the smaller the RMSE, the higher the tracking degree, that is, the higher the correction accuracy.
- the vertical axis represents the decrease rate of RMSE
- the horizontal axis represents the number of nodes in the intermediate layer of DAE. In this verification, the number of input variables to the DAE is four.
- FIG. 17A shows the result when the number of input variables is 6
- FIG. 17B shows the result when the number of input variables is 8. Show. Also in these drawings, the vertical axis represents the decrease rate of RMSE, and the horizontal axis represents the number of nodes in the intermediate layer of DAE.
- the correction unit 103 adopts DAE-RM using DAE as the correction method, but the correction method is not limited to DAE-RM.
- Other regression methods may be used as the correction method. Examples of regression methods other than DAE include PLS (partial (least squares) and LW-PLS (locally weighted PLS).
- PLS is a widely used linear regression method, for example, disclosed in Paul Geladi and Bruce R. Kowalski. Partial leastsquares regression: a tutorial. Analytica Chimica Acta, Vol. 185, pp. 1-17, 1986. ing. Using this technique, the problem of multicollinearity can be avoided by using fewer latent variables than input variables.
- LW-PLS is an extension of PLS.
- a local PLS model is constructed using a sample that best represents an input / output relationship in a query, using a sample of the data set already obtained and the similarity of the query as weights.
- the inventors apply DAE, PLS, and LW-PLS to the RRI data in the correction target range among the RRI data of the subjects M to R shown in FIG.
- the correction method was evaluated by comparing the RRI data of HRV and the HRV index obtained from the corrected RRI data.
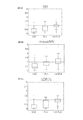
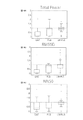
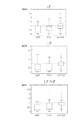
- 18A, 18B, and 18C respectively show RRI data, meanNN, and SDNN after correction by applying DAE, PLS, and LW-PLS, respectively.
- 19A, 19B, and 19C respectively show Total Powe, RMSSD, and NN50.
- 20A, B, and C show LF, HF, and LF / HF, respectively. Also in these drawings, the vertical axis represents the reduction rate of RMSE, and the horizontal axis represents the method used.
- the detection unit 102 sets a value about twice the value of normal RRI data as a threshold value, and when there is RRI data exceeding the threshold value, an artifact (hereinafter referred to as an R wave detection artifact) , R wave missing artifact) can be detected.
- the detection unit 102 sets RRI data exceeding the threshold as RRI data in the detection target range.
- the correction unit 103 inputs the RRI data of the detection target range to the DAE and outputs the corrected post-correction as in the first embodiment.
- RRI data is obtained. Therefore, the present invention is not limited to the case where artifacts (noise) mixed in the RRI data are PVC artifacts. For example, even if artifacts due to other factors such as R wave missing artifacts are corrected, RRI data that eliminates the influence of artifacts can be obtained.
- the data input at the time of AE learning is RRI data
- the added noise is noise caused by R wave missing.
- the DAE used for removing the R wave missing artifact removes the noise caused by the R wave missing from the input RRI data, and outputs the RRI data not including the noise caused by the R wave missing. It was learned.
- the inventors generate RRI data for testing assuming that one R beat of the R wave could not be detected from the RRI data of the subjects M to R shown in FIG. 12, and for the RRI data for testing, Correction is performed by applying DAE (ReLUDAE) whose activation function is ReLU, DAE (typical DAE) whose activation function is sigmoid function, PLS, and LW-PLS, and RRI data after correction and correction
- DAE ReLUDAE
- DAE typically DAE
- 21A, 21B, and 21C respectively show RRI data, meanNN, and SDNN after correction by applying ReLUDAE, typicalDAE, PLS, and LW-PLS, respectively.
- 22A, 22B, and C show Total Power, RMSSD, and NN50, respectively.
- 23A, B, and C show LF, HF, and LF / HF, respectively. Also in these figures, the vertical axis represents the reduction rate of RMSE, and the horizontal axis represents the method used.
- the DAE used for correction is switched between ReLUDAE and typical DAE depending on whether the artifact included in the RRI sequence is a PVC artifact or an R wave missing artifact. May be.
- the measured RRI is smaller than the normal RRI.
- the measured RRI becomes larger than the normal RRI.
- the detection unit 102 includes the determination unit 105 shown in FIG.
- the discriminating unit 105 stores in advance the RRI value that is the boundary between the PVC artifact and the R wave missing artifact as a threshold value, and compares the measured RRI with the measured RRI to determine whether the detected artifact is a PVC artifact or an R wave missing artifact. Or the type of artifact is determined.
- the correction unit 103 prepares ReLUDAE (31) and typicalDAE (32) in advance, and the artifacts determined by the detection unit 102 are detected. Switching between ReLUDAE and typicalDAE according to the type.
- the factor that reduces the reliability of R-wave detection is not limited to PVC.
- Another example of a factor that lowers the reliability of R-wave detection is supraventricular premature contraction (PAC).
- PAC is a type of extrasystole where excitement occurs at a location called the upper chamber such as the atrium prior to the excitement of the sinus node.
- PAC is a type of arrhythmia that can occur in healthy individuals as well as PVC. Even when PAC occurs, artifacts are mixed into the RRI, which causes a decrease in the reliability of R-wave detection.
- the intermediate layer of the neural network used for correction is a sigmoid function, and the number of units in the intermediate layer is 8.
- the activation function of the intermediate layer is ReLU, and the activation function of the output layer is an identity map.
- An electrocardiogram waveform for 8 beats was used for detection of PAC by the auto encoder (AE).
- the number of DAE parameters, which is the number of RRI elements to be corrected, is 4, and the number of DAE parameters, which are intermediate layer units, is 2.
- AE is a neural network for dimension compression and feature extraction.
- FIGS. 26B to 28C show the indexes obtained from the original RRI data, the RRI data added with the artificial artifact, and the RRI data corrected by DAE-RM shown in FIG. 26A. . 26B to 28C, abnormality detection by AE is applied to each index, and each index obtained from original RRI data, corrected RRI data by DAE-RM, and original RRI data. And each index obtained from RRI data after correction by DAE-RM.
- the improvement rate of the original RRI data and the corrected RRI data was 27.4%.
- meanNN is 0.1%
- SDNN is 24.8%
- Total Power is 22.7%
- RSMMD is 70.8%
- NN50 is 34.0%
- LF is 22.7%
- HF is 28.2%.
- % LF / HF was 30.0%. That is, it can be seen that both the corrected RRI and the HRV index calculated from the corrected RRI follow the original RRI or the HRV index calculated from the original RRI with high accuracy.
- the following arithmetic device is included. That is, (1) According to an embodiment, the arithmetic device corrects RRI data, which is data of an interval between adjacent R waves of an electrocardiogram signal, and includes the RRI data obtained in time series. The correction target range including the RRI data having noise is detected, and the RRI data in the correction target range is corrected.
- RRI data which is data of an interval between adjacent R waves of an electrocardiogram signal
- the detecting includes detecting the correction target range including RRI data in which noise is due to PVC, detecting the correction target range including RRI data in which noise is due to PAC, and (1) or (2) including at least one of detecting the correction target range including RRI data in which noise is caused by a lack of R-wave detection. Arithmetic unit.
Landscapes
- Health & Medical Sciences (AREA)
- Life Sciences & Earth Sciences (AREA)
- Cardiology (AREA)
- Heart & Thoracic Surgery (AREA)
- Molecular Biology (AREA)
- Pathology (AREA)
- Engineering & Computer Science (AREA)
- Biomedical Technology (AREA)
- Physics & Mathematics (AREA)
- Medical Informatics (AREA)
- Biophysics (AREA)
- Surgery (AREA)
- Animal Behavior & Ethology (AREA)
- General Health & Medical Sciences (AREA)
- Public Health (AREA)
- Veterinary Medicine (AREA)
- Measurement And Recording Of Electrical Phenomena And Electrical Characteristics Of The Living Body (AREA)
Abstract
演算装置(1)は心電信号の隣接するR波の間隔のデータであるRRIデータを補正する演算装置であって、時系列に得られたRRIデータのうちの、ノイズを有するRRIデータを含む補正対象範囲を検出し、補正対象範囲のRRIデータをDAE(denoising autoencoder)に入力することによって、補正対象範囲のRRIデータを補正する。
Description
本開示は、演算装置、検知装置、演算方法、及び、コンピュータプログラムに関する。本出願は、2018年5月9日出願の日本出願第2018-090592号に基づく優先権を主張し、前記日本出願に記載された全ての記載内容を援用する。
心電図上の隣接するR波の間隔(RRI:R-R Interval)は自律神経活動と関係があることが知られている。RRIのばらつきは心拍変動(HRV:heart rate variability)と呼ばれ、一般的に、HRVが大きいほど内部又は外部からの刺激に対する反応性が高く、HRVが小さいほど反応性が低い。
この特徴を利用して、HRV解析を用いた様々なヘルスモニタリング技術が開発されている。たとえば、てんかん性発作の予兆の検知(特開2015-112423号公報)や無呼吸状態の検出(特開2016-214491号公報)などのヘルスモニタリング技術が知られている。
HRV解析を用いたヘルスモニタリング技術においては、R波の正確な検出が前提となる。そのため、R波が正確に検出されないと、HRV解析の精度が低下するという課題がある。HRV解析の精度の低下は、ヘルスモニタリングの性能の低下につながる。
R波の検出の信頼性を低下させる要因の一つとして、R波の誤検出や検出漏れが挙げられる。また、R波の検出の信頼性を低下させる要因の他の例として、健常者でも起こりうる一般的な不整脈である期外収縮(PVC:Premature Ventricular Contraction)が挙げられる。PVCが発生するとRRIにアーチファクトが混入するためである。
ある実施の形態に従うと、演算装置は、心電信号の隣接するR波の間隔のデータであるRRIデータを補正する演算装置であって、時系列に得られたRRIデータのうちの、ノイズを有するRRIデータを含む補正対象範囲を検出し、補正対象範囲のRRIデータをDAE(denoising autoencoder)に入力することによって、補正対象範囲のRRIデータを補正する。
他の実施の形態に従うと、検知装置は上記演算装置を搭載し、補正対象範囲のRRIデータを含んだ時系列に得られたRRIデータに基づいて特定の生体情報を検知する。
他の実施の形態に従うと、演算方法は、心電信号の隣接するR波の間隔のデータであるRRIデータを補正する演算方法であって、時系列に得られたRRIデータのうちの、ノイズを有するRRIデータを含む補正対象範囲を検出するステップと、補正対象範囲のRRIデータをDAEに入力することによって、補正対象範囲のRRIデータを補正するステップと、を備える。
他の実施の形態に従うと、コンピュータプログラムは、コンピュータを心電信号の隣接するR波の間隔のデータであるRRIデータを補正する演算装置として機能させるプログラムであって、コンピュータに、時系列に得られたRRIデータのうちの、ノイズを有するRRIデータを含む補正対象範囲を検出するステップと、補正対象範囲のRRIデータをDAEに入力することによって、補正対象範囲のRRIデータを補正するステップと、を実行させる。
更なる詳細は、後述の実施形態として説明される。
更なる詳細は、後述の実施形態として説明される。
[1.演算装置、検知装置、演算方法、及び、コンピュータプログラムの概要]
(1)本実施の形態に含まれる演算装置は、心電信号の隣接するR波の間隔のデータであるRRIデータを補正する演算装置であって、時系列に得られたRRIデータのうちの、ノイズを有するRRIデータを含む補正対象範囲を検出し、補正対象範囲のRRIデータをDAE(denoising autoencoder)に入力することによって、補正対象範囲のRRIデータを補正する。ノイズ(アーチファクト)は、例えば、期外収縮(PVC:Premature Ventricular Contraction)、及び、R波の検知の欠落、である。
RRIデータのばらつきは心拍変動(HRV:heart rate variability)、HRV解析は様々なヘルスモニタリング技術に利用されている。そのため、ノイズを有するRRIデータを含む補正対象範囲のRRIデータを補正することによって、HRV解析の精度を向上させることができる。その結果、HRV解析を利用したヘルスモニタリング技術の性能を向上させることができる。
(2)好ましくは、検出することは、ノイズがPVCによるものであるRRIデータを含む補正対象範囲を検出することを含む。この場合、PVCによるノイズを含むRRIデータの範囲が補正対象範囲とされて補正されるため、測定されたRRIデータからPVCによるノイズを排したRRIデータが得られる。その結果、補正後のRRIデータのHRV解析の精度が向上する。
(3)好ましくは、DAEの活性化関数はReLU(Rectified Linear Unit)である。発明者らによる実施によって、RRIデータがPVCによるノイズを含む場合、活性化関数がReLUであるDAEをRRIデータに対して適用した方が、他の活性化関数を適用した場合よりも、補正後のRRIデータがPVCによるノイズがないRRIデータに対する追従度合が高いことが検証されている。つまり、RRIデータがPVCによるノイズを含む場合には活性化関数はReLUとした方が補正の精度が高い。したがって、補正後のRRIデータのHRV解析の精度をより向上させることができる。
(4)好ましくは、検出することは、ノイズがR波の検知が欠落していることに起因するものであるRRIデータを含む補正対象範囲を検出することを含む。この場合、R波の検知の欠落によるノイズを含むRRIデータの範囲が補正対象範囲とされて補正されるため、測定されたRRIデータからこのノイズを排したRRIデータが得られる。その結果、補正後のRRIデータのHRV解析の精度が向上する。
(5)好ましくは、DAEの活性化関数はシグモイド関数である。発明者らによる実施によって、RRIデータがR波の検知の欠落によるノイズを含む場合、活性化関数がシグモイド関数であるDAEをRRIデータに対して適用した方が、他の活性化関数を適用した場合よりも、補正後のRRIデータがR波の検知の欠落によるノイズがないRRIデータに対する追従度合が高いことが検証されている。つまり、RRIデータがR波の検知の欠落によるノイズを含む場合には活性化関数はシグモイド関数とした方が補正の精度が高い。したがって、補正後のRRIデータのHRV解析の精度をより向上させることができる。
(6)好ましくは、演算装置は、補正対象範囲のRRIデータを補正する際に、検出された補正対象範囲が、ノイズがPVCによるものであるRRIデータを含む補正対象範囲か、ノイズがR波の検知が欠落していることに起因するものであるRRIデータを含む補正対象範囲か、によって、DAEの活性化関数を、ReLUとシグモイド関数とで切り替える。これにより、RRIデータに含まれるノイズに応じて最適な補正を行うことができる。
(7)好ましくは、補正対象範囲のRRIデータを補正する際にDAEに入力するRRIデータの数は、補正対象範囲に含まれるRRIデータの数に一致する。補正対象範囲に含まれるRRIデータの数は、たとえば、ノイズがPVCによるものであって、そのノイズが連続する2拍に現れる場合、その2拍と前後1拍ずつの、計4拍である。これにより、補正対象範囲を不必要に大きくすることなく、必要な範囲の補正を可能にする。
(8)好ましくは、検出することは、ノイズがPACによるものであるRRIデータを含む補正対象範囲を検出することを含む。この場合、PACによるノイズを含むRRIデータの範囲が補正対象範囲とされて補正されるため、測定されたRRIデータからPACによるノイズを排したRRIデータが得られる。その結果、補正後のRRIデータのHRV解析の精度が向上する。
(9)本実施の形態に含まれる検知装置は(1)~(7)のいずれか1つに記載の演算装置を搭載し、補正対象範囲のRRIデータを含んだ時系列に得られたRRIデータに基づいて特定の生体状態を検知する。特定の生体状態は、たとえば、てんかん性発作の予兆や、無呼吸状態や、居眠り状態、などである。(1)~(7)のいずれか1つに記載の演算装置を搭載していることで、この検知装置は、(1)~(7)に記載の演算装置と同様の効果を奏する。つまり、HRV解析を利用した上記のような生体状態の検知精度を向上させることができる。
(10)本実施の形態に含まれる演算方法は、(1)~(7)のいずれか1つに記載の演算装置において実行される演算方法である。そのため、この演算方法は、(1)~(7)に記載の演算装置と同様の効果を奏する。
(11)本実施の形態に含まれるコンピュータプログラムは、コンピュータを(1)~(7)に記載の演算装置として機能させるプログラムである。そのため、このコンピュータプログラムは、(1)~(7)に記載の演算装置と同様の効果を奏する。コンピュータプログラムは、コンピュータ読み取り可能な、非一時的な記憶媒体に格納される。
[2.演算装置、検知装置、演算方法、及び、コンピュータプログラムの例]
[第1の実施の形態]
<検知装置の構成>
図1は、本実施の形態にかかる検知装置の構成の概略を示す図である。図を参照して、検知装置100は、演算装置1と心拍計測器2とを含む。本実施の形態にかかる検知装置は、被験者の心拍に基づいて特定の生体状態を検知する検知装置である。特定の生体状態は、たとえば、てんかん性発作の予兆や、無呼吸状態や、居眠り状態、などである。
図1は、本実施の形態にかかる検知装置の構成の概略を示す図である。図を参照して、検知装置100は、演算装置1と心拍計測器2とを含む。本実施の形態にかかる検知装置は、被験者の心拍に基づいて特定の生体状態を検知する検知装置である。特定の生体状態は、たとえば、てんかん性発作の予兆や、無呼吸状態や、居眠り状態、などである。
演算装置1と心拍計測器2とは通信可能であって、一例として無線通信する。無線通信は、たとえば、Bluetooth(登録商標)などの短距離無線通信、インターネットを介した通信、などである。
<心拍計測器>
心拍計測器2は、被験者Pの身体に取り付けられ、被験者Pの心拍を計測するための小型軽量なウェアラブルデバイスである。心拍計測器2には、被験者Pの体表に取り付けられる複数(図1では3つ)の電極21が接続されている。3つの電極21は、たとえばプラス電極、マイナス電極、及び、接地電極である。
心拍計測器2は、被験者Pの身体に取り付けられ、被験者Pの心拍を計測するための小型軽量なウェアラブルデバイスである。心拍計測器2には、被験者Pの体表に取り付けられる複数(図1では3つ)の電極21が接続されている。3つの電極21は、たとえばプラス電極、マイナス電極、及び、接地電極である。
図2の(a)は、心電信号の一例を示す図である。図2の(a)の縦軸は電位、横軸は時間を示している。電極21を用いて心拍を計測すると、図2の(a)に示すようなP~T波からなる電位変化が周期的に現れる。単位周期の電位変化の中で最も電位の高いピークをR波といい、R波のタイミングで心臓が拍動する。心拍計測器2は、R波を示すR波データを演算装置1に送信する。
図2の(b)は、図2の(a)の心電信号に対応するR波データを示す。図3に示すように、R波データは、心電信号におけるR波に対応する期間(信号強度Iが所定の強度閾値Ithを超える期間)が「1」に設定され、それ以外の期間が「0」に設定された矩形パルス列を表すデータである。
<演算装置>
演算装置1は、心拍計測器2から送信されるR波データに基づいててんかん性発作の兆候などの特定の生体状態を検知する検知装置として機能するとともに、後述のRRIを補正する補正装置としても機能する。演算装置1は、たとえば、スマートフォンやパーソナルコンピュータなどの通信端末である。
演算装置1は、心拍計測器2から送信されるR波データに基づいててんかん性発作の兆候などの特定の生体状態を検知する検知装置として機能するとともに、後述のRRIを補正する補正装置としても機能する。演算装置1は、たとえば、スマートフォンやパーソナルコンピュータなどの通信端末である。
図3は、演算装置1の構成の一例を示すブロック図である。図を参照して、演算装置1は、専用のマイクロコンピュータなどからなる処理部10を含む。また、演算装置1はメモリ12を有し、メモリ12には、処理部10で演算を行うためのプログラム121が記憶されている。
演算装置1は、心拍計測器2と通信する通信部13を有する。通信部13は、たとえば、心拍計測器2から送信されたR波を示す無線信号を受信し、受信した無線信号からR波を示すデータを生成して処理部10に入力する。通信部13は、R波を示すデータを記録した記録媒体にアクセスし、記録媒体からデータを読み出す読み出し装置であってもよい。データを取得することは、通信によってデータを受信すること、及び、記録媒体からデータを読み出すこと、を含む。
<PVCのHRV解析への影響について>
R波データより、R波の間隔を示すRRI変数の時系列データであるRRIデータが得られる。RRIデータにはアーチファクト(ノイズ)が混入することがある。RRIデータに混入するアーチファクトの原因は、R波の検出漏れ、及び、不整脈である期外収縮(PVC:Premature Ventricular Contraction)の発生が挙げられ、第1の実施の形態では、PVCによるアーチファクト(以下、PVCアーチファクト)の混入について、検出及び補正を行うものとする。
R波データより、R波の間隔を示すRRI変数の時系列データであるRRIデータが得られる。RRIデータにはアーチファクト(ノイズ)が混入することがある。RRIデータに混入するアーチファクトの原因は、R波の検出漏れ、及び、不整脈である期外収縮(PVC:Premature Ventricular Contraction)の発生が挙げられ、第1の実施の形態では、PVCによるアーチファクト(以下、PVCアーチファクト)の混入について、検出及び補正を行うものとする。
HRV解析に用いられる指標(以下、HRV指標)は、時間領域指標及び周波数領域指標を含む。時間領域指標は、下の5指標を含む。時間領域指標は、RRIデータから直接算出される。
1)meanNN:RRIの平均値
2)SDNN:RRIの標準偏差
3)Total Power:RRIの分散
4)RMSSD:隣接するRRIの差の2乗平均平方根
5)NN50:隣接するRRIの差が50msを超えた回数
1)meanNN:RRIの平均値
2)SDNN:RRIの標準偏差
3)Total Power:RRIの分散
4)RMSSD:隣接するRRIの差の2乗平均平方根
5)NN50:隣接するRRIの差が50msを超えた回数
周波数領域指標は、下の3指標を含む。周波数領域指標は、RRIデータのパワースペクトル密度(PSD:Power Spectrum Density)から算出される。なお、RRIデータは等間隔にサンプリングされていないため、PSDを得るためにサンプリングする必要がある。PSDはリサンプリング後のRRIデータより自己回帰(AR:Auto Regression)モデル又はFourier変換を用いて算出される
1)LF:PSDの低周波(0.04~0.15Hz)のパワー
2)HF:PSDの高周波(0.15~0.40Hz)のパワー
3)LF/HF:HFに対するLFの比
1)LF:PSDの低周波(0.04~0.15Hz)のパワー
2)HF:PSDの高周波(0.15~0.40Hz)のパワー
3)LF/HF:HFに対するLFの比
図4は、PVCが生じたときの心電信号の例を示す図である。図の縦軸は電位、横軸は時間を示している。図4と図2の(a)(PVCが生じていないときの心電信号)とを比較すると、PVCが生じていないときには概ね等間隔であったRRIに、PVCが生じたことによって大きな変動が生じていることがわかる。
RRIに大きな変動が生じると、RRIから算出される各HRV指標も影響を受ける。図5及び図6は、人工的なPVCアーチファクトを混入させたRRIデータから算出された、上記HRV指標のうちのSDNNとLF/HFと表した図である。図の横軸は時間経過、縦軸はHRV指標の値を示している。図中のタイミングtは、PVCアーチファクトを混入させたタイミングを示している。図中の点線及び実線は、それぞれ、PVCアーチファクトを混入させていない元のRRIデータから算出されたHRV指標、及び、PVC-RRIから算出されたHRV指標を示している。
図5及び図6に示された算出結果より、PVCアーチファクトを混入させた直後から各HRV指標に変化が生じていることがわかる。そのため、PVCアーチファクトが混入することによって変化したHRV指標をHRV解析に用いると、解析精度を低下させる可能性がある。
<演算装置の処理部の機能構成>
本実施の形態において、演算装置1の処理部10は、計測結果から得られたRRIデータに混入されているPVCアーチファクトを検出する。そして、検出したPVCアーチファクトの影響をRRIデータから排除したRRIデータとなるように、計測結果から得られたRRIデータを補正する。処理部10は、補正したRRIデータを所定の生体状態の検知に用いる。
本実施の形態において、演算装置1の処理部10は、計測結果から得られたRRIデータに混入されているPVCアーチファクトを検出する。そして、検出したPVCアーチファクトの影響をRRIデータから排除したRRIデータとなるように、計測結果から得られたRRIデータを補正する。処理部10は、補正したRRIデータを所定の生体状態の検知に用いる。
上記の処理を実行するために、処理部10は、メモリ12からプログラム121を読み出して実行することで実現される機能として、RRI算出部101、検出部102、補正部103、及び、検知部104を含む。
RRI算出部101は、通信部13から入力されたR波データに基づいてRRIデータを生成する。RRI算出部101は、図2の(b)に示されたようなR波データから、時間的に隣り合う2つの矩形パルスの立下り時刻の時間間隔をRRI変数として算出し、算出した当該RRI変数を時系列に並べることにより、RRIデータを生成する。
検出部102は、RRIデータへのアーチファクト(ノイズ)の混入を検出する。RRIデータへのアーチファクトの混入が検出されると、補正部103は、RRIデータからアーチファクトの影響を排する補正を行う。検知手法、及び、補正手法については後述する。
検知部104は、補正後のRRIデータから所定の生体状態を検出する。検知部104での検出方法は、公知の検知方法であってよい。たとえば、所定の生体状態がてんかん性発作の予兆である場合、特開2015-112423号公報に記載の方法を採用することができる。またたとえば、所定の生体状態が無呼吸状態である場合、特開2016-214491号公報に記載の方法を採用することができる。
処理部10は、検知部104が特定の生体状態を検知すると、特定の生体状態が検知されたことを示す信号を通信部13に入力するとともに、予め規定された送信先にその信号を出力するように指示する。予め規定された送信先は、演算装置1に接続された図示しないディスプレイやスピーカなどであって、処理部10は、それらで特定の生体状態が検知されたことを報知してもよい。またたとえば、予め規定された送信先は、被験者Pに対応付けて記憶されている所定のアドレスであって、被験者Pに対応付けられた通信端末に特定の生体状態が検知されたことを報知してもよい。
<PVCアーチファクトの検出手法>
検出部102におけるPVCアーチファクトの検出手法には、MSPC-SSAが用られる。MSPC-SSAは、異常検知手法の特異スペクトル解析(SSA:Singular Spectrum Analysis)に、多変量の異常検知手法の多変量統計的プロセス管理(MSPC:Multivariate Statistical Process Control)で用いられる監視指標を導入した手法である。
検出部102におけるPVCアーチファクトの検出手法には、MSPC-SSAが用られる。MSPC-SSAは、異常検知手法の特異スペクトル解析(SSA:Singular Spectrum Analysis)に、多変量の異常検知手法の多変量統計的プロセス管理(MSPC:Multivariate Statistical Process Control)で用いられる監視指標を導入した手法である。
MSPCでは、特徴抽出に主成分分析(PCA:Principal Component Analysis)を用いる。PCAはデータの次元を削減するための手法であり、複数の変数の線型結合によって主成分と呼ばれる新たな変数を作りだす。
図7Aは、2つのHRV指標変数(変数1、変数2)と2つの主成分(第1主成分、第2主成分)との関係を示す図であり、図7Bは、2つのHRV指標変数及び2つの主成分とT2統計量との関係を説明するための図である。HRV指標変数としては、上記のHRV指標の中から2つを選択すればよい。たとえばmeanNNとLFとを選択することができる。
PCAでは、HRV指標データを表す空間における一方向を第1主成分とし、その第1主成分と直交する空間の一方向を第2主成分に設定する。この手順を繰り返すことにより複数の主成分が設定される。ここで、第1主成分は、主成分得点の分散が最大となる方向に設定される。なお、「主成分得点」とは、主成分軸上の座標、すなわち、主成分が張る空間へHRV指標データを射影して得られる値である。場合、第1主成分及び第2主成分へHRV指標データを射影して得られる値が主成分得点となる。
PCAを用いると、図7Aに示された管理限界CL1を設定することができる。しかしながら、多次元空間においてこの管理限界CL1からの逸脱を判断することは容易ではない。そこで、本実施の形態にかかるPVCアーチファクトの検出手法では、Hotelling’sT2統計量とQ統計量とを用いる、MSPCを採用する。
Hotelling’sT2統計量は主成分で張られる部分空間でのサンプルと原点とのMahalanobis距離であって、主成分分析により得られる主成分得点から算出される。Hotelling’sT2統計量は、主成分で張られる部分空間での異常検知に用いられる。Hotelling’sT2統計量では、原点からの距離が各主成分方向に対して規格化されるため、図7Aに示された管理限界CL1を、図7Bに示すような真円状の管理限界CL2に変形することができる。
Q統計量は、サンプルと主成分で張られる部分空間との2乗距離であって、主成分分析により得られる主成分得点から算出される。Q統計量は、主成分で張られる部分空間の直交補空間での異常検知に用いられる。
MSPCでは、Hotelling’sT2統計量とQ統計量とを同時に監視し、いずれか一方でも管理限界を超えた場合に異常と判定する。つまり、Hotelling’sT2統計量及びQ統計量の管理限界は、RRI列に異常値が含まれるか否かの判定の閾値として用られる。
SSAは、単変量の時系列データからHankel行列を作成し、特異値分解によって抽出された特徴を用いて異常検知を行う手法である。RRI時系列データx={x1、x2、…、xT}に対し、Hankel行列は図8Aの式(1)で示される。RRI時系列データxの各要素はRRIデータであって、添え字は測定順を示す。Tは測定されたRRIデータの総数を示す。
Hankel行列の各行yi(i=1,…n)を部分RRI列とする。mは、部分RRI列を構成するRRI時系列データ数であり、m<Tである。MSPC-SSAでは、部分RRI列yiをサンプルとみなして、部分RRI列yiに異常値が含まれるか否かの判定に用いる閾値としてのHotelling’sT2統計量及びQ統計量それぞれの管理限界T2 ̄及びQ ̄を決定する。
図9は、検出部102がMSPC-SSAを用いてPVCアーチファクトの検出に用いるモデルを構築するアルゴリズムの一例を示したフローチャートである。図9のフローチャートにおいて、nはモデル構築に用いるRRI列の総数を表し、変数Iが処理中のRRI列の番号を表す。
図8Bは、図9に示されたモデルの構築を具体的に説明するための図である。図8Bでは、各枠がRRI時系列データを示しており、左から右の順に時系列に配列されている。ここでは、部分RRI列を構成するRRI時系列データ数mが4(m=4)である例が示されている。実線の枠が部分RRI列を構成するRRIデータを表し、点線の枠が部分RRI列を構成していないRRIデータを表している。
図9を参照して、はじめに、変数Iを1インクリメントし(ステップS101)、図8Aの式(1)に示されるHankel行列の、I番目のRRI列を作成する(ステップS103)。ステップS101、S103は、モデル構築に用いるRRI列の総数nに達するまで(ステップS105でNO)、繰り返し実行される(ステップS106)。
図8Bの例では、ステップS101、S103が繰り返されることによって、1番目のRRI列としてx1~x4からなるRRI列、2番目のRRI列してx2~x5、…n番目のRRI列してx(m-3)~xmからなるRRI列が作成される。
モデル構築に用いるRRI列の総数n分、Hankel行列の列を作成すると(ステップS105でYES)、1番目~n番目までのすべての列を1つの行列にまとめ(ステップS107)、平均0、分散1となるように標準化することで、Hankel行列Xが作成される(ステップS109)。
ステップS109で得られたHankel行列Xについて特異値分解を実行して主成分と左特異ベクトルとを算出することによって(ステップS111)、Hotelling’sT2統計量およびQ統計量それぞれの管理限界T2 ̄(閾値α1)及びQ ̄(閾値β1)を決定する(ステップS113)。
MSPC-SSAでは、図9のフローチャートによって構築されるモデル(以下、正常モデル)の部分RRI列yiごとに、Hotelling’sT2統計量(値α)又はQ統計量(値β)の少なくとも一方が管理限界(閾値α1,β1)を超過するか否かによって、正常、異常、つまり、PVCアーチファクトの有無が判定される。部分RRI列yiが異常と判定された場合、部分RRI列yiに含まれる要素のいずれかにPVCアーチファクトが含まれていると考えられる。すなわち、連続した複数の部分RRI列が値α,βの少なくとも一方が管理限界(閾値α1,β1)を超過した場合、それらに共通して含まれる要素にPVCアーチファクトが含まれていると考えられる。
図8Bを用いて、PVCアーチファクトが含まれている範囲の特定方法を説明する。単発性のPVCは、RRIデータ2拍の値に影響を及ぼす。図8Bでは、ハッチングが付された枠がPVCアーチファクトの影響を受けたRRI時系列データを示しており、具体的に、RRIデータx4およびx5がPVCアーチファクトの影響を受けた例を示している。
図8Aの例では、正常モデルは、各部分RRI列は規定数(図8Aの例では4個)の連続するRRI時系列データからなり、1番目~n番目まで、部分RRI列ごとに先頭のRRI時系列データが1個ずつ、時系列に沿ってずれて構成されている。そのため、PVCアーチファクトの影響を受けたRRIデータx4およびx5の少なくとも一方は、1番目~5番目までの部分RRI列に出現している。
すなわち、連続するm-1個(図8Aでは2番目~4番目)の部分RRI列に、PVCの影響を受けた2拍が含まれる。そこで、本実施の形態にかかるPVCアーチファクトの検出手法では、部分RRI列がm-1個連続して異常と判定された場合に、PVCアーチファクトを検出したと判定される。
また、上記のm-1個の部分RRI列の前後の部分RRI列(図8Aでは1番目及び5番目)には、PVCアーチファクトが1拍のみ含まれる。この前後2つの部分RRI列も異常と判定されると、最大m+1個の部分RRI列(図8Aでは1番目~5番目)が連続で異常と判定される。
MSPC-SSAでは、値α,βの少なくとも一方が管理限界を連続して超過した部分RRI列の数τの閾値τ1を予め規定しておき、数τが閾値τ1以上であった場合には、対象の部分RRI列にPVCアーチファクトが含まれていると判定する。閾値τ1は、部分RRI列の長さm、つまり、Hankel行列の列数mに依存する。
異常と判定された最後の部分RRI列をyj={xj,…,xj+m-1}とすると、部分RRI列の値α,βがm+1個連続で管理限界を超過すれば、PVCアーチファクトの1拍目はx^j-1となる。m-1連続で管理限界を超過すれば、PVCアーチファクトの1拍目はx^jとなる。つまり、この2拍のいずれかがPVCアーチファクトの1拍目と一致する。そこで、MSPC-SSAでは、x^j-1及びx^jがPVCアーチファクトを含むと判定する。
図10は、検出部102がMSPC-SSAを用いてリアルタイムでPVCアーチファクトを検出するアルゴリズムを示したフローチャートである。図10のアルゴリズムにおいて、PVC検出モデルは図9の処理によってすでに作成されているものとする。変数tは、RRIデータが取得された番号を表し、RRIデータの測定数の最大値をMAXとする。RRIデータx_tは、t番目のRRIデータを示し、部分RRI列y_tは、第1要素がx_tであるm次元部分RRI列を示す。
図10を参照して、はじめに、カウンタτ及び変数tを初期化する(ステップS201)。次に、新たにt番目のRRIを計測し、FIFO(First In First Out)方式にしたがってRRIデータとしてバッファに記録する(ステップS203)。
次に、バッファから、先に計測されたRRIデータx_(t-m+1)からRRIデータx_(t-1)までを読み出し、新たに得られたRRIデータx_tを加えて、RRIデータx_tを最終要素とする部分RRI列y_m+1を作成する(ステップS205)。そして、部分RRI列y_m+1のHotelling’sT2統計量(値α)とQ統計量(値β)とを算出する(ステップS207)。
値α,βの少なくとも一方でも管理限界(閾値α1,β1)を超過していた場合(ステップS209でYES)、部分RRI列y_m+1はPVCアーチファクトを含む可能性がある。そこで、この場合カウンタτを1インクリメントする(ステップS211)。
値α,βのいずれもが管理限界(閾値α1,β1)を超過していない場合には(ステップS209でNO)、部分RRI列y_m+1にはPVCアーチファクトが含まれていない可能性が高い。この場合、カウンタτが閾値τ1に達していたら(ステップS215でYES)、部分RRI列y_mまで閾値τ1に相当する数、PVCアーチファクトを含む可能性がある部分RRI列が連続し、部分RRI列y_m+1でPVCアーチファクトを含む可能性がなくなっている。つまり、図8Bの例では、閾値τ1が5であり、部分RRI列y_m+1は部分RRI列y6に相当する。従って、この場合、RRIデータx_(t-m)とRRIデータx_(t-m+1)とがPVCアーチファクトを含むと判定する(ステップS217)。
なお、カウンタτが閾値τ1未満である場合(ステップS215でNO)、PVCアーチファクトを含むと判定されるまで、値α,βの少なくとも一方が管理限界(閾値α1,β1)を超過した部分RRI列が連続していない。つまり、PVCアーチファクトは含まれていない。そのため、この場合、カウンタτを初期化する(ステップS219)。
その後、次のRRIデータを計測するために変数tをインクリメントし(ステップS213)、変数tが最大値MAXに達するまで(ステップS221でNO)、以上の処理を繰り返することによって、PVCアーチファクトを検出する。変数tが測定数の最大値MAXに達すると(ステップS221でYES)、一連の処理を終了する。
<RRIの補正手法>
補正部103におけるRRIデータの補正手法には、SAE(sparse autoencoder)と、ノイズ除去を目的とするニューラルネットであるDAE(denoising autoencoder)とが組み合わせて用いられる。AE(autoencoder)はニューラルネットを用いた次元圧縮手法、特徴抽出手法である。AEは出力を入力とできるだけ等しくするため、入力と出力との再構築誤差を最も小さくするように学習を行う。
補正部103におけるRRIデータの補正手法には、SAE(sparse autoencoder)と、ノイズ除去を目的とするニューラルネットであるDAE(denoising autoencoder)とが組み合わせて用いられる。AE(autoencoder)はニューラルネットを用いた次元圧縮手法、特徴抽出手法である。AEは出力を入力とできるだけ等しくするため、入力と出力との再構築誤差を最も小さくするように学習を行う。
このとき、中間層と出力層とにおいて活性化関数を恒等写像とすると、AEは代表的な次元圧縮手法である主成分分析(PCA:Principal Component Analysis)と一致する。次元圧縮された特徴を得るため、隠れ層のユニット数は入力変数の数よりも小さくするべきであるが、正則化項を導入することで隠れ層のユニット数を入力変数の数より大きくすることができる。この手法をSAEと呼ぶ。
DAEはAEと同じ構造を持つニューラルネットであるが、学習時の入力にノイズを加え、ノイズを加える前の入力と同様の出力を得るよう学習を行う。ノイズを加えて学習を行うことから、DAEはノイズ除去能力を有すると考えられる。
DAEによってPVCアーチファクトを除去するため、AEの学習時に入力層及び出力層に渡すデータは(ノイズを含まない)RRIデータであって、さらに、入力層にPVCに起因するノイズを渡す。これにより、PVCアーチファクトを除去するために用いるDAEは、入力されたRRIデータからPVCに起因するノイズを除去して、PVCに起因するノイズを含まないRRIデータを出力するように学習されたものとなる。DAEによってノイズを除去する補正手法をDAE-RM(DAE-based RRI modication)と呼ぶ。
DAEによってRRIデータに含まれるPVCアーチファクトを除去する際に、DAEに補正対象とするRRIデータを入力する。DAEに入力するRRIデータは、時系列に連続するRRIデータのうちの補正対象範囲である。補正対象範囲は、上記の検出手法によって検出されたPVCアーチファクトによって変化したRRIデータと、その前後の予め設定した補正幅分のRRIデータと、である。すなわち、図10に示されたアルゴリズムに従ってPVCアーチファクトを検出することは、補正対象範囲を検出することである。
図8Cは、DAEの構成の概略、及び、DAEに入出力されるデータの概要を表した図である。図8Cを参照して、DAEは、データx1,x2,…xnが入力されると、中間層と出力層とにおいて入力データに対して活性化関数を適用して出力変数x1^,x2^,…xn^を出力する。DAEは上記のように学習済であるため、入力変数x1,x2,…xnにPVCに起因するノイズが含まれる場合に、そのノイズが除去された出力変数x1^,x2^,…xn^を出力する。
入力変数x1,x2,…xnの数は、RRIデータ列のうち、少なくともPVCに起因するノイズが含まれるRRIデータである。好ましくは、ノイズが含まれるRRIデータの前後規定数のRRIデータをさらに含む。DAEで補正を行うためにPVCアーチファクトによって変化した拍前後のRRIデータが必要なためである。これらのDAEに入力するRRIデータ列を、RRIデータ列のうちの補正対象範囲とする。図8Bの例の場合、ノイズが含まれるRRIデータはデータx4,x5の2拍であり、その前後1拍ずつを加えたデータx3~x6を補正対象範囲としている。このとき、図8Cに示されたように、データx3~x6がDAEに入力され、補正の対象となる。
図11は、補正部103がDAE-RMを用いてRRIデータからPVCアーチファクトを除去する補正アルゴリズムを示したフローチャートである。この補正の前提として、DAEは上記の学習済であるものとする。変数tは、RRIデータが取得された番号を表し、最大値をMAXとする。RRIデータx_tは、t番目のRRIデータを示し、yは補正を行う範囲のRRIデータ、y_meanはyの各成分の平均を示している。TはPVCアーチファクトによって変化したRRIデータの数を表しておりT=2のときはPVCは単発性である。PはDAEによる補正幅を表すパラメータである。T拍(たとえば2拍)の前後P拍(たとえば前後1拍)をDAEによって補正する。
図11を参照して、はじめに、変数tを初期化する(ステップS301)。次に、新たにt番目のRRIを計測し、FIFO方式にしたがってRRIデータとしてバッファに記録する(ステップS303)。新たにRRIが計測されると、検出部102において図10の検出処理が実行され、PVCアーチファクトの有無が判定される。
検出部102での図10のアルゴリズムに従う処理の結果、RRIデータにPVCアーチファクトが混入していることが検出された場合(ステップS305でYES)、その後、t+1番目からt+T+P-1番目までのRRIデータの計測を待機する(ステップS307)。計測が終了し、これらRRIデータがFIFO方式にしたがってバッファに記憶されると、バッファから、計測されたRRIデータx_(t-P)からRRIデータx_(t-1)までを読み出し、(T+2P)次元の部分RRI列yを作成する(ステップS309)。これにより、PVCアーチファクトを含むと判定されたT拍、及び、その前後P拍の補正範囲が部分RRI列yとして作成される。
ステップS309で得られた部分RRI列yの平均値y_meanを算出し、平均値y_meanからの差分を用いて部分RRI列yを中心化する(ステップS311)。ステップS311で中心化した部分RRI列yをDAEに入力し、出力である部分RRI列y^を得る(ステップS313)。これにより、中心化された部分RRI列yからPVCアーチファクトの影響が取り除かれる。その後、得られた部分RRI列y^にステップS311で得られた平均値y_meanを加えて元の大きさの部分RRI列y^に復元する(ステップS315)。
ステップS309で得られた元の部分RRI列yの総和と、ステップS315で補正された部分RRI列y^の総和との差を、部分RRI列yの最後の要素に加える(ステップS317)。これにより、補正前後でこの範囲の経過時間の総和が一致する。
以降、部分RRI列yを補正後の部分RRI列y^とし(ステップS319)、次のRRIデータを計測するために変数tをインクリメントする(ステップS321)。また、ステップS303で計測されたRRIデータにPVCアーチファクトが混入していることが検出されなかった場合も(ステップS305でNO)、次のRRIデータを計測するために変数tをインクリメントする(ステップS321)。そして、変数tが最大値MAXに達するまで(ステップS323でNO)、以上の処理を繰り返することによって、RRIデータからPVCアーチファクトを排するように、RRIデータを補正する。変数tが測定数の最大値MAXに達すると(ステップS323でYES)、一連の処理を終了する。
[実施例1]
発明者らは、PVCアーチファクトを加えた実際のRRIデータに対してMSPC-SSA及びDAE-RMを適用し、その結果から、PVCアーチファクトの混入に対するDAE-RMによる補正の効果を評価した。図12は、被験者A~Rの属性を示した図である。図に示された被験者A~Rは、26歳から45歳までの5人の男性(平均33.8歳、標準偏差7.7)と、20歳から50歳までの13名の女性(平均35.8歳、標準準偏差7.7)とで構成され、その全員が不整脈でないと診断されている。
被験者A~Rから計測されたRRIデータのいくつかには明らかなアーチファクトが含まれており、これらのアーチファクトは評価の妨げとなるため除去した。明らかなアーチファクトを除去した被験者A~Rから部分RRI列yが166個作成され、部分RRI列yの合計時間は375時間となった。本実施例では、これら部分RRI列yに対してランダムな位置に人工的なPVCアーチファクトを加え、MSPC-SSAで異常と検出された範囲に対してDAE-RMを適用した。
なお、MSPC-SSAのモデル構築には被験者Aから得られた部分RRI列yを用いた。MSPC-SSAのパラメータは被験者E,Fから得られた部分RRI列yを用いて決定した結果、部分RRI列の長さm、つまり、Hankel行列の列数mはm=6となった。管理限界は正常モデル構築データの99%が正常と判定されるように設定し、主成分数は、累積寄与率が90%を超えるように設定した。
SSAの性能評価指標として、感度(SEN:sensitivity)及び誤検出率(FPrate:false positive rate)を用いた。指標SENはRRIデータに加えた人工的なPVCアーチファクトのうち、MSPC-SSAによって検出されたPVCの割合を表す。指標FPrateは単位時間(1時間)あたりの誤検出の回数、つまりMSPC-SSAがPVCアーチファクトを含まない部分RRI列yにPVCアーチファクトが含まれると判定した回数を表す。
次に、DAEの学習には被験者Bから得られた部分RRI列yを用いた。中間層と出力層との活性化関数にはそれぞれ、シグモイド関数と恒等写像とを用いた。DAEのパラメータは被験者C,Dから得られた部分RRI列yを用いて決定し、DAEによって補正する要素の数が4、中間層のユニット数が20、最大試行回数が2000となった。つまり、図11のフローチャートに示された補正処理においてT=2、P=1となった。また、パラメータ決定時にL2正則化項を用いてスパース性を導入した。そのため、ユニットを結合するほぼすべての重みが0となっている。
検証には、被験者G~Rから得られたすべての部分RRI列yを用いた。なお、PVC-RRIデータの作成及び補正は、加えたPVCアーチファクトの位置に補正性能が依存することを防ぐため、5回の試行を行ってその平均値を結果とした。被験者M~Rの部分RRI列yにPVCアーチファクトを加え、MSPC-SSAを適用した結果は、
SEN:94.9%
FPrate:1.20[times/hour]
であった。
SEN:94.9%
FPrate:1.20[times/hour]
であった。
図13Aは、被験者Mから得られたRRIデータを示す図であって、実線が計測されたRRIデータ(オリジナルRRI)、荒い点線がPVCアーチファクトが加えられたRRI(PVC-RRI)、及び細かい点線がDAE-RMでPVC-RRIを補正した補正後のRRI(補正後RRI)を示している。図13B、図13C)、図14A~図14C、及び、図15A~図15Cは、図13Aの被験者Mから得られたRRIデータから算出された各HRV指標である。図13BはmeanNN、図13CはSDNN、図14AはTotal Power、図14BはRMSSD、図14CはNN50、図15AはLF、図15BはHF、及び、図15CはLF/HFを示している。各図において、実線がオリジナルRRIから算出されたHRV指標、荒い点線がPVC-RRIから算出されたHRV指標、及び、細かい点線が補正後RRIから算出されたHRV指標、を示している。
これら図において、細かい点線は概ね実線に重なり、視認可能な程度の目立った乖離がない。つまり、補正後RRI(図13A)、及び、補正後RRIから算出されたHRV指標(図13B,C、図14A~14C、及び、図15A~15C)は、いずれも、オリジナルRRI、又は、オリジナルRRIから算出されたHRV指標に高精度で追従していることがわかる。
なお、追従度合の指標としてオリジナルRRIとPVC-RRIとの平方平均二乗誤差(RMSE:root mean squared error)に対する補正後RRIの改善率I1、及び、各HRV指標(meanNN、SDNN、Total Power、RMSSD、NN50、LF、HF、LF/HF)における改善率I2~I9は下のようになった。
I1=72.4%
I2=57.3%
I3=85.2%
I4=86.4%
I5=91.2%
I6=60.9%
I7=61.6%
I8=71.7%
I9=76.3%
I1=72.4%
I2=57.3%
I3=85.2%
I4=86.4%
I5=91.2%
I6=60.9%
I7=61.6%
I8=71.7%
I9=76.3%
以上の第1の実施例に示された検証結果から、DAE-RMによってRRIデータよりPVCアーチファクトの影響は高精度で排除できることが検証された。この結果、DAE-RMによって、PVCがHRV解析に与える影響を軽減できていることが検証された。
[実施例2]
次に、発明者らは、図12に示された被験者M~RのRRIデータに対して、活性化関数がシグモイド関数であるDAEと、ReLU(Rectified Linear Unit)であるDAEと、のそれぞれを適用し、補正に適用するDAEの中間層の活性化関数の効果を評価した。図16Aは活性化関数がシグモイド関数であるDAEを適用したときの結果、図16Bは活性化関数がReLUであるDAEを適用したときの結果を示している。
なお、本検証では、補正後RRIのオリジナルRRIに対する追従度合によって評価し、追従度合の指標として、オリジナルRRIと補正後RRIとの平方平均二乗誤差(RMSE:root mean squared error)を用いた。RMSEが小さいほど追従度合が高い、つまり、補正精度が高いことを意味している。図16A,Bにおいて、縦軸はRMSEの減少率を表し、横軸はDAEの中間層のノード数を表している。本検証において、DAEへの入力変数の数は4としている。
図16A,Bの比較より、中間層の活性化関数にReLUを用いたとき(図16B)の方が、シグモイド関数を用いたとき(図16A)よりも、中間層のノード数に関わらず全体的にRMSEが小さい。これより、PVCアーチファクトの影響を排する補正を行う場合には、DAEの活性化関数には図16Bに示されたシグモイド関数よりもReLUを用いる方が補正精度が向上することが検証された。
[実施例3]
次に、発明者らは、図12に示された被験者M~RのRRIデータに対してDAEを適用して補正する際の、DAEへの入力変数の効果を評価した。第3の実施例では、中間層の活性化関数がReLUであるDAEを適用し、図17Aが入力変数の数を6とした場合、図17Bが入力変数の数を8とした場合の結果を示している。これら図においても、縦軸はRMSEの減少率を表し、横軸はDAEの中間層のノード数を表している。
図16B、図17A,Bの比較より、入力変数が少ないほど(図16B)、多い場合よりも(図17A,B)、中間層のノード数に関わらず全体的にRMSEが小さい。これより、DAEの入力変数は小さい方が補正精度が向上することが検証された。つまり、RRIデータのうちの補正対象範囲としてDAEに入力するRRIデータ数が少ないほど補正精度が向上することが検証された。
[第2の実施の形態]
なお、第1の実施の形態では、補正部103が補正手法としてDAEを用いたDAE-RMを採用するものとしているが、補正手法はDAE-RMのみに限定されない。補正手法として他の回帰手法を用いてもよい。DAE以外の他の回帰手法としては、たとえば、PLS(partial least squares)や、LW-PLS(locally weighted PLS)が挙げられる。
PLSは広く使われている線形回帰手法であって、たとえば、Paul Geladi and Bruce R. Kowalski. Partial leastsquares regression: a tutorial. Analytica Chimica Acta, Vol. 185, pp. 1 - 17, 1986.に開示されている。この手法を用いると、入力変数より少ない潜在変数を用いることで多重共線性の問題を回避できる。
LW-PLSはPLSを拡張した手法であって、たとえば、Sanghong Kim, et al. Development of soft-sensorusing locally weighted pls with adaptive similarity measure. Chemometrics and Intelligent Laboratory Systems, Vol. 124, pp. 43 - 49, 2013. に開示されている。この手法では、すでに得られているデータセットのサンプルとクエリの類似度とを重みとして、クエリにおける入出力関係を最もよく表現するサンプルを用いて局所的なPLSモデルを構築する。
[実施例4]
発明者らは、図12に示された被験者M~RのRRIデータのうちの補正対象範囲のRRIデータに対してDAE、PLS、及び、LW-PLSをそれぞれ適用して補正を行い、補正後のRRIデータ、及び、補正後のRRIデータから得られたHRV指標を比較することによって、補正手法を評価した。
図18A,B,Cは、それぞれ、DAE、PLS、及び、LW-PLSをそれぞれ適用して補正した後のRRIデータ、meanNN,SDNNを示している。図19A,B,Cは、それぞれ、Total Powe、RMSSD、NN50を示している。図20A,B,Cは、それぞれ、LF、HF、LF/HFを示している。これら図においても、縦軸はRMSEの減少率を表し、横軸は用いた手法を表している。
図18A~図20Cより、DAE、PLS、及び、LW-PLSのいずれも、補正手法として用いてRRIデータが補正されていることが示されている。しかしながら、これらを比較すると、いずれの指標においてもDAEのRMSEが最も小さい。つまり、いずれの手法であっても補正可能であり、特に、DAEが補正に適していることが検証された。
[第3の実施の形態]
以上の実施の形態では、RRIデータに混入するアーチファクト(ノイズ)がPVCアーチファクトである場合について説明した。RRIデータに混入し得る他のアーチファクトとして、R波の検出漏れが挙げられる。この場合、RRIデータの値は通常の値の2倍程度の大きさになる。そのため、この場合、検出部102は、通常のRRIデータの値の2倍程度の値を閾値として設定しておき、当該閾値を超えるRRIデータがあった場合にR波の検出漏れによるアーチファクト(以下、R波抜けアーチファクト)が混入していると検出することができる。検出部102は、上記閾値を超えるRRIデータを検出対象範囲のRRIデータとする。
RRIデータに混入しているアーチファクトがR波抜けアーチファクトである場合も、第1の実施の形態と同様に、補正部103は、検出対象範囲のRRIデータをDAEに入力し、出力である補正後のRRIデータを得る。したがって、RRIデータに混入するアーチファクト(ノイズ)がPVCアーチファクトである場合のみに限定されず、たとえばR波抜けアーチファクトなど他の要因によるアーチファクトであっても、同様の補正手法を用いて補正し、そのアーチファクトの影響を排したRRIデータを得ることができる。
なお、この場合、DAEによってR波抜けアーチファクトを除去するため、AEの学習時に入力するデータはRRIデータであって、加えるノイズをR波抜けに起因するノイズとする。これにより、R波抜けアーチファクトを除去するために用いるDAEは、入力されたRRIデータからR波抜けに起因するノイズを除去して、R波抜けに起因するノイズを含まないRRIデータを出力するように学習されたものである。
[実施例5]
発明者らは、図12に示された被験者M~RのRRIデータからR波を1拍分を検出できなかったと仮定したテスト用のRRIデータを生成し、このテスト用のRRIデータに対して活性化関数がReLUであるDAE(ReLUDAE)、活性化関数がシグモイド関数であるDAE(typicalDAE)、PLS、及び、LW-PLSをそれぞれ適用して補正を行い、補正後のRRIデータ、及び、補正後のRRIデータから得られたHRV指標を比較することによって、アーチファクトがR波抜けアーチファクトである場合の補正の効果を評価した。
図21A,B,Cは、それぞれ、ReLUDAE、typicalDAE、PLS、及び、LW-PLSをそれぞれ適用して補正した後のRRIデータ、meanNN,SDNNを示している。図22A,B,Cは、それぞれ、Total Power、RMSSD、NN50を示している。図23A,B,Cは、それぞれ、LF、HF、LF/HFを示している。これらの図においても、縦軸はRMSEの減少率を表し、横軸は用いた手法を表している。
図21A~図23Cより、ReLUDAE以外の他の補正手法については、いずれも、RRIデータが補正されていることが示されている。一方で、ReLUDAEについては補正の効果が見られない。そこで、R波抜けアーチファクトに関しては、ReLUDAEよりもtypicalDAE、つまり、活性化関数としてシグモイド関数を用いたDAEが補正に適していることが検証された。また、DAE以外の手法も補正の効果があるものの、特に、DAEが補正に適していることが検証された。
[第4の実施の形態]
第1の実施の形態および第3の実施の形態より、演算装置1では、RRI列に含まれたアーチファクトがPVCアーチファクトかR波抜けアーチファクトかによって、補正に用いるDAEを、ReLUDAEとtypicalDAEとに切り替えてもよい。
図4に示したように、PVCアーチファクトは隣接するR波の間に混入するため、PVCアーチファクトが混入した場合には測定されるRRIが通常のRRIよりも小さくなる。一方、R波抜けアーチファクトはR波が1つ以上欠損しているため、R波抜けアーチファクトが混入した場合には測定されるRRIが通常のRRIよりも大きくなる。
そこで、第4の実施の形態において、検出部102は、図3に示された判別部105を含む。判別部105はPVCアーチファクトとR波抜けアーチファクトとの境界となるRRIの値を閾値として予め記憶しておき、計測されたRRIと比較することによって、検出されたアーチファクトがPVCアーチファクトかR波抜けアーチファクトか、アーチファクトの種別を判別する。
また、第4の実施の形態において、補正部103は、図3に示されたように、ReLUDAE(31)とtypicalDAE(32)と予め用意しておき、検出部102での判別されたアーチファクトの種別に応じてReLUDAEとtypicalDAEとを切り替える。
これにより、検出されたアーチファクトに応じて最適な補正手法を採用することになるため、高精度でアーチファクトの影響を排した補正後のRRIデータを得ることができる。その結果、複数種別のアーチファクトが含まれる場合にも、HRV解析の精度を向上させることができる。
[第5の実施の形態]
R波の検出の信頼性を低下させる要因はPVCに限定されない。R波の検出の信頼性を低下させる要因の他の例として、上室性期外収縮(PAC:Premature Atrial Contraction)がある。PACは、洞結節の興奮に先立って心房などの上室と呼ばれる箇所で興奮が起こる期外収縮の一種である。PACもPVCと同様に健常者にも起こりうる不整脈の一種である。PACが生じた場合においてもRRIにアーチファクトが混入するため、R波の検出の信頼性を低下させる要因となる。
R波の検出の信頼性を低下させる要因はPVCに限定されない。R波の検出の信頼性を低下させる要因の他の例として、上室性期外収縮(PAC:Premature Atrial Contraction)がある。PACは、洞結節の興奮に先立って心房などの上室と呼ばれる箇所で興奮が起こる期外収縮の一種である。PACもPVCと同様に健常者にも起こりうる不整脈の一種である。PACが生じた場合においてもRRIにアーチファクトが混入するため、R波の検出の信頼性を低下させる要因となる。
[実施例6]
発明者らは、PACアーチファクトについても、PVCアーチファクトと同様に補正の効果を評価した。図24に示されるように、PACが発生したの心電波形は、PACが生じた前のRRIのみが変化していることがわかる。この特徴を反映するため、発明者らは、RRIデータの1拍をランダムに選択してRRIの値を減少させて検証に用いた。またPACによるP波がT波の後に生じる場合のみを仮定し、この仮定を満たすようRRIの値を減少させたものを検証に用いた。具体的には、心電波形に、図25に示すようなPACアーチファクトを加えて用いた。PACアーチファクトの大きさLは、RRIが健常なQT間隔より短くなることのない範囲でランダムな値を設定した。また、心電波形において、連続でPACが生じることはないと仮定した。
補正に用いるニューラルネットワークの中間層をシグモイド関数とし、中間層のユニットの数は8とした。また、中間層の活性化関数をReLU、出力層の活性化関数を恒等写像とした。また、オートエンコーダ(AE)によるPACの検出には、8拍分の心電波形を用いた。また、補正するRRIの要素数であるDAEのパラメータ数を4、中間層のユニットであるDAEのパラメータ数を2とした。なお、AEは、次元圧縮や特徴抽出のためのニューラルネットである。
図26B~図28Cには、26Aに示された、オリジナルのRRIデータ、人工アーチファクトを加えたRRIデータ、及び、DAE-RMによる補正後のRRIデータそれぞれから得られた各指標が示されている。図26B~図28Cに示された各指標に対して、AEによる異常検出を適用し、オリジナルのRRIデータとDAE-RMによる補正後のRRIデータ、及び、オリジナルのRRIデータから得られた各指標と、DAE-RMによる補正後のRRIデータから得られた各指標とを比較した。
その結果、オリジナルのRRIデータと補正後のRRIデータの改善率は27.4%であった。また、meanNNで0.1%、SDNNで24.8%、Total Powerで22.7%、RSMMDで70.8%、NN50で34.0%、LFで22.7%、HFで28.2%、LF/HFで30.0%であった。つまり、補正後RRI、及び、補正後RRIから算出されたHRV指標は、いずれも、オリジナルRRI、又は、オリジナルRRIから算出されたHRV指標に高精度で追従していることがわかる。
この結果より、PACアーチファクトについてもPVCアーチファクトと同様にDAE-RMによってRRIデータより高精度で排除できることが検証された。従って、DAE-RMによって、PACがHRV解析に与える影響もPVCと同様に軽減できていることが検証された。
[3.付記]
なお、本実施の形態の他の局面に従うと、次のような演算装置が含まれる。すなわち、
(1)ある実施の形態に従うと、演算装置は、心電信号の隣接するR波の間隔のデータであるRRIデータを補正する演算装置であって、時系列に得られたRRIデータのうちの、ノイズを有するRRIデータを含む補正対象範囲を検出し、補正対象範囲のRRIデータを補正する。
(1)ある実施の形態に従うと、演算装置は、心電信号の隣接するR波の間隔のデータであるRRIデータを補正する演算装置であって、時系列に得られたRRIデータのうちの、ノイズを有するRRIデータを含む補正対象範囲を検出し、補正対象範囲のRRIデータを補正する。
(2)前記補正することは、前記補正対象範囲のRRIデータをPLS(partial least squares)に入力することによって、前記補正対象範囲のRRIデータを補正することを含む、(1)に記載の演算装置。
(3)前記検出することは、ノイズがPVCによるものであるRRIデータを含む前記補正対象範囲を検出すること、ノイズがPACによるものであるRRIデータを含む前記補正対象範囲を検出すること、及び、ノイズがR波の検知が欠落していることに起因するものであるRRIデータを含む前記補正対象範囲を検出すること、のうちの少なくとも一つを含む、(1)又は(2)に記載の演算装置。
本発明は、上記実施形態に限定されるものではなく、様々な変形が可能である。
1 演算装置
2 心拍計測器
10 処理部
12 メモリ
13 通信部
21 電極
31 ReLUDAE
32 typicalDAE
100 検知装置
101 RRI算出部
102 検出部
103 補正部
104 検知部
105 判別部
121 プログラム
2 心拍計測器
10 処理部
12 メモリ
13 通信部
21 電極
31 ReLUDAE
32 typicalDAE
100 検知装置
101 RRI算出部
102 検出部
103 補正部
104 検知部
105 判別部
121 プログラム
Claims (11)
- 心電信号の隣接するR波の間隔のデータであるRRIデータを補正する演算装置であって、
時系列に得られた前記RRIデータのうちの、ノイズを有するRRIデータを含む補正対象範囲を検出し、
前記補正対象範囲のRRIデータをDAE(denoising autoencoder)に入力することによって、前記補正対象範囲のRRIデータを補正する
演算装置。 - 前記検出することは、ノイズが期外収縮(PVC:Premature Ventricular Contraction)によるものであるRRIデータを含む前記補正対象範囲を検出することを含む
請求項1に記載の演算装置。 - 前記DAEの活性化関数はReLU(Rectified Linear Unit)である
請求項2に記載の演算装置。 - 前記検出することは、ノイズがR波の検知が欠落していることに起因するものであるRRIデータを含む前記補正対象範囲を検出することを含む
請求項1に記載の演算装置。 - 前記DAEの活性化関数はシグモイド関数である
請求項4に記載の演算装置。 - 前記補正対象範囲のRRIデータを補正する際に、検出された前記補正対象範囲が、ノイズがPVCによるものであるRRIデータを含む補正対象範囲か、ノイズがR波の検知が欠落していることに起因するものであるRRIデータを含む補正対象範囲か、によって、前記DAEの活性化関数を、ReLUとシグモイド関数とで切り替える
請求項1に記載の演算装置。 - 前記補正対象範囲のRRIデータを補正する際にDAEに入力するRRIデータの数は、前記補正対象範囲に含まれるRRIデータの数に一致する
請求項1~請求項6のいずれか一項に記載の演算装置。 - 前記検出することは、ノイズが上室性期外収縮(PAC:Premature Atrial Contraction)によるものであるRRIデータを含む前記補正対象範囲を検出することを含む
請求項1に記載の演算装置。 - 請求項1~請求項7のいずれか一項に記載の演算装置を搭載し、
前記補正対象範囲のRRIデータを含んだ時系列に得られた前記RRIデータに基づいて特定の生体状態を検知する
検知装置。 - 心電信号の隣接するR波の間隔のデータであるRRIデータを補正する演算方法であって、
時系列に得られた前記RRIデータのうちの、ノイズを有するRRIデータを含む補正対象範囲を検出するステップと、
前記補正対象範囲のRRIデータをDAEに入力することによって、前記補正対象範囲のRRIデータを補正するステップと、を備える
演算方法。 - コンピュータを心電信号の隣接するR波の間隔のデータであるRRIデータを補正する演算装置として機能させるプログラムであって、
前記コンピュータに、
時系列に得られた前記RRIデータのうちの、ノイズを有するRRIデータを含む補正対象範囲を検出するステップと、
前記補正対象範囲のRRIデータをDAEに入力することによって、前記補正対象範囲のRRIデータを補正するステップと、を実行させる
コンピュータプログラム。
Priority Applications (1)
| Application Number | Priority Date | Filing Date | Title |
|---|---|---|---|
| JP2020518335A JP7690182B2 (ja) | 2018-05-09 | 2019-05-09 | 演算装置、検知装置、演算方法、及び、コンピュータプログラム |
Applications Claiming Priority (2)
| Application Number | Priority Date | Filing Date | Title |
|---|---|---|---|
| JP2018-090592 | 2018-05-09 | ||
| JP2018090592 | 2018-05-09 |
Publications (1)
| Publication Number | Publication Date |
|---|---|
| WO2019216378A1 true WO2019216378A1 (ja) | 2019-11-14 |
Family
ID=68467001
Family Applications (1)
| Application Number | Title | Priority Date | Filing Date |
|---|---|---|---|
| PCT/JP2019/018574 Ceased WO2019216378A1 (ja) | 2018-05-09 | 2019-05-09 | 演算装置、検知装置、演算方法、及び、コンピュータプログラム |
Country Status (2)
| Country | Link |
|---|---|
| JP (1) | JP7690182B2 (ja) |
| WO (1) | WO2019216378A1 (ja) |
Cited By (7)
| Publication number | Priority date | Publication date | Assignee | Title |
|---|---|---|---|---|
| JP2021081917A (ja) * | 2019-11-18 | 2021-05-27 | 株式会社東海理化電機製作所 | 学習データ拡張方法、および学習データ生成装置 |
| CN113768511A (zh) * | 2020-06-04 | 2021-12-10 | 深圳市理邦精密仪器股份有限公司 | 生理参数检测方法及电子设备 |
| CN114098760A (zh) * | 2020-09-01 | 2022-03-01 | 伯恩森斯韦伯斯特(以色列)有限责任公司 | 从心脏信号中移除噪声 |
| EP3928701A3 (en) * | 2020-06-04 | 2022-03-02 | Biosense Webster (Israel) Ltd | Reducing noise of intracardiac electrocardiograms using an autoencoder and utilizing and refining intracardiac and body surface electrocardiograms using deep learning training loss functions |
| JP2022040077A (ja) * | 2020-08-27 | 2022-03-10 | バイオセンス・ウエブスター・(イスラエル)・リミテッド | 心内信号からの遠距離場の除去 |
| CN114720981A (zh) * | 2022-04-19 | 2022-07-08 | 电子科技大学 | 基于主成分增强矩阵填充的毫米波雷达三维稀疏成像方法 |
| JP2023520944A (ja) * | 2020-04-09 | 2023-05-22 | ジェイ-ウェイブ ダイアグノスティクス エス.アール.エル | 心電図解析 |
Citations (1)
| Publication number | Priority date | Publication date | Assignee | Title |
|---|---|---|---|---|
| US20100099995A1 (en) * | 2008-10-16 | 2010-04-22 | Jie Lian | Method and apparatus for ectopic beat detection |
Family Cites Families (1)
| Publication number | Priority date | Publication date | Assignee | Title |
|---|---|---|---|---|
| JP3353452B2 (ja) * | 1994-05-24 | 2002-12-03 | いすゞ自動車株式会社 | 居眠り警告装置 |
-
2019
- 2019-05-09 JP JP2020518335A patent/JP7690182B2/ja active Active
- 2019-05-09 WO PCT/JP2019/018574 patent/WO2019216378A1/ja not_active Ceased
Patent Citations (1)
| Publication number | Priority date | Publication date | Assignee | Title |
|---|---|---|---|---|
| US20100099995A1 (en) * | 2008-10-16 | 2010-04-22 | Jie Lian | Method and apparatus for ectopic beat detection |
Non-Patent Citations (4)
| Title |
|---|
| 4 April 2018 (2018-04-04), pages 1 - 65, Retrieved from the Internet <URL:ibis.t.u-tokyo.ac.jp/suzuki/lecture/2018/2018/ML_Gairon_01.pdf> [retrieved on 20190522] * |
| ANONYMOUS: "Guidelines for risks and prevention of sudden cardiac death", JCS 2010, 15 August 2010 (2010-08-15), pages 1 - 10, XP055651891, Retrieved from the Internet <URL:www.j-circ.or.jp/guideline/pdf/JCS2010aizawa.h.pdf> [retrieved on 20190523] * |
| DAI, JIEJIE ET AL.: "Cleaning Method for Status Monitoring Data of Power Equipment Based on Stacked Denoising Autoencoders", IEEE ACCESS, vol. 5, 24 August 2017 (2017-08-24), pages 22863 - 22870, XP055651899 * |
| PENG, XIONG ET AL.: "Denoising Autoencorder for Electrocardiogram Signal Enhancement", JOURNAL OF MEDICAL IMAGING AND HEALTH INFORMATICS, vol. 5, no. 8, December 2015 (2015-12-01), pages 1804 - 1810 * |
Cited By (16)
| Publication number | Priority date | Publication date | Assignee | Title |
|---|---|---|---|---|
| JP7234100B2 (ja) | 2019-11-18 | 2023-03-07 | 株式会社東海理化電機製作所 | 学習データ拡張方法、および学習データ生成装置 |
| JP2021081917A (ja) * | 2019-11-18 | 2021-05-27 | 株式会社東海理化電機製作所 | 学習データ拡張方法、および学習データ生成装置 |
| JP2023520944A (ja) * | 2020-04-09 | 2023-05-22 | ジェイ-ウェイブ ダイアグノスティクス エス.アール.エル | 心電図解析 |
| CN113768511A (zh) * | 2020-06-04 | 2021-12-10 | 深圳市理邦精密仪器股份有限公司 | 生理参数检测方法及电子设备 |
| US12622626B2 (en) | 2020-06-04 | 2026-05-12 | Biosense Webster (Israel) Ltd. | Reducing noise of intracardiac electrocardiograms using an autoencoder and utilizing and refining intracardiac and body surface electrocardiograms using deep learning training loss functions |
| EP3928701A3 (en) * | 2020-06-04 | 2022-03-02 | Biosense Webster (Israel) Ltd | Reducing noise of intracardiac electrocardiograms using an autoencoder and utilizing and refining intracardiac and body surface electrocardiograms using deep learning training loss functions |
| CN113768511B (zh) * | 2020-06-04 | 2023-09-22 | 深圳市理邦精密仪器股份有限公司 | 生理参数检测方法及电子设备 |
| JP7790656B2 (ja) | 2020-08-27 | 2025-12-23 | バイオセンス・ウエブスター・(イスラエル)・リミテッド | 心内信号からの遠距離場の除去 |
| JP2022040077A (ja) * | 2020-08-27 | 2022-03-10 | バイオセンス・ウエブスター・(イスラエル)・リミテッド | 心内信号からの遠距離場の除去 |
| JP2022041993A (ja) * | 2020-09-01 | 2022-03-11 | バイオセンス・ウエブスター・(イスラエル)・リミテッド | 心臓信号からノイズを除去する |
| US20220061768A1 (en) * | 2020-09-01 | 2022-03-03 | Biosense Webster (Israel) Ltd. | Removing noise from cardiac signals |
| EP3960074A1 (en) * | 2020-09-01 | 2022-03-02 | Biosense Webster (Israel) Ltd | Method and system for removing noise from cardiac signals |
| JP7790657B2 (ja) | 2020-09-01 | 2025-12-23 | バイオセンス・ウエブスター・(イスラエル)・リミテッド | 心臓信号からノイズを除去する |
| US12502139B2 (en) * | 2020-09-01 | 2025-12-23 | Biosense Webster (Israel) Ltd. | Removing noise from cardiac signals |
| CN114098760A (zh) * | 2020-09-01 | 2022-03-01 | 伯恩森斯韦伯斯特(以色列)有限责任公司 | 从心脏信号中移除噪声 |
| CN114720981A (zh) * | 2022-04-19 | 2022-07-08 | 电子科技大学 | 基于主成分增强矩阵填充的毫米波雷达三维稀疏成像方法 |
Also Published As
| Publication number | Publication date |
|---|---|
| JPWO2019216378A1 (ja) | 2021-05-20 |
| JP7690182B2 (ja) | 2025-06-10 |
Similar Documents
| Publication | Publication Date | Title |
|---|---|---|
| JP7690182B2 (ja) | 演算装置、検知装置、演算方法、及び、コンピュータプログラム | |
| US12186086B2 (en) | Systems and methods for reduced lead electrocardiogram diagnosis using deep neural networks and rule-based systems | |
| US11571161B2 (en) | Systems and methods for electrocardiogram diagnosis using deep neural networks and rule-based systems | |
| US8233972B2 (en) | System for cardiac arrhythmia detection and characterization | |
| EP4216232A1 (en) | Methods and system for cardiac arrhythmia prediction using transformer-based neural networks | |
| CN109700450B (zh) | 一种心率检测方法及电子设备 | |
| CN118648883B (zh) | 双模血压计算方法、装置、设备及存储介质 | |
| US8903480B2 (en) | System for cardiac condition detection using heart waveform area associated analysis | |
| Al-Ani | ECG waveform classification based on P-QRS-T wave recognition | |
| CN117271977B (zh) | 一种hrv数据预处理方法、装置及电子设备 | |
| US20150133795A1 (en) | System and method for risk stratification based on dynamic nonlinear analysis and comparison of cardiac repolarization with other physiological signals | |
| CN110840443A (zh) | 心电信号处理方法、心电信号处理装置和电子设备 | |
| JPWO2020166239A1 (ja) | 睡眠時無呼吸症候群判定装置、睡眠時無呼吸症候群判定方法、及び、睡眠時無呼吸症候群判定プログラム | |
| Lee et al. | A real-time abnormal beat detection method using a template cluster for the ECG diagnosis of IoT devices | |
| US12138062B2 (en) | Determining whether a hypothesis concerning a signal is true | |
| US20160135704A1 (en) | Matrix-Based Patient Signal Analysis | |
| de Morais Borges et al. | Bayesian fusion of multiple sensors for reliable heart rate detection | |
| EP3014501B1 (en) | Measuring respiration | |
| US20230346305A1 (en) | Parameter determination method, parameter determination apparatus, storage medium, and electronic device | |
| Amelia et al. | ECG Arrhythmia Detection Using Complete Ensemble Empirical Mode Decomposition with Adaptive Noise (CEEMDAN) | |
| Manilo et al. | Recognition of biosignals with nonlinear properties by approximate entropy parameters | |
| US11337635B2 (en) | Automatic cardiovascular disease diagnostic system and method | |
| Naaz et al. | ECG Data Mining Approach for Detection of Arrhythmia Using Machine Learning | |
| Hepzibah et al. | A Novel Feature Prioritization and Ensemble-Based Algorithm for ECG-Based Cardiac Risk Stratification | |
| WO2026042154A1 (ja) | 生体データ処理システム、生体データ処理方法、及び、コンピュータプログラム |
Legal Events
| Date | Code | Title | Description |
|---|---|---|---|
| 121 | Ep: the epo has been informed by wipo that ep was designated in this application |
Ref document number: 19800799 Country of ref document: EP Kind code of ref document: A1 |
|
| ENP | Entry into the national phase |
Ref document number: 2020518335 Country of ref document: JP Kind code of ref document: A |
|
| NENP | Non-entry into the national phase |
Ref country code: DE |
|
| 122 | Ep: pct application non-entry in european phase |
Ref document number: 19800799 Country of ref document: EP Kind code of ref document: A1 |