WO2019167166A1 - 配管診断方法、配管診断装置、及び配管診断システム - Google Patents
配管診断方法、配管診断装置、及び配管診断システム Download PDFInfo
- Publication number
- WO2019167166A1 WO2019167166A1 PCT/JP2018/007483 JP2018007483W WO2019167166A1 WO 2019167166 A1 WO2019167166 A1 WO 2019167166A1 JP 2018007483 W JP2018007483 W JP 2018007483W WO 2019167166 A1 WO2019167166 A1 WO 2019167166A1
- Authority
- WO
- WIPO (PCT)
- Prior art keywords
- pipe
- model
- calculated
- state
- piping
- Prior art date
- Legal status (The legal status is an assumption and is not a legal conclusion. Google has not performed a legal analysis and makes no representation as to the accuracy of the status listed.)
- Ceased
Links
Images



Classifications
-
- G—PHYSICS
- G01—MEASURING; TESTING
- G01B—MEASURING LENGTH, THICKNESS OR SIMILAR LINEAR DIMENSIONS; MEASURING ANGLES; MEASURING AREAS; MEASURING IRREGULARITIES OF SURFACES OR CONTOURS
- G01B21/00—Measuring arrangements or details thereof, where the measuring technique is not covered by the other groups of this subclass, unspecified or not relevant
- G01B21/02—Measuring arrangements or details thereof, where the measuring technique is not covered by the other groups of this subclass, unspecified or not relevant for measuring length, width, or thickness
- G01B21/08—Measuring arrangements or details thereof, where the measuring technique is not covered by the other groups of this subclass, unspecified or not relevant for measuring length, width, or thickness for measuring thickness
-
- F—MECHANICAL ENGINEERING; LIGHTING; HEATING; WEAPONS; BLASTING
- F17—STORING OR DISTRIBUTING GASES OR LIQUIDS
- F17D—PIPE-LINE SYSTEMS; PIPE-LINES
- F17D3/00—Arrangements for supervising or controlling working operations
- F17D3/01—Arrangements for supervising or controlling working operations for controlling, signalling, or supervising the conveyance of a product
-
- G—PHYSICS
- G01—MEASURING; TESTING
- G01B—MEASURING LENGTH, THICKNESS OR SIMILAR LINEAR DIMENSIONS; MEASURING ANGLES; MEASURING AREAS; MEASURING IRREGULARITIES OF SURFACES OR CONTOURS
- G01B21/00—Measuring arrangements or details thereof, where the measuring technique is not covered by the other groups of this subclass, unspecified or not relevant
- G01B21/02—Measuring arrangements or details thereof, where the measuring technique is not covered by the other groups of this subclass, unspecified or not relevant for measuring length, width, or thickness
- G01B21/08—Measuring arrangements or details thereof, where the measuring technique is not covered by the other groups of this subclass, unspecified or not relevant for measuring length, width, or thickness for measuring thickness
- G01B21/085—Measuring arrangements or details thereof, where the measuring technique is not covered by the other groups of this subclass, unspecified or not relevant for measuring length, width, or thickness for measuring thickness using thermal means
-
- G—PHYSICS
- G01—MEASURING; TESTING
- G01N—INVESTIGATING OR ANALYSING MATERIALS BY DETERMINING THEIR CHEMICAL OR PHYSICAL PROPERTIES
- G01N17/00—Investigating resistance of materials to the weather, to corrosion, or to light
- G01N17/008—Monitoring fouling
-
- G—PHYSICS
- G01—MEASURING; TESTING
- G01N—INVESTIGATING OR ANALYSING MATERIALS BY DETERMINING THEIR CHEMICAL OR PHYSICAL PROPERTIES
- G01N25/00—Investigating or analyzing materials by the use of thermal means
- G01N25/18—Investigating or analyzing materials by the use of thermal means by investigating thermal conductivity
Definitions
- the present invention relates to a piping diagnostic method, a piping diagnostic device, and a piping diagnostic system.
- the temperature of the pipe when the pipe is cooled is detected by the temperature sensor, and the thinned state of the pipe is predicted based on the temperature change.
- the temperature sensor detects the temperature change.
- a temperature change similar to the state in which the pipe is not thin is detected even though the pipe is thin. May not be enough.
- an object of the present invention is to provide a pipe diagnosis method, a pipe diagnosis apparatus, and a pipe diagnosis system that can accurately diagnose the state of a pipe.
- the pipe diagnosis method includes a temperature change of the pipe calculated from the model when the pipe is heated in a model in which heat transfer behavior inside the pipe including deposits is modeled by an equivalent circuit, and A pipe diagnosis method in which a computer executes a process of diagnosing the state of the pipe from the model updated based on the temperature change of the pipe measured when the pipe is heated.
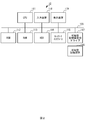
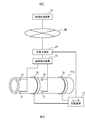
- FIG. 1 is a diagram schematically illustrating a piping diagnosis system according to an embodiment.
- FIG. 2 is a diagram illustrating an example of a hardware configuration of the information processing apparatus.
- FIG. 3 is a functional block diagram of the information processing apparatus.
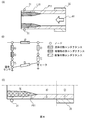
- FIG. 4A is a cross-sectional view showing an example of a pipe where deposits are deposited and thinned
- FIG. 4B is an equivalent modeled on the heat transfer behavior of the pipe shown in FIG.
- FIG. 4C illustrates a section represented by each element illustrated in FIG.
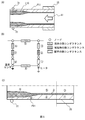
- FIG. 5A is a cross-sectional view showing another example of a pipe in which deposits are accumulated and thinned
- FIG. 5B models the heat transfer behavior of the pipe shown in FIG.
- FIG. 5A is a cross-sectional view showing another example of a pipe in which deposits are accumulated and thinned
- FIG. 5B models the heat transfer behavior of the pipe shown in FIG.
- FIG. 5A is a cross-sectional view showing another example of
- FIG. 5C shows an equivalent circuit, and shows a section represented by each element shown in FIG.
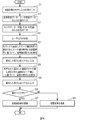
- FIG. 6 is a flowchart of piping diagnosis processing executed by the information processing apparatus.
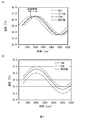
- FIG. 7A is a diagram for explaining the processing in step S21 in FIG. 6, and
- FIG. 7B is a diagram for explaining the processing in step S23 in FIG.
- FIG. 8 is a diagram for explaining the processing in step S25 of FIG.
- FIG. 9 is a diagram schematically showing a modification of the piping diagnosis system.
- FIG. 1 schematically shows the configuration of a piping diagnosis system 100 according to an embodiment.
- a piping diagnosis system 100 includes a temperature sensor 31 and a temperature detection device 33 as measurement devices, a heater 35 as a heating device, a heater control device 37, and an information processing device 10 as a piping diagnosis device. And comprising.
- the piping diagnostic system 100 measured a temperature change of the piping P10 calculated from a model in which the heat transfer behavior inside the piping P10 including deposits is modeled by an equivalent circuit when the piping P10 is heated by the heater 35. By comparing with the temperature change of the pipe, the accuracy of the model is improved, and the state of the pipe P10 is diagnosed using the model. More specifically, the piping diagnosis system 100 is derived from a periodic change in the surface temperature of the piping P10 when the output of the heater 35 is periodically changed and a periodic temperature change is given to the piping P10. By bringing the predetermined parameter closer to the predetermined parameter derived from the measured change in the periodic surface temperature of the pipe P10, a model suitable for the actual pipe condition is obtained, and the risk of thinning from the model is obtained. judge.
- the temperature sensor 31 is arranged on the surface of the pipe P10 so as to measure the surface temperature of the pipe P10 at a point away from the heater 35 in the length direction of the pipe.
- the output signal of the temperature sensor 31 is input to the temperature detection device 33.
- the temperature detection device 33 detects the temperature of the pipe P10 from the output signal of the temperature sensor 31, and outputs the detection result to the information processing device 10.
- the distance between the temperature sensor 31 and the heater 35 may be appropriately set in consideration of the performance of the heater 35, the thickness of the pipe P10, and the like. Further, the number of temperature sensors 31 may be one or plural.
- the heater control device 37 periodically changes the output of the heater 35 based on the output and the frequency f set by the information processing device 10 to be described later.
- the heater 35 periodically heats the pipe P10 at the frequency f under the control of the heater control device 37.
- the information processing apparatus 10 includes an equivalent circuit (model) that models the heat transfer behavior of the pipe P10, the shape of the pipe P10, the shape of the heater 35, the type of fluid that flows through the pipe P10, the fluid pressure, the fluid flow rate, and the outside. Accepts input of temperature data.
- the fluid pressure, the fluid flow rate, and the outside air temperature are input to the information processing apparatus 10 from a sensor (not shown) installed in the pipe P10.
- the information processing apparatus 10 determines the output of the heater 35 and the frequency f based on the received model and various data, and sets them in the heater control device 37.
- the information processing apparatus 10 displays the determined output and frequency f on the display device 119 and the like included in the information processing apparatus 10, and the user who confirms the display sets the output and frequency f in the heater control device 37. Also good.
- the information processing apparatus 10 When the information processing apparatus 10 periodically heats the pipe P10 with the output of the heater 35 and the frequency f determined by the information processing apparatus 10, the surface temperature of the pipe P10 calculated from the model of the heat transfer behavior of the pipe P10. Based on the periodic change and the periodic change of the surface temperature of the pipe P10 actually measured, the thickness of the deposit inside the pipe P10 and the thickness of the pipe P10 are calculated, and the model is updated. Get a model that fits the actual piping conditions. And the information processing apparatus 10 determines the thinning risk of the piping P10 using the updated model. Further, the information processing apparatus 10 notifies information related to ultrasonic diagnosis of the pipe P10 and information related to cleaning of the pipe P10 based on the determination result of the thinning risk.
- the information processing apparatus 10 has a hardware configuration as shown in FIG. Specifically, as shown in FIG. 2, the information processing apparatus 10 includes a central processing unit (CPU) 111, a read only memory (ROM) 112, a random access memory (RAM) 113, and a storage device (hard disk drive: HDD). ) 114, a network interface 115, a portable storage medium drive 117 capable of reading data stored in the portable storage medium 116, an input device 118, a display device 119, and the like. Each component of the information processing apparatus 10 is connected to the bus 120.
- the input device 118 is, for example, a keyboard, a mouse, a touch panel, or the like, but is not limited thereto.
- the CPU 111 causes the information processing apparatus 10 to function as each unit of FIG. 3 by executing a program stored in the ROM 112 or the HDD 114 or a program read from the portable storage medium 116 by the portable storage medium drive 117.
- the information processing apparatus 10 when the CPU 111 executes a program, the information processing apparatus 10 includes a data reception unit 11, a determination unit 12, a diagnosis unit 13, and a determination unit as a determination unit and a notification unit. 15 functions.
- the data reception unit 11 receives an input of an equivalent circuit (model) that models the heat transfer behavior of the pipe P10 from the user, for example, via the input device 118.
- an equivalent circuit that models the heat transfer behavior of the pipe P10 will be described.
- FIG. 4 (A) is a cross-sectional view showing an example of a pipe where deposits are accumulated and the thickness is reduced. It is assumed that the fluid flows in the pipe P11 in the direction indicated by the arrow A1.
- a heater 35 is attached to the upstream side of the pipe P11, and a temperature sensor 31 is attached to the downstream side.
- a deposit L10 is deposited on the downstream side of the pipe P11.
- FIG. 4A when the heat from the heater 35 and the heat transfer path through which the fluid flowing through the pipe P11 and the temperature sensor 31 are transmitted via the pipe P11 are represented by an equivalent circuit, for example, FIG. 4B is obtained.
- the model shown in FIG. 4B is a model of the lower half of the pipe P11 as shown in FIG. 4C.
- the fluid flowing inside the pipe P11 is deposited inside the pipe P11.
- the numbers described adjacent to each element in FIG. 4B represent each section in FIG. 4C that each element models.
- thermal conductance of the pipe P11 the thermal conductance of the deposit L10, and the thermal conductance of the fluid are obtained by the following equation (1).
- G thermal conductance
- ⁇ thermal conductivity
- A area
- L length (or thickness).
- the thermal conductance of the deposit L10 is applied to the corresponding location in the equivalent circuit shown in FIG.
- An element to be expressed is added to modify the equivalent circuit as shown in FIG. It is not necessary to create a model every time, and a model created for a certain pipe can be used for a pipe having the same unevenness or bending of the pipe. Furthermore, it is preferable to register the model as a database in a storage device such as the HDD 114.
- the data receiving unit 11 receives input of physical property data of piping from the user via the input device 118. Specifically, the data receiving unit 11 receives an input of the shape of the pipe, the shape of the heater 35, and the type of fluid flowing through the pipe from the user. The data receiving unit 11 receives inputs of fluid pressure, fluid flow rate, and outside air temperature from various sensors (not shown) installed in the pipe. The data reception unit 11 outputs the received model and various data to the determination unit 12 and the diagnosis unit 13. In addition, the data receiving unit 11 receives the surface temperature data of the pipe measured by the temperature sensor 31 from the temperature detection device 33 and outputs the data to the diagnosis unit 13.
- the determining unit 12 determines the output and the frequency f of the heater 35 based on the received model and various data, and sets them in the heater control device 37.
- the diagnostic unit 13 inputs various data to the model that models the heat transfer behavior of the pipe, and performs a thermal network analysis.
- the diagnostic unit 13 determines the time at the peak value within the period of the change in the surface temperature of the pipe calculated from the model when the pipe is heated periodically, and the period of the change in the surface temperature of the pipe measured by the temperature sensor 31.
- the thickness Ld of the deposit inside the pipe is calculated based on the delay time between the peak value and the peak value.
- diagnosis unit 13 is based on the peak value of the pipe surface temperature obtained from the model when the thickness of the deposit is Ld and the peak value of the actual surface temperature of the pipe measured by the temperature sensor 31. Then, the pipe thickness Lp is calculated. The diagnosis unit 13 outputs the calculated deposit thickness Ld and pipe thickness Lp to the determination unit 15.
- the determination unit 15 calculates the thermal conductance of the pipe in the model when the thickness of the deposit is Ld and the thickness of the pipe is Lp.
- the determination unit 15 compares the threshold registered in the threshold DB 16 with the calculated thermal conductance to determine whether there is a risk of thinning.
- the threshold value DB 16 stores a threshold value determined based on the thermal conductance of the piping when the piping is replaced in another similar piping system in the past. For example, when the calculated thermal conductance is equal to or greater than the threshold value, the determination unit 15 determines that there is a risk of thinning (the possibility that the pipe is thin enough to require replacement of the pipe). For example, if the determination unit 15 determines that there is a risk of thinning, the determination unit 15 notifies information related to ultrasonic diagnosis, and if not, notifies information related to pipe cleaning.
- FIG. 6 is a flowchart illustrating an example of piping diagnosis processing executed by the information processing apparatus 10.
- the process of FIG. 6 is performed regularly (every 6 months), for example. Note that the processing of FIG. 6 may be executed at a timing designated by an administrator of the piping facility, for example.
- a case will be described as an example in which a diagnosis is performed on the piping system A that has passed 6 years since the previous piping was replaced.
- the outer diameter of the piping is 100 mm
- the initial thickness is 5 mm
- the flow rate of water flowing through the piping measured by the flow sensor is 2 m / s.
- the flow velocity distribution of the water flowing in the pipe is uniform and the flow velocity is constant, and that the heat transfer of the pipe and the deposit is constant.
- the data receiving unit 11 receives an input of a model that models the heat transfer behavior of a pipe to be inspected (step S11).
- the data receiving unit 11 receives input of pipe shape data and heater shape data (step S13). Moreover, the data reception part 11 receives the input of sensor data (flow rate / pressure / outside temperature) (step S17).
- the determination unit 12 determines the output and cycle of the heater 35 (step S19). For example, the determination unit 12 determines the period of the heating cycle of the heater 35 as 6000 seconds. The heater 35 starts periodic heating of the pipe with the determined output and cycle.
- the diagnosis unit 13 compares the time in the peak value within the cycle of the change in the surface temperature of the pipe calculated from the heating cycle of the pipe and the model, and the peak value in the cycle of the change in the surface temperature of the measured pipe. Based on the delay time, the deposit thickness Ld in the element representing the thermal conductance of the deposit in the model is calculated (step S21). Specifically, the diagnosis unit 13 assumes that the pipe thickness Lp is an initial thickness of 5 mm, and changes the deposit thickness Ld to minimize the delay time between the model and the actual measurement. The length Ld is calculated. When deposits are accumulated inside the pipe, the way in which heat is transferred from the fluid flowing inside the pipe to the temperature sensor 31 is delayed, and a delay occurs in the peak within the heating cycle of the pipe. Can be used to calculate the thickness Ld.
- the diagnosis unit 13 determines the time at the peak value in the cycle of the temperature change of the surface temperature of the pipe when the thickness of the deposit is 0 mm, 13.5 mm, and 27 mm in the model, and the actually measured temperature. The delay time with respect to the time at the peak value within the period of change is calculated. The diagnosis unit 13 calculates the thickness Ld of the deposit that minimizes the delay time between the time at the peak value calculated from the model and the time at the actually measured peak value. For example, as shown in FIG. 7A, when the thickness of the deposit is assumed to be 0 mm, 13.5 mm, and 27 mm, the time at the peak value calculated from the model is 1500 seconds, 1875 seconds, and 2250, respectively. Suppose that it was seconds. In this case, when the time at the actually measured peak value is 2000 seconds, the diagnosis unit 13 calculates 18 mm as the thickness Ld of the deposit. Since the thickness Ld of the deposit is calculated based on the actually measured value, Ld with high accuracy can be calculated.
- the temperature waveform of the surface temperature of the pipe may be calculated with respect to the blockage rate of the pipe. For example, in the case of a pipe having an outer diameter of 100 mm and an initial thickness of 5 mm, if the deposit thickness is 13.5 mm, the blocking rate is 30%, and if the deposit thickness is 27 mm, the blocking rate is 60. %.
- the diagnosis unit 13 inputs the deposit thickness Ld calculated in step S21 into the model, and updates the model (step S22). Thereby, the state of the deposit actually deposited inside the pipe is reflected in the model. That is, since the model is updated to a model that matches the actual piping state, the accuracy of the model is improved.
- the diagnosis unit 13 uses the model based on the peak value of the surface temperature of the pipe calculated from the model to which the thickness Ld is input (reflected) and the peak value of the actual surface temperature of the measured pipe.
- the pipe thickness Lp in the element representing the thermal conductance of the pipe is calculated (step S23). Specifically, the diagnosis unit 13 changes the pipe thickness Lp to calculate the pipe thickness Lp that minimizes the difference between the peak value calculated from the model and the actually measured peak value. As the pipe is thicker, the heat from the heater 35 diffuses and the peak value of the pipe surface temperature becomes lower. Therefore, the peak value of the pipe surface temperature can be used to calculate the pipe thickness Lp.
- the diagnosis unit 13 calculates the peak value of the surface temperature of the pipe when the pipe thickness Lp is set to 1 mm and 5 mm in the model in which the deposit thickness Ld calculated in step S21 is input, for example. Then, the diagnosis unit 13 calculates the pipe thickness Lp that minimizes the difference between the peak value calculated from the model and the measured peak value of the actual surface temperature of the pipe. For example, as shown in FIG. 7B, the peak values of the surface temperature of the pipe calculated from the model when the pipe thickness Lp is 1 mm and 5 mm are 37.0 ° C. and 36.0 ° C., respectively. Suppose there was.
- the diagnosis unit 13 calculates approximately 3 mm as the pipe thickness Lp. Since the pipe thickness Lp is calculated based on the actually measured value, it is possible to calculate Lp with high accuracy.
- the diagnosis unit 13 inputs the pipe thickness Lp calculated in step S23 into the model, and updates the model (step S24). Thereby, the actual thinning state of the pipe is reflected in the model. That is, since the model is updated to a model that matches the actual piping state, the accuracy of the model is improved.
- step S21 and step S23 the model assumes that the flow velocity distribution of the fluid in the pipe is uniform and the flow velocity is constant, and that the heat transfer of the pipe and the deposit is also constant. Since it is assumed, there is a possibility that an error is included in the calculation result from the model. Therefore, it is preferable that the surface temperature data of the pipe is acquired by performing an experiment in the initial stage of the pipe installation without deposits. The calculation accuracy can be improved by correcting the value calculated from the model based on the experimental data.
- the determination unit 15 determines whether there is a risk of thinning (step S25). Specifically, in a model in which the deposit thickness Ld and the pipe thickness Lp are input (reflected), the thermal conductance of the pipe is calculated. The determination unit 15 determines that there is a risk of thinning when the calculated thermal conductance is equal to or greater than a threshold value registered in the threshold value DB 16. For example, as shown in FIG. 8, the thermal conductance of the pipe calculated when the pipe diagnosis process was performed every six months since the previous pipe was replaced did not exceed the threshold value of 17.0 W / K. This time (six years after pipe replacement), when calculating the thermal conductance of the pipe, it is assumed that it exceeded the threshold value of 17.0 W / K. In this case, the determination unit 15 determines that there is a risk of thinning.
- the determination unit 15 When it is determined that there is a risk of thinning (step S25 / YES), the determination unit 15 notifies information related to the ultrasonic diagnosis (step S27), and ends the process of FIG. For example, the determination unit 15 displays a message on the display device 119 of the information processing apparatus 10 that recommends performing ultrasound diagnosis. Thereby, the user (for example, manager of piping equipment) can secure equipment and personnel necessary for ultrasonic diagnosis.
- the information processing apparatus 10 is calculated from a model when the pipe is heated in a model in which the heat transfer behavior inside the pipe including deposits is modeled by an equivalent circuit.
- a diagnosis unit 13 for diagnosing the state of the pipe from the model updated based on the temperature change of the pipe and the temperature change of the pipe measured when the pipe is heated. Since the temperature change calculated from the model and the actually measured temperature change are used, the accuracy of the model is improved, and the diagnosis accuracy of the piping state using the model is also improved.
- the model includes a fluid flowing inside the pipe, deposits accumulated inside the pipe, and elements representing the pipe, and the diagnosis unit 13 starts from the model when the pipe is heated periodically.
- the state of deposits accumulated in the pipe based on the delay time between the calculated time at the peak value within the period of the temperature change of the pipe and the time at the peak value within the period of the measured temperature change of the pipe Is calculated.
- the delay time between the model and the actual measurement it is possible to calculate the state of the deposit accumulated on the pipe (the thickness of the deposit).
- the accuracy of the model is improved, and the diagnostic accuracy of the state of the pipe using the model is also improved.
- the diagnosis unit 13 updates the model in the state of the deposit accumulated on the calculated pipe, and the peak of the surface temperature of the pipe calculated from the model when the pipe is periodically heated. Based on the value and the peak value of the measured surface temperature of the pipe, the state of thinning of the pipe is calculated. By using the peak value calculated from the model and the actually measured peak value, it is possible to calculate the state of pipe thinning (pipe thickness). Thereby, the accuracy of the model is improved, and the diagnostic accuracy of the state of the pipe using the model is also improved.
- the information processing apparatus 10 updates the model in the calculated pipe thinning state, and determines the conductance value calculated from the updated model and the conductance value when the pipe is replaced.
- the determination part 15 which determines a thinning risk based on the determined threshold value is provided. Since the thinning risk is determined by comparison with the conductance value when the pipe has been replaced in the past, the thinning risk can be accurately determined.
- the determination unit 15 of the information processing apparatus 10 notifies information related to work on the pipe based on the diagnosed pipe state. Thereby, the user of the information processing apparatus 10 can assign tools and personnel necessary for ultrasonic diagnosis and cleaning of the piping.
- the pipe condition is calculated and reflected in the model, but the present invention is not limited to this.
- the pipe state is determined based on the change in the surface temperature of the pipe calculated from the model when the pipe is cooled and the change in the surface temperature of the pipe actually measured. It may be calculated and reflected in the model.
- the model can be adapted to the actual state of the piping by bringing the predetermined parameter value calculated from the model close to the actual measurement value.
- the information processing apparatus 10 may be a cloud.
- the worker is on the information processing apparatus 10 connected to the worker terminal 20 via a wired or wireless network NW, such as the Internet, Local Area Network (LAN), Wide Area Network (WAN), or the like. Diagnosis of piping can be performed by the service provided in.
- NW wireless or wireless network
- LAN Local Area Network
- WAN Wide Area Network
- the above processing functions can be realized by a computer.
- a program describing the processing contents of the functions that the processing apparatus should have is provided.
- the program describing the processing contents can be recorded on a computer-readable recording medium (except for a carrier wave).
- the program When the program is distributed, for example, it is sold in the form of a portable storage medium such as a DVD (Digital Versatile Disc) or CD-ROM (Compact Disc Read Only Memory) on which the program is recorded. It is also possible to store the program in a storage device of a server computer and transfer the program from the server computer to another computer via a network.
- a portable storage medium such as a DVD (Digital Versatile Disc) or CD-ROM (Compact Disc Read Only Memory) on which the program is recorded. It is also possible to store the program in a storage device of a server computer and transfer the program from the server computer to another computer via a network.
- the computer that executes the program stores, for example, the program recorded in the portable storage medium or the program transferred from the server computer in its own storage device. Then, the computer reads the program from its own storage device and executes processing according to the program. The computer can also read the program directly from the portable storage medium and execute processing according to the program. Further, each time the program is transferred from the server computer, the computer can sequentially execute processing according to the received program.
Landscapes
- Physics & Mathematics (AREA)
- General Physics & Mathematics (AREA)
- Life Sciences & Earth Sciences (AREA)
- Immunology (AREA)
- General Health & Medical Sciences (AREA)
- Pathology (AREA)
- Health & Medical Sciences (AREA)
- Chemical & Material Sciences (AREA)
- Analytical Chemistry (AREA)
- Biochemistry (AREA)
- Engineering & Computer Science (AREA)
- Environmental Sciences (AREA)
- Ecology (AREA)
- Biodiversity & Conservation Biology (AREA)
- Environmental & Geological Engineering (AREA)
- Mechanical Engineering (AREA)
- General Engineering & Computer Science (AREA)
- Investigating Or Analyzing Materials Using Thermal Means (AREA)
Abstract
配管の状態を精度よく予測するため、配管診断方法は、堆積物を含む配管内部の伝熱挙動を等価回路でモデル化したモデルにおいて前記配管を加熱した場合に前記モデルから算出される前記配管の温度変化と、前記配管を加熱した場合に測定された前記配管の温度変化と、に基づいて更新された前記モデルから前記配管の状態を診断する、処理をコンピュータが実行する。
Description
本発明は、配管診断方法、配管診断装置、及び配管診断システムに関する。
ビルや工場などに設置された配管の減肉状態を予測することが行われている(例えば、特許文献1参照)。
上記技術では、配管をヒータにより加熱した後、配管が冷却されていく際の配管の温度を温度センサにより検出し、その温度変化に基づいて配管の減肉状態を予測している。しかしながら、例えば、配管に堆積物が堆積している場合、配管が減肉しているにもかかわらず、配管が減肉していない状態と同様の温度変化が検出される場合もあり、予測精度が十分でない可能性がある。
1つの側面では、本発明は、配管の状態を精度よく診断できる配管診断方法、配管診断装置、及び配管診断システムを提供することを目的とする。
一つの態様では、配管診断方法は、堆積物を含む配管内部の伝熱挙動を等価回路でモデル化したモデルにおいて前記配管を加熱した場合に前記モデルから算出される前記配管の温度変化と、前記配管を加熱した場合に測定された前記配管の温度変化と、に基づいて更新された前記モデルから前記配管の状態を診断する、処理をコンピュータが実行する配管診断方法である。
配管の状態を精度よく診断できる。
以下、一実施形態に係る配管診断システムについて、図1~図8に基づいて詳細に説明する。
図1には、一実施形態に係る配管診断システム100の構成が概略的に示されている。図1に示すように、配管診断システム100は、測定装置としての温度センサ31及び温度検出装置33と、加熱装置としてのヒータ35と、ヒータ制御装置37と、配管診断装置としての情報処理装置10と、を備える。
配管診断システム100は、ヒータ35により配管P10を加熱した場合に堆積物を含む配管P10の内部の伝熱挙動を等価回路でモデル化したモデルから算出される配管P10の温度変化を、測定された配管の温度変化と比較することにより、モデルの精度を高め、当該モデルを用いて配管P10の状態を診断する装置である。より具体的には、配管診断システム100は、ヒータ35の出力を周期的に変化させ、配管P10に周期的な温度変化を与えた場合の配管P10の周期的な表面温度の変化から導出される所定のパラメータを、測定された配管P10の周期的な表面温度の変化から導出される所定のパラメータに近づけることによって、実際の配管の状態に適合したモデルを得て、当該モデルから減肉リスクを判定する。
温度センサ31は、ヒータ35から配管の長さ方向に所定距離離れた地点の配管P10の表面温度を測定するよう、配管P10の表面上に配置される。温度センサ31の出力信号は、温度検出装置33に入力される。温度検出装置33は、温度センサ31の出力信号から配管P10の温度を検出し、検出結果を情報処理装置10に出力する。温度センサ31とヒータ35との間の距離は、ヒータ35の性能や配管P10の厚さ等を考慮して適宜設定すればよい。また、温度センサ31の数は、1つでもよいし、複数でもよい。
ヒータ制御装置37は、後述する情報処理装置10が設定した出力及び周波数fに基づいて、ヒータ35の出力を周期的に変化させる。ヒータ35は、ヒータ制御装置37の制御の下、配管P10を周波数fで周期的に加熱する。
情報処理装置10は、配管P10の伝熱挙動をモデル化した等価回路(モデル)、配管P10の形状、ヒータ35の形状、配管P10を流れる流体の種類、流体の圧力、流体の流量、及び外気温のデータの入力を受け付ける。なお、流体の圧力、流体の流量、及び外気温は、配管P10に設置されたセンサ(不図示)から情報処理装置10に入力される。
情報処理装置10は、受け付けたモデル及び各種データに基づいて、ヒータ35の出力及び周波数fを決定し、ヒータ制御装置37に設定する。なお、情報処理装置10は、決定した出力及び周波数fを情報処理装置10が備える表示装置119等に表示し、当該表示を確認したユーザが、出力及び周波数fをヒータ制御装置37に設定してもよい。
情報処理装置10は、情報処理装置10が決定したヒータ35の出力及び周波数fで配管P10を周期的に加熱した場合に、配管P10の伝熱挙動のモデルから算出される配管P10の表面温度の周期的な変化と、実際に測定された配管P10の表面温度の周期的な変化と、に基づいて、配管P10内部の堆積物の厚さや、配管P10の厚さを算出し、モデルを更新し、実際の配管の状態に適合するモデルを得る。そして、情報処理装置10は、更新したモデルを用いて、配管P10の減肉リスクを判定する。また、情報処理装置10は、減肉リスクの判定結果に基づいて、配管P10の超音波診断に関する情報や、配管P10の洗浄に関する情報を報知する。
情報処理装置10は、図2に示すようなハードウェア構成を有する。具体的には、情報処理装置10は、図2に示すように、Central Processing Unit(CPU)111、Read Only Memory(ROM)112、Random Access Memory(RAM)113、記憶装置(Hard Disk Drive:HDD)114、ネットワークインタフェース115、可搬型記憶媒体116に記憶されたデータを読み取り可能な可搬型記憶媒体用ドライブ117、入力装置118、及び表示装置119等を備えている。これら情報処理装置10の構成各部は、バス120に接続されている。入力装置118は、例えば、キーボード、マウス、及びタッチパネル等であるが、これらに限定されるものではない。CPU111は、ROM112あるいはHDD114に格納されているプログラム、或いは可搬型記憶媒体用ドライブ117が可搬型記憶媒体116から読み取ったプログラムを実行することで、情報処理装置10を図3の各部として機能させる。
具体的には、図3に示すように、CPU111がプログラムを実行することにより、情報処理装置10は、データ受付部11、決定部12、診断部13、並びに判定部及び報知部としての判定部15として機能する。
データ受付部11は、例えば入力装置118を介し、ユーザから、配管P10の伝熱挙動をモデル化した等価回路(モデル)の入力を受け付ける。ここで、配管P10の伝熱挙動をモデル化した等価回路について説明する。
図4(A)は、堆積物が堆積し、減肉した配管の一例を示す断面図である。配管P11内を流体が矢印A1で示す方向に流れているものとする。配管P11の上流側にはヒータ35が取り付けられ、下流側には温度センサ31が取り付けられている。配管P11の下流側には、堆積物L10が堆積している。
図4(A)において、ヒータ35からの熱が、配管P11を流れる流体及び配管P11を介して温度センサ31に伝わる伝熱経路を等価回路で表すと、例えば、図4(B)となる。ここで、図4(B)に示すモデルは、図4(C)に示すように、配管P11の下半分をモデル化したものであり、配管P11の内部を流れる流体、配管P11の内部に堆積した堆積物、及び配管P11の熱コンダクタンスを表す要素を含む。図4(B)の各要素に隣接して記載した数字は、各要素がモデル化した図4(C)の各区画を表している。
ここで、配管P11の熱コンダクタンス、堆積物L10の熱コンダクタンス、及び流体の熱コンダクタンスは、以下の式(1)で求められる。

なお、図5(A)に示すように、ヒータ35を設置した箇所にも堆積物L10が存在する場合には、図4(B)に示す等価回路の該当箇所に堆積物L10の熱コンダクタンスを表す要素を追加して、図5(B)に示すような等価回路に修正する。モデルは毎回作成する必要はなく、ある配管に対して作成したモデルを、配管の凹凸や曲がりなどが同等な配管に流用することができる。さらに、モデルをデータベースとしてHDD114等の記憶装置に登録しておくことが好ましい。
図3に戻り、データ受付部11は、入力装置118を介し、ユーザから配管の物性データの入力を受け付ける。具体的には、データ受付部11は、配管の形状、ヒータ35の形状、配管を流れる流体の種類の入力をユーザから受け付ける。また、データ受付部11は、配管に設置された各種センサ(不図示)から、流体の圧力、流体の流量、及び外気温の入力を受け付ける。データ受付部11は、受け付けたモデル及び各種データを決定部12及び診断部13に出力する。また、データ受付部11は、温度検出装置33から、温度センサ31が測定した、配管の表面温度のデータを受け付け、診断部13に出力する。
決定部12は、受け付けたモデル及び各種データに基づいて、ヒータ35の出力及び周波数fを決定し、ヒータ制御装置37に設定する。
診断部13は、配管の伝熱挙動をモデル化したモデルに対して、各種データを入力し、熱回路網解析を行う。診断部13は、配管を周期的に加熱した場合にモデルから算出される配管の表面温度の変化の周期内のピーク値における時間と、温度センサ31により測定された配管の表面温度の変化の周期内のピーク値における時間と、の遅延時間に基づいて、配管内部の堆積物の厚さLdを算出する。
さらに、診断部13は、堆積物の厚さがLdである場合にモデルから得られる配管の表面温度のピーク値と、温度センサ31により測定された配管の実際の表面温度のピーク値とに基づいて、配管の厚さLpを算出する。診断部13は、算出した堆積物の厚さLd及び配管の厚さLpを判定部15に出力する。
判定部15は、堆積物の厚さがLdであり、配管の厚さがLpである場合のモデルにおける配管の熱コンダクタンスを算出する。判定部15は、閾値DB16に登録されている閾値と、算出した熱コンダクタンスを比較して、減肉リスクが存在するか否かを判定する。閾値DB16には、過去に他の同様の配管系統において配管を交換した際の配管の熱コンダクタンスに基づいて決定された閾値が格納されている。例えば、判定部15は、算出した熱コンダクタンスが閾値以上である場合に、減肉リスクが存在する(配管の交換が必要なほど配管が減肉している可能性が高い)と判定する。判定部15は、例えば、減肉リスクが存在すると判定すると、超音波診断に関する情報を報知し、そうでない場合には、配管洗浄に関する情報を報知する。
次に、情報処理装置10が実行する配管診断処理の一例について説明する。図6は、情報処理装置10が実行する配管診断処理の一例を示すフローチャートである。図6の処理は、例えば、定期的(6か月おき)に実行される。なお、図6の処理を、例えば、配管設備の管理者が指定するタイミングで実行してもよい。以下の説明では、前回配管を交換してから6年経過した配管系統Aについて診断を行う場合を例に説明する。配管系統Aは、配管の外径が100mm、初期厚さ5mmであり、流量センサによって測定された、配管内を流れる水の流速は2m/sであるとする。また、配管内を流れる水の流速分布が均一で、かつ、流速が一定であると仮定し、配管及び堆積物の熱の伝わり方は一定であると仮定する。
図6の処理において、まず、データ受付部11は、検査対象となる配管の伝熱挙動をモデル化したモデルの入力を受け付ける(ステップS11)。
次に、データ受付部11は、配管形状データ及びヒータ形状データの入力を受け付ける(ステップS13)。また、データ受付部11は、センサデータ(流量/圧力/外気温)の入力を受け付ける(ステップS17)。
次に、決定部12は、ヒータ35の出力及び周期を決定する(ステップS19)。例えば、決定部12は、ヒータ35の加熱サイクルの周期を6000秒と決定する。ヒータ35は、決定された出力及び周期で、配管の周期的な加熱を開始する。
次に、診断部13は、配管の加熱周期とモデルから算出される配管の表面温度の変化の周期内のピーク値における時間と、測定された配管の表面温度の変化の周期内のピーク値における時間と、の遅延時間に基づいて、モデルにおいて堆積物の熱コンダクタンスを表す要素における堆積物の厚さLdを算出する(ステップS21)。具体的には、診断部13は、配管の厚さLpを初期厚さ5mmであるとし、堆積物の厚さLdを変化させて、モデルと実測との遅延時間が最小となる堆積物の厚さLdを算出する。配管内部に堆積物が堆積すると、配管内部を流れる流体から温度センサ31への熱の伝わり方が遅くなり、配管の加熱周期内のピークに遅延が生じるため、遅延時間を、配管内部の堆積物の厚さLdを算出するのに用いることができる。
例えば、診断部13は、モデルにおいて堆積物の厚さを0mm、13.5mm、及び27mmとした場合の配管の表面温度の温度変化の周期内のピーク値における時間と、実際に測定された温度変化の周期内のピーク値における時間との遅延時間を算出する。診断部13は、モデルから算出されたピーク値における時間と、実測されたピーク値における時間と、の遅延時間が最小となる堆積物の厚さLdを算出する。例えば、図7(A)に示すように、堆積物の厚さを0mm、13.5mm、及び27mmと仮定した場合にモデルから算出されたピーク値における時間がそれぞれ1500秒、1875秒、及び2250秒であったとする。この場合において、実測されたピーク値における時間が2000秒であった場合、診断部13は、堆積物の厚さLdとして18mmを算出する。実測値に基づいて、堆積物の厚さLdを算出するので、精度の高いLdを算出することができる。
なお、堆積物の厚さに代わり、配管の閉塞率に対して、配管の表面温度の温度波形を算出してもよい。例えば、外径100mm、初期厚さ5mmの配管の場合、堆積物の厚さが13.5mmであれば、閉塞率は30%となり、堆積物の厚さが27mmであれば、閉塞率は60%となる。
図6に戻り、診断部13は、ステップS21で算出した堆積物の厚さLdをモデルに入力し、モデルを更新する(ステップS22)。これにより、実際に配管内部に堆積した堆積物の状態がモデルに反映される。すなわち、モデルが、実際の配管の状態に適合したモデルに更新されるので、モデルの精度が向上する。
次に、診断部13は、厚さLdを入力した(反映した)モデルから算出した配管の表面温度のピーク値と、測定された配管の実際の表面温度のピーク値とに基づいて、モデルにおいて配管の熱コンダクタンスを表す要素における配管の厚さLpを算出する(ステップS23)。具体的には、診断部13は、配管の厚さLpを変化させて、モデルから算出されたピーク値と実測されたピーク値との差を最小とする配管の厚さLpを算出する。配管が厚いほど、ヒータ35からの熱が拡散して配管の表面温度のピーク値が低くなるため、配管の表面温度のピーク値を、配管の厚さLpを算出するのに用いることができる。
診断部13は、例えば、ステップS21で算出した堆積物の厚さLdを入力したモデルにおいて、配管の厚さLpを1mm及び5mmとした場合の配管の表面温度のピーク値を算出する。そして、診断部13は、モデルから算出されたピーク値と、測定された配管の実際の表面温度のピーク値との差を最小とする配管の厚さLpを算出する。例えば、図7(B)に示すように、配管の厚さLpを1mm及び5mmとしたときにモデルから算出される配管の表面温度のピーク値が、それぞれ37.0℃、36.0℃であったとする。この場合において、実際に測定された配管の表面温度のピーク値が36.6℃である場合、診断部13は、配管の厚さLpとして、およそ3mmを算出する。実測値に基づいて配管の厚さLpを算出するので、精度の高いLpを算出することができる。
図6に戻り、診断部13は、ステップS23で算出した配管の厚さLpをモデルに入力し、モデルを更新する(ステップS24)。これにより、実際の配管の減肉の状態がモデルに反映される。すなわち、モデルが、実際の配管の状態に適合したモデルに更新されるので、モデルの精度が向上する。
なお、ステップS21及びステップS23において、モデルでは、配管内の流体の流速分布が均一でかつ流速が一定であると仮定しており、さらに、配管及び堆積物の熱の伝わり方も一定であると仮定していることから、モデルからの算出結果に誤差が含まれる可能性がある。したがって、堆積物がない、配管設置初期に実験を行って配管の表面温度のデータを取得することが好ましい。実験データに基づいてモデルから算出した値を補正することによって、算出精度を向上させることができる。
次に、判定部15は、減肉リスクがあるか否かを判定する(ステップS25)。具体的には、堆積物の厚さLd及び配管の厚さLpが入力された(反映された)モデルにおいて、配管の熱コンダクタンスを算出する。判定部15は、算出した熱コンダクタンスが、閾値DB16に登録されている閾値以上である場合、減肉リスクがあると判断する。例えば、図8に示すように、前回配管を交換してから半年ごとに配管診断処理を行ったときに算出した配管の熱コンダクタンスは、閾値である17.0W/Kを越えていなかったが、今回(配管交換後6年)配管の熱コンダクタンスを算出すると、閾値である17.0W/Kを越えていたとする。この場合、判定部15は、減肉リスクがあると判定する。
減肉リスクがあると判定した場合(ステップS25/YES)、判定部15は、超音波診断に関する情報を報知し(ステップS27)、図6の処理を終了する。例えば、判定部15は、超音波診断の実施を推奨する旨のメッセージを情報処理装置10の表示装置119に表示する。これにより、ユーザ(例えば、配管設備の管理者)は、超音波診断に必要な機材及び人員を確保することができる。一方、減肉リスクがないと判定した場合(ステップS25/NO)、判定部15は、配管洗浄に関する情報を報知し(ステップS29)、図6の処理を終了する。例えば、判定部15は、配管洗浄を推奨する旨のメッセージを情報処理装置10の表示装置119に表示する。これにより、ユーザは、配管洗浄に必要な機材及び人員を確保することができる。
以上詳細に説明したように、本実施形態によれば、情報処理装置10は、堆積物を含む配管内部の伝熱挙動を等価回路でモデル化したモデルにおいて配管を加熱した場合にモデルから算出される配管の温度変化と、配管を加熱した場合に測定された配管の温度変化と、に基づいて更新されたモデルから配管の状態を診断する診断部13を備える。モデルから算出される温度変化と実測された温度変化とを用いるので、モデルの精度が向上し、モデルを用いた配管の状態の診断精度も向上する。
また、本実施形態によれば、モデルは、配管内部を流れる流体、配管内部に堆積した堆積物、及び配管を表す要素を含み、診断部13は、配管を周期的に加熱した場合にモデルから算出される配管の温度変化の周期内のピーク値における時間と、測定された配管の温度変化の周期内のピーク値における時間と、の遅延時間に基づいて、配管内部に堆積した堆積物の状態を算出する。モデルと実測との遅延時間を用いることで、配管に堆積した堆積物の状態(堆積物の厚さ)を算出することができる。これにより、モデルの精度が向上し、モデルを用いた配管の状態の診断精度も向上する。
また、本実施形態によれば、診断部13は、算出した配管に堆積した堆積物の状態でモデルを更新し、配管を周期的に加熱した場合にモデルから算出される配管の表面温度のピーク値と、測定された配管の表面温度のピーク値と、に基づいて、配管の減肉の状態を算出する。モデルから算出したピーク値と、実測されたピーク値とを用いることで、配管の減肉の状態(配管の厚さ)を算出することができる。これにより、モデルの精度が向上し、モデルを用いた配管の状態の診断精度も向上する。
また、本実施形態において、情報処理装置10は、算出した配管の減肉の状態でモデルを更新し、更新されたモデルから算出したコンダクタンス値と、配管を交換したときのコンダクタンス値に基づいて定めた閾値とに基づいて、減肉リスクを判定する判定部15を備える。過去に配管を交換した際のコンダクタンス値との比較によって、減肉リスクを判定するため、精度よく減肉リスクを判定できる。
また、本実施形態において、情報処理装置10の判定部15は、診断した配管の状態に基づいて、配管に対する作業に関する情報を報知する。これにより、情報処理装置10のユーザは、配管の超音波診断、洗浄等に必要な器具及び人員のアサインを行うことができる。
なお、上記実施形態では、配管を周期的に加熱した場合にモデルから算出される配管の周期的な表面温度の変化と、実際に測定された配管の周期的な表面温度の変化と、に基づいて、配管の状態を算出しモデルに反映させていたが、これに限られるものではない。例えば、配管を加熱した後、配管が冷却されていく際にモデルから算出される配管の表面温度の変化と、実際に測定された配管の表面温度の変化と、に基づいて、配管の状態を算出しモデルに反映させてもよい。この場合も、モデルから算出された所定のパラメータ値を実測値に近づけることで、配管の実際の状態にモデルを適合させることができる。
なお、上記実施形態において、情報処理装置10はクラウドであってもよい。作業者は、図9に示すように、インターネット、Local Area Network(LAN)、Wide Area Network(WAN)等、有線又は無線のネットワークNWを介して作業者端末20と接続された情報処理装置10上で提供されるサービスによって配管診断を行うことができる。
なお、上記の処理機能は、コンピュータによって実現することができる。その場合、処理装置が有すべき機能の処理内容を記述したプログラムが提供される。そのプログラムをコンピュータで実行することにより、上記処理機能がコンピュータ上で実現される。処理内容を記述したプログラムは、コンピュータで読み取り可能な記録媒体(ただし、搬送波は除く)に記録しておくことができる。
プログラムを流通させる場合には、例えば、そのプログラムが記録されたDVD(Digital Versatile Disc)、CD-ROM(Compact Disc Read Only Memory)などの可搬型記憶媒体の形態で販売される。また、プログラムをサーバコンピュータの記憶装置に格納しておき、ネットワークを介して、サーバコンピュータから他のコンピュータにそのプログラムを転送することもできる。
プログラムを実行するコンピュータは、例えば、可搬型記憶媒体に記録されたプログラムもしくはサーバコンピュータから転送されたプログラムを、自己の記憶装置に格納する。そして、コンピュータは、自己の記憶装置からプログラムを読み取り、プログラムに従った処理を実行する。なお、コンピュータは、可搬型記憶媒体から直接プログラムを読み取り、そのプログラムに従った処理を実行することもできる。また、コンピュータは、サーバコンピュータからプログラムが転送されるごとに、逐次、受け取ったプログラムに従った処理を実行することもできる。
上述した実施形態は本発明の好適な実施の例である。但し、これに限定されるものではなく、本発明の要旨を逸脱しない範囲内において種々変形実施可能である。
10 情報処理装置
31 温度センサ
33 温度検出装置
35 ヒータ
13 診断部
15 判定部
100、100´ 配管診断システム
31 温度センサ
33 温度検出装置
35 ヒータ
13 診断部
15 判定部
100、100´ 配管診断システム
Claims (11)
- 堆積物を含む配管内部の伝熱挙動を等価回路でモデル化したモデルにおいて前記配管を加熱した場合に前記モデルから算出される前記配管の温度変化と、前記配管を加熱した場合に測定された前記配管の温度変化と、に基づいて更新された前記モデルから前記配管の状態を診断する、
処理をコンピュータが実行する配管診断方法。 - 前記モデルは、前記配管内部を流れる流体、前記配管内部に堆積した堆積物、及び前記配管を表す要素を含み、
前記配管の状態を診断する処理は、前記配管を周期的に加熱した場合に前記モデルから算出される前記配管の温度変化の周期内のピーク値における時間と、測定された前記配管の温度変化の周期内のピーク値における時間と、の遅延時間に基づいて、前記配管内部に堆積した堆積物の状態を算出する処理を含む、
請求項1に記載の配管診断方法。 - 前記配管の状態を診断する処理は、算出した前記配管に堆積した堆積物の状態で前記モデルを更新し、前記配管を周期的に加熱した場合に更新された前記モデルから算出される前記配管の表面温度のピーク値と、測定された前記配管の表面温度のピーク値と、に基づいて、前記配管の減肉の状態を算出する処理を含む、
請求項2に記載の配管診断方法。 - 前記配管の状態を診断する処理は、算出した前記配管の減肉の状態で前記モデルを更新し、更新された前記モデルから算出したコンダクタンス値と、配管を交換したときのコンダクタンス値に基づいて定めた閾値とに基づいて、減肉リスクを判定する処理を含む、
請求項3記載の配管診断方法。 - 前記配管の状態に基づいて、前記配管に対する作業に関する情報を報知する、
処理をコンピュータに実行させる請求項1~4のいずれか一項に記載の配管診断方法。 - 堆積物を含む配管内部の伝熱挙動を等価回路でモデル化したモデルにおいて前記配管を加熱した場合に前記モデルから算出される前記配管の温度変化と、前記配管を加熱した場合に測定された前記配管の温度変化と、に基づいて更新された前記モデルから前記配管の状態を診断する診断部、
を備える配管診断装置。 - 前記モデルは、前記配管内部を流れる流体、前記配管内部に堆積した堆積物、及び前記配管を表す要素を含み、
前記診断部は、前記配管を周期的に加熱した場合に前記モデルから算出される前記配管の温度変化の周期内のピーク値における時間と、測定された前記配管の温度変化の周期内のピーク値における時間と、の遅延時間に基づいて、前記配管内部に堆積した堆積物の状態を算出する、
請求項6に記載の配管診断装置。 - 前記診断部は、算出した前記配管に堆積した堆積物の状態で前記モデルを更新し、前記配管を周期的に加熱した場合に更新された前記モデルから算出される前記配管の表面温度のピーク値と、測定された前記配管の表面温度のピーク値と、に基づいて、前記配管の減肉の状態を算出する、
請求項7に記載の配管診断装置。 - 前記配管の状態を診断する処理は、算出した前記配管の減肉の状態で前記モデルを更新し、更新された前記モデルから算出したコンダクタンス値と、配管を交換したときのコンダクタンス値に基づいて定めた閾値とに基づいて、減肉リスクを判定する判定部、
を備える請求項8記載の配管診断装置。 - 前記配管の状態に基づいて、前記配管に対する作業に関する情報を報知する報知部、
を備える請求項6~9のいずれか一項に記載の配管診断装置。 - 配管を加熱する加熱装置と、
前記配管の表面温度を測定する測定装置と、
堆積物を含む配管内部の伝熱挙動を等価回路でモデル化したモデルにおいて前記配管を加熱した場合に前記モデルから算出される前記配管の温度変化と、前記配管を加熱した場合に測定された前記配管の温度変化と、に基づいて更新された前記モデルから前記配管の状態を診断する診断部と、
を備える配管診断システム。
Priority Applications (3)
| Application Number | Priority Date | Filing Date | Title |
|---|---|---|---|
| JP2020503159A JP7006766B2 (ja) | 2018-02-28 | 2018-02-28 | 配管診断方法、配管診断装置、及び配管診断システム |
| PCT/JP2018/007483 WO2019167166A1 (ja) | 2018-02-28 | 2018-02-28 | 配管診断方法、配管診断装置、及び配管診断システム |
| US16/932,889 US20200348131A1 (en) | 2018-02-28 | 2020-07-20 | Method of diagnosing pipe, device of diagnosing pipe, and system of diagnosing pipe |
Applications Claiming Priority (1)
| Application Number | Priority Date | Filing Date | Title |
|---|---|---|---|
| PCT/JP2018/007483 WO2019167166A1 (ja) | 2018-02-28 | 2018-02-28 | 配管診断方法、配管診断装置、及び配管診断システム |
Related Child Applications (1)
| Application Number | Title | Priority Date | Filing Date |
|---|---|---|---|
| US16/932,889 Continuation US20200348131A1 (en) | 2018-02-28 | 2020-07-20 | Method of diagnosing pipe, device of diagnosing pipe, and system of diagnosing pipe |
Publications (1)
| Publication Number | Publication Date |
|---|---|
| WO2019167166A1 true WO2019167166A1 (ja) | 2019-09-06 |
Family
ID=67805184
Family Applications (1)
| Application Number | Title | Priority Date | Filing Date |
|---|---|---|---|
| PCT/JP2018/007483 Ceased WO2019167166A1 (ja) | 2018-02-28 | 2018-02-28 | 配管診断方法、配管診断装置、及び配管診断システム |
Country Status (3)
| Country | Link |
|---|---|
| US (1) | US20200348131A1 (ja) |
| JP (1) | JP7006766B2 (ja) |
| WO (1) | WO2019167166A1 (ja) |
Cited By (3)
| Publication number | Priority date | Publication date | Assignee | Title |
|---|---|---|---|---|
| JP2021518905A (ja) * | 2018-03-23 | 2021-08-05 | ローズマウント インコーポレイテッド | 非侵襲性パイプ壁診断法 |
| WO2022061228A1 (en) * | 2020-09-18 | 2022-03-24 | Watlow Electric Manufacturing Company | Systems and methods for detecting the presence of deposits in fluid flow conduits |
| TWI909139B (zh) * | 2021-09-22 | 2025-12-21 | 美商瓦特洛威電子製造公司 | 用於偵測流體流動導管中沉積物之存在之系統及方法 |
Families Citing this family (5)
| Publication number | Priority date | Publication date | Assignee | Title |
|---|---|---|---|---|
| KR101817083B1 (ko) * | 2016-06-03 | 2018-01-11 | 가천대학교 산학협력단 | 압전 센서의 구부림을 분석하는 장치 및 알고리즘 |
| CN114018981B (zh) * | 2021-09-28 | 2023-12-01 | 彩虹显示器件股份有限公司 | 一种铂金通道寿命的估算方法及系统 |
| CN115930873A (zh) * | 2021-10-06 | 2023-04-07 | 横河电机株式会社 | 估计设备、估计方法以及计算机可读记录介质 |
| JP7400790B2 (ja) * | 2021-10-06 | 2023-12-19 | 横河電機株式会社 | 推定装置、推定方法および推定プログラム |
| CN115631066B (zh) * | 2022-12-22 | 2023-03-07 | 成都秦川物联网科技股份有限公司 | 智慧燃气管道冻胀安全管理方法和物联网系统 |
Citations (5)
| Publication number | Priority date | Publication date | Assignee | Title |
|---|---|---|---|---|
| JPS6126809A (ja) * | 1984-07-16 | 1986-02-06 | Showa Denko Kk | 流体管内の付着物状況検知方法および装置 |
| JPS6413445A (en) * | 1987-07-07 | 1989-01-18 | Fujitsu Ltd | Method for calculating thermal resistance of heat radiating route from surface packaging type element |
| JP2001176729A (ja) * | 1999-12-20 | 2001-06-29 | Mitsubishi Electric Corp | 電力機器負荷監視装置 |
| US6886393B1 (en) * | 1999-10-01 | 2005-05-03 | 01 Db Metravib | Method and device for detecting deposit in a conduit |
| JP2016024174A (ja) * | 2014-07-24 | 2016-02-08 | 国立大学法人埼玉大学 | 物質の熱拡散率測定方法およびその方法を使った物質の熱電特性評価装置 |
Family Cites Families (3)
| Publication number | Priority date | Publication date | Assignee | Title |
|---|---|---|---|---|
| JP2000161943A (ja) * | 1998-11-26 | 2000-06-16 | Hitachi Ltd | 配管の肉厚測定装置 |
| WO2009135504A1 (de) * | 2008-05-07 | 2009-11-12 | Siemens Aktiengesellschaft | Einrichtung und verfahren zur detektion von ablagerungen |
| NO332832B1 (no) * | 2009-01-30 | 2013-01-21 | Statoil Asa | Fremgangsmate for a male tykkelsen av avsetninger |
-
2018
- 2018-02-28 JP JP2020503159A patent/JP7006766B2/ja not_active Expired - Fee Related
- 2018-02-28 WO PCT/JP2018/007483 patent/WO2019167166A1/ja not_active Ceased
-
2020
- 2020-07-20 US US16/932,889 patent/US20200348131A1/en not_active Abandoned
Patent Citations (5)
| Publication number | Priority date | Publication date | Assignee | Title |
|---|---|---|---|---|
| JPS6126809A (ja) * | 1984-07-16 | 1986-02-06 | Showa Denko Kk | 流体管内の付着物状況検知方法および装置 |
| JPS6413445A (en) * | 1987-07-07 | 1989-01-18 | Fujitsu Ltd | Method for calculating thermal resistance of heat radiating route from surface packaging type element |
| US6886393B1 (en) * | 1999-10-01 | 2005-05-03 | 01 Db Metravib | Method and device for detecting deposit in a conduit |
| JP2001176729A (ja) * | 1999-12-20 | 2001-06-29 | Mitsubishi Electric Corp | 電力機器負荷監視装置 |
| JP2016024174A (ja) * | 2014-07-24 | 2016-02-08 | 国立大学法人埼玉大学 | 物質の熱拡散率測定方法およびその方法を使った物質の熱電特性評価装置 |
Cited By (6)
| Publication number | Priority date | Publication date | Assignee | Title |
|---|---|---|---|---|
| JP2021518905A (ja) * | 2018-03-23 | 2021-08-05 | ローズマウント インコーポレイテッド | 非侵襲性パイプ壁診断法 |
| JP7101256B2 (ja) | 2018-03-23 | 2022-07-14 | ローズマウント インコーポレイテッド | 非侵襲性パイプ壁診断法 |
| WO2022061228A1 (en) * | 2020-09-18 | 2022-03-24 | Watlow Electric Manufacturing Company | Systems and methods for detecting the presence of deposits in fluid flow conduits |
| JP2023545633A (ja) * | 2020-09-18 | 2023-10-31 | ワットロー・エレクトリック・マニュファクチャリング・カンパニー | 流体流導管内の堆積物の存在を検出するためのシステムおよび方法 |
| US12347703B2 (en) | 2020-09-18 | 2025-07-01 | Watlow Electric Manufacturing Company | Systems and methods for detecting the presence of deposits in fluid flow conduits |
| TWI909139B (zh) * | 2021-09-22 | 2025-12-21 | 美商瓦特洛威電子製造公司 | 用於偵測流體流動導管中沉積物之存在之系統及方法 |
Also Published As
| Publication number | Publication date |
|---|---|
| JPWO2019167166A1 (ja) | 2020-12-03 |
| JP7006766B2 (ja) | 2022-01-24 |
| US20200348131A1 (en) | 2020-11-05 |
Similar Documents
| Publication | Publication Date | Title |
|---|---|---|
| JP7006766B2 (ja) | 配管診断方法、配管診断装置、及び配管診断システム | |
| JP6884448B2 (ja) | スケール厚さ推定システム、スケール厚さ推定方法、およびスケール厚さ推定プログラム | |
| Ahmad et al. | The exponentiated Weibull software reliability growth model with various testing‐efforts and optimal release policy: A performance analysis | |
| US20230105228A1 (en) | Estimation device, estimation method, and non-transitory computer-readable recording medium for thickness of deposit | |
| Thöns et al. | On damage detection system information for structural systems | |
| KR20140109596A (ko) | 미검침 구간의 검침 데이터 예측 및 보정 방법과 그 장치 | |
| EP4163587A1 (en) | Estimation device, estimation method, and estimation computer program for estimating a precipitate thickness | |
| Loyola-Fuentes et al. | Estimation of fouling model parameters for shell side and tube side of crude oil heat exchangers using data reconciliation and parameter estimation | |
| KR102914416B1 (ko) | 열교환 튜브 손상도 평가 장치 | |
| WO2016174958A1 (ja) | 漏水発生位置推定装置、システムおよび方法 | |
| CN112525774B (zh) | 一种基于涡街流量计频谱的流速、密度和粘度的测量方法 | |
| JP2016086521A (ja) | 消費電力予測方法および装置 | |
| JP7014223B2 (ja) | 分析装置、診断装置、分析方法及びプログラム | |
| JP5749422B2 (ja) | 流量計測方法 | |
| EP4350310A1 (en) | Computer implemented method for determining boundary thermal resistance data, a computer product element and a system | |
| US11454529B2 (en) | Augmented flowmeter with a system for simulating fluid parameters | |
| JP7780403B2 (ja) | 系統性能監視装置、および、系統性能監視方法 | |
| EP4350309A1 (en) | Computer implemented method for determining boundary thermal resistance data, a computer product element and a system | |
| Xavier et al. | Automatic estimation of initial transient in a turbulent flow time series | |
| CN120344931A (zh) | 流体网络的整体多向异常和场景转变检测 | |
| JP6855953B2 (ja) | 配管診断方法、配管診断装置、及び配管診断システム | |
| JP2003065500A (ja) | 配水管網維持管理装置 | |
| JP2025094738A (ja) | 学習モデル生成装置、学習モデル生成プログラム、流量推定システム | |
| JP6856124B2 (ja) | 分析装置、分析方法及びコンピュータプログラム | |
| JP2023055661A (ja) | 推定装置、推定方法および推定プログラム |
Legal Events
| Date | Code | Title | Description |
|---|---|---|---|
| 121 | Ep: the epo has been informed by wipo that ep was designated in this application |
Ref document number: 18907731 Country of ref document: EP Kind code of ref document: A1 |
|
| ENP | Entry into the national phase |
Ref document number: 2020503159 Country of ref document: JP Kind code of ref document: A |
|
| NENP | Non-entry into the national phase |
Ref country code: DE |
|
| 122 | Ep: pct application non-entry in european phase |
Ref document number: 18907731 Country of ref document: EP Kind code of ref document: A1 |