WO2019160077A1 - Method for producing low-antigenic cell - Google Patents
Method for producing low-antigenic cell Download PDFInfo
- Publication number
- WO2019160077A1 WO2019160077A1 PCT/JP2019/005524 JP2019005524W WO2019160077A1 WO 2019160077 A1 WO2019160077 A1 WO 2019160077A1 JP 2019005524 W JP2019005524 W JP 2019005524W WO 2019160077 A1 WO2019160077 A1 WO 2019160077A1
- Authority
- WO
- WIPO (PCT)
- Prior art keywords
- hla
- allele
- cells
- cell
- base sequence
- Prior art date
Links
Images


Classifications
-
- G—PHYSICS
- G01—MEASURING; TESTING
- G01N—INVESTIGATING OR ANALYSING MATERIALS BY DETERMINING THEIR CHEMICAL OR PHYSICAL PROPERTIES
- G01N33/00—Investigating or analysing materials by specific methods not covered by groups G01N1/00 - G01N31/00
- G01N33/48—Biological material, e.g. blood, urine; Haemocytometers
- G01N33/50—Chemical analysis of biological material, e.g. blood, urine; Testing involving biospecific ligand binding methods; Immunological testing
- G01N33/53—Immunoassay; Biospecific binding assay; Materials therefor
- G01N33/569—Immunoassay; Biospecific binding assay; Materials therefor for microorganisms, e.g. protozoa, bacteria, viruses
- G01N33/56966—Animal cells
- G01N33/56977—HLA or MHC typing
-
- C—CHEMISTRY; METALLURGY
- C12—BIOCHEMISTRY; BEER; SPIRITS; WINE; VINEGAR; MICROBIOLOGY; ENZYMOLOGY; MUTATION OR GENETIC ENGINEERING
- C12N—MICROORGANISMS OR ENZYMES; COMPOSITIONS THEREOF; PROPAGATING, PRESERVING, OR MAINTAINING MICROORGANISMS; MUTATION OR GENETIC ENGINEERING; CULTURE MEDIA
- C12N5/00—Undifferentiated human, animal or plant cells, e.g. cell lines; Tissues; Cultivation or maintenance thereof; Culture media therefor
- C12N5/06—Animal cells or tissues; Human cells or tissues
- C12N5/0602—Vertebrate cells
- C12N5/0696—Artificially induced pluripotent stem cells, e.g. iPS
-
- A—HUMAN NECESSITIES
- A61—MEDICAL OR VETERINARY SCIENCE; HYGIENE
- A61K—PREPARATIONS FOR MEDICAL, DENTAL OR TOILETRY PURPOSES
- A61K39/00—Medicinal preparations containing antigens or antibodies
- A61K39/0005—Vertebrate antigens
- A61K39/001—Preparations to induce tolerance to non-self, e.g. prior to transplantation
-
- C—CHEMISTRY; METALLURGY
- C07—ORGANIC CHEMISTRY
- C07K—PEPTIDES
- C07K14/00—Peptides having more than 20 amino acids; Gastrins; Somatostatins; Melanotropins; Derivatives thereof
- C07K14/435—Peptides having more than 20 amino acids; Gastrins; Somatostatins; Melanotropins; Derivatives thereof from animals; from humans
- C07K14/705—Receptors; Cell surface antigens; Cell surface determinants
- C07K14/70503—Immunoglobulin superfamily
- C07K14/70539—MHC-molecules, e.g. HLA-molecules
-
- C—CHEMISTRY; METALLURGY
- C12—BIOCHEMISTRY; BEER; SPIRITS; WINE; VINEGAR; MICROBIOLOGY; ENZYMOLOGY; MUTATION OR GENETIC ENGINEERING
- C12N—MICROORGANISMS OR ENZYMES; COMPOSITIONS THEREOF; PROPAGATING, PRESERVING, OR MAINTAINING MICROORGANISMS; MUTATION OR GENETIC ENGINEERING; CULTURE MEDIA
- C12N15/00—Mutation or genetic engineering; DNA or RNA concerning genetic engineering, vectors, e.g. plasmids, or their isolation, preparation or purification; Use of hosts therefor
- C12N15/09—Recombinant DNA-technology
- C12N15/11—DNA or RNA fragments; Modified forms thereof; Non-coding nucleic acids having a biological activity
- C12N15/113—Non-coding nucleic acids modulating the expression of genes, e.g. antisense oligonucleotides; Antisense DNA or RNA; Triplex- forming oligonucleotides; Catalytic nucleic acids, e.g. ribozymes; Nucleic acids used in co-suppression or gene silencing
- C12N15/1138—Non-coding nucleic acids modulating the expression of genes, e.g. antisense oligonucleotides; Antisense DNA or RNA; Triplex- forming oligonucleotides; Catalytic nucleic acids, e.g. ribozymes; Nucleic acids used in co-suppression or gene silencing against receptors or cell surface proteins
-
- C—CHEMISTRY; METALLURGY
- C12—BIOCHEMISTRY; BEER; SPIRITS; WINE; VINEGAR; MICROBIOLOGY; ENZYMOLOGY; MUTATION OR GENETIC ENGINEERING
- C12N—MICROORGANISMS OR ENZYMES; COMPOSITIONS THEREOF; PROPAGATING, PRESERVING, OR MAINTAINING MICROORGANISMS; MUTATION OR GENETIC ENGINEERING; CULTURE MEDIA
- C12N9/00—Enzymes; Proenzymes; Compositions thereof; Processes for preparing, activating, inhibiting, separating or purifying enzymes
- C12N9/14—Hydrolases (3)
- C12N9/16—Hydrolases (3) acting on ester bonds (3.1)
- C12N9/22—Ribonucleases RNAses, DNAses
-
- C—CHEMISTRY; METALLURGY
- C12—BIOCHEMISTRY; BEER; SPIRITS; WINE; VINEGAR; MICROBIOLOGY; ENZYMOLOGY; MUTATION OR GENETIC ENGINEERING
- C12Q—MEASURING OR TESTING PROCESSES INVOLVING ENZYMES, NUCLEIC ACIDS OR MICROORGANISMS; COMPOSITIONS OR TEST PAPERS THEREFOR; PROCESSES OF PREPARING SUCH COMPOSITIONS; CONDITION-RESPONSIVE CONTROL IN MICROBIOLOGICAL OR ENZYMOLOGICAL PROCESSES
- C12Q1/00—Measuring or testing processes involving enzymes, nucleic acids or microorganisms; Compositions therefor; Processes of preparing such compositions
- C12Q1/68—Measuring or testing processes involving enzymes, nucleic acids or microorganisms; Compositions therefor; Processes of preparing such compositions involving nucleic acids
- C12Q1/6876—Nucleic acid products used in the analysis of nucleic acids, e.g. primers or probes
- C12Q1/6881—Nucleic acid products used in the analysis of nucleic acids, e.g. primers or probes for tissue or cell typing, e.g. human leukocyte antigen [HLA] probes
-
- A—HUMAN NECESSITIES
- A61—MEDICAL OR VETERINARY SCIENCE; HYGIENE
- A61K—PREPARATIONS FOR MEDICAL, DENTAL OR TOILETRY PURPOSES
- A61K39/00—Medicinal preparations containing antigens or antibodies
- A61K2039/51—Medicinal preparations containing antigens or antibodies comprising whole cells, viruses or DNA/RNA
- A61K2039/515—Animal cells
-
- C—CHEMISTRY; METALLURGY
- C12—BIOCHEMISTRY; BEER; SPIRITS; WINE; VINEGAR; MICROBIOLOGY; ENZYMOLOGY; MUTATION OR GENETIC ENGINEERING
- C12N—MICROORGANISMS OR ENZYMES; COMPOSITIONS THEREOF; PROPAGATING, PRESERVING, OR MAINTAINING MICROORGANISMS; MUTATION OR GENETIC ENGINEERING; CULTURE MEDIA
- C12N2310/00—Structure or type of the nucleic acid
- C12N2310/10—Type of nucleic acid
- C12N2310/20—Type of nucleic acid involving clustered regularly interspaced short palindromic repeats [CRISPRs]
-
- C—CHEMISTRY; METALLURGY
- C12—BIOCHEMISTRY; BEER; SPIRITS; WINE; VINEGAR; MICROBIOLOGY; ENZYMOLOGY; MUTATION OR GENETIC ENGINEERING
- C12N—MICROORGANISMS OR ENZYMES; COMPOSITIONS THEREOF; PROPAGATING, PRESERVING, OR MAINTAINING MICROORGANISMS; MUTATION OR GENETIC ENGINEERING; CULTURE MEDIA
- C12N2320/00—Applications; Uses
- C12N2320/30—Special therapeutic applications
- C12N2320/34—Allele or polymorphism specific uses
-
- C—CHEMISTRY; METALLURGY
- C12—BIOCHEMISTRY; BEER; SPIRITS; WINE; VINEGAR; MICROBIOLOGY; ENZYMOLOGY; MUTATION OR GENETIC ENGINEERING
- C12N—MICROORGANISMS OR ENZYMES; COMPOSITIONS THEREOF; PROPAGATING, PRESERVING, OR MAINTAINING MICROORGANISMS; MUTATION OR GENETIC ENGINEERING; CULTURE MEDIA
- C12N2501/00—Active agents used in cell culture processes, e.g. differentation
- C12N2501/20—Cytokines; Chemokines
- C12N2501/24—Interferons [IFN]
-
- C—CHEMISTRY; METALLURGY
- C12—BIOCHEMISTRY; BEER; SPIRITS; WINE; VINEGAR; MICROBIOLOGY; ENZYMOLOGY; MUTATION OR GENETIC ENGINEERING
- C12N—MICROORGANISMS OR ENZYMES; COMPOSITIONS THEREOF; PROPAGATING, PRESERVING, OR MAINTAINING MICROORGANISMS; MUTATION OR GENETIC ENGINEERING; CULTURE MEDIA
- C12N2501/00—Active agents used in cell culture processes, e.g. differentation
- C12N2501/20—Cytokines; Chemokines
- C12N2501/25—Tumour necrosing factors [TNF]
Definitions
- the present invention relates to a method for producing a low antigenic cell. More specifically, the present invention relates to a method for producing a low antigenic cell, a kit for detecting a low antigenic cell, a cell, a gRNA, and a method for specifying a target base sequence.
- This application claims priority based on Japanese Patent Application No. 2018-026421 filed in Japan on February 16, 2018, the contents of which are incorporated herein by reference.
- transplanting donor cells to a recipient (patient) who is another person When transplanting donor cells to a recipient (patient) who is another person, the transplanted cells are rejected due to an immune reaction.
- HLA Human Leukocyte Antigen
- MHC major histocompatibility complex
- Class I HLA proteins are expressed in most types of cells in the body. Class I HLA proteins form a heterodimer with ⁇ 2-microglobulin (B2M) and are expressed on the cell surface, and have a function of presenting peptides to CD8-positive cytotoxic T cells and inducing activation. The presented antigenic peptides are endogenous and many have a length of 8 to 10 amino acids.
- B2M ⁇ 2-microglobulin
- HLA-A gene There are mainly six genes classified into HLA class I: HLA-A gene, HLA-B gene, HLA-C gene, HLA-E gene, HLA-F gene, and HLA-G gene.
- HLA-H, HLA-J, HLA-K, HLA-L, HLA-P, HLA-T, HLA-U, HLA-V, HLA-W, HLA-X, HLA -Y etc. are also known.
- pseudogenes HLA-H, HLA-J, HLA-K, HLA-L, HLA-P, HLA-T, HLA-U, HLA-V, HLA-W, HLA-X, HLA -Y etc.
- HLA-A gene the HLA-B gene
- HLA-C gene which are major in distinguishing between self and non-self in transplantation immunity. Playing a role.
- Class II HLA proteins are mainly expressed in immune cells such as macrophages, dendritic cells, activated T cells, and B cells.
- Class II HLA proteins have a function in which ⁇ chain and ⁇ chain form heterodimers, present peptides to CD4 helper T cells, and induce activation.
- the presented antigenic peptides are exogenous and often have a length of 15 to 24 amino acids.
- the HLA class II is classified into HLA-DR ( ⁇ chain: HLA-DRA, ⁇ chain: HLA-DRB), HLA-DQ ( ⁇ chain: HLA-DQA1, ⁇ chain: HLA-DQB1), HLA- DP ( ⁇ chain: HLA-DPA1 or HLA-DPA2, ⁇ chain: HLA-DPB1 or HLA-DPB2).
- HLA-DMA HLA-DMA
- HLA-DMB HLA-DOA
- HLA-DOB HLA-DOB
- the HLA gene is involved in the recognition of self and non-self at the cellular level due to its sequence diversity. During allogeneic transplantation, HLA matching is also very important to reduce immune rejection. For example, in hematopoietic stem cell transplantation, it is recommended to find and transplant donors that have the same antigenicity in all alleles of HLA-A, HLA-B, HLA-C, and HLA-DR, that is, alleles in total of 8 loci. Yes.
- NK cells express multiple inhibitory receptors.
- CD94 and NKG2A complex receptor that recognizes HLA-E and suppresses the function of NK cells induces and activates NK cell activation when it finds cells without HLA-E.
- KIR Insert cell Immunoglobulin-like Receptor
- 2DL1 receptor recognizes HLA-C2
- 2DL2 and 2DL3 receptors recognize HLA-C1
- 2DL4 receptor recognizes HLA-G
- 3DL1 recognizes HLA-Bw4
- 3DL2 recognizes HLA-A3 or HLA-A11
- NK It is known to suppress the activity of cells.
- polymorphisms in KIR for example, almost all Japanese (98% or more) have 2DL1, 2DL3, 3DL4, but it is reported that having 2DL2 is rare, about 15%.
- pluripotent stem cells such as iPS cells and ES cells have pluripotency capable of differentiating into various cell types
- the pluripotent stem cells are differentiated into various cells and transplanted to a patient.
- Cell therapy and regenerative medicine are attracting attention.
- Patent Document 1 describes a cell in which a B2M gene necessary for cell surface presentation of a class I HLA protein is deleted.
- gRNA CRISPR-Cas9 and guide RNA
- DSB double-strand DNA breaks
- DSB induction in genome editing technology is determined by a spacer base sequence of about 20 bases of gRNA that recognizes and binds to a target sequence and a base sequence called a PAM sequence of about 3 to 5 bases. For this reason, unless the base sequence of gRNA matches the base sequence of the target site, efficient DSB induction is difficult.
- DSB is erroneously induced in a site other than the target site, which is undesirable.
- off-target mutation risk There is a known risk of inducing genomic sequence variation, so-called off-target mutation risk.
- An object of the present invention is to provide a technique for producing a low antigenic cell with reduced rejection when transplanted to a recipient.
- the present invention includes the following aspects.
- a method for producing low antigenic cells with reduced rejection when transplanted into a recipient from a donor cell wherein the donor cell and the recipient's Human Leukocyte Antigen (HLA) allele Determining an HLA allele that is not present in the recipient and is present in the donor cell, destroying or modifying the identified HLA allele, and providing an HLA protein specific to the donor cell Obtaining a cell population containing cells that do not express, wherein the cells that do not express HLA protein specific for the donor cells are the low antigenic cells.
- HLA Human Leukocyte Antigen
- the HLA allele determined in determining the donor cell and the recipient's HLA allele includes an HLA-A allele, an HLA-B allele and an HLA-C allele, respectively.
- Manufacturing method [3] After obtaining a cell population containing cells that do not express HLA protein specific for the donor cells, further comprising recovering cells that do not express HLA protein specific for the donor cells from the cell population. The recovery comprises contacting the cell population with an HLA protein expression inducer, and using as an index the expression of HLA protein specific to the donor cell in the cell population in contact with the HLA protein expression inducer, Recovering cells that do not express HLA protein specific to the donor cells from the cell population, [1] or [2].
- the HLA protein expression inducer is interferon (IFN) - ⁇ , IFN- ⁇ , IFN- ⁇ , interleukin (IL) -4, Granulocyte Macrophage colony-stimulating Factor (GM-CSF), Transforming growth factor (GM).
- IFN interferon
- IL interleukin
- GM-CSF Granulocyte Macrophage colony-stimulating Factor
- GM Granulocyte Macrophage colony-stimulating Factor
- GM Granulocyte Macrophage colony-stimulating Factor
- GM Granulocyte Macrophage colony-stimulating Factor
- GM Granulocyte Macrophage colony-stimulating Factor
- GM Granulocyte Macrophage colony-stimulating Factor
- GM Transforming growth factor
- kits according to [6], wherein the HLA protein expression inducer is IFN- ⁇ , IFN- ⁇ , IFN- ⁇ , IL-4, GM-CSF, TGF- ⁇ , or TGF- ⁇ .
- the low antigenic cell is a pluripotent stem cell.
- An HLA protein expression inducer comprising IFN- ⁇ , IFN- ⁇ , IFN- ⁇ , IL-4, GM-CSF, TGF- ⁇ or TGF- ⁇ .
- CIITA Class II Major Histocompatibility Complex Transactivator
- RFX5 Regulatory Factor X5
- RFXAP Regulatory Factor X Associated Protein
- RFXANK Regulatory Factor X Associated Ankyrin Containing Protein
- the HLA-C protein is HLA-C * 01: 02 allele, HLA-C * 02: 02 allele, HLA-C * 03: 03 allele, HLA-C * 03: 04 allele, HLA-C * 04:01 allele, HLA-C * 05: 01 allele, HLA-C * 06: 02 allele, HLA-C * 07: 01 allele, HLA-C * 07: 02 allele, HLA-C * 08: 01 allele,
- the cell according to [15] which is a protein encoded by one allele selected from the group consisting of the HLA-C * 12: 02 allele and the HLA-C * 16: 01 allele.
- [17] A method for producing a low antigenic cell with reduced rejection when transplanted into a recipient from a donor cell, the CIITA allele, the RFX5 allele, the RFXAP allele and the RFXANK allele of the donor cell.
- a cell comprising the CIITA allele, the RFX5 allele, the RFXAP allele or the RFXANK allele destroyed or modified, which is the low antigenic cell.
- the cell according to [17], wherein the low antigenic cell is a pluripotent stem cell.
- [21] When mapping to the base sequence data of genomic DNA of all HLA haplotypes, mapping to only one target HLA haplotype, and mapping to base sequence data of all genomic DNA other than HLA alleles A gRNA having a base sequence that is not mapped to a target base sequence.
- the target base sequence is any one of SEQ ID NOs: 3, 4, 7, 45 to 52, 72 to 2459, or SEQ ID NOs: 3, 4, 7, 45 to 52, and 72 to 2459.
- the gRNA according to [21] comprising a base sequence in which one or several bases have been deleted, substituted or added at the 5 ′ end of any one of the base sequences.
- the target base sequence of the base sequence described in any of SEQ ID NOs: 3, 4, 7, 45 to 52, or the base sequence described in any of SEQ ID NOs: 3, 4, 7, 45 to 52 The gRNA according to [21] or [22], comprising a base sequence in which one or several bases are deleted, substituted or added at the 5 ′ end.
- mapping to base sequence data of genomic DNA of all HLA haplotypes mapping to two or more target HLA haplotypes and mapping to base sequence data of total genomic DNA other than HLA alleles
- the target base sequence is the base sequence described in any one of SEQ ID NOs: 53 to 55 and 2460 to 8013, or the 5 ′ end of the base sequence described in any one of SEQ ID NOs: 53 to 55 and 2460 to 8013.
- the gRNA according to [25] comprising a nucleotide sequence in which one or several bases are deleted, substituted or added.
- the target base sequence has one or several bases at the 5 ′ end of the base sequence set forth in any of SEQ ID NOs: 53 to 55 or the base sequence set forth in any of SEQ ID NOs: 53 to 55.
- the gRNA according to [25] or [26] which comprises a nucleotide sequence that is deleted, substituted, or added.
- mapping the candidate base sequence, mapping the candidate base sequence to the base sequence data of all genomic DNA other than the HLA allele, and the base sequence data of all HLA haplotype genomic DNA When mapping, the candidate base sequence that is mapped only to one target HLA haplotype and not mapped when mapping to the base sequence data of all genomic DNA other than the HLA allele is specified as the target base sequence
- a method comprising: [30] A method for identifying a target base sequence for producing low antigenic cells with reduced rejection when transplanted to a recipient by genome editing, wherein the base sequence data of genomic DNA of all HLA haplotypes
- mapping the candidate base sequence, mapping the candidate base sequence to the base sequence data of all genomic DNA other than the HLA allele, and the base sequence data of all HLA haplotype genomic DNA When the mapping is performed
- FIG. (A) is a Venn diagram showing the HLA allele targeted by the sgRNA extracted in Experimental Example 1.
- FIG. (B) is a diagram showing where the sgRNA identified in Experimental Example 1 targets the HLA-A allele, HLA-B allele, and HLA-C allele.
- 10 is a graph showing the results of flow cytometry in Experimental Example 2.
- 10 is a graph showing the results of flow cytometry in Experimental Example 3.
- (A) is a graph showing the results of flow cytometry in Experimental Example 4.
- (B) is a diagram showing the schedule of IPS- ⁇ treatment of iPS cells and analysis of the expression level of HLA-A protein in Experimental Example 4.
- FIG. (A) is a figure which shows the target site
- FIG. (B) is a photograph showing the results of T7 endonuclease I assay in Experimental Example 6.
- (A) And (b) is a graph which shows the result of the flow cytometry in Experimental example 7.
- FIG. It is a graph which shows the ratio of the base sequence variation
- FIG. (A) And (b) is a graph which shows the result of the flow cytometry in Experimental example 8.
- FIG. (A) And (b) is a graph which shows the result of the flow cytometry in Experimental example 8.
- FIG. (A) is a figure which shows the base mutation pattern of each clone collect
- FIG. (B) is the base sequence of a representative clone recovered in Experimental Example 8.
- FIG. 10 is a graph showing the results of flow cytometry in Experimental Example 9.
- (A) is a figure which shows the base mutation pattern of each clone collect
- FIG. (B) is a base sequence of a representative clone recovered in Experimental Example 9.
- (A) And (b) is a figure which shows the base mutation pattern of each clone collect
- FIG. (C) is a base sequence of a representative clone recovered in Experimental Example 10.
- A) is a figure which shows the base mutation pattern of each clone collect
- FIG. (B) is a base sequence of a representative clone recovered in Experimental Example 11.
- (A) is a graph showing the results of flow cytometry in Experimental Example 11.
- FIG. (B) is a figure which shows the base mutation pattern of each clone collect
- FIG. (C) is a base sequence of a representative clone recovered in Experimental Example 11.
- (A) is a figure which shows the target site
- FIG. (B) And (c) is a graph which shows the result of the flow cytometry in Experimental example 12.
- FIG. (A) is a figure which shows the base mutation pattern of the clone collect
- FIG. (B) is the base sequence of the clone collected in Experimental Example 12.
- A) is a graph showing the results of flow cytometry in Experimental Example 13.
- FIG. (B) And (d) is a figure which shows the base mutation pattern of each clone collect
- FIG. (C) and (e) are the base sequences of representative clones recovered in Experimental Example 13.
- (A) And (b) is a graph which shows the result of the flow cytometry in Experimental example 14.
- FIG. (C) is a figure which shows the base mutation pattern of each clone collect
- FIG. (D) is a base sequence of a representative clone recovered in Experimental Example 14.
- A) is a figure which shows the target site
- FIG. (B) And (c) is a graph which shows the result of the flow cytometry in Experimental example 15.
- FIG. (C) is a graph showing the results of flow cytometry in Experimental Example 15.
- (A) And (b) is a figure which shows the analysis result of the base sequence in Experimental example 16.
- (A) And (b) is a graph which shows the result of the flow cytometry in Experimental example 17.
- FIG. (C) is a figure which shows the analysis result of the base sequence in Experimental example 17.
- FIG. (A) is a graph showing the results of flow cytometry in Experimental Example 18.
- (B) is a figure which shows the analysis result of the base sequence in Experimental example 18.
- (A) to (e) are graphs showing the results of flow cytometry in Experimental Example 19.
- FIG. (A) to (f) are graphs showing the results of flow cytometry in Experimental Example 20.
- (A) to (e) are graphs showing the results of flow cytometry in Experimental Example 21.
- 14 is a schematic diagram showing the procedure of Experimental Example 22.
- FIG. (A) to (e) are graphs showing the results of flow cytometry in Experimental Example 22.
- FIG. 10 is a schematic diagram showing the procedure of Experimental Example 23.
- 14 is a graph showing the results of Experimental Example 23. It is a graph which shows the result of Experimental example 24. It is a graph which shows the result of Experimental example 25.
- (A) And (b) is a graph which shows the result of the flow cytometry in Experimental example 26.
- FIG. (C) is a graph showing the results of Experimental Example 26.
- (A) to (g) are graphs showing the results of flow cytometry in Experimental Example 27. It is a graph which shows the result of Experimental example 28.
- (A) to (f) are phase contrast micrographs showing the results of Experimental Example 29.
- (A) to (f) are phase contrast micrographs showing the results of Experimental Example 30.
- (A) And (b) is a graph which shows the result of the flow cytometry in Experimental example 31.
- FIG. (C) is a graph showing the results of Experimental Example 31.
- (A) And (b) is a graph which shows the result of the flow cytometry in Experimental example 32.
- FIG. (C) is a graph showing the results of Experimental Example 32.
- (A) is a figure explaining the experiment schedule in Experimental example 33.
- FIG. (B) is a photograph showing the result of photographing fluorescence of EB-derived blood cell-like cells in Experimental Example 33.
- FIG. (C) is a graph showing the survival rate of EB-derived blood cell-like cells in Experimental Example 33.
- FIG. (A) is a graph showing the results of flow cytometry analysis in Experimental Example 34.
- (B) is a graph showing the results of Experimental Example 34.
- (A) is a graph showing the results of flow cytometry analysis in Experimental Example 35.
- (B) is a graph showing the results of Experimental Example 35.
- (A) And (b) is a graph which shows the result of the flow cytometry analysis in Experimental example 36.
- FIG. (A) is a figure explaining the experiment schedule in Experimental example 37.
- FIG. (B) is a photograph showing the result of photographing fluorescence of EB-derived blood cell-like cells in Experimental Example 37.
- FIG. (C) is a graph showing the relative survival rate of EB-derived blood cell-like cells in Experimental Example 37.
- FIG. 14 is a graph showing the results of Experimental Example 38.
- (A) is a table showing the HLA haplotype of the 585A1-C7 remaining cells used in Experimental Example 39 and the HLA haplotype of the 585A1-C7 remaining cells prepared in Experimental Example 39 and knocked out of the CIITA gene.
- (B) is a diagram showing the base mutation pattern of each clone obtained in Experimental Example 39.
- FIG. (C) is the base sequence of a representative clone obtained in Experimental Example 39.
- FIG. (A) to (d) are graphs showing the results of flow cytometry in Experimental Example 40.
- (A) to (c) are graphs showing the results of flow cytometry in Experimental Example 41.
- (A)-(c) is a figure explaining the procedure of Experimental example 42.
- FIG. (A) is a graph showing the results of flow cytometry in Experimental Example 42.
- (B) is a figure which shows the base mutation pattern of each subclone obtained in Experimental example 42.
- FIG. (A) And (b) is a figure which shows the base mutation pattern of each subclone obtained in Experimental example 42.
- FIG. It is a table
- FIG. 14 is a graph showing the results of flow cytometry in Experimental Example 46. It is a figure which shows the base mutation pattern of each subclone obtained in Experimental example 47. It is a figure which shows the base mutation pattern of each subclone obtained in Experimental example 48. It is a figure which shows the base mutation pattern of each subclone obtained in Experimental example 49.
- the manufacturing method of 1st Embodiment is a manufacturing method which manufactures the low antigenic cell by which rejection when the recipient transplanted to a recipient was reduced from a donor cell, (a) The said donor cell and the said recipe Determining each HLA allele of the ent; (b) identifying an HLA allele that is not present in the recipient and present in the donor cell; and (c) destroying or modifying the identified HLA allele, Obtaining a cell population containing cells that do not express HLA protein specific to the donor cell, wherein the cells that do not express HLA protein specific to the donor cell are the low antigenic cells. is there.
- the production method of the first embodiment it is possible to produce low antigenic cells with reduced rejection (graft-versus-host disease) when transplanted to a recipient. it can. Further, as will be described later in the Examples, the low antigenic cells produced by the production method of the first embodiment are not easily attacked by the recipient's NK cells even when transplanted to the recipient.
- HLA locus is referred to as “HLA allele”, and the antigen diversity of the HLA protein presented on the cell surface is sometimes referred to as “HLA type”.
- HLA type the antigen diversity of the HLA protein presented on the cell surface
- donor cell and recipient HLA alleles are determined.
- the donor cell may be a human cell or a non-human animal cell.
- the donor cell may be a pluripotent stem cell or a differentiated cell.
- pluripotent stem cells mean embryonic stem cells (ES cells), induced pluripotent stem cells (iPS cells), and the like.
- the low antigenic cell produced by the production method of the first embodiment is a cell obtained by destroying or modifying the HLA allele of the donor cell. Therefore, the low antigenic cell may be a pluripotent stem cell similar to a donor cell, or may be a differentiated cell.
- the recipient is preferably an animal of the same species as the low antigenic cell.
- the recipient may be a patient who is actually scheduled for transplantation, or may be a recipient with a hypothetical HLA allele that can be a future recipient.
- the HLA allele is determined by the PCR-rSSO method (PCR-reverse Sequence Specific Oligotide), the PCR-SSP (Sequence Specific Primer) method, the PCR-SBT (Sequence based sequencing method, etc.) It can be performed by a method, and can be performed using a commercially available HLA typing kit or the like.
- HLA typing, HLA-PRG, hla-genotype, PHLAT, Optitype, neXtype are software that performs HLA typing from sequence data of next-generation sequencers such as whole genome sequence (WGS), exome sequence (WES), and RNA-seq. , Atlasates, HLAforest, SOAP-HLA, HLAminer, seq2HLA, GATK HLA Caller and the like are known.
- the HLA allele determined in this step is preferably an HLA allele highly related to rejection when cell transplantation is performed, and may include an HLA-A allele, an HLA-B allele, and an HLA-C allele. preferable.
- the HLA allele determined in this step may further include an HLA-DR allele, an HLA-DQ allele, and an HLA-DP allele, and may further include another HLA allele.
- donor-specific HLA allele an HLA allele that is not present in the recipient but is present in the donor cell.
- a donor-specific HLA allele can be identified by comparing the HLA allele of the donor cell with the HLA allele of the recipient.
- the HLA allele is a base sequence encoded on genomic DNA and encodes an HLA protein.
- the serological classification of HLA proteins is called HLA serotype.
- HLA serotype identification methods include methods for analyzing reactivity with sera and antibodies recognizing specific HLA serotypes, HLA allele DNA, or RNA nucleotide sequences transcribed from HLA alleles. And a method of collating with a table, an IPD-IMGT database (https://www.ebi.ac.uk/ipd/imgt/hla/), and the like.
- the HLA serotype generally refers to a difference in the first area (two-digit notation) of the HLA allele notation (http://hla.alleles.org/nomenclature/naming.html). In the book, if the amino acid sequences are different (non-synonymous substitution) even if they are serologically the same HLA antigen type, they are judged to be different HLA alleles.
- the HLA allele is the same or different from the difference between the first area and the second area (4-digit notation) in the HLA allele notation. And the HLA allele in which the 1st area and 2nd area of HLA allele description corresponded is judged to be the same HLA allele.
- the third zone base substitution inside the translation region without amino acid mutation
- the fourth zone translation region
- a cell that does not express donor-specific HLA protein is a cell in which expression of a specific HLA protein is negative due to destruction of the HLA allele of the donor cell, or from a specific HLA type by modification of the HLA allele of the donor cell. A cell that has changed to another HLA type.
- the cells obtained by this process and not expressing donor-specific HLA protein are low antigenic cells. Note that this step is not necessary when there is no donor-specific HLA protein.
- the B2M gene is not disrupted in the low antigenic cells produced by the production method of the first embodiment.
- class I HLA proteins are presented on the cell surface, and even when low antigenic cells are transplanted to recipients, they are less likely to be attacked by recipient NK cells.
- only a part of the HLA has been destroyed, and the remaining HLA retains the ability to present the antigen, so that the ability to present the antigen is maintained even when the cell is infected with a virus or becomes tumorous. Is possible.
- the HLA allele of a donor cell can be destroyed or modified by genome editing, for example.
- the HLA allele can be destroyed by specifically cleaving the HLA allele to induce double-stranded DNA break (DSB).
- DSB double-stranded DNA break
- a baseshift is deleted or added during the DSB repair process and a frameshift mutation occurs, the HLA allele is destroyed and the HLA protein is not expressed.
- the destruction of the HLA allele is sometimes referred to as knockout of the HLA allele.
- HLA-A * 02: 07 allele can be changed to the HLA-A * 01: 01 allele as described later in the Examples.
- the donor DNA it is preferable to use a donor DNA that has sequence identity with the region including before and after the position of double-stranded DNA cleavage of genomic DNA and encodes a desired HLA allele.
- the donor DNA may be single-stranded DNA or double-stranded DNA.
- the donor DNA may be DNA having a single base sequence or a mixture of DNAs having a plurality of base sequences.
- having sequence identity means that 90% or more of the base sequence matches between the donor DNA and the region containing the target double-strand break in genomic DNA.
- the region containing the position of the double-strand break in the genomic DNA preferably matches 95% or more of the base sequence, and more preferably 99% or more of the base sequence matches.
- the donor DNA may be single-stranded DNA of about 50 to 5,000 bases or double-stranded DNA of about 50 to 5,000 base pairs.
- the donor DNA may have sequence identity with any of the double strands of genomic DNA.
- sequence-specific DNA cleaving enzymes used for genome editing by inducing DSB are roughly classified into RNA-induced nucleases and artificial nucleases.
- the sequence-specific DNA cleaving enzyme may be an RNA-induced nuclease or an artificial nuclease.
- the sequence-specific DNA cleaving enzyme is not particularly limited as long as it cuts genomic DNA in a target sequence-specific manner to form a double-strand break.
- the length of the target sequence recognized by the sequence-specific DNA cleaving enzyme may be, for example, about 10 to 60 bases.
- sequence-specific DNA cleaving enzyme may be in a mode of cleaving DNA by combining a plurality of nickases, for example.
- nickase means an enzyme that forms a nick in one strand of double-stranded DNA.
- double strand breaks can be formed by nicking both strands of double stranded DNA at close positions on the genomic DNA.
- RNA-guided nuclease is an enzyme that induces sequence-specific cleavage by binding a short RNA serving as a guide to a target sequence and recruiting a nuclease having two DNA cleavage domains (nuclease domains).
- Examples of the RNA-induced nuclease include CRISPR-Cas family proteins. CRISPR-Cas family proteins are broadly classified into class 1 and class 2. Class 1 includes type I, type III and type IV, and class 2 includes type II, type V and type VI. Is included.
- CRISPR-Cas family proteins examples include Cas9, Cpf1, CasX, CasY, Cas12, Cas13, C2C2, and the like.
- the RNA-induced nuclease may be a homologue of CRISPR-Cas family protein or may be a modified CRISPR-Cas family protein. For example, it may be a nickase-modified nuclease obtained by modifying one of two existing wild-type nuclease domains into an inactive form.
- Cas9-HF, HiFi-Cas9, eCas9, etc. with improved target specificity may be used.
- Cas9 examples include those derived from pyogenic Streptococcus, Staphylococcus aureus, Streptococcus thermophilus, Geobacillus stearothermophilus, and the like.
- Cpf1 examples include those derived from acidominococcus, lacnospira, Chlamydomonas, Francisella novicida, and the like.
- the artificial nuclease is an artificial restriction enzyme having a DNA binding domain designed and produced so as to specifically bind to a target sequence, and a nuclease domain (such as a DNA cleavage domain of FokI which is a restriction enzyme).
- a nuclease domain such as a DNA cleavage domain of FokI which is a restriction enzyme.
- Examples of the artificial nuclease include, but are not limited to, Zinc finger nuclease (ZFN), transcribing activator-like effector nuclease (TALEN), meganuclease and the like.
- gRNA RNA-binding protein
- the gRNA may be introduced into the donor cell in the form of RNA, or may be introduced into the donor cell in the form of an expression vector and expressed in the cell.
- Examples of a method for preparing gRNA in the form of RNA include a method in which a construct in which a promoter such as T7 is added upstream of a nucleic acid fragment encoding gRNA and synthesized by an in vitro transcription reaction, a chemical synthesis method, and the like. .
- a promoter such as T7
- a chemical synthesis method and the like.
- gRNA is chemically synthesized, chemically modified RNA may be used.
- expression vectors include plasmid vectors and virus vectors that transcribe gRNA from a Pol III promoter such as H1 promoter or U6 promoter.
- gRNA When gRNA is expressed using an expression vector, gRNA may be expressed constantly or under the control of an expression-inducible promoter.
- Cas9 may be introduced into donor cells in the form of an expression vector expressed from the Pol II promoter, or may be introduced into donor cells in the form of a purified protein.
- expression vectors include transposon vectors, virus vectors, episomal vectors, plasmid vectors, and the like.
- virus vectors include adeno-associated virus vectors, adenovirus vectors, retrovirus vectors, lentivirus vectors, Sendai virus vectors, baculovirus vectors, and the like.
- gRNA and Cas9 are transposon vectors, episomal vectors, plasmid vectors, etc., or when gRNA is RNA and Cas9 is a purified protein, it can be introduced into donor cells by transfection reagents or electroporation. That's fine.
- transfection reagent for example, Lipofectamine 2000, Lipofectamine 3000, CRISPRMAX, RNAMAX (both Thermo Fisher Scientific), FuGENE 6, FuGENE HD (both Promega) and the like can be used.
- the electroporation method can be performed using equipment such as NEPA21 (Neppagene Corporation), Neon (Thermo Fisher Scientific), 4D-Nucleofector (Lonza).
- step (c) a cell population containing low antigenic cells that does not express donor-specific HLA protein can be obtained.
- the cell population obtained in the step (c) includes cells in which the HLA allele is not destroyed or modified in addition to the cells in which the target HLA allele is destroyed or modified (low antigenic cells), It may contain cells or the like in which the destruction or modification of the HLA allele has been incompletely performed. Therefore, after the step (c), a step (d) of recovering cells (low antigenic cells) that do not express donor-specific HLA protein may be further performed.
- Step (d) is a step of contacting an HLA protein expression inducer (HLA protein expression inducer) with a cell population containing low antigenic cells, and the donor-specificity in the cell population in contact with the HLA protein expression inducer. Recovering cells that do not express the donor-specific HLA protein from the cell population using the expression of the target HLA protein as an indicator.
- the step of bringing the HLA protein expression inducer into contact with the cell population can be performed, for example, by adding the HLA protein expression inducer to the medium of the cell population.
- recovering cells that do not express donor-specific HLA protein from the cell population using the expression of donor-specific HLA protein as an indicator is to detect the presence of the expressed HLA protein and based on its presence or absence It may be to recover cells that do not express donor-specific HLA protein.
- HLA protein expression inducers examples include cytokines such as IFN- ⁇ , IFN- ⁇ , IFN- ⁇ , IL-4, GM-CSF, TGF- ⁇ , and TGF- ⁇ . These expression inducers may be used alone or in a combination of two or more.
- the above cytokine is preferably a human-derived cytokine when used for human cells.
- the NCBI accession number of human IFN- ⁇ protein is NP_000610.2, etc.
- the NCBI accession numbers of human IFN- ⁇ protein are NP_076918.1, NP_0005966.2, NP_066546.1, etc.
- NCBI accession numbers are NP_002167.1, etc.
- NCBI accession numbers of human IL-4 protein are NP_000580.1, NP_7588588.1, NP_00134199.1, etc.
- NCBI accession numbers of human GM-CSF protein are NP_000749 2 and the NCBI accession numbers of human TGF- ⁇ protein are NP_0010933161.1, NP_003227.1, NP_001295088.1.
- human TGF- ⁇ NCBI accession number for the protein is NP_000651.3, is XP_011525544.1, and the like.
- the above cytokine may have a mutation in the amino acid sequence described in each accession number. More specifically, the amino acid sequence described in each accession number may have an amino acid sequence in which one or several amino acids are deleted, substituted or added. Here, the one or several amino acids may be, for example, 1 to 10 amino acids, such as 1 to 5 amino acids, such as 1 to 3 amino acids.
- the above cytokine may further have an amino acid sequence from which the signal peptide has been removed.
- pluripotent stem cells are generally undifferentiated and do not express HLA protein on the cell surface, making it difficult to detect HLA protein. In order to present the HLA protein, it is necessary to induce differentiation. However, the differentiation induction process is generally complicated and time consuming. In addition, since a cell once induced to differentiate does not spontaneously return to an undifferentiated state, even if a differentiated cell population negative for HLA protein is recovered, it is no longer a pluripotent stem cell.
- the inventors can induce the expression of HLA protein while maintaining the pluripotency of pluripotent stem cells by causing the above-mentioned HLA protein expression inducer to act on pluripotent stem cells.
- HLA protein expression inducer to act on pluripotent stem cells.
- step (d) This induces the expression of HLA protein in the cell population obtained in step (d), and efficiently detects pluripotent stem cells (low antigenic cells) in which the target HLA allele has been destroyed or modified. Can be recovered.
- the cells are stained with an anti-HLA protein antibody, so that HLA-expressing cells or non-expressing cells can be distinguished and collected by sorting using a flow cytometer.
- the anti-HLA protein antibody can be adsorbed to magnetic beads and brought into contact with HLA protein-expressing cells, and the cells to which the magnetic beads are bound can be recovered using magnetic force.
- cells that express a specific HLA protein on the culture dish are labeled with an anti-HLA protein antibody, etc., and unnecessary non-target cells are removed by aspiration or laser irradiation, and only the target low antigenic cells are recovered. May be.
- T cells that recognize non-target HLA proteins are mixed with HLA protein-expressing cells on a culture dish, and only cells expressing non-target HLA proteins are attacked and removed, and the target low antigen Only sex cells may be collected.
- the production method of the first embodiment may further include a step of further destroying or modifying at least one allele of the CIITA allele, RFX5 allele, RFXAP allele and RFXANK allele of the donor cell.
- the CIITA gene is a gene encoding a Class II Major Histocompatibility Complex Transactivator protein.
- the RFX5 gene is a gene encoding the Regulatory Factor X5 protein.
- the RFXAP gene is a gene encoding Regulatory Factor X Associated Protein.
- the RFXANK gene is a gene encoding Regulatory Factor X Associated Ankyrin Containing Protein.
- the CIITA gene together with the RFX5 gene, the RFXAP gene, and the RFXANK gene, encodes a transcription factor that controls transcriptional activation of HLA class II. Therefore, cells in which at least one of the CIITA allele, RFX5 allele, RFXAP allele, and RFXANK allele is disrupted do not express HLA class II protein, and rejection when transplanted to a recipient is further reduced. .
- NCBI accession numbers for human CIITA genes are NM_000246.3, NM_001286402.1, NM_001286403.1, etc.
- NCBI accession numbers for human RFX5 gene are NM_000449.3, NM_0010255603.1, etc.
- NCBI accession numbers for human RFXAP gene The session number is NM_000538.3, and the NCBI accession numbers of the human RFXANK gene are NM_001278772.1, NM_001278728.1, NM_003721.3, NM_134440.2, and the like.
- the production method of the second embodiment is a production method for producing low antigenic cells with reduced rejection when transplanted to a recipient from a donor cell, wherein the CIITA allele and RFX5 allele of the donor cell are used. Destroying or modifying an allele comprising at least one of the RFXAP allele and RFXANK allele, wherein the allele comprising at least one of the CIITA allele, RFX5 allele, RFXAP allele and RFXANK allele is destroyed or altered The production method, wherein the produced cells are the low antigenic cells.
- the manufacturing method of this embodiment is mainly different from the manufacturing method of the first embodiment described above in that the HLA allele is not destroyed.
- CIITA gene As described above, it is known that the expression of CIITA gene, RFX5 gene, RFXAP gene and RFXANK gene is essential for the expression of class II HLA protein. Therefore, cells in which at least one of the CIITA allele, RFX5 allele, RFXAP allele, and RFXANK allele is destroyed do not express HLA class II protein, and rejection when transplanted to a recipient is reduced.
- the donor cell may be a pluripotent stem cell similar to that described above, or may be a differentiated cell.
- the recipient is preferably an animal of the same species as the low antigenic cell.
- the recipient may be a patient who is actually scheduled for transplantation, or may be a recipient with a hypothetical HLA allele that can be a future recipient.
- the production method of the second embodiment may further include a step of destroying the B2M allele of the donor cell.
- the CIITA allele or B2M allele of a donor cell can be destroyed by, for example, genome editing. Genome editing is the same as described above.
- the present invention provides a kit for detecting low antigenic cells having reduced rejection when transplanted to a recipient, comprising an HLA protein expression inducer.
- the kit of this embodiment low antigenic cells can be detected and recovered. Therefore, it can be said that the kit of this embodiment is a kit for recovering low antigenic cells.
- the HLA protein expression inducer is the same as described above, such as IFN- ⁇ , IFN- ⁇ , IFN- ⁇ , IL-4, GM-CSF, TGF- ⁇ , TGF- ⁇ , etc. Of cytokines.
- the kit of this embodiment may contain 1 type of these expression inducers independently, and may contain 2 or more types.
- the low antigenic cell may be a pluripotent stem cell. As described later in the Examples, according to the kit of the present embodiment, even when the low antigenic cell is a pluripotent stem cell, the expression of HLA protein is maintained while maintaining the pluripotency of the low antigenic cell. Can be guided.
- the cell according to the first embodiment is a cell in which at least one HLA allele is disrupted or modified and at least one HLA protein can be expressed.
- the cell of the first embodiment may be a pluripotent stem cell or a differentiated cell.
- the at least one HLA allele destroyed or modified is a class I HLA allele.
- Pluripotent stem cells usually have weak HLA protein expression.
- weak expression means that, for example, when the cells are stained with an anti-HLA protein antibody and subjected to flow cytometry analysis, the expression of the HLA protein cannot be clearly detected.
- HLA protein expression inducer when brought into contact with pluripotent stem cells, the expression of HLA protein is enhanced.
- “capable of expressing at least one HLA protein” means that even if the cell is a cell that is normally weak in HLA protein expression, such as a pluripotent stem cell, By contacting the HLA protein expression inducer described above, it means a cell whose HLA protein expression is enhanced.
- the cell of 1st Embodiment may be the cell which differentiated and expressed HLA protein.
- cells in which the B2M allele is destroyed do not express HLA class I protein even if the HLA allele is a wild type.
- the cell of 1st Embodiment shall not contain such a cell.
- the HLA allele destroyed or modified preferably includes a class I HLA allele, and preferably includes an HLA-A allele, an HLA-B allele, or an HLA-C allele.
- the cells of the first embodiment express at least one class I HLA protein, they are less likely to be attacked by the recipient's NK cells even when transplanted to the recipient.
- at least one class I HLA protein include HLA-C protein, HLA-E protein, and HLA-G protein.
- HLA-C protein HLA-C protein
- HLA-E protein HLA-E protein
- HLA-G protein HLA-G protein
- the cells of the first embodiment are low antigenic cells with reduced rejection when transplanted to a recipient, and the disrupted or modified HLA allele is an HLA allele that does not exist in the recipient. May be.
- the above-mentioned low antigenic cells have reduced rejection when transplanted to recipients.
- the low antigenic cells of the first embodiment are preferably the same type of cells as the recipient, and may be human cells or non-human animal cells.
- the recipient may be a patient who is actually scheduled for transplantation, or may be a recipient with a hypothetical HLA allele that can be a future recipient.
- an allele including at least one of CIITA allele, RFX5 allele, RFXAP allele and RFXANK allele may be further destroyed or modified.
- CIITA gene, RFX5 gene, RFXAP gene and RFXANK gene is essential for the expression of class II HLA protein. Therefore, cells in which at least one of the CIITA allele, RFX5 allele, RFXAP allele, and RFXANK allele is disrupted do not express HLA class II protein, and rejection when transplanted to a recipient is further reduced. .
- the cell according to the second embodiment is a cell in which an allele including at least one of CIITA allele, RFX5 allele, RFXAP allele and RFXANK allele is destroyed or modified.
- cells in which an allele including at least one of the CIITA allele, RFX5 allele, RFXAP allele, and RFXANK allele is disrupted or modified do not express HLA class II protein and have been transplanted to the recipient. In some cases, it is a low antigenic cell with reduced rejection.
- the cell according to the second embodiment may express an HLA class I protein.
- the cells of the second embodiment may be useful for allogeneic transplantation into the recipient.
- the cell of the second embodiment may be a pluripotent stem cell or a differentiated cell.
- cells in which the B2M allele is destroyed do not express HLA class I protein even if the HLA allele is a wild type.
- the B2M allele in addition to at least one of the CIITA allele, RFX5 allele, RFXAP allele, and RFXANK allele, the B2M allele may be further destroyed.
- the low antigenic cells of the second embodiment are preferably the same type of cells as the recipient, and may be human cells or non-human animal cells.
- the recipient may be a patient who is actually scheduled for transplantation, or may be a recipient with a hypothetical HLA allele that can be a future recipient.
- the cells of the first and second embodiments described above are low antigenic cells with reduced rejection when transplanted to recipients. Therefore, it can be used for cell therapy and regenerative medicine.
- the low antigenic cell is a pluripotent stem cell, for example, it is differentiated into a neuron cell, hepatocyte, pancreatic islet cell, cardiomyocyte, kidney cell, hematopoietic stem cell, cytotoxic T cell, etc. It may be transplanted.
- the gene may be introduced into a low antigenic cell and then transplanted to a patient.
- a low antigenic cell For example, differentiation of pluripotent stem cells into T cells, gene introduction of a chimeric antigen receptor (CAR), and transplantation to CAR patients as CAR-T cells.
- CAR chimeric antigen receptor
- the present invention relates to a method for identifying a target base sequence for producing low antigenic cells with reduced rejection when transplanted to a recipient by genome editing, comprising all HLA haplotypes. Mapping the candidate base sequence to the base sequence data of genomic DNA, mapping the candidate base sequence to the base sequence data of all genomic DNA other than the HLA allele, and genomic DNA of all HLA haplotypes The candidate base sequence that is mapped only to one target HLA haplotype when mapped to the base sequence data of, but not mapped when mapped to the base sequence data of all genomic DNA other than the HLA allele, And identifying as a target base sequence.
- the target base sequence of the gRNA of the first embodiment described later can be specified by the method of the first embodiment.
- the gRNA of the first embodiment can induce DSB specifically for a specific HLA haplotype and has a low risk of off-target mutation introduction.
- the HLA gene has many pseudogenes, and the HLA gene sequences are highly homologous to each other, and the sequence diversity among individuals is large. For this reason, it is not easy to determine an appropriate target base sequence for genome editing using a sequence-specific DNA cleaving enzyme.
- the identification of the target base sequence of the HLA gene-specific sequence-specific DNA cleaving enzyme can be performed, for example, as follows. First, base sequence data of genomic DNA of all HLA haplotypes (base sequence data of all known HLA genes) is obtained.
- the base sequence data of all HLA genes can be obtained from, for example, the IPD-IMGT / HLA database (https://www.ebi.ac.uk/ipd/imgt/hla/). As of July 2017, 12,544 base sequences of HLA class I genes and 4,622 base sequences of HLA class II genes are registered in this database.
- the base sequence that is the target of the sequence-specific DNA cleaving enzyme to be used is extracted from the base sequence of each HLA allele.
- a PAM sequence of about 3 to 5 bases for example, “NGG” for Cas9 derived from Streptococcus pyogenes, “TTTN” for Cpf1 derived from Asidaminococcus )
- NVG for Cas9 derived from Streptococcus pyogenes
- TTTN for Cpf1 derived from Asidaminococcus
- the target base sequence includes a PAM sequence.
- the length of the target base sequence including the PAM sequence varies depending on the sequence-specific DNA cleavage enzyme.
- the sequence-specific DNA cleaving enzyme is Pseudomonas aeruginosa Cas9
- the length of the target base sequence including the PAM sequence is preferably 19 to 33 bases, more preferably 20 to 24 bases. preferable.
- the sequence-specific DNA-cleaving enzyme is Cpf1 derived from acidominococcus
- the length of the target base sequence including the PAM sequence is preferably 20 to 34 bases, more preferably about 24 bases. .
- the candidate base sequence including the PAM sequence is mapped to the base sequence data of the genomic DNA of all HLA haplotypes.
- Mapping refers to a position where the sequence identity of a query base sequence (here, a candidate base sequence) is high on a reference base sequence (here, it means base sequence data of genomic DNA of all HLA haplotypes).
- the operation to identify is preferably 90% or more, more preferably 95% or more, further preferably 99% or more, and particularly preferably 100%. preferable.
- the mapping can be performed using, for example, the Bowtie program (http://bowtie-bio.sourceforge.net/index.shtml).
- the mapping may be performed using a sequence homology (sequence identity) search program other than the Bowtie program, such as BWA, BLAST, BLAT, SOAP, Novoalign, and TopHat.
- the candidate base sequence is mapped to the base sequence data of the whole genomic DNA other than the HLA allele.
- Reference human genome sequence (Hg19) or the like can be used as the base sequence data of total genomic DNA.
- a Bowtie program or a sequence homology search program other than the Bowtie program can be used.
- mapping to the base sequence data of genomic DNA of all HLA haplotypes mapping to only one target HLA haplotype and mapping to base sequence data of all genomic DNA other than HLA alleles
- candidate base sequences that are not mapped to are specified as target base sequences.
- the target HLA haplotype means an HLA haplotype to be destroyed or modified.
- gRNA having the target base sequence specified by the method of the first embodiment as a target base sequence is specifically DSB specific to the target HLA haplotype. And the risk of off-target mutagenesis is low.
- the HLA gene is often composed of 8 exons, but the target base sequence is preferably targeted to the protein coding region of the HLA gene.
- the target base sequence preferably targets exons 1, 2, 3 or 4 encoding the extracellular domain of the HLA protein, and particularly preferably targets exon 2 or 3.
- two or more target base sequences may be designed so as to include a gene region encoding a protein of the HLA gene.
- the target base sequence is preferably one that does not target another genomic region other than the HLA gene or mitochondrial DNA. In addition, even when a mismatch of several bases is allowed, it is preferable to select a target base sequence that has few sites that target a region other than the HLA gene.
- the present invention relates to a method for identifying a target base sequence for producing low antigenic cells with reduced rejection when transplanted to a recipient by genome editing, comprising all HLA haplotypes.
- Mapping the candidate base sequence to the base sequence data of genomic DNA, mapping the candidate base sequence to the base sequence data of all genomic DNA other than the HLA allele, and genomic DNA of all HLA haplotypes The candidate base sequence that is mapped to two or more target HLA haplotypes when mapped to the base sequence data of, and not mapped when mapped to the base sequence data of total genomic DNA other than the HLA allele, And identifying as a target base sequence.
- candidate base sequences mapped to two or more target HLA haplotypes are specified as target base sequences. This is mainly different from the method of the first embodiment described above.
- candidate base sequences, base sequence data of genomic DNA of all HLA haplotypes, base sequence data of total genomic DNA, and mapping are the same as in the method of the first embodiment described above.
- the target base sequence of the gRNA of the second embodiment described later can be specified by the method of the present embodiment.
- the gRNA of the second embodiment can cleave a plurality of target HLA genes (or alleles). For this reason, the kind of gRNA required when destroying or modifying a plurality of HLA genes can be reduced. Thereby, the cost of producing gRNA can be reduced. Moreover, the risk of off-target mutagenesis can be reduced by reducing the type of gRNA used.
- the present invention maps only to one target HLA haplotype when mapped to genomic DNA base sequence data of all HLA haplotypes, and base sequence data of total genomic DNA other than HLA alleles.
- a gRNA having a base sequence that is not mapped when mapped as a target base sequence.
- the gRNA of the first embodiment can induce DSB specifically for a specific HLA haplotype and has a low risk of introducing an off-target mutation.
- the gRNA may be a complex of CRISPR RNA (crRNA) and trans-activated CRISPR RNA (tracrRNA), or a single synthetic gRNA (sgRNA) combining tracrRNA and crRNA. May be. Any structure of gRNA can induce DSB specifically in the target base sequence.
- crRNA CRISPR RNA
- tracrRNA trans-activated CRISPR RNA
- sgRNA single synthetic gRNA
- the target base sequence is specified by the method described above.
- the target base sequence is a base sequence including a PAM sequence. Therefore, a base sequence obtained by removing the PAM sequence from the target base sequence is used as a spacer base sequence of crRNA or sgRNA.
- the base sequence of sgRNA can be the following base sequence.
- a base sequence obtained by removing the PAM sequence from the target base sequence is defined as a spacer base sequence.
- a base sequence in which a scaffold sequence is linked to the 3 'end of the spacer base sequence is designed.
- the scaffold sequence for example, the base sequence described in SEQ ID NO: 39 can be used, but not limited thereto.
- the base sequence described in SEQ ID NO: 39 may be a base sequence in which one or several bases are deleted, substituted or added in the base sequence described in SEQ ID NO: 39 as long as it functions as a scaffold sequence.
- the one or several bases may be, for example, 1 to 10 bases, such as 1 to 5 bases, such as 1 to 3 bases.
- the designed sgRNA can be prepared by chemical synthesis or the like.
- the sgRNA may be prepared as RNA and introduced directly into a donor cell, or may be prepared as DNA and incorporated into an expression vector, introduced into the donor cell in the form of an expression vector, and expressed in the cell.
- a polymerase III promoter such as U6 promoter or H1 promoter can be used.
- the base sequence at the 5 'end of sgRNA may be changed to G or GG. Changing the base sequence at the 5 'end of sgRNA to G or GG has little effect on the cleavage activity of Cas9.
- the base sequence obtained by removing the PAM sequence from the target base sequence is “5′-NNNNNNNNNNNNNNNNNNNNNNNN-3 ′” (SEQ ID NO: 62)
- the base sequence of the sgRNA that specifically cleaves the target base sequence is “5′- NNNNNNNNNNNNNNNNNNNNNNNNGUUUUAGAGCUAGAAAUAGCAAGUUAAAAUAAGGCUAGUCCGUUAUCAACUUGAAAAAGUGGCACCGAGUCGGUGCUUUUUU-3 ′ ”(SEQ ID NO: 63).
- the gRNA of this embodiment may be a complex of crRNA and tracrRNA.
- crRNA and tracrRNA may be directly introduced into donor cells, or may be introduced into donor cells in the form of expression vectors and expressed in the cells.
- a polymerase III promoter such as U6 promoter or H1 promoter can be used.
- the base sequence at the 5 'end of crRNA or tracrRNA may be changed to G or GG. Changing the base sequence at the 5 'end of crRNA or tracrRNA to G or GG has little effect on the cleavage activity of Cas9.
- the base sequences of crRNA and tracrRNA can be the following base sequences.
- a base sequence obtained by removing the PAM sequence from the target base sequence is defined as a spacer base sequence.
- a base sequence in which a scaffold sequence is linked to the 3 'end of the spacer base sequence is designed to be a crRNA base sequence.
- the base sequence obtained by removing the PAM sequence from the target base sequence is “5′-NNNNNNNNNNNNNNNNNNNNNN-3 ′” (SEQ ID NO: 62)
- the base sequence of crRNA is “5′-NNNNNNNNNNNNNNNNNNNNNNNNNNNNNNGUUUUAGAGCUAUGCUGUUUUG-3 ′” (SEQ ID NO: 64).
- the base sequence of the tracrRNA can be, for example, “5′-CAAAACAGCAUAGCAAGUUAAAAUAAGGCUAGUCCGUUAUCAACUUGAAAAAGUGGCACCGAGUCGGUGC-3 ′” (SEQ ID NO: 65).
- the base sequence of crRNA may have a mutation relative to the base sequence described in SEQ ID NO: 64 as long as it functions as crRNA. More specifically, it may be a base sequence in which one or several bases are deleted, substituted or added in the base sequence shown in SEQ ID NO: 64.
- the one or several bases may be, for example, 1 to 10 bases, such as 1 to 5 bases, such as 1 to 3 bases.
- the base sequence of tracrRNA may be a base sequence in which one or several bases are deleted, substituted, or added in the base sequence described in SEQ ID NO: 65 as long as it functions as tracRNA.
- the one or several bases may be, for example, 1 to 10 bases, such as 1 to 5 bases, such as 1 to 3 bases.
- crRNA and tracrRNA can be prepared by chemical synthesis or the like.
- crRNA and tracrRNA may be prepared as RNA and introduced directly into a donor cell, or prepared as DNA and incorporated into an expression vector, introduced into the donor cell in the form of an expression vector, and expressed in the cell.
- the one or several bases may be, for example, 1 to 10 bases, such as 1 to 5 bases, such as 1 to 3 bases.
- the ability to bind to DNA can be reduced and the sequence recognition specificity of CRISPR-Cas9 can be increased.
- gRNA having the base sequence described in any of SEQ ID NOs: 3, 4, 7, 45 to 52 as a target base sequence, or the base sequence described in any of SEQ ID NOs: 3, 4, 7, 45 to 52 A gRNA having a base sequence in which one or several bases are deleted, substituted or added at the 5 ′ end of the target base sequence is preferred.
- the HLA allele is specifically disrupted or modified by the HLA haplotype, and rejection when transplanted to recipients is reduced. Antigenic cells can be produced.
- the present invention relates to nucleotide sequence data of total genomic DNA other than HLA alleles that are mapped to two or more target HLA haplotypes when mapped to nucleotide sequence data of genomic DNA of all HLA haplotypes.
- a gRNA having a base sequence that is not mapped when mapped as a target base sequence.
- a gRNA having any of the base sequences described in SEQ ID NOs: 53 to 55 and 2460 to 8013 as a target base sequence, or any one of SEQ ID NOs: 53 to 55 and 2460 to 8013 is used.
- examples include gRNA having a target base sequence in which one or several bases are deleted, substituted or added at the 5 ′ end of the base sequence described above.
- the one or several bases may be, for example, 1 to 10 bases, such as 1 to 5 bases, such as 1 to 3 bases.
- the ability to bind to DNA can be reduced and the sequence recognition specificity of CRISPR-Cas9 can be increased.
- one or several bases at the 5 ′ end of the gRNA having the base sequence described in any of SEQ ID NOs: 53 to 55 as a target base sequence or the base sequence described in any of SEQ ID NOs: 53 to 55 A gRNA having a base sequence in which is deleted, substituted or added as a target base sequence is preferred.
- the base sequence at the 5 'end of gRNA may be changed to G or GG.
- HLA-A gene derived from the father and the HLA-A gene derived from the mother it may be the same.
- HLA-A gene derived from the father it is necessary to cleave only one HLA-A gene to induce knockout and leave the opposite HLA-A gene.
- HLA genes have high DNA sequence homology with each other, so that one gRNA can be used as a plurality of HLA genes (for example, HLA-A gene).
- HLA-A gene a plurality of HLA genes
- gRNA capable of inducing cleavage of both the father-derived sequence and the maternal-derived sequence, or the HLA-A gene and the HLA-B gene was searched, a plurality of such gRNA sequences could be identified.
- the gRNA of the second embodiment it is possible to reduce the types of gRNA necessary for cleaving a plurality of HLA genes (or alleles). Thereby, the cost of producing gRNA can be reduced. Moreover, the risk of off-target mutagenesis can be reduced by reducing the type of gRNA used.
- the present invention relates to the pluripotency of a pluripotent stem cell comprising IFN- ⁇ , IFN- ⁇ , IFN- ⁇ , IL-4, GM-CSF, TGF- ⁇ or TGF- ⁇ as an active ingredient.
- An HLA protein expression inducer that induces the expression of HLA protein while maintaining the above is provided.
- the present invention provides a method for inducing HLA protein expression while maintaining the pluripotency of pluripotent stem cells, wherein IFN- ⁇ , IFN- ⁇ , IFN- A method comprising the step of adding ⁇ , IL-4, GM-CSF, TGF- ⁇ or TGF- ⁇ is provided.
- the target base sequence of gRNA that recognizes the HLA-A allele, HLA-B allele, and HLA-C allele was determined by the following method. First, download the “hla_gen.fasta” file containing the base sequence of all HLA haplotype genomic DNA from the IPD-IMGT / HLA database (https://www.ebi.ac.uk/ipd/imgt/hla/). Obtained.
- a base sequence that matches “NNNNNNNNNNNNNNNNNNNNNNNNNNNNNNNNNGG” was extracted as a target base sequence candidate for SpCas9 gRNA (sgRNA) from the base sequence of the genomic DNA of all HLA haplotypes.
- the base sequence of each candidate is mapped to the base sequence of all HLA haplotypes using the Bowtie program (http://bowtie-bio.sourceforge.net/index.shtml).
- the number of mapping to the HLA gene was analyzed.
- the same operation can be performed using a sequence homology search program other than the Bowtie program.
- each sgRNA binds to only one of the HLA-A allele, HLA-B allele, or HLA-C allele, and the HLA-A allele and HLA- When binding to two or more HLA alleles such as B allele, HLA-A allele and HLA-C allele, HLA-B allele and HLA-C allele, HLA-A allele, HLA-B allele and HLA-C allele Classified.
- FIG. 1 (a) is a Venn diagram showing whether the target base sequence extracted in this experimental example targets an HLA-A allele, an HLA-B allele, or an HLA-C allele.
- the numbers in the figure indicate the number of target base sequences of sgRNA.
- FIG. 1 (b) is a diagram showing where the target base sequence of the sgRNA identified in this experimental example targets the HLA-A allele, HLA-B allele, or HLA-C allele.
- the box connected with a line indicates the exon of each HLA gene
- the HLA-A allele has exon 1 on the left side
- the HLA-B allele and HLA-C allele have exon 1 on the right side.
- “[+] strand sgRNAs” indicates a target base sequence targeting positive strand DNA
- “[ ⁇ ] strand sgRNAs” indicates a target base sequence targeting negative strand DNA
- “Unique k-mers”. Indicates a set of 10 to 16-mer base sequences (referred to as “k-mer sequences”) that exist only in one place on the human genome.
- mapping to the nucleotide sequence data of genomic DNA of all HLA haplotypes to SEQ ID NOs: 53 to 55 and 2460 to 8013 it is mapped to two or more target HLA haplotypes, and whole genomic DNA other than the HLA allele
- Table 2 shows, as an example, the number of target HLA alleles and target HLA alleles for some base sequences.
- mapping when mapping to the base sequence data of genomic DNA of all HLA haplotypes, it is mapped to two or more target HLA haplotypes, and to the base sequence data of all genomic DNAs other than HLA alleles
- the target base sequence extracted as a base sequence that is not mapped in the case of mapping the number of target HLA alleles and the number of extracted target base sequences are shown.
- FIG. 2 is a graph showing the results of flow cytometry. As a result, it became clear that the addition of IFN- ⁇ increased the expression of HLA protein.
- FIG. 3 is a graph showing the results of flow cytometry. As a result, it became clear that the addition of IFN- ⁇ increased the expression of HLA protein. As a result, it was revealed that the expression of HLA protein increased when IFN- ⁇ was added at any concentration.
- Example 4 (Induction of HLA protein expression by iPS cell stimulation 3) After adding 50 ng / mL IFN- ⁇ to the iPS cell culture medium and treating for 4 hours, 8 hours, 16 hours, 24 hours, and 48 hours, anti-HLA-A2 antibody (product number: 740082, BD) was used. Flow cytometry analysis was performed to examine the expression of HLA-A2 protein.
- FIG. 4 (a) is a graph showing the results of flow cytometry.
- FIG. 4B is a diagram showing a schedule for analysis of IPS- ⁇ treatment and expression level of HLA-A protein in iPS cells. As a result, it was revealed that the expression of HLA protein increases as the IFN- ⁇ treatment time increases. Further, as a result of further studies, it was revealed that after the iPS cells were treated with IFN- ⁇ for 48 hours, IFN- ⁇ was removed from the medium and the expression of HLA protein was maintained 7 days later.
- 604B1 iPS cells and 1383D2 iPS cells first, based on the results of creating the ST based on the WES (Whole Exequencing) analysis results of the 604B1 iPS cells and the WGS (Whole Genome Sequencing) analysis results of the 1383D2 iPS cells. .
- each FASTQ sequence file was mapped to a reference human genome sequence (Hg19) to create a BAM file.
- each BAM file is analyzed using software (named “HLA-genotyper”, https://pypi.python.org/pypi/hla-genotyper/0.4.2b1), and the HLA haplotype of each cell is determined. Were determined.
- the extracted genomic DNA was sent to the HLA Laboratory (http://hla.or.jp/), and the HLA haplotype was determined by the fluorescent bead method (PCR-rSSO / Luminex method). .
- the same HLA haplotype determination as that of 585A1 iPS cells was also performed.
- PBMC peripheral blood mononuclear cells
- each sgRNA used in each of the following experimental examples was obtained by linking the scaffold sequence shown in SEQ ID NO: 39 to the 3 ′ side of the base sequence obtained by removing the PAM sequence from the target base sequence of each sgRNA.
- the base sequence For example, when the base sequence obtained by removing the PAM sequence from the target base sequence is “5′-NNNNNNNNNNNNNNNNNN-3 ′” (SEQ ID NO: 62), the base sequence of the sgRNA used is “5′-NNNNNNNNNNNNNNNNNNNNNNNNGUUUUAGAGCUAGAAAUAGCAAGUUAAAAUUGUGACCAGUCCGUUAUCGACUUGAAAAUUGAACUUGAAAAUGU SEQ ID NO: 63).
- each sgRNA was introduced into a cell in the form of an expression vector and used after being expressed in the cell.
- FIG. 5 (a) shows the target site and target base of sgRNA found in the exon 3 region of HLA-A.
- the box indicates the exon of the HLA-A * 02: 07 gene, and the arrow indicates the position of the target base sequence of each sgRNA.
- FIG. 5 (a) also shows the base sequence of the wild type A * 02: 07 allele and the base sequence of the wild type A * 32: 01 allele. The parts where the sequences differ between both alleles are shown in capital letters, and the PAM sequence of sgRNA is underlined.
- A0207-ex3-g1, A0207-ex3-g2 and A0207-ex3-g4 were each transfected into 1383D2 iPS cells having the HLA haplotype shown in Table 4 below together with purified Cas9 protein. Transfection was performed using a commercially available kit (model “CRISPR-MAX”, product number: CMAX00003, Thermo Fisher Scientific).
- T7EI T7 endonuclease I
- nested PCR was performed using primers that specifically amplify the A * 02: 07 allele of the HLA-A2 region.
- the primers shown in Table 5 below were used for the nested PCR.
- PCR product was purified, 1/10 volume of 10 ⁇ NEBuffer2 (NEB) buffer was added to the purified PCR product (400 ng), and the double-stranded DNA was heat denatured by heating at 95 ° C. for 5 minutes. And then reannealing by gradually lowering the temperature. More specifically, the temperature was cooled from 95 ° C. to 85 ° C. at ⁇ 2 ° C./second, and from 85 ° C. to 25 ° C. at ⁇ 0.1 ° C./second.
- NEB NEBuffer2
- T7EI T7 endonuclease I
- M0302S NEB
- the T7EI-treated PCR product was subjected to 2% agarose gel electrophoresis, and the DNA signal intensity of the cut and uncut bands was quantified with ImageJ software.
- FIG. 5 (b) shows the result of analyzing the genomic DNA mutagenesis efficiency by T7EI assay when each sgRNA is used.
- T7EI indicates T7 endonuclease I
- ⁇ indicates that it was not added
- + indicates that it was added.
- ex3-g1 indicates the result of introducing A0207-ex3-g1
- ex3-g2 indicates the result of introducing A0207-ex3-g2
- “ex3-g4” indicates The results show that A0207-ex3-g4 was introduced
- “DMD # 1” shows the results of introducing sgRNA specific to the dystrophin gene used as a positive control.
- An arrowhead indicates a band cut by T7EI.
- A0207-ex3-g4 sgRNA has the highest genome cleavage activity.
- HLA allele-specific knockout 1 (HLA allele-specific knockout 1) ⁇ Confirmation of HLA protein expression>
- two iPS cell lines having HLA serotype A2 1383D2 and 404C2 were selected.
- 604B1 strain was selected as an iPS cell line not having HLA antigen type A2.
- a total of 3 undifferentiated iPS cells were treated with anti-HLA-A2 antibody (Product No .: 740082, BD) when not treated with cytokine and treated with 50 ng / mL IFN- ⁇ for 48 hours. Were subjected to flow cytometry analysis.
- FIG. 6 (a) is a graph showing the results of flow cytometry analysis. As a result, specific expression of HLA-A2 was confirmed in 1383D2 cells and 404C2 cells by IFN- ⁇ treatment.
- A0207-ex3-g1 (the target base sequence is shown in SEQ ID NO: 3)
- A0207-ex3-g2 (the target base sequence is shown in SEQ ID NO: 4)
- A0207-ex3-g4 which are the sgRNAs described above.
- the target base sequence is shown in SEQ ID NO: 7
- sgRNA-DMD # 1 target base sequence is shown in SEQ ID NO: 61
- DMD dystrophin
- each transfected iPS cell was passaged in two wells, one well was left untreated with cytokines, and the other well was supplemented with 50 ng / mL IFN- ⁇ in the medium. Treated for 48 hours. Thereafter, flow cytometry analysis was performed using an anti-HLA-A2 antibody (product number: 740082, BD).
- FIG. 6 (b) is a graph showing the results of flow cytometry analysis. As a result, it was found that when A0207-ex3-g4 sgRNA having the highest genome cleavage activity was used, cells in which the most HLA-A2 antigen was destroyed appeared.
- genomic DNA was extracted from 1383D2 iPS cells into which sgRNA (A0207-ex3-g4) was introduced, and the A * 02: 07 allele was specifically amplified and the A * 32: 01 allele was not amplified.
- Nested PCR was performed to amplify the target site of sgRNA. The primers shown in Table 6 below were used for the nested PCR.
- 1383D2 iPS cells into which sgRNA (A0207-ex3-g4) was introduced were stained with anti-HLA-A2 antibody (product number: 740082, BD), and HLA-A2 antigen was negative on a flow cytometer Sorted.
- Genomic DNA was extracted from the sorted iPS cells, and nested PCR was performed using primers (described above) that specifically amplify the target allele A * 02: 07 allele.
- Nested PCR was performed using primers that specifically amplify the non-target A * 32: 01 allele.
- the primers shown in Table 7 below were used for the nested PCR of the A * 32: 01 allele.
- PCR product was cloned into pGEM-T-Easy vector (Promega) by TA cloning. Sixteen E. coli colonies (A * 02: 07 allele) and 19 strains (A * 32: 01 allele) were recovered, and the nucleotide sequence was determined by Sanger sequencing. Subsequently, based on the determined base sequence, the number of clones having a deletion in the sequence, the number of clones having an insertion, and the number of clones having no sequence change were counted.
- the A * 02: 07 allele had some insertion deletion mutation (Indel mutation) in all 16 subclones.
- the A * 32: 01 allele was confirmed to be a wild-type nucleotide sequence in all 19 subclones.
- FIG. 7 shows a case where sgRNA was introduced into iPS cell 1383D2 strain to induce genome editing, and sorting was not performed with HLA-A2 antigen expression, and cells with negative HLA-A2 antigen expression were sorted. It is a graph which shows the genomic DNA mutation introduction efficiency in the case.
- HLA allele-specific knockout 2 By destroying the HLA allele of the 604B1 iPS cells having the HLA haplotypes shown in Table 8 below, the rejection reaction when transplanting to the recipient A having the virtual HLA haplotypes shown in Table 9 below is reduced. Antigenic cells were generated.
- the HLA haplotypes shown in Table 9 below are HLA haplotypes of peripheral blood mononuclear cells (PBMC, model “LP — 194”, CTL).
- 604B1 iPS cells have A * 01: 01 allele and B * 07: 02 allele. These HLA alleles are not present in recipient A. For this reason, when 604B1 iPS cells or cells induced to differentiate from 604B1 iPS cells are transplanted into a recipient, immune rejection occurs due to attack by the T cells of recipient A.
- the HLA alleles A * 01: 01 and B * 07: 02 alleles that do not exist in recipient A but exist in donor cells are destroyed and specific to donor cells.
- the typical HLA protein should not be expressed.
- sgRNAs identified in Experimental Example 1 above only the A * 01: 01 allele was cleaved, and two sgRNAs (A0101-ex3-g1 (target base sequence of the target base sequence were not matched with the A * 24: 02 allele). And A0101-ex3-g2 (the target base sequence is shown in SEQ ID NO: 46)) and the B * 07: 02 allele are cleaved, and the sequence matches that of the B * 37: 01 allele. Two sgRNAs (B0702-ex2-g1 (target base sequence is shown in SEQ ID NO: 47) and B0702-ex2-g2 (target base sequence is shown in SEQ ID NO: 48)) were selected.
- each sgRNA was synthesized by in vitro transcription reaction and transfected into 604B1 iPS cells together with purified Cas9 protein. Transfection was performed using a commercially available kit (model “CRISPR-MAX”, product number: CMAX00003, Thermo Fisher Scientific).
- each iPS cell was stimulated with 50 ng / mL IFN- ⁇ for 48 hours to induce expression of HLA protein. Subsequently, each iPS cell is stained with an anti-HLA-A1 antibody (model “ab33883”, abcam) or anti-HLA-B7 antibody (model “MCA986”, Bio-Rad), and negative for HLA protein by flow cytometry. The percentage of cells was analyzed.
- FIG. 8 (a) and 8 (b) are graphs showing the results of flow cytometry analysis.
- FIG. 8 (a) shows the results of measuring the expression level of HLA-A1 protein in iPS cells in which the A * 01: 01 allele was disrupted
- FIG. 8 (b) shows iPS in which the B * 07: 02 allele was disrupted. It is the result of having measured the expression level of HLA-B7 protein in a cell.
- “No transfection” shows the result of iPS cells into which sgRNA was not introduced.
- A0101-ex3-g1 target base sequence is shown in SEQ ID NO: 45
- A0101-ex3-g2 target base sequence is shown in SEQ ID NO: 46
- A0101-ex3-g2 is a sgRNA with higher knockout efficiency.
- B0702-ex2-g1 target base sequence is shown in SEQ ID NO: 47
- B0702-ex2-g2 target base sequence is shown in SEQ ID NO: 48
- B0702-ex2-g1 is an sgRNA with higher knockout efficiency.
- A0101-ex3-g2 and B0702-ex2-g1 having high knockout efficiency were selected, and both A * 01: 01 allele and B * 07: 02 allele were knocked out.
- 604B1 iPS cells were transfected with two selected sgRNAs together with purified Cas9 protein. Transfection was performed using a commercially available kit (model “CRISPR-MAX”, product number: CMAX00003, Thermo Fisher Scientific).
- iPS cells were stimulated with 50 ng / mL IFN- ⁇ for 48 hours to induce expression of HLA protein. Subsequently, iPS cells were stained with anti-HLA-A1 antibody (model “ab33883”, abcam) and anti-HLA-B7 antibody (model “MCA986”, Bio-Rad) and analyzed by flow cytometry.
- FIG. 9 (a) and 9 (b) are graphs showing the results of flow cytometry analysis.
- “No translation” indicates an analysis result of iPS cells into which sgRNA was not introduced.
- “A0101-ex3-g2” and “B0702-ex2-g1” represent the A * 01: 01 allele and the B * 07: 02 allele by co-introducing these two sgRNAs. It shows that it is the analysis result of the iPS cell which knocked out both.
- single cell sorting was performed from a cell population in which both HLA-A1 protein and HLA-B7 protein were negative, and 15 subclones were recovered. Subsequently, genomic DNA was extracted from each subclone. Subsequently, after performing PCR reaction to amplify the region containing the target site (exon 3) of A0101-ex3-g2 which is the sgRNA used and the region containing the target site (exon 2) of B0702-ex2-g1 The base sequence was analyzed by Sanger sequencing.
- FIG. 10 (a) is a diagram showing the base mutation pattern of each recovered clone.
- WT indicates that it was a wild-type base sequence
- ⁇ indicates that it had a deletion mutation
- + had an insertion mutation. It shows that.
- ⁇ 5 bp indicates that it has a deletion of 5 bases
- +18 bp indicates that it has an insertion of 18 bases.
- FIG. 10B shows the base sequences of two strains (# 8 and # 10) as representative examples.
- HLA allele-specific knockout 3 By destroying the HLA allele of the 585A1 iPS cells having the HLA haplotype shown in Table 10 below, the rejection when the transplantation is performed on the recipient B having the hypothetical HLA haplotype shown in Table 11 below is reduced. Antigenic cells were generated.
- the HLA haplotypes shown in Table 11 below are HLA haplotypes of peripheral blood mononuclear cells (PBMC, model “2010113203”, Wako).
- the B * 07: 02 allele and the C * 07: 02 allele exist in 585A1 iPS cells. These HLA alleles are not present in recipient B. For this reason, when a cell induced to differentiate from 585A1 iPS cells or 585A1 iPS cells is transplanted into the recipient, immune rejection occurs due to attack by the T cells of recipient B.
- HLA alleles B * 07: 02 and C * 07: 02 alleles that do not exist in recipient B but exist in donor cells are destroyed and specific to donor cells.
- the typical HLA protein should not be expressed.
- B * 07: 02 allele-specific B0702-ex2-g1 target base sequence is shown in SEQ ID NO: 47
- C * 07: 02 allele-specific C0702-ex3-g3 target base sequence is sgRNA No. 49
- a B * 07: 02 allele of 585A1 iPS cells was used in the same manner as in Experimental Example 7, except that a commercially available kit (trade name “4D-Nucleofector”, model “V4XP-4032”, Lonza) was used).
- the C * 07: 02 allele was knocked out.
- iPS cells were stimulated with 50 ng / mL IFN- ⁇ for 48 hours to induce expression of HLA protein. Subsequently, iPS cells were stained with an anti-HLA-B7 antibody (type “MCA986”, Bio-Rad) and analyzed by flow cytometry.
- an anti-HLA-B7 antibody type “MCA986”, Bio-Rad
- FIG. 11 is a graph showing the results of flow cytometry analysis.
- “No stain” indicates an analysis result of iPS cells not stained with the antibody
- “No translation” indicates an analysis result of iPS cells into which sgRNA was not introduced
- “-Ex2-g1” and “C0702-ex3-g3” indicate the analysis results of iPS cells in which both sgRNAs were introduced and both B * 07: 02 and C * 07: 02 alleles were knocked out. .
- single cell sorting was performed from a cell population negative for HLA-B7 protein, and 28 subclones were recovered. Subsequently, genomic DNA was extracted from each subclone. Subsequently, after performing a PCR reaction to amplify the region containing the target site (exon 2) of B0702-ex2-g1, which is the sgRNA used, and the region containing the target site (exon 3) of C0702-ex3-g3 The base sequence was analyzed by Sanger sequencing.
- FIG. 12 is a diagram showing the base mutation pattern of each collected clone.
- “WT” indicates that the nucleotide sequence was a wild type
- “ ⁇ ” indicates that it had a deletion mutation
- “+” had an insertion mutation. It shows that.
- FIG. 12B shows the base sequences of three strains (# 2, # 11, and # 26) as a representative example.
- HLA allele-specific knockout 4 By destroying the HLA allele of the 585A1 iPS cells having the HLA haplotypes shown in Table 12 below, the rejection reaction when transplanting to recipient C having the hypothetical HLA haplotypes shown in Table 13 below is reduced. Antigenic cells were generated.
- the HLA haplotypes shown in Table 13 below are HLA haplotypes of peripheral blood mononuclear cells (PBMC, model “LP — 266”, CTL).
- 585A1 iPS cells have B * 52: 01 allele and C * 12: 02 allele. These HLA alleles are not present in recipient C. For this reason, when a cell induced to differentiate from a 585A1 iPS cell or a 585A1 iPS cell is transplanted into the recipient C, immune rejection occurs due to attack by the T cell of the recipient C.
- the HLA alleles B * 52: 01 and C * 12: 02 that are not present in the recipient C but present in the donor cell are destroyed and specific to the donor cell.
- the typical HLA protein should not be expressed.
- Example 9 As Example 9 except that C1202-ex3-g1 (target base sequence is shown in SEQ ID NO: 50) specific to C * 12: 02 allele was used as the sgRNA, and the cells were not sorted. Then, the C * 12: 02 allele of 585A1 iPS cells was knocked out to obtain 17 subclones. The cells were not sorted because anti-HLA-C12 allele-specific antibodies were not available.
- genomic DNA was extracted from each subclone. Subsequently, genomic DNA was extracted from each subclone. Subsequently, a PCR reaction was performed to amplify a region containing the target site (exon 3) of C1202-ex3-g1, which was the sgRNA used, and then the nucleotide sequence was analyzed by Sanger sequencing.
- FIG. 13 (a) is a diagram showing the base mutation pattern of each collected clone.
- “ ⁇ ” indicates that it had a deletion mutation
- “+” indicates that it had an insertion mutation.
- Indel mutation some insertion deletion mutation
- B * 52: 01 allele-specific B5201-ex3-g2 (the target base sequence is shown in SEQ ID NO: 51) is introduced as sgRNA into # 1 cells in which the C * 12: 02 allele was knocked out.
- genomic DNA was extracted from each subclone.
- a PCR reaction was performed to amplify a region containing the target site (exon 3) of B5201-ex3-g2, which was the sgRNA used, and then the nucleotide sequence was analyzed by Sanger sequencing.
- FIG. 13 (b) is a diagram showing the base mutation pattern of each recovered clone.
- “Mut” indicates that it had a substitution mutation
- “WT” indicates that it was a wild-type base sequence
- “ ⁇ ” had a deletion mutation. It shows that. As a result, it was revealed that some mutation occurred near the target site of sgRNA.
- FIG. 13 (c) shows the base sequence of strain # 1-1 as a representative example.
- HLA allele-specific knockout 5 By destroying the HLA allele of the 604B1 iPS cells having the HLA haplotypes shown in Table 14 below, the rejection when the transplantation is performed on the recipient C having the virtual HLA haplotypes shown in Table 15 below is reduced. Antigenic cells were generated.
- the HLA haplotypes shown in Table 15 below are HLA haplotypes of peripheral blood mononuclear cells (PBMC, model “LP — 266”, CTL).
- 604B1 iPS cells have A * 01: 01 allele, B * 37: 01 allele and C * 06: 02 allele. These HLA alleles are not present in recipient C. For this reason, when a 604B1 iPS cell or a cell induced to differentiate from a 604B1 iPS cell is transplanted into a recipient, immune rejection occurs due to attack by the T cell possessed by the recipient.
- the A * 01: 01 allele, B * 37: 01 allele and C * 06: 02 allele which are HLA alleles present in donor cells but not in recipient C, are destroyed.
- the HLA protein specific to the donor cell may not be expressed.
- a * 01: 01 allele-specific A0101-ex3-g2 (the target base sequence is shown in SEQ ID NO: 46) was used in the same manner as in Experimental Example 9, and A * 01: 01 of 604B1 iPS cells. Knocked out the allele. Subsequently, C0606-ex3-g1 (target base sequence is shown in SEQ ID NO: 52), which is a C * 06: 02 allele-specific sgRNA, was introduced into this cell to knock out the C * 06: 02 allele. 9 subclones were obtained.
- genomic DNA was extracted from each subclone. Subsequently, after performing a PCR reaction to amplify the region containing the target site (exon 3) of A0101-ex3-g2, which is the sgRNA used, and the region containing the target site (exon 3) of C0602-ex3-g1 The base sequence was analyzed by Sanger sequencing.
- FIG. 14 (a) is a diagram showing the base mutation pattern of each collected clone.
- WT indicates that the nucleotide sequence was a wild type
- ⁇ indicates that it had a deletion mutation
- + had an insertion mutation. It shows that.
- Indel mutation some insertion deletion mutation in the vicinity of the target site of sgRNA was obtained.
- FIG. 14B shows the nucleotide sequence of clone # 3 having a frameshift mutation as a representative example among clones having an Indel mutation.
- HLA-B allele-specific B-ex2-g1 (target base sequence is shown in SEQ ID NO: 53) as sgRNA in clone # 3 in which the A * 01: 01 allele and C * 06: 02 allele were knocked out. ) was introduced to obtain a clone in which only the B * 37: 01 allele was knocked out.
- B-ex2-g1 is an sgRNA that targets both the B * 37: 01 allele and the B * 07: 02 allele.
- iPS cells were stimulated with 50 ng / mL IFN- ⁇ for 48 hours to induce expression of HLA protein. Subsequently, iPS cells were stained with an anti-HLA-B7 antibody (type “MCA986”, Bio-Rad) and analyzed by flow cytometry.
- an anti-HLA-B7 antibody type “MCA986”, Bio-Rad
- FIG. 15 (a) is a graph showing the results of flow cytometry analysis.
- “No stain” indicates the analysis result of iPS cells not stained with the antibody
- “No translation” indicates the analysis result of iPS cells into which sgRNA was not introduced.
- “B-ex2-g1” indicates the analysis result of iPS cells into which this sgRNA was introduced and the HLA-B allele was knocked out.
- single cell sorting was performed from a cell population positive for HLA-B7 protein, and 12 subclones (clone # 3-1 to # 3-12) were recovered. Subsequently, genomic DNA was extracted from each subclone. Subsequently, PCR that amplifies the targeted B * 37: 01 allele and the untargeted B * 07: 02 allele in the region containing the target site (exon 2) of B-ex2-g1, which is the sgRNA used. After the reaction, the base sequence was analyzed by the Sanger sequence.
- FIG. 15 (b) is a diagram showing the base mutation pattern of each collected clone.
- “Mut” indicates that it had a substitution mutation
- “WT” indicates that it was a wild-type base sequence
- “ ⁇ ” had a deletion mutation.
- “+” Indicates that it had an insertion mutation.
- a clone having some insertion deletion mutation (Indel mutation) in the vicinity of the target site of sgRNA was obtained.
- FIG. 15 (c) shows the nucleotide sequences of 2 clones (clone # 3-11 and # 3-12) among the clones in which the Indel mutation occurred only in the B * 37: 01 allele.
- HLA allele-specific knockout 6 By destroying the HLA allele of the 604B1 iPS cell having the HLA haplotype shown in Table 16 below, cells in which all three loci of the HLA-A allele, the HLA-B allele and the HLA-C allele were knocked out were prepared.
- FIG. 16A shows the target site of sgRNA used in this experimental example.
- BC-ex2-g1 target base sequence is shown in SEQ ID NO: 54
- B * 07: 02 allele, B * 37: 01 allele, C * 06: 02 allele and C * 07: 02 allele of 604B1 iPS cells were knocked out.
- FIG. 16B is a graph showing the results of flow cytometry.
- “No stain” indicates the analysis result of iPS cells not stained with the antibody
- “No translation” indicates the analysis result of iPS cells into which sgRNA was not introduced.
- “BC-ex2-g1” indicates that this is the analysis result of iPS cells into which this sgRNA was introduced and both the HLA-B allele and the HLA-C allele were knocked out.
- FIG. 16C is a graph showing the results of flow cytometry.
- “No stain” indicates the analysis result of iPS cells not stained with the antibody
- “No translation” indicates the analysis result of iPS cells into which sgRNA was not introduced.
- “A-ex3-g1” indicates the result of analysis of iPS cells into which this sgRNA was introduced and the HLA-A allele was knocked out.
- FIG. 17 (a) is a diagram showing the base mutation pattern of one of the recovered clones (clone # 1).
- “ ⁇ ” indicates that it has a deletion mutation
- “+” indicates that it has an insertion mutation.
- a * 01: 01 allele, A * 24: 02 allele, B * 07: 02 allele, B * 37: 01 allele, C * 06: 02 allele and C * 07: 02 allele are all deleted. It was confirmed that a clone having a mutation (Indel mutation) was obtained.
- FIG. 17B shows the base sequence of each HLA allele of clone # 1.
- “WT” represents a wild-type base sequence.
- HLA allele-specific knockout 7 By destroying the HLA allele of the 585A1 iPS cell having the HLA haplotype shown in Table 17 below, a cell in which the HLA-A allele and the HLA-B allele were knocked out and only one of the HLA-C alleles was knocked out was produced. .
- A-ex3-g1 (target base sequence is shown in SEQ ID NO: 55) capable of targeting the HLA-A allele
- B-ex2-g1 target base sequence is shown in SEQ ID NO: 55
- the A * 24: 02 allele, B * 07: 02 allele and B * 52: 01 allele of 585A1 iPS cells were knocked out in the same manner as in Experimental Example 9. .
- FIG. 18A is a graph showing the results of flow cytometry.
- FIG. 18 (b) is a diagram showing the base mutation pattern of each recovered clone.
- WT indicates that it was a wild type base sequence
- ⁇ indicates that it had a deletion mutation
- + had an insertion mutation.
- "?” Indicates that it could not be determined.
- clone # 3 which was found to have an insertion deletion mutation (Indel mutation) in all of the A * 24: 02 allele, B * 07: 02 allele and B * 52: 01 allele was selected.
- FIG. 18 (c) shows the base sequence of clone # 3.
- C * 12: 02 allele-specific C1202-ex3-g1 (the target base sequence is shown in SEQ ID NO: 50) was introduced into clone # 3, and the C * 12: 02 allele was knocked out. Subsequently, 4 subclones (clone # 3-1 to # 3-4) were recovered. Subsequently, genomic DNA was extracted from each subclone. Then, after performing PCR reaction which each amplifies C * 07: 02 allele and C * 12: 02 allele, the base sequence was analyzed by the Sanger sequence.
- FIG. 18 (d) is a diagram showing the base mutation pattern of each recovered clone.
- WT indicates a wild-type nucleotide sequence
- ⁇ indicates that it has a deletion mutation.
- FIG. 18 (e) shows the base sequence of clone # 3-1 as a representative example.
- A-ex3-g1 (target base sequence is shown in SEQ ID NO: 55) capable of targeting the HLA-A allele
- B-ex2-g1 target base sequence is shown in SEQ ID NO: 55
- 604B1 iPS cell A * 01: 01 allele, A * 24: 02 allele, B * 07: 02 allele and B * using the target base sequence as shown in SEQ ID NO: 53).
- the 37:01 allele was knocked out.
- FIG. 19A is a graph showing the results of flow cytometry.
- “No stain” indicates the analysis result of iPS cells not stained with the antibody
- “No translation” indicates the analysis result of iPS cells into which sgRNA was not introduced.
- “A-ex2-g1” and “B-ex2-g1” indicate the analysis results of iPS cells into which these sgRNAs were introduced and both the HLA-A allele and the HLA-B allele were knocked out.
- FIG. 19B is a graph showing the results of flow cytometry.
- “No stain” indicates the analysis result of iPS cells not stained with the antibody
- “HLA-A24, B7 ( ⁇ ) sorted” indicates the sorted HLA-A24 antigen and HLA- It shows that it is the analysis result of the cell population in which both B7 antigens are negative.
- the cell population negative for HLA-A1 antigen was sorted and collected, and 23 subclones were collected.
- genomic DNA was extracted from each subclone. Then, after performing PCR reaction which each amplifies the area
- FIG. 19 (c) is a diagram showing the base mutation pattern of each recovered clone.
- WT indicates that it was a wild type base sequence
- ⁇ indicates that it had a deletion mutation
- + had an insertion mutation. It shows that.
- 6 clones in which insertion deletion mutation (Indel mutation) occurred in all of the A * 01: 01 allele, A * 24: 02 allele, B * 07: 02 allele and B * 37: 01 allele were obtained. It became clear.
- the base sequence of clone # 4 is shown in FIG.
- FIG. 20 (a) is a diagram showing the target site of sgRNA used in this experimental example.
- BC-ex2-g1 target base sequence is shown in SEQ ID NO: 54
- C * 14: 02 allele of 1383D2 iPS cells were knocked out.
- FIG. 20B is a graph showing the results of flow cytometry.
- “No stain” indicates the analysis result of iPS cells not stained with the antibody
- “No translation” indicates the analysis result of iPS cells into which sgRNA was not introduced.
- “BC-ex2-g1” indicates that this is the analysis result of iPS cells into which this sgRNA was introduced and both the HLA-B allele and the HLA-C allele were knocked out.
- iPS cells were stimulated with 50 ng / mL IFN- ⁇ for 48 hours, and flow cytometry analysis was performed to examine the expression of HLA-A protein, HLA-B protein and HLA-C protein.
- FIG. 20 (c) is a graph showing the results of flow cytometry.
- “No stain” indicates the analysis result of iPS cells not stained with the antibody
- “No translation” indicates the analysis result of iPS cells into which sgRNA was not introduced.
- “A-ex3-g1” indicates the result of analysis of iPS cells into which this sgRNA was introduced and the HLA-A allele was knocked out. As a result, the existence of a cell population in which all of HLA-A protein, HLA-B protein and HLA-C protein were negative was confirmed.
- a double-regulated Cas9 expression vector and an sgRNA expression vector both of which are piggyBac transposon vectors, were introduced into 1383D2 iPS cells, and puromycin (Cat. No. 29455-54, Nacalai, with a final concentration of 1 to 15 ⁇ g / mL) was introduced. And a final concentration of 100-200 ⁇ g / mL hygromycin B (Cat. No. 10687-010, Thermo Fisher Scientific Co., Ltd.) for about 5 days to select a stable chromosomally transfected cell population.
- puromycin Cat. No. 29455-54, Nacalai, with a final concentration of 1 to 15 ⁇ g / mL
- hygromycin B Cat. No. 10687-010, Thermo Fisher Scientific Co., Ltd.
- the dual-regulated Cas9 expression vector is an expression vector of Cas9 that can control both expression induction and subcellular localization (Ishida et al., Site-specifc randomization of the endogenous genome by a regulatable CRISPR-Cas9 piggyBac system in human cells, Sci. Rep., 8: 310, 2018).
- expression of a fusion protein of Cas9 protein and glucocorticoid receptor (GR) (hereinafter referred to as “Cas9-GR protein”) is induced by adding doxycycline (Dox) to the cell culture medium.
- a dual-regulated Cas9 expression vector was used that can transfer Cas9-GR into the nucleus by adding dexamethasone (Dex) to the cell culture medium.
- Dex dexamethasone
- 21 (a) and 21 (b) are schematic diagrams illustrating homologous recombination according to this experimental example. Subsequently, in order to induce homologous recombination, a single-stranded DNA (target base sequence is shown in SEQ ID NO: 56) encoding a region containing exons 1 to 3 of the A * 01: 01 allele was prepared.
- target base sequence is shown in SEQ ID NO: 56
- the genomic DNA of 604B1 iPS cells was used as a template, and the primers shown in Table 21 below were used for the portion from 67 bases upstream of exon 1 to 1247 bases downstream of exon 3 of the A * 01: 01 allele. It was amplified by PCR and incorporated into pENTR plasmid to prepare pENTR vector.
- this plasmid DNA was nicked with the nicking endonuclease Nb.
- Treatment with BsrDI enzyme (model number “R0648S”, New England Biolabs), agarose electrophoresis under formamide denaturing conditions, excising and purifying the corresponding DNA band, the desired single-stranded DNA donor (lssDNA donor, sequence) No. 56) was prepared.
- the pENTR vector (dsDNA donor) or the prepared single-stranded DNA (lssDNA donor, SEQ ID NO: 56) in a double-stranded DNA state was introduced into 1383D2 iPS cells, respectively, and Dox and Dex were each at a final concentration of 2 ⁇ M. And 1 ⁇ M to induce homologous recombination by genome editing.
- each iPS cell was stimulated with 50 ng / mL of IFN- ⁇ for 48 hours and subjected to flow cytometry analysis to examine the expression of HLA-A2 antigen and HLA-A1 antigen.
- FIG. 21 (c) is a graph showing the results of flow cytometry.
- “No stain” indicates the analysis result of iPS cells that were not stained with the antibody
- “No Dox / Dex” is the analysis result of iPS cells that did not induce Cas9 expression.
- DsDNA donor indicates the analysis result of iPS cells in which a double-stranded DNA donor was introduced to induce homologous recombination
- the proportion of negative A2 antigen and positive A1 antigen was 0.2% when double-stranded DNA was used as a donor, whereas single-stranded DNA was used as a donor. It was 1.6%.
- the cell population in which the A2 antigen is negative and the A1 antigen is positive by homologous recombination using a single-stranded DNA donor is sorted by flow cytometry.
- the clone was analyzed for the nucleotide sequence of the HLA-A locus.
- FIG. 22 (a) is a diagram showing the results of analyzing the base sequence of the cell population.
- “Bulk” indicates the result of analysis of the cell population.
- FIG. 22 (b) is a diagram showing the results of analyzing the base sequence of a representative subclone (clone # 2) subjected to single cell sorting. As a result, it was revealed that a part of the A * 02: 07 locus was modified to the A * 01: 01 gene.
- FIG. 23 (a) is a graph showing the results of flow cytometry.
- “No stain” indicates an analysis result of iPS cells not stained with an antibody
- “No translation” indicates an analysis result of iPS cells into which sgRNA was not introduced.
- “B2M-g1” and “B2M-g2” indicate the analysis results of iPS cells into which this sgRNA was introduced and the B2M allele was knocked out.
- the percentage of the cell population in which all of HLA-A protein, HLA-B protein and HLA-C protein are negative is obtained when B2M-g1 (target base sequence is shown in SEQ ID NO: 59) is used as sgRNA. It was 2.8%. When B2M-g2 (target base sequence is shown in SEQ ID NO: 60) was used as sgRNA, it was 6.9%.
- FIG. 23B is a graph showing the results of flow cytometry.
- “B2M-KO # 1” indicates the result of clone # 1
- “B2M-KO # 2” indicates the result of clone # 2.
- FIG. 23 (c) shows the base sequence of the B2M allele of clone # 1.
- WT indicates a wild-type base sequence.
- Example 18 (Preparation of B2M knockout iPS cells 2) The same operation as in Experimental Example 17 was performed on 604B1 iPS cells to knock out the B2M allele.
- B2M-g2 target base sequence is shown in SEQ ID NO: 60
- FIG. 24 (a) is a graph showing the results of flow cytometry.
- “No stain” indicates the analysis result of iPS cells not stained with the antibody
- “No translation” indicates the analysis result of iPS cells into which sgRNA was not introduced.
- B2M-g2 indicates that this sgRNA was introduced to knock out the B2M allele. As a result, it was revealed that a cell population in which all of HLA-A protein, HLA-B protein and HLA-C protein were negative was obtained.
- FIG. 24B is a diagram showing the analysis result of the base sequence. As a result, it was confirmed that an insertion deletion mutation (Indel mutation) was introduced in any subclone.
- T cell activation test 1 (1) 604B1 iPS cells having HLA haplotypes shown in Table 22 below, (2) Clone # 8 knocked out of A * 01: 01 allele and B * 07: 02 allele of 604B1 iPS cells prepared in Experimental Example 8; 3) Same clone # 10, (4) 1383D2 iPS cells having the HLA haplotype shown in Table 23 below, (5) 604B1 iPS cells (clone # 1) prepared in Experimental Example 18 knocked out of B2M allele, respectively Differentiation was induced into body (EB) -derived blood cell-like cells.
- EB body
- CD8-positive T cells collected by sorting from peripheral blood mononuclear cells (PBMC, model “LP — 194”, CTL, corresponding to the recipient A described above) having the HLA haplotypes shown in Table 24 below are CFSE ( Cayman Chemical Co., Ltd.) and co-cultured with EB-derived hematopoietic cells differentiated from the cells (1) to (5) described above in the presence of IL-2 and IFN- ⁇ for 8 days.
- FIGS. 25A to 25E are graphs showing the results of flow cytometry.
- FIGS. 25 (a) to (e) show the results of CD8 positive T cells co-cultured with EB-derived blood cell-like cells differentiated from the cells (1) to (5), respectively. As a result, it was confirmed that only the T cell population specifically recognizing the HLA antigen of each iPS cell grew and CFSE became negative.
- T cell activation test 2 (1) 585A1 iPS cells having the HLA haplotypes shown in Table 25 below, (2) Clone # 2 in which the B * 07: 02 allele and C * 07: 02 allele of the 585A1 iPS cell prepared in Experimental Example 9 were knocked out, ( 3) Same clone # 11, (4) Same clone # 26, (5) 1383D2 iPS cells having the HLA haplotype shown in Table 26 below, (6) 604B1 iPS cells prepared in Experimental Example 18 and knocked out of B2M (clone #) 1) was induced to differentiate into EB-derived blood cell-like cells.
- CD8 positive T cells collected by sorting from peripheral blood mononuclear cells (PBMC, model “2010113203”, Wako, Inc., recipient B described above) having the HLA haplotypes shown in Table 27 below were CFSE ( Cayman Chemical Co., Ltd.) and co-cultured with EB-derived hematopoietic cells differentiated from the cells (1) to (6) described above in the presence of IL-2 and IFN- ⁇ for 8 days.
- PBMC peripheral blood mononuclear cells
- CFSE Cayman Chemical Co., Ltd.
- FIGS. 26 (a) to (f) show the results of CD8 positive T cells co-cultured with EB-derived blood cell-like cells differentiated from the cells (1) to (6), respectively. As a result, it was confirmed that the T cell population specifically recognizing the HLA antigen of each iPS cell grew and CFSE became negative.
- Example 21 T cell activation test 3 (1) 604B1 iPS cells having the HLA haplotype shown in Table 28 below, (2) A * 01: 01 allele, B * 37: 01 allele and C * 06: 02 allele of 604B1 iPS cells prepared in Experimental Example 11 Knockout clone # 3-11, (3) clone # 3-12, (4) 1383D2 iPS cells having the HLA haplotype of Table 29 below, (5) 604B1 iPS cells knocked out of B2M prepared in Experimental Example 18 (Clone # 1) was induced to differentiate into EB-derived blood cell-like cells.
- CD8-positive T cells collected by sorting from peripheral blood mononuclear cells (PBMC, model “LP — 266”, CTL, corresponding to the recipient C described above) having the HLA haplotypes shown in Table 30 below were CFSE ( Cayman Chemical Co., Ltd.) and co-cultured with EB-derived hematopoietic cells differentiated from the cells (1) to (5) described above in the presence of IL-2 and IFN- ⁇ for 8 days.
- FIGS. 27A to 27E are graphs showing the results of flow cytometry.
- FIGS. 27 (a) to (e) show the results of CD8 positive T cells co-cultured with EB-derived blood cell-like cells differentiated from the cells (1) to (5), respectively. As a result, it was confirmed that the T cell population specifically recognizing the HLA antigen of each iPS cell grew and CFSE became negative.
- CD8 positive T cells reactive to the HLA antigen of 604B1 iPS cells were prepared.
- Peripheral blood mononuclear cells (PBMC) -derived T cells are mixed with T cells that recognize various antigens.
- PBMC peripheral blood mononuclear cells
- CD8 positive T cells reactive to the HLA antigen of 604B1 iPS cells were stimulated to proliferate and recovered.
- FIG. 28 is a schematic diagram showing the procedure of this experimental example.
- 604B1 iPS cells were differentiated into EB-derived blood cell-like cells.
- EB-derived hematopoietic cells include CD45 positive white blood cells.
- CD8-positive T cells contained in PBMC were stained with CFSE (Cayman Chemical) and co-cultured with EB-derived hematopoietic cells differentiated from 604B1 iPS cells in the presence of IL-2 and IFN- ⁇ for 8 days. did.
- CFSE Cyman Chemical
- FIGS. 29A to 29E are graphs showing the results of flow cytometry.
- FIG. 29 (a) shows the result of co-culturing the PBMC cell population with a PBMC cell population which is an allogeneic (Allo), and FIG. 29 (b) is an EB-derived blood cell-like cell obtained by differentiating the PBMC cell population from 604B1 iPS cells.
- FIG. 29 (c) shows the result of culturing only the PBMC cell population, and FIG. 29 (d) differentiates CD8 positive T cells recovered from the PBMC cell population by sorting from 604B1 iPS cells.
- FIG. 29 (e) shows the results of culturing only CD8-positive T cells recovered from the PBMC cell population by sorting. As a result, it was confirmed that the T cell population that specifically recognizes the incompatible HLA antigen proliferated and became negative for CFSE.
- the CD8-positive T cells that became negative for CFSE shown in FIG. 29 (d) were sorted and collected to obtain T cells reactive to the HLA antigen of 604B1 iPS cells.
- FIG. 30 is a schematic diagram showing the procedure of this experimental example.
- 604B1 iPS cells having the HLA haplotype shown in Table 31 below (2) Clone # 8 knocked out of the A * 01: 01 allele and B * 07: 02 allele of 604B1 iPS cells prepared in Experimental Example 8 (3) The clone # 10 and (4) 1383D2 iPS cells (clone # 1) prepared in Experimental Example 17 and knocked out of B2M were induced to differentiate into cardiomyocytes, respectively.
- each cardiomyocyte was stimulated with IFN- ⁇ to induce expression of HLA protein. Subsequently, in order to perform a 51 Cr release assay described later, 51 Cr (chromium) was added to the medium and incorporated into each cardiomyocyte.
- CD8-positive T cells reactive to the HLA antigen of 604B1 iPS cells prepared in Experimental Example 22 were added to the medium of each cardiomyocyte at various ratios to examine whether or not each cardiomyocyte was attacked. did. That is, the HLA antigen-reactive CD8 T cells prepared in Experimental Example 22 were used as effector cells, and the iPS cell-derived cardiomyocytes described above were used as target cells. The ratio of the number of CD8 positive T cells to be added was 0.625, 1.25, 2.5, 5, 10 with respect to cardiomyocytes 1.
- the amount of 51 Cr contained in the supernatant of untreated cardiomyocytes after labeling with 51 Cr is defined as 0% Specific Lysis, and the cardiomyocytes labeled with 51 Cr with a surfactant (Triton-X)
- the amount of 51 Cr released into the supernatant when treated and killed was subtracted from the amount of 51 Cr released into the supernatant when culturing 51 Cr-labeled cardiomyocytes in a normal medium. It was defined as 100% Specific Lysis.
- FIG. 31 is a graph showing the rate at which each cardiomyocyte was damaged and dissolved.
- “*” indicates that there is a significant difference at P ⁇ 0.05
- “Non-edited” is the result of cardiomyocytes induced to differentiate from 604B1 iPS cells in (1) above.
- A1 - B7 - # 8 indicates that the result of differentiated cardiomyocytes derived from clone # 8 above (2)
- A1 - B7 - # 10 indicates that the clone # 10 that is the result of the differentiation induction cardiomyocytes
- 1383D2-B2M - # 1 indicates that the above (4) differentiated cardiomyocytes derived from 1383D2 iPS cells (clone # 1) was knocked out B2M of It shows that it is the result of.
- cardiomyocytes induced to differentiate from 1383D2 iPS cells knocked out of B2M were not damaged even when the ratio of effector CD8-positive T cells was increased.
- cardiomyocytes differentiated from clones # 8 and # 10 in which the A * 01: 01 and B * 07: 02 alleles of 604B1 iPS cells are knocked out, may increase the proportion of effector CD8-positive T cells. It became clear that there was no injury.
- T cell toxicity test 2 The same iPS cells (1) to (4) as in Experimental Example 23 were induced to differentiate into EB-derived blood cell-like cells, and a 51 Cr release assay was performed.
- 604B1 iPS cells (2) clone # 8 prepared in Experimental Example 7 in which the A * 01: 01 allele and B * 07: 02 allele of 604B1 iPS cells were knocked out, (3) the same clone # 10 (4)
- the 604B1 iPS cells (clone # 1) prepared in Experimental Example 18 and knocked out of B2M were induced to differentiate into EB-derived blood cells.
- EB-derived blood cell-like cells include blood cells.
- CD8-positive T cells reactive to the HLA antigen of 604B1 iPS cells prepared in Experimental Example 22 were added to the medium of each EB-derived blood cell-like cell at various ratios, and each EB-derived blood cell-like cell attacked. We examined whether it was done. That is, the HLA antigen-reactive CD8 T cells prepared in Experimental Example 21 were used as effector cells, and the EB-derived blood cell-like cells described above were used as target cells. The ratio of the number of CD8-positive T cells to be added was 0.625, 1.25, 2.5, 5, 10, and 20 with respect to EB-derived blood cell-like cells 1.
- FIG. 32 is a graph showing the rate at which each EB-derived blood cell-like cell was damaged and lysed.
- “*” indicates that there is a significant difference at P ⁇ 0.05
- “Non-edited” indicates the result of EB-derived blood cell-like cells induced to differentiate from 604B1 iPS cells in (1) above.
- each of the iPS cells of (2) to (4) above into EB-derived blood cell-like cells is due to the treatment with IFN- ⁇ , while maintaining the pluripotency of pluripotent stem cells. It shows that the expression of can be induced.
- Example 25 T cell toxicity test 3 The same examination as in Experimental Example 24 was performed except that iPS cells different from Experimental Example 24 were used.
- 585A1 iPS cells having the HLA haplotypes shown in Table 32 below (2) clone # 2 in which the B * 07: 02 allele and C * 07: 02 allele of the 585A1 iPS cell prepared in Experimental Example 9 were knocked out (3) Clone # 11, (4) Clone # 26, (5) B2M knocked out 604B1 iPS cells (clone # 1) produced in Experimental Example 18 were induced to differentiate into EB-derived blood cell-like cells, respectively. did.
- EB-derived blood cell-like cells include blood cells.
- peripheral blood mononuclear cells having the HLA haplotypes shown in Table 33 below are derived from each EB-derived blood cell-like cell medium.
- Effector CD8-positive T cells were added at various ratios to examine whether or not each EB-derived blood cell-like cell was attacked.
- CD8-positive T cells in PBMC that were negative for CFSE shown in FIG. 26 (a) of Experimental Example 20 were used after sorting.
- the target cell is each EB-derived blood cell-like cell described above.
- the ratio of the number of effector CD8-positive T cells to be added was 0.625, 1.25, 2.5, 5, 10, and 20 with respect to EB-derived blood cell-like cells 1.
- FIG. 33 is a graph showing the rate at which each EB-derived blood cell-like cell was damaged and lysed.
- “*” indicates that there is a significant difference at P ⁇ 0.05
- “Non-edited” indicates the result of EB-derived blood cell-like cells induced to differentiate from 585A1 iPS cells in (1) above.
- each iPS cell of (2) to (5) above could be induced to differentiate into an EB-derived blood cell-like cell because the IFN- ⁇ treatment maintained the pluripotency of the pluripotent stem cell while maintaining the HLA protein. It shows that the expression of can be induced.
- T cell toxicity test 4 604B1 iPS cells having the HLA haplotypes shown in Table 34 below, and 604B1 iPS cells (clone # 1) prepared in Experimental Example 18 and knocking out B2M, were converted to peripheral blood mononuclear cells having HLA haplotypes shown in Table 35 below ( PBMC, model “LP — 266”, CTL, which corresponds to the recipient C described above) was mixed with CFSE (Cayman Chemical) and co-cultured for 7 days.
- PBMC peripheral blood mononuclear cells having HLA haplotypes shown in Table 35 below
- PBMC peripheral blood mononuclear cells having HLA haplotypes shown in Table 35 below
- CFSE Cyman Chemical
- FIGS. 34A and 34B are graphs showing the results of flow cytometry.
- "604B1-B2M - # 1" indicates that the result of PBMC were co-cultured with 604B1 iPS cells knockout B2M (Clone # 1), "604B1" in , 604B1 shows the results of PBMC co-cultured with iPS cells.
- PBMC cocultured with 604B1 iPS cells (clone # 1) knocked out of B2M contained 11.3% of CD8 positive and CSFE negative T cells.
- PBMC co-cultured with 604B1 iPS cells contained 21.3% of CD8 positive and CSFE negative T cells.
- CD8 positive and CSFE negative cells were sorted and collected as effector CD8 positive T cells from PBMC co-cultured with 604B1 iPS cells shown in FIG. 34 (b).
- clone # 3 in which (1) 604B1 iPS cells and (2) A * 01: 01 allele, B * 37: 01 allele and C * 06: 02 allele of 604B1 iPS cells prepared in Experimental Example 11 were knocked out. -11, (3) The clone # 3-12 was induced to differentiate into EB-derived blood cell-like cells.
- EB-derived blood cell-like cells include blood cells.
- the collected effector CD8-positive T cells were added at various ratios to the medium of each EB-derived blood cell-like cell to examine whether or not each EB-derived blood cell-like cell was attacked. That is, the target cell is an EB-derived blood cell-like cell that is induced to differentiate from each of the cells (1) to (3).
- the ratio of the number of effector CD8-positive T cells to be added was 0.625, 1.25, 2.5, 5, 10, and 20 with respect to EB-derived blood cell-like cells 1.
- FIG. 34 (c) is a graph showing the rate at which each EB-derived blood cell-like cell was damaged and lysed.
- “*” indicates that there is a significant difference at P ⁇ 0.05
- “Non-edited” indicates EB-derived blood cell-like cells induced to differentiate from 604B1 iPS cells of (1) above. It indicates that the results of cell "A1 - B37 - C6 - # 3-11” indicates that the result of EB-derived blood-like cells induced to differentiate from clone # 3-11 above (2)
- “A1 ⁇ B37 ⁇ C6 ⁇ # 3-12” indicates the result of EB-derived blood cell-like cells induced to differentiate from clone # 3-12 in (3) above.
- 604B1 iPS cell A * 01: 01 allele, B * 37: 01 allele, and C * 06: 02 allele were knocked out and differentiated from clones # 3-11 and # 3-12. It was revealed that the cells were not damaged even when the proportion of effector CD8 positive T cells was increased.
- each iPS cell of (2) to (3) above could be induced to differentiate into an EB-derived blood cell-like cell because of the HLA protein while maintaining the pluripotency of the pluripotent stem cell by IFN- ⁇ treatment. It shows that the expression of can be induced.
- NK cell reactivity test 1 (1) 604B1 iPS cells having the HLA haplotypes shown in Table 36 below, (2) Clone # 8 knocked out of the A * 01: 01 allele and B * 07: 02 allele of 604B1 iPS cells prepared in Experimental Example 8; 3) Same clone # 10, (4) 1383D2 iPS cells having the HLA haplotype shown in Table 37 below, (5) 604B1 iPS cells (clone # 1) prepared in Experimental Example 18 and knocked out of B2M, respectively, EB-derived blood cells Differentiated into like cells.
- the EB-derived blood cell-like cells include CD45 positive white blood cells.
- CD56 positive cells were collected from PBMC having the HLA haplotype shown in Table 38 below (type “LP — 194”, corresponding to CTL, recipient A described above) by sorting. Subsequently, the recovered NK cells were co-cultured with each differentiated CD45-positive white blood cell in the presence of the anti-CD107a antibody. As a result, when NK cells are activated, they become CD107a positive. After co-culture, flow cytometry analysis was performed to determine the percentage of activated NK cells.
- FIGS. 35 (a) to (g) are graphs showing the results of flow cytometry analysis.
- FIG. 35 (a) shows the result of culturing and analyzing only NK cells.
- FIG. 35 (b) shows the results of analysis of NK cells co-cultured with EB-derived blood cell-like cells induced to differentiate from 604B1 iPS cells.
- FIG. 35 (c) shows the results of analysis of NK cells co-cultured with EB-derived hematopoietic cells induced to differentiate from clone # 8 in which the A * 01: 01 allele and B * 07: 02 allele of 604B1 iPS cells were knocked out. .
- FIG. 35 (a) shows the result of culturing and analyzing only NK cells.
- FIG. 35 (b) shows the results of analysis of NK cells co-cultured with EB-derived blood cell-like cells induced to differentiate from 604B1 iPS cells.
- FIG. 35 (c) shows the results of
- FIG. 35 (d) shows the results of analysis of NK cells co-cultured with EB-derived blood cell-like cells induced to differentiate from clone # 10.
- FIG. 35 (e) shows the results of analysis of NK cells co-cultured with EB-derived blood cell-like cells induced to differentiate from 1383D2 iPS cells.
- FIG. 35 (f) shows the results of analysis of NK cells co-cultured with EB-derived blood cell-like cells induced to differentiate from 604B1 iPS cells knocked out of B2M.
- FIG. 35 (g) shows the result of analysis of NK cells co-cultured with K562 cells known not to express HLA antigen as a positive control.
- NK cells co-cultured with K562 cells were activated.
- NK cells co-cultured with EB-derived blood cell-like cells induced to differentiate from 604B1 iPS cells that did not express HLA antigen and knocked out B2M were activated.
- the primers used for amplification of human NANOG cDNA and the primers used for amplification of human ACTB cDNA are shown in Table 39 below.
- FIG. 36 is a graph showing the results of quantitative PCR in which the expression level of the NANOG gene was measured.
- the expression level of the NANOG gene is shown as a relative value with the expression level of the NANOG gene relative to the ACTB gene as 1 in “untreated” 1383D2 cells.
- untreated indicates the result of iPS cells cultured under normal undifferentiated maintenance conditions without being treated with IFN- ⁇ , and “immediately after IFN” is immediately after treatment with IFN- ⁇ for 48 hours. "5 days later” indicates that the result was 5 days after treatment with IFN- ⁇ for 48 hours.
- AK03N medium StemFit, Ajinomoto
- iMatrix-511 Neppi
- FIGS. 37 (a) to (f) are photographs of the cells (1) to (5) taken with a phase contrast microscope.
- the scale bar is 1 mm.
- iPS cells that have been disrupted by the HLA allele or B2M allele and subjected to IFN- ⁇ treatment also form a flat colony characteristic of undifferentiated pluripotent stem cells and proliferate.
- This result indicates that pluripotency is maintained even when iPS cells are treated with IFN- ⁇ .
- This result also shows that pluripotency is maintained even when the HLA allele or B2M allele of iPS cells is destroyed.
- Induction of blood cell differentiation of iPS cells was performed as follows. First, undifferentiated iPS cells were seeded on an ultra-low adhesion culture plate (Corning), and 2 EBs (embryoplasts) were added in an AK03N medium containing Y-27633. Formed for days.
- human bFGF Oriental Yeast
- human VEGF R & D Systems
- ITS Insulin-Transferrin-Selenium, Thermo Fisher Scientific
- GlutaMax-I Thermo Fisher Scientific
- L-ascorbic Stem Pro-34 SFM culture medium Surfisch
- Stem Pro-34 SFM culture medium Surfisch
- Stem Pro-34 culture system Surfisch
- Stem Pro-34 culture system Stem Pro-34 culture system
- Stem Pro-34 culture system Surfischer
- Acid 2-phosphate squimagnesium salt hydrate Sigma
- 1-Thioglycerol MMG, Nacalai Tesque
- human BMP4 R & D Systems
- T cell toxicity test 5 (1) A cell (clone # 1) in which the B2M allele of the 1383D2 iPS cell having the HLA haplotype shown in Table 40 shown below was knocked out, and (2) a 585A1 iPS cell having the HLA haplotype shown in Table 41 below, The cells were stained with CFSE (Cayman Chemical) and co-cultured with peripheral blood mononuclear cells (PBMC, model “LP — 275”, CTL) having the HLA haplotype shown in Table 42 below for 7 days.
- CFSE Cyman Chemical
- PBMC peripheral blood mononuclear cells
- FIGS. 39A and 39B are graphs showing the results of flow cytometry.
- 39 (a) and (b) “1383D2 B2M-KO # 1” indicates the result of PBMC co-cultured with 1383D2 iPS cells (clone # 1) knocked out of B2M, and “585A1-WT”. "" Shows the result of PBMC co-cultured with 585A1 iPS cells.
- CD8-positive and CSFE-negative T cells were not present in PBMC co-cultured with 1383D2 iPS cells (clone # 1) knocked out of B2M.
- PBMC co-cultured with 585A1 iPS cells contained 24.4% of CD8 positive T cells that were activated and became CSFE negative.
- CD8 positive and CSFE negative cells were sorted and collected as effector CD8 positive T cells from PBMC co-cultured with 585A1 iPS cells shown in FIG. 39 (b).
- the collected effector CD8-positive T cells were added at various ratios to the medium of each EB-derived blood cell-like cell to examine whether or not each EB-derived blood cell-like cell was attacked. That is, the target cell is an EB-derived blood cell-like cell that has been induced to differentiate from each of the cells (1) to (4).
- the ratio of the number of effector CD8-positive T cells to be added was 0.625, 1.25, 2.5, 5, 10, and 20 with respect to EB-derived blood cell-like cells 1.
- FIG. 39 (c) is a graph showing the rate at which each EB-derived blood cell-like cell was damaged and lysed.
- “**” indicates that there is a significant difference at P ⁇ 0.01
- “WT” is the result of EB-derived blood cell-like cells induced to differentiate from the 585A1 iPS cells of (1) above.
- C7 # 3-1 indicates the result of EB-derived blood cell-like cells induced to differentiate from clone # 3-1 in (2) above
- C7 # 3-3 (3) shows that the result of EB-derived hematopoietic cells differentiated from clone # 3-3 in (3), where “B2M ⁇ ” was induced to differentiate from the B5M allele of 585A1 iPS cells in (4) above. It shows that it is a result of EB-derived blood cell-like cells.
- clones # 3-1 and # 3-3 were knocked out of the A * 24: 02 allele, B * 07: 02 allele, B * 52: 01 allele, and C * 12: 02 allele of 585A1 iPS cells.
- EB-derived hematopoietic cells induced by differentiation from EBs and EB-derived hematopoietic cells induced by differentiation from B2M alleles of 585A1 iPS cells should not be damaged even if the proportion of effector CD8-positive T cells is increased. Became clear.
- T cell toxicity test 6 (1) A cell (clone # 1) in which the B2M allele of the 1383D2 iPS cell having the HLA haplotype shown in Table 43 shown below was knocked out, and (2) a 585A1 iPS cell having the HLA haplotype shown in Table 44 below.
- Peripheral blood mononuclear cells (PBMC, model “LP — 329”, CTL) having the HLA haplotype shown in Table 45 below were co-cultured with those stained with CFSE (Cayman Chemical) for 7 days.
- FIGS. 40A and 40B are graphs showing the results of flow cytometry.
- 40 (a) and 40 (b) “1383D2 B2M-KO # 1” indicates the result of PBMC co-cultured with 1383D2 iPS cells (clone # 1) knocked out of B2M, and “585A1-WT”. Indicates the result of PBMC co-cultured with 585A1 iPS cells.
- CD8-positive and CSFE-negative T cells were not present in PBMC cocultured with 1383D2 iPS cells (clone # 1) knocked out of B2M.
- PBMC co-cultured with 585A1 iPS cells contained 11.7% of CD8 positive T cells that were activated and became CSFE negative.
- CD8-positive and CSFE-negative cells were sorted and collected as effector CD8-positive T cells from PBMC co-cultured with 585A1 iPS cells shown in FIG. 40 (b).
- the collected effector CD8-positive T cells were added at various ratios to the medium of each EB-derived blood cell-like cell to examine whether or not each EB-derived blood cell-like cell was attacked. That is, the target cell is an EB-derived blood cell-like cell that has been induced to differentiate from each of the cells (1) to (4).
- the ratio of the number of effector CD8-positive T cells to be added was 0.625, 1.25, 2.5, 5, 10, and 20 with respect to EB-derived blood cell-like cells 1.
- FIG. 40 (c) is a graph showing the rate at which each EB-derived blood cell-like cell was damaged and lysed.
- “**” indicates that there is a significant difference at P ⁇ 0.01
- “WT” is the result of EB-derived blood cell-like cells induced to differentiate from 585A1 iPS cells in (1) above.
- C7 # 3-1 indicates the result of EB-derived blood cell-like cells induced to differentiate from clone # 3-1 in (2) above
- C7 # 3-3 (3) shows that the result of EB-derived hematopoietic cells differentiated from clone # 3-3 in (3), where “B2M ⁇ ” was induced to differentiate from the B5M allele of 585A1 iPS cells in (4) above. It shows that it is a result of EB-derived blood cell-like cells.
- clones # 3-1 and # 3-3 were knocked out of the A * 24: 02 allele, B * 07: 02 allele, B * 52: 01 allele, and C * 12: 02 allele of 585A1 iPS cells.
- EB-derived blood cell-like cells induced to differentiate from EBs and EB-derived blood cell-like cells induced to differentiate from B83M allele of 1383D2 iPS cells should not be damaged even if the proportion of effector CD8-positive T cells is increased. Became clear.
- immunodeficient mice NOD.Cg-Rag1 tm1Mom Il2rg tm1Wjl / SzJ (NRG), The Jackson Laboratory , Inc.
- PBMC peripheral blood mononuclear cells
- luciferin a luciferase substrate
- IVIS imaging system trade name “ The fluorescence of EB-derived blood cell-like cells labeled with luciferase was photographed using IVIS Spectrum (SPI), and the survival rate of the transplanted cells was measured.
- FIG. 41 (a) is a diagram illustrating an experiment schedule.
- FIG. 41 (b) is a photograph showing the results of photographing fluorescence of EB-derived blood cell-like cells in each mouse.
- FIG. 41 (c) shows the relative results of calculating the survival rate of each EB-derived blood cell-like cell when effector CD8-positive T cells were administered to mice, assuming that the fluorescence intensity before T cell injection was 100%. It is a graph of a survival curve.
- WT indicates the result of EB-derived blood cell-like cells induced to differentiate from the 585A1 iPS cells of (1) above
- C7 # 3-1 indicates the above
- 2 shows the result of EB-derived hematopoietic cells differentiated from clone # 3-1
- Mock shows the result of administration of medium as a control
- T cell shows the result of peripheral blood It shows that it is a result of administering an effector CD8 positive T cell derived from a nuclear cell (PBMC, model “LP — 329”, CTL).
- NK cells CD56 positive cells
- PBMCs having the HLA haplotypes shown in Table 48 below model “LP — 275”, CTL
- the recovered NK cells were co-cultured with the cells (1) to (3) described above in the presence of the anti-CD107a antibody.
- flow cytometry analysis was performed to determine the percentage of activated NK cells.
- FIG. 42 (a) is a graph showing the results of flow cytometry analysis.
- “**” indicates that there is a significant difference at P ⁇ 0.01
- “WT” indicates the result of the 585A1 iPS cell of (1) above
- “C7 # “3-1” indicates the result of clone # 3-1 of (2) above
- “B2M ⁇ ” indicates the result of a cell knocked out of the B2M allele of 585A1 iPS cell of (3) above.
- NK cells activated with cells knocked out of the B2M allele were sorted and collected.
- K562 cells known not to express the HLA antigen (5) cells obtained by knocking out the B2M allele of 585A1 iPS cells prepared in Experimental Example 46 described later (bulk not subcloned) Cells), (6) cells obtained by knocking out the HLA-A allele, HLA-B allele and HLA-C allele of 585A1 iPS cells prepared in Experimental Example 47 described later (clone # 3-5, HLA-E, F) , G allele remains.), (7) A * 24: 02 allele, B * 07: 02 allele, B * 52: 01 allele, and C * 12 of 585A1 iPS cells prepared in Experimental Example 13.
- the above activated NK cells were used as effector cells, and the above cells (4) to (10) were used as target cells.
- the ratio of the number of NK cells to be added was 0.33, 1, and 3 with respect to the target cell 1.
- FIG. 42 (b) is a graph showing the rate at which each of the cells (4) to (10) described above was damaged and lysed.
- “*” indicates that there is a significant difference at P ⁇ 0.05
- “**” indicates that there is a significant difference at P ⁇ 0.01
- “K562” indicates “B2M ⁇ ” indicates the result of the knockout of the B2M allele of the 585A1 iPS cell of (5) above
- “A ⁇ B ⁇ C ⁇ “# 5” indicates the result of the cell (clone # 3-5) in which the HLA-A allele, HLA-B allele and HLA-C allele of (6) above were knocked out
- “C7 # 3-1” The result of clone # 3-1 in (7) above is shown
- “C7 # 3-3” shows the result of clone # 3-3 in (8) above
- “A ⁇ B ⁇ # 3 ” knocks out the HLA-A allele and HLA-B
- the cells in which the HLA-C allele remained were significantly more attacked by NK cells compared to the cells knocked out of B2M and the cells knocked out of the HLA-A allele, HLA-B allele and HLA-C allele. It became clear that it could be avoided.
- NK cells CD3-negative CD56-positive cells
- Table 51 model “LP — 329”, CTL
- the recovered NK cells were co-cultured with the cells (1) to (3) described above in the presence of the anti-CD107a antibody.
- flow cytometry analysis was performed to determine the percentage of activated NK cells.
- FIG. 43 (a) is a graph showing the results of flow cytometry analysis.
- “**” indicates that there is a significant difference at P ⁇ 0.01
- “WT” indicates the result of the 585A1 iPS cells of (1) above
- “C7 # “3-1” indicates the result of clone # 3-1 of (2) above
- “B2M ⁇ ” indicates the result of a cell knocked out of the B2M allele of 585A1 iPS cell of (3) above.
- NK cells activated with cells knocked out of the B2M allele were sorted and collected.
- K562 cells known not to express the HLA antigen (5) cells obtained by knocking out the B2M allele of 585A1 iPS cells prepared in Experimental Example 46 described later (bulk not subcloned) Cells), (6) cells obtained by knocking out the HLA-A allele, HLA-B allele and HLA-C allele of 585A1 iPS cells prepared in Experimental Example 47 described later (clone # 3-5, HLA-E, F) , G allele remains.), (7) A * 24: 02 allele, B * 07: 02 allele, B * 52: 01 allele, and C * 12 of 585A1 iPS cells prepared in Experimental Example 13.
- the above activated NK cells were used as effector cells, and the above cells (4) to (10) were used as target cells.
- the ratio of the number of NK cells to be added was 0.33, 1, and 3 with respect to the target cell 1.
- FIG. 43 (b) is a graph showing the rate at which each of the cells (4) to (10) described above was damaged and lysed.
- “**” indicates that there is a significant difference at P ⁇ 0.01
- “K562” indicates the result of the K562 cell of (4) above
- the cells in which the HLA-C allele remained were significantly more attacked by NK cells compared to the cells knocked out of B2M and the cells knocked out of the HLA-A allele, HLA-B allele and HLA-C allele. It became clear that it could be avoided.
- CD3 negative CD56 positive cells were obtained from PBMC having the HLA haplotype shown in Table 54 (model “LP — 118”, CTL) and PBMC having the HLA haplotype shown in Table 55 (model “LP — 266”, CTL). Each was collected by sorting. Subsequently, the recovered NK cells were co-cultured with the cells (1) to (4) described above in the presence of the anti-CD107a antibody. As a result, when NK cells are activated, they become CD107a positive. After co-culture, flow cytometry analysis was performed to determine the percentage of activated NK cells.
- FIG. 44 (a) and 44 (b) are graphs showing the results of flow cytometry analysis.
- FIG. 44 (a) shows the results of NK cells derived from PBMCs having the HLA haplotypes in Table 54 (model “LP — 118”, CTL), and
- FIG. 44 (b) shows PBMCs having HLA haplotypes in Table 55 (Table 55).
- the results of NK cells derived from type “LP — 266” (CTL) are shown.
- CTL LP — 266
- “**” indicates that there is a significant difference at P ⁇ 0.01
- “WT” indicates the result of 585A1 iPS cells of (1) above.
- C7 # 3-1 indicates the result of clone # 3-1 in (2) above
- B2M ⁇ indicates the result of the cell knocked out in B2M allele of 585A1 iPS cell in (3) above
- K562 indicates the result of the K562 cell of (4) above.
- mice (NOD.Cg-Rag1 tm1Mom Il2rg tm1Wjl / SzJ (NRG), The Jackson Laboratory , Inc.) were respectively transplanted each cell to.
- Table 56 shows the HLA haplotypes of PBMC (model “LP — 329”, CTL).
- luciferin a luciferase substrate
- IVIS imaging system Fluorescence of EB-derived blood cell-like cells labeled with luciferase was photographed using a trade name “IVIS Spectrum” (SPI), and the viability of the transplanted cells was measured.
- FIG. 45 (a) is a diagram illustrating an experiment schedule.
- FIG. 45 (b) is a photograph showing the results of photographing the fluorescence of EB-derived blood cell-like cells in each mouse.
- FIG. 45 (c) shows the survival rate of each EB-derived blood cell-like cell when NK cells are administered to a mouse, with the fluorescence intensity before NK cell injection as 100%, and further relative to each measurement time. It is a graph which shows the result of having calculated the survival rate by the following formula (F1).
- the unit of the vertical axis is (%).
- Relative survival rate (%) survival rate of NK cell administration group (%) / survival rate of control group (%) ⁇ 100 (F1)
- B2M ⁇ indicates the result of EB-derived hematopoietic cells induced to differentiate from cells knocked out of the B2M gene of 585A1 iPS cells in (1) above.
- # 3-1 indicates the result of the EB-derived blood cell-like cells induced to differentiate from clone # 3-1 in (2) above,
- “Mock” indicates the result of administration of the medium as a control,
- NK cells indicate the result of administration of activated NK cells derived from peripheral blood mononuclear cells (PBMC, model “LP — 329”, CTL).
- effector CD8-positive T cells collected by sorting from peripheral blood mononuclear cells (PBMC, model “LP — 275”, CTL) in the medium of each EB-derived blood cell-like cell in the same manner as in Experimental Example 31
- PBMC peripheral blood mononuclear cells
- activated NK cells sorted and recovered from PBMC were added at various ratios, and 51 Cr release assay was performed.
- the target cell is an EB-derived blood cell-like cell that has been induced to differentiate from each of the cells (1) to (3), and the effector cells are the above-mentioned CD8-positive T cells and activated NK cells.
- the ratio of the number of effector CD8-positive T cells to be added was 1, 3, and 9 with respect to the EB-derived blood cell-like cell 1.
- the ratio of the number of activated NK cells to be added was 0.33, 1, 3 with respect to the EB-derived blood cell-like cell 1.
- FIG. 46 is a graph showing the rate at which each EB-derived blood cell-like cell was damaged and lysed.
- “*” indicates that there is a significant difference at P ⁇ 0.05
- “**” indicates that there is a significant difference at P ⁇ 0.01
- “WT” indicates the above (1 ) From 585A1 iPS cells
- “C7 # 3-1” is a result of differentiation-induced EB-derived hematopoietic cells from clone # 3-1 in (2) above.
- B2M ⁇ indicates a result of EB-derived hematopoietic cells induced to differentiate from a cell obtained by knocking out the B2M allele of the 585A1 iPS cell in (3) above.
- the CIITA gene is a gene encoding a Class II Major Histocompatibility Complex Transactivator protein. As mentioned above, CIITA gene expression is known to be essential for class II HLA protein expression.
- FIG. 47 (a) is a table showing HLA haplotypes of 585A1-C7 remaining cells and 585A1-C7 remaining cells knocked out of the CIITA gene. By knocking out the CIITA gene, HLA-DP, HLA-DQ, HLA-DR, etc., which are class II HLA proteins, can be deleted.
- CIITA-ex3g5 target base sequence is shown in SEQ ID NO: 8017
- SEQ ID NO: 8017 is a sgRNA that cleaves the CIITA allele, together with purified Cas9 protein.
- a clone was obtained.
- Transfection was performed using a commercially available kit (trade name “4D-Nucleofector”, model “V4XP-4032”, Lonza).
- FIG. 47 (b) is a diagram showing the base mutation pattern of each subclone.
- “Clone ID” indicates a subclone name
- “WT” indicates a wild-type base sequence
- “ ⁇ ” indicates that it has a deletion mutation
- “+” Indicates that it had an insertion mutation.
- FIG. 47 (c) shows the base sequence of clone # 3-1-3 as a representative example.
- CD4 positive T cell activation test CD4 positive T cells were collected from peripheral blood mononuclear cells (PBMC) derived from healthy volunteer # 21 by sorting and stained with CFSE (Cayman Chemical).
- PBMC peripheral blood mononuclear cells
- the CD4 positive T cells were (1) 585A1 iPS cells, (2) A * 24: 02 alleles, B * 07: 02 alleles, B * 52: 585A1 iPS cells prepared in Experimental Example 13. Clone # 3-1 knocked out of 01 allele and C * 12: 02 allele (hereinafter sometimes referred to as “585A1-C7 residual cells”), (3) 585A1-C7 residual cells prepared in Experimental Example 39 Cells (clone # 3-1-3) in which CIITA gene was knocked out were mixed and co-cultured for 1 week. For comparison, (4) a group in which only the CD4-positive T cells were cultured alone for 1 week was also prepared.
- 48 (a) to (d) are graphs showing the results of flow cytometry.
- 48 (a) to 48 (d) “Mock” indicates that only the CD4 positive T cell of (4) above was cultured alone, and “585A1-WT” represents the 585A1 iPS of (1) above.
- 585A1-C7 # 3-1 indicates the result of 585A1-C7 remaining cells in (2) above, and “585A1-C7 + CIITA ⁇ # 3-1-3” indicates This shows that the results are for the cells (clone # 3-1-3) in which the CIITA gene of 585A1-C7 remaining cells in (3) above was knocked out.
- CD4 positive T cells derived from healthy volunteer # 21 and CIITA gene knockout cells (clone # 3-1-3) of 585A1-C7 remaining cells were co-cultured. It was also revealed that CD4 positive T cells are not activated.
- the PBMCs described above were (1) 585A1 iPS cells, (2) A * 24: 02 alleles, B * 07: 02 alleles, B * 52: 01 alleles of 585A1 iPS cells prepared in Experimental Example 13. And C * 12: 02 allele knocked out clone # 3-1 (hereinafter sometimes referred to as “585A1-C7 residual cells”), (3) CIITA gene of 585A1-C7 residual cells prepared in Experimental Example 39 Knockout cells (clone # 3-1-3), (4) EB-derived hematopoietic cells differentiated from each cell of clone # 3-1-6, and (5) not expressing HLA antigen Known K562 cells were mixed and co-cultured for 1 week. For comparison, (6) a group was also prepared in which only the above PBMC was cultured alone for 1 week.
- 49 (a) to 49 (c) are graphs showing the results of flow cytometry.
- 49 (a) to 49 (c) “Mock” indicates the result of culturing only the PBMC of (6) above, and “585A1-WT” is differentiated from the 585A1 iPS cells of (1) above.
- 585A1-C7 # 3-1” indicates the result of EB-derived blood cell-like cells induced to differentiate from the 585A1-C7 residual cells of (2) above.
- “585A1-C7 + CIITA ⁇ # 3-1-3” indicates that EB-derived blood cell-like cells induced to differentiate from cells (clone # 3-1-3) in which the CIITA gene of 585A1-C7 residual cells in (3) above was knocked out. indicates that the results, "585A1-C7 + CIITA - # 3-1-6" knocked out CIITA gene 585A1-C7 remaining cells of (4) Indicates that the cells (clone # 3-1-6) Results of EB-derived blood-like cells induced to differentiate from "K562" indicates a result of K562 cells (5).
- CD8-positive T cells react with EB-derived blood cell-like cells induced to differentiate from 585A1 iPS cells, and 51.0% of CD8-positive T cells are activated to produce CFSE. It became clear that it became negative. In contrast, it was revealed that only 2% or less of CD8-positive T cells were activated even when co-cultured with cells other than EB-derived blood cell-like cells induced to differentiate from 585A1 iPS cells.
- CD4-positive T cells react with EB-derived blood cell-like cells induced to differentiate from 585A1 iPS cells and EB-derived blood cell-like cells induced to differentiate from 585A1-C7 residual cells, respectively. It was revealed that 49.2% and 26.7% of CD4 positive T cells were activated and became CFSE negative. On the other hand, it was revealed that only 2% or less of CD4-positive T cells were activated even when co-cultured with other cells.
- NK cells reacted with K562 cells, and 79.2% of NK cells were activated and became CFSE negative. On the other hand, even when co-cultured with other cells, only 7% or less of NK cells were activated.
- FIGS. 50A to 50C are diagrams for explaining the procedure of this experimental example.
- FIG. 50 (a) is a diagram illustrating a procedure in which the HLA-A allele, the HLA-B allele, and the CIITA allele are knocked out in one step.
- FIGS. 50B and 50C are diagrams illustrating a procedure in which the HLA-A allele, the HLA-B allele, and the CIITA allele are knocked out in two stages.
- Af-Xt-28s05 iPS cells are sgRNA that can target the HLA-A allele, A-ex3-g1 (target base).
- the sequence is shown in SEQ ID NO: 55
- B-ex2-g1 which is an sgRNA that can target the HLA-B allele
- the target nucleotide sequence is shown in SEQ ID NO: 53
- the CIITA allele is targeted.
- CIITA-ex3g5 target base sequence is shown in SEQ ID NO: 8017
- SEQ ID NO: 8017 which is an sgRNA capable, and purified Cas9 protein were transfected. Transfection was performed using a commercially available kit (trade name “4D-Nucleofector”, model “V4XP-4032”, Lonza).
- FIG. 51A is a graph showing the results of flow cytometry.
- “No stain” indicates the analysis result of iPS cells not stained with the antibody
- “No TF” indicates the analysis result of iPS cells into which sgRNA was not introduced.
- HLA-A-ex3g1 is the result of introducing A-ex3-g1 (target base sequence is shown in SEQ ID NO: 55)
- HLA-B-ex2g1 is B-ex2- g1 (target base sequence is shown in SEQ ID NO: 53)
- CIITA-ex3g5 target base sequence is shown in SEQ ID NO: 8017
- FIG. 51 (b) is a diagram showing the base mutation pattern of each subclone.
- “Clone ID” indicates a subclone name
- “WT” indicates a wild-type base sequence
- “ ⁇ ” indicates that it has a deletion mutation
- “+” Indicates that it had an insertion mutation
- “ND” indicates that the nucleotide sequence was not determined.
- “ABTo” in the subclone name means that the HLA-A allele, HLA-B allele and CIITA allele were knocked out.
- Ff-Xt-28s05 iPS cells are sgRNA capable of targeting the HLA-A allele, A-ex3-g1 (target base).
- the sequence is shown in SEQ ID NO: 55
- B-ex2-g1 which is an sgRNA that can target the HLA-B allele (the target base sequence is shown in SEQ ID NO: 53)
- purified Cas9 protein Seventeen subclones were obtained. Transfection was performed using a commercially available kit (trade name “4D-Nucleofector”, model “V4XP-4032”, Lonza).
- FIG. 52 (a) shows the base mutation pattern of each subclone.
- “Clone ID” indicates a subclone name
- “WT” indicates a wild-type base sequence
- “ ⁇ ” indicates that it has a deletion mutation
- “+” Indicates that it had an insertion mutation
- “Mut.” Indicates that it had a substitution mutation.
- “ABo” in the subclone name means that the HLA-A allele and the HLA-B allele were knocked out.
- clone # 14 was obtained in which an insertion deletion mutation (Indel mutation) was detected in both the HLA-A allele and the HLA-B allele.
- CIITA-ex3g5 target base sequence is shown in SEQ ID NO: 8017
- SEQ ID NO: 8017 a sgRNA capable of targeting the CIITA allele to the obtained clone # 14 and purified Cas9.
- the protein was transfected to obtain 12 subclones. Transfection was performed using a commercially available kit (trade name “4D-Nucleofector”, model “V4XP-4032”, Lonza).
- FIG. 52 (b) shows the base mutation pattern of each subclone.
- “Clone ID” indicates a subclone name
- “WT” indicates a wild-type base sequence
- “ ⁇ ” indicates that it has a deletion mutation
- “+” Indicates that it had an insertion mutation
- “ND” indicates that the nucleotide sequence was not determined.
- “ABo_To” in the subclone name means that the HLA-A allele and the HLA-B allele were knocked out and subcloned once, and then the CIITA allele was knocked out.
- FIG. 53 is a table showing the allele frequencies of HLC-C alleles in various races.
- JPN indicates Japanese
- EUR indicates European American
- AFA indicates African American
- API indicates Asian
- HIS indicates Hispanic.
- Allele frequency indicates the frequency (%) of alleles in each race, and “Rank” indicates the order from the highest frequency.
- the cells lacking the HLA-A allele and the HLA-B allele and having any of the above 12 types of HLA-C alleles, or the HLA-A allele, the HLA-B allele and the CIITA allele are deleted.
- the cells having any of the above 12 types of HLA-C alleles are very useful as cells for cell therapy and regenerative medicine.
- the cell is not particularly limited as long as it is a cell used for cell therapy, and may be a pluripotent stem cell or a differentiated cell. Specifically, for example, iPS cells, T cells, hematopoietic stem cells, mesenchymal stem cells and the like may be used.
- Ff-Xt-28s05 iPS cells were transfected with B2M-g2 (target base sequence is shown in SEQ ID NO: 60), which is a sgRNA capable of targeting the B2M allele, and purified Cas9 protein.
- B2M-g2 target base sequence is shown in SEQ ID NO: 60
- sgRNA capable of targeting the B2M allele
- purified Cas9 protein obtained from the B2M allele
- Got. Transfection was performed using a commercially available kit (trade name “4D-Nucleofector”, model “V4XP-4032”, Lonza).
- FIG. 54 is a diagram showing a base mutation pattern of each subclone.
- “Clone ID” indicates the name of the subclone
- “WT” indicates that it was a wild-type base sequence
- “ ⁇ ” indicates that it had a deletion mutation
- “+” Indicates that it had an insertion mutation.
- “Mo” in the subclone name means that the B2M allele was knocked out.
- B2M-g2 which is a sgRNA capable of targeting the B2M allele (target base sequence is shown in SEQ ID NO: 60)
- CIITA which is a sgRNA capable of targeting the CIITA allele -Ex3g5 (target base sequence is shown in SEQ ID NO: 8017)
- purified Cas9 protein were transfected to obtain 19 subclones. Transfection was performed using a commercially available kit (trade name “4D-Nucleofector”, model “V4XP-4032”, Lonza).
- FIG. 55 is a diagram showing a base mutation pattern of each subclone.
- “Clone ID” indicates a subclone name
- “WT” indicates a wild-type base sequence
- “ ⁇ ” indicates that it has a deletion mutation
- “+” Indicates that it had an insertion mutation.
- “MTo” in the subclone name means that the B2M allele and the CIITA allele were knocked out in one step.
- clone # 2 In clone # 2, it was revealed that only one of the B2M alleles was knocked out and both CIITA alleles were knocked out. Therefore, clone # 2 was obtained as a cell line in which only the CIITA allele was substantially knocked out.
- Ff-Xt-28s05-MTo # 2 iPS cells were stimulated with 50 ng / mL IFN- ⁇ for 48 hours, and then stained with anti-HLA-ABC antibody (product number: 31418, BIOLEGEND) to perform flow cytometry analysis. And the expression of HLA-A protein, HLA-B protein and HLA-C protein was examined.
- 56 (a) and 56 (b) are graphs showing the results of flow cytometry.
- “No stain” indicates the analysis result of iPS cells not stained with the antibody.
- “Ff-Xt-28s05-MTo # 2” indicates the analysis result of Ff-Xt-28s05-MTo # 2 iPS cells.
- Ff-Xt-28s05-MTo # 2 iPS cells maintained the expression ability of HLA-A protein, HLA-B protein and HLA-C protein.
- FIG. 57 is a graph showing the results of flow cytometry.
- “No stain” indicates an analysis result of iPS cells not stained with an antibody
- “No TF” indicates an analysis result of iPS cells into which sgRNA was not introduced
- “B2M” indicates an analysis result of iPS cells into which this sgRNA was introduced and the B2M allele was knocked out.
- the proportion of the cell population in which all of HLA-A protein, HLA-B protein and HLA-C protein were negative was 27.0%.
- the cell population obtained by introducing B2M-g2 sgRNA and negative for HLA-A, HLA-B, and HLA-C was collected by sorting. Subcloning was not performed here.
- HLA allele specific knockout 10 585A1 iPS cell HLA-A allele, HLA-B allele and HLA-C allele were knocked out. Specifically, purified Cas9 protein was added to cells (clone # 3) in which the A * 24: 02 allele, B * 07: 02 allele and B * 52: 01 allele of 585A1 iPS cells prepared in Experimental Example 13 were knocked out. C * 07: 02 allele specific sgRNA and C * 12: 02 allele specific sgRNA were transfected.
- C0702-ex3-g3 (target base sequence is shown in SEQ ID NO: 49) was used as the C * 07: 02 allele-specific sgRNA. Further, C1202-ex3-g1 (the target base sequence is shown in SEQ ID NO: 50) was used as the C * 12: 02 allele-specific sgRNA.
- a commercially available kit (trade name “4D-Nucleofector”, model “V4XP-4032”, Lonza) was used for transfection.
- FIG. 58 is a diagram showing the base mutation pattern of each collected clone. 58, “Clone ID” indicates a subclone name, “HLA-C07” indicates an HLA-C * 07: 02 allele, “HLA-C12” indicates an HLA-C * 12: 02 allele, “WT” indicates that the nucleotide sequence was a wild type, “ ⁇ ” indicates that it had a deletion mutation, and “+” indicates that it had an insertion mutation. As a result, it was confirmed that both alleles of HLA-C were knocked out in clones # 3-4, # 3-5, # 3-6, and # 3-7.
- C0702-ex3-g3 (target base sequence is shown in SEQ ID NO: 49) was used as the C * 07: 02 allele-specific sgRNA.
- a commercially available kit (trade name “4D-Nucleofector”, model “V4XP-4032”, Lonza) was used for transfection.
- FIG. 59 is a diagram showing the base mutation pattern of each collected clone.
- “Clone ID” indicates the subclone name
- “HLA-C07” indicates the HLA-C * 07: 02 allele
- “HLA-C12” indicates the HLA-C * 12: 02 allele
- “WT” indicates a wild-type nucleotide sequence
- “+” indicates that it had an insertion mutation.
- clones # 3-1, # 3-2, # 3-3, # 3-5, and # 3-6 were knocked out of the HLA-C * 07: 02 allele and the HLA-C * 12: 02 allele Only the remaining clone was confirmed.
- the cells prepared in this experimental example can be used as one of these 12 types of cells.
- Example 49 HLA allele specific knockout 12 Purification into cells (clone # 4) knocked out of the A * 01: 01 allele, A * 24: 02 allele, B * 07: 02 allele and B * 37: 01 allele of 604B1 iPS cells prepared in Experimental Example 14 Cas9 protein and C * 07: 02 allele specific sgRNA were transfected.
- C0702-ex3-g3 (target base sequence is shown in SEQ ID NO: 49) was used as the C * 07: 02 allele-specific sgRNA.
- a commercially available kit (trade name “4D-Nucleofector”, model “V4XP-4032”, Lonza) was used for transfection.
- FIG. 60 is a diagram showing the base mutation pattern of each collected clone.
- “Clone ID” indicates a subclone name
- “HLA-C06” indicates an HLA-C * 06: 02 allele
- “HLA-C07” indicates an HLA-C * 07: 02 allele
- “WT” indicates that the nucleotide sequence was a wild type
- “ ⁇ ” indicates that it had an insertion mutation
- “+” indicates that it had an insertion mutation.
- clones # 4-2, # 4-6, # 4-10, and # 4-11 were clones in which the HLA-C * 07: 02 allele was knocked out and only the HLA-C * 06: 02 allele remained. It was confirmed that there was.
- the cells prepared in this experimental example can be used as one of these 12 types of cells.
Landscapes
- Health & Medical Sciences (AREA)
- Life Sciences & Earth Sciences (AREA)
- Engineering & Computer Science (AREA)
- Chemical & Material Sciences (AREA)
- Biomedical Technology (AREA)
- Genetics & Genomics (AREA)
- Organic Chemistry (AREA)
- Zoology (AREA)
- Immunology (AREA)
- Wood Science & Technology (AREA)
- Biotechnology (AREA)
- Molecular Biology (AREA)
- Bioinformatics & Cheminformatics (AREA)
- General Health & Medical Sciences (AREA)
- Microbiology (AREA)
- Biochemistry (AREA)
- General Engineering & Computer Science (AREA)
- Cell Biology (AREA)
- Medicinal Chemistry (AREA)
- Physics & Mathematics (AREA)
- Proteomics, Peptides & Aminoacids (AREA)
- Analytical Chemistry (AREA)
- Biophysics (AREA)
- Transplantation (AREA)
- Urology & Nephrology (AREA)
- Hematology (AREA)
- Developmental Biology & Embryology (AREA)
- Pathology (AREA)
- Plant Pathology (AREA)
- General Physics & Mathematics (AREA)
- Food Science & Technology (AREA)
- Tropical Medicine & Parasitology (AREA)
- Virology (AREA)
- Veterinary Medicine (AREA)
- Animal Behavior & Ethology (AREA)
- Public Health (AREA)
- Epidemiology (AREA)
- Pharmacology & Pharmacy (AREA)
- Mycology (AREA)
- Toxicology (AREA)
Abstract
Description
[1]レシピエントに他家移植した場合の拒絶反応が低減された低抗原性細胞を、ドナー細胞から製造する製造方法であって、前記ドナー細胞及び前記レシピエントのHuman Leukocyte Antigen(HLA)アレルをそれぞれ決定することと、前記レシピエントに存在せず前記ドナー細胞に存在するHLAアレルを特定することと、特定された前記HLAアレルを破壊又は改変し、前記ドナー細胞に特異的なHLAタンパク質を発現しない細胞を含む細胞集団を得ることと、を含み、前記ドナー細胞に特異的なHLAタンパク質を発現しない細胞が前記低抗原性細胞である、製造方法。
[2]前記ドナー細胞及び前記レシピエントの前記HLAアレルをそれぞれ決定することにおいて決定される前記HLAアレルが、HLA-Aアレル、HLA-Bアレル及びHLA-Cアレルを含む、[1]に記載の製造方法。
[3]前記ドナー細胞に特異的なHLAタンパク質を発現しない細胞を含む細胞集団を得ることの後に、前記細胞集団から前記ドナー細胞に特異的なHLAタンパク質を発現しない細胞を回収することを更に含み、前記回収することが、前記細胞集団にHLAタンパク質発現誘導剤を接触させることと、前記HLAタンパク質発現誘導剤に接触した前記細胞集団における前記ドナー細胞に特異的なHLAタンパク質の発現を指標として、前記細胞集団から前記ドナー細胞に特異的なHLAタンパク質を発現しない細胞を回収することと、を含む、[1]又は[2]に記載の製造方法。
[4]前記HLAタンパク質発現誘導剤が、インターフェロン(IFN)-γ、IFN-α、IFN-β、インターロイキン(IL)-4、Granulocyte Macrophage colony-stimulating Factor(GM-CSF)、Transforming growth factor(TGF)-α又はTGF-βである、[3]に記載の製造方法。
[5]前記低抗原性細胞が多能性幹細胞である、[1]~[4]のいずれかに記載の製造方法。
[6]HLAタンパク質発現誘導剤を含む、レシピエントに他家移植した場合の拒絶反応が低減された低抗原性細胞の検出用キット。
[7]前記HLAタンパク質発現誘導剤が、IFN-γ、IFN-α、IFN-β、IL-4、GM-CSF、TGF-α又はTGF-βである、[6]に記載のキット。
[8]前記低抗原性細胞が多能性幹細胞である、[6]又は[7]に記載のキット。
[9]IFN-γ、IFN-α、IFN-β、IL-4、GM-CSF、TGF-α又はTGF-βからなるHLAタンパク質発現誘導剤。
[10]少なくとも1つのHLAアレルが破壊又は改変され、少なくとも1種のHLAタンパク質を発現可能な細胞。
[11]前記HLAアレルが、HLA-Aアレル、HLA-Bアレル又はHLA-Cアレルを含む、[10]に記載の細胞。
[12]レシピエントに他家移植した場合の拒絶反応が低減された低抗原性細胞であり、破壊又は改変された前記HLAアレルが、前記レシピエントに存在しないHLAアレルである、[10]又は[11]に記載の細胞。
[13]多能性幹細胞である、[10]~[12]のいずれかに記載の細胞。
[14]Class II Major Histocompatibility Complex Transactivator(CIITA)アレル、Regulatory Factor X5(RFX5)アレル、Regulatory Factor X Associated Protein(RFXAP)アレル及びRegulatory Factor X Associated Ankyrin Containing Protein(RFXANK)アレルのうち少なくとも1つのアレルが更に破壊又は改変されている、[10]~[13』のいずれかに記載の細胞。
[15]HLA-Aアレル及びHLA-Bアレルが破壊され、少なくとも1種のHLA-Cタンパク質を発現可能な、[10]~[14]のいずれかに記載の細胞。
[16]前記HLA-Cタンパク質が、HLA-C*01:02アレル、HLA-C*02:02アレル、HLA-C*03:03アレル、HLA-C*03:04アレル、HLA-C*04:01アレル、HLA-C*05:01アレル、HLA-C*06:02アレル、HLA-C*07:01アレル、HLA-C*07:02アレル、HLA-C*08:01アレル、HLA-C*12:02アレル及びHLA-C*16:01アレルからなる群より選択される1種のアレルにコードされるタンパク質である、[15]に記載の細胞。
[17]レシピエントに他家移植した場合の拒絶反応が低減された低抗原性細胞を、ドナー細胞から製造する製造方法であって、前記ドナー細胞のCIITAアレル、RFX5アレル、RFXAPアレル及びRFXANKアレルのうち少なくとも1つ以上を含むアレルを破壊又は改変すること、を含み、前記CIITAアレル、RFX5アレル、RFXAPアレル又はRFXANKアレルが破壊又は改変された細胞が前記低抗原性細胞である、製造方法。
[18]前記低抗原性細胞が多能性幹細胞である、[17]に記載の細胞。
[19]CIITAアレル、RFX5アレル、RFXAPアレル及びRFXANKアレルのうち少なくとも1つ以上を含むアレルが破壊又は改変された細胞。
[20]多能性幹細胞である、[19]に記載の細胞。
[21]全HLAハプロタイプのゲノムDNAの塩基配列データに対してマッピングした場合に1つの標的とするHLAハプロタイプにしかマッピングされず、HLAアレル以外の全ゲノムDNAの塩基配列データに対してマッピングした場合にマッピングされない塩基配列を、標的塩基配列とするgRNA。
[22]前記標的塩基配列が、配列番号3、4、7、45~52、72~2459のいずれかに記載の塩基配列、又は配列番号3、4、7、45~52、72~2459のいずれかに記載の塩基配列の5’末端において、1若しくは数個の塩基が欠失、置換若しくは付加された塩基配列からなる、[21]に記載のgRNA。
[23]前記標的塩基配列が、配列番号3、4、7、45~52のいずれかに記載の塩基配列、又は配列番号3、4、7、45~52のいずれかに記載の塩基配列の5’末端において、1若しくは数個の塩基が欠失、置換若しくは付加された塩基配列からなる、[21]又は[22]に記載のgRNA。
[24]前記標的塩基配列が、HLA遺伝子のエクソン2又は3にマッピングされる、[21]~[23]のいずれかに記載のgRNA。
[25]全HLAハプロタイプのゲノムDNAの塩基配列データに対してマッピングした場合に2つ以上の標的とするHLAハプロタイプにマッピングされ、HLAアレル以外の全ゲノムDNAの塩基配列データに対してマッピングした場合にマッピングされない塩基配列を、標的塩基配列とするgRNA。
[26]前記標的塩基配列が、配列番号53~55、2460~8013のいずれかに記載の塩基配列、又は配列番号53~55、2460~8013のいずれかに記載の塩基配列の5’末端において、1若しくは数個の塩基が欠失、置換若しくは付加された塩基配列からなる、[25]に記載のgRNA。
[27]前記標的塩基配列が、配列番号53~55のいずれかに記載の塩基配列、又は配列番号53~55のいずれかに記載の塩基配列の5’末端において、1若しくは数個の塩基が欠失、置換若しくは付加された塩基配列からなる、[25]又は[26]に記載のgRNA。
[28]前記標的塩基配列が、HLA遺伝子のエクソン2又は3にマッピングされる、[25]~[27]のいずれかに記載のgRNA。
[29]レシピエントに他家移植した場合の拒絶反応が低減された低抗原性細胞をゲノム編集により製造するための標的塩基配列の特定方法であって、全HLAハプロタイプのゲノムDNAの塩基配列データに対して、候補塩基配列をマッピングすることと、HLAアレル以外の全ゲノムDNAの塩基配列データに対して、前記候補塩基配列をマッピングすることと、全HLAハプロタイプのゲノムDNAの塩基配列データに対してマッピングした場合に1つの標的とするHLAハプロタイプにしかマッピングされず、HLAアレル以外の全ゲノムDNAの塩基配列データに対してマッピングした場合にマッピングされない前記候補塩基配列を、標的塩基配列として特定することと、を含む、方法。
[30]レシピエントに他家移植した場合の拒絶反応が低減された低抗原性細胞をゲノム編集により製造するための標的塩基配列の特定方法であって、全HLAハプロタイプのゲノムDNAの塩基配列データに対して、候補塩基配列をマッピングすることと、HLAアレル以外の全ゲノムDNAの塩基配列データに対して、前記候補塩基配列をマッピングすることと、全HLAハプロタイプのゲノムDNAの塩基配列データに対してマッピングした場合に2つ以上の標的とするHLAハプロタイプにマッピングされ、HLAアレル以外の全ゲノムDNAの塩基配列データに対してマッピングした場合にマッピングされない前記候補塩基配列を、標的塩基配列として特定することと、を含む、方法。 The present invention includes the following aspects.
[1] A method for producing low antigenic cells with reduced rejection when transplanted into a recipient from a donor cell, wherein the donor cell and the recipient's Human Leukocyte Antigen (HLA) allele Determining an HLA allele that is not present in the recipient and is present in the donor cell, destroying or modifying the identified HLA allele, and providing an HLA protein specific to the donor cell Obtaining a cell population containing cells that do not express, wherein the cells that do not express HLA protein specific for the donor cells are the low antigenic cells.
[2] The [1], wherein the HLA allele determined in determining the donor cell and the recipient's HLA allele includes an HLA-A allele, an HLA-B allele and an HLA-C allele, respectively. Manufacturing method.
[3] After obtaining a cell population containing cells that do not express HLA protein specific for the donor cells, further comprising recovering cells that do not express HLA protein specific for the donor cells from the cell population. The recovery comprises contacting the cell population with an HLA protein expression inducer, and using as an index the expression of HLA protein specific to the donor cell in the cell population in contact with the HLA protein expression inducer, Recovering cells that do not express HLA protein specific to the donor cells from the cell population, [1] or [2].
[4] The HLA protein expression inducer is interferon (IFN) -γ, IFN-α, IFN-β, interleukin (IL) -4, Granulocyte Macrophage colony-stimulating Factor (GM-CSF), Transforming growth factor (GM). The production method of [3], which is TGF) -α or TGF-β.
[5] The production method according to any one of [1] to [4], wherein the low antigenic cell is a pluripotent stem cell.
[6] A kit for detecting a low antigenic cell with reduced rejection when transplanted to a recipient, including an HLA protein expression inducer.
[7] The kit according to [6], wherein the HLA protein expression inducer is IFN-γ, IFN-α, IFN-β, IL-4, GM-CSF, TGF-α, or TGF-β.
[8] The kit according to [6] or [7], wherein the low antigenic cell is a pluripotent stem cell.
[9] An HLA protein expression inducer comprising IFN-γ, IFN-α, IFN-β, IL-4, GM-CSF, TGF-α or TGF-β.
[10] A cell in which at least one HLA allele is disrupted or modified to express at least one HLA protein.
[11] The cell according to [10], wherein the HLA allele comprises an HLA-A allele, an HLA-B allele, or an HLA-C allele.
[12] Low antigenic cells with reduced rejection when transplanted to a recipient, and the HLA allele destroyed or modified is an HLA allele that is not present in the recipient [10] or [11] The cell according to [11].
[13] The cell according to any one of [10] to [12], which is a pluripotent stem cell.
[14] Class II Major Histocompatibility Complex Transactivator (CIITA) alleles, Regulatory Factor X5 (RFX5) alleles, Regulatory Factor X Associated Protein (RFXAP) allele and Regulatory Factor X Associated Ankyrin Containing Protein (RFXANK) at least one allele of the allele The cell according to any one of [10] to [13], which is further destroyed or modified.
[15] The cell according to any one of [10] to [14], wherein the HLA-A allele and the HLA-B allele are disrupted and can express at least one HLA-C protein.
[16] The HLA-C protein is HLA-C * 01: 02 allele, HLA-C * 02: 02 allele, HLA-C * 03: 03 allele, HLA-C * 03: 04 allele, HLA-C * 04:01 allele, HLA-C * 05: 01 allele, HLA-C * 06: 02 allele, HLA-C * 07: 01 allele, HLA-C * 07: 02 allele, HLA-C * 08: 01 allele, The cell according to [15], which is a protein encoded by one allele selected from the group consisting of the HLA-C * 12: 02 allele and the HLA-C * 16: 01 allele.
[17] A method for producing a low antigenic cell with reduced rejection when transplanted into a recipient from a donor cell, the CIITA allele, the RFX5 allele, the RFXAP allele and the RFXANK allele of the donor cell. A cell comprising the CIITA allele, the RFX5 allele, the RFXAP allele or the RFXANK allele destroyed or modified, which is the low antigenic cell.
[18] The cell according to [17], wherein the low antigenic cell is a pluripotent stem cell.
[19] A cell in which an allele comprising at least one of CIITA allele, RFX5 allele, RFXAP allele and RFXANK allele is destroyed or modified.
[20] The cell according to [19], which is a pluripotent stem cell.
[21] When mapping to the base sequence data of genomic DNA of all HLA haplotypes, mapping to only one target HLA haplotype, and mapping to base sequence data of all genomic DNA other than HLA alleles A gRNA having a base sequence that is not mapped to a target base sequence.
[22] The target base sequence is any one of SEQ ID NOs: 3, 4, 7, 45 to 52, 72 to 2459, or SEQ ID NOs: 3, 4, 7, 45 to 52, and 72 to 2459. The gRNA according to [21], comprising a base sequence in which one or several bases have been deleted, substituted or added at the 5 ′ end of any one of the base sequences.
[23] The target base sequence of the base sequence described in any of SEQ ID NOs: 3, 4, 7, 45 to 52, or the base sequence described in any of SEQ ID NOs: 3, 4, 7, 45 to 52 The gRNA according to [21] or [22], comprising a base sequence in which one or several bases are deleted, substituted or added at the 5 ′ end.
[24] The gRNA according to any of [21] to [23], wherein the target base sequence is mapped to
[25] When mapping to base sequence data of genomic DNA of all HLA haplotypes, mapping to two or more target HLA haplotypes and mapping to base sequence data of total genomic DNA other than HLA alleles A gRNA having a base sequence that is not mapped to a target base sequence.
[26] The target base sequence is the base sequence described in any one of SEQ ID NOs: 53 to 55 and 2460 to 8013, or the 5 ′ end of the base sequence described in any one of SEQ ID NOs: 53 to 55 and 2460 to 8013. The gRNA according to [25], comprising a nucleotide sequence in which one or several bases are deleted, substituted or added.
[27] The target base sequence has one or several bases at the 5 ′ end of the base sequence set forth in any of SEQ ID NOs: 53 to 55 or the base sequence set forth in any of SEQ ID NOs: 53 to 55. The gRNA according to [25] or [26], which comprises a nucleotide sequence that is deleted, substituted, or added.
[28] The gRNA according to any one of [25] to [27], wherein the target base sequence is mapped to
[29] A method for identifying a target base sequence for producing low antigenic cells with reduced rejection when transplanted into a recipient by genome editing, wherein the base sequence data of genomic DNA of all HLA haplotypes On the other hand, mapping the candidate base sequence, mapping the candidate base sequence to the base sequence data of all genomic DNA other than the HLA allele, and the base sequence data of all HLA haplotype genomic DNA When mapping, the candidate base sequence that is mapped only to one target HLA haplotype and not mapped when mapping to the base sequence data of all genomic DNA other than the HLA allele is specified as the target base sequence A method comprising:
[30] A method for identifying a target base sequence for producing low antigenic cells with reduced rejection when transplanted to a recipient by genome editing, wherein the base sequence data of genomic DNA of all HLA haplotypes On the other hand, mapping the candidate base sequence, mapping the candidate base sequence to the base sequence data of all genomic DNA other than the HLA allele, and the base sequence data of all HLA haplotype genomic DNA When the mapping is performed, the candidate base sequences that are mapped to two or more target HLA haplotypes and are not mapped when mapped to the base sequence data of all genomic DNA other than the HLA allele are specified as target base sequences. A method comprising:
(第1実施形態)
第1実施形態の製造方法は、レシピエントに他家移植した場合の拒絶反応が低減された低抗原性細胞を、ドナー細胞から製造する製造方法であって、(a)前記ドナー細胞及び前記レシピエントのHLAアレルをそれぞれ決定することと、(b)前記レシピエントに存在せず前記ドナー細胞に存在するHLAアレルを特定することと、(c)特定された前記HLAアレルを破壊又は改変し、前記ドナー細胞に特異的なHLAタンパク質を発現しない細胞を含む細胞集団を得ることと、を含み、前記ドナー細胞に特異的なHLAタンパク質を発現しない細胞が前記低抗原性細胞である、製造方法である。 [Method for producing low antigenic cells with reduced rejection]
(First embodiment)
The manufacturing method of 1st Embodiment is a manufacturing method which manufactures the low antigenic cell by which rejection when the recipient transplanted to a recipient was reduced from a donor cell, (a) The said donor cell and the said recipe Determining each HLA allele of the ent; (b) identifying an HLA allele that is not present in the recipient and present in the donor cell; and (c) destroying or modifying the identified HLA allele, Obtaining a cell population containing cells that do not express HLA protein specific to the donor cell, wherein the cells that do not express HLA protein specific to the donor cell are the low antigenic cells. is there.
本工程において、ドナー細胞及びレシピエントのHLAアレルをそれぞれ決定する。ドナー細胞は、ヒト細胞であってもよく、非ヒト動物細胞であってもよい。また、ドナー細胞は多能性幹細胞であってもよいし、分化した細胞であってもよい。本明細書において、多能性幹細胞は、胚性幹細胞(ES細胞)、人工多能性幹細胞(iPS細胞)等を意味する。 (Process (a))
In this step, donor cell and recipient HLA alleles are determined. The donor cell may be a human cell or a non-human animal cell. In addition, the donor cell may be a pluripotent stem cell or a differentiated cell. In this specification, pluripotent stem cells mean embryonic stem cells (ES cells), induced pluripotent stem cells (iPS cells), and the like.
本工程において、レシピエントに存在せずドナー細胞に存在するHLAアレル(以下、「ドナー特異的HLAアレル」という場合がある。)を特定する。ドナー特異的HLAアレルは、ドナー細胞のHLAアレル及びレシピエントのHLAアレルを比較することにより特定することができる。 (Process (b))
In this step, an HLA allele that is not present in the recipient but is present in the donor cell (hereinafter sometimes referred to as “donor-specific HLA allele”) is identified. A donor-specific HLA allele can be identified by comparing the HLA allele of the donor cell with the HLA allele of the recipient.
レシピエントに存在しないHLA抗原型のHLAタンパク質を有する細胞をレシピエントに他家移植すると、拒絶反応が生じて移植した細胞が拒絶されてしまう。そこで、本工程において、ドナー特異的HLAアレルを破壊又は改変し、前記ドナー細胞に特異的なHLAタンパク質(以下、「ドナー特異的HLAタンパク質」という場合がある。)を発現しない細胞を含む細胞集団を得る。 (Process (c))
When a cell having an HLA antigen type HLA protein that does not exist in the recipient is transplanted to the recipient, a rejection occurs and the transplanted cell is rejected. Therefore, in this step, a cell population containing cells that destroy or modify the donor-specific HLA allele and do not express HLA protein specific to the donor cell (hereinafter sometimes referred to as “donor-specific HLA protein”). Get.
実施例において後述するように、ドナー細胞のHLAアレルの破壊又は改変は、例えばゲノム編集により行うことができる。HLAアレルの破壊は、HLAアレルを特異的に切断して二本鎖DNA切断(DSB)を誘導することにより行うことができる。DSBの修復過程で塩基が欠失又は付加されてフレームシフト変異が生じた場合、HLAアレルが破壊されて、HLAタンパク質が発現しなくなる。本明細書において、HLAアレルの破壊をHLAアレルのノックアウトという場合がある。 《Genome editing》
As will be described later in Examples, the HLA allele of a donor cell can be destroyed or modified by genome editing, for example. The HLA allele can be destroyed by specifically cleaving the HLA allele to induce double-stranded DNA break (DSB). When a baseshift is deleted or added during the DSB repair process and a frameshift mutation occurs, the HLA allele is destroyed and the HLA protein is not expressed. In this specification, the destruction of the HLA allele is sometimes referred to as knockout of the HLA allele.
一般的に、DSBを誘導してゲノム編集を行うために利用する配列特異的DNA切断酵素は、RNA誘導型ヌクレアーゼと人工ヌクレアーゼに大別される。配列特異的DNA切断酵素はRNA誘導型ヌクレアーゼであってもよく、人工ヌクレアーゼであってもよい。 《Sequence-specific DNA cleavage enzyme》
In general, sequence-specific DNA cleaving enzymes used for genome editing by inducing DSB are roughly classified into RNA-induced nucleases and artificial nucleases. The sequence-specific DNA cleaving enzyme may be an RNA-induced nuclease or an artificial nuclease.
ドナー細胞に導入する配列特異的DNA切断酵素として、例えば、CRISPR-Casを用いる場合、標的塩基配列はgRNAによって決定される。gRNAの詳細については後述する。gRNAは、RNAの形態でドナー細胞に導入してもよいし、発現ベクターの形態でドナー細胞に導入し、細胞内で発現させてもよい。 <Introduction of sequence-specific DNA cleaving enzyme>
When, for example, CRISPR-Cas is used as a sequence-specific DNA cleaving enzyme introduced into a donor cell, the target base sequence is determined by gRNA. Details of gRNA will be described later. The gRNA may be introduced into the donor cell in the form of RNA, or may be introduced into the donor cell in the form of an expression vector and expressed in the cell.
工程(c)において、ドナー特異的HLAタンパク質を発現しない、低抗原性細胞を含む細胞集団を得ることができる。しかしながら、工程(c)で得られる細胞集団は、目的とするHLAアレルの破壊又は改変が行われた細胞(低抗原性細胞)以外にも、HLAアレルの破壊又は改変が行われなかった細胞、HLAアレルの破壊又は改変が不完全に行われた細胞等を含んでいる場合がある。そこで、工程(c)の後に、ドナー特異的HLAタンパク質を発現しない細胞(低抗原性細胞)を回収する工程(d)を更に実施してもよい。 (Process (d))
In step (c), a cell population containing low antigenic cells that does not express donor-specific HLA protein can be obtained. However, the cell population obtained in the step (c) includes cells in which the HLA allele is not destroyed or modified in addition to the cells in which the target HLA allele is destroyed or modified (low antigenic cells), It may contain cells or the like in which the destruction or modification of the HLA allele has been incompletely performed. Therefore, after the step (c), a step (d) of recovering cells (low antigenic cells) that do not express donor-specific HLA protein may be further performed.
第2実施形態の製造方法は、レシピエントに他家移植した場合の拒絶反応が低減された低抗原性細胞を、ドナー細胞から製造する製造方法であって、前記ドナー細胞のCIITAアレル、RFX5アレル、RFXAPアレル及びRFXANKアレルのうち少なくとも1つ以上を含むアレルを破壊又は改変すること、を含み、前記CIITAアレル、RFX5アレル、RFXAPアレル及びRFXANKアレルのうち少なくとも1つ以上を含むアレルが破壊又は改変された細胞が前記低抗原性細胞である、製造方法である。本実施形態の製造方法は、HLAアレルを破壊しない点で上述した第1実施形態の製造方法と主に異なる。 (Second Embodiment)
The production method of the second embodiment is a production method for producing low antigenic cells with reduced rejection when transplanted to a recipient from a donor cell, wherein the CIITA allele and RFX5 allele of the donor cell are used. Destroying or modifying an allele comprising at least one of the RFXAP allele and RFXANK allele, wherein the allele comprising at least one of the CIITA allele, RFX5 allele, RFXAP allele and RFXANK allele is destroyed or altered The production method, wherein the produced cells are the low antigenic cells. The manufacturing method of this embodiment is mainly different from the manufacturing method of the first embodiment described above in that the HLA allele is not destroyed.
1実施形態において、本発明は、HLAタンパク質発現誘導剤を含む、レシピエントに他家移植した場合の拒絶反応が低減された低抗原性細胞の検出用キットを提供する。本実施形態のキットにより低抗原性細胞を検出して回収することができる。したがって、本実施形態のキットは、低抗原性細胞の回収用キットであるということもできる。 [Low-antigenic cell detection kit]
In one embodiment, the present invention provides a kit for detecting low antigenic cells having reduced rejection when transplanted to a recipient, comprising an HLA protein expression inducer. With the kit of this embodiment, low antigenic cells can be detected and recovered. Therefore, it can be said that the kit of this embodiment is a kit for recovering low antigenic cells.
(第1実施形態)
第1実施形態に係る細胞は、少なくとも1つのHLAアレルが破壊又は改変され、少なくとも1種のHLAタンパク質を発現可能な細胞である。第1実施形態の細胞は多能性幹細胞であってもよいし、分化した細胞であってもよい。第1実施形態の細胞において、破壊又は改変された少なくとも1つのHLAアレルはクラスI HLAアレルであることが好ましい。 [cell]
(First embodiment)
The cell according to the first embodiment is a cell in which at least one HLA allele is disrupted or modified and at least one HLA protein can be expressed. The cell of the first embodiment may be a pluripotent stem cell or a differentiated cell. In the cell of the first embodiment, it is preferred that the at least one HLA allele destroyed or modified is a class I HLA allele.
第2実施形態に係る細胞は、CIITAアレル、RFX5アレル、RFXAPアレル及びRFXANKアレルのうち少なくとも1つ以上を含むアレルが破壊又は改変された細胞である。上述したように、CIITAアレル、RFX5アレル、RFXAPアレル、RFXANKアレルのうち少なくとも1つ以上を含むアレルが破壊又は改変された細胞は、HLAクラスIIタンパク質を発現せず、レシピエントに他家移植した場合の拒絶反応が低減された低抗原性細胞である。 (Second Embodiment)
The cell according to the second embodiment is a cell in which an allele including at least one of CIITA allele, RFX5 allele, RFXAP allele and RFXANK allele is destroyed or modified. As described above, cells in which an allele including at least one of the CIITA allele, RFX5 allele, RFXAP allele, and RFXANK allele is disrupted or modified do not express HLA class II protein and have been transplanted to the recipient. In some cases, it is a low antigenic cell with reduced rejection.
上述した、第1実施形態及び第2実施形態の細胞は、レシピエントに他家移植した場合の拒絶反応が低減された低抗原性細胞である。そこで、細胞治療や再生医療に利用することができる。 (Use of low antigenic cells)
The cells of the first and second embodiments described above are low antigenic cells with reduced rejection when transplanted to recipients. Therefore, it can be used for cell therapy and regenerative medicine.
(第1実施形態)
1実施形態において、本発明は、レシピエントに他家移植した場合の拒絶反応が低減された低抗原性細胞をゲノム編集により製造するための標的塩基配列の特定方法であって、全HLAハプロタイプのゲノムDNAの塩基配列データに対して、候補塩基配列をマッピングすることと、HLAアレル以外の全ゲノムDNAの塩基配列データに対して、前記候補塩基配列をマッピングすることと、全HLAハプロタイプのゲノムDNAの塩基配列データに対してマッピングした場合に1つの標的とするHLAハプロタイプにしかマッピングされず、HLAアレル以外の全ゲノムDNAの塩基配列データに対してマッピングした場合にマッピングされない前記候補塩基配列を、標的塩基配列として特定することとを含む方法を提供する。 [Method for specifying target nucleotide sequence]
(First embodiment)
In one embodiment, the present invention relates to a method for identifying a target base sequence for producing low antigenic cells with reduced rejection when transplanted to a recipient by genome editing, comprising all HLA haplotypes. Mapping the candidate base sequence to the base sequence data of genomic DNA, mapping the candidate base sequence to the base sequence data of all genomic DNA other than the HLA allele, and genomic DNA of all HLA haplotypes The candidate base sequence that is mapped only to one target HLA haplotype when mapped to the base sequence data of, but not mapped when mapped to the base sequence data of all genomic DNA other than the HLA allele, And identifying as a target base sequence.
配列同一性(%)=一致した塩基数/クエリー塩基配列の総塩基数×100 (1) Here, the sequence identity of the query base sequence with respect to the reference base sequence can be determined, for example, as follows. First, a reference base sequence and a query base sequence are aligned. Subsequently, in the reference base sequence and the query base sequence, the number of bases of the matched base is calculated, and the sequence identity can be obtained according to the following formula (1).
Sequence identity (%) = number of matched bases / total number of bases in query base sequence × 100 (1)
1実施形態において、本発明は、レシピエントに他家移植した場合の拒絶反応が低減された低抗原性細胞をゲノム編集により製造するための標的塩基配列の特定方法であって、全HLAハプロタイプのゲノムDNAの塩基配列データに対して、候補塩基配列をマッピングすることと、HLAアレル以外の全ゲノムDNAの塩基配列データに対して、前記候補塩基配列をマッピングすることと、全HLAハプロタイプのゲノムDNAの塩基配列データに対してマッピングした場合に2つ以上の標的とするHLAハプロタイプにマッピングされ、HLAアレル以外の全ゲノムDNAの塩基配列データに対してマッピングした場合にマッピングされない前記候補塩基配列を、標的塩基配列として特定することとを含む方法を提供する。 (Second Embodiment)
In one embodiment, the present invention relates to a method for identifying a target base sequence for producing low antigenic cells with reduced rejection when transplanted to a recipient by genome editing, comprising all HLA haplotypes. Mapping the candidate base sequence to the base sequence data of genomic DNA, mapping the candidate base sequence to the base sequence data of all genomic DNA other than the HLA allele, and genomic DNA of all HLA haplotypes The candidate base sequence that is mapped to two or more target HLA haplotypes when mapped to the base sequence data of, and not mapped when mapped to the base sequence data of total genomic DNA other than the HLA allele, And identifying as a target base sequence.
(第1実施形態)
1実施形態において、本発明は、全HLAハプロタイプのゲノムDNAの塩基配列データに対してマッピングした場合に1つの標的とするHLAハプロタイプにしかマッピングされず、HLAアレル以外の全ゲノムDNAの塩基配列データに対してマッピングした場合にマッピングされない塩基配列を、標的塩基配列とするgRNAを提供する。 [GRNA]
(First embodiment)
In one embodiment, the present invention maps only to one target HLA haplotype when mapped to genomic DNA base sequence data of all HLA haplotypes, and base sequence data of total genomic DNA other than HLA alleles. Provided is a gRNA having a base sequence that is not mapped when mapped as a target base sequence.
1実施形態において、本発明は、全HLAハプロタイプのゲノムDNAの塩基配列データに対してマッピングした場合に2つ以上の標的とするHLAハプロタイプにマッピングされ、HLAアレル以外の全ゲノムDNAの塩基配列データに対してマッピングした場合にマッピングされない塩基配列を、標的塩基配列とするgRNAを提供する。 (Second Embodiment)
In one embodiment, the present invention relates to nucleotide sequence data of total genomic DNA other than HLA alleles that are mapped to two or more target HLA haplotypes when mapped to nucleotide sequence data of genomic DNA of all HLA haplotypes. Provided is a gRNA having a base sequence that is not mapped when mapped as a target base sequence.
1実施形態において、本発明は、IFN-γ、IFN-α、IFN-β、IL-4、GM-CSF、TGF-α又はTGF-βを有効成分とする、多能性幹細胞の多能性を維持したままHLAタンパク質の発現を誘導する、HLAタンパク質発現誘導剤を提供する。 [Other Embodiments]
In one embodiment, the present invention relates to the pluripotency of a pluripotent stem cell comprising IFN-γ, IFN-α, IFN-β, IL-4, GM-CSF, TGF-α or TGF-β as an active ingredient. An HLA protein expression inducer that induces the expression of HLA protein while maintaining the above is provided.
(gRNAの設計)
HLA遺伝子は配列の個人差が大きく、一方でHLA遺伝子間の相同性が高いことから、特定のHLAハプロタイプだけを切断するgRNAの塩基配列を設計することは困難であった。具体的には、例えば、HLA-A*01:01アレルだけを認識するgRNAであって、他のHLA-AアレルやHLA-A以外のHLA遺伝子、他のゲノム領域を認識しないgRNA配列を設計することは困難であった。 [Experimental Example 1]
(Design of gRNA)
Since the HLA gene has large individual differences in sequence, while the homology between HLA genes is high, it has been difficult to design a base sequence of gRNA that cleaves only a specific HLA haplotype. Specifically, for example, a gRNA that recognizes only the HLA-A * 01: 01 allele and that does not recognize other HLA-A alleles, HLA genes other than HLA-A, or other genomic regions is designed. It was difficult to do.


(iPS細胞の刺激によるHLAタンパク質の発現誘導1)
未分化iPS細胞を刺激してHLAタンパク質の発現を誘導することを試みた。具体的には、iPS細胞の培地に100ng/mLのリポポリサッカライド(LPS)、100ng/mLのTNF-α、又は50ng/mLのIFN-γを添加して48時間処理後、抗HLA-ABC抗体(品番:311418、BIOLEGEND社)を用いてフローサイトメトリー解析を行い、HLAタンパク質の発現を検討した。 [Experiment 2]
(Induction of HLA protein expression by iPS cell stimulation 1)
We attempted to stimulate undifferentiated iPS cells to induce HLA protein expression. Specifically, 100 ng / mL lipopolysaccharide (LPS), 100 ng / mL TNF-α, or 50 ng / mL IFN-γ was added to the iPS cell medium for 48 hours, followed by anti-HLA-ABC. Flow cytometry analysis was performed using an antibody (Product No .: 31418, BIOLEGEND) to examine the expression of HLA protein.
(iPS細胞の刺激によるHLAタンパク質の発現誘導2)
iPS細胞の培地に10ng/mL、50ng/mL、又は100ng/mLのIFN-γを添加して48時間処理後、抗HLA-ABC抗体(品番:311418、BIOLEGEND社)を用いてフローサイトメトリー解析を行い、HLAタンパク質の発現を検討した。 [Experiment 3]
(Induction of HLA protein expression by iPS cell stimulation 2)
10 ng / mL, 50 ng / mL, or 100 ng / mL IFN-γ was added to the iPS cell medium for 48 hours, followed by flow cytometry analysis using an anti-HLA-ABC antibody (Part No .: 31418, BIOLEGEND) And the expression of HLA protein was examined.
(iPS細胞の刺激によるHLAタンパク質の発現誘導3)
iPS細胞の培地に50ng/mLのIFN-γを添加し、4時間、8時間、16時間、24時間、及び48時間処理後、抗HLA-A2抗体(品番:740082、BD社)を用いてフローサイトメトリー解析を行い、HLA-A2タンパク質の発現を検討した。 [Experimental Example 4]
(Induction of HLA protein expression by iPS cell stimulation 3)
After adding 50 ng / mL IFN-γ to the iPS cell culture medium and treating for 4 hours, 8 hours, 16 hours, 24 hours, and 48 hours, anti-HLA-A2 antibody (product number: 740082, BD) was used. Flow cytometry analysis was performed to examine the expression of HLA-A2 protein.
(細胞のHLAハプロタイプ決定)
以下の方法により、各細胞のHLAハプロタイプ(両親から受け継いだ各HLAアレルの対)を決定した。 [Experimental Example 5]
(Determine HLA haplotype of cells)
The HLA haplotype (pair of each HLA allele inherited from parents) of each cell was determined by the following method.
(sgRNAのゲノム切断活性の検討)
実験例1で同定した標的塩基配列を標的とするsgRNAの中から、A*02:07アレルだけを切断し、A*32:01アレルとは塩基配列が一致しないsgRNAである、A0207-ex3-g1(標的塩基配列を配列番号3に示す。)、A0207-ex3-g2(標的塩基配列を配列番号4に示す。)及びA0207-ex3-g4(標的塩基配列を配列番号7に示す。)を選択した。 [Experimental Example 6]
(Study of genome cleavage activity of sgRNA)
Among the sgRNAs targeted to the target base sequence identified in Experimental Example 1, only the A * 02: 07 allele is cleaved, and the base sequence does not match the A * 32: 01 allele, A0207-ex3- g1 (target base sequence is shown in SEQ ID NO: 3), A0207-ex3-g2 (target base sequence is shown in SEQ ID NO: 4) and A0207-ex3-g4 (target base sequence is shown in SEQ ID NO: 7). Selected.


(HLAアレル特異的ノックアウト1)
《HLAタンパク質の発現の確認》
HLAの細胞表面での発現を確認するために、HLA抗原型A2を持つiPS細胞株を2株(1383D2株及び404C2株)選択した。また、HLA抗原型A2を持たないiPS細胞株として604B1株を選択した。合計3株の未分化iPS細胞に対して、サイトカイン未処理の場合と50ng/mLのIFN-γで48時間処理した場合において、抗HLA-A2抗体(品番:740082、BD社)を用いて細胞を染色し、フローサイトメトリー解析を行った。 [Experimental Example 7]
(HLA allele-specific knockout 1)
<Confirmation of HLA protein expression>
In order to confirm the expression of HLA on the cell surface, two iPS cell lines having HLA serotype A2 (1383D2 and 404C2) were selected. In addition, 604B1 strain was selected as an iPS cell line not having HLA antigen type A2. A total of 3 undifferentiated iPS cells were treated with anti-HLA-A2 antibody (Product No .: 740082, BD) when not treated with cytokine and treated with 50 ng / mL IFN-γ for 48 hours. Were subjected to flow cytometry analysis.
続いて、上述したsgRNAである、A0207-ex3-g1(標的塩基配列を配列番号3に示す。)、A0207-ex3-g2(標的塩基配列を配列番号4に示す。)及びA0207-ex3-g4(標的塩基配列を配列番号7に示す。)を、精製Cas9タンパク質と共に1383D2 iPS細胞にそれぞれトランスフェクションした。トランスフェクションは市販のキット(型式「CRISPR-MAX」、品番:CMAX00003、サーモフィッシャーサイエンティフィック社)を用いて行った。 《HLA allele-specific knockout》
Subsequently, A0207-ex3-g1 (the target base sequence is shown in SEQ ID NO: 3), A0207-ex3-g2 (the target base sequence is shown in SEQ ID NO: 4) and A0207-ex3-g4, which are the sgRNAs described above. (The target base sequence is shown in SEQ ID NO: 7) was transfected into 1383D2 iPS cells together with purified Cas9 protein. Transfection was performed using a commercially available kit (model “CRISPR-MAX”, product number: CMAX00003, Thermo Fisher Scientific).
続いて、sgRNA(A0207-ex3-g4)を導入した1383D2 iPS細胞からゲノムDNAを抽出し、A*02:07アレルを特異的に増幅し、A*32:01アレルを増幅しないプライマーを用いてNested PCRを行いsgRNAのターゲット部位を増幅した。Nested PCRには、下記表6に示すプライマーを使用した。 << Analysis of the base sequence of the target site of sgRNA >>
Subsequently, genomic DNA was extracted from 1383D2 iPS cells into which sgRNA (A0207-ex3-g4) was introduced, and the A * 02: 07 allele was specifically amplified and the A * 32: 01 allele was not amplified. Nested PCR was performed to amplify the target site of sgRNA. The primers shown in Table 6 below were used for the nested PCR.
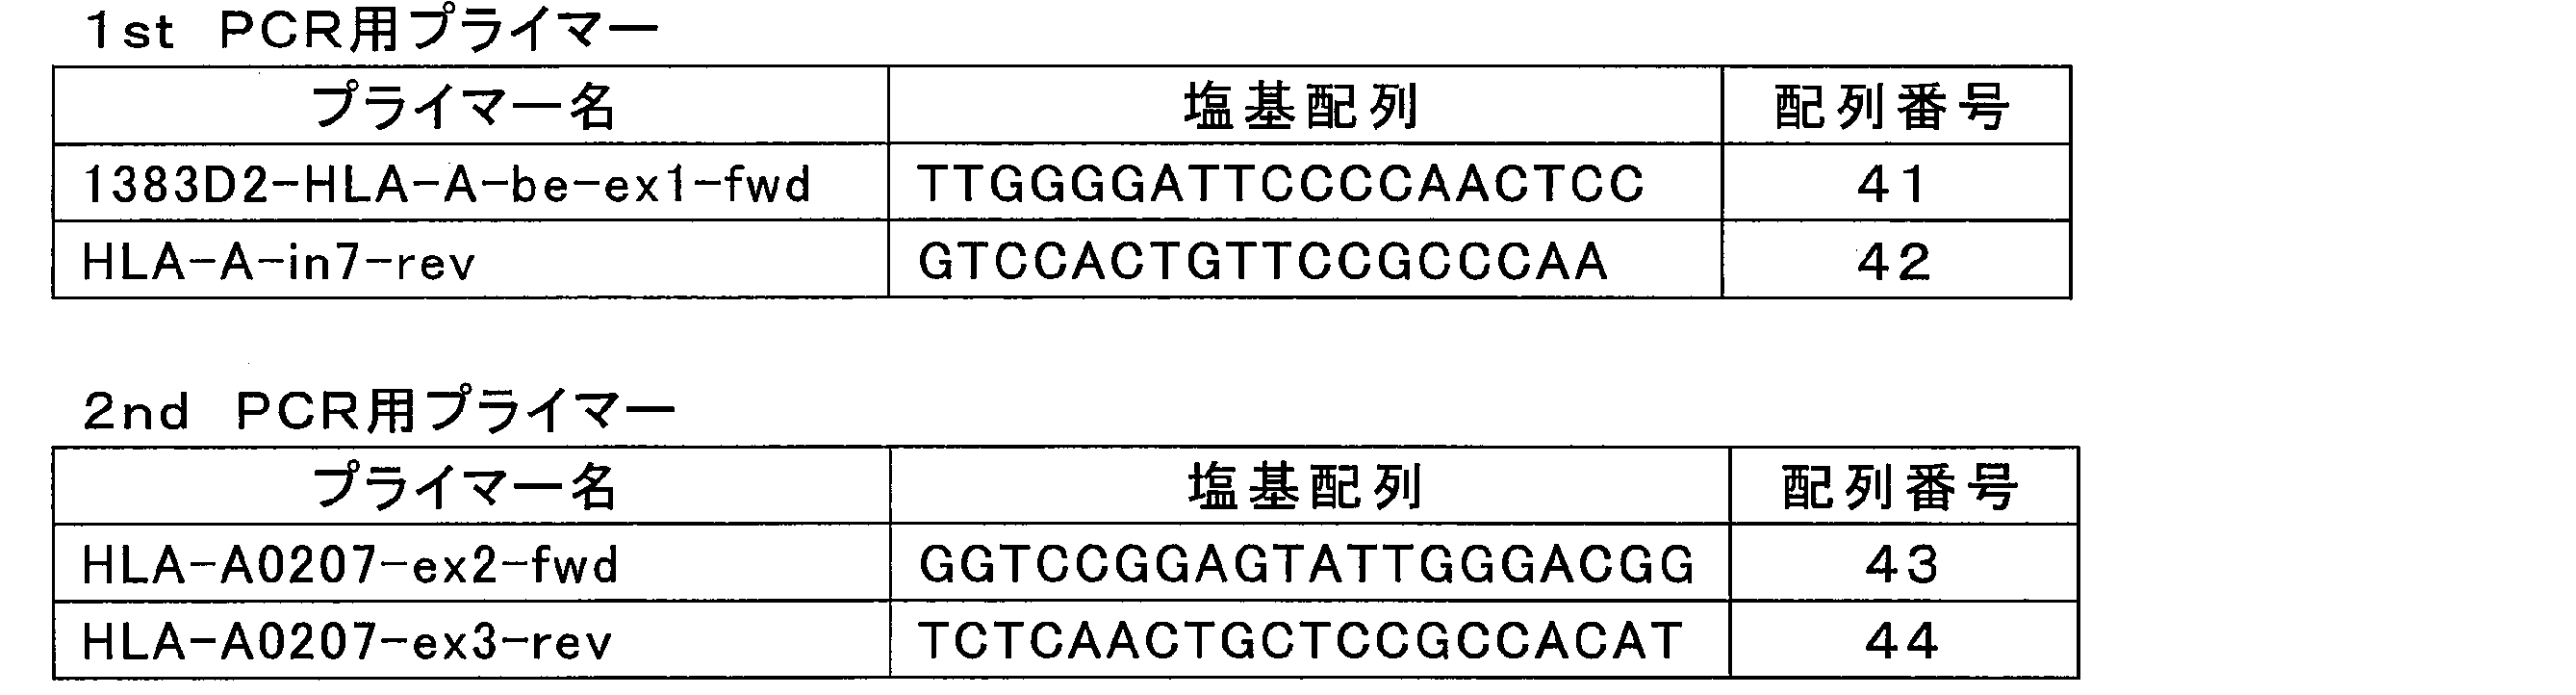

(HLAアレル特異的ノックアウト2)
下記表8のHLAハプロタイプを持つ604B1 iPS細胞のHLAアレルを破壊することにより、下記表9に示す仮想的なHLAハプロタイプを持つレシピエントAに他家移植を行う場合の拒絶反応が低減された低抗原性細胞を作製した。なお、下記表9に示すHLAハプロタイプは、末梢血単核球細胞(PBMC、型式「LP_194」、CTL社)のHLAハプロタイプである。 [Experimental Example 8]
(HLA allele-specific knockout 2)
By destroying the HLA allele of the 604B1 iPS cells having the HLA haplotypes shown in Table 8 below, the rejection reaction when transplanting to the recipient A having the virtual HLA haplotypes shown in Table 9 below is reduced. Antigenic cells were generated. The HLA haplotypes shown in Table 9 below are HLA haplotypes of peripheral blood mononuclear cells (PBMC, model “LP — 194”, CTL).


(HLAアレル特異的ノックアウト3)
下記表10のHLAハプロタイプを持つ585A1 iPS細胞のHLAアレルを破壊することにより、下記表11に示す仮想的なHLAハプロタイプを持つレシピエントBに他家移植を行う場合の拒絶反応が低減された低抗原性細胞を作製した。なお、下記表11に示すHLAハプロタイプは、末梢血単核球細胞(PBMC、型式「2010113203」、Wako社)のHLAハプロタイプである。 [Experimental Example 9]
(HLA allele-specific knockout 3)
By destroying the HLA allele of the 585A1 iPS cells having the HLA haplotype shown in Table 10 below, the rejection when the transplantation is performed on the recipient B having the hypothetical HLA haplotype shown in Table 11 below is reduced. Antigenic cells were generated. The HLA haplotypes shown in Table 11 below are HLA haplotypes of peripheral blood mononuclear cells (PBMC, model “2010113203”, Wako).


(HLAアレル特異的ノックアウト4)
下記表12のHLAハプロタイプを持つ585A1 iPS細胞のHLAアレルを破壊することにより、下記表13に示す仮想的なHLAハプロタイプを持つレシピエントCに他家移植を行う場合の拒絶反応が低減された低抗原性細胞を作製した。なお、下記表13に示すHLAハプロタイプは、末梢血単核球細胞(PBMC、型式「LP_266」、CTL社)のHLAハプロタイプである。 [Experimental Example 10]
(HLA allele-specific knockout 4)
By destroying the HLA allele of the 585A1 iPS cells having the HLA haplotypes shown in Table 12 below, the rejection reaction when transplanting to recipient C having the hypothetical HLA haplotypes shown in Table 13 below is reduced. Antigenic cells were generated. The HLA haplotypes shown in Table 13 below are HLA haplotypes of peripheral blood mononuclear cells (PBMC, model “LP — 266”, CTL).


(HLAアレル特異的ノックアウト5)
下記表14のHLAハプロタイプを持つ604B1 iPS細胞のHLAアレルを破壊することにより、下記表15で示す仮想的なHLAハプロタイプを持つレシピエントCに他家移植を行う場合の拒絶反応が低減された低抗原性細胞を作製した。なお、下記表15に示すHLAハプロタイプは、末梢血単核球細胞(PBMC、型式「LP_266」、CTL社)のHLAハプロタイプである。 [Experimental Example 11]
(HLA allele-specific knockout 5)
By destroying the HLA allele of the 604B1 iPS cells having the HLA haplotypes shown in Table 14 below, the rejection when the transplantation is performed on the recipient C having the virtual HLA haplotypes shown in Table 15 below is reduced. Antigenic cells were generated. The HLA haplotypes shown in Table 15 below are HLA haplotypes of peripheral blood mononuclear cells (PBMC, model “LP — 266”, CTL).


(HLAアレル特異的ノックアウト6)
下記表16のHLAハプロタイプを持つ604B1 iPS細胞のHLAアレルを破壊することにより、HLA-Aアレル、HLA-Bアレル、HLA-Cアレルの3遺伝子座全てをノックアウトした細胞を作製した。図16(a)は本実験例で使用したsgRNAの標的部位を示す図である。 [Experimental example 12]
(HLA allele-specific knockout 6)
By destroying the HLA allele of the 604B1 iPS cell having the HLA haplotype shown in Table 16 below, cells in which all three loci of the HLA-A allele, the HLA-B allele and the HLA-C allele were knocked out were prepared. FIG. 16A shows the target site of sgRNA used in this experimental example.

(HLAアレル特異的ノックアウト7)
下記表17のHLAハプロタイプを持つ585A1 iPS細胞のHLAアレルを破壊することにより、HLA-Aアレル及びHLA-Bアレルがノックアウトされており、HLA-Cアレルの一方のみがノックアウトされた細胞を作製した。 [Experimental Example 13]
(HLA allele-specific knockout 7)
By destroying the HLA allele of the 585A1 iPS cell having the HLA haplotype shown in Table 17 below, a cell in which the HLA-A allele and the HLA-B allele were knocked out and only one of the HLA-C alleles was knocked out was produced. .

(HLAアレル特異的ノックアウト8)
下記表18のHLAハプロタイプを持つ604B1 iPS細胞のHLAアレルを破壊することにより、HLA-Aアレル及びHLA-Bアレルをノックアウトした細胞を作製した。 [Experimental Example 14]
(HLA allele-specific knockout 8)
By destroying the HLA allele of the 604B1 iPS cell having the HLA haplotype shown in Table 18 below, cells in which the HLA-A allele and the HLA-B allele were knocked out were prepared.

(HLAアレル特異的ノックアウト9)
下記表19のHLAハプロタイプを持つ1383D2 iPS細胞のHLAアレルを破壊することにより、HLA-Aアレル、HLA-Bアレル、HLA-Cアレルの3遺伝子座全てをノックアウトした細胞を作製した。図20(a)は本実験例で使用したsgRNAの標的部位を示す図である。 [Experimental Example 15]
(HLA allele specific knockout 9)
By destroying the HLA allele of the 1383D2 iPS cell having the HLA haplotype shown in Table 19 below, cells in which all three loci of the HLA-A allele, HLA-B allele, and HLA-C allele were knocked out were prepared. FIG. 20 (a) is a diagram showing the target site of sgRNA used in this experimental example.

(HLAアレルの改変)
下記表20のHLAハプロタイプを持つ1383D2 iPS細胞のA*02:07アレルを、ゲノム編集によりA*01:01アレルに改変する検討を行った。 [Experimental Example 16]
(Modification of HLA allele)
The A * 02: 07 allele of 1383D2 iPS cells having the HLA haplotype shown in Table 20 below was examined by genome editing to A * 01: 01 allele.


(B2MノックアウトiPS細胞の作製1)
1383D2 iPS細胞にCas9を発現するプラスミドベクターとB2M特異的なsgRNAをトランスフェクションした。sgRNAとしては、B2M-g1(標的塩基配列を配列番号59に示す。)及びB2M-g2(標的塩基配列を配列番号60に示す。)を使用した。 [Experimental Example 17]
(Preparation of B2M knockout iPS cells 1)
1383D2 iPS cells were transfected with a plasmid vector expressing Cas9 and B2M-specific sgRNA. As sgRNA, B2M-g1 (target base sequence is shown in SEQ ID NO: 59) and B2M-g2 (target base sequence is shown in SEQ ID NO: 60) were used.
(B2MノックアウトiPS細胞の作製2)
604B1 iPS細胞に対し、実験例17と同様の操作を行い、B2Mアレルをノックアウトした。sgRNAとしては、B2M-g2(標的塩基配列を配列番号60に示す。)を使用した。 [Experiment 18]
(Preparation of B2M knockout iPS cells 2)
The same operation as in Experimental Example 17 was performed on 604B1 iPS cells to knock out the B2M allele. As the sgRNA, B2M-g2 (target base sequence is shown in SEQ ID NO: 60) was used.
(T細胞活性化試験1)
(1)下記表22のHLAハプロタイプを持つ604B1 iPS細胞、(2)実験例8で作製した、604B1 iPS細胞のA*01:01アレル及びB*07:02アレルをノックアウトしたクローン#8、(3)同クローン#10、(4)下記表23のHLAハプロタイプを持つ1383D2 iPS細胞、(5)実験例18で作製した、B2Mアレルをノックアウトした604B1 iPS細胞(クローン#1)を、それぞれ胚様体(EB)由来血球様細胞に分化誘導した。 [Experimental Example 19]
(T cell activation test 1)
(1) 604B1 iPS cells having HLA haplotypes shown in Table 22 below, (2)


(T細胞活性化試験2)
(1)下記表25のHLAハプロタイプを持つ585A1 iPS細胞、(2)実験例9で作製した、585A1 iPS細胞のB*07:02アレル及びC*07:02アレルをノックアウトしたクローン#2、(3)同クローン#11、(4)同クローン#26、(5)下記表26のHLAハプロタイプを持つ1383D2 iPS細胞、(6)実験例18で作製した、B2Mをノックアウトした604B1 iPS細胞(クローン#1)を、それぞれEB由来血球様細胞に分化誘導した。 [Experiment 20]
(T cell activation test 2)
(1) 585A1 iPS cells having the HLA haplotypes shown in Table 25 below, (2)


(T細胞活性化試験3)
(1)下記表28のHLAハプロタイプを持つ604B1 iPS細胞、(2)実験例11で作製した、604B1 iPS細胞のA*01:01アレル、B*37:01アレル及びC*06:02アレルをノックアウトしたクローン#3-11、(3)同クローン#3-12、(4)下記表29のHLAハプロタイプを持つ1383D2 iPS細胞、(5)実験例18で作製した、B2Mをノックアウトした604B1 iPS細胞(クローン#1)を、それぞれEB由来血球様細胞に分化誘導した。 [Experiment 21]
(T cell activation test 3)
(1) 604B1 iPS cells having the HLA haplotype shown in Table 28 below, (2) A * 01: 01 allele, B * 37: 01 allele and C * 06: 02 allele of 604B1 iPS cells prepared in Experimental Example 11 Knockout clone # 3-11, (3) clone # 3-12, (4) 1383D2 iPS cells having the HLA haplotype of Table 29 below, (5) 604B1 iPS cells knocked out of B2M prepared in Experimental Example 18 (Clone # 1) was induced to differentiate into EB-derived blood cell-like cells.


(HLA抗原反応性CD8陽性T細胞の調製)
604B1 iPS細胞のHLA抗原に反応性を有するCD8陽性T細胞を調製した。末梢血単核球細胞(PBMC)由来のT細胞には、多様な抗原を認識するT細胞が混在している。これらのT細胞のうち、604B1 iPS細胞のHLA抗原に反応性を有するCD8陽性T細胞を刺激して増殖させ、回収した。 [Experimental example 22]
(Preparation of HLA antigen-reactive CD8-positive T cells)
CD8 positive T cells reactive to the HLA antigen of 604B1 iPS cells were prepared. Peripheral blood mononuclear cells (PBMC) -derived T cells are mixed with T cells that recognize various antigens. Among these T cells, CD8 positive T cells reactive to the HLA antigen of 604B1 iPS cells were stimulated to proliferate and recovered.
(T細胞傷害性試験1)
図30は、本実験例の手順を示す模式図である。まず、(1)下記表31のHLAハプロタイプを持つ604B1 iPS細胞、(2)実験例8で作製した、604B1 iPS細胞のA*01:01アレル及びB*07:02アレルをノックアウトしたクローン#8、(3)同クローン#10、(4)実験例17で作製した、B2Mをノックアウトした1383D2 iPS細胞(クローン#1)を、それぞれ心筋細胞に分化誘導した。 [Experimental example 23]
(T cell toxicity test 1)
FIG. 30 is a schematic diagram showing the procedure of this experimental example. First, (1) 604B1 iPS cells having the HLA haplotype shown in Table 31 below, (2)

(T細胞傷害性試験2)
実験例23と同様の(1)~(4)のiPS細胞をEB由来血球様細胞に分化誘導し、51Crリリースアッセイを行った。 [Experimental example 24]
(T cell toxicity test 2)
The same iPS cells (1) to (4) as in Experimental Example 23 were induced to differentiate into EB-derived blood cell-like cells, and a 51 Cr release assay was performed.
(T細胞傷害性試験3)
実験例24とは異なるiPS細胞を用いた点以外は実験例24と同様の検討を行った。まず、(1)下記表32のHLAハプロタイプを持つ585A1 iPS細胞、(2)実験例9で作製した、585A1 iPS細胞のB*07:02アレルおよびC*07:02アレルをノックアウトしたクローン#2、(3)同クローン#11、(4)同クローン#26、(5)実験例18で作製した、B2Mをノックアウトした604B1 iPS細胞(クローン#1)を、それぞれEB由来血球様細胞に分化誘導した。なお、EB由来血球様細胞は血球細胞を含む。 [Experiment 25]
(T cell toxicity test 3)
The same examination as in Experimental Example 24 was performed except that iPS cells different from Experimental Example 24 were used. First, (1) 585A1 iPS cells having the HLA haplotypes shown in Table 32 below, (2)


(T細胞傷害性試験4)
下記表34のHLAハプロタイプを持つ604B1 iPS細胞、及び、実験例18で作製した、B2Mをノックアウトした604B1 iPS細胞(クローン#1)を、下記表35のHLAハプロタイプを持つ末梢血単核球細胞(PBMC、型式「LP_266」、CTL社、上述したレシピエントCに相当する。)をCFSE(ケイマンケミカル社)でラベリングしたものと混合し、7日間共培養した。 [Experiment 26]
(T cell toxicity test 4)
604B1 iPS cells having the HLA haplotypes shown in Table 34 below, and 604B1 iPS cells (clone # 1) prepared in Experimental Example 18 and knocking out B2M, were converted to peripheral blood mononuclear cells having HLA haplotypes shown in Table 35 below ( PBMC, model “LP — 266”, CTL, which corresponds to the recipient C described above) was mixed with CFSE (Cayman Chemical) and co-cultured for 7 days.


(NK細胞反応性試験1)
(1)下記表36のHLAハプロタイプを持つ604B1 iPS細胞、(2)実験例8で作製した、604B1 iPS細胞のA*01:01アレル及びB*07:02アレルをノックアウトしたクローン#8、(3)同クローン#10、(4)下記表37のHLAハプロタイプを持つ1383D2 iPS細胞、(5)実験例18で作製した、B2Mをノックアウトした604B1 iPS細胞(クローン#1)を、それぞれEB由来血球様細胞に分化させた。なお、EB由来血球様細胞はCD45陽性白血球細胞を含む。 [Experiment 27]
(NK cell reactivity test 1)
(1) 604B1 iPS cells having the HLA haplotypes shown in Table 36 below, (2)


(多能性確認試験1)
1383D2 iPS細胞及び604B1 iPS細胞について、(1)未処理の状態、(2)50ng/mLのIFN-γで48時間処理した直後、及び(3)50ng/mLのIFN-γで48時間処理してから5日後、の各細胞をそれぞれ用意し、mRNAを抽出した。続いて、Rever Tra Ase qPCR RT Master Mix(Toyobo社)を用いてcDNAを合成後、多能性幹細胞で特異的に発現しているヒトNANOG cDNAを増幅するプライマー、及び、mRNA総量のコントロールとして、ヒトACTB cDNAを増幅するプライマーを用いて、定量PCRを行った。 [Experiment 28]
(Multipotency confirmation test 1)
1383D2 iPS cells and 604B1 iPS cells were (1) untreated, (2) immediately treated with 50 ng / mL IFN-γ for 48 hours, and (3) treated with 50 ng / mL IFN-γ for 48 hours. Five days after the preparation, each cell was prepared and mRNA was extracted. Subsequently, after synthesizing cDNA using River Tra As qPCR RT Master Mix (Toyobo), as a primer for amplifying human NANOG cDNA specifically expressed in pluripotent stem cells, and as a control of the total amount of mRNA, Quantitative PCR was performed using primers that amplify human ACTB cDNA.

(多能性確認試験2)
(1)604B1 iPS細胞、(2)実験例11で作製した604B1 iPS細胞のA*01:01アレル、B*37:01アレル、C*06:02アレルを破壊したクローン#3-11、(3)同クローン#3-12、(4)実験例18で作製した604B1 iPS細胞のB2M遺伝子を破壊したクローン#1、(5)1383D2 iPS細胞、(6)実験例17で作製した1383D2 iPS細胞のB2M遺伝子を破壊したクローン#1を、それぞれ未分化維持条件下で培養し、各細胞の形態を位相差顕微鏡で観察した。 [Experimental example 29]
(Multipotency confirmation test 2)
(1) 604B1 iPS cells, (2) clone # 3-11 in which the A * 01: 01 allele, B * 37: 01 allele, and C * 06: 02 allele of the 604B1 iPS cell prepared in Experimental Example 11 were destroyed ( 3) Clone # 3-12, (4)
(多能性確認試験3)
(1)604B1 iPS細胞、(2)実験例11で作製した604B1 iPS細胞のA*01:01アレル、B*37:01アレル、C*06:02アレルを破壊したクローン#3-11、(3)同クローン#3-12、(4)実験例18で作製した604B1 iPS細胞のB2M遺伝子を破壊したクローン#1、(5)1383D2 iPS細胞、(6)実験例17で作製した1383D2 iPS細胞のB2M遺伝子を破壊したクローン#1を、それぞれ血球分化誘導条件下で培養し、EB由来血球様細胞の形態を位相差顕微鏡で観察した。 [Experiment 30]
(Multipotency confirmation test 3)
(1) 604B1 iPS cells, (2) clone # 3-11 in which the A * 01: 01 allele, B * 37: 01 allele, and C * 06: 02 allele of the 604B1 iPS cell prepared in Experimental Example 11 were destroyed ( 3) Clone # 3-12, (4)
(T細胞傷害性試験5)
(1)実験例17で作製した、下記表40のHLAハプロタイプを持つ1383D2 iPS細胞のB2Mアレルをノックアウトした細胞(クローン#1)、(2)下記表41のHLAハプロタイプを持つ585A1 iPS細胞を、CFSE(ケイマンケミカル社)で染色し、下記表42のHLAハプロタイプを持つ末梢血単核球細胞(PBMC、型式「LP_275」、CTL社)と7日間共培養した。 [Experimental example 31]
(T cell toxicity test 5)
(1) A cell (clone # 1) in which the B2M allele of the 1383D2 iPS cell having the HLA haplotype shown in Table 40 shown below was knocked out, and (2) a 585A1 iPS cell having the HLA haplotype shown in Table 41 below, The cells were stained with CFSE (Cayman Chemical) and co-cultured with peripheral blood mononuclear cells (PBMC, model “LP — 275”, CTL) having the HLA haplotype shown in Table 42 below for 7 days.


(T細胞傷害性試験6)
(1)実験例17で作製した、下記表43のHLAハプロタイプを持つ1383D2 iPS細胞のB2Mアレルをノックアウトした細胞(クローン#1)、(2)下記表44のHLAハプロタイプを持つ585A1 iPS細胞を、下記表45のHLAハプロタイプを持つ末梢血単核球細胞(PBMC、型式「LP_329」、CTL社)をCFSE(ケイマンケミカル社)で染色したものと7日間共培養した。 [Experiment 32]
(T cell toxicity test 6)
(1) A cell (clone # 1) in which the B2M allele of the 1383D2 iPS cell having the HLA haplotype shown in Table 43 shown below was knocked out, and (2) a 585A1 iPS cell having the HLA haplotype shown in Table 44 below. Peripheral blood mononuclear cells (PBMC, model “LP — 329”, CTL) having the HLA haplotype shown in Table 45 below were co-cultured with those stained with CFSE (Cayman Chemical) for 7 days.


(細胞移植実験1)
(1)585A1 iPS細胞、(2)実験例13で作製した、585A1 iPS細胞のA*24:02アレル、B*07:02アレル、B*52:01アレル、及びC*12:02アレルをノックアウトしたクローン#3-1を、それぞれEB由来血球様細胞に分化誘導した。続いて、各EB由来血球様細胞をルシフェラーゼでラベルした。 [Experimental Example 33]
(Cell transplantation experiment 1)
(1) 585A1 iPS cells, (2) A * 24: 02 allele, B * 07: 02 allele, B * 52: 01 allele, and C * 12: 02 allele of 585A1 iPS cells prepared in Experimental Example 13 Each knockout clone # 3-1 was induced to differentiate into EB-derived blood cell-like cells. Subsequently, each EB-derived blood cell-like cell was labeled with luciferase.
(NK細胞反応性試験2)
(1)585A1 iPS細胞、(2)実験例13で作製した、585A1 iPS細胞のA*24:02アレル、B*07:02アレル、B*52:01アレル、及びC*12:02アレルをノックアウトしたクローン#3-1、(3)後述する実験例46で作製した、585A1 iPS細胞のB2Mアレルをノックアウトした細胞(サブクローニングしていないバルクの細胞)を用意した。下記表46に585A1 iPS細胞のHLAハプロタイプを示し、下記表47に1383D2 iPS細胞のHLAハプロタイプを示す。

(NK cell reactivity test 2)
(1) 585A1 iPS cells, (2) A * 24: 02 allele, B * 07: 02 allele, B * 52: 01 allele, and C * 12: 02 allele of 585A1 iPS cells prepared in Experimental Example 13 Knockout clone # 3-1, (3) A cell (bulk cell not subcloned) knocked out of the B2M allele of 585A1 iPS cell prepared in Experimental Example 46 described later was prepared. Table 46 below shows HLA haplotypes of 585A1 iPS cells, and Table 47 below shows HLA haplotypes of 1383D2 iPS cells.


(NK細胞反応性試験3)
(1)585A1 iPS細胞、(2)実験例13で作製した、585A1 iPS細胞のA*24:02アレル、B*07:02アレル、B*52:01アレル、及びC*12:02アレルをノックアウトしたクローン#3-1、(3)後述する実験例46で作製した、585A1 iPS細胞のB2Mアレルをノックアウトした細胞(サブクローニングしていないバルクの細胞)を用意した。下記表49に585A1 iPS細胞のHLAハプロタイプを示し、下記表50に1383D2 iPS細胞のHLAハプロタイプを示す。

(NK cell reactivity test 3)
(1) 585A1 iPS cells, (2) A * 24: 02 allele, B * 07: 02 allele, B * 52: 01 allele, and C * 12: 02 allele of 585A1 iPS cells prepared in Experimental Example 13 Knockout clone # 3-1, (3) A cell (bulk cell not subcloned) knocked out of the B2M allele of 585A1 iPS cell prepared in Experimental Example 46 described later was prepared. Table 49 below shows HLA haplotypes of 585A1 iPS cells, and Table 50 below shows HLA haplotypes of 1383D2 iPS cells.


(NK細胞反応性試験4)
(1)585A1 iPS細胞、(2)実験例13で作製した、585A1 iPS細胞のA*24:02アレル、B*07:02アレル、B*52:01アレル、及びC*12:02アレルをノックアウトしたクローン#3-1、(3)後述する実験例46で作製した、585A1 iPS細胞のB2Mアレルをノックアウトした細胞(サブクローニングしていないバルクの細胞)、(4)HLA抗原を発現していないことが知られているK562細胞を用意した。下記表52に585A1 iPS細胞のHLAハプロタイプを示し、下記表53に1383D2 iPS細胞のHLAハプロタイプを示す。

(NK cell reactivity test 4)
(1) 585A1 iPS cells, (2) A * 24: 02 allele, B * 07: 02 allele, B * 52: 01 allele, and C * 12: 02 allele of 585A1 iPS cells prepared in Experimental Example 13 Knockout clone # 3-1, (3) a cell (Bulk cell not subcloned) knocked out of the B2M allele of 585A1 iPS cell prepared in Example 46 described later, (4) HLA antigen is not expressed K562 cells known to be prepared were prepared. Table 52 below shows HLA haplotypes of 585A1 iPS cells, and Table 53 below shows HLA haplotypes of 1383D2 iPS cells.


(細胞移植実験2)
(1)585A1 iPS細胞のB2M遺伝子をノックアウトした細胞、(2)実験例13で作製した、585A1 iPS細胞のA*24:02アレル、B*07:02アレル、B*52:01アレル、及びC*12:02アレルをノックアウトしたクローン#3-1を、それぞれEB由来血球様細胞に分化誘導した。続いて、各EB由来血球様細胞をルシフェラーゼでラベルした。 [Experiment 37]
(Cell transplantation experiment 2)
(1) 585A1 iPS cell knocked out B2M gene cell, (2) 585A1 iPS cell A * 24: 02 allele, B * 07: 02 allele, B * 52: 01 allele prepared in Experimental Example 13 Clone # 3-1, in which the C * 12: 02 allele was knocked out, was induced to differentiate into EB-derived blood cells. Subsequently, each EB-derived blood cell-like cell was labeled with luciferase.

相対的生存率(%)=NK細胞投与群の生存率(%)/対照群の生存率(%)×100 …(F1) FIG. 45 (a) is a diagram illustrating an experiment schedule. FIG. 45 (b) is a photograph showing the results of photographing the fluorescence of EB-derived blood cell-like cells in each mouse. FIG. 45 (c) shows the survival rate of each EB-derived blood cell-like cell when NK cells are administered to a mouse, with the fluorescence intensity before NK cell injection as 100%, and further relative to each measurement time. It is a graph which shows the result of having calculated the survival rate by the following formula (F1). In FIG. 45 (c), the unit of the vertical axis is (%).
Relative survival rate (%) = survival rate of NK cell administration group (%) / survival rate of control group (%) × 100 (F1)
(T細胞及びNK細胞による傷害性試験)
(1)585A1 iPS細胞、(2)実験例13で作製した、585A1 iPS細胞のA*24:02アレル、B*07:02アレル、B*52:01アレル、及びC*12:02アレルをノックアウトしたクローン#3-1、(3)後述する実験例46で作製した、585A1 iPS細胞のB2Mアレルをノックアウトした細胞(サブクローニングしていないバルクの細胞)を、それぞれEB由来血球様細胞に分化誘導した。 [Experiment 38]
(Toxicity test using T cells and NK cells)
(1) 585A1 iPS cells, (2) A * 24: 02 allele, B * 07: 02 allele, B * 52: 01 allele, and C * 12: 02 allele of 585A1 iPS cells prepared in Experimental Example 13 Clone # 3-1 knocked out, (3) Differentiation of 585A1 iPS cell B2M allele knocked out cells (bulk cells not subcloned) produced in Experimental Example 46 described later into EB-derived blood cell-like cells did.
(CIITA遺伝子ノックアウトiPS細胞の作製)
CIITA遺伝子は、Class II Major Histocompatibility Complex Transactivatorタンパク質をコードする遺伝子である。上述したように、CIITA遺伝子の発現はクラスIIのHLAタンパク質の発現に必須であることが知られている。 [Experimental Example 39]
(Preparation of CIITA gene knockout iPS cells)
The CIITA gene is a gene encoding a Class II Major Histocompatibility Complex Transactivator protein. As mentioned above, CIITA gene expression is known to be essential for class II HLA protein expression.
(CD4陽性T細胞活性化試験)
健常人ボランティア#21由来の末梢血単核球細胞(PBMC)からソーティングによりCD4陽性T細胞を回収し、CFSE(ケイマンケミカル社)で染色した。 [Experimental Example 40]
(CD4 positive T cell activation test)
CD4 positive T cells were collected from peripheral blood mononuclear cells (PBMC) derived from
(CD4陽性T細胞、CD8陽性T細胞及びNK細胞の活性化試験)
末梢血単核球細胞(PBMC、型式「LP_329」、CTL社)をCFSE(ケイマンケミカル社)で染色した。下記表57にPBMC(型式「LP_329」、CTL社)のHLAハプロタイプを示す。 [Experimental example 41]
(Activation test of CD4 positive T cell, CD8 positive T cell and NK cell)
Peripheral blood mononuclear cells (PBMC, model “LP — 329”, CTL) were stained with CFSE (Cayman Chemical). Table 57 below shows the HLA haplotypes of PBMC (model “LP — 329”, CTL).

(HLA-C7残存CIITA欠損iPS細胞の作製)
日本人において、第3位のHLAアレル頻度をホモに有するiPSストック細胞(Ff-Xt-28s05 iPS細胞)から、HLA-Aアレル、HLA-Bアレル及びCIITAアレルをノックアウトした。ノックアウトは1段階及び2段階のゲノム編集によりそれぞれ行った。下記表58にFf-Xt-28s05 iPS細胞のHLAハプロタイプを示す。 [Experimental Example 42]
(Preparation of HLA-C7 residual CIITA deficient iPS cells)
In Japanese, HLA-A allele, HLA-B allele, and CIITA allele were knocked out from iPS stock cells (Ff-Xt-28s05 iPS cells) having homology with the third HLA allele frequency. Knockout was performed by genome editing in 1st stage and 2nd stage, respectively. Table 58 below shows HLA haplotypes of Ff-Xt-28s05 iPS cells.

(B2MノックアウトiPS細胞の作製3)
実験例41でも使用したiPSストック細胞(Ff-Xt-28s05 iPS細胞)から、B2Mアレルをノックアウトした。 [Experimental Example 43]
(Preparation of B2M knockout iPS cells 3)
The B2M allele was knocked out from the iPS stock cells (Ff-Xt-28s05 iPS cells) that were also used in Experimental Example 41.
(B2M及びCIITAノックアウトiPS細胞の作製)
実験例41でも使用したiPSストック細胞(Ff-Xt-28s05 iPS細胞)から、B2Mアレル及びCIITAアレルを同時にノックアウトした。 [Experimental Example 44]
(Preparation of B2M and CIITA knockout iPS cells)
From the iPS stock cells (Ff-Xt-28s05 iPS cells) used in Experimental Example 41, the B2M allele and the CIITA allele were simultaneously knocked out.
(B2M及びCIITAノックアウトiPS細胞におけるHLAタンパク質の発現の検討)
実験例44で作製した、Ff-Xt-28s05-MTo#2 iPS細胞におけるHLA-ABCタンパク質の発現を検討した。 [Experimental Example 45]
(Examination of HLA protein expression in B2M and CIITA knockout iPS cells)
The expression of HLA-ABC protein in Ff-Xt-28s05-
(B2MノックアウトiPS細胞の作製4)
585A1 iPS細胞にCas9を発現するプラスミドベクターとB2M特異的なsgRNAをトランスフェクションした。sgRNAとしては、B2M-g2(標的塩基配列を配列番号60に示す。)を使用した。 [Experimental example 46]
(Preparation of B2M knockout iPS cells 4)
585A1 iPS cells were transfected with a plasmid vector expressing Cas9 and a B2M-specific sgRNA. As the sgRNA, B2M-g2 (target base sequence is shown in SEQ ID NO: 60) was used.
(HLAアレル特異的ノックアウト10)
585A1 iPS細胞のHLA-Aアレル、HLA-Bアレル及びHLA-Cアレルをノックアウトした細胞を作製した。具体的には、実験例13で作製した、585A1 iPS細胞のA*24:02アレル、B*07:02アレル及びB*52:01アレルをノックアウトした細胞(クローン#3)に、精製Cas9タンパク質、C*07:02アレル特異的なsgRNA及びC*12:02アレル特異的なsgRNAをトランスフェクションした。 [Experimental example 47]
(HLA allele specific knockout 10)
585A1 iPS cell HLA-A allele, HLA-B allele and HLA-C allele were knocked out. Specifically, purified Cas9 protein was added to cells (clone # 3) in which the A * 24: 02 allele, B * 07: 02 allele and B * 52: 01 allele of 585A1 iPS cells prepared in Experimental Example 13 were knocked out. C * 07: 02 allele specific sgRNA and C * 12: 02 allele specific sgRNA were transfected.
(HLAアレル特異的ノックアウト11)
実験例13で作製した、585A1 iPS細胞のA*24:02アレル、B*07:02アレル及びB*52:01アレルをノックアウトした細胞(クローン#3)に、精製Cas9タンパク質及びC*07:02アレル特異的なsgRNAをトランスフェクションした。 [Experimental Example 48]
(HLA allele-specific knockout 11)
To the cells (clone # 3) knocked out of the A * 24: 02 allele, B * 07: 02 allele and B * 52: 01 allele of 585A1 iPS cells prepared in Experimental Example 13, purified Cas9 protein and C * 07: The 02 allele specific sgRNA was transfected.
(HLAアレル特異的ノックアウト12)
実験例14で作製した、604B1 iPS細胞のA*01:01アレル、A*24:02アレル、B*07:02アレル及びB*37:01アレルをノックアウトした細胞(クローン#4)に、精製Cas9タンパク質及びC*07:02アレル特異的なsgRNAをトランスフェクションした。 [Example 49]
(HLA allele specific knockout 12)
Purification into cells (clone # 4) knocked out of the A * 01: 01 allele, A * 24: 02 allele, B * 07: 02 allele and B * 37: 01 allele of 604B1 iPS cells prepared in Experimental Example 14 Cas9 protein and C * 07: 02 allele specific sgRNA were transfected.
Claims (30)
- レシピエントに他家移植した場合の拒絶反応が低減された低抗原性細胞を、ドナー細胞から製造する製造方法であって、
前記ドナー細胞及び前記レシピエントのHuman Leukocyte Antigen(HLA)アレルをそれぞれ決定することと、
前記レシピエントに存在せず前記ドナー細胞に存在するHLAアレルを特定することと、
特定された前記HLAアレルを破壊又は改変し、前記ドナー細胞に特異的なHLAタンパク質を発現しない細胞を含む細胞集団を得ることと、を含み、
前記ドナー細胞に特異的なHLAタンパク質を発現しない細胞が前記低抗原性細胞である、製造方法。 A method for producing low antigenic cells with reduced rejection when transplanted into a recipient from a donor cell, comprising:
Determining the donor cell and the recipient's Human Leukocyte Antigen (HLA) allele, respectively;
Identifying an HLA allele present in the donor cell that is not present in the recipient;
Destroying or modifying the identified HLA allele to obtain a cell population comprising cells that do not express HLA proteins specific for the donor cells,
The production method, wherein the cells that do not express HLA protein specific for the donor cells are the low antigenic cells. - 前記ドナー細胞及び前記レシピエントの前記HLAアレルをそれぞれ決定することにおいて決定される前記HLAアレルが、HLA-Aアレル、HLA-Bアレル及びHLA-Cアレルを含む、請求項1に記載の製造方法。 The production method according to claim 1, wherein the HLA allele determined in determining the HLA allele of the donor cell and the recipient includes an HLA-A allele, an HLA-B allele, and an HLA-C allele, respectively. .
- 前記ドナー細胞に特異的なHLAタンパク質を発現しない細胞を含む細胞集団を得ることの後に、前記細胞集団から前記ドナー細胞に特異的なHLAタンパク質を発現しない細胞を回収することを更に含み、
前記回収することが、
前記細胞集団にHLAタンパク質発現誘導剤を接触させることと、
前記HLAタンパク質発現誘導剤に接触した前記細胞集団における前記ドナー細胞に特異的なHLAタンパク質の発現を指標として、前記細胞集団から前記ドナー細胞に特異的なHLAタンパク質を発現しない細胞を回収することと、を含む、
請求項1又は2に記載の製造方法。 After obtaining a cell population comprising cells that do not express HLA protein specific for said donor cells, further comprising recovering cells that do not express HLA protein specific for said donor cells from said cell population;
Collecting the
Contacting the cell population with an HLA protein expression inducer;
Recovering cells that do not express HLA protein specific to the donor cell from the cell population, using as an index the expression of the HLA protein specific to the donor cell in the cell population in contact with the HLA protein expression inducer; ,including,
The manufacturing method of Claim 1 or 2. - 前記HLAタンパク質発現誘導剤が、インターフェロン(IFN)-γ、IFN-α、IFN-β、インターロイキン(IL)-4、Granulocyte Macrophage colony-stimulating Factor(GM-CSF)、Transforming growth factor(TGF)-α又はTGF-βである、請求項3に記載の製造方法。 The HLA protein expression inducer is interferon (IFN) -γ, IFN-α, IFN-β, interleukin (IL) -4, Granulocyte macrophage colony-stimulating factor (GM-CSF), Transforming growth factor (TGF). The production method according to claim 3, which is α or TGF-β.
- 前記低抗原性細胞が多能性幹細胞である、請求項1~4のいずれか一項に記載の製造方法。 The production method according to any one of claims 1 to 4, wherein the low antigenic cell is a pluripotent stem cell.
- HLAタンパク質発現誘導剤を含む、レシピエントに他家移植した場合の拒絶反応が低減された低抗原性細胞の検出用キット。 A kit for detecting low antigenic cells with reduced rejection when transplanted to a recipient, including an HLA protein expression inducer.
- 前記HLAタンパク質発現誘導剤が、IFN-γ、IFN-α、IFN-β、IL-4、GM-CSF、TGF-α又はTGF-βである、請求項6に記載のキット。 The kit according to claim 6, wherein the HLA protein expression inducer is IFN-γ, IFN-α, IFN-β, IL-4, GM-CSF, TGF-α or TGF-β.
- 前記低抗原性細胞が多能性幹細胞である、請求項6又は7に記載のキット。 The kit according to claim 6 or 7, wherein the low antigenic cell is a pluripotent stem cell.
- IFN-γ、IFN-α、IFN-β、IL-4、GM-CSF、TGF-α又はTGF-βからなるHLAタンパク質発現誘導剤。 An HLA protein expression inducer comprising IFN-γ, IFN-α, IFN-β, IL-4, GM-CSF, TGF-α or TGF-β.
- 少なくとも1つのHLAアレルが破壊又は改変され、少なくとも1種のHLAタンパク質を発現可能な細胞。 A cell in which at least one HLA allele is disrupted or modified and is capable of expressing at least one HLA protein.
- 前記HLAアレルが、HLA-Aアレル、HLA-Bアレル又はHLA-Cアレルを含む、請求項10に記載の細胞。 The cell according to claim 10, wherein the HLA allele comprises an HLA-A allele, an HLA-B allele, or an HLA-C allele.
- レシピエントに他家移植した場合の拒絶反応が低減された低抗原性細胞であり、破壊又は改変された前記HLAアレルが、前記レシピエントに存在しないHLAアレルである、請求項10又は11に記載の細胞。 12. A low antigenic cell with reduced rejection when transplanted to a recipient, and the disrupted or modified HLA allele is an HLA allele that is not present in the recipient. Cells.
- 多能性幹細胞である、請求項10~12のいずれか一項に記載の細胞。 The cell according to any one of claims 10 to 12, which is a pluripotent stem cell.
- Class II Major Histocompatibility Complex Transactivator(CIITA)アレル、Regulatory Factor X5(RFX5)アレル、Regulatory Factor X Associated Protein(RFXAP)アレル及びRegulatory Factor X Associated Ankyrin Containing Protein(RFXANK)アレルのうち少なくとも1つのアレルが更に破壊又は改変されている、請求項10~13のいずれか一項に記載の細胞。 Class II Major Histocompatibility Complex Transactivator (CIITA) alleles, Regulatory Factor X5 (RFX5) alleles, Regulatory Factor X Associated Protein (RFXAP) allele and Regulatory Factor X Associated Ankyrin Containing Protein (RFXANK) at least one allele of the allele further destruction or The cell according to any one of claims 10 to 13, which has been modified.
- HLA-Aアレル及びHLA-Bアレルが破壊され、少なくとも1種のHLA-Cタンパク質を発現可能な、請求項10~14のいずれか一項に記載の細胞。 The cell according to any one of claims 10 to 14, wherein the HLA-A allele and the HLA-B allele are disrupted and can express at least one HLA-C protein.
- 前記HLA-Cタンパク質が、HLA-C*01:02アレル、HLA-C*02:02アレル、HLA-C*03:03アレル、HLA-C*03:04アレル、HLA-C*04:01アレル、HLA-C*05:01アレル、HLA-C*06:02アレル、HLA-C*07:01アレル、HLA-C*07:02アレル、HLA-C*08:01アレル、HLA-C*12:02アレル及びHLA-C*16:01アレルからなる群より選択される1種のアレルにコードされるタンパク質である、請求項15に記載の細胞。 The HLA-C protein is HLA-C * 01: 02 allele, HLA-C * 02: 02 allele, HLA-C * 03: 03 allele, HLA-C * 03: 04 allele, HLA-C * 04: 01 Allele, HLA-C * 05: 01 allele, HLA-C * 06: 02 allele, HLA-C * 07: 01 allele, HLA-C * 07: 02 allele, HLA-C * 08: 01 allele, HLA-C The cell according to claim 15, which is a protein encoded by one allele selected from the group consisting of the * 12: 02 allele and the HLA-C * 16: 01 allele.
- レシピエントに他家移植した場合の拒絶反応が低減された低抗原性細胞を、ドナー細胞から製造する製造方法であって、
前記ドナー細胞のCIITAアレル、RFX5アレル、RFXAPアレル及びRFXANKアレルのうち少なくとも1つ以上を含むアレルを破壊又は改変すること、を含み、
前記CIITAアレル、RFX5アレル、RFXAPアレル又はRFXANKアレルが破壊又は改変された細胞が前記低抗原性細胞である、製造方法。 A method for producing low antigenic cells with reduced rejection when transplanted into a recipient from a donor cell, comprising:
Destroying or modifying an allele comprising at least one of the CIITA allele, RFX5 allele, RFXAP allele and RFXANK allele of the donor cell,
The production method, wherein the cell in which the CIITA allele, RFX5 allele, RFXAP allele or RFXANK allele is disrupted or modified is the low antigenic cell. - 前記低抗原性細胞が多能性幹細胞である、請求項17に記載の細胞。 The cell according to claim 17, wherein the low antigenic cell is a pluripotent stem cell.
- CIITAアレル、RFX5アレル、RFXAPアレル及びRFXANKアレルのうち少なくとも1つ以上を含むアレルが破壊又は改変された細胞。 A cell in which an allele including at least one of CIITA allele, RFX5 allele, RFXAP allele and RFXANK allele is destroyed or modified.
- 多能性幹細胞である、請求項19に記載の細胞。 The cell according to claim 19, which is a pluripotent stem cell.
- 全HLAハプロタイプのゲノムDNAの塩基配列データに対してマッピングした場合に1つの標的とするHLAハプロタイプにしかマッピングされず、HLAアレル以外の全ゲノムDNAの塩基配列データに対してマッピングした場合にマッピングされない塩基配列を、標的塩基配列とするgRNA。 When mapping to nucleotide sequence data of genomic DNA of all HLA haplotypes, it is mapped only to one target HLA haplotype, and not mapped when mapping to nucleotide sequence data of all genomic DNA other than HLA alleles GRNA whose base sequence is a target base sequence.
- 前記標的塩基配列が、
配列番号3、4、7、45~52、72~2459のいずれかに記載の塩基配列、又は
配列番号3、4、7、45~52、72~2459のいずれかに記載の塩基配列の5’末端において、1若しくは数個の塩基が欠失、置換若しくは付加された塩基配列からなる、請求項21に記載のgRNA。 The target base sequence is
5 of the nucleotide sequence set forth in any of SEQ ID NOs: 3, 4, 7, 45 to 52, 72 to 2459, or the nucleotide sequence set forth in any of SEQ ID NOs: 3, 4, 7, 45 to 52, and 72 to 2459 The gRNA according to claim 21, comprising a nucleotide sequence in which one or several bases are deleted, substituted or added at the 'terminal. - 前記標的塩基配列が、
配列番号3、4、7、45~52のいずれかに記載の塩基配列、又は
配列番号3、4、7、45~52のいずれかに記載の塩基配列の5’末端において、1若しくは数個の塩基が欠失、置換若しくは付加された塩基配列からなる、請求項21又は22に記載のgRNA。 The target base sequence is
One or several nucleotide sequences at the 5 ′ end of the nucleotide sequence set forth in any of SEQ ID NOs: 3, 4, 7, 45 to 52, or the nucleotide sequence set forth in any of SEQ ID NOs: 3, 4, 7, 45 to 52 23. The gRNA according to claim 21 or 22, comprising a base sequence in which the base of is deleted, substituted or added. - 前記標的塩基配列が、HLA遺伝子のエクソン2又は3にマッピングされる、請求項21~23のいずれか一項に記載のgRNA。 The gRNA according to any one of claims 21 to 23, wherein the target base sequence is mapped to exon 2 or 3 of the HLA gene.
- 全HLAハプロタイプのゲノムDNAの塩基配列データに対してマッピングした場合に2つ以上の標的とするHLAハプロタイプにマッピングされ、HLAアレル以外の全ゲノムDNAの塩基配列データに対してマッピングした場合にマッピングされない塩基配列を、標的塩基配列とするgRNA。 When mapping to nucleotide sequence data of genomic DNA of all HLA haplotypes, it is mapped to two or more target HLA haplotypes, and not mapped when mapping to nucleotide sequence data of total genomic DNA other than HLA alleles GRNA whose base sequence is a target base sequence.
- 前記標的塩基配列が、
配列番号53~55、2460~8013のいずれかに記載の塩基配列、又は
配列番号53~55、2460~8013のいずれかに記載の塩基配列の5’末端において、1若しくは数個の塩基が欠失、置換若しくは付加された塩基配列からなる、請求項25に記載のgRNA。 The target base sequence is
One or several bases are missing at the 5 ′ end of the nucleotide sequence set forth in any of SEQ ID NOs: 53-55 and 2460-8013, or the nucleotide sequence set forth in any of SEQ ID NOs: 53-55, 2460-8013 26. The gRNA according to claim 25, comprising a missing, substituted or added base sequence. - 前記標的塩基配列が、
配列番号53~55のいずれかに記載の塩基配列、又は
配列番号53~55のいずれかに記載の塩基配列の5’末端において、1若しくは数個の塩基が欠失、置換若しくは付加された塩基配列からなる、請求項25又は26に記載のgRNA。 The target base sequence is
A base sequence according to any of SEQ ID NOs: 53 to 55, or a base in which one or several bases are deleted, substituted or added at the 5 ′ end of the base sequence according to any of SEQ ID NOs: 53 to 55 27. The gRNA according to claim 25 or 26, comprising a sequence. - 前記標的塩基配列が、HLA遺伝子のエクソン2又は3にマッピングされる、請求項25~27のいずれか一項に記載のgRNA。 The gRNA according to any one of claims 25 to 27, wherein the target base sequence is mapped to exon 2 or 3 of the HLA gene.
- レシピエントに他家移植した場合の拒絶反応が低減された低抗原性細胞をゲノム編集により製造するための標的塩基配列の特定方法であって、
全HLAハプロタイプのゲノムDNAの塩基配列データに対して、候補塩基配列をマッピングすることと、
HLAアレル以外の全ゲノムDNAの塩基配列データに対して、前記候補塩基配列をマッピングすることと、
全HLAハプロタイプのゲノムDNAの塩基配列データに対してマッピングした場合に1つの標的とするHLAハプロタイプにしかマッピングされず、HLAアレル以外の全ゲノムDNAの塩基配列データに対してマッピングした場合にマッピングされない前記候補塩基配列を、標的塩基配列として特定することと、を含む、方法。 A method for identifying a target nucleotide sequence for producing a low antigenic cell with reduced rejection when transplanted into a recipient by genome editing,
Mapping candidate base sequences to base sequence data of genomic DNA of all HLA haplotypes;
Mapping the candidate base sequence to base sequence data of whole genomic DNA other than the HLA allele;
When mapping to nucleotide sequence data of genomic DNA of all HLA haplotypes, it is mapped only to one target HLA haplotype, and not mapped when mapping to nucleotide sequence data of all genomic DNA other than HLA alleles Identifying the candidate base sequence as a target base sequence. - レシピエントに他家移植した場合の拒絶反応が低減された低抗原性細胞をゲノム編集により製造するための標的塩基配列の特定方法であって、
全HLAハプロタイプのゲノムDNAの塩基配列データに対して、候補塩基配列をマッピングすることと、
HLAアレル以外の全ゲノムDNAの塩基配列データに対して、前記候補塩基配列をマッピングすることと、
全HLAハプロタイプのゲノムDNAの塩基配列データに対してマッピングした場合に2つ以上の標的とするHLAハプロタイプにマッピングされ、HLAアレル以外の全ゲノムDNAの塩基配列データに対してマッピングした場合にマッピングされない前記候補塩基配列を、標的塩基配列として特定することと、を含む、方法。 A method for identifying a target nucleotide sequence for producing a low antigenic cell with reduced rejection when transplanted into a recipient by genome editing,
Mapping candidate base sequences to base sequence data of genomic DNA of all HLA haplotypes;
Mapping the candidate base sequence to base sequence data of whole genomic DNA other than the HLA allele;
When mapping to nucleotide sequence data of genomic DNA of all HLA haplotypes, it is mapped to two or more target HLA haplotypes, and not mapped when mapping to nucleotide sequence data of total genomic DNA other than HLA alleles Identifying the candidate base sequence as a target base sequence.
Priority Applications (9)
| Application Number | Priority Date | Filing Date | Title |
|---|---|---|---|
| US16/969,222 US20200407693A1 (en) | 2018-02-16 | 2019-02-15 | Method for producing low-antigenic cell |
| SG11202007563XA SG11202007563XA (en) | 2018-02-16 | 2019-02-15 | Method for producing low-antigenic cell |
| KR1020207021384A KR20200122306A (en) | 2018-02-16 | 2019-02-15 | Method for producing resistant cells |
| CN201980012715.XA CN111757932A (en) | 2018-02-16 | 2019-02-15 | Method for producing low-antigenicity cell |
| JP2020500578A JP7385281B2 (en) | 2018-02-16 | 2019-02-15 | Method for producing low antigenicity cells |
| CA3091136A CA3091136A1 (en) | 2018-02-16 | 2019-02-15 | Method for producing low-antigenic cell |
| EP19753818.4A EP3754018A4 (en) | 2018-02-16 | 2019-02-15 | Method for producing low-antigenic cell |
| IL276597A IL276597A (en) | 2018-02-16 | 2020-08-09 | Method for producing low-antigenic cell |
| JP2023109941A JP2023126897A (en) | 2018-02-16 | 2023-07-04 | Method for producing low antigenicity cell |
Applications Claiming Priority (2)
| Application Number | Priority Date | Filing Date | Title |
|---|---|---|---|
| JP2018-026421 | 2018-02-16 | ||
| JP2018026421 | 2018-02-16 |
Publications (1)
| Publication Number | Publication Date |
|---|---|
| WO2019160077A1 true WO2019160077A1 (en) | 2019-08-22 |
Family
ID=67618722
Family Applications (1)
| Application Number | Title | Priority Date | Filing Date |
|---|---|---|---|
| PCT/JP2019/005524 WO2019160077A1 (en) | 2018-02-16 | 2019-02-15 | Method for producing low-antigenic cell |
Country Status (9)
| Country | Link |
|---|---|
| US (1) | US20200407693A1 (en) |
| EP (1) | EP3754018A4 (en) |
| JP (2) | JP7385281B2 (en) |
| KR (1) | KR20200122306A (en) |
| CN (1) | CN111757932A (en) |
| CA (1) | CA3091136A1 (en) |
| IL (1) | IL276597A (en) |
| SG (1) | SG11202007563XA (en) |
| WO (1) | WO2019160077A1 (en) |
Cited By (8)
| Publication number | Priority date | Publication date | Assignee | Title |
|---|---|---|---|---|
| CN112481310A (en) * | 2019-09-12 | 2021-03-12 | 华东师范大学 | Universal CAR-T cell targeting HLA-I molecules and application thereof |
| JP2021182900A (en) * | 2020-05-20 | 2021-12-02 | 國立中央大學 | Universal human induced pluripotent stem cell, and method for generating the same |
| WO2021241658A1 (en) * | 2020-05-26 | 2021-12-02 | 株式会社ヘリオス | Hypoimmunogenic cells |
| WO2022140586A3 (en) * | 2020-12-23 | 2022-08-04 | Intellia Therapeutics, Inc. | Compositions and methods for reducing hla-a in a cell |
| WO2022191216A1 (en) | 2021-03-09 | 2022-09-15 | 国立研究開発法人理化学研究所 | Method for producing hypoimmunogenic retinal pigment epithelial cells |
| CN115087732A (en) * | 2020-02-07 | 2022-09-20 | 学校法人顺天堂 | Cytotoxic T cells from human T cell-derived iPS cells |
| WO2023047524A1 (en) | 2021-09-24 | 2023-03-30 | 公益財団法人京都大学iPS細胞研究財団 | Method for producing modified human induced pluripotent stem cells |
| WO2023191063A1 (en) * | 2022-04-01 | 2023-10-05 | 株式会社Logomix | Cell suitable for gene engineering, cell engineering and cellular medicine, and method for producing same |
Families Citing this family (3)
| Publication number | Priority date | Publication date | Assignee | Title |
|---|---|---|---|---|
| WO2021163191A1 (en) * | 2020-02-10 | 2021-08-19 | Board Of Regents, The University Of Texas System | Methods for rapid cloning and expression of hla class i cells |
| WO2023245109A2 (en) * | 2022-06-16 | 2023-12-21 | Intellia Therapeutics, Inc. | Compositions and methods for genomic editing |
| WO2023245108A2 (en) * | 2022-06-16 | 2023-12-21 | Intellia Therapeutics, Inc. | Compositions and methods for reducing mhc class i in a cell |
Citations (6)
| Publication number | Priority date | Publication date | Assignee | Title |
|---|---|---|---|---|
| WO2012145384A1 (en) | 2011-04-20 | 2012-10-26 | University Of Washington Through Its Center For Commercialization | Beta-2 microglobulin-deficient cells |
| JP2016513460A (en) * | 2013-03-12 | 2016-05-16 | サンガモ バイオサイエンシーズ, インコーポレイテッド | Methods and compositions for modifying HLA |
| WO2016183041A2 (en) * | 2015-05-08 | 2016-11-17 | President And Fellows Of Harvard College | Universal donor stem cells and related methods |
| WO2016201047A1 (en) * | 2015-06-09 | 2016-12-15 | Editas Medicine, Inc. | Crispr/cas-related methods and compositions for improving transplantation |
| JP2017523813A (en) * | 2014-08-06 | 2017-08-24 | カレッジ オブ メディシン ポチョン チャ ユニバーシティ インダストリー−アカデミック コーオペレイション ファウンデーション | Immunocompatible cells produced by nuclease-mediated editing of genes encoding HLA |
| JP2018026421A (en) | 2016-08-09 | 2018-02-15 | 株式会社東芝 | Magnetic storage device |
Family Cites Families (2)
| Publication number | Priority date | Publication date | Assignee | Title |
|---|---|---|---|---|
| KR102228828B1 (en) * | 2014-03-11 | 2021-03-16 | 셀렉티스 | Method for generating t-cells compatible for allogenic transplantation |
| CN107208055B (en) * | 2015-01-17 | 2021-06-15 | 浙江大学 | Modified cells causing reduced immunogenic response |
-
2019
- 2019-02-15 US US16/969,222 patent/US20200407693A1/en active Pending
- 2019-02-15 WO PCT/JP2019/005524 patent/WO2019160077A1/en unknown
- 2019-02-15 EP EP19753818.4A patent/EP3754018A4/en active Pending
- 2019-02-15 JP JP2020500578A patent/JP7385281B2/en active Active
- 2019-02-15 CA CA3091136A patent/CA3091136A1/en active Pending
- 2019-02-15 CN CN201980012715.XA patent/CN111757932A/en active Pending
- 2019-02-15 SG SG11202007563XA patent/SG11202007563XA/en unknown
- 2019-02-15 KR KR1020207021384A patent/KR20200122306A/en not_active Application Discontinuation
-
2020
- 2020-08-09 IL IL276597A patent/IL276597A/en unknown
-
2023
- 2023-07-04 JP JP2023109941A patent/JP2023126897A/en active Pending
Patent Citations (6)
| Publication number | Priority date | Publication date | Assignee | Title |
|---|---|---|---|---|
| WO2012145384A1 (en) | 2011-04-20 | 2012-10-26 | University Of Washington Through Its Center For Commercialization | Beta-2 microglobulin-deficient cells |
| JP2016513460A (en) * | 2013-03-12 | 2016-05-16 | サンガモ バイオサイエンシーズ, インコーポレイテッド | Methods and compositions for modifying HLA |
| JP2017523813A (en) * | 2014-08-06 | 2017-08-24 | カレッジ オブ メディシン ポチョン チャ ユニバーシティ インダストリー−アカデミック コーオペレイション ファウンデーション | Immunocompatible cells produced by nuclease-mediated editing of genes encoding HLA |
| WO2016183041A2 (en) * | 2015-05-08 | 2016-11-17 | President And Fellows Of Harvard College | Universal donor stem cells and related methods |
| WO2016201047A1 (en) * | 2015-06-09 | 2016-12-15 | Editas Medicine, Inc. | Crispr/cas-related methods and compositions for improving transplantation |
| JP2018026421A (en) | 2016-08-09 | 2018-02-15 | 株式会社東芝 | Magnetic storage device |
Non-Patent Citations (1)
| Title |
|---|
| ISHIDA ET AL.: "Site-specific randomization of the endogenous genome by a regulatable CRISPR-Cas9 piggyBac system in human cells", SCI. REP., vol. 8, 2018, pages 310 |
Cited By (9)
| Publication number | Priority date | Publication date | Assignee | Title |
|---|---|---|---|---|
| CN112481310A (en) * | 2019-09-12 | 2021-03-12 | 华东师范大学 | Universal CAR-T cell targeting HLA-I molecules and application thereof |
| CN115087732A (en) * | 2020-02-07 | 2022-09-20 | 学校法人顺天堂 | Cytotoxic T cells from human T cell-derived iPS cells |
| JP2021182900A (en) * | 2020-05-20 | 2021-12-02 | 國立中央大學 | Universal human induced pluripotent stem cell, and method for generating the same |
| JP7028928B2 (en) | 2020-05-20 | 2022-03-02 | 國立中央大學 | Universal human-induced pluripotent stem cells and their production methods |
| WO2021241658A1 (en) * | 2020-05-26 | 2021-12-02 | 株式会社ヘリオス | Hypoimmunogenic cells |
| WO2022140586A3 (en) * | 2020-12-23 | 2022-08-04 | Intellia Therapeutics, Inc. | Compositions and methods for reducing hla-a in a cell |
| WO2022191216A1 (en) | 2021-03-09 | 2022-09-15 | 国立研究開発法人理化学研究所 | Method for producing hypoimmunogenic retinal pigment epithelial cells |
| WO2023047524A1 (en) | 2021-09-24 | 2023-03-30 | 公益財団法人京都大学iPS細胞研究財団 | Method for producing modified human induced pluripotent stem cells |
| WO2023191063A1 (en) * | 2022-04-01 | 2023-10-05 | 株式会社Logomix | Cell suitable for gene engineering, cell engineering and cellular medicine, and method for producing same |
Also Published As
| Publication number | Publication date |
|---|---|
| CN111757932A (en) | 2020-10-09 |
| EP3754018A1 (en) | 2020-12-23 |
| EP3754018A4 (en) | 2021-11-24 |
| CA3091136A1 (en) | 2019-08-22 |
| SG11202007563XA (en) | 2020-09-29 |
| JPWO2019160077A1 (en) | 2021-03-18 |
| KR20200122306A (en) | 2020-10-27 |
| JP7385281B2 (en) | 2023-11-22 |
| US20200407693A1 (en) | 2020-12-31 |
| IL276597A (en) | 2020-09-30 |
| JP2023126897A (en) | 2023-09-12 |
Similar Documents
| Publication | Publication Date | Title |
|---|---|---|
| JP7385281B2 (en) | Method for producing low antigenicity cells | |
| US11590171B2 (en) | Targeted replacement of endogenous T cell receptors | |
| EP3194578B1 (en) | Immune-compatible cells created by nuclease-mediated editing of genes encoding hla | |
| JP2018518182A (en) | CRISPR / CAS9 complex for genome editing | |
| US20210130817A1 (en) | Gene Editing System and Gene Editing Method | |
| WO2018232356A1 (en) | Targeted non-viral dna insertions | |
| Kitano et al. | Generation of hypoimmunogenic induced pluripotent stem cells by CRISPR-Cas9 system and detailed evaluation for clinical application | |
| JP2020528046A (en) | Compositions and Methods for Enhancing the Efficacy of T Cell-Based Immunotherapy | |
| US20230416747A1 (en) | Safe harbor loci | |
| EP4112720A1 (en) | Genetically modified megakaryocyte, modified platelet, and methods respectively for producing said genetically modified megakaryocyte and said modified platelet | |
| WO2022143783A1 (en) | Methods of identifying t-cell modulating genes | |
| WO2023191063A1 (en) | Cell suitable for gene engineering, cell engineering and cellular medicine, and method for producing same | |
| Yang et al. | In situ correction of various β-thalassemia mutations in human hematopoietic stem cells | |
| WO2022093846A1 (en) | Safe harbor loci |
Legal Events
| Date | Code | Title | Description |
|---|---|---|---|
| 121 | Ep: the epo has been informed by wipo that ep was designated in this application |
Ref document number: 19753818 Country of ref document: EP Kind code of ref document: A1 |
|
| ENP | Entry into the national phase |
Ref document number: 2020500578 Country of ref document: JP Kind code of ref document: A |
|
| ENP | Entry into the national phase |
Ref document number: 3091136 Country of ref document: CA |
|
| NENP | Non-entry into the national phase |
Ref country code: DE |
|
| ENP | Entry into the national phase |
Ref document number: 2019753818 Country of ref document: EP Effective date: 20200916 |