WO2018186437A1 - センサモジュールおよび機械学習と親和性の高いシステム - Google Patents
センサモジュールおよび機械学習と親和性の高いシステム Download PDFInfo
- Publication number
- WO2018186437A1 WO2018186437A1 PCT/JP2018/014399 JP2018014399W WO2018186437A1 WO 2018186437 A1 WO2018186437 A1 WO 2018186437A1 JP 2018014399 W JP2018014399 W JP 2018014399W WO 2018186437 A1 WO2018186437 A1 WO 2018186437A1
- Authority
- WO
- WIPO (PCT)
- Prior art keywords
- sensor
- signal
- sensor module
- feature
- feature amount
- Prior art date
- Legal status (The legal status is an assumption and is not a legal conclusion. Google has not performed a legal analysis and makes no representation as to the accuracy of the status listed.)
- Ceased
Links
Images






Classifications
-
- G—PHYSICS
- G01—MEASURING; TESTING
- G01M—TESTING STATIC OR DYNAMIC BALANCE OF MACHINES OR STRUCTURES; TESTING OF STRUCTURES OR APPARATUS, NOT OTHERWISE PROVIDED FOR
- G01M99/00—Subject matter not provided for in other groups of this subclass
Definitions
- the present invention relates to a sensor module that receives a sensor signal from a sensor applied to a pump and outputs data, and a system having a high affinity with machine learning including the sensor module.
- Patent Document 1 discloses an acceleration sensor that detects an acceleration component applied to an infusion tube, and an infusion signal from the detection signal of the acceleration sensor.
- a drop measurement device including a droplet information acquisition unit that acquires information about a droplet that falls in a cylinder, and a display control unit that displays information acquired by the droplet information acquisition unit on a display unit Yes.
- the drip measurement apparatus of Patent Document 1 detects information about a droplet falling in the drip tube from a feature amount of a waveform obtained by detecting an acceleration component applied to the drip tube and synthesizing this detection signal in time series. is doing. Specifically, it is necessary for the engineer to extract the feature value indicated by the time axis waveform, and the engineer is required to have a high level of expertise, and the engineer must work for each individual case. there were. Therefore, an object of the present invention is to solve the above-described problems and provide a highly versatile sensor module and a system having high affinity with machine learning.
- the sensor module of the present invention comprises: A signal detector for receiving a sensor signal from a sensor applied to the pump; A feature vector calculation unit that extracts a feature amount indicating an abnormality in the liquid flow path of the pump from the sensor signal; A signal output unit for outputting the feature amount; It has.
- the feature vector calculation unit extracts the feature amount using at least one of frequency analysis and statistical analysis. It is preferable.
- the feature vector computing unit extracts the feature amount using a feature extraction algorithm generated in advance by machine learning; It is preferable.
- the sensor module further includes an abnormality detection unit that determines whether or not the feature amount indicates abnormality using an abnormality detection algorithm generated in advance by machine learning. It is preferable.
- the signal detection unit receives an auxiliary sensor signal from one or more auxiliary sensors of the pump,
- the feature vector calculation unit further extracts the feature amount using the auxiliary sensor signal; It is preferable.
- the signal output unit outputs the sensor signal together with the feature amount. It is preferable.
- the system having high affinity with the machine learning of the present invention is The sensor module described above; A computer for receiving data output from the sensor module; Is provided.
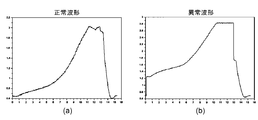
- (A) is a waveform of a sensor signal during normal liquid feeding
- (b) is a waveform of a sensor signal when a blockage occurs upstream of the infusion pump.
- (A) and (b) are the images which carried out the Fourier transformation of the waveform of Fig.8 (a) (b), respectively.
- (A) and (b) are the waveforms which showed typically the image of Drawing 9 (a) and (b), respectively. It is a figure for demonstrating the usage example of a 1st and 2nd rotation sensor signal.
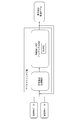
- FIG. 1 is a schematic view of a sensor module according to the first embodiment of the present invention.
- the sensor module 10a receives the sensor signal S and outputs data to a computer (not shown) such as a client. As will be described later, this data is data that can be applied to machine learning in a computer, that is, data having high affinity with machine learning.
- the sensor module 10a includes a signal detection unit 11 that receives the sensor signal S from the sensor applied to the pump, and a feature amount that indicates an abnormality (for example, blockage or bubble mixing) in the liquid supply path of the pump from the sensor signal S.
- a feature vector calculation unit 12 to extract and a signal output unit 13 to output a feature amount are provided.
- the feature vector calculation unit 12 can extract a feature amount from the sensor signal S using frequency analysis.
- the feature vector calculation unit 12 detects a difference between a waveform obtained by Fourier transforming the sensor signal S at normal time and a waveform obtained by Fourier transforming the sensor signal S at abnormal time, and extracts the difference as a feature amount. Can do. By using this method, it is not necessary for the engineer to extract the feature amount indicated by the time axis waveform, and the data amount can be compressed.
- the feature vector calculation unit 12 may extract a feature amount from the sensor signal S by using statistical analysis such as a maximum value, a minimum value, or a median value instead of or in addition to the frequency analysis.
- the feature vector calculation unit 12 can extract a feature amount from the sensor signal S by using an algorithm for feature extraction generated in advance by machine learning. Hereinafter, this method will be described with reference to FIG.
- FIG. 2 is a diagram for explaining an algorithm design process using data mining technology.
- a feature extraction algorithm is generated from a large number of learning data and verification data by a data mining process.
- the feature extraction algorithm is an algorithm for extracting five parameters related to abnormality determination as feature amounts when the learning data and the verification data have 1000 parameters.
- the feature extraction algorithm generated in this way is incorporated in the feature vector calculation unit 12.
- an abnormality detection mathematical model (an abnormality detection algorithm) is generated from the extracted feature quantity by machine learning such as SVM. For example, when n parameter values a1, a2,..., An related to abnormality determination are extracted, weighting factors w1, w2,..., Wn corresponding to these parameter values are used.
- Formula Z w1 ⁇ a1 + w2 ⁇ a2 +... + Wn ⁇ an + b (b is an offset value) is generated, and it is determined that Z is normal when Z> 0 and is abnormal when Z ⁇ 0.
- the abnormality detection algorithm generated in this way is incorporated in the abnormality detection unit 14 described with reference to FIG.
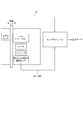
- FIG. 3 is a schematic view of a sensor module according to the second embodiment of the present invention.
- the sensor module 10b according to the second embodiment further includes an abnormality detection unit 14, and the signal detection unit 11 receives the first and second auxiliary sensor signals Sr1 and Sr2 from the first and second auxiliary sensors.
- the sensor module 10a is the same as that of the first embodiment. Note that the number of auxiliary sensors is not limited to two, and may be one or three or more.
- the abnormality detection unit 14 has a determination unit, and can determine whether or not the feature amount indicates abnormality using an abnormality detection algorithm generated in advance by machine learning.
- the abnormality detection unit 14 performs abnormality determination by substituting the feature quantities a1, a2,..., An into the above-described mathematical formula Z using the feature quantities. For example, when Z> 0, it is normal and is determined to be Pass, and when Z ⁇ 0 is abnormal, it is determined to be Fail. Further, the type of defect such as defects A, B,.
- the first and second auxiliary sensors are, for example, rotation sensors.
- the rotation sensor is a sensor that the pump normally has, and is provided in the encoder to detect the rotational position of the motor.
- First and second auxiliary sensors (hereinafter sometimes referred to as rotation sensors) output first and second auxiliary sensor signals (hereinafter also referred to as rotation sensor signals) Sr1 and Sr2. .
- the signal detection unit 11 further receives the first and second rotation sensor signals Sr1 and Sr2 in addition to the sensor signal S, and transmits the received signals S, Sr1 and Sr2 to the feature vector calculation unit 12.
- the feature vector calculation unit 12 can further extract the feature amount using the first and second rotation sensor signals Sr1 and Sr2 in an auxiliary manner.
- the abnormality detection unit 14 can also use the first and second rotation sensor signals Sr1 and Sr2 in an auxiliary manner to determine whether or not the feature value indicates abnormality.
- FIG. 4 is a schematic view of a sensor module according to the third embodiment of the present invention.
- the signal detection unit 11 transmits the sensor signal S to the signal output unit 13, and the signal output unit 13 outputs the sensor signal S together with the feature amount in the first embodiment. This is the same as the sensor module 10a according to the above.
- the reason why the signal output unit 13 outputs the sensor signal S together with the feature amount is that there are cases where the sensor signal S as raw data is requested depending on the client that uses the output data.
- FIGS. 5A and 5B are diagrams illustrating an example of output data.
- One block represents data output at a time at a certain time.
- a feature amount is output together with the sensor signals S1, S2,.
- the feature quantity output together with the sensor signal S11 is the feature quantity extracted from S1 to S10
- the feature quantity output together with the sensor signal S12 is the feature quantity extracted from S2 to S11.
- the feature amount output together with the sensor signal S13 is the feature amount extracted from S3 to S12.
- the feature value output together with the sensor signal is a feature value extracted from the ten sensor signals immediately preceding the sensor signal.
- the feature amount output together with the sensor signal S11 is the feature amount extracted from S1 to S10
- the feature amount output together with the sensor signal S12 is also extracted from S1 to S10.
- the feature quantity output together with the sensor signal S13 is also the feature quantity extracted from S1 to S10.
- the feature values output together with the sensor signals S11 to S20 are the same as the feature values extracted from S1 to S10. Note that the method for extracting the feature amount output together with the sensor signal is not limited to the illustrated example.
- the present invention can also provide a system having high affinity for machine learning including the above-described sensor module and a computer that receives data output from the sensor module (in the above-described example, a client computer).
- FIG. 6 is a schematic view in which the sensor module of the present invention is applied to a commercially available infusion pump.
- the infusion pump is a finger-type infusion pump, and includes an infusion tube as a liquid feeding path, a cam + finger, a motor, an encoder, and first and second rotation sensors.
- a strain sensor for measuring the internal pressure of the infusion tube is attached to the infusion tube.
- the sensor signal S from the strain sensor and the rotation sensor signals Sr1 and Sr2 from the first and second rotation sensors are transmitted to the sensor module.
- FIG. 7 is a diagram illustrating the waveform of the sensor signal S and the waveforms of the first and second rotation sensor signals Sr1 and Sr2.
- Fig. 7 (a) shows a waveform during normal liquid feeding
- Fig. 7 (b) shows a waveform (abnormality 1) when an occlusion occurs upstream of the infusion pump
- Fig. 7 (c) shows an infusion. It is a waveform (abnormality 2) when bubbles are mixed in the tube.
- FIG. 7B it can be seen that the amplitude of the sensor signal S is lower than the amplitude of the sensor signal S at the normal time, as indicated by x. This indicates that an occlusion occurs upstream of the infusion pump and the infusion tube is crushed.
- a step is generated in the sensor signal S as indicated by y. This indicates that the liquid is flowing backward in the infusion tube.
- the amplitude of the sensor signal S is lower than the amplitude of the sensor signal S at the normal time, as indicated by z. This indicates that air bubbles are mixed in the infusion tube.
- the feature amount is extracted from the sensor signal S using at least one of frequency analysis and statistical analysis as the first method, or described with reference to FIG. 2 as the second method.
- FIGS. 8 to 10 are diagrams for explaining the first method.
- FIG. 8A shows the waveform of the sensor signal S at the time of normal liquid feeding
- FIG. 8B shows the waveform of the sensor signal S when a blockage occurs upstream of the infusion pump.
- FIGS. 9A and 9B are images obtained by Fourier transforming the waveforms of FIGS. 8A and 8B, respectively.
- FIGS. 10A and 10B are waveforms schematically showing the images of FIGS. 9A and 9B, respectively. 8 to 10, when an abnormal waveform is Fourier-transformed, a peak that does not appear when a normal waveform is Fourier-transformed is observed in a specific frequency band. This peak is a feature amount.
- a peak that is a feature amount can be extracted using frequency analysis.
- the wavelet transform is a so-called three-dimensional Fourier transform including time, frequency, and power.
- the X axis represents time
- the Y axis represents frequency
- the Z axis represents power.
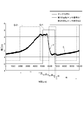
- FIG. 11 is a diagram for explaining an example of use of the first and second rotation sensor signals Sr1 and Sr2.
- the combination of the first and second rotation sensor signals (Sr1, Sr2) is as follows: period t1 (0, 1) ⁇ period t2 (0, 0) ⁇ period t3 (1, 0) ⁇ period t4 (1, 1) ⁇ Period t5 (0, 1) ⁇ period t6 (0, 0) ⁇ ... Is repeated.
- the period t4 (1, 1) that is, the first rotation sensor signal Sr1 remains 1, and the second rotation sensor signal Sr2 is switched from 0 to 1.
- the period t3 (1, 0) ⁇ By using the time point at which the period t4 (1, 1) is switched as a trigger, the feature amount can be extracted efficiently.
Landscapes
- Physics & Mathematics (AREA)
- General Physics & Mathematics (AREA)
- Testing And Monitoring For Control Systems (AREA)
- Testing Of Devices, Machine Parts, Or Other Structures Thereof (AREA)
Abstract
汎用性の高いセンサモジュールおよび機械学習と親和性の高いシステムを提供する。 センサモジュールは、ポンプに適用されたセンサから、センサ信号を受信する信号検出部と、センサ信号から、ポンプの送液路の異常を示す特徴量を抽出する特徴ベクトル演算部と、特徴量を出力する信号出力部と、を備えている。特徴ベクトル演算部は、周波数解析および統計解析の少なくとも一方を用いて特徴量を抽出する、または、予め機械学習によって生成された特徴抽出用のアルゴリズムを用いて特徴量を抽出することが好ましい。
Description
本発明は、ポンプに適用されたセンサからのセンサ信号を受信し、データを出力するセンサモジュール、および、このセンサモジュールを備える、機械学習と親和性の高いシステムに関するものである。
ポンプに適用されたセンサからのセンサ信号を受信し、データを出力するセンサモジュールとして、例えば特許文献1には、点滴筒に加わる加速度成分を検出する加速度センサと、加速度センサの検出信号から、点滴筒内を落下する液滴に関する情報を取得する液滴情報取得部と、液滴情報取得部により取得された情報を、表示部に表示させる表示制御部と、を備える滴下測定装置が提案されている。
特許文献1の滴下測定装置は、点滴筒に加わる加速度成分を検出し、この検出信号を時系列に合成処理して得た波形の特徴量から、点滴筒内を落下する液滴に関する情報を取得している。具体的には、技術者が、時間軸波形が示す特徴量を抽出する必要があり、技術者には高度な専門知識が要求されるとともに、個別の事例ごとに技術者が作業をする必要があった。
そこで、本発明の目的は、上述した問題点を解消し、汎用性の高いセンサモジュールおよび機械学習と親和性の高いシステムを提供することにある。
そこで、本発明の目的は、上述した問題点を解消し、汎用性の高いセンサモジュールおよび機械学習と親和性の高いシステムを提供することにある。
本発明のセンサモジュールは、
ポンプに適用されたセンサから、センサ信号を受信する信号検出部と、
前記センサ信号から、前記ポンプの送液路の異常を示す特徴量を抽出する特徴ベクトル演算部と、
前記特徴量を出力する信号出力部と、
を備えている。
ポンプに適用されたセンサから、センサ信号を受信する信号検出部と、
前記センサ信号から、前記ポンプの送液路の異常を示す特徴量を抽出する特徴ベクトル演算部と、
前記特徴量を出力する信号出力部と、
を備えている。
前記特徴ベクトル演算部は、周波数解析および統計解析の少なくとも一方を用いて前記特徴量を抽出する、
ことが好ましい。
ことが好ましい。
前記特徴ベクトル演算部は、予め機械学習によって生成された特徴抽出用のアルゴリズムを用いて前記特徴量を抽出する、
ことが好ましい。
ことが好ましい。
前記センサモジュールは、予め機械学習によって生成された異常検出用のアルゴリズムを用いて前記特徴量が異常を示すか否かを判定する異常検出部をさらに備えている、
ことが好ましい。
ことが好ましい。
前記信号検出部は、前記ポンプが有する1つ以上の補助センサから補助センサ信号を受信し、
前記特徴ベクトル演算部は、前記補助センサ信号をさらに用いて前記特徴量を抽出する、
ことが好ましい。
前記特徴ベクトル演算部は、前記補助センサ信号をさらに用いて前記特徴量を抽出する、
ことが好ましい。
前記信号出力部は、前記特徴量とともに前記センサ信号を出力する、
ことが好ましい。
ことが好ましい。
本発明の機械学習と親和性の高いシステムは、
上述したセンサモジュールと、
前記センサモジュールの出力するデータを受信するコンピュータと、
を備える。
上述したセンサモジュールと、
前記センサモジュールの出力するデータを受信するコンピュータと、
を備える。
図1は、本発明の第1実施形態に係るセンサモジュールの概略図である。
センサモジュール10aは、センサ信号Sを受信し、クライアント等のコンピュータ(図示せず)に対してデータを出力する。このデータは、後述するように、コンピュータにおいて機械学習に適用することが可能なデータ、すなわち、機械学習と親和性の高いデータである。
センサモジュール10aは、ポンプに適用されたセンサから、センサ信号Sを受信する信号検出部11と、センサ信号Sから、ポンプの送液路の異常(例えば、閉塞、気泡混入)を示す特徴量を抽出する特徴ベクトル演算部12と、特徴量を出力する信号出力部13と、を備えている。
特徴ベクトル演算部12は、周波数解析を用いて、センサ信号Sから特徴量を抽出することができる。例えば、特徴ベクトル演算部12は、正常時のセンサ信号Sをフーリエ変換した波形と、異常時のセンサ信号Sをフーリエ変換した波形と、の差分を検出し、当該差分を特徴量として抽出することができる。この手法を用いることにより、技術者が、時間軸波形が示す特徴量を抽出する必要がなくなり、データ量を圧縮することもできる。
なお、特徴ベクトル演算部12は、周波数解析に代えてあるいは加えて、最大値、最小値または中央値等の統計解析を用い、センサ信号Sから特徴量を抽出するようにしてもよい。
あるいは、特徴ベクトル演算部12は、予め機械学習によって生成された特徴抽出用のアルゴリズムを用いて、センサ信号Sから特徴量を抽出することもできる。以下、図2を用いてこの方法を説明する。
センサモジュール10aは、センサ信号Sを受信し、クライアント等のコンピュータ(図示せず)に対してデータを出力する。このデータは、後述するように、コンピュータにおいて機械学習に適用することが可能なデータ、すなわち、機械学習と親和性の高いデータである。
センサモジュール10aは、ポンプに適用されたセンサから、センサ信号Sを受信する信号検出部11と、センサ信号Sから、ポンプの送液路の異常(例えば、閉塞、気泡混入)を示す特徴量を抽出する特徴ベクトル演算部12と、特徴量を出力する信号出力部13と、を備えている。
特徴ベクトル演算部12は、周波数解析を用いて、センサ信号Sから特徴量を抽出することができる。例えば、特徴ベクトル演算部12は、正常時のセンサ信号Sをフーリエ変換した波形と、異常時のセンサ信号Sをフーリエ変換した波形と、の差分を検出し、当該差分を特徴量として抽出することができる。この手法を用いることにより、技術者が、時間軸波形が示す特徴量を抽出する必要がなくなり、データ量を圧縮することもできる。
なお、特徴ベクトル演算部12は、周波数解析に代えてあるいは加えて、最大値、最小値または中央値等の統計解析を用い、センサ信号Sから特徴量を抽出するようにしてもよい。
あるいは、特徴ベクトル演算部12は、予め機械学習によって生成された特徴抽出用のアルゴリズムを用いて、センサ信号Sから特徴量を抽出することもできる。以下、図2を用いてこの方法を説明する。
図2は、データマイニング技術を活用したアルゴリズム設計工程を説明するための図である。
多数の学習用データおよび検証用データから、データマイニング工程によって特徴抽出用のアルゴリズムが生成される。例えば、特徴抽出用のアルゴリズムとは、学習用データおよび検証用データが1000個のパラメータを有する場合、そのうち、特徴量として、異常判定に関連する5個のパラメータを抽出するためのアルゴリズムである。
このようにして生成された特徴抽出用のアルゴリズムは、特徴ベクトル演算部12に組み込まれる。
多数の学習用データおよび検証用データから、データマイニング工程によって特徴抽出用のアルゴリズムが生成される。例えば、特徴抽出用のアルゴリズムとは、学習用データおよび検証用データが1000個のパラメータを有する場合、そのうち、特徴量として、異常判定に関連する5個のパラメータを抽出するためのアルゴリズムである。
このようにして生成された特徴抽出用のアルゴリズムは、特徴ベクトル演算部12に組み込まれる。
さらに、抽出された特徴量から、SVM等の機械学習によって異常検出数理モデル(異常検出用のアルゴリズム)が生成される。例えば、異常判定に関連するn個のパラメータの値a1、a2、・・・、anが抽出される場合、これらのパラメータの値に対応する重み係数w1、w2、・・・、wnを用いた数式Z=w1×a1+w2×a2+・・・+wn×an+b(bは、オフセット値)が生成され、Z>0の場合正常であり、Z≦0の場合異常であると判定される。
このようにして生成された異常検出用のアルゴリズムは、図3を用いて説明する異常検出部14に組み込まれる。
このようにして生成された異常検出用のアルゴリズムは、図3を用いて説明する異常検出部14に組み込まれる。
図3は、本発明の第2実施形態に係るセンサモジュールの概略図である。第2実施形態に係るセンサモジュール10bは、異常検出部14をさらに備え、信号検出部11が、第1および第2の補助センサから第1および第2の補助センサ信号Sr1、Sr2を受信する点以外、第1実施形態に係るセンサモジュール10aと同一である。なお、補助センサは、2つに限らず、1つでもよいし、3つ以上を設けてもよい。
異常検出部14は、判定部を有し、予め機械学習によって生成された異常検出用のアルゴリズムを用いて特徴量が異常を示すか否かを判定することができる。上述した例の場合、異常検出部14は、特徴量を用いた上述の数式Zに、特徴量a1、a2、・・・、anを代入することにより、異常判定を行う。例えば、Z>0の場合正常であり、Passと判定され、Z≦0の場合異常であり、Failと判定される。さらに、Zの値によって不具合A、B、・・・といったように不具合の種類が特定される。
第1および第2の補助センサは、例えば回転センサである。ここで、回転センサは、ポンプが通常有するセンサであり、モータの回転位置を検出するためにエンコーダに設けられている。第1および第2の補助センサ(以下、回転センサと呼称することがある)は、第1および第2の補助センサ信号(以下、回転センサ信号と呼称することがある)Sr1、Sr2を出力する。信号検出部11は、センサ信号Sに加えて、これらの第1および第2の回転センサ信号Sr1、Sr2をさらに受信し、受信した信号S、Sr1、Sr2を特徴ベクトル演算部12に送信する。
特徴ベクトル演算部12は、センサ信号Sに加えて、これらの第1および第2の回転センサ信号Sr1、Sr2をさらに補助的に用いて特徴量を抽出することができる。例えば、第1および第2の回転センサ信号Sr1、Sr2が所定の値を出力した際に、センサ信号Sに異常が発生することが分かった場合、第1および第2の回転センサ信号Sr1、Sr2の当該所定の値をトリガとして用いて特徴量を抽出することができる。
異常検出部14もまた、センサ信号Sに加えて、第1および第2の回転センサ信号Sr1、Sr2をさらに補助的に用いて特徴量が異常を示すか否かを判定することができる。
特徴ベクトル演算部12は、センサ信号Sに加えて、これらの第1および第2の回転センサ信号Sr1、Sr2をさらに補助的に用いて特徴量を抽出することができる。例えば、第1および第2の回転センサ信号Sr1、Sr2が所定の値を出力した際に、センサ信号Sに異常が発生することが分かった場合、第1および第2の回転センサ信号Sr1、Sr2の当該所定の値をトリガとして用いて特徴量を抽出することができる。
異常検出部14もまた、センサ信号Sに加えて、第1および第2の回転センサ信号Sr1、Sr2をさらに補助的に用いて特徴量が異常を示すか否かを判定することができる。
図4は、本発明の第3実施形態に係るセンサモジュールの概略図である。第3実施形態に係るセンサモジュール10cでは、信号検出部11が、センサ信号Sを信号出力部13に送信し、信号出力部13が特徴量とともにセンサ信号Sを出力する点以外、第1実施形態に係るセンサモジュール10aと同一である。
信号出力部13が特徴量とともにセンサ信号Sを出力するのは、出力データを利用するクライアントによっては、生データとしてのセンサ信号Sを要求する場合が存在するためである。
信号出力部13が特徴量とともにセンサ信号Sを出力するのは、出力データを利用するクライアントによっては、生データとしてのセンサ信号Sを要求する場合が存在するためである。
図5(a)(b)は、出力データの一例を示す図である。
1つのブロックが、ある時点で一度に出力されるデータを表す。センサ信号S1、S2、・・・とともに特徴量が出力される。 図5(a)では、センサ信号S11とともに出力される特徴量は、S1~S10から抽出した特徴量であり、センサ信号S12とともに出力される特徴量は、S2~S11から抽出した特徴量であり、センサ信号S13とともに出力される特徴量は、S3~S12から抽出した特徴量である。このように、センサ信号とともに出力される特徴量は、当該センサ信号より1つ前の10のセンサ信号から抽出した特徴量である。
なお、センサ信号S1~S10の出力の際には、十分なデータが蓄積されていないためダミーデータが出力される。
代替例である図5(b)では、センサ信号S11とともに出力される特徴量は、S1~S10から抽出した特徴量であり、センサ信号S12とともに出力される特徴量も、S1~S10から抽出した特徴量であり、センサ信号S13とともに出力される特徴量も、S1~S10から抽出した特徴量である。このように、センサ信号S11~S20とともに出力される特徴量は、S1~S10から抽出した特徴量であり同一である。
なお、センサ信号とともに出力される特徴量の抽出方法は、図示例に限定されるものではない。
1つのブロックが、ある時点で一度に出力されるデータを表す。センサ信号S1、S2、・・・とともに特徴量が出力される。 図5(a)では、センサ信号S11とともに出力される特徴量は、S1~S10から抽出した特徴量であり、センサ信号S12とともに出力される特徴量は、S2~S11から抽出した特徴量であり、センサ信号S13とともに出力される特徴量は、S3~S12から抽出した特徴量である。このように、センサ信号とともに出力される特徴量は、当該センサ信号より1つ前の10のセンサ信号から抽出した特徴量である。
なお、センサ信号S1~S10の出力の際には、十分なデータが蓄積されていないためダミーデータが出力される。
代替例である図5(b)では、センサ信号S11とともに出力される特徴量は、S1~S10から抽出した特徴量であり、センサ信号S12とともに出力される特徴量も、S1~S10から抽出した特徴量であり、センサ信号S13とともに出力される特徴量も、S1~S10から抽出した特徴量である。このように、センサ信号S11~S20とともに出力される特徴量は、S1~S10から抽出した特徴量であり同一である。
なお、センサ信号とともに出力される特徴量の抽出方法は、図示例に限定されるものではない。
本発明は、上述したセンサモジュールと、センサモジュールの出力するデータを受信するコンピュータ(上述した例では、クライアントのコンピュータ)と、を備える機械学習と親和性の高いシステムもまた提供することができる。
以下、本発明を、実施例を参照しながら説明するが、本発明はこの実施例に限定されるものではない。
図6は、本発明のセンサモジュールを市販の輸液ポンプに適用した概略図である。
輸液ポンプは、フィンガー方式の輸液ポンプであり、送液路としての輸液チューブと、カム+フィンガーと、モータと、エンコーダと、第1および第2の回転センサと、を有する。輸液チューブには、輸液チューブの内圧を測定するためのひずみセンサが取り付けられている。ひずみセンサからのセンサ信号Sと、第1および第2の回転センサからの回転センサ信号Sr1、Sr2と、はセンサモジュールに送信される。
図6は、本発明のセンサモジュールを市販の輸液ポンプに適用した概略図である。
輸液ポンプは、フィンガー方式の輸液ポンプであり、送液路としての輸液チューブと、カム+フィンガーと、モータと、エンコーダと、第1および第2の回転センサと、を有する。輸液チューブには、輸液チューブの内圧を測定するためのひずみセンサが取り付けられている。ひずみセンサからのセンサ信号Sと、第1および第2の回転センサからの回転センサ信号Sr1、Sr2と、はセンサモジュールに送信される。
図7は、センサ信号Sの波形と、第1および第2の回転センサ信号Sr1、Sr2の波形と、を示す図である。
図7(a)は、正常送液時の波形であり、図7(b)は、輸液ポンプの上流で閉塞が生じた場合の波形(異常1)であり、図7(c)は、輸液チューブに気泡が混入した場合の波形(異常2)である。
図7(b)では、xに示すように、センサ信号Sの振幅が、正常時のセンサ信号Sの振幅と比較して下がっていることが分かる。これは、輸液ポンプの上流で閉塞が生じ、輸液チューブが潰れていることを示す。また、yに示すように、センサ信号Sに段差が生じていることが分かる。これは、輸液チューブ内を液体が逆流していることを示す。
図7(c)では、zに示すように、センサ信号Sの振幅が、正常時のセンサ信号Sの振幅と比較して下がっていることが分かる。これは、輸液チューブに気泡が混入していることを示す。
従来は、技術者が、正常波形と異常波形とを比較し、xyzに示すような特徴量を抽出する必要があった。
一方、本発明は、第1の手法として、周波数解析および統計解析の少なくとも一方を用いて、センサ信号Sから特徴量を抽出するか、あるいは、第2の手法として、図2を用いて説明したように予め機械学習によって生成された特徴抽出用のアルゴリズムを用いて、センサ信号Sから特徴量を抽出することができるので、汎用性の高いセンサモジュールを提供することが可能となる。
図7(a)は、正常送液時の波形であり、図7(b)は、輸液ポンプの上流で閉塞が生じた場合の波形(異常1)であり、図7(c)は、輸液チューブに気泡が混入した場合の波形(異常2)である。
図7(b)では、xに示すように、センサ信号Sの振幅が、正常時のセンサ信号Sの振幅と比較して下がっていることが分かる。これは、輸液ポンプの上流で閉塞が生じ、輸液チューブが潰れていることを示す。また、yに示すように、センサ信号Sに段差が生じていることが分かる。これは、輸液チューブ内を液体が逆流していることを示す。
図7(c)では、zに示すように、センサ信号Sの振幅が、正常時のセンサ信号Sの振幅と比較して下がっていることが分かる。これは、輸液チューブに気泡が混入していることを示す。
従来は、技術者が、正常波形と異常波形とを比較し、xyzに示すような特徴量を抽出する必要があった。
一方、本発明は、第1の手法として、周波数解析および統計解析の少なくとも一方を用いて、センサ信号Sから特徴量を抽出するか、あるいは、第2の手法として、図2を用いて説明したように予め機械学習によって生成された特徴抽出用のアルゴリズムを用いて、センサ信号Sから特徴量を抽出することができるので、汎用性の高いセンサモジュールを提供することが可能となる。
図8~図10は、第1の手法を説明するための図である。
図8(a)は、正常送液時のセンサ信号Sの波形であり、図8(b)は、輸液ポンプの上流で閉塞が生じた場合のセンサ信号Sの波形である。
図9(a)(b)は、それぞれ、図8(a)(b)の波形をフーリエ変換した画像である。
図10(a)(b)は、それぞれ、図9(a)(b)の画像を模式的に示した波形である。
図8~図10より、異常波形をフーリエ変換すると、特定の周波数帯域に、正常波形をフーリエ変換した際には現れなかったピークが見られる。このピークが特徴量であり、第1の手法では、周波数解析を用いて特徴量であるピークを抽出することができる。
なお、ウェーブレット変換は、時間、周波数およびパワーを含む、いわゆる3次元のフーリエ変換であり、図9および図10では、X軸が時間を、Y軸が周波数を、Z軸がパワーを表す。
図8(a)は、正常送液時のセンサ信号Sの波形であり、図8(b)は、輸液ポンプの上流で閉塞が生じた場合のセンサ信号Sの波形である。
図9(a)(b)は、それぞれ、図8(a)(b)の波形をフーリエ変換した画像である。
図10(a)(b)は、それぞれ、図9(a)(b)の画像を模式的に示した波形である。
図8~図10より、異常波形をフーリエ変換すると、特定の周波数帯域に、正常波形をフーリエ変換した際には現れなかったピークが見られる。このピークが特徴量であり、第1の手法では、周波数解析を用いて特徴量であるピークを抽出することができる。
なお、ウェーブレット変換は、時間、周波数およびパワーを含む、いわゆる3次元のフーリエ変換であり、図9および図10では、X軸が時間を、Y軸が周波数を、Z軸がパワーを表す。
図11は、第1および第2の回転センサ信号Sr1、Sr2の利用例を説明するための図である。
第1および第2の回転センサ信号(Sr1、Sr2)の組み合わせは、期間t1(0、1)→期間t2(0、0)→期間t3(1、0)→期間t4(1、1)→期間t5(0、1)→期間t6(0、0)→・・・を繰り返す。例えば、期間t3(1、0)→期間t4(1、1)のとき、すなわち、第1の回転センサ信号Sr1が1のままであり、第2の回転センサ信号Sr2が0から1に切り替わった直後に、yの位置でセンサ信号Sに異常が発生することが分かった場合(なお、図示のセンサ信号Sは正常波形のため、異常は示されていない)、期間t3(1、0)→期間t4(1、1)の切り替わる時点をトリガとして用いることにより、特徴量を効率的に抽出することができる。
第1および第2の回転センサ信号(Sr1、Sr2)の組み合わせは、期間t1(0、1)→期間t2(0、0)→期間t3(1、0)→期間t4(1、1)→期間t5(0、1)→期間t6(0、0)→・・・を繰り返す。例えば、期間t3(1、0)→期間t4(1、1)のとき、すなわち、第1の回転センサ信号Sr1が1のままであり、第2の回転センサ信号Sr2が0から1に切り替わった直後に、yの位置でセンサ信号Sに異常が発生することが分かった場合(なお、図示のセンサ信号Sは正常波形のため、異常は示されていない)、期間t3(1、0)→期間t4(1、1)の切り替わる時点をトリガとして用いることにより、特徴量を効率的に抽出することができる。
10a、10b、10c センサモジュール
11 信号検出部
12 特徴ベクトル演算部
13 信号出力部
14 異常検出部
11 信号検出部
12 特徴ベクトル演算部
13 信号出力部
14 異常検出部
Claims (7)
- ポンプに適用されたセンサから、センサ信号を受信する信号検出部と、
前記センサ信号から、前記ポンプの送液路の異常を示す特徴量を抽出する特徴ベクトル演算部と、
前記特徴量を出力する信号出力部と、
を備えているセンサモジュール。 - 前記特徴ベクトル演算部は、周波数解析および統計解析の少なくとも一方を用いて前記特徴量を抽出する、
請求項1に記載のセンサモジュール。 - 前記特徴ベクトル演算部は、予め機械学習によって生成された特徴抽出用のアルゴリズムを用いて前記特徴量を抽出する、
請求項1に記載のセンサモジュール。 - 予め機械学習によって生成された異常検出用のアルゴリズムを用いて前記特徴量が異常を示すか否かを判定する異常検出部をさらに備えている、
請求項1から3のいずれかに記載のセンサモジュール。 - 前記信号検出部は、前記ポンプが有する1つ以上の補助センサから補助センサ信号を受信し、
前記特徴ベクトル演算部は、前記補助センサ信号をさらに用いて前記特徴量を抽出する、
請求項1から4のいずれかに記載のセンサモジュール。 - 前記信号出力部は、前記特徴量とともに前記センサ信号を出力する、
請求項1から5のいずれかに記載のセンサモジュール。 - 請求項1から6のいずれかに記載のセンサモジュールと、
前記センサモジュールの出力するデータを受信するコンピュータと、
を備える機械学習と親和性の高いシステム。
Applications Claiming Priority (2)
| Application Number | Priority Date | Filing Date | Title |
|---|---|---|---|
| JP2017-075202 | 2017-04-05 | ||
| JP2017075202A JP2018179582A (ja) | 2017-04-05 | 2017-04-05 | センサモジュールおよび機械学習と親和性の高いシステム |
Publications (1)
| Publication Number | Publication Date |
|---|---|
| WO2018186437A1 true WO2018186437A1 (ja) | 2018-10-11 |
Family
ID=63713128
Family Applications (1)
| Application Number | Title | Priority Date | Filing Date |
|---|---|---|---|
| PCT/JP2018/014399 Ceased WO2018186437A1 (ja) | 2017-04-05 | 2018-04-04 | センサモジュールおよび機械学習と親和性の高いシステム |
Country Status (2)
| Country | Link |
|---|---|
| JP (1) | JP2018179582A (ja) |
| WO (1) | WO2018186437A1 (ja) |
Citations (4)
| Publication number | Priority date | Publication date | Assignee | Title |
|---|---|---|---|---|
| JPH11212637A (ja) * | 1998-01-22 | 1999-08-06 | Hitachi Ltd | 予防保全方法及び装置 |
| JP2004024476A (ja) * | 2002-06-25 | 2004-01-29 | Nemoto Kyorindo:Kk | 輸液ポンプ |
| JP2004279211A (ja) * | 2003-03-14 | 2004-10-07 | Omron Corp | 知識作成支援装置及びパラメータ探索方法並びにプログラム製品 |
| US20160203036A1 (en) * | 2015-01-09 | 2016-07-14 | Ecorithm, Inc. | Machine learning-based fault detection system |
-
2017
- 2017-04-05 JP JP2017075202A patent/JP2018179582A/ja active Pending
-
2018
- 2018-04-04 WO PCT/JP2018/014399 patent/WO2018186437A1/ja not_active Ceased
Patent Citations (4)
| Publication number | Priority date | Publication date | Assignee | Title |
|---|---|---|---|---|
| JPH11212637A (ja) * | 1998-01-22 | 1999-08-06 | Hitachi Ltd | 予防保全方法及び装置 |
| JP2004024476A (ja) * | 2002-06-25 | 2004-01-29 | Nemoto Kyorindo:Kk | 輸液ポンプ |
| JP2004279211A (ja) * | 2003-03-14 | 2004-10-07 | Omron Corp | 知識作成支援装置及びパラメータ探索方法並びにプログラム製品 |
| US20160203036A1 (en) * | 2015-01-09 | 2016-07-14 | Ecorithm, Inc. | Machine learning-based fault detection system |
Also Published As
| Publication number | Publication date |
|---|---|
| JP2018179582A (ja) | 2018-11-15 |
Similar Documents
| Publication | Publication Date | Title |
|---|---|---|
| EP2677500A3 (en) | Event-based image processing apparatus and method | |
| CN202040152U (zh) | 一种液压系统的故障检测系统 | |
| CN105354535B (zh) | 一种特殊的低压差分信号图像采集与处理方法 | |
| EP2853191A3 (en) | Image processing apparatus, image processing system, and image processing method | |
| US8155924B2 (en) | Method and apparatus for three dimensional calibration of an on-board diagnostics system | |
| US20080205853A1 (en) | Method of Monitoring the Control of Image Representations, Particularly from Safety-relevant Raw Data | |
| JP6113691B2 (ja) | センサ装置、処理装置、センサシステム及び物理量の出力方法 | |
| WO2018186437A1 (ja) | センサモジュールおよび機械学習と親和性の高いシステム | |
| JP6409375B2 (ja) | パラメータ分類装置 | |
| CN115388760B (zh) | 基于弓网检测装置的数据处理方法、装置、设备及介质 | |
| WO2019049199A1 (ja) | データ表示システム、表示装置およびデータ表示方法 | |
| US11231352B2 (en) | Impact testing machine | |
| JP2001125634A (ja) | ウェーブレット変換によるプラント機器監視装置 | |
| US20220412837A1 (en) | Graphical Display of Discontinuous Waveform Data | |
| KR101554474B1 (ko) | 제어 시스템 | |
| CN103018327A (zh) | 航空发动机整流器超声波探伤钎着率测量方法 | |
| JP2005335664A (ja) | 回転体の異常検知装置および方法 | |
| CN103686158B (zh) | 模拟视频信号输出设备检测方法和系统 | |
| CN102721426B (zh) | 数显计数器校准系统及方法 | |
| CN113869171A (zh) | 一种防止工程机械仪表显示数据跳变的控制方法及系统 | |
| EP3324259A3 (en) | Fault signal recovery apparatus and method | |
| CN104019844A (zh) | 一种基于快速傅利叶变换的仪表指针抖动检测方法 | |
| JP5835287B2 (ja) | 画像分析装置および画像分析方法 | |
| CN105488255B (zh) | 一种电传铁鸟试验传感器数据处理方法及系统 | |
| US12181856B2 (en) | Method and system for collecting machine data |
Legal Events
| Date | Code | Title | Description |
|---|---|---|---|
| 121 | Ep: the epo has been informed by wipo that ep was designated in this application |
Ref document number: 18780699 Country of ref document: EP Kind code of ref document: A1 |
|
| NENP | Non-entry into the national phase |
Ref country code: DE |
|
| 122 | Ep: pct application non-entry in european phase |
Ref document number: 18780699 Country of ref document: EP Kind code of ref document: A1 |