WO2018154672A1 - 磁気特性推定方法および磁気特性推定装置 - Google Patents
磁気特性推定方法および磁気特性推定装置 Download PDFInfo
- Publication number
- WO2018154672A1 WO2018154672A1 PCT/JP2017/006755 JP2017006755W WO2018154672A1 WO 2018154672 A1 WO2018154672 A1 WO 2018154672A1 JP 2017006755 W JP2017006755 W JP 2017006755W WO 2018154672 A1 WO2018154672 A1 WO 2018154672A1
- Authority
- WO
- WIPO (PCT)
- Prior art keywords
- curve
- major loop
- magnetic
- point
- flux density
- Prior art date
- Legal status (The legal status is an assumption and is not a legal conclusion. Google has not performed a legal analysis and makes no representation as to the accuracy of the status listed.)
- Ceased
Links
Images






Classifications
-
- G—PHYSICS
- G01—MEASURING; TESTING
- G01R—MEASURING ELECTRIC VARIABLES; MEASURING MAGNETIC VARIABLES
- G01R33/00—Arrangements or instruments for measuring magnetic variables
- G01R33/12—Measuring magnetic properties of articles or specimens of solids or fluids
- G01R33/14—Measuring or plotting hysteresis curves
Definitions
- the present invention relates to a magnetic characteristic estimation method and a magnetic characteristic estimation apparatus for estimating a major loop relating to hysteresis of a magnetic material.
- Patent Document 1 describes a magnetic field analysis method and system in consideration of hysteresis. In this method, in addition to the initial magnetization curve of magnetic material (input data necessary for electromagnetic field analysis ignoring hysteresis) as well as input data, measurement data of a major loop describing hysteresis characteristics is required.
- Patent Document 1 requires hysteresis data (measurement data) of a major loop, but a user who performs electromagnetic field analysis does not necessarily have an apparatus or technique for measuring a major loop. Not exclusively. For this reason, if a major loop can be easily estimated, an electromagnetic field analysis that approximately considers magnetic hysteresis becomes possible.
- An object of the present invention is to make it possible to perform an electromagnetic field analysis that approximately considers hysteresis even when it is difficult to obtain hysteresis data (measurement data) of a major loop relating to hysteresis of a magnetic material. And to provide approximate estimation data for the major loop.
- the present invention provides a magnetic property estimation method for estimating a major loop relating to hysteresis of a magnetic material, using known data of the initial magnetization curve of the magnetic material as an input, and the initial magnetization curve and the initial magnetization curve.
- the present invention even when it is difficult to obtain measurement data of the major loop, it is possible to provide approximate estimation data regarding the major loop, and to analyze the electromagnetic field in consideration of the hysteresis of the magnetic substance. Enable.
- FIG. 1 is a diagram showing a configuration example of an electromagnetic field analysis system according to the present invention.
- FIG. 2 is a diagram showing a flowchart of the electromagnetic field analysis program according to the present invention.
- FIG. 3 is a diagram illustrating a specific method for creating an ascending curve in a region where the magnetic flux density is positive, as the first embodiment.
- FIG. 4 is a diagram illustrating a specific method for creating a descending curve in a region where the magnetic flux density is positive.
- FIG. 5 is a diagram illustrating a method of creating a descending curve using two parabolas.
- FIG. 6 is a diagram illustrating an example in which a descending curve is created by a quadratic Bezier curve and a comparison with a major loop based on measurement data.
- FIG. 1 is a diagram showing a configuration example of an electromagnetic field analysis system according to the present invention.
- FIG. 2 is a diagram showing a flowchart of the electromagnetic field analysis program according to the present invention.
- FIG. 7 is a diagram illustrating a method of creating a descending curve by a curve obtained by affine transformation of an initial magnetization curve as Example 2.
- FIG. 8 is a diagram showing a comparison between the major loop estimated by Example 2 and the measured major loop.
- FIG. 9 is a diagram illustrating a method of changing the width of the major loop as the third embodiment.
- FIG. 10 is a diagram showing a major loop in which the loop width is changed by affine transformation.
- FIG. 1 is a diagram showing a configuration example of an electromagnetic field analysis system according to the present invention.
- the main point of the electromagnetic analysis system according to the present invention is to estimate the magnetic characteristics of the target magnetic material.
- a general configuration of an electromagnetic field analysis system according to the present invention includes a computer 1, a display device 2, a storage device 3, and an input device 4.
- the storage device 3 is shown as being externally attached to the computer 1 in order to clearly show this, but it goes without saying that the storage device 3 may be installed in the computer 1.
- the computer 1 stores a program coding a series of processes for estimating a point-symmetric hysteresis loop (major loop) with respect to the origin formed in the space of magnetic field strength and magnetic flux density as an electromagnetic field analysis program. .
- the electromagnetic field analysis program can also be recorded on a computer-readable recording medium. At that time, the computer 1 can read and store the program via a computer-readable recording medium in which the electromagnetic field analysis program is recorded.
- the input device 4 is, for example, a keyboard or a mouse, and is used to input data necessary for electromagnetic field analysis to the computer 1 and to specify reading / writing of a data file storing input data, execution of calculation, and the like. used.
- the computer 1 executes arithmetic processing necessary for reading the input data and electromagnetic field analysis in accordance with the stored electromagnetic field analysis program.
- the computer 1 displays the calculation result on the display device 2 and stores it in the storage device 3 as a data file. A part of the obtained calculation result may be displayed or stored.
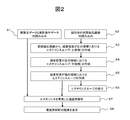
- FIG. 2 is a diagram showing a flowchart of an electromagnetic field analysis program (hereinafter simply referred to as “program”) in consideration of hysteresis according to the present invention.
- program an electromagnetic field analysis program
- a hysteresis loop (major loop) is created by estimating magnetic characteristics. It is the flowchart which described the process process to do in detail.
- the hysteresis loop (major loop) is simply referred to as “major loop”.
- step S1 the program reads the discretization data (for example, the shape of the target magnetic product etc.) and analysis condition data of the magnetic material to be subjected to electromagnetic field analysis, and in step S2, Read the initial magnetization curve data of the magnetic material.
- the initial magnetization curve data is known data such as data provided by the manufacturer or the like for the target magnetic product or data obtained by measurement.
- step S3 the program creates a curve on the rising side of the major loop in the region where the magnetic flux density is positive from the initial magnetization curve data read in step S2.
- step S4 the program creates a curve on the descending side of the major loop in the region where the magnetic flux density is positive.
- step S5 since the major loop is point-symmetric with respect to the origin, the program rotates the curve that forms part of the major loop in the region where the magnetic flux density created in steps S3 and S4 is positive by 180 °. Thus, a curve in a region where the magnetic flux density is negative is generated. Thereby, a major loop can be created from the two curves of the positive area created in the previous step and the negative area created in the previous step.
- step S6 the program displays the created major loop.
- step S7 the program performs electromagnetic field analysis considering hysteresis using the discretized data and analysis condition data read in step S1 and the major loop created in steps S2 to S5.
- step S8 the program displays the result of the electromagnetic field analysis obtained in step S7.
- FIG. 3 is a diagram showing a specific method for creating an ascending curve in a region where the magnetic flux density is positive as the first embodiment.
- the rising curve is constructed using the initial magnetization curve as it is. Further, for the region where the magnetic flux density B is lower than the point 10, a straight line that passes through the point 10 and has an inclination of the substantially maximum differential permeability (dotted line 20 having the maximum differential permeability as an inclination) is created. Thus, an upward curve (broken line shown in FIG. 3) in the region where the magnetic flux density is positive is formed.
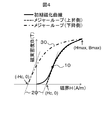
- FIG. 4 is a diagram showing a specific method for creating a descending curve in a region where the magnetic flux density is positive.
- points (Hmax, Bmax) at which the magnetic field H and the magnetic flux density B are maximized are obtained on the initial magnetization curve (solid line shown in FIG. 4).
- a straight line (a dotted line having the maximum differential permeability as the slope) passing through the point giving the substantially maximum differential permeability (point 10 giving the maximum differential permeability) on the initial magnetization curve and having the slope as the substantially maximum differential permeability.
- the point (Hc, 0) at which the magnetic flux density B becomes 0 is obtained on the straight line 20).
- a point ( ⁇ Hc, 0) where the obtained magnetic flux density B becomes 0 (Hc, 0) is taken on the negative side of the magnetic field H is obtained, and the descending curve is represented by (Hmax, Bmax) and ( ⁇ Hc, 0), and the slope at the point (Hmax, Bmax) is defined as the differential permeability at the point (Hmax, Bmax) of the initial magnetization curve, and the slope at the point ( ⁇ Hc, 0) is It is constituted by a curve (the estimated curve 30 of the descending major loop indicated by a one-dot chain line in FIG. 4) having a substantially maximum differential permeability of the initial magnetization curve.
- FIG. 5 shows two different parabolas, parabola 1 (shown by dashed line 50) passing through point (-Hc, 0) and parabola 2 (shown by alternate long and short dash line 60) passing through point (Hmax, Bmax) near the inflection point.
- a descending curve is created by combining them.
- the curve in the area where the magnetic flux density is negative in the major loop is obtained by rotating the curve in the area where the magnetic flux density is positive in point symmetry with respect to the origin.
- Can be obtained from these two curves by generating a curve (not shown) of a negative magnetic flux density region by rotating the positive region curve 180 ° about the origin.
- FIG. 6 shows an example in which the descending curve is created by a quadratic Bezier curve (estimated major loop shown by a one-dot chain line), and also shows a comparison with a major loop (shown by a broken line) based on measurement data It is.
- the estimated major loop has a smaller area in the loop than the measured major loop, but even if the measured data of the major loop is not available, using this estimated major loop reduces the effects of hysteresis. Analysis in consideration is possible.
- Example 2 a descending curve is created using a curve obtained by affine transformation (transformation by a combination of linear mapping and translation) of the initial magnetization curve. Below, it demonstrates centering on difference with Example 1.
- FIG. 2 affine transformation (transformation by a combination of linear mapping and translation)
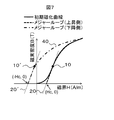
- FIG. 7 is a diagram showing a method of creating a descending curve by a curve obtained by affine transformation of the initial magnetization curve.
- a descending curve 40 obtained by affine transformation of a part of the initial magnetization curve (solid line) is obtained.
- This descending curve 40 is a curve obtained by extending a part of the initial magnetization curve (solid line) from the point where the magnetic field H is maximum to the region where the magnetic field H is in the negative direction.
- a straight line (a straight line with a dotted line 20) with the maximum differential permeability as an inclination is shown, and the magnetic field H is positive and the magnetic flux density B is From the point (Hc, 0) where the magnetic field is zero, the magnetic field H is negative and the magnetic flux density B is translated as a straight line passing through the point (-Hc, 0) where the magnetic flux density B is zero (the straight line indicated by the dotted line 20 ').
- a straight line portion one-dot chain line portion) extending from the point 10 ′ that gives the maximum differential permeability to the point (Hc, 0) is used.
- the straight line (the one-dot chain line portion) having the maximum differential permeability as an inclination
- the descending curve 40 one-dot chain line obtained by the affine transformation is extended from the point 10 ′ to a point ( It may be another curve leading to Hc, 0).
- FIG. 8 is a diagram showing a comparison between the major loop estimated in Example 2 and the measured major loop.
- the width of the major loop is changed by affine transformation of the major loop created in the first or second embodiment.
- the difference from the first and second embodiments will be mainly described.
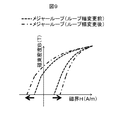
- FIG. 9 is a diagram showing a method of changing the width of the major loop. As shown in FIG. 9, the width of the major loop in the direction of the magnetic field axis is obtained by affine transforming each of the rising and lowering curves of the major loop created in Example 1 or 2 so as to extend in the direction of the arrow. Can be changed.
- FIG. 10 shows a major loop (indicated by a one-dot chain line, before affine transformation for changing the width) created in the second embodiment, and a major loop in which the loop width is changed by affine transformation in accordance with the third embodiment (indicated by a broken line). It is a figure which shows the affine transformation for a change).
- the area of the two-dimensional space surrounded by the major loop corresponds to the hysteresis loss per round of the major loop per unit volume. If the user who performs the electromagnetic field analysis obtains measurement data of hysteresis loss or coercive force in addition to the initial magnetization curve, the width of the major loop can be changed so as to match the measurement data.
Landscapes
- Physics & Mathematics (AREA)
- Condensed Matter Physics & Semiconductors (AREA)
- General Physics & Mathematics (AREA)
- Measuring Magnetic Variables (AREA)
Abstract
磁性体のヒステリシスに関するメジャーループのヒステリシスデータ(測定データ)の入手が困難でも、ヒステリシスを近似的に考慮した電磁界解析を実施することを可能にするために、磁性体の初期磁化曲線の既知データを入力として、初期磁化曲線と当該初期磁化曲線の略最大の微分透磁率を傾きとする直線とから、メジャーループの上昇側の曲線を作成し、メジャーループの上昇側の曲線の最大磁束密度の点とメジャーループの上昇側の曲線が磁束密度0となる点の磁界値の符号を反転させた点とを任意の曲線で結んで、メジャーループの下降側の曲線を作成し、メジャーループの上昇側の曲線および下降側の曲線を、原点を中心に点対称に180°回転させることにより、磁束密度が負の領域におけるメジャーループの曲線を作成する。
Description
本発明は、磁性体のヒステリシスに関するメジャーループを推定する磁気特性推定方法および磁気特性推定装置に関する。
近年、磁性体の磁気ヒステリシスを考慮した電磁界解析が普及し始めている。特許文献1には、ヒステリシスを考慮した磁界解析の方法およびシステムが記載されている。この方法では、入力データとして、磁性体の初期磁化曲線(ヒステリシスを無視した電磁界解析でも必要な入力データ)に加え、ヒステリシス特性を記述するメジャーループの測定データが必要である。
特許文献1に記載の方法は、メジャーループのヒステリシスデータ(測定データ)を必要とするが、電磁界解析を行うユーザが、必ずしもメジャーループを測定するための装置や技術を有しているとは限らない。このため、メジャーループを簡単に推定できれば、近似的に磁気ヒステリシスを考慮した電磁界解析が可能になる。
本発明の目的は、磁性体のヒステリシスに関するメジャーループのヒステリシスデータ(測定データ)の入手が困難な場合であっても、ヒステリシスを近似的に考慮した電磁界解析を実施することを可能にするために、メジャーループに関する近似的な推定データを提供することである。
上記課題を解決するために、本発明は、磁性体のヒステリシスに関するメジャーループを推定する磁気特性推定方法として、磁性体の初期磁化曲線の既知データを入力として、初期磁化曲線と当該初期磁化曲線の略最大の微分透磁率を傾きとする直線とから、メジャーループの上昇側の曲線を作成する第1のステップと、磁束密度が正の領域で、メジャーループの上昇側の曲線の最大磁束密度となる第2の点と、メジャーループの上昇側の曲線が磁束密度0となる点の磁界値の符号を反転させた第3の点とを任意の曲線で結んで、メジャーループの下降側の曲線を作成する第2のステップと、メジャーループの上昇側の曲線および下降側の曲線を、原点を中心に点対称に180°回転させて、磁束密度が負の領域におけるメジャーループの曲線を作成する第3のステップとを有する。
本発明によれば、メジャーループの測定データの入手が困難で手元に無い場合であっても、メジャーループに関する近似的な推定データを提供し、磁性体のヒステリシスを近似的に考慮した電磁界解析を可能にする。
以下、本発明の実施形態および実施例について、図面を用いて説明する。以下の説明は、本発明に係る具体例を示すものであるが、本発明がこれらの具体例に限定されるものではなく、本明細書に開示する技術思想の範囲内において、当業者による様々な変更および修正が可能である。また、本発明を説明する図面において、同一の機能を有するものには同一の符号を付け、その繰り返しの説明は省略する場合がある。
図1は、本発明に係る電磁界解析システムの一構成例を示す図である。本発明に係る電磁解析システムの主要なポイントは、対象とする磁性体の磁気特性の推定にある。本発明に係る電磁界解析システムの一般的な構成は、計算機1、表示装置2、記憶装置3および入力装置4から成る。図1では、記憶装置3は、それを明示するために、計算機1に外付けする形で提示しているが、計算機1に内蔵する形で設置してもよいことは云うまでもない。
計算機1には、電磁界解析プログラムとして、磁界強度と磁束密度の空間で形成される原点に関して点対称なヒステリシスループ(メジャーループ)を推定するための一連のプロセスをコーディングしたプログラムが格納されている。また、この電磁界解析プログラムは、コンピュータ読み取り可能な記録媒体に記録することも可能である。その際には、計算機1は、この電磁界解析プログラムを記録したコンピュータ読み取り可能な記録媒体を介してプログラムを読み込む、内部に格納することができる。
入力装置4は、例えばキーボードやマウスであり、電磁界解析に必要なデータを計算機1へ入力するため、また、入力データを保存したデータファイルの読み書きの指定や計算の実行などを行うため、に使用される。
計算機1は、入力装置4を介して必要なデータが入力されると、格納されている電磁界解析プログラムに従い、入力データの読み取りや電磁界解析に必要な演算処理を実行する。そして、計算機1は、演算結果を、表示装置2に表示するとともに、データファイルとして記憶装置3に記憶する。得られた計算結果の一部を表示したり記憶したりしてもよい。
図2は、本発明に係るヒステリシスを考慮した電磁界解析プログラム(以下、単に「プログラム」と記す)のフローチャートを示す図であって、特に、磁気特性を推定しヒステリシスループ(メジャーループ)を作成する処理過程を詳細に記したフローチャートである。なお、以下では、ヒステリシスループ(メジャーループ)を、単に「メジャーループ」と記す。
まず、プログラムは、ステップS1で、電磁界解析の対象とする磁性体の離散化データ(例えば、対象となる磁性体製品等の形状など)および解析条件データを読み込み、また、ステップS2で、対象とする磁性体の初期磁化曲線のデータを読み込む。この初期磁化曲線のデータは、対象となる磁性体製品に対してそのメーカ等から提供されているデータや測定により得られたデータ等の既知データである。
ステップS3で、プログラムは、ステップS2で読み込んだ初期磁化曲線のデータから、磁束密度が正の領域におけるメジャーループの上昇側の曲線を作成する。
ステップS4で、プログラムは、磁束密度が正の領域におけるメジャーループの下降側の曲線を作成する。
ステップS4で、プログラムは、磁束密度が正の領域におけるメジャーループの下降側の曲線を作成する。
続いて、ステップS5で、メジャーループが原点に対して点対称であることから、プログラムは、ステップS3およびS4で作成した磁束密度が正の領域におけるメジャーループの一部をなす曲線を180°回転させて、磁束密度が負の領域の曲線を生成する。これにより、先のステップで作成した正の領域と当該ステップで作成した負の領域の2つの曲線から、メジャーループを作成することができる。
ステップS6で、プログラムは、作成したメジャーループを表示する。
また、ステップS7で、プログラムは、ステップS1で読み込んだ離散化データおよび解析条件データと、ステップS2からS5で作成したメジャーループを用いて、ヒステリシスを考慮した電磁界解析を実施する。
ステップS8で、プログラムは、ステップS7で求められた電磁界解析の結果を表示する。
また、ステップS7で、プログラムは、ステップS1で読み込んだ離散化データおよび解析条件データと、ステップS2からS5で作成したメジャーループを用いて、ヒステリシスを考慮した電磁界解析を実施する。
ステップS8で、プログラムは、ステップS7で求められた電磁界解析の結果を表示する。
次に、上記ステップS3~S5に示したメジャーループの曲線を作成する具体的方法として、実施例1~3について説明する。
図3は、実施例1として、磁束密度が正の領域における上昇側の曲線を作成する具体的方法を示す図である。まず、初期磁化曲線(図3に示す実線)のデータから、初期磁化曲線の傾き、すなわち微分透磁率が、略最大になる点(最大微分透磁率を与える点10)を求める。
次に、この点10よりも磁束密度Bが高い領域に関しては、上昇側の曲線を、初期磁化曲線をそのまま用いて構成する。また、この点10よりも磁束密度Bが低い領域に関しては、この点10を通り、かつ略最大の微分透磁率を傾きとする直線(最大微分透磁率を傾きとする点線の直線20)を作成して、磁束密度が正の領域における上昇側の曲線(図3に示す破線)を構成する。
図4は、磁束密度が正の領域における下降側の曲線を作成する具体的な方法を示す図である。まず、初期磁化曲線(図4に示す実線)上で、磁界Hおよび磁束密度Bが最大になる点(Hmax、Bmax)を求める。また、初期磁化曲線上で略最大の微分透磁率を与える点(最大微分透磁率を与える点10)を通り、傾きを略最大の微分透磁率とした直線(最大微分透磁率を傾きとする点線の直線20)上で、磁束密度Bが0になる点(Hc、0)を求める。
次に、求めた磁束密度Bが0になる点(Hc、0)を磁界Hの負側にとった点(-Hc、0)を求め、下降側の曲線を、(Hmax、Bmax)および(-Hc、0)の2点を通り、かつ点(Hmax、Bmax)での傾きを初期磁化曲線の点(Hmax、Bmax)における微分透磁率とし、さらに点(-Hc、0)での傾きを初期磁化曲線の略最大の微分透磁率とした曲線(図4で一点鎖線で示す、下降側のメジャーループの推定曲線30)によって構成する。
ここで、曲線の関数としては、例えば、ベジェ曲線や円弧、または、図5に示すように、二つの異なる放物線を組み合わせたものなどを用いることができる。図5は、点(-Hc、0)を通る放物線1(破線50で示す)および点(Hmax、Bmax)を通る放物線2(一点鎖線60で示す)の二つの異なる放物線を変曲点付近で組み合わせるようにして、下降側の曲線を作成したものである。
また、メジャーループにおける磁束密度が負の領域の曲線は、磁束密度が正の領域の曲線を原点に対して点対称に回転させたものであるから、最終的に作成するメジャーループは、磁束密度が正の領域の曲線を原点を中心に180°回転させることにより、磁束密度が負の領域の曲線(図示せず)を生成して、これらの2つの曲線から得ることができる。
図6は、下降側の曲線を2次のベジェ曲線で作成した例(一点鎖線で示す、推定したメジャーループ)を示し、併せて測定データによるメジャーループ(破線で示す)との比較を示す図である。測定したメジャーループよりも推定したメジャーループの方が、ループ内の面積が小さいが、メジャーループの測定データが入手できない場合であっても、この推定したメジャーループを用いることにより、ヒステリシスの影響を考慮した解析が可能となる。
実施例2は、下降側の曲線を、初期磁化曲線をアフィン変換(線形写像と平行移動の組み合わせによる変換)して得られる曲線を用いて作成する。以下では、実施例1との相違点を中心に説明する。
図7は、下降側の曲線を、初期磁化曲線をアフィン変換して得られる曲線により作成する方法を示す図である。
初期磁化曲線の最大微分透磁率を与える点10よりも磁束密度Bが高い領域では、初期磁化曲線(実線)の一部の曲線をアフィン変換して得られる下降側の曲線40(一点鎖線)を生成する。この下降側の曲線40(一点鎖線)は、初期磁化曲線(実線)の一部の曲線を、その磁界Hが最大の点から磁界Hが負の方向に至る領域まで引き伸ばして得られる曲線である。
また、初期磁化曲線の最大微分透磁率を与える点10よりも磁束密度Bが低い領域は、最大微分透磁率を傾きとする直線(点線20の直線)を、磁界Hが正で磁束密度Bが0となる点(Hc、0)から、磁界Hが負で磁束密度Bが0となる点(-Hc、0)を通る直線として平行移動させ(点線20´の直線)、それにより平行移動した最大微分透磁率を与える点10´から点(Hc、0)に至る直線部分(一点鎖線部分)を用いる。ここで、最大微分透磁率を傾きとする直線(一点鎖線部分)に限定されるものではなく、点10´から前記のアフィン変換により得られる下降側の曲線40(一点鎖線)を延長し点(Hc、0)に至る別の曲線であってもよい。
その後、実施例1と同様に磁束密度が負の領域の曲線を生成し、両方を接続してメジャーループを作成する。
図8は、実施例2によって推定したメジャーループと、測定したメジャーループとの比較を示す図である。実施例2のように、初期磁化曲線をアフィン変換して得られる曲線を用いることにより、初期磁化曲線がどのような軌跡を描いていても、初期磁化曲線と交差しないようにメジャーループを作成することができる。
実施例3は、実施例1または2で作成したメジャーループをアフィン変換することで、メジャーループの幅を変更するものである。以下、実施例1および2との相違点を中心に説明する。
図9は、メジャーループの幅を変更する方法を示す図である。図9に示すように、実施例1または2で作成したメジャーループの上昇側および下降側のそれぞれの曲線を、矢印の方向に引き伸ばすようにアフィン変換することにより、メジャーループの磁界軸方向の幅を変更することができる。
図10は、実施例2で作成したメジャーループ(一点鎖線で示す、幅変更のためのアフィン変換前)と、実施例3によりアフィン変換してループ幅を変更したメジャーループ(破線で示す、幅変更のためのアフィン変換後)を示す図である。ここで、メジャーループで囲まれる2次元空間の面積は、単位体積あたりのメジャーループ一周あたりのヒステリシス損に相当する。電磁界解析を行うユーザが、初期磁化曲線のほかに、ヒステリシス損または保持力の測定データを入手していれば、それらの測定データと合うように、メジャーループの幅を変更することができる。
1 計算機、2 表示装置、3 記憶装置、4 入力装置、
10 最大微分透磁率を与える点、
20 最大微分透磁率を傾きとする直線、
30 下降側の推定曲線、
40 初期磁化曲線をアフィン変換して得られる曲線、
50 放物線1、60 放物線2
10 最大微分透磁率を与える点、
20 最大微分透磁率を傾きとする直線、
30 下降側の推定曲線、
40 初期磁化曲線をアフィン変換して得られる曲線、
50 放物線1、60 放物線2
Claims (7)
- 磁性体のヒステリシスに関するメジャーループを推定する磁気特性推定方法であって、
前記磁性体の初期磁化曲線の既知データを入力として、
前記初期磁化曲線と当該初期磁化曲線の略最大の微分透磁率を傾きとする直線とから、前記メジャーループの上昇側の曲線を作成する第1のステップと、
磁束密度が正の領域で、前記メジャーループの上昇側の曲線の最大磁束密度となる第2の点と、前記メジャーループの上昇側の曲線が磁束密度0となる点の磁界値の符号を反転させた第3の点とを任意の曲線で結んで、前記メジャーループの下降側の曲線を作成する第2のステップと、
前記メジャーループの上昇側の曲線および下降側の曲線を、原点を中心に点対称に180°回転させて、磁束密度が負の領域における前記メジャーループの曲線を作成する第3のステップと
を有する磁気特性推定方法。 - 請求項1に記載の磁気特性推定方法であって、
前記第1のステップは、前記初期磁化曲線の略最大の微分透磁率を与える第1の点より大きい磁束密度領域では前記初期磁化曲線を用い、該第1の点より小さい正の磁束密度領域では該第1の点を通る前記略最大の微分透磁率を傾きとする直線を用いる
ことを特徴とする磁気特性推定方法。 - 請求項1または2に記載の磁気特性推定方法であって、
前記任意の曲線として、ベジェ曲線、円弧または二つの異なる放物線の組み合わせのいずれか一つを用いる
ことを特徴とする磁気特性推定方法。 - 請求項1または2に記載の磁気特性推定方法であって、
前記任意の曲線は、前記第2の点から発し前記初期磁化曲線の一部を線形写像と平行移動との組み合わせによるアフィン変換で得られる曲線と、前記第3の点に至る前記略最大の微分透磁率を傾きとする直線または前記アフィン変換で得られる曲線を延長して前記第3の点に至る別の曲線とを組み合わせた曲線である
ことを特徴とする磁気特性推定方法。 - 請求項1から請求項4のいずれか1項に記載の磁気特性推定方法であって、
作成した前記メジャーループの磁界軸方向の幅を、当該メジャーループを構成する曲線にアフィン変換を施すことによって変更する第4のステップを
有する磁気特性推定方法。 - 請求項1から請求項5のいずれか1項に記載の磁気特性推定方法であって、
作成した前記メジャーループを表示させる第5のステップを
有する磁気特性推定方法。 - 磁性体のヒステリシスに関するメジャーループを推定するための磁気特性推定装置であって、
入力部と、記憶部と、処理部と、表示部とを備え、
前記入力部は、磁性体の初期磁化曲線の既知データを入力とし
前記記憶部は、少なくとも前記磁性体のヒステリシスに関するメジャーループを推定するためのプログラムを格納し、
前記処理部は、前記記憶部から読み出した前記プログラムに基づいて、
前記初期磁化曲線の略最大の微分透磁率を与える第1の点より大きい磁束密度領域では、前記初期磁化曲線を用い、該第1の点より小さい正の磁束密度領域では、該第1の点を通る前記略最大の微分透磁率を傾きとする直線を用いて、前記メジャーループの上昇側の曲線を作成し、
磁束密度が正の領域で、前記メジャーループの上昇側の曲線の最大磁束密度となる第2の点と、前記メジャーループの上昇側の曲線が磁束密度0となる点の磁界値の符号を反転させた第3の点とを任意の曲線で結んで、前記メジャーループの下降側の曲線を作成し、
前記メジャーループの上昇側の曲線および下降側の曲線を、原点を中心に点対称に180°回転させて、磁束密度が負の領域における前記メジャーループの曲線を作成し、
作成した前記メジャーループの曲線を前記表示部に表示させる
ことを特徴とする磁気特性推定装置。
Priority Applications (1)
| Application Number | Priority Date | Filing Date | Title |
|---|---|---|---|
| PCT/JP2017/006755 WO2018154672A1 (ja) | 2017-02-23 | 2017-02-23 | 磁気特性推定方法および磁気特性推定装置 |
Applications Claiming Priority (1)
| Application Number | Priority Date | Filing Date | Title |
|---|---|---|---|
| PCT/JP2017/006755 WO2018154672A1 (ja) | 2017-02-23 | 2017-02-23 | 磁気特性推定方法および磁気特性推定装置 |
Publications (1)
| Publication Number | Publication Date |
|---|---|
| WO2018154672A1 true WO2018154672A1 (ja) | 2018-08-30 |
Family
ID=63253648
Family Applications (1)
| Application Number | Title | Priority Date | Filing Date |
|---|---|---|---|
| PCT/JP2017/006755 Ceased WO2018154672A1 (ja) | 2017-02-23 | 2017-02-23 | 磁気特性推定方法および磁気特性推定装置 |
Country Status (1)
| Country | Link |
|---|---|
| WO (1) | WO2018154672A1 (ja) |
Cited By (4)
| Publication number | Priority date | Publication date | Assignee | Title |
|---|---|---|---|---|
| CN111381197A (zh) * | 2018-12-28 | 2020-07-07 | Tdk株式会社 | 磁传感器装置 |
| CN111381196A (zh) * | 2018-12-28 | 2020-07-07 | Tdk株式会社 | 磁传感器装置 |
| EP3757862A1 (en) | 2019-06-28 | 2020-12-30 | Fujitsu Limited | Magnetic field simulator method, magnetic field simulator program and corresponding information processing apparatus |
| JP2021179436A (ja) * | 2020-05-16 | 2021-11-18 | テクトロニクス・インコーポレイテッドTektronix, Inc. | 試験測定装置及び磁気損失測定方法 |
Citations (2)
| Publication number | Priority date | Publication date | Assignee | Title |
|---|---|---|---|---|
| US7502723B1 (en) * | 2005-06-01 | 2009-03-10 | Linear Technology Corporation | Asymmetric minor hysteresis loop model and circuit simulator including the same |
| WO2011114492A1 (ja) * | 2010-03-18 | 2011-09-22 | 富士通株式会社 | 磁性体のシミュレーション方法及びプログラム |
-
2017
- 2017-02-23 WO PCT/JP2017/006755 patent/WO2018154672A1/ja not_active Ceased
Patent Citations (2)
| Publication number | Priority date | Publication date | Assignee | Title |
|---|---|---|---|---|
| US7502723B1 (en) * | 2005-06-01 | 2009-03-10 | Linear Technology Corporation | Asymmetric minor hysteresis loop model and circuit simulator including the same |
| WO2011114492A1 (ja) * | 2010-03-18 | 2011-09-22 | 富士通株式会社 | 磁性体のシミュレーション方法及びプログラム |
Non-Patent Citations (1)
| Title |
|---|
| LEE, CHAHN ET AL.: "Phenomenological Hysteresis Modeling Based on Asymmetric Transition Probability of Magnetization", IEEE TRANSACTIONS ON MAGNETICS, vol. 50, no. 4, 10 April 2014 (2014-04-10), XP055538319 * |
Cited By (5)
| Publication number | Priority date | Publication date | Assignee | Title |
|---|---|---|---|---|
| CN111381197A (zh) * | 2018-12-28 | 2020-07-07 | Tdk株式会社 | 磁传感器装置 |
| CN111381196A (zh) * | 2018-12-28 | 2020-07-07 | Tdk株式会社 | 磁传感器装置 |
| CN111381196B (zh) * | 2018-12-28 | 2022-07-12 | Tdk株式会社 | 磁传感器装置 |
| EP3757862A1 (en) | 2019-06-28 | 2020-12-30 | Fujitsu Limited | Magnetic field simulator method, magnetic field simulator program and corresponding information processing apparatus |
| JP2021179436A (ja) * | 2020-05-16 | 2021-11-18 | テクトロニクス・インコーポレイテッドTektronix, Inc. | 試験測定装置及び磁気損失測定方法 |
Similar Documents
| Publication | Publication Date | Title |
|---|---|---|
| Hosseini et al. | An isogeometric solid‐like shell element for nonlinear analysis | |
| Kim et al. | FreeFEM++ code for reaction-diffusion equation–based topology optimization: for high-resolution boundary representation using adaptive mesh refinement | |
| Petras et al. | A least-squares implicit RBF-FD closest point method and applications to PDEs on moving surfaces | |
| Alves et al. | Probing the f (R) formalism through gravitational wave polarizations | |
| WO2018154672A1 (ja) | 磁気特性推定方法および磁気特性推定装置 | |
| Sundararaghavan | Reconstruction of three-dimensional anisotropic microstructures from two-dimensional micrographs imaged on orthogonal planes | |
| Chluba et al. | Spectral distortions from the dissipation of tensor perturbations | |
| De Corato et al. | Hydrodynamics and Brownian motions of a spheroid near a rigid wall | |
| Lian et al. | Stress analysis without meshing: Isogeometric boundary-element method | |
| Vignollet et al. | On the numerical integration of isogeometric interface elements | |
| Loi et al. | Torsional Alfvén resonances as an efficient damping mechanism for non-radial oscillations in red giant stars | |
| WO2019171660A1 (ja) | 磁場解析装置、解析方法、及びプログラム | |
| Shikhar Jaiswal | Shape parameterization of airfoil shapes using Bezier curves | |
| Korpinar et al. | Quasi binormal Schrodinger evolution of wave polarizatıon field of light wıth repulsive type | |
| Armas et al. | Thermal transitions of metastable M-branes | |
| Weißer | Residual error estimate for BEM-based FEM on polygonal meshes | |
| JP2005100067A (ja) | マイクロ磁化解析プログラムおよび解析装置 | |
| CN103718180B (zh) | 磁场分析方法 | |
| Jailin et al. | Fast four-dimensional tensile test monitored via X-ray computed tomography: Elastoplastic identification from radiographs | |
| CN107590300A (zh) | 最短路径确定方法和信息处理装置 | |
| JP6246339B2 (ja) | 図面ビューにスケッチ寸法を規定する方法、装置及びコンピュータプログラム | |
| Negara et al. | 3-D numerical investigation of subsurface flow in anisotropic porous media using multipoint flux approximation method | |
| JP2019215226A (ja) | 情報処理装置、閉磁路演算方法、および閉磁路演算システム | |
| Helin et al. | Bayesian design of measurements for magnetorelaxometry imaging | |
| Denisov et al. | Drift of suspended single-domain nanoparticles in a harmonically oscillating gradient magnetic field |
Legal Events
| Date | Code | Title | Description |
|---|---|---|---|
| 121 | Ep: the epo has been informed by wipo that ep was designated in this application |
Ref document number: 17898315 Country of ref document: EP Kind code of ref document: A1 |
|
| NENP | Non-entry into the national phase |
Ref country code: DE |
|
| 122 | Ep: pct application non-entry in european phase |
Ref document number: 17898315 Country of ref document: EP Kind code of ref document: A1 |
|
| NENP | Non-entry into the national phase |
Ref country code: JP |