WO2018145117A1 - Methods and compositions for diagnosis and prognosis of renal injury and renal failure - Google Patents
Methods and compositions for diagnosis and prognosis of renal injury and renal failure Download PDFInfo
- Publication number
- WO2018145117A1 WO2018145117A1 PCT/US2018/017118 US2018017118W WO2018145117A1 WO 2018145117 A1 WO2018145117 A1 WO 2018145117A1 US 2018017118 W US2018017118 W US 2018017118W WO 2018145117 A1 WO2018145117 A1 WO 2018145117A1
- Authority
- WO
- WIPO (PCT)
- Prior art keywords
- subject
- hours
- likelihood
- serum creatinine
- step comprises
- Prior art date
Links
Classifications
-
- G—PHYSICS
- G01—MEASURING; TESTING
- G01N—INVESTIGATING OR ANALYSING MATERIALS BY DETERMINING THEIR CHEMICAL OR PHYSICAL PROPERTIES
- G01N33/00—Investigating or analysing materials by specific methods not covered by groups G01N1/00 - G01N31/00
- G01N33/48—Biological material, e.g. blood, urine; Haemocytometers
- G01N33/50—Chemical analysis of biological material, e.g. blood, urine; Testing involving biospecific ligand binding methods; Immunological testing
- G01N33/68—Chemical analysis of biological material, e.g. blood, urine; Testing involving biospecific ligand binding methods; Immunological testing involving proteins, peptides or amino acids
- G01N33/6893—Chemical analysis of biological material, e.g. blood, urine; Testing involving biospecific ligand binding methods; Immunological testing involving proteins, peptides or amino acids related to diseases not provided for elsewhere
-
- G—PHYSICS
- G01—MEASURING; TESTING
- G01N—INVESTIGATING OR ANALYSING MATERIALS BY DETERMINING THEIR CHEMICAL OR PHYSICAL PROPERTIES
- G01N33/00—Investigating or analysing materials by specific methods not covered by groups G01N1/00 - G01N31/00
- G01N33/48—Biological material, e.g. blood, urine; Haemocytometers
- G01N33/50—Chemical analysis of biological material, e.g. blood, urine; Testing involving biospecific ligand binding methods; Immunological testing
- G01N33/53—Immunoassay; Biospecific binding assay; Materials therefor
- G01N33/543—Immunoassay; Biospecific binding assay; Materials therefor with an insoluble carrier for immobilising immunochemicals
-
- G—PHYSICS
- G01—MEASURING; TESTING
- G01N—INVESTIGATING OR ANALYSING MATERIALS BY DETERMINING THEIR CHEMICAL OR PHYSICAL PROPERTIES
- G01N33/00—Investigating or analysing materials by specific methods not covered by groups G01N1/00 - G01N31/00
- G01N33/48—Biological material, e.g. blood, urine; Haemocytometers
- G01N33/50—Chemical analysis of biological material, e.g. blood, urine; Testing involving biospecific ligand binding methods; Immunological testing
- G01N33/68—Chemical analysis of biological material, e.g. blood, urine; Testing involving biospecific ligand binding methods; Immunological testing involving proteins, peptides or amino acids
-
- G—PHYSICS
- G16—INFORMATION AND COMMUNICATION TECHNOLOGY [ICT] SPECIALLY ADAPTED FOR SPECIFIC APPLICATION FIELDS
- G16B—BIOINFORMATICS, i.e. INFORMATION AND COMMUNICATION TECHNOLOGY [ICT] SPECIALLY ADAPTED FOR GENETIC OR PROTEIN-RELATED DATA PROCESSING IN COMPUTATIONAL MOLECULAR BIOLOGY
- G16B25/00—ICT specially adapted for hybridisation; ICT specially adapted for gene or protein expression
- G16B25/10—Gene or protein expression profiling; Expression-ratio estimation or normalisation
-
- G—PHYSICS
- G16—INFORMATION AND COMMUNICATION TECHNOLOGY [ICT] SPECIALLY ADAPTED FOR SPECIFIC APPLICATION FIELDS
- G16B—BIOINFORMATICS, i.e. INFORMATION AND COMMUNICATION TECHNOLOGY [ICT] SPECIALLY ADAPTED FOR GENETIC OR PROTEIN-RELATED DATA PROCESSING IN COMPUTATIONAL MOLECULAR BIOLOGY
- G16B40/00—ICT specially adapted for biostatistics; ICT specially adapted for bioinformatics-related machine learning or data mining, e.g. knowledge discovery or pattern finding
- G16B40/20—Supervised data analysis
-
- G—PHYSICS
- G01—MEASURING; TESTING
- G01N—INVESTIGATING OR ANALYSING MATERIALS BY DETERMINING THEIR CHEMICAL OR PHYSICAL PROPERTIES
- G01N2333/00—Assays involving biological materials from specific organisms or of a specific nature
- G01N2333/435—Assays involving biological materials from specific organisms or of a specific nature from animals; from humans
- G01N2333/52—Assays involving cytokines
- G01N2333/521—Chemokines
-
- G—PHYSICS
- G01—MEASURING; TESTING
- G01N—INVESTIGATING OR ANALYSING MATERIALS BY DETERMINING THEIR CHEMICAL OR PHYSICAL PROPERTIES
- G01N2333/00—Assays involving biological materials from specific organisms or of a specific nature
- G01N2333/90—Enzymes; Proenzymes
- G01N2333/914—Hydrolases (3)
- G01N2333/948—Hydrolases (3) acting on peptide bonds (3.4)
- G01N2333/95—Proteinases, i.e. endopeptidases (3.4.21-3.4.99)
- G01N2333/964—Proteinases, i.e. endopeptidases (3.4.21-3.4.99) derived from animal tissue
- G01N2333/96425—Proteinases, i.e. endopeptidases (3.4.21-3.4.99) derived from animal tissue from mammals
- G01N2333/96427—Proteinases, i.e. endopeptidases (3.4.21-3.4.99) derived from animal tissue from mammals in general
- G01N2333/9643—Proteinases, i.e. endopeptidases (3.4.21-3.4.99) derived from animal tissue from mammals in general with EC number
- G01N2333/96486—Metalloendopeptidases (3.4.24)
-
- G—PHYSICS
- G01—MEASURING; TESTING
- G01N—INVESTIGATING OR ANALYSING MATERIALS BY DETERMINING THEIR CHEMICAL OR PHYSICAL PROPERTIES
- G01N2800/00—Detection or diagnosis of diseases
- G01N2800/34—Genitourinary disorders
- G01N2800/347—Renal failures; Glomerular diseases; Tubulointerstitial diseases, e.g. nephritic syndrome, glomerulonephritis; Renovascular diseases, e.g. renal artery occlusion, nephropathy
-
- G—PHYSICS
- G01—MEASURING; TESTING
- G01N—INVESTIGATING OR ANALYSING MATERIALS BY DETERMINING THEIR CHEMICAL OR PHYSICAL PROPERTIES
- G01N2800/00—Detection or diagnosis of diseases
- G01N2800/56—Staging of a disease; Further complications associated with the disease
Definitions
- the kidney is responsible for water and solute excretion from the body. Its functions include maintenance of acid-base balance, regulation of electrolyte concentrations, control of blood volume, and regulation of blood pressure. As such, loss of kidney function through injury and/or disease results in substantial morbidity and mortality. A detailed discussion of renal injuries is provided in Harrison's Principles of Internal Medicine, 17 th Ed., McGraw Hill, New York, pages 1741-1830, which are hereby incorporated by reference in their entirety. Renal disease and/or injury may be acute or chronic.
- Acute and chronic kidney disease are described as follows (from Current Medical Diagnosis & Treatment 2008, 47 th Ed, McGraw Hill, New York, pages 785-815, which are hereby incorporated by reference in their entirety): "Acute renal failure is worsening of renal function over hours to days, resulting in the retention of nitrogenous wastes (such as urea nitrogen) and creatinine in the blood. Retention of these substances is called azotemia.
- Chronic renal failure results from an abnormal loss of renal function over months to years”.
- Acute renal failure also known as acute kidney injury, or AKI
- AKI acute kidney injury
- intravascular fluid into the extravascular space due to ascites, peritonitis, pancreatitis, or burns), loss of skin and mucus membranes, renal salt- and water-wasting states
- Ischemia prolonged or severe prerenal state
- NSAIDs cyclosporines, tacrolimus, aminoglycosides, foscarnet, ethylene glycol, hemoglobin, myoglobin, ifosfamide, heavy metals, methotrexate, radiopaque contrast agents, streptozotocin
- Acute tubulointerstitial Drug reaction eg, ⁇ -lactams, NSAIDs, sulfonamides, nephritis ciprofloxacin, thiazide diuretics, furosemide, phenytoin, allopurinol, pyelonephritis, papillary necrosis
- acyclovir indinavir, methotrexate, ethylene glycol ingestion, myeloma protein, myoglobin Type Risk Factors
- Bladder obstruction Mechanical Benign prostatic hyperplasia, prostate
- Neurogenic Anticholinergic drugs, upper or lower motor neuron lesion
- ischemic ARF the course of the disease may be divided into four phases.
- an initiation phase which lasts hours to days, reduced perfusion of the kidney is evolving into injury. Glomerular ultrafiltration reduces, the flow of filtrate is reduced due to debris within the tubules, and back leakage of filtrate through injured epithelium occurs.
- Renal injury can be mediated during this phase by reperfusion of the kidney.
- Initiation is followed by an extension phase which is characterized by continued ischemic injury and inflammation and may involve endothelial damage and vascular congestion.
- the maintenance phase lasting from 1 to 2 weeks, renal cell injury occurs, and glomerular filtration and urine output reaches a minimum.
- a recovery phase can follow in which the renal epithelium is repaired and GFR gradually recovers. Despite this, the survival rate of subjects with ARF may be as low as about 60%.
- Acute kidney injury caused by radiocontrast agents also called contrast media
- other nephrotoxins such as cyclosporine, antibiotics including aminoglycosides and anticancer drugs such as cisplatin manifests over a period of days to about a week.
- Contrast induced nephropathy (CIN, which is AKI caused by radiocontrast agents) is thought to be caused by intrarenal vasoconstriction (leading to ischemic injury) and from the generation of reactive oxygen species that are directly toxic to renal tubular epithelial cells.
- CIN classically presents as an acute (onset within 24-48h) but reversible (peak 3-5 days, resolution within 1 week) rise in blood urea nitrogen and serum creatinine.
- a commonly reported criteria for defining and detecting AKI is an abrupt (typically within about 2-7 days or within a period of hospitalization) elevation of serum creatinine.
- serum creatinine elevation to define and detect AKI is well established, the magnitude of the serum creatinine elevation and the time over which it is measured to define AKI varies considerably among publications.
- relatively large increases in serum creatinine such as 100%, 200%, an increase of at least 100% to a value over 2 mg/dL and other definitions were used to define AKI.
- the recent trend has been towards using smaller serum creatinine rises to define AKI.
- ERD end stage renal disease— the need for dialysis for more than 3 months.
- RIFLE criteria which provide a useful clinical tool to classify renal status.
- the RIFLE criteria provide a uniform definition of AKI which has been validated in numerous studies.
- Stage I increase in serum creatinine of more than or equal to 0.3 mg/dL (> 26.4 ⁇ /L) or increase to more than or equal to 150% (1.5-fold) from baseline OR urine output less than 0.5 mL/kg per hour for more than 6 hours;
- Standardize ⁇ increase in serum creatinine to more than 200% (> 2-fold) from baseline OR urine output less than 0.5 mL/kg per hour for more than 12 hours;
- Stage III increase in serum creatinine to more than 300% (> 3-fold) from baseline OR serum creatinine > 354 ⁇ /L accompanied by an acute increase of at least 44 ⁇ /L OR urine output less than 0.3 mL/kg per hour for 24 hours or anuria for 12 hours.
- serum creatinine is generally regarded to have several limitations in the diagnosis, assessment and monitoring of AKI patients.
- the time period for serum creatinine to rise to values (e.g., a 0.3 mg/dL or 25% rise) considered diagnostic for AKI can be 48 hours or longer depending on the definition used. Since cellular injury in AKI can occur over a period of hours, serum creatinine elevations detected at 48 hours or longer can be a late indicator of injury, and relying on serum creatinine can thus delay diagnosis of AKI.
- serum creatinine is not a good indicator of the exact kidney status and treatment needs during the most acute phases of AKI when kidney function is changing rapidly. Some patients with AKI will recover fully, some will need dialysis (either short term or long term) and some will have other detrimental outcomes including death, major adverse cardiac events and chronic kidney disease. Because serum creatinine is a marker of filtration rate, it does not differentiate between the causes of AKI (pre-renal, intrinsic renal, post-renal obstruction, atheroembolic, etc) or the category or location of injury in intrinsic renal disease (for example, tubular, glomerular or interstitial in origin). Urine output is similarly limited, Knowing these things can be of vital importance in managing and treating patients with AKI.
- measurement of one or more markers selected from the group consisting of Metalloproteinase inhibitor 1, Metalloproteinase inhibitor 2, Metalloproteinase inhibitor 4, C-C motif chemokine 15, C-C motif chemokine 18, C-C motif chemokine 23, and/or, C-C motif chemokine 24 can be used for diagnosis, prognosis, risk stratification, staging, monitoring, categorizing and determination of further diagnosis and treatment regimens in subjects suffering or at risk of suffering from an injury to renal function, reduced renal function, and/or acute renal failure (also called acute kidney injury).
- kidney injury markers may be used, individually or in panels comprising a plurality of kidney injury markers, for risk stratification (that is, to identify subjects at risk for a future injury to renal function, for future progression to reduced renal function, for future progression to ARF, for future improvement in renal function, etc.); for diagnosis of existing disease (that is, to identify subjects who have suffered an injury to renal function, who have progressed to reduced renal function, who have progressed to ARF, etc.); for monitoring for deterioration or improvement of renal function; and for predicting a future medical outcome, such as improved or worsening renal function, a decreased or increased mortality risk, a decreased or increased risk that a subject will require renal replacement therapy (i.e., hemodialysis, peritoneal dialysis, hemofiltration, and/or renal transplantation, a decreased or increased risk that a subject will recover from an injury to renal function, a decreased or increased risk that a subject will recover from ARF, a decreased or increased risk that a subject will progress to end stage renal disease,
- the present invention relates to methods for evaluating renal status in a subject. These methods comprise performing an assay method that is configured to detect one or more kidney injury markers of the present invention in a body fluid sample obtained from the subject.
- the assay result(s) for example a measured concentration of one or more markers selected from the group consisting of Metalloproteinase inhibitor 1, Metalloproteinase inhibitor 2, Metalloproteinase inhibitor 4, C-C motif chemokine 15, C-C motif chemokine 18, C-C motif chemokine 23, and/or, C-C motif chemokine 24, is/are then correlated to the renal status of the subject.
- This correlation to renal status may include correlating the assay result(s) to one or more of risk stratification, diagnosis, prognosis, staging, classifying and monitoring of the subject as described herein.
- the present invention utilizes one or more kidney injury markers of the present invention for the evaluation of renal injury.
- the methods for evaluating renal status described herein are methods for risk stratification of the subject; that is, assigning a likelihood of one or more future changes in renal status to the subject.
- the assay result(s) is/are correlated to one or more such future changes. The following are preferred risk stratification embodiments.
- these methods comprise determining a subject' s risk for a future injury to renal function, and the assay result(s), for example a measured concentration of one or more markers selected from the group consisting of
- Metalloproteinase inhibitor 1, Metalloproteinase inhibitor 2, Metalloproteinase inhibitor 4, C-C motif chemokine 15, C-C motif chemokine 18, C-C motif chemokine 23, and/or, C-C motif chemokine 24, is/are correlated to a likelihood of such a future injury to renal function.
- the measured concentration(s) may each be compared to a threshold value.
- a threshold value For a "positive going" kidney injury marker, an increased likelihood of suffering a future injury to renal function is assigned to the subject when the measured concentration is above the threshold, relative to a likelihood assigned when the measured concentration is below the threshold.
- a "negative going" kidney injury marker an increased likelihood of suffering a future injury to renal function is assigned to the subject when the measured concentration is below the threshold, relative to a likelihood assigned when the measured concentration is above the threshold.
- these methods comprise determining a subject's risk for future reduced renal function, and the assay result(s), for example a measured concentration of one or more markers selected from the group consisting of Metalloproteinase inhibitor 1, Metalloproteinase inhibitor 2, Metalloproteinase inhibitor 4, C-C motif chemokine 15, C-C motif chemokine 18, C-C motif chemokine 23, and/or, C-C motif chemokine 24, is/are correlated to a likelihood of such reduced renal function.
- the measured concentrations may each be compared to a threshold value.
- an increased likelihood of suffering a future reduced renal function is assigned to the subject when the measured concentration is above the threshold, relative to a likelihood assigned when the measured concentration is below the threshold.
- an increased likelihood of future reduced renal function is assigned to the subject when the measured concentration is below the threshold, relative to a likelihood assigned when the measured concentration is above the threshold.
- these methods comprise determining a subject's likelihood for a future improvement in renal function, and the assay result(s), for example a measured concentration of one or more markers selected from the group consisting of Metalloproteinase inhibitor 1, Metalloproteinase inhibitor 2, Metalloproteinase inhibitor 4, C-C motif chemokine 15, C-C motif chemokine 18, C-C motif chemokine 23, and/or, C-C motif chemokine 24, is/are correlated to a likelihood of such a future improvement in renal function.
- the measured concentration(s) may each be compared to a threshold value.
- an increased likelihood of a future improvement in renal function is assigned to the subject when the measured concentration is below the threshold, relative to a likelihood assigned when the measured concentration is above the threshold.
- an increased likelihood of a future improvement in renal function is assigned to the subject when the measured concentration is above the threshold, relative to a likelihood assigned when the measured concentration is below the threshold.
- these methods comprise determining a subject's risk for progression to ARF, and the result(s), for example a measured concentration of one or more markers selected from the group consisting of Metalloproteinase inhibitor 1, Metalloproteinase inhibitor 2, Metalloproteinase inhibitor 4, C-C motif chemokine 15, C-C motif chemokine 18, C-C motif chemokine 23, and/or, C-C motif chemokine 24, is/are correlated to a likelihood of such progression to ARF.
- the measured concentration of one or more markers selected from the group consisting of Metalloproteinase inhibitor 1, Metalloproteinase inhibitor 2, Metalloproteinase inhibitor 4, C-C motif chemokine 15, C-C motif chemokine 18, C-C motif chemokine 23, and/or, C-C motif chemokine 24 is/are correlated to a likelihood of such progression to ARF.
- the measured concentration of one or more markers selected from the group consisting of Metalloproteinase inhibitor 1, Metalloprotein
- concentration(s) may each be compared to a threshold value.
- a threshold value For a "positive going" kidney injury marker, an increased likelihood of progression to ARF is assigned to the subject when the measured concentration is above the threshold, relative to a likelihood assigned when the measured concentration is below the threshold.
- a "negative going” kidney injury marker an increased likelihood of progression to ARF is assigned to the subject when the measured concentration is below the threshold, relative to a likelihood assigned when the measured concentration is above the threshold.
- these methods comprise determining a subject's outcome risk, and the assay result(s), for example a measured concentration of one or more markers selected from the group consisting of Metalloproteinase inhibitor 1, Metalloproteinase inhibitor 2, Metalloproteinase inhibitor 4, C-C motif chemokine 15, C-C motif chemokine 18, C-C motif chemokine 23, and/or, C-C motif chemokine 24, is/are correlated to a likelihood of the occurrence of a clinical outcome related to a renal injury suffered by the subject.
- the measured concentration(s) may each be compared to a threshold value.
- kidney injury marker For a "positive going" kidney injury marker, an increased likelihood of one or more of: acute kidney injury, progression to a worsening stage of AKI, mortality, a requirement for renal replacement therapy, a requirement for withdrawal of renal toxins, end stage renal disease, heart failure, stroke, myocardial infarction, progression to chronic kidney disease, etc., is assigned to the subject when the measured concentration is above the threshold, relative to a likelihood assigned when the measured concentration is below the threshold.
- kidney injury marker For a "negative going" kidney injury marker, an increased likelihood of one or more of: acute kidney injury, progression to a worsening stage of AKI, mortality, a requirement for renal replacement therapy, a requirement for withdrawal of renal toxins, end stage renal disease, heart failure, stroke, myocardial infarction, progression to chronic kidney disease, etc., is assigned to the subject when the measured concentration is below the threshold, relative to a likelihood assigned when the measured concentration is above the threshold.
- the likelihood or risk assigned is that an event of interest is more or less likely to occur within 180 days of the time at which the body fluid sample is obtained from the subject.
- the likelihood or risk assigned relates to an event of interest occurring within a shorter time period such as 18 months, 120 days, 90 days, 60 days, 45 days, 30 days, 21 days, 14 days, 7 days, 5 days, 96 hours, 72 hours, 48 hours, 36 hours, 24 hours, 12 hours, or less.
- a risk at 0 hours of the time at which the body fluid sample is obtained from the subject is equivalent to diagnosis of a current condition.
- the subject is selected for risk stratification based on the pre-existence in the subject of one or more known risk factors for prerenal, intrinsic renal, or postrenal ARF.
- a subject undergoing or having undergone major vascular surgery, coronary artery bypass, or other cardiac surgery a subject having pre-existing congestive heart failure, preeclampsia, eclampsia, diabetes mellitus, hypertension, coronary artery disease, proteinuria, renal insufficiency, glomerular filtration below the normal range, cirrhosis, serum creatinine above the normal range, or sepsis; or a subject exposed to NSAIDs, cyclosporines, tacrolimus, aminoglycosides, foscarnet, ethylene glycol, hemoglobin, myoglobin, ifosfamide, heavy metals, methotrexate, radiopaque contrast agents, or streptozotocin are all preferred subjects for monitoring risks according to
- pre-existence in this context is meant that the risk factor exists at the time the body fluid sample is obtained from the subject.
- a subject is chosen for risk stratification based on an existing diagnosis of injury to renal function, reduced renal function, or ARF.
- the methods for evaluating renal status described herein are methods for diagnosing a renal injury in the subject; that is, assessing whether or not a subject has suffered from an injury to renal function, reduced renal function, or ARF.
- the assay result(s) is/are correlated to the occurrence or nonoccurrence of a change in renal status. The following are preferred diagnostic embodiments.
- these methods comprise diagnosing the occurrence or nonoccurrence of an injury to renal function, and the assay result(s), for example a measured concentration of one or more markers selected from the group consisting of Metalloproteinase inhibitor 1, Metalloproteinase inhibitor 2, Metalloproteinase inhibitor 4, C-C motif chemokine 15, C-C motif chemokine 18, C-C motif chemokine 23, and/or, C-C motif chemokine 24, is/are correlated to the occurrence or nonoccurrence of such an injury. For example, each of the measured concentration(s) may be compared to a threshold value.
- an increased likelihood of the occurrence of an injury to renal function is assigned to the subject when the measured concentration is above the threshold (relative to the likelihood assigned when the measured concentration is below the threshold); alternatively, when the measured concentration is below the threshold, an increased likelihood of the nonoccurrence of an injury to renal function may be assigned to the subject (relative to the likelihood assigned when the measured concentration is above the threshold).
- an increased likelihood of the occurrence of an injury to renal function is assigned to the subject when the measured concentration is below the threshold (relative to the likelihood assigned when the measured concentration is above the threshold); alternatively, when the measured concentration is above the threshold, an increased likelihood of the nonoccurrence of an injury to renal function may be assigned to the subject (relative to the likelihood assigned when the measured concentration is below the threshold).
- these methods comprise diagnosing the occurrence or nonoccurrence of reduced renal function, and the assay result(s), for example a measured concentration of one or more markers selected from the group consisting of
- Metalloproteinase inhibitor 1 Metalloproteinase inhibitor 2
- Metalloproteinase inhibitor 4 C-C motif chemokine 15, C-C motif chemokine 18, C-C motif chemokine 23, and/or, C-C motif chemokine 24
- each of the measured concentration(s) may be compared to a threshold value.
- an increased likelihood of the occurrence of an injury causing reduced renal function is assigned to the subject when the measured concentration is above the threshold (relative to the likelihood assigned when the measured concentration is below the threshold); alternatively, when the measured concentration is below the threshold, an increased likelihood of the nonoccurrence of an injury causing reduced renal function may be assigned to the subject (relative to the likelihood assigned when the measured concentration is above the threshold).
- an increased likelihood of the occurrence of an injury causing reduced renal function is assigned to the subject when the measured concentration is below the threshold (relative to the likelihood assigned when the measured concentration is above the threshold); alternatively, when the measured concentration is above the threshold, an increased likelihood of the nonoccurrence of an injury causing reduced renal function may be assigned to the subject (relative to the likelihood assigned when the measured concentration is below the threshold).
- these methods comprise diagnosing the occurrence or nonoccurrence of ARF, and the assay result(s), for example a measured concentration of one or more markers selected from the group consisting of Metalloproteinase inhibitor 1, Metalloproteinase inhibitor 2, Metalloproteinase inhibitor 4, C-C motif chemokine 15, C-C motif chemokine 18, C-C motif chemokine 23, and/or, C-C motif chemokine 24, is/are correlated to the occurrence or nonoccurrence of an injury causing ARF. For example, each of the measured concentration(s) may be compared to a threshold value.
- an increased likelihood of the occurrence of ARF is assigned to the subject when the measured concentration is above the threshold (relative to the likelihood assigned when the measured concentration is below the threshold); alternatively, when the measured concentration is below the threshold, an increased likelihood of the nonoccurrence of ARF may be assigned to the subject (relative to the likelihood assigned when the measured concentration is above the threshold).
- an increased likelihood of the occurrence of ARF is assigned to the subject when the measured concentration is below the threshold (relative to the likelihood assigned when the measured concentration is above the threshold); alternatively, when the measured concentration is above the threshold, an increased likelihood of the nonoccurrence of ARF may be assigned to the subject (relative to the likelihood assigned when the measured concentration is below the threshold).
- these methods comprise diagnosing a subject as being in need of renal replacement therapy, and the assay result(s), for example a measured concentration of one or more markers selected from the group consisting of
- Metalloproteinase inhibitor 1 Metalloproteinase inhibitor 2
- Metalloproteinase inhibitor 4 C-C motif chemokine 15, C-C motif chemokine 18, C-C motif chemokine 23, and/or, C-C motif chemokine 24
- each of the measured concentration(s) may be compared to a threshold value.
- an increased likelihood of the occurrence of an injury creating a need for renal replacement therapy is assigned to the subject when the measured concentration is above the threshold (relative to the likelihood assigned when the measured concentration is below the threshold); alternatively, when the measured concentration is below the threshold, an increased likelihood of the nonoccurrence of an injury creating a need for renal replacement therapy may be assigned to the subject (relative to the likelihood assigned when the measured concentration is above the threshold).
- an increased likelihood of the occurrence of an injury creating a need for renal replacement therapy is assigned to the subject when the measured concentration is below the threshold (relative to the likelihood assigned when the measured concentration is above the threshold); alternatively, when the measured concentration is above the threshold, an increased likelihood of the nonoccurrence of an injury creating a need for renal replacement therapy may be assigned to the subject (relative to the likelihood assigned when the measured concentration is below the threshold).
- these methods comprise diagnosing a subject as being in need of renal transplantation, and the assay result(s), for example a measured concentration of one or more markers selected from the group consisting of
- Metalloproteinase inhibitor 1 Metalloproteinase inhibitor 2
- Metalloproteinase inhibitor 4 C-C motif chemokine 15, C-C motif chemokine 18, C-C motif chemokine 23, and/or, C-C motif chemokine 24
- each of the measured concentration(s) may be compared to a threshold value.
- an increased likelihood of the occurrence of an injury creating a need for renal transplantation is assigned to the subject when the measured concentration is above the threshold (relative to the likelihood assigned when the measured concentration is below the threshold); alternatively, when the measured concentration is below the threshold, an increased likelihood of the nonoccurrence of an injury creating a need for renal transplantation may be assigned to the subject (relative to the likelihood assigned when the measured concentration is above the threshold).
- an increased likelihood of the occurrence of an injury creating a need for renal transplantation is assigned to the subject when the measured concentration is below the threshold (relative to the likelihood assigned when the measured concentration is above the threshold); alternatively, when the measured concentration is above the threshold, an increased likelihood of the nonoccurrence of an injury creating a need for renal transplantation may be assigned to the subject (relative to the likelihood assigned when the measured concentration is below the threshold).
- the methods for evaluating renal status described herein are methods for monitoring a renal injury in the subject; that is, assessing whether or not renal function is improving or worsening in a subject who has suffered from an injury to renal function, reduced renal function, or ARF.
- the assay result(s) for example a measured concentration of one or more markers selected from the group consisting of Metalloproteinase inhibitor 1, Metalloproteinase inhibitor 2, Metalloproteinase inhibitor 4, C-C motif chemokine 15, C-C motif chemokine 18, C-C motif chemokine 23, and/or, C-C motif chemokine 24, is/are correlated to the occurrence or nonoccurrence of a change in renal status.
- the following are preferred monitoring embodiments.
- these methods comprise monitoring renal status in a subject suffering from an injury to renal function, and the assay result(s), for example a measured concentration of one or more markers selected from the group consisting of Metalloproteinase inhibitor 1, Metalloproteinase inhibitor 2, Metalloproteinase inhibitor 4, C-C motif chemokine 15, C-C motif chemokine 18, C-C motif chemokine 23, and/or, C-C motif chemokine 24, is/are correlated to the occurrence or nonoccurrence of a change in renal status in the subject.
- the measured concentration(s) may be compared to a threshold value.
- a worsening of renal function when the measured concentration is above the threshold, a worsening of renal function may be assigned to the subject; alternatively, when the measured concentration is below the threshold, an improvement of renal function may be assigned to the subject.
- a worsening of renal function when the measured concentration is below the threshold, a worsening of renal function may be assigned to the subject; alternatively, when the measured concentration is above the threshold, an improvement of renal function may be assigned to the subject.
- these methods comprise monitoring renal status in a subject suffering from reduced renal function, and the assay result(s), for example a measured concentration of one or more markers selected from the group consisting of Metalloproteinase inhibitor 1, Metalloproteinase inhibitor 2, Metalloproteinase inhibitor 4, C-C motif chemokine 15, C-C motif chemokine 18, C-C motif chemokine 23, and/or, C-C motif chemokine 24, is/are correlated to the occurrence or nonoccurrence of a change in renal status in the subject.
- the measured concentration(s) may be compared to a threshold value.
- a worsening of renal function when the measured concentration is above the threshold, a worsening of renal function may be assigned to the subject; alternatively, when the measured concentration is below the threshold, an improvement of renal function may be assigned to the subject.
- a worsening of renal function when the measured concentration is below the threshold, a worsening of renal function may be assigned to the subject; alternatively, when the measured concentration is above the threshold, an improvement of renal function may be assigned to the subject.
- these methods comprise monitoring renal status in a subject suffering from acute renal failure, and the assay result(s), for example a measured concentration of one or more markers selected from the group consisting of
- Metalloproteinase inhibitor 1, Metalloproteinase inhibitor 2, Metalloproteinase inhibitor 4, C-C motif chemokine 15, C-C motif chemokine 18, C-C motif chemokine 23, and/or, C-C motif chemokine 24, is/are correlated to the occurrence or nonoccurrence of a change in renal status in the subject.
- the measured concentration(s) may be compared to a threshold value.
- a threshold value For a positive going marker, when the measured concentration is above the threshold, a worsening of renal function may be assigned to the subject; alternatively, when the measured concentration is below the threshold, an improvement of renal function may be assigned to the subject.
- a negative going marker when the measured concentration is below the threshold, a worsening of renal function may be assigned to the subject; alternatively, when the measured concentration is above the threshold, an improvement of renal function may be assigned to the subject.
- these methods comprise monitoring renal status in a subject at risk of an injury to renal function due to the pre-existence of one or more known risk factors for prerenal, intrinsic renal, or postrenal ARF, and the assay result(s), for example a measured concentration of one or more markers selected from the group consisting of Metalloproteinase inhibitor 1, Metalloproteinase inhibitor 2, Metalloproteinase inhibitor 4, C-C motif chemokine 15, C-C motif chemokine 18, C-C motif chemokine 23, and/or, C-C motif chemokine 24, is/are correlated to the occurrence or nonoccurrence of a change in renal status in the subject.
- the assay result(s) for example a measured concentration of one or more markers selected from the group consisting of Metalloproteinase inhibitor 1, Metalloproteinase inhibitor 2, Metalloproteinase inhibitor 4, C-C motif chemokine 15, C-C motif chemokine 18, C-C motif chemokine 23, and/or, C-C motif chemok
- the measured concentration(s) may be compared to a threshold value.
- a threshold value For a positive going marker, when the measured concentration is above the threshold, a worsening of renal function may be assigned to the subject; alternatively, when the measured concentration is below the threshold, an improvement of renal function may be assigned to the subject.
- a negative going marker when the measured concentration is below the threshold, a worsening of renal function may be assigned to the subject; alternatively, when the measured concentration is above the threshold, an improvement of renal function may be assigned to the subject.
- these methods comprise monitoring renal status in a subject having, or at risk of, an injury to renal function for future persistence of acute kidney injury.
- “Future persistence” as used herein refers to an existing acute renal injury that will continue for a period selected from the group consisting of 21 days, 14 days, 7 days, 5 days, 96 hours, 72 hours, 48 hours, 36 hours, 24 hours, and 12 hours.
- the subject has an acute kidney injury at the time the sample is obtained. This is not meant to imply that the subject must have an acute kidney injury at the time the sample is obtained, but rather that the subject, upon onset of an acute kidney injury, suffers from an acute kidney injury that will persist.
- the assay result(s) for example a measured concentration of one or more markers selected from the group consisting of Metalloproteinase inhibitor 1, Metalloproteinase inhibitor 2, Metalloproteinase inhibitor 4, C-C motif chemokine 15, C-C motif chemokine 18, C-C motif chemokine 23, and/or, C-C motif chemokine 24, is/are correlated to the future persistence of the acute kidney injury in the subject.
- the measured concentration(s) may be compared to a threshold value.
- a future persistence of acute kidney injury when the measured concentration is above the threshold, a future persistence of acute kidney injury may be assigned to the subject; alternatively, when the measured concentration is below the threshold, afuture improvement of renal function may be assigned to the subject.
- a future persistence of acute kidney injury when the measured concentration is below the threshold, a future persistence of acute kidney injury may be assigned to the subject; alternatively, when the measured concentration is above the threshold, a future improvement of renal function may be assigned to the subject.
- the methods for evaluating renal status described herein are methods for classifying a renal injury in the subject; that is, determining whether a renal injury in a subject is prerenal, intrinsic renal, or postrenal; and/or further subdividing these classes into subclasses such as acute tubular injury, acute glomerulonephritis acute
- the assay result(s) for example a measured concentration of one or more markers selected from the group consisting of Metalloproteinase inhibitor 1, Metalloproteinase inhibitor 2,
- Metalloproteinase inhibitor 4 C-C motif chemokine 15, C-C motif chemokine 18, C-C motif chemokine 23, and/or, C-C motif chemokine 24, is/are correlated to a particular class and/or subclass.
- the following are preferred classification embodiments.
- these methods comprise determining whether a renal injury in a subject is prerenal, intrinsic renal, or postrenal; and/or further subdividing these classes into subclasses such as acute tubular injury, acute glomerulonephritis acute tubulointerstitial nephritis, acute vascular nephropathy, or infiltrative disease; and/or assigning a likelihood that a subject will progress to a particular RIFLE stage, and the assay result(s), for example a measured concentration of one or more markers selected from the group consisting of Metalloproteinase inhibitor 1, Metalloproteinase inhibitor 2, Metalloproteinase inhibitor 4, C-C motif chemokine 15, C-C motif chemokine 18, C-C motif chemokine 23, and/or, C-C motif chemokine 24, is/are correlated to the injury classification for the subject.
- the measured concentration may be compared to a threshold value, and when the measured concentration is above the threshold, a particular
- a different classification may be assigned to the subject.
- the threshold value may be determined from a population of normal subjects by selecting a concentration representing the 75 th , 85 th , 90 th , 95 th , or 99 th percentile of a kidney injury marker measured in such normal subjects.
- the threshold value may be determined from a "diseased" population of subjects, e.g., those suffering from an injury or having a predisposition for an injury (e.g., progression to ARF or some other clinical outcome such as death, dialysis, renal transplantation, etc.), by selecting a concentration representing the 75 th , 85 th , 90 th , 95 th , or 99 th percentile of a kidney injury marker measured in such subjects.
- the threshold value may be determined from a prior measurement of a kidney injury marker in the same subject; that is, a temporal change in the level of a kidney injury marker in the subject may be used to assign risk to the subject.
- kidney injury markers of the present invention must be compared to corresponding individual thresholds.
- Methods for combining assay results can comprise the use of multivariate logistical regression, loglinear modeling, neural network analysis, n-of-m analysis, decision tree analysis, calculating ratios of markers, etc. This list is not meant to be limiting.
- a composite result which is determined by combining individual markers may be treated as if it is itself a marker; that is, a threshold may be determined for the composite result as described herein for individual markers, and the composite result for an individual patient compared to this threshold.
- ROC curves established from a "first" subpopulation which is predisposed to one or more future changes in renal status, and a "second" subpopulation which is not so predisposed can be used to calculate a ROC curve, and the area under the curve provides a measure of the quality of the test.
- the tests described herein provide a ROC curve area greater than 0.5, preferably at least 0.6, more preferably 0.7, still more preferably at least 0.8, even more preferably at least 0.9, and most preferably at least 0.95.
- the measured concentration of one or more kidney injury markers, or a composite of such markers may be treated as continuous variables.
- any particular concentration can be converted into a corresponding probability of a future reduction in renal function for the subject, the occurrence of an injury, a classification, etc.
- a threshold that can provide an acceptable level of specificity and sensitivity in separating a population of subjects into "bins” such as a "first" subpopulation (e.g., which is predisposed to one or more future changes in renal status, the occurrence of an injury, a classification, etc.) and a "second" subpopulation which is not so predisposed.
- a threshold value is selected to separate this first and second population by one or more of the following measures of test accuracy: an odds ratio greater than 1, preferably at least about 2 or more or about 0.5 or less, more preferably at least about 3 or more or about 0.33 or less, still more preferably at least about 4 or more or about 0.25 or less, even more preferably at least about 5 or more or about 0.2 or less, and most preferably at least about 10 or more or about 0.1 or less; a specificity of greater than 0.5, preferably at least about 0.6, more preferably at least about 0.7, still more preferably at least about 0.8, even more preferably at least about 0.9 and most preferably at least about 0.95, with a corresponding sensitivity greater than 0.2, preferably greater than about 0.3, more preferably greater than about 0.4, still more preferably at least about 0.5, even more preferably about 0.6, yet more preferably greater than about 0.7, still more preferably greater than about 0.8, more preferably greater than about 0.9, and most preferably greater than about 0.95;
- Multiple thresholds may also be used to assess renal status in a subject. For example, a "first" subpopulation which is predisposed to one or more future changes in renal status, the occurrence of an injury, a classification, etc., and a "second" subpopulation which is not so predisposed can be combined into a single group. This group is then subdivided into three or more equal parts (known as tertiles, quartiles, quin tiles, etc., depending on the number of subdivisions). An odds ratio is assigned to subjects based on which subdivision they fall into. If one considers a tertile, the lowest or highest tertile can be used as a reference for comparison of the other subdivisions. This reference subdivision is assigned an odds ratio of 1.
- the second tertile is assigned an odds ratio that is relative to that first tertile. That is, someone in the second tertile might be 3 times more likely to suffer one or more future changes in renal status in comparison to someone in the first tertile.
- the third tertile is also assigned an odds ratio that is relative to that first tertile.
- the assay method is an immunoassay.
- Antibodies for use in such assays will specifically bind a full length kidney injury marker of interest, and may also bind one or more polypeptides that are "related" thereto, as that term is defined hereinafter. Numerous immunoassay formats are known to those of skill in the art.
- Preferred body fluid samples are selected from the group consisting of urine, blood, serum, saliva, tears, and plasma.
- kidney injury marker assay result(s) is/are used in isolation in the methods described herein. Rather, additional variables or other clinical indicia may be included in the methods described herein. For example, a risk stratification, diagnostic, classification, monitoring, etc.
- method may combine the assay result(s) with one or more variables measured for the subject selected from the group consisting of demographic information (e.g., weight, sex, age, race), medical history (e.g., family history, type of surgery, pre-existing disease such as aneurism, congestive heart failure, preeclampsia, eclampsia, diabetes mellitus, hypertension, coronary artery disease, proteinuria, renal insufficiency, or sepsis, type of toxin exposure such as NSAIDs,
- demographic information e.g., weight, sex, age, race
- medical history e.g., family history, type of surgery, pre-existing disease such as aneurism, congestive heart failure, preeclampsia, eclampsia, diabetes mellitus, hypertension, coronary artery disease, proteinuria, renal insufficiency, or sepsis
- type of toxin exposure such as NSAIDs
- cyclosporines tacrolimus, aminoglycosides, foscarnet, ethylene glycol, hemoglobin, myoglobin, ifosfamide, heavy metals, methotrexate, radiopaque contrast agents, or
- streptozotocin e.g., blood pressure, temperature, respiration rate
- risk scores APACHE score, PREDICT score, TIMI Risk Score for UA/NSTEMI, Framingham Risk Score
- a glomerular filtration rate an estimated glomerular filtration rate, a urine production rate, a serum or plasma creatinine concentration, a urine creatinine concentration, a fractional excretion of sodium, a urine sodium concentration, a urine creatinine to serum or plasma creatinine ratio, a urine specific gravity, a urine osmolality, a urine urea nitrogen to plasma urea nitrogen ratio, a plasma BUN to creatnine ratio, a renal failure index calculated as urine sodium / (urine creatinine / plasma creatinine), a serum or plasma neutrophil gelatinase (NGAL) concentration, a urine NGAL concentration, a serum or plasma cystatin C
- NGAL serum or plasma neutrophil gelatinase
- kidney injury marker assay result(s) measures of renal function which may be combined with one or more kidney injury marker assay result(s) are described hereinafter and in Harrison's Principles of Internal Medicine, 17 th Ed., McGraw Hill, New York, pages 1741-1830, and Current Medical Diagnosis & Treatment 2008, 47 th Ed, McGraw Hill, New York, pages 785-815, each of which are hereby incorporated by reference in their entirety.
- the individual markers may be measured in samples obtained at the same time, or may be determined from samples obtained at different (e.g., an earlier or later) times.
- the individual markers may also be measured on the same or different body fluid samples. For example, one kidney injury marker may be measured in a serum or plasma sample and another kidney injury marker may be measured in a urine sample.
- assignment of a likelihood may combine an individual kidney injury marker assay result with temporal changes in one or more additional variables.
- kits for performing the methods described herein comprise reagents sufficient for performing an assay for at least one of the described kidney injury markers, together with instructions for performing the described threshold comparisons.
- reagents for performing such assays are provided in an assay device, and such assay devices may be included in such a kit.
- Preferred reagents can comprise one or more solid phase antibodies, the solid phase antibody comprising antibody that detects the intended biomarker target(s) bound to a solid support.
- such reagents can also include one or more detectably labeled antibodies, the detectably labeled antibody comprising antibody that detects the intended biomarker target(s) bound to a detectable label. Additional optional elements that may be provided as part of an assay device are described hereinafter.
- Detectable labels may include molecules that are themselves detectable (e.g., fluorescent moieties, electrochemical labels, eel (electrochemical luminescence) labels, metal chelates, colloidal metal particles, etc.) as well as molecules that may be indirectly detected by production of a detectable reaction product (e.g., enzymes such as horseradish peroxidase, alkaline phosphatase, etc.) or through the use of a specific binding molecule which itself may be detectable (e.g., a labeled antibody that binds to the second antibody, biotin, digoxigenin, maltose, oligohistidine, 2,4-dintrobenzene, phenylarsenate, ssDNA, dsDNA, etc.).
- a detectable reaction product e.g., enzymes such as horseradish peroxidase, alkaline phosphatase, etc.
- a specific binding molecule which itself may be detectable (e.g.,
- Generation of a signal from the signal development element can be performed using various optical, acoustical, and electrochemical methods well known in the art.
- detection modes include fluorescence, radiochemical detection, reflectance, absorbance, amperometry, conductance, impedance, interferometry, ellipsometry, etc.
- the solid phase antibody is coupled to a transducer (e.g., a diffraction grating, electrochemical sensor, etc) for generation of a signal, while in others, a signal is generated by a transducer that is spatially separate from the solid phase antibody (e.g., a fluorometer that employs an excitation light source and an optical detector).
- a transducer e.g., a diffraction grating, electrochemical sensor, etc
- a signal is generated by a transducer that is spatially separate from the solid phase antibody (e.g., a fluorometer that employs an excitation light source and an optical detector).
- the present invention relates to methods and compositions for diagnosis, differential diagnosis, risk stratification, monitoring, classifying and determination of treatment regimens in subjects suffering or at risk of suffering from injury to renal function, reduced renal function and/or acute renal failure through measurement of one or more kidney injury markers.
- a measured concentration of one or more markers selected from the group consisting of Metalloproteinase inhibitor 1, Metalloproteinase inhibitor 2,
- Metalloproteinase inhibitor 4 C-C motif chemokine 15, C-C motif chemokine 18, C-C motif chemokine 23, and/or, C-C motif chemokine 24 or one or more markers related thereto, and optionally one or more additional kidney injury markers known in the art, are correlated to the renal status of the subject.
- an "injury to renal function” is an abrupt (within 14 days, preferably within 7 days, more preferably within 72 hours, and still more preferably within 48 hours) measurable reduction in a measure of renal function. Such an injury may be identified, for example, by a decrease in glomerular filtration rate or estimated GFR, a reduction in urine output, an increase in serum creatinine, an increase in serum cy statin C, a requirement for renal replacement therapy, etc.
- "Improvement in Renal Function” is an abrupt (within 14 days, preferably within 7 days, more preferably within 72 hours, and still more preferably within 48 hours) measurable increase in a measure of renal function. Preferred methods for measuring and/or estimating GFR are described hereinafter.
- reduced renal function is an abrupt (within 14 days, preferably within 7 days, more preferably within 72 hours, and still more preferably within 48 hours) reduction in kidney function identified by an absolute increase in serum creatinine of greater than or equal to 0.1 mg/dL (> 8.8 ⁇ /L), a percentage increase in serum creatinine of greater than or equal to 20% (1.2-fold from baseline), or a reduction in urine output (documented oliguria of less than 0. 5 ml/kg per hour).
- Acute renal failure is an abrupt (within 14 days, preferably within 7 days, more preferably within 72 hours, and still more preferably within 48 hours) reduction in kidney function identified by an absolute increase in serum creatinine of greater than or equal to 0.3 mg/dl (> 26.4 ⁇ / ⁇ ), a percentage increase in serum creatinine of greater than or equal to 50% (1. 5-fold from baseline), or a reduction in urine output (documented oliguria of less than 0.5 ml/kg per hour for at least 6 hours).
- This term is synonymous with "acute kidney injury” or "AKI.”
- the signals obtained from an immunoassay are a direct result of complexes formed between one or more antibodies and the target biomolecule (i.e., the analyte) and polypeptides containing the necessary epitope(s) to which the antibodies bind. While such assays may detect the full length biomarker and the assay result be expressed as a concentration of a biomarker of interest, the signal from the assay is actually a result of all such "immunoreactive" polypeptides present in the sample.
- Biomarkers may also be determined by means other than immunoassays, including protein measurements (such as dot blots, western blots, chromatographic methods, mass spectrometry, etc.) and nucleic acid measurements (mRNA quatitation). This list is not meant to be limiting.
- Metalloproteinase inhibitor 1 refers to one or more polypeptides present in a biological sample that are derived from the Metalloproteinase inhibitor 1 precursor (Swiss-Prot P01033 (SEQ ID NO: 1)).
- Metalloproteinase inhibitor 2 refers to one or more polypeptides present in a biological sample that are derived from the Metalloproteinase inhibitor 2 precursor (human precursor: Swiss-Prot P16035 (SEQ ID NO: 2)).
- Metalloproteinase inhibitor 4" refers to one or polypeptides present in a biological sample that are derived from the Metalloproteinase inhibitor 4 precursor (human precursor: Swiss-Prot Q99727 (SEQ ID NO: 3)).
- C-C motif chemokine 15 refers to one or more polypeptides present in a biological sample that are derived from the C-C motif chemokine 15 precursor (human precursor: Swiss-Prot Q16663 (SEQ ID NO: 4)).
- C-C motif chemokine 18 refers to one or more polypeptides present in a biological sample that are derived from the C-C motif chemokine 18 precursor (human precursor: Swiss-Prot P55774 (SEQ ID NO: 5)).
- C-C motif chemokine 23 refers to one or more polypeptides present in a biological sample that are derived from the C-C motif chemokine 23 precursor (Swiss-Prot P55773 (SEQ ID NO: 6))
- C-C motif chemokine 24 refers to one or more polypeptides present in a biological sample that are derived from the C-C motif chemokine 24 precursor (Swiss-Prot 000175 (SEQ ID NO: 7))
- the term "relating a signal to the presence or amount" of an analyte reflects this understanding. Assay signals are typically related to the presence or amount of an analyte through the use of a standard curve calculated using known concentrations of the analyte of interest. As the term is used herein, an assay is "configured to detect" an analyte if an assay can generate a detectable signal indicative of the presence or amount of a physiologically relevant concentration of the analyte.
- an immunoassay configured to detect a marker of interest will also detect polypeptides related to the marker sequence, so long as those polypeptides contain the epitope(s) necessary to bind to the antibody or antibodies used in the assay.
- the term "related marker” as used herein with regard to a biomarker such as one of the kidney injury markers described herein refers to one or more fragments, variants, etc., of a particular marker or its biosynthetic parent that may be detected as a surrogate for the marker itself or as independent biomarkers.
- the term also refers to one or more polypeptides present in a biological sample that are derived from the biomarker precursor complexed to additional species, such as binding proteins, receptors, heparin, lipids, sugars, etc.
- positive going marker refers to a marker that is determined to be elevated in subjects suffering from a disease or condition, relative to subjects not suffering from that disease or condition.
- negative going marker refers to a marker that is determined to be reduced in subjects suffering from a disease or condition, relative to subjects not suffering from that disease or condition.
- subject refers to a human or non-human organism.
- methods and compositions described herein are applicable to both human and veterinary disease.
- a subject is preferably a living organism, the invention described herein may be used in post-mortem analysis as well.
- Preferred subjects are humans, and most preferably "patients,” which as used herein refers to living humans that are receiving medical care for a disease or condition. This includes persons with no defined illness who are being investigated for signs of pathology.
- an analyte is measured in a sample.
- a sample may be obtained from a subject, or may be obtained from biological materials intended to be provided to the subject.
- a sample may be obtained from a kidney being evaluated for possible
- Preferred samples are body fluid samples.
- body fluid sample refers to a sample of bodily fluid obtained for the purpose of diagnosis, prognosis, classification or evaluation of a subject of interest, such as a patient or transplant donor. In certain embodiments, such a sample may be obtained for the purpose of determining the outcome of an ongoing condition or the effect of a treatment regimen on a condition.
- Preferred body fluid samples include blood, serum, plasma, cerebrospinal fluid, urine, saliva, sputum, and pleural effusions.
- body fluid samples would be more readily analyzed following a fractionation or purification procedure, for example, separation of whole blood into serum or plasma components.
- diagnosis refers to methods by which the skilled artisan can estimate and/or determine the probability ("a likelihood") of whether or not a patient is suffering from a given disease or condition.
- diagnosis includes using the results of an assay, most preferably an immunoassay, for a kidney injury marker of the present invention, optionally together with other clinical characteristics, to arrive at a diagnosis (that is, the occurrence or nonoccurrence) of an acute renal injury or ARF for the subject from which a sample was obtained and assayed. That such a diagnosis is "determined” is not meant to imply that the diagnosis is 100% accurate. Many biomarkers are indicative of multiple conditions.
- a measured biomarker level on one side of a predetermined diagnostic threshold indicates a greater likelihood of the occurrence of disease in the subject relative to a measured level on the other side of the predetermined diagnostic threshold.
- a prognostic risk signals a probability ("a likelihood") that a given course or outcome will occur.
- a level or a change in level of a prognostic indicator which in turn is associated with an increased probability of morbidity (e.g., worsening renal function, future ARF, or death) is referred to as being "indicative of an increased likelihood" of an adverse outcome in a patient.
- immunoassays involve contacting a sample containing or suspected of containing a biomarker of interest with at least one antibody that specifically binds to the biomarker. A signal is then generated indicative of the presence or amount of complexes formed by the binding of polypeptides in the sample to the antibody. The signal is then related to the presence or amount of the biomarker in the sample.
- Numerous methods and devices are well known to the skilled artisan for the detection and analysis of biomarkers. See, e.g., U.S. Patents 6,143,576; 6,113,855; 6,019,944; 5,985,579; 5,947,124; 5,939,272; 5,922,615;
- the assay devices and methods known in the art can utilize labeled molecules in various sandwich, competitive, or non-competitive assay formats, to generate a signal that is related to the presence or amount of the biomarker of interest.
- Suitable assay formats also include chromatographic, mass spectrographic, and protein "blotting" methods.
- certain methods and devices such as biosensors and optical immunoassays, may be employed to determine the presence or amount of analytes without the need for a labeled molecule. See, e.g., U.S. Patents 5,631,171 ; and 5,955,377, each of which is hereby incorporated by reference in its entirety, including all tables, figures and claims.
- robotic instrumentation including but not limited to Beckman ACCESS®, Abbott AXSYM®, Roche ELECSYS®, Dade Behring STRATUS® systems are among the immunoassay analyzers that are capable of performing immunoassays.
- any suitable immunoassay may be utilized, for example, enzyme-linked immunoassays (ELISA), radioimmunoassays (RIAs), competitive binding assays, and the like.
- Antibodies or other polypeptides may be immobilized onto a variety of solid supports for use in assays.
- Solid phases that may be used to immobilize specific binding members include include those developed and/or used as solid phases in solid phase binding assays. Examples of suitable solid phases include membrane filters, cellulose-based papers, beads (including polymeric, latex and paramagnetic particles), glass, silicon wafers, microparticles, nanoparticles, TentaGels, AgroGels, PEGA gels, SPOCC gels, and multiple- well plates.
- An assay strip could be prepared by coating the antibody or a plurality of antibodies in an array on solid support.
- Antibodies or other polypeptides may be bound to specific zones of assay devices either by conjugating directly to an assay device surface, or by indirect binding. In an example of the later case, antibodies or other polypeptides may be immobilized on particles or other solid supports, and that solid support immobilized to the device surface.
- Biological assays require methods for detection, and one of the most common methods for quantitation of results is to conjugate a detectable label to a protein or nucleic acid that has affinity for one of the components in the biological system being studied.
- Detectable labels may include molecules that are themselves detectable (e.g., fluorescent moieties, electrochemical labels, metal chelates, etc.) as well as molecules that may be indirectly detected by production of a detectable reaction product (e.g., enzymes such as horseradish peroxidase, alkaline phosphatase, etc.) or by a specific binding molecule which itself may be detectable (e.g., biotin, digoxigenin, maltose, oligohistidine, 2,4-dintrobenzene, phenylarsenate, ssDNA, dsDNA, etc.).
- a detectable reaction product e.g., enzymes such as horseradish peroxidase, alkaline phosphatase, etc.
- Cross-linking reagents contain at least two reactive groups, and are divided generally into homofunctional cross-linkers (containing identical reactive groups) and heterofunctional cross-linkers (containing non-identical reactive groups). Homobifunctional cross-linkers that couple through amines, sulfhydryls or react non- specifically are available from many commercial sources. Maleimides, alkyl and aryl halides, alpha-haloacyls and pyridyl disulfides are thiol reactive groups.
- kits for the analysis of the described kidney injury markers comprises reagents for the analysis of at least one test sample which comprise at least one antibody that a kidney injury marker.
- the kit can also include devices and instructions for performing one or more of the diagnostic and/or prognostic correlations described herein.
- Preferred kits will comprise an antibody pair for performing a sandwich assay, or a labeled species for performing a competitive assay, for the analyte.
- an antibody pair comprises a first antibody conjugated to a solid phase and a second antibody conjugated to a detectable label, wherein each of the first and second antibodies that bind a kidney injury marker.
- each of the antibodies are monoclonal antibodies.
- the instructions for use of the kit and performing the correlations can be in the form of labeling, which refers to any written or recorded material that is attached to, or otherwise accompanies a kit at any time during its manufacture, transport, sale or use.
- labeling encompasses advertising leaflets and brochures, packaging materials, instructions, audio or video cassettes, computer discs, as well as writing imprinted directly on kits.
- antibody refers to a peptide or polypeptide derived from, modeled after or substantially encoded by an immunoglobulin gene or immunoglobulin genes, or fragments thereof, capable of specifically binding an antigen or epitope. See, e.g.
- antibody includes antigen-binding portions, i.e., "antigen binding sites,” (e.g., fragments, subsequences, complementarity determining regions (CDRs)) that retain capacity to bind antigen, including (i) a Fab fragment, a monovalent fragment consisting of the VL, VH, CL and CHI domains; (ii) a F(ab')2 fragment, a bivalent fragment comprising two Fab fragments linked by a disulfide bridge at the hinge region; (iii) a Fd fragment consisting of the VH and CHI domains; (iv) a Fv fragment consisting of the VL and VH domains of a single arm of an antibody, (v) a dAb fragment (Ward et al., (1989) Nature 341 :544-546), which consists of a VH domain; and (vi) an isolated complementarity determining region (CDR).
- Antigen binding sites e.g., fragments, sub
- Antibodies used in the immunoassays described herein preferably specifically bind to a kidney injury marker of the present invention.
- the term "specifically binds" is not intended to indicate that an antibody binds exclusively to its intended target since, as noted above, an antibody binds to any polypeptide displaying the epitope(s) to which the antibody binds.
- an antibody "specifically binds" if its affinity for its intended target is about 5-fold greater when compared to its affinity for a non-target molecule which does not display the appropriate epitope(s).
- the affinity of the antibody will be at least about 5 fold, preferably 10 fold, more preferably 25-fold, even more preferably 50-fold, and most preferably 100-fold or more, greater for a target molecule than its affinity for a non-target molecule.
- Preferred antibodies bind with affinities of at least about 10 7 M "1 , and preferably between about 10 8 M "1 to about 10 9 NT 1 , about 10 9 M "1 to about 10 10 NT 1 , or about 10 10 M 1 to about 10 12 M 1 .
- r/c is plotted on the Y-axis versus r on the X-axis, thus producing a Scatchard plot.
- Antibody affinity measurement by Scatchard analysis is well known in the art. See, e.g., van Erp et al., J. Immunoassay 12: 425-43, 1991 ; Nelson and Griswold, Comput. Methods Programs Biomed. 27: 65-8, 1988.
- epitope refers to an antigenic determinant capable of specific binding to an antibody.
- Epitopes usually consist of chemically active surface groupings of molecules such as amino acids or sugar side chains and usually have specific three dimensional structural characteristics, as well as specific charge characteristics. Conformational and
- nonconformational epitopes are distinguished in that the binding to the former but not the latter is lost in the presence of denaturing solvents.
- phage display technology to produce and screen libraries of polypeptides for binding to a selected analyte. See, e.g, Cwirla et al., Proc. Natl. Acad. Sci. USA 87, 6378-82, 1990; Devlin et al, Science 249, 404-6, 1990, Scott and Smith, Science 249, 386-88, 1990; and Ladner et al, U.S. Pat. No. 5,571,698.
- a basic concept of phage display methods is the establishment of a physical association between DNA encoding a polypeptide to be screened and the polypeptide.
- This physical association is provided by the phage particle, which displays a polypeptide as part of a capsid enclosing the phage genome which encodes the polypeptide.
- the establishment of a physical association between polypeptides and their genetic material allows simultaneous mass screening of very large numbers of phage bearing different polypeptides.
- Phage displaying a polypeptide with affinity to a target bind to the target and these phage are enriched by affinity screening to the target.
- the identity of polypeptides displayed from these phage can be determined from their respective genomes.
- a polypeptide identified as having a binding affinity for a desired target can then be synthesized in bulk by conventional means. See, e.g., U.S. Patent No. 6,057,098, which is hereby incorporated in its entirety, including all tables, figures, and claims.
- the antibodies that are generated by these methods may then be selected by first screening for affinity and specificity with the purified polypeptide of interest and, if required, comparing the results to the affinity and specificity of the antibodies with polypeptides that are desired to be excluded from binding.
- the screening procedure can involve immobilization of the purified polypeptides in separate wells of microtiter plates. The solution containing a potential antibody or groups of antibodies is then placed into the respective microtiter wells and incubated for about 30 min to 2 h.
- microtiter wells are then washed and a labeled secondary antibody (for example, an anti-mouse antibody conjugated to alkaline phosphatase if the raised antibodies are mouse antibodies) is added to the wells and incubated for about 30 min and then washed. Substrate is added to the wells and a color reaction will appear where antibody to the immobilized polypeptide(s) are present.
- a labeled secondary antibody for example, an anti-mouse antibody conjugated to alkaline phosphatase if the raised antibodies are mouse antibodies
- the antibodies so identified may then be further analyzed for affinity and specificity in the assay design selected.
- the purified target protein acts as a standard with which to judge the sensitivity and specificity of the immunoassay using the antibodies that have been selected. Because the binding affinity of various antibodies may differ; certain antibody pairs (e.g., in sandwich assays) may interfere with one another sterically, etc., assay performance of an antibody may be a more important measure than absolute affinity and specificity of an antibody.
- correlating refers to comparing the presence or amount of the biomarker(s) in a patient to its presence or amount in persons known to suffer from, or known to be at risk of, a given condition; or in persons known to be free of a given condition. Often, this takes the form of comparing an assay result in the form of a biomarker concentration to a predetermined threshold selected to be indicative of the occurrence or nonoccurrence of a disease or the likelihood of some future outcome.
- Selecting a diagnostic threshold involves, among other things, consideration of the probability of disease, distribution of true and false diagnoses at different test thresholds, and estimates of the consequences of treatment (or a failure to treat) based on the diagnosis. For example, when considering administering a specific therapy which is highly efficacious and has a low level of risk, few tests are needed because clinicians can accept substantial diagnostic uncertainty. On the other hand, in situations where treatment options are less effective and more risky, clinicians often need a higher degree of diagnostic certainty. Thus, cost/benefit analysis is involved in selecting a diagnostic threshold.
- Suitable thresholds may be determined in a variety of ways. For example, one recommended diagnostic threshold for the diagnosis of acute myocardial infarction using cardiac troponin is the 97.5 th percentile of the concentration seen in a normal population.
- Another method may be to look at serial samples from the same patient, where a prior
- baseline result is used to monitor for temporal changes in a biomarker level.
- ROC Operating Characteristic
- TPR true positive rate
- FPR false positive rate
- diseased is meant to refer to a population having one characteristic (the presence of a disease or condition or the occurrence of some outcome) and “nondiseased” is meant to refer to a population lacking the characteristic. While a single decision threshold is the simplest application of such a method, multiple decision thresholds may be used. For example, below a first threshold, the absence of disease may be assigned with relatively high confidence, and above a second threshold the presence of disease may also be assigned with relatively high confidence. Between the two thresholds may be considered indeterminate. This is meant to be exemplary in nature only.
- Measures of test accuracy may be obtained as described in Fischer et ah, Intensive Care Med. 29: 1043-51, 2003, and used to determine the effectiveness of a given biomarker. These measures include sensitivity and specificity, predictive values, likelihood ratios, diagnostic odds ratios, and ROC curve areas.
- the area under the curve ("AUC") of a ROC plot is equal to the probability that a classifier will rank a randomly chosen positive instance higher than a randomly chosen negative one.
- the area under the ROC curve may be thought of as equivalent to the Mann- Whitney U test, which tests for the median difference between scores obtained in the two groups considered if the groups are of continuous data, or to the Wilcoxon test of ranks.
- suitable tests may exhibit one or more of the following results on these various measures: a specificity of greater than 0.5, preferably at least 0.6, more preferably at least 0.7, still more preferably at least 0.8, even more preferably at least 0.9 and most preferably at least 0.95, with a corresponding sensitivity greater than 0.2, preferably greater than 0.3, more preferably greater than 0.4, still more preferably at least 0.5, even more preferably 0.6, yet more preferably greater than 0.7, still more preferably greater than 0.8, more preferably greater than 0.9, and most preferably greater than 0.95; a sensitivity of greater than 0.5, preferably at least 0.6, more preferably at least 0.7, still more preferably at least 0.8, even more preferably at least 0.9 and most preferably at least 0.95, with a corresponding specificity greater than 0.2, preferably greater than 0.3, more preferably greater than 0.4, still more preferably at least 0.5, even more preferably 0.6, yet more preferably greater than 0.7
- ROC curve area of greater than 0.5, preferably at least 0.6, more preferably 0.7, still more preferably at least 0.8, even more preferably at least 0.9, and most preferably at least 0.95; an odds ratio different from
- a positive likelihood ratio (calculated as sensitivity/(l- specificity)) of greater than 1, at least 2, more preferably at least 3, still more preferably at least 5, and most preferably at least 10; and or a negative likelihood ratio (calculated as (1- sensitivity)/specificity) of less than 1, less than or equal to 0.5, more preferably less than or equal to 0.3, and most preferably less than or equal to 0.1
- kidney injury marker assay result(s) of the present invention may be combined with other biomarkers related to renal status.
- Examples include the following, which recite the common biomarker name, followed by the Swiss-Prot entry number for that biomarker or its parent: Actin (P68133); Adenosine deaminase binding protein (DPP4, P27487); Alpha-l-acid glycoprotein 1 (P02763); Alpha-1- microglobulin (P02760); Albumin (P02768); Angiotensinogenase (Renin, P00797); Annexin A2 (P07355); Beta-glucuronidase (P08236); B-2-microglobulin (P61769); Beta-galactosidase (P16278); BMP-7 (P18075); Brain natriuretic peptide (proBNP, BNP-32, NTproBNP; P16860); Calcium-binding protein Beta (S lOO-beta, P04271); Carbonic anhydrase 9 (Q16790); Casein Kinase 2 (P68400); Cluster
- Endothelin-1 (P05305); Exosomal Fetuin-A (P02765); Fatty acid-binding protein, heart (FABP3, P05413); Fatty acid-binding protein, liver (P07148); Ferritin (light chain, P02792; heavy chain P02794); Fructose- 1,6-biphosphatase (P09467); GRO-alpha (CXCL1, (P09341); Growth Hormone (P01241); Hepatocyte growth factor (PI 4210); Insulin-like growth factor I (P05019); Immunoglobulin G; Immunoglobulin Light Chains (Kappa and Lambda); Interferon gamma (P01579); Lysozyme (P61626); Interleukin-1 alpha (P01583); Interleukin-2 (P60568); Interleukin-4 (P05112); Interleukin-9 (P15248); Interleukin-12p40 (P29460); Inter
- Adiponectin (Q15848); Alkaline phosphatase (P05186); Aminopeptidase N (P15144); CalbindinD28k (P05937); Cystatin C (P01034); 8 subunit of FIFO ATPase (P03928); Gamma-glutamyltransferase (P19440); GSTa (alpha- glutathione-S-transferase, P08263); GSTpi (Glutathione-S -transferase P; GST class-pi;
- IGFBP-1 P08833
- IGFBP-2 P18065
- IGFBP-6 P24592
- Integral membrane protein 1 Itml, P46977
- Interleukin-6 P05231
- Interleukin-8 P10145
- Interleukin-18 Q14116
- IP-10 10 kDa interferon-gamma-induced protein, P02778
- IRPR IRPR
- Isovaleryl-CoA dehydrogenase IVD, P26440
- I-TAC/CXCL11 (014625); Keratin 19 (P08727); Kim-1 (Hepatitis A virus cellular receptor 1, Q96D42); L-arginine:glycine amidinotransferase (P50440); Leptin (P41159); Lipocalin2 (NGAL, P80188); MCP-1
- Other clinical indicia which may be combined with the kidney injury marker assay result(s) of the present invention includes demographic information (e.g., weight, sex, age, race), medical history (e.g., family history, type of surgery, pre-existing disease such as aneurism, congestive heart failure, preeclampsia, eclampsia, diabetes mellitus, hypertension, coronary artery disease, proteinuria, renal insufficiency, or sepsis, type of toxin exposure such as NSAIDs, cyclosporines, tacrolimus, aminoglycosides, foscarnet, ethylene glycol, hemoglobin, myoglobin, ifosfamide, heavy metals, methotrexate, radiopaque contrast agents, or streptozotocin), clinical variables (e.g., blood pressure, temperature, respiration rate), risk scores (APACHE score, PREDICT score, TIMI Risk Score for UA/NSTEMI, Fram
- kidney injury marker assay result(s) Other measures of renal function which may be combined with the kidney injury marker assay result(s) are described hereinafter and in Harrison' s Principles of Internal Medicine, 17 th Ed., McGraw Hill, New York, pages 1741-1830, and Current Medical Diagnosis & Treatment 2008, 47 th Ed, McGraw Hill, New York, pages 785-815, each of which are hereby incorporated by reference in their entirety.
- Combining assay results/clinical indicia in this manner can comprise the use of multivariate logistical regression, loglinear modeling, neural network analysis, n-of-m analysis, decision tree analysis, etc. This list is not meant to be limiting.
- the terms "acute renal (or kidney) injury” and “acute renal (or kidney) failure” as used herein are defined in part in terms of changes in serum creatinine from a baseline value.
- Most definitions of ARF have common elements, including the use of serum creatinine and, often, urine output. Patients may present with renal dysfunction without an available baseline measure of renal function for use in this comparison. In such an event, one may estimate a baseline serum creatinine value by assuming the patient initially had a normal GFR.
- Glomerular filtration rate (GFR) is the volume of fluid filtered from the renal (kidney) glomerular capillaries into the Bowman's capsule per unit time. Glomerular filtration rate (GFR) can be calculated by measuring any chemical that has a steady level in the blood, and is freely filtered but neither reabsorbed nor secreted by the kidneys. GFR is typically expressed in units of ml/min:
- GFR glomerular filtration rate
- eGFR glomerular filtration rate
- Creatinine clearance is used to measure GFR. Creatinine is produced naturally by the body (creatinine is a metabolite of creatine, which is found in muscle). It is freely filtered by the glomerulus, but also actively secreted by the renal tubules in very small amounts such that creatinine clearance overestimates actual GFR by 10-20%. This margin of error is acceptable considering the ease with which creatinine clearance is measured.
- Creatinine clearance can be calculated if values for creatinine's urine concentration (U&), urine flow rate (V), and creatinine's plasma concentration (P&) are known. Since the product of urine concentration and urine flow rate yields creatinine's excretion rate, creatinine clearance is also said to be its excretion rate (U&xV) divided by its plasma concentration. This is commonly represented mathematically as:
- the CCr is often corrected for the body surface area (BSA) and expressed compared to the average sized man as ml/min/1.73 m2. While most adults have a BSA that approaches 1.7 (1.6-1.9), extremely obese or slim patients should have their CCr corrected for their actual BSA:
- the clinician can readily select a treatment regimen that is compatible with the diagnosis, such as initiating renal replacement therapy, withdrawing delivery of compounds that are known to be damaging to the kidney, kidney transplantation, delaying or avoiding procedures that are known to be damaging to the kidney, modifying diuretic administration, initiating goal directed therapy, etc.
- a treatment regimen that is compatible with the diagnosis, such as initiating renal replacement therapy, withdrawing delivery of compounds that are known to be damaging to the kidney, kidney transplantation, delaying or avoiding procedures that are known to be damaging to the kidney, modifying diuretic administration, initiating goal directed therapy, etc.
- the skilled artisan is aware of appropriate treatments for numerous diseases discussed in relation to the methods of diagnosis described herein. See, e.g., Merck Manual of Diagnosis and Therapy, 17th Ed. Merck Research Laboratories, Whitehouse Station, NJ, 1999.
- the markers of the present invention may be used to monitor a course of treatment. For example, improved or worsened prognostic state may indicate that a particular treatment is or is not eff
- Example 1 Contrast-induced nephropathy sample collection
- the objective of this sample collection study is to collect samples of plasma and urine and clinical data from patients before and after receiving intravascular contrast media. Approximately 250 adults undergoing radiographic/angiographic procedures involving intravascular administration of iodinated contrast media are enrolled. To be enrolled in the study, each patient must meet all of the following inclusion criteria and none of the following exclusion criteria:
- Exclusion Criteria renal transplant recipients acutely worsening renal function prior to the contrast procedure; already receiving dialysis (either acute or chronic) or in imminent need of dialysis at enrollment; expected to undergo a major surgical procedure (such as involving cardiopulmonary bypass) or an additional imaging procedure with contrast media with significant risk for further renal insult within the 48 hrs following contrast administration; participation in an interventional clinical study with an experimental therapy within the previous 30 days; known infection with human immunodeficiency virus (HIV) or a hepatitis virus.
- HAV human immunodeficiency virus
- an EDTA anti-coagulated blood sample (10 mL) and a urine sample (10 mL) are collected from each patient. Blood and urine samples are then collected at 4 ( ⁇ 0.5), 8 ( ⁇ 1), 24 ( ⁇ 2) 48 ( ⁇ 2), and 72 ( ⁇ 2) hrs following the last administration of contrast media during the index contrast procedure. Blood is collected via direct venipuncture or via other available venous access, such as an existing femoral sheath, central venous line, peripheral intravenous line or hep-lock. These study blood samples are processed to plasma at the clinical site, frozen and shipped to Astute Medical, Inc., San Diego, CA. The study urine samples are frozen and shipped to Astute Medical, Inc.
- Serum creatinine is assessed at the site immediately prior to the first contrast administration (after any pre-procedure hydration) and at 4 ( ⁇ 0.5), 8 ( ⁇ 1), 24 ( ⁇ 2) and 48 ( ⁇ 2) ), and 72 ( ⁇ 2) hours following the last administration of contrast (ideally at the same time as the study samples are obtained).
- each patient's status is evaluated through day 30 with regard to additional serum and urine creatinine measurements, a need for dialysis,
- Example 2 Cardiac surgery sample collection
- the objective of this sample collection study is to collect samples of plasma and urine and clinical data from patients before and after undergoing cardiovascular surgery, a procedure known to be potentially damaging to kidney function. Approximately 900 adults undergoing such surgery are enrolled. To be enrolled in the study, each patient must meet all of the following inclusion criteria and none of the following exclusion criteria:
- HAV human immunodeficiency virus
- an EDTA anti-coagulated blood sample (10 mL), whole blood (3 mL), and a urine sample (35 mL) are collected from each patient. Blood and urine samples are then collected at 3 ( ⁇ 0.5), 6 ( ⁇ 0.5), 12 ( ⁇ 1), 24 ( ⁇ 2) and 48 ( ⁇ 2) hrs following the procedure and then daily on days 3 through 7 if the subject remains in the hospital. Blood is collected via direct venipuncture or via other available venous access, such as an existing femoral sheath, central venous line, peripheral intravenous line or hep-lock. These study blood samples are frozen and shipped to Astute Medical, Inc., San Diego, CA. The study urine samples are frozen and shipped to Astute Medical, Inc. [00123] Example 3: Acutely ill subject sample collection
- the objective of this study is to collect samples from acutely ill patients.
- Study population 1 approximately 300 patients that have at least one of: shock (SBP ⁇ 90 mmHg and/or need for vasopressor support to maintain MAP > 60 mmHg and/or documented drop in SBP of at least 40 mmHg); and sepsis;
- shock SBP ⁇ 90 mmHg and/or need for vasopressor support to maintain MAP > 60 mmHg and/or documented drop in SBP of at least 40 mmHg
- sepsis sepsis
- Study population 2 approximately 300 patients that have at least one of:
- IV antibiotics ordered in computerized physician order entry within 24 hours of enrollment; contrast media exposure within 24 hours of enrollment; increased Intra- Abdominal Pressure with acute decompensated heart failure; and severe trauma as the primary reason for ICU admission and likely to be hospitalized in the ICU for 48 hours after enrollment;
- Study population 3 approximately 300 patients expected to be hospitalized through acute care setting (ICU or ED) with a known risk factor for acute renal injury (e.g. sepsis,
- shock systolic BP ⁇ 90 mmHg and/or the need for vasopressor support to maintain a MAP > 60 mmHg and/or a documented drop in SBP > 40 mmHg), major trauma, hemorrhage, or major surgery); and/or expected to be hospitalized to the ICU for at least 24 hours after enrollment;
- Study population 4 approximately 1000 patients that are 21 years of age or older, within 24 hours of being admitted into the ICU, expected to have an indwelling urinary catheter for at least 48 hours after enrollment, and have at least one of the following acute conditions within 24 hours prior to enrollment: (i) respiratory SOFA score of > 2 (Pa02/Fi02 ⁇ 300), (ii) cardiovascular SOFA score of > 1 (MAP ⁇ 70 mm Hg and/or any vasopressor required).
- Study population 5 approximately 300 patients that are 21 years of age or older, receiving care in the ICU, have an indwelling urinary catheter as standard care at the time of enrollment, have acute kidney injury (KDIGO stage 2 or stage 3) at the time of the first sample collection, and have their first sample collected within 36 hours of meeting KDIGO stage 2 criteria
- an EDTA anti-coagulated blood sample (10 mL) and a urine sample (25-50 mL) are collected from each patient. Blood and urine samples are then collected at 4 (+ 0.5) and 8 (+ 1) hours after contrast administration (if applicable); at 12 ( ⁇ 1), 24 ( ⁇ 2), 36 ( ⁇ 2), 48 ( ⁇ 2), 60 ( ⁇ 2), 72 ( ⁇ 2), and 84 ( ⁇ 2) hours after enrollment, and thereafter daily up to day 7 to day 14 while the subject is hospitalized. Blood is collected via direct venipuncture or via other available venous access, such as an existing femoral sheath, central venous line, peripheral intravenous line or hep-lock. These study blood samples are processed to plasma at the clinical site, frozen and shipped to Astute Medical, Inc., San Diego, CA. The study urine samples are frozen and shipped to Astute Medical, Inc.
- Analytes are measured using standard sandwich enzyme immunoassay techniques.
- a first antibody which binds the analyte is immobilized in wells of a 96 well polystyrene microplate.
- Analyte standards and test samples are pipetted into the appropriate wells and any analyte present is bound by the immobilized antibody.
- a horseradish peroxidase-conjugated second antibody which binds the analyte is added to the wells, thereby forming sandwich complexes with the analyte (if present) and the first antibody.
- a substrate solution comprising tetramethylbenzidine and hydrogen peroxide is added to the wells. Color develops in proportion to the amount of analyte present in the sample. The color development is stopped and the intensity of the color is measured at 540 nm or 570 nm.
- concentration is assigned to the test sample by comparison to a standard curve determined from the analyte standards.
- Example 5 Apparently Healthy Donor and Chronic Disease Patient Samples
- the urine samples were shipped and stored frozen at less than -20 degrees centigrade.
- the vendor provided a case report form for each individual donor with age, gender, race (Black/White), smoking status and alcohol use, height, weight, chronic disease(s) diagnosis, current medications and previous surgeries.
- Example 6 Use of Metalloproteinase inhibitor 1 for evaluating renal status in patients admitted to the ICU: Recovery to RIFLE 0 from RIFLE I and F
- EDTA anti-coagulated blood samples (10 mL) and urine samples (50 mL) are collected from each patient at enrollment, and at every 12 hours up to day 3, and then every 24 hours thereafter up to day 7 while the subject is hospitalized.
- Metalloproteinase inhibitor 1 is measured in the enrollment samples by standard immunoassay methods using commercially available assay reagents.
- Kidney status is assessed by RIFLE criteria based on serum creatinine, urine output, or both serum creatinine and urine output.
- Two cohorts are defined to represent a "recovered” and a "non-recovered” population. "Recovered” indicates those patients whose maximum RIFLE stage during a period of 24, 48 or 72 hours is non-injury (RIFLE 0) where the recovery period can start from the time of sample collection to 24, 48, 72, 96 or 168 hours after sample collection.
- Non-recovered indicates those patients whose maximum RIFLE stage during a period of 24, 48 or 72 hours is risk of injury (R), injury (I) or failure (F) where the recovery period can start from the time of sample collection to 24, 48, 72, 96 or 168 hours after sample collection. If a patient dies or is placed on renal replacement therapy (RRT) at any time from sample collection to 24, 48, 72, 96 or 168 hours after sample collection, the patient is considered “non-recovered”.
- RRT renal replacement therapy
- Table 6.1 Comparison of marker levels and the area under the ROC curve (AUC) in urine samples for the "recovered” and “non-recovered” cohorts where recovery starts within 24 hours after sample collection and renal status is assessed by serum creatinine (sCr) only, urine output (UO) only, or serum creatinine or urine output RIFLE criteria.
- Cutoff Quartile 2 6030 6020 6080 6030 6020 6080 6030 6020 6080 6030 6020 6080 6030 6020 6080 6030 6020 6080 6030 6020 6080
- Cutoff Quartile 4 35900 35400 36300 35900 35400 36300 35900 35400 36300 35900 35400 36300 35900 35400 36300 35900 35400 36300 35900 35400 36300
- Table 6.2 Comparison of marker levels and the area under the ROC curve (AUC) in urine samples for the "recovered” and “non-recovered” cohorts where recovery starts within 48 hours after sample collection and renal status is assessed by serum creatinine (sCr) only, urine output (UO) only, or serum creatinine or urine output RIFLE criteria. sCr or UO
- Table 6.3 Comparison of marker levels and the area under the ROC curve (AUC) in urine samples for the "recovered” and “non-recovered” cohorts where recovery starts within 72 hours after sample collection and renal status is assessed by serum creatinine (sCr) only, urine output (UO) only, or serum creatinine or urine output RIFLE criteria. sCr or UO
- Table 6.4 Comparison of marker levels and the area under the ROC curve (AUC) in urine samples for the "recovered” and “non-recovered” cohorts where recovery starts within 96 hours after sample collection and renal status is assessed by serum creatinine (sCr) only, urine output (UO) only, or serum creatinine or urine output RIFLE criteria. sCr or UO Cohort recovered Cohort recovered Cohort recovered Cohort recovered
- Cutoff Quartile 4 35900 35900 36300 35900 35900 36300 35900 35900 36300 35900 35900 36300 35900 35900 36300 35900 35900 36300 35900 35900 36300
- Table 6.5 Comparison of marker levels and the area under the ROC curve (AUC) in urine samples for the "recovered” and “non-recovered” cohorts where recovery starts within 168 hours after sample collection and renal status is assessed by serum creatinine (sCr) only, urine output (UO) only, or serum creatinine or urine output RIFLE criteria.
- Table 6.6 Comparison of marker levels and the area under the ROC curve (AUC) in EDTA samples for the "recovered” and “non-recovered” cohorts where recovery starts within 24 hours after sample collection and renal status is assessed by serum creatinine (sCr) only, urine output (UO) only, or serum creatinine or urine output RIFLE criteria.
- Table 6.7 Comparison of marker levels and the area under the ROC curve (AUC) in EDTA samples for the "recovered” and “non-recovered” cohorts where recovery starts within 48 hours after sample collection and renal status is assessed by serum creatinine (sCr) only, urine output (UO) only, or serum creatinine or urine output RIFLE criteria.
- Table 6.8 Comparison of marker levels and the area under the ROC curve (AUC) in EDTA samples for the "recovered” and “non-recovered” cohorts where recovery starts within 72 hours after sample collection and renal status is assessed by serum creatinine (sCr) only, urine output (UO) only, or serum creatinine or urine output RIFLE criteria.
- Table 6.9 Comparison of marker levels and the area under the ROC curve (AUC) in EDTA samples for the "recovered” and “non-recovered” cohorts where recovery starts within 96 hours after sample collection and renal status is assessed by serum creatinine (sCr) only, urine output (UO) only, or serum creatinine or urine output RIFLE criteria.
- Table 6.10 Comparison of marker levels and the area under the ROC curve (AUC) in EDTA samples for the "recovered” and “non-recovered” cohorts where recovery starts within 168 hours after sample collection and renal status is assessed by serum creatinine (sCr) only, urine output (UO) only, or serum creatinine or urine output RIFLE criteria.
- Example 7 Use of Metalloproteinase inhibitor 1 for evaluating renal status in patients admitted to the ICU: Recovery to RIFLE 0 and R from RIFLE I and F
- EDTA anti-coagulated blood samples (10 mL) and urine samples (50 mL) are collected from each patient at enrollment, and at every 12 hours up to day 3, and then every 24 hours thereafter up to day 7 while the subject is hospitalized.
- Metalloproteinase inhibitor 1 is measured in the enrollment samples by standard immunoassay methods using commercially available assay reagents.
- Kidney status is assessed by RIFLE criteria based on serum creatinine, urine output, or both serum creatinine and urine output.
- Two cohorts are defined to represent a "recovered” and a “non-recovered” population. "Recovered” indicates those patients whose maximum RIFLE stage during a period of 24, 48 or 72 hours is non-injury (RIFLE 0) or risk of injury (R) where the recovery period can start from the time of sample collection to 24, 48, 72, 96 or 168 hours after sample collection.
- Non-recovered indicates those patients whose maximum RIFLE stage during a period of 24, 48 or 72 hours is injury (I) or failure (F) where the recovery period can start from the time of sample collection to 24, 48, 72, 96 or 168 hours after sample collection. If a patient dies or is placed on renal replacement therapy (RRT) at any time from sample collection to 24, 48, 72, 96 or 168 hours after sample collection, the patient is considered “non-recovered”.
- RRT renal replacement therapy
- Table 7.1 Comparison of marker levels and the area under the ROC curve (AUC) in urine samples for the "recovered” and “non-recovered” cohorts where recovery starts within 24 hours after sample collection and renal status is assessed by serum creatinine (sCr) only, urine output (UO) only, or serum creatinine or urine output RIFLE criteria.
- Table 7.2 Comparison of marker levels and the area under the ROC curve (AUC) in urine samples for the "recovered” and “non-recovered” cohorts where recovery starts within 48 hours after sample collection and renal status is assessed by serum creatinine (sCr) only, urine output (UO) only, or serum creatinine or urine output RIFLE criteria.
- Table 7.3 Comparison of marker levels and the area under the ROC curve (AUC) in urine samples for the "recovered” and “non-recovered” cohorts where recovery starts within 72 hours after sample collection and renal status is assessed by serum creatinine (sCr) only, urine output (UO) only, or serum creatinine or urine output RIFLE criteria. sCr or UO sCr only
- Cutoff Quartile 4 35900 35900 36300 35900 35900 36300 35900 35900 36300 35900 35900 36300 35900 35900 36300 35900 35900 36300 35900 35900 36300
- Table 7.4 Comparison of marker levels and the area under the ROC curve (AUC) in urine samples for the "recovered” and “non-recovered” cohorts where recovery starts within 96 hours after sample collection and renal status is assessed by serum creatinine (sCr) only, urine output (UO) only, or serum creatinine or urine output RIFLE criteria.
- Table 7.5 Comparison of marker levels and the area under the ROC curve (AUC) in urine samples for the "recovered” and “non-recovered” cohorts where recovery starts within 168 hours after sample collection and renal status is assessed by serum creatinine (sCr) only, urine output (UO) only, or serum creatinine or urine output RIFLE criteria.
- Cutoff Quartile 2 6030 6030 6080 6030 6030 6080 6030 6030 6080 6030 6030 6080 6030 6030 6080 6030 6030 6080
- Cutoff Quartile 4 35900 35900 36300 35900 35900 36300 35900 35900 36300 35900 35900 36300 35900 35900 36300 35900 35900 36300 35900 35900 36300
- Table 7.6 Comparison of marker levels and the area under the ROC curve (AUC) in EDTA samples for the "recovered” and “non-recovered” cohorts where recovery starts within 24 hours after sample collection and renal status is assessed by serum creatinine (sCr) only, urine output (UO) only, or serum creatinine or urine output RIFLE criteria.
- Table 7.7 Comparison of marker levels and the area under the ROC curve (AUC) in EDTA samples for the "recovered” and “non-recovered” cohorts where recovery starts within 48 hours after sample collection and renal status is assessed by serum creatinine (sCr) only, urine output (UO) only, or serum creatinine or urine output RIFLE criteria.
- Table 7.8 Comparison of marker levels and the area under the ROC curve (AUC) in EDTA samples for the "recovered” and “non-recovered” cohorts where recovery starts within 72 hours after sample collection and renal status is assessed by serum creatinine (sCr) only, urine output (UO) only, or serum creatinine or urine output RIFLE criteria.
- Table 7.9 Comparison of marker levels and the area under the ROC curve (AUC) in EDTA samples for the "recovered” and “non-recovered” cohorts where recovery starts within 96 hours after sample collection and renal status is assessed by serum creatinine (sCr) only, urine output (UO) only, or serum creatinine or urine output RIFLE criteria.
- Table 7.10 Comparison of marker levels and the area under the ROC curve (AUC) in EDTA samples for the "recovered” and “non-recovered” cohorts where recovery starts within 168 hours after sample collection and renal status is assessed by serum creatinine (sCr) only, urine output (UO) only, or serum creatinine or urine output RIFLE criteria.
- Example 8 Use of Metalloproteinase inhibitor 1 for evaluating renal status in patients admitted to the ICU: Persistent at RIFLE F
- Metalloproteinase inhibitor 1 is measured in the enrollment samples by standard immunoassay methods using commercially available assay reagents.
- Kidney status is assessed by RIFLE criteria based on serum creatinine, urine output, or both serum creatinine and urine output.
- Two cohorts are defined to represent a "persistent” and a “non-persistent” population. "Persistent” indicates those patients whose minimum RIFLE stage during a period of 24, 48 or 72 hours is failure (F) where the persistence period can start from the time of sample collection to 24, 48, 72, 96 or 168 hours after sample collection.
- Non-persistent indicates those patients who are not persistent at failure (F) and whose minimum RIFLE stage during a period of 24, 48 or 72 hours is non-injury (RIFLE 0), risk of injury (R), or injury (I) where the persistence period can start from the time of sample collection to 24, 48, 72, 96 or 168 hours after sample collection. If a patient dies after failure (F) or is placed on renal replacement therapy (RRT) at any time from sample collection to 24, 48, 72, 96 or 168 hours after sample collection, the patient is considered “persistent”.
- Table 8.1 Comparison of marker levels and the area under the ROC curve (AUC) in urine samples for the "persistent” and “non-persistent” cohorts where persistence starts within 24 hours after sample collection and renal status is assessed by serum creatinine (sCr) only, urine output (UO) only, or serum creatinine or urine output RIFLE criteria.
- Table 8.2 Comparison of marker levels and the area under the ROC curve (AUC) in urine samples for the "persistent” and “non-persistent” cohorts where persistence starts within 48 hours after sample collection and renal status is assessed by serum creatinine (sCr) only, urine output (UO) only, or serum creatinine or urine output RIFLE criteria.
- Table 8.3 Comparison of marker levels and the area under the ROC curve (AUC) in urine samples for the "persistent” and “non-persistent” cohorts where persistence starts within 72 hours after sample collection and renal status is assessed by serum creatinine (sCr) only, urine output (UO) only, or serum creatinine or urine output RIFLE criteria.
- Table 8.4 Comparison of marker levels and the area under the ROC curve (AUC) in urine samples for the "persistent" and “non-persistent” cohorts where persistence starts within 96 hours after sample collection and renal status is assessed by serum creatinine (sCr) only, urine output (UO) only, or serum creatinine or urine output RIFLE criteria.
- Table 8.5 Comparison of marker levels and the area under the ROC curve (AUC) in urine samples for the "persistent” and “non-persistent” cohorts where persistence starts within 168 hours after sample collection and renal status is assessed by serum creatinine (sCr) only, urine output (UO) only, or serum creatinine or urine output RIFLE criteria.
- Cutoff Quartile 2 6030 6020 6080 6030 6020 6080 6030 6020 6080 6030 6020 6080 6030 6020 6080 6030 6020 6080 6030 6020 6080
- Cutoff Quartile 4 35900 35400 36300 35900 35400 36300 35900 35400 36300 35900 35400 36300 35900 35400 36300 35900 35400 36300 35900 35400 36300
- Table 8.6 Comparison of marker levels and the area under the ROC curve (AUC) in EDTA samples for the "persistent" and “non-persistent” cohorts where persistence starts within 24 hours after sample collection and renal status is assessed by serum creatinine (sCr) only, urine output (UO) only, or serum creatinine or urine output RIFLE criteria.
- Table 8.7 Comparison of marker levels and the area under the ROC curve (AUC) in EDTA samples for the "persistent" and “non-persistent” cohorts where persistence starts within 48 hours after sample collection and renal status is assessed by serum creatinine (sCr) only, urine output (UO) only, or serum creatinine or urine output RIFLE criteria.
- Table 8.8 Comparison of marker levels and the area under the ROC curve (AUC) in EDTA samples for the "persistent" and “non-persistent” cohorts where persistence starts within 72 hours after sample collection and renal status is assessed by serum creatinine (sCr) only, urine output (UO) only, or serum creatinine or urine output RIFLE criteria.
- Table 8.9 Comparison of marker levels and the area under the ROC curve (AUC) in EDTA samples for the "persistent" and “non-persistent” cohorts where persistence starts within 96 hours after sample collection and renal status is assessed by serum creatinine (sCr) only, urine output (UO) only, or serum creatinine or urine output RIFLE criteria.
Abstract
The present invention relates to methods and compositions for monitoring, diagnosis, prognosis, and determination of treatment regimens in subjects suffering from or suspected of having a renal injury. In particular, the invention relates to using assays that detect one or more of Metalloproteinase inhibitor 1, Metalloproteinase inhibitor 2, Metalloproteinase inhibitor 4, C-C motif chemokine 15, C-C motif chemokine 18, C-C motif chemokine 23, and/or, C-C motif chemokine 24 as diagnostic and prognostic biomarker assays in renal injuries.
Description
METHODS AND COMPOSITIONS FOR DIAGNOSIS AND PROGNOSIS OF RENAL
INJURY AND RENAL FAILURE
[0001] The present application claims the benefit of U.S. Provisional Patent Application 62/455,503 filed February 6, 2017, which is hereby incorporated by reference in its entirety including all tables, figures and claims.
BACKGROUND OF THE INVENTION
[0002] The following discussion of the background of the invention is merely provided to aid the reader in understanding the invention and is not admitted to describe or constitute prior art to the present invention.
[0003] The kidney is responsible for water and solute excretion from the body. Its functions include maintenance of acid-base balance, regulation of electrolyte concentrations, control of blood volume, and regulation of blood pressure. As such, loss of kidney function through injury and/or disease results in substantial morbidity and mortality. A detailed discussion of renal injuries is provided in Harrison's Principles of Internal Medicine, 17th Ed., McGraw Hill, New York, pages 1741-1830, which are hereby incorporated by reference in their entirety. Renal disease and/or injury may be acute or chronic. Acute and chronic kidney disease are described as follows (from Current Medical Diagnosis & Treatment 2008, 47th Ed, McGraw Hill, New York, pages 785-815, which are hereby incorporated by reference in their entirety): "Acute renal failure is worsening of renal function over hours to days, resulting in the retention of nitrogenous wastes (such as urea nitrogen) and creatinine in the blood. Retention of these substances is called azotemia. Chronic renal failure (chronic kidney disease) results from an abnormal loss of renal function over months to years".
[0004] Acute renal failure (ARF, also known as acute kidney injury, or AKI) is an abrupt (typically detected within about 48 hours to 1 week) reduction in glomerular filtration. This loss of filtration capacity results in retention of nitrogenous (urea and creatinine) and non- nitrogenous waste products that are normally excreted by the kidney, a reduction in urine output, or both. It is reported that ARF complicates about 5% of hospital admissions, 4-15% of cardiopulmonary bypass surgeries, and up to 30% of intensive care admissions. ARF may be categorized as prerenal, intrinsic renal, or postrenal in causation. Intrinsic renal disease can be further divided into glomerular, tubular, interstitial, and vascular abnormalities. Major causes of
ARF are described in the following table, which is adapted from the Merck Manual, 17 ed., Chapter 222, and which is hereby incorporated by reference in their entirety:
Type Risk Factors
Prerenal
ECF volume depletion Excessive diuresis, hemorrhage, GI losses, loss of
intravascular fluid into the extravascular space (due to ascites, peritonitis, pancreatitis, or burns), loss of skin and mucus membranes, renal salt- and water-wasting states
Low cardiac output Cardiomyopathy, MI, cardiac tamponade, pulmonary
embolism, pulmonary hypertension, positive-pressure mechanical ventilation
Low systemic vascular Septic shock, liver failure, antihypertensive drugs
resistance
Increased renal vascular NSAIDs, cyclosporines, tacrolimus, hypercalcemia, resistance anaphylaxis, anesthetics, renal artery obstruction, renal
vein thrombosis, sepsis, hepatorenal syndrome
Decreased efferent ACE inhibitors or angiotensin II receptor blockers arteriolar tone (leading to
decreased GFR from
reduced glomerular
transcapillary pressure,
especially in patients with
bilateral renal artery
stenosis)
Intrinsic Renal
Acute tubular injury Ischemia (prolonged or severe prerenal state): surgery,
hemorrhage, arterial or venous obstruction; Toxins:
NSAIDs, cyclosporines, tacrolimus, aminoglycosides, foscarnet, ethylene glycol, hemoglobin, myoglobin, ifosfamide, heavy metals, methotrexate, radiopaque contrast agents, streptozotocin
Acute glomerulonephritis ANCA-associated: Crescentic glomerulonephritis,
polyarteritis nodosa, Wegener's granulomatosis; Anti- GBM glomerulonephritis: Goodpasture's syndrome;
Immune-complex: Lupus glomerulonephritis,
postinfectious glomerulonephritis, cryoglobulinemic glomerulonephritis
Acute tubulointerstitial Drug reaction (eg, β-lactams, NSAIDs, sulfonamides, nephritis ciprofloxacin, thiazide diuretics, furosemide, phenytoin, allopurinol, pyelonephritis, papillary necrosis
Acute vascular Vasculitis, malignant hypertension, thrombotic
nephropathy microangiopathies, scleroderma, atheroembolism
Infiltrative diseases Lymphoma, sarcoidosis, leukemia
Postrenal
Tubular precipitation Uric acid (tumor lysis), sulfonamides, triamterene,
acyclovir, indinavir, methotrexate, ethylene glycol ingestion, myeloma protein, myoglobin
Type Risk Factors
Ureteral obstruction Intrinsic: Calculi, clots, sloughed renal tissue, fungus
ball, edema, malignancy, congenital defects; Extrinsic:
Malignancy, retroperitoneal fibrosis, ureteral trauma
during surgery or high impact injury
Bladder obstruction Mechanical: Benign prostatic hyperplasia, prostate
cancer, bladder cancer, urethral strictures, phimosis,
paraphimosis, urethral valves, obstructed indwelling
urinary catheter; Neurogenic: Anticholinergic drugs, upper or lower motor neuron lesion
[0005] In the case of ischemic ARF, the course of the disease may be divided into four phases. During an initiation phase, which lasts hours to days, reduced perfusion of the kidney is evolving into injury. Glomerular ultrafiltration reduces, the flow of filtrate is reduced due to debris within the tubules, and back leakage of filtrate through injured epithelium occurs. Renal injury can be mediated during this phase by reperfusion of the kidney. Initiation is followed by an extension phase which is characterized by continued ischemic injury and inflammation and may involve endothelial damage and vascular congestion. During the maintenance phase, lasting from 1 to 2 weeks, renal cell injury occurs, and glomerular filtration and urine output reaches a minimum. A recovery phase can follow in which the renal epithelium is repaired and GFR gradually recovers. Despite this, the survival rate of subjects with ARF may be as low as about 60%.
[0006] Acute kidney injury caused by radiocontrast agents (also called contrast media) and other nephrotoxins such as cyclosporine, antibiotics including aminoglycosides and anticancer drugs such as cisplatin manifests over a period of days to about a week. Contrast induced nephropathy (CIN, which is AKI caused by radiocontrast agents) is thought to be caused by intrarenal vasoconstriction (leading to ischemic injury) and from the generation of reactive oxygen species that are directly toxic to renal tubular epithelial cells. CIN classically presents as an acute (onset within 24-48h) but reversible (peak 3-5 days, resolution within 1 week) rise in blood urea nitrogen and serum creatinine.
[0007] A commonly reported criteria for defining and detecting AKI is an abrupt (typically within about 2-7 days or within a period of hospitalization) elevation of serum creatinine. Although the use of serum creatinine elevation to define and detect AKI is well established, the magnitude of the serum creatinine elevation and the time over which it is measured to define AKI varies considerably among publications. Traditionally, relatively large increases in serum creatinine such as 100%, 200%, an increase of at least 100% to a value over 2 mg/dL and other
definitions were used to define AKI. However, the recent trend has been towards using smaller serum creatinine rises to define AKI. The relationship between serum creatinine rise, AKI and the associated health risks are reviewed in Praught and Shlipak, Curr Opin Nephrol Hypertens 14:265-270, 2005 and Chertow et al, J Am Soc Nephrol 16: 3365-3370, 2005, which, with the references listed therein, are hereby incorporated by reference in their entirety. As described in these publications, acute worsening renal function (AKI) and increased risk of death and other detrimental outcomes are now known to be associated with very small increases in serum creatinine. These increases may be determined as a relative (percent) value or a nominal value. Relative increases in serum creatinine as small as 20% from the pre-injury value have been reported to indicate acutely worsening renal function (AKI) and increased health risk, but the more commonly reported value to define AKI and increased health risk is a relative increase of at least 25%. Nominal increases as small as 0.3 mg/dL, 0.2 mg/dL or even 0.1 mg/dL have been reported to indicate worsening renal function and increased risk of death. Various time periods for the serum creatinine to rise to these threshold values have been used to define AKI, for example, ranging from 2 days, 3 days, 7 days, or a variable period defined as the time the patient is in the hospital or intensive care unit. These studies indicate there is not a particular threshold serum creatinine rise (or time period for the rise) for worsening renal function or AKI, but rather a continuous increase in risk with increasing magnitude of serum creatinine rise.
[0008] One study (Lassnigg et all, J Am Soc Nephrol 15: 1597-1605, 2004, hereby incorporated by reference in its entirety) investigated both increases and decreases in serum creatinine. Patients with a mild fall in serum creatinine of -0.1 to -0.3 mg/dL following heart surgery had the lowest mortality rate. Patients with a larger fall in serum creatinine (more than or equal to -0.4 mg/dL) or any increase in serum creatinine had a larger mortality rate. These findings caused the authors to conclude that even very subtle changes in renal function (as detected by small creatinine changes within 48 hours of surgery) seriously effect patient's outcomes. In an effort to reach consensus on a unified classification system for using serum creatinine to define AKI in clinical trials and in clinical practice, Bellomo et ah, Crit Care. 8(4):R204-12, 2004, which is hereby incorporated by reference in its entirety, proposes the following classifications for stratifying AKI patients:
"Risk": serum creatinine increased 1.5 fold from baseline OR urine production of <0.5 ml/kg body weight/hr for 6 hours;
"Injury": serum creatinine increased 2.0 fold from baseline OR urine production <0.5 ml/kg/hr for 12 h;
"Failure": serum creatinine increased 3.0 fold from baseline OR creatinine >355 μιηοΐ/ΐ (with a rise of >44) or urine output below 0.3 ml/kg/hr for 24 h or anuria for at least 12 hours;
And included two clinical outcomes:
"Loss": persistent need for renal replacement therapy for more than four weeks.
"ESRD": end stage renal disease— the need for dialysis for more than 3 months.
These criteria are called the RIFLE criteria, which provide a useful clinical tool to classify renal status. As discussed in Kellum, Crit. Care Med. 36: S 141-45, 2008 and Ricci et al., Kidney Int. 73, 538-546, 2008, each hereby incorporated by reference in its entirety, the RIFLE criteria provide a uniform definition of AKI which has been validated in numerous studies.
[0009] More recently, Mehta et al, Crit. Care 11:R31 (doi: 10.1186.cc5713), 2007, hereby incorporated by reference in its entirety, proposes the following similar classifications for stratifying AKI patients, which have been modified from RIFLE:
"Stage I": increase in serum creatinine of more than or equal to 0.3 mg/dL (> 26.4 μιηοΙ/L) or increase to more than or equal to 150% (1.5-fold) from baseline OR urine output less than 0.5 mL/kg per hour for more than 6 hours;
"Stage Π": increase in serum creatinine to more than 200% (> 2-fold) from baseline OR urine output less than 0.5 mL/kg per hour for more than 12 hours;
"Stage III": increase in serum creatinine to more than 300% (> 3-fold) from baseline OR serum creatinine > 354 μιηοΙ/L accompanied by an acute increase of at least 44 μιηοΙ/L OR urine output less than 0.3 mL/kg per hour for 24 hours or anuria for 12 hours.
[0010] The CIN Consensus Working Panel (McCollough et al, Rev Cardiovasc Med.
2006;7(4):177-197, hereby incorporated by reference in its entirety? uses a serum creatinine rise of 25% to define Contrast induced nephropathy (which is a type of
AKI) .Although various groups propose slightly different criteria for using serum
creatinine to detect AKI, the consensus is that small changes in serum creatinine, such as 0.3 mg/dL or 25%, are sufficient to detect AKI (worsening renal function) and that the magnitude of the serum creatinine change is an indicator of the severity of the AKI and mortality risk.
[0011] Although serial measurement of serum creatinine over a period of days is an accepted method of detecting and diagnosing AKI and is considered one of the most important
tools to evaluate AKI patients, serum creatinine is generally regarded to have several limitations in the diagnosis, assessment and monitoring of AKI patients. The time period for serum creatinine to rise to values (e.g., a 0.3 mg/dL or 25% rise) considered diagnostic for AKI can be 48 hours or longer depending on the definition used. Since cellular injury in AKI can occur over a period of hours, serum creatinine elevations detected at 48 hours or longer can be a late indicator of injury, and relying on serum creatinine can thus delay diagnosis of AKI.
Furthermore, serum creatinine is not a good indicator of the exact kidney status and treatment needs during the most acute phases of AKI when kidney function is changing rapidly. Some patients with AKI will recover fully, some will need dialysis (either short term or long term) and some will have other detrimental outcomes including death, major adverse cardiac events and chronic kidney disease. Because serum creatinine is a marker of filtration rate, it does not differentiate between the causes of AKI (pre-renal, intrinsic renal, post-renal obstruction, atheroembolic, etc) or the category or location of injury in intrinsic renal disease (for example, tubular, glomerular or interstitial in origin). Urine output is similarly limited, Knowing these things can be of vital importance in managing and treating patients with AKI.
[0012] These limitations underscore the need for better methods to detect and assess AKI, particularly in the early and subclinical stages, but also in later stages when recovery and repair of the kidney can occur. Furthermore, there is a need to better identify patients who are at risk of having an AKI.
BRIEF SUMMARY OF THE INVENTION
[0013] It is an object of the invention to provide methods and compositions for evaluating renal function in a subject. As described herein, measurement of one or more markers selected from the group consisting of Metalloproteinase inhibitor 1, Metalloproteinase inhibitor 2, Metalloproteinase inhibitor 4, C-C motif chemokine 15, C-C motif chemokine 18, C-C motif chemokine 23, and/or, C-C motif chemokine 24 (collectively referred to herein as "kidney injury markers, and individually as a "kidney injury marker") can be used for diagnosis, prognosis, risk stratification, staging, monitoring, categorizing and determination of further diagnosis and treatment regimens in subjects suffering or at risk of suffering from an injury to renal function, reduced renal function, and/or acute renal failure (also called acute kidney injury).
[0014] These kidney injury markers may be used, individually or in panels comprising a plurality of kidney injury markers, for risk stratification (that is, to identify subjects at risk for a
future injury to renal function, for future progression to reduced renal function, for future progression to ARF, for future improvement in renal function, etc.); for diagnosis of existing disease (that is, to identify subjects who have suffered an injury to renal function, who have progressed to reduced renal function, who have progressed to ARF, etc.); for monitoring for deterioration or improvement of renal function; and for predicting a future medical outcome, such as improved or worsening renal function, a decreased or increased mortality risk, a decreased or increased risk that a subject will require renal replacement therapy (i.e., hemodialysis, peritoneal dialysis, hemofiltration, and/or renal transplantation, a decreased or increased risk that a subject will recover from an injury to renal function, a decreased or increased risk that a subject will recover from ARF, a decreased or increased risk that a subject will progress to end stage renal disease, a decreased or increased risk that a subject will progress to chronic renal failure, a decreased or increased risk that a subject will suffer rejection of a transplanted kidney, etc.
[0015] In a first aspect, the present invention relates to methods for evaluating renal status in a subject. These methods comprise performing an assay method that is configured to detect one or more kidney injury markers of the present invention in a body fluid sample obtained from the subject. The assay result(s), for example a measured concentration of one or more markers selected from the group consisting of Metalloproteinase inhibitor 1, Metalloproteinase inhibitor 2, Metalloproteinase inhibitor 4, C-C motif chemokine 15, C-C motif chemokine 18, C-C motif chemokine 23, and/or, C-C motif chemokine 24, is/are then correlated to the renal status of the subject. This correlation to renal status may include correlating the assay result(s) to one or more of risk stratification, diagnosis, prognosis, staging, classifying and monitoring of the subject as described herein. Thus, the present invention utilizes one or more kidney injury markers of the present invention for the evaluation of renal injury.
[0016] In certain embodiments, the methods for evaluating renal status described herein are methods for risk stratification of the subject; that is, assigning a likelihood of one or more future changes in renal status to the subject. In these embodiments, the assay result(s) is/are correlated to one or more such future changes. The following are preferred risk stratification embodiments.
[0017] In preferred risk stratification embodiments, these methods comprise determining a subject' s risk for a future injury to renal function, and the assay result(s), for example a measured concentration of one or more markers selected from the group consisting of
Metalloproteinase inhibitor 1, Metalloproteinase inhibitor 2, Metalloproteinase inhibitor 4, C-C
motif chemokine 15, C-C motif chemokine 18, C-C motif chemokine 23, and/or, C-C motif chemokine 24, is/are correlated to a likelihood of such a future injury to renal function. For example, the measured concentration(s) may each be compared to a threshold value. For a "positive going" kidney injury marker, an increased likelihood of suffering a future injury to renal function is assigned to the subject when the measured concentration is above the threshold, relative to a likelihood assigned when the measured concentration is below the threshold. For a "negative going" kidney injury marker, an increased likelihood of suffering a future injury to renal function is assigned to the subject when the measured concentration is below the threshold, relative to a likelihood assigned when the measured concentration is above the threshold.
[0018] In other preferred risk stratification embodiments, these methods comprise determining a subject's risk for future reduced renal function, and the assay result(s), for example a measured concentration of one or more markers selected from the group consisting of Metalloproteinase inhibitor 1, Metalloproteinase inhibitor 2, Metalloproteinase inhibitor 4, C-C motif chemokine 15, C-C motif chemokine 18, C-C motif chemokine 23, and/or, C-C motif chemokine 24, is/are correlated to a likelihood of such reduced renal function. For example, the measured concentrations may each be compared to a threshold value. For a "positive going" kidney injury marker, an increased likelihood of suffering a future reduced renal function is assigned to the subject when the measured concentration is above the threshold, relative to a likelihood assigned when the measured concentration is below the threshold. For a "negative going" kidney injury marker, an increased likelihood of future reduced renal function is assigned to the subject when the measured concentration is below the threshold, relative to a likelihood assigned when the measured concentration is above the threshold.
[0019] In still other preferred risk stratification embodiments, these methods comprise determining a subject's likelihood for a future improvement in renal function, and the assay result(s), for example a measured concentration of one or more markers selected from the group consisting of Metalloproteinase inhibitor 1, Metalloproteinase inhibitor 2, Metalloproteinase inhibitor 4, C-C motif chemokine 15, C-C motif chemokine 18, C-C motif chemokine 23, and/or, C-C motif chemokine 24, is/are correlated to a likelihood of such a future improvement in renal function. For example, the measured concentration(s) may each be compared to a threshold value. For a "positive going" kidney injury marker, an increased likelihood of a future improvement in renal function is assigned to the subject when the measured concentration is
below the threshold, relative to a likelihood assigned when the measured concentration is above the threshold. For a "negative going" kidney injury marker, an increased likelihood of a future improvement in renal function is assigned to the subject when the measured concentration is above the threshold, relative to a likelihood assigned when the measured concentration is below the threshold.
[0020] In yet other preferred risk stratification embodiments, these methods comprise determining a subject's risk for progression to ARF, and the result(s), for example a measured concentration of one or more markers selected from the group consisting of Metalloproteinase inhibitor 1, Metalloproteinase inhibitor 2, Metalloproteinase inhibitor 4, C-C motif chemokine 15, C-C motif chemokine 18, C-C motif chemokine 23, and/or, C-C motif chemokine 24, is/are correlated to a likelihood of such progression to ARF. For example, the measured
concentration(s) may each be compared to a threshold value. For a "positive going" kidney injury marker, an increased likelihood of progression to ARF is assigned to the subject when the measured concentration is above the threshold, relative to a likelihood assigned when the measured concentration is below the threshold. For a "negative going" kidney injury marker, an increased likelihood of progression to ARF is assigned to the subject when the measured concentration is below the threshold, relative to a likelihood assigned when the measured concentration is above the threshold.
[0021] And in other preferred risk stratification embodiments, these methods comprise determining a subject's outcome risk, and the assay result(s), for example a measured concentration of one or more markers selected from the group consisting of Metalloproteinase inhibitor 1, Metalloproteinase inhibitor 2, Metalloproteinase inhibitor 4, C-C motif chemokine 15, C-C motif chemokine 18, C-C motif chemokine 23, and/or, C-C motif chemokine 24, is/are correlated to a likelihood of the occurrence of a clinical outcome related to a renal injury suffered by the subject. For example, the measured concentration(s) may each be compared to a threshold value. For a "positive going" kidney injury marker, an increased likelihood of one or more of: acute kidney injury, progression to a worsening stage of AKI, mortality, a requirement for renal replacement therapy, a requirement for withdrawal of renal toxins, end stage renal disease, heart failure, stroke, myocardial infarction, progression to chronic kidney disease, etc., is assigned to the subject when the measured concentration is above the threshold, relative to a likelihood assigned when the measured concentration is below the threshold. For a "negative going" kidney injury marker, an increased likelihood of one or more of: acute kidney injury, progression to a worsening stage of AKI, mortality, a requirement for renal replacement
therapy, a requirement for withdrawal of renal toxins, end stage renal disease, heart failure, stroke, myocardial infarction, progression to chronic kidney disease, etc., is assigned to the subject when the measured concentration is below the threshold, relative to a likelihood assigned when the measured concentration is above the threshold.
[0022] In such risk stratification embodiments, preferably the likelihood or risk assigned is that an event of interest is more or less likely to occur within 180 days of the time at which the body fluid sample is obtained from the subject. In particularly preferred embodiments, the likelihood or risk assigned relates to an event of interest occurring within a shorter time period such as 18 months, 120 days, 90 days, 60 days, 45 days, 30 days, 21 days, 14 days, 7 days, 5 days, 96 hours, 72 hours, 48 hours, 36 hours, 24 hours, 12 hours, or less. A risk at 0 hours of the time at which the body fluid sample is obtained from the subject is equivalent to diagnosis of a current condition.
[0023] In preferred risk stratification embodiments, the subject is selected for risk stratification based on the pre-existence in the subject of one or more known risk factors for prerenal, intrinsic renal, or postrenal ARF. For example, a subject undergoing or having undergone major vascular surgery, coronary artery bypass, or other cardiac surgery; a subject having pre-existing congestive heart failure, preeclampsia, eclampsia, diabetes mellitus, hypertension, coronary artery disease, proteinuria, renal insufficiency, glomerular filtration below the normal range, cirrhosis, serum creatinine above the normal range, or sepsis; or a subject exposed to NSAIDs, cyclosporines, tacrolimus, aminoglycosides, foscarnet, ethylene glycol, hemoglobin, myoglobin, ifosfamide, heavy metals, methotrexate, radiopaque contrast agents, or streptozotocin are all preferred subjects for monitoring risks according to the methods described herein. This list is not meant to be limiting. By "pre-existence" in this context is meant that the risk factor exists at the time the body fluid sample is obtained from the subject. In particularly preferred embodiments, a subject is chosen for risk stratification based on an existing diagnosis of injury to renal function, reduced renal function, or ARF.
[0024] In other embodiments, the methods for evaluating renal status described herein are methods for diagnosing a renal injury in the subject; that is, assessing whether or not a subject has suffered from an injury to renal function, reduced renal function, or ARF. In these embodiments, the assay result(s) is/are correlated to the occurrence or nonoccurrence of a change in renal status. The following are preferred diagnostic embodiments.
[0025] In preferred diagnostic embodiments, these methods comprise diagnosing the occurrence or nonoccurrence of an injury to renal function, and the assay result(s), for example a measured concentration of one or more markers selected from the group consisting of Metalloproteinase inhibitor 1, Metalloproteinase inhibitor 2, Metalloproteinase inhibitor 4, C-C motif chemokine 15, C-C motif chemokine 18, C-C motif chemokine 23, and/or, C-C motif chemokine 24, is/are correlated to the occurrence or nonoccurrence of such an injury. For example, each of the measured concentration(s) may be compared to a threshold value. For a positive going marker, an increased likelihood of the occurrence of an injury to renal function is assigned to the subject when the measured concentration is above the threshold (relative to the likelihood assigned when the measured concentration is below the threshold); alternatively, when the measured concentration is below the threshold, an increased likelihood of the nonoccurrence of an injury to renal function may be assigned to the subject (relative to the likelihood assigned when the measured concentration is above the threshold). For a negative going marker, an increased likelihood of the occurrence of an injury to renal function is assigned to the subject when the measured concentration is below the threshold (relative to the likelihood assigned when the measured concentration is above the threshold); alternatively, when the measured concentration is above the threshold, an increased likelihood of the nonoccurrence of an injury to renal function may be assigned to the subject (relative to the likelihood assigned when the measured concentration is below the threshold).
[0026] In other preferred diagnostic embodiments, these methods comprise diagnosing the occurrence or nonoccurrence of reduced renal function, and the assay result(s), for example a measured concentration of one or more markers selected from the group consisting of
Metalloproteinase inhibitor 1, Metalloproteinase inhibitor 2, Metalloproteinase inhibitor 4, C-C motif chemokine 15, C-C motif chemokine 18, C-C motif chemokine 23, and/or, C-C motif chemokine 24, is/are correlated to the occurrence or nonoccurrence of an injury causing reduced renal function. For example, each of the measured concentration(s) may be compared to a threshold value. For a positive going marker, an increased likelihood of the occurrence of an injury causing reduced renal function is assigned to the subject when the measured concentration is above the threshold (relative to the likelihood assigned when the measured concentration is below the threshold); alternatively, when the measured concentration is below the threshold, an increased likelihood of the nonoccurrence of an injury causing reduced renal function may be assigned to the subject (relative to the likelihood assigned when the measured concentration is above the threshold). For a negative going marker, an increased likelihood of
the occurrence of an injury causing reduced renal function is assigned to the subject when the measured concentration is below the threshold (relative to the likelihood assigned when the measured concentration is above the threshold); alternatively, when the measured concentration is above the threshold, an increased likelihood of the nonoccurrence of an injury causing reduced renal function may be assigned to the subject (relative to the likelihood assigned when the measured concentration is below the threshold).
[0027] In yet other preferred diagnostic embodiments, these methods comprise diagnosing the occurrence or nonoccurrence of ARF, and the assay result(s), for example a measured concentration of one or more markers selected from the group consisting of Metalloproteinase inhibitor 1, Metalloproteinase inhibitor 2, Metalloproteinase inhibitor 4, C-C motif chemokine 15, C-C motif chemokine 18, C-C motif chemokine 23, and/or, C-C motif chemokine 24, is/are correlated to the occurrence or nonoccurrence of an injury causing ARF. For example, each of the measured concentration(s) may be compared to a threshold value. For a positive going marker, an increased likelihood of the occurrence of ARF is assigned to the subject when the measured concentration is above the threshold (relative to the likelihood assigned when the measured concentration is below the threshold); alternatively, when the measured concentration is below the threshold, an increased likelihood of the nonoccurrence of ARF may be assigned to the subject (relative to the likelihood assigned when the measured concentration is above the threshold). For a negative going marker, an increased likelihood of the occurrence of ARF is assigned to the subject when the measured concentration is below the threshold (relative to the likelihood assigned when the measured concentration is above the threshold); alternatively, when the measured concentration is above the threshold, an increased likelihood of the nonoccurrence of ARF may be assigned to the subject (relative to the likelihood assigned when the measured concentration is below the threshold).
[0028] In still other preferred diagnostic embodiments, these methods comprise diagnosing a subject as being in need of renal replacement therapy, and the assay result(s), for example a measured concentration of one or more markers selected from the group consisting of
Metalloproteinase inhibitor 1, Metalloproteinase inhibitor 2, Metalloproteinase inhibitor 4, C-C motif chemokine 15, C-C motif chemokine 18, C-C motif chemokine 23, and/or, C-C motif chemokine 24, is/are correlated to a need for renal replacement therapy. For example, each of the measured concentration(s) may be compared to a threshold value. For a positive going marker, an increased likelihood of the occurrence of an injury creating a need for renal replacement therapy is assigned to the subject when the measured concentration is above the
threshold (relative to the likelihood assigned when the measured concentration is below the threshold); alternatively, when the measured concentration is below the threshold, an increased likelihood of the nonoccurrence of an injury creating a need for renal replacement therapy may be assigned to the subject (relative to the likelihood assigned when the measured concentration is above the threshold). For a negative going marker, an increased likelihood of the occurrence of an injury creating a need for renal replacement therapy is assigned to the subject when the measured concentration is below the threshold (relative to the likelihood assigned when the measured concentration is above the threshold); alternatively, when the measured concentration is above the threshold, an increased likelihood of the nonoccurrence of an injury creating a need for renal replacement therapy may be assigned to the subject (relative to the likelihood assigned when the measured concentration is below the threshold).
[0029] In still other preferred diagnostic embodiments, these methods comprise diagnosing a subject as being in need of renal transplantation, and the assay result(s), for example a measured concentration of one or more markers selected from the group consisting of
Metalloproteinase inhibitor 1, Metalloproteinase inhibitor 2, Metalloproteinase inhibitor 4, C-C motif chemokine 15, C-C motif chemokine 18, C-C motif chemokine 23, and/or, C-C motif chemokine 24, is/are correlated to a need for renal transplantation. For example, each of the measured concentration(s) may be compared to a threshold value. For a positive going marker, an increased likelihood of the occurrence of an injury creating a need for renal transplantation is assigned to the subject when the measured concentration is above the threshold (relative to the likelihood assigned when the measured concentration is below the threshold); alternatively, when the measured concentration is below the threshold, an increased likelihood of the nonoccurrence of an injury creating a need for renal transplantation may be assigned to the subject (relative to the likelihood assigned when the measured concentration is above the threshold). For a negative going marker, an increased likelihood of the occurrence of an injury creating a need for renal transplantation is assigned to the subject when the measured concentration is below the threshold (relative to the likelihood assigned when the measured concentration is above the threshold); alternatively, when the measured concentration is above the threshold, an increased likelihood of the nonoccurrence of an injury creating a need for renal transplantation may be assigned to the subject (relative to the likelihood assigned when the measured concentration is below the threshold).
[0030] In still other embodiments, the methods for evaluating renal status described herein are methods for monitoring a renal injury in the subject; that is, assessing whether or not renal
function is improving or worsening in a subject who has suffered from an injury to renal function, reduced renal function, or ARF. In these embodiments, the assay result(s), for example a measured concentration of one or more markers selected from the group consisting of Metalloproteinase inhibitor 1, Metalloproteinase inhibitor 2, Metalloproteinase inhibitor 4, C-C motif chemokine 15, C-C motif chemokine 18, C-C motif chemokine 23, and/or, C-C motif chemokine 24, is/are correlated to the occurrence or nonoccurrence of a change in renal status. The following are preferred monitoring embodiments.
[0031] In preferred monitoring embodiments, these methods comprise monitoring renal status in a subject suffering from an injury to renal function, and the assay result(s), for example a measured concentration of one or more markers selected from the group consisting of Metalloproteinase inhibitor 1, Metalloproteinase inhibitor 2, Metalloproteinase inhibitor 4, C-C motif chemokine 15, C-C motif chemokine 18, C-C motif chemokine 23, and/or, C-C motif chemokine 24, is/are correlated to the occurrence or nonoccurrence of a change in renal status in the subject. For example, the measured concentration(s) may be compared to a threshold value. For a positive going marker, when the measured concentration is above the threshold, a worsening of renal function may be assigned to the subject; alternatively, when the measured concentration is below the threshold, an improvement of renal function may be assigned to the subject. For a negative going marker, when the measured concentration is below the threshold, a worsening of renal function may be assigned to the subject; alternatively, when the measured concentration is above the threshold, an improvement of renal function may be assigned to the subject.
[0032] In other preferred monitoring embodiments, these methods comprise monitoring renal status in a subject suffering from reduced renal function, and the assay result(s), for example a measured concentration of one or more markers selected from the group consisting of Metalloproteinase inhibitor 1, Metalloproteinase inhibitor 2, Metalloproteinase inhibitor 4, C-C motif chemokine 15, C-C motif chemokine 18, C-C motif chemokine 23, and/or, C-C motif chemokine 24, is/are correlated to the occurrence or nonoccurrence of a change in renal status in the subject. For example, the measured concentration(s) may be compared to a threshold value. For a positive going marker, when the measured concentration is above the threshold, a worsening of renal function may be assigned to the subject; alternatively, when the measured concentration is below the threshold, an improvement of renal function may be assigned to the subject. For a negative going marker, when the measured concentration is below the threshold, a worsening of renal function may be assigned to the subject; alternatively, when
the measured concentration is above the threshold, an improvement of renal function may be assigned to the subject.
[0033] In yet other preferred monitoring embodiments, these methods comprise monitoring renal status in a subject suffering from acute renal failure, and the assay result(s), for example a measured concentration of one or more markers selected from the group consisting of
Metalloproteinase inhibitor 1, Metalloproteinase inhibitor 2, Metalloproteinase inhibitor 4, C-C motif chemokine 15, C-C motif chemokine 18, C-C motif chemokine 23, and/or, C-C motif chemokine 24, is/are correlated to the occurrence or nonoccurrence of a change in renal status in the subject. For example, the measured concentration(s) may be compared to a threshold value. For a positive going marker, when the measured concentration is above the threshold, a worsening of renal function may be assigned to the subject; alternatively, when the measured concentration is below the threshold, an improvement of renal function may be assigned to the subject. For a negative going marker, when the measured concentration is below the threshold, a worsening of renal function may be assigned to the subject; alternatively, when the measured concentration is above the threshold, an improvement of renal function may be assigned to the subject.
[0034] In other additional preferred monitoring embodiments, these methods comprise monitoring renal status in a subject at risk of an injury to renal function due to the pre-existence of one or more known risk factors for prerenal, intrinsic renal, or postrenal ARF, and the assay result(s), for example a measured concentration of one or more markers selected from the group consisting of Metalloproteinase inhibitor 1, Metalloproteinase inhibitor 2, Metalloproteinase inhibitor 4, C-C motif chemokine 15, C-C motif chemokine 18, C-C motif chemokine 23, and/or, C-C motif chemokine 24, is/are correlated to the occurrence or nonoccurrence of a change in renal status in the subject. For example, the measured concentration(s) may be compared to a threshold value. For a positive going marker, when the measured concentration is above the threshold, a worsening of renal function may be assigned to the subject; alternatively, when the measured concentration is below the threshold, an improvement of renal function may be assigned to the subject. For a negative going marker, when the measured concentration is below the threshold, a worsening of renal function may be assigned to the subject; alternatively, when the measured concentration is above the threshold, an improvement of renal function may be assigned to the subject.
[0035] In yet other preferred monitoring embodiments, these methods comprise monitoring renal status in a subject having, or at risk of, an injury to renal function for future persistence of
acute kidney injury. "Future persistence" as used herein refers to an existing acute renal injury that will continue for a period selected from the group consisting of 21 days, 14 days, 7 days, 5 days, 96 hours, 72 hours, 48 hours, 36 hours, 24 hours, and 12 hours. In certain embodiments the subject has an acute kidney injury at the time the sample is obtained. This is not meant to imply that the subject must have an acute kidney injury at the time the sample is obtained, but rather that the subject, upon onset of an acute kidney injury, suffers from an acute kidney injury that will persist. In various embodiments, the assay result(s), for example a measured concentration of one or more markers selected from the group consisting of Metalloproteinase inhibitor 1, Metalloproteinase inhibitor 2, Metalloproteinase inhibitor 4, C-C motif chemokine 15, C-C motif chemokine 18, C-C motif chemokine 23, and/or, C-C motif chemokine 24, is/are correlated to the future persistence of the acute kidney injury in the subject. For example, the measured concentration(s) may be compared to a threshold value. For a positive going marker, when the measured concentration is above the threshold, a future persistence of acute kidney injury may be assigned to the subject; alternatively, when the measured concentration is below the threshold, afuture improvement of renal function may be assigned to the subject. For a negative going marker, when the measured concentration is below the threshold, a future persistence of acute kidney injury may be assigned to the subject; alternatively, when the measured concentration is above the threshold, a future improvement of renal function may be assigned to the subject.
[0036] In still other embodiments, the methods for evaluating renal status described herein are methods for classifying a renal injury in the subject; that is, determining whether a renal injury in a subject is prerenal, intrinsic renal, or postrenal; and/or further subdividing these classes into subclasses such as acute tubular injury, acute glomerulonephritis acute
tubulointerstitial nephritis, acute vascular nephropathy, or infiltrative disease; and/or assigning a likelihood that a subject will progress to a particular RIFLE stage. In these embodiments, the assay result(s), for example a measured concentration of one or more markers selected from the group consisting of Metalloproteinase inhibitor 1, Metalloproteinase inhibitor 2,
Metalloproteinase inhibitor 4, C-C motif chemokine 15, C-C motif chemokine 18, C-C motif chemokine 23, and/or, C-C motif chemokine 24, is/are correlated to a particular class and/or subclass. The following are preferred classification embodiments.
[0037] In preferred classification embodiments, these methods comprise determining whether a renal injury in a subject is prerenal, intrinsic renal, or postrenal; and/or further subdividing these classes into subclasses such as acute tubular injury, acute glomerulonephritis
acute tubulointerstitial nephritis, acute vascular nephropathy, or infiltrative disease; and/or assigning a likelihood that a subject will progress to a particular RIFLE stage, and the assay result(s), for example a measured concentration of one or more markers selected from the group consisting of Metalloproteinase inhibitor 1, Metalloproteinase inhibitor 2, Metalloproteinase inhibitor 4, C-C motif chemokine 15, C-C motif chemokine 18, C-C motif chemokine 23, and/or, C-C motif chemokine 24, is/are correlated to the injury classification for the subject. For example, the measured concentration may be compared to a threshold value, and when the measured concentration is above the threshold, a particular classification is assigned;
alternatively, when the measured concentration is below the threshold, a different classification may be assigned to the subject.
[0038] A variety of methods may be used by the skilled artisan to arrive at a desired threshold value for use in these methods. For example, the threshold value may be determined from a population of normal subjects by selecting a concentration representing the 75th, 85th, 90th, 95th, or 99th percentile of a kidney injury marker measured in such normal subjects.
Alternatively, the threshold value may be determined from a "diseased" population of subjects, e.g., those suffering from an injury or having a predisposition for an injury (e.g., progression to ARF or some other clinical outcome such as death, dialysis, renal transplantation, etc.), by selecting a concentration representing the 75th, 85th, 90th, 95th, or 99th percentile of a kidney injury marker measured in such subjects. In another alternative, the threshold value may be determined from a prior measurement of a kidney injury marker in the same subject; that is, a temporal change in the level of a kidney injury marker in the subject may be used to assign risk to the subject.
[0039] The foregoing discussion is not meant to imply, however, that the kidney injury markers of the present invention must be compared to corresponding individual thresholds. Methods for combining assay results can comprise the use of multivariate logistical regression, loglinear modeling, neural network analysis, n-of-m analysis, decision tree analysis, calculating ratios of markers, etc. This list is not meant to be limiting. In these methods, a composite result which is determined by combining individual markers may be treated as if it is itself a marker; that is, a threshold may be determined for the composite result as described herein for individual markers, and the composite result for an individual patient compared to this threshold.
[0040] The ability of a particular test to distinguish two populations can be established using ROC analysis. For example, ROC curves established from a "first" subpopulation which
is predisposed to one or more future changes in renal status, and a "second" subpopulation which is not so predisposed can be used to calculate a ROC curve, and the area under the curve provides a measure of the quality of the test. Preferably, the tests described herein provide a ROC curve area greater than 0.5, preferably at least 0.6, more preferably 0.7, still more preferably at least 0.8, even more preferably at least 0.9, and most preferably at least 0.95.
[0041] In certain aspects, the measured concentration of one or more kidney injury markers, or a composite of such markers, may be treated as continuous variables. For example, any particular concentration can be converted into a corresponding probability of a future reduction in renal function for the subject, the occurrence of an injury, a classification, etc. In yet another alternative, a threshold that can provide an acceptable level of specificity and sensitivity in separating a population of subjects into "bins" such as a "first" subpopulation (e.g., which is predisposed to one or more future changes in renal status, the occurrence of an injury, a classification, etc.) and a "second" subpopulation which is not so predisposed. A threshold value is selected to separate this first and second population by one or more of the following measures of test accuracy: an odds ratio greater than 1, preferably at least about 2 or more or about 0.5 or less, more preferably at least about 3 or more or about 0.33 or less, still more preferably at least about 4 or more or about 0.25 or less, even more preferably at least about 5 or more or about 0.2 or less, and most preferably at least about 10 or more or about 0.1 or less; a specificity of greater than 0.5, preferably at least about 0.6, more preferably at least about 0.7, still more preferably at least about 0.8, even more preferably at least about 0.9 and most preferably at least about 0.95, with a corresponding sensitivity greater than 0.2, preferably greater than about 0.3, more preferably greater than about 0.4, still more preferably at least about 0.5, even more preferably about 0.6, yet more preferably greater than about 0.7, still more preferably greater than about 0.8, more preferably greater than about 0.9, and most preferably greater than about 0.95; a sensitivity of greater than 0.5, preferably at least about 0.6, more preferably at least about 0.7, still more preferably at least about 0.8, even more preferably at least about 0.9 and most preferably at least about 0.95, with a corresponding specificity greater than 0.2, preferably greater than about 0.3, more preferably greater than about 0.4, still more preferably at least about 0.5, even more preferably about 0.6, yet more preferably greater than about 0.7, still more
preferably greater than about 0.8, more preferably greater than about 0.9, and most preferably greater than about 0.95; at least about 75% sensitivity, combined with at least about 75% specificity; a positive likelihood ratio (calculated as sensitivity/(l-specificity)) of greater than 1, at least about 2, more preferably at least about 3, still more preferably at least about 5, and most preferably at least about 10; or a negative likelihood ratio (calculated as (l-sensitivity)/specificity) of less than 1, less than or equal to about 0.5, more preferably less than or equal to about 0.3, and most preferably less than or equal to about 0.1.
The term "about" in the context of any of the above measurements refers to +/- 5% of a given measurement.
[0042] Multiple thresholds may also be used to assess renal status in a subject. For example, a "first" subpopulation which is predisposed to one or more future changes in renal status, the occurrence of an injury, a classification, etc., and a "second" subpopulation which is not so predisposed can be combined into a single group. This group is then subdivided into three or more equal parts (known as tertiles, quartiles, quin tiles, etc., depending on the number of subdivisions). An odds ratio is assigned to subjects based on which subdivision they fall into. If one considers a tertile, the lowest or highest tertile can be used as a reference for comparison of the other subdivisions. This reference subdivision is assigned an odds ratio of 1. The second tertile is assigned an odds ratio that is relative to that first tertile. That is, someone in the second tertile might be 3 times more likely to suffer one or more future changes in renal status in comparison to someone in the first tertile. The third tertile is also assigned an odds ratio that is relative to that first tertile.
[0043] In certain embodiments, the assay method is an immunoassay. Antibodies for use in such assays will specifically bind a full length kidney injury marker of interest, and may also bind one or more polypeptides that are "related" thereto, as that term is defined hereinafter. Numerous immunoassay formats are known to those of skill in the art. Preferred body fluid samples are selected from the group consisting of urine, blood, serum, saliva, tears, and plasma.
[0044] The foregoing method steps should not be interpreted to mean that the kidney injury marker assay result(s) is/are used in isolation in the methods described herein. Rather, additional variables or other clinical indicia may be included in the methods described herein. For example, a risk stratification, diagnostic, classification, monitoring, etc. method may
combine the assay result(s) with one or more variables measured for the subject selected from the group consisting of demographic information (e.g., weight, sex, age, race), medical history (e.g., family history, type of surgery, pre-existing disease such as aneurism, congestive heart failure, preeclampsia, eclampsia, diabetes mellitus, hypertension, coronary artery disease, proteinuria, renal insufficiency, or sepsis, type of toxin exposure such as NSAIDs,
cyclosporines, tacrolimus, aminoglycosides, foscarnet, ethylene glycol, hemoglobin, myoglobin, ifosfamide, heavy metals, methotrexate, radiopaque contrast agents, or
streptozotocin), clinical variables (e.g., blood pressure, temperature, respiration rate), risk scores (APACHE score, PREDICT score, TIMI Risk Score for UA/NSTEMI, Framingham Risk Score), a glomerular filtration rate, an estimated glomerular filtration rate, a urine production rate, a serum or plasma creatinine concentration, a urine creatinine concentration, a fractional excretion of sodium, a urine sodium concentration, a urine creatinine to serum or plasma creatinine ratio, a urine specific gravity, a urine osmolality, a urine urea nitrogen to plasma urea nitrogen ratio, a plasma BUN to creatnine ratio, a renal failure index calculated as urine sodium / (urine creatinine / plasma creatinine), a serum or plasma neutrophil gelatinase (NGAL) concentration, a urine NGAL concentration, a serum or plasma cystatin C
concentration, a serum or plasma cardiac troponin concentration, a serum or plasma BNP concentration, a serum or plasma NTproBNP concentration, and a serum or plasma proBNP concentration. Other measures of renal function which may be combined with one or more kidney injury marker assay result(s) are described hereinafter and in Harrison's Principles of Internal Medicine, 17th Ed., McGraw Hill, New York, pages 1741-1830, and Current Medical Diagnosis & Treatment 2008, 47th Ed, McGraw Hill, New York, pages 785-815, each of which are hereby incorporated by reference in their entirety.
[0045] When more than one marker is measured, the individual markers may be measured in samples obtained at the same time, or may be determined from samples obtained at different (e.g., an earlier or later) times. The individual markers may also be measured on the same or different body fluid samples. For example, one kidney injury marker may be measured in a serum or plasma sample and another kidney injury marker may be measured in a urine sample. In addition, assignment of a likelihood may combine an individual kidney injury marker assay result with temporal changes in one or more additional variables.
[0046] In various related aspects, the present invention also relates to devices and kits for performing the methods described herein. Suitable kits comprise reagents sufficient for
performing an assay for at least one of the described kidney injury markers, together with instructions for performing the described threshold comparisons.
[0047] In certain embodiments, reagents for performing such assays are provided in an assay device, and such assay devices may be included in such a kit. Preferred reagents can comprise one or more solid phase antibodies, the solid phase antibody comprising antibody that detects the intended biomarker target(s) bound to a solid support. In the case of sandwich immunoassays, such reagents can also include one or more detectably labeled antibodies, the detectably labeled antibody comprising antibody that detects the intended biomarker target(s) bound to a detectable label. Additional optional elements that may be provided as part of an assay device are described hereinafter.
[0048] Detectable labels may include molecules that are themselves detectable (e.g., fluorescent moieties, electrochemical labels, eel (electrochemical luminescence) labels, metal chelates, colloidal metal particles, etc.) as well as molecules that may be indirectly detected by production of a detectable reaction product (e.g., enzymes such as horseradish peroxidase, alkaline phosphatase, etc.) or through the use of a specific binding molecule which itself may be detectable (e.g., a labeled antibody that binds to the second antibody, biotin, digoxigenin, maltose, oligohistidine, 2,4-dintrobenzene, phenylarsenate, ssDNA, dsDNA, etc.).
[0049] Generation of a signal from the signal development element can be performed using various optical, acoustical, and electrochemical methods well known in the art. Examples of detection modes include fluorescence, radiochemical detection, reflectance, absorbance, amperometry, conductance, impedance, interferometry, ellipsometry, etc. In certain of these methods, the solid phase antibody is coupled to a transducer (e.g., a diffraction grating, electrochemical sensor, etc) for generation of a signal, while in others, a signal is generated by a transducer that is spatially separate from the solid phase antibody (e.g., a fluorometer that employs an excitation light source and an optical detector). This list is not meant to be limiting. Antibody-based biosensors may also be employed to determine the presence or amount of analytes that optionally eliminate the need for a labeled molecule.
DETAILED DESCRIPTION OF THE INVENTION
[0050] The present invention relates to methods and compositions for diagnosis, differential diagnosis, risk stratification, monitoring, classifying and determination of treatment regimens in subjects suffering or at risk of suffering from injury to renal function, reduced renal function and/or acute renal failure through measurement of one or more kidney injury markers. In
various embodiments, a measured concentration of one or more markers selected from the group consisting of Metalloproteinase inhibitor 1, Metalloproteinase inhibitor 2,
Metalloproteinase inhibitor 4, C-C motif chemokine 15, C-C motif chemokine 18, C-C motif chemokine 23, and/or, C-C motif chemokine 24 or one or more markers related thereto, and optionally one or more additional kidney injury markers known in the art, are correlated to the renal status of the subject.
[0051] For purposes of this document, the following definitions apply:
As used herein, an "injury to renal function" is an abrupt (within 14 days, preferably within 7 days, more preferably within 72 hours, and still more preferably within 48 hours) measurable reduction in a measure of renal function. Such an injury may be identified, for example, by a decrease in glomerular filtration rate or estimated GFR, a reduction in urine output, an increase in serum creatinine, an increase in serum cy statin C, a requirement for renal replacement therapy, etc. "Improvement in Renal Function" is an abrupt (within 14 days, preferably within 7 days, more preferably within 72 hours, and still more preferably within 48 hours) measurable increase in a measure of renal function. Preferred methods for measuring and/or estimating GFR are described hereinafter.
As used herein, "reduced renal function" is an abrupt (within 14 days, preferably within 7 days, more preferably within 72 hours, and still more preferably within 48 hours) reduction in kidney function identified by an absolute increase in serum creatinine of greater than or equal to 0.1 mg/dL (> 8.8 μιηοΙ/L), a percentage increase in serum creatinine of greater than or equal to 20% (1.2-fold from baseline), or a reduction in urine output (documented oliguria of less than 0. 5 ml/kg per hour).
As used herein, "acute renal failure" or "ARF" is an abrupt (within 14 days, preferably within 7 days, more preferably within 72 hours, and still more preferably within 48 hours) reduction in kidney function identified by an absolute increase in serum creatinine of greater than or equal to 0.3 mg/dl (> 26.4 μιηοΐ/ΐ), a percentage increase in serum creatinine of greater than or equal to 50% (1. 5-fold from baseline), or a reduction in urine output (documented oliguria of less than 0.5 ml/kg per hour for at least 6 hours). This term is synonymous with "acute kidney injury" or "AKI."
[0052] In this regard, the skilled artisan will understand that the signals obtained from an immunoassay are a direct result of complexes formed between one or more antibodies and the target biomolecule (i.e., the analyte) and polypeptides containing the necessary epitope(s) to
which the antibodies bind. While such assays may detect the full length biomarker and the assay result be expressed as a concentration of a biomarker of interest, the signal from the assay is actually a result of all such "immunoreactive" polypeptides present in the sample. Expression of biomarkers may also be determined by means other than immunoassays, including protein measurements (such as dot blots, western blots, chromatographic methods, mass spectrometry, etc.) and nucleic acid measurements (mRNA quatitation). This list is not meant to be limiting.
[0053] As used herein, the term "Metalloproteinase inhibitor 1" refers to one or more polypeptides present in a biological sample that are derived from the Metalloproteinase inhibitor 1 precursor (Swiss-Prot P01033 (SEQ ID NO: 1)).
10 20 30 40 50 60
MAPFEPLASG ILLLLWLIAP SRACTCVPPH PQTAFCNSDL VIRAKFVGTP EVNQTTLYQR
70 80 90 100 110 120
YEIKMTKMYK GFQALGDAAD IRFVYTPAME SVCGYFHRSH NRSEEFLIAG KLQDGLLHIT
130 140 150 160 170 180
TCSFVAPWNS LSLAQRRGFT KTYTVGCEEC TVFPCLSIPC KLQSGTHCLW TDQLLQGSEK
190 200
GFQSRHLACL PREPGLCTWQ SLRSQIA
[0054] The following domains have been identified in Metalloproteinase inhibitor 1 :
Residues Length Domain ID
1-23 23 signal sequence
24-207 184 Metalloproteinase inhibitor 1
[0055] As used herein, the term "Metalloproteinase inhibitor 2" refers to one or more polypeptides present in a biological sample that are derived from the Metalloproteinase inhibitor 2 precursor (human precursor: Swiss-Prot P16035 (SEQ ID NO: 2)).
10 20 30 40 50 60
MGAAARTLRL ALGLLLLATL LRPADACSCS PVHPQQAFCN ADWIRAKAV SEKEVDSGND
70 80 90 100 110 120
IYGNPIKRIQ YEIKQIKMFK GPEKDIEFIY TAPSSAVCGV SLDVGGKKEY LIAGKAEGDG
130 140 150 160 170 180
KMHITLCDFI VPWDTLSTTQ KKSLNHRYQM GCECKITRCP MIPCYISSPD ECLWMDWVTE
190 200 210 220
KNINGHQAKF FACIKRSDGS CAWYRGAAPP KQEFLDIEDP
[0056] The following domains have been identified in Metalloproteinase inhibitor 2:
Residues Length Domain ID
1-26 26 Signal peptide
27-220 194 Metalloproteinase inhibitor 2
[0057] As used herein, the term "Metalloproteinase inhibitor 4" refers to one or polypeptides present in a biological sample that are derived from the Metalloproteinase inhibitor 4 precursor (human precursor: Swiss-Prot Q99727 (SEQ ID NO: 3)).
10 20 30 40 50 60
MPGSPRPAPS WVLLLRLLAL LRPPGLGEAC SCAPAHPQQH ICHSALVIRA KISSEKVVPA
70 80 90 100 110 120
SADPADTEKM LRYEIKQIKM FKGFEKVKDV QYIYTPFDSS LCGVKLEANS QKQYLLTGQV
130 140 150 160 170 180
LSDGKVFIHL CNYIEPWEDL SLVQRESLNH HYHLNCGCQI TTCYTVPCTI SAPNECLWTD
190 200 210 220
WLLERKLYGY QAQHYVCMKH VDGTCSWYRG HLPLRKEFVD IVQP
[0058] The following domains have been identified in Metalloproteinase inhibitor 4:
Residues Length Domain ID
1-29 29 Signal sequence
30-224 195 Metalloproteinase inhibitor 4
[0059] As used herein, the term "C-C motif chemokine 15" refers to one or more polypeptides present in a biological sample that are derived from the C-C motif chemokine 15 precursor (human precursor: Swiss-Prot Q16663 (SEQ ID NO: 4)).
10 20 30 40 50
MKVSVAALSC LMLVAVLGSQ AQFINDAETE LMMSKLPLEN PVVLNSFHFA
60 70 80 90 100
ADCCTSYISQ SIPCSLMKSY FETSSECSKP GVIFLTKKGR QVCAKPSGPG
110
VQDCMKKLKP YSI
[0060] The following domains have been identified in C-C motif chemokine 15:
Residues Length Domain ID
1-21 21 Signal peptide
22-113 92 C-C motif chemokine 15
43-113 71 C-C motif chemokine 15 (22-92)
46-113 68 C-C motif chemokine 15 (25-92)
50-113 64 C-C motif chemokine 15 (29-92)
[0061] As used herein, the term "C-C motif chemokine 18" refers to one or more polypeptides present in a biological sample that are derived from the C-C motif chemokine 18 precursor (human precursor: Swiss-Prot P55774 (SEQ ID NO: 5)).
10 20 30 40 50 60
MKGLAAALLV LVCTMALCSC AQVGTNKELC CLVYTSWQIP QKFIVDYSET SPQCPKPGVI
70 80
LLTKRGRQIC ADPNKKWVQK YISDLKLNA
[0062] The following domains have been identified in C-C motif chemokine 18:
Residues Length Domain ID
1-20 20 Signal peptide
21-89 69 C-C motif chemokine 18
21-88 68 CCL 18 (1-68)
23-89 67 CCL 18 (3-69)
24-89 66 CCL 18 (4-69)
[0063] As used herein, the term "C-C motif chemokine 23" refers to one or more polypeptides present in a biological sample that are derived from the C-C motif chemokine 23 precursor (Swiss-Prot P55773 (SEQ ID NO: 6))
10 20 30 40 50
MKVSVAALSC LMLVTALGSQ ARVTKDAETE FMMSKLPLEN PVLLDRFHAT
60 70 80 90 100
SADCCISYTP RSIPCSLLES YFETNSECSK PGVIFLTKKG RRFCANPSDK
110 120
QVQVCVRMLK LDTRIKTRKN
[0064] The following domains have been identified in C-C motif chemokine 23:
Residues Length Domain ID
1-21 21 signal peptide
22- 120 99 C-C motif chemokine 23
40-120 81 C-C motif chemokine 23 (19-99)
43-120 78 C-C motif chemokine 23 (22-99)
48-120 73 C-C motif chemokine 23 (27-99)
51-120 70 C-C motif chemokine 23 (30-99)
[0065] As used herein, the term "C-C motif chemokine 24" refers to one or more polypeptides present in a biological sample that are derived from the C-C motif chemokine 24 precursor (Swiss-Prot 000175 (SEQ ID NO: 7))
10 2 0 30 4 0 50
MAGLMT IVTS LLFLGVCAHH I I PTGSWIP SPCCMFFVSK RI PENRWSY
60 7 0 80 90 1 00
QLS SRS TCLK AGVIFTTKKG QQFCGDPKQE WVQRYMKNLD AKQKKASPRA
1 10
RAVAVKGPVQ RYP GNQTTC
[0066] The following domains have been identified in C-C motif chemokine 24:
Residues Length Domain ID
1-26 26 signal peptide
27- 119 93 C-C motif chemokine 24
[0067] As used herein, the term "relating a signal to the presence or amount" of an analyte reflects this understanding. Assay signals are typically related to the presence or amount of an analyte through the use of a standard curve calculated using known concentrations of the analyte of interest. As the term is used herein, an assay is "configured to detect" an analyte if an assay can generate a detectable signal indicative of the presence or amount of a physiologically relevant concentration of the analyte. Because an antibody epitope is on the order of 8 amino acids, an immunoassay configured to detect a marker of interest will also detect polypeptides related to the marker sequence, so long as those polypeptides contain the epitope(s) necessary to bind to the antibody or antibodies used in the assay.
[0068] The term "related marker" as used herein with regard to a biomarker such as one of the kidney injury markers described herein refers to one or more fragments, variants, etc., of a particular marker or its biosynthetic parent that may be detected as a surrogate for the marker itself or as independent biomarkers. The term also refers to one or more polypeptides present in a biological sample that are derived from the biomarker precursor complexed to additional species, such as binding proteins, receptors, heparin, lipids, sugars, etc.
[0069] The term "positive going" marker as that term is used herein refer to a marker that is determined to be elevated in subjects suffering from a disease or condition, relative to subjects not suffering from that disease or condition. The term "negative going" marker as that term is used herein refer to a marker that is determined to be reduced in subjects suffering from a disease or condition, relative to subjects not suffering from that disease or condition.
[0070] The term "subject" as used herein refers to a human or non-human organism. Thus, the methods and compositions described herein are applicable to both human and veterinary disease. Further, while a subject is preferably a living organism, the invention described herein may be used in post-mortem analysis as well. Preferred subjects are humans, and most preferably "patients," which as used herein refers to living humans that are receiving medical care for a disease or condition. This includes persons with no defined illness who are being investigated for signs of pathology.
[0071] Preferably, an analyte is measured in a sample. Such a sample may be obtained from a subject, or may be obtained from biological materials intended to be provided to the subject. For example, a sample may be obtained from a kidney being evaluated for possible
transplantation into a subject, and an analyte measurement used to evaluate the kidney for preexisting damage. Preferred samples are body fluid samples.
[0072] The term "body fluid sample" as used herein refers to a sample of bodily fluid obtained for the purpose of diagnosis, prognosis, classification or evaluation of a subject of interest, such as a patient or transplant donor. In certain embodiments, such a sample may be obtained for the purpose of determining the outcome of an ongoing condition or the effect of a treatment regimen on a condition. Preferred body fluid samples include blood, serum, plasma, cerebrospinal fluid, urine, saliva, sputum, and pleural effusions. In addition, one of skill in the art would realize that certain body fluid samples would be more readily analyzed following a fractionation or purification procedure, for example, separation of whole blood into serum or plasma components.
[0073] The term "diagnosis" as used herein refers to methods by which the skilled artisan can estimate and/or determine the probability ("a likelihood") of whether or not a patient is suffering from a given disease or condition. In the case of the present invention, "diagnosis" includes using the results of an assay, most preferably an immunoassay, for a kidney injury marker of the present invention, optionally together with other clinical characteristics, to arrive at a diagnosis (that is, the occurrence or nonoccurrence) of an acute renal injury or ARF for the subject from which a sample was obtained and assayed. That such a diagnosis is "determined" is not meant to imply that the diagnosis is 100% accurate. Many biomarkers are indicative of multiple conditions. The skilled clinician does not use biomarker results in an informational vacuum, but rather test results are used together with other clinical indicia to arrive at a diagnosis. Thus, a measured biomarker level on one side of a predetermined diagnostic threshold indicates a greater likelihood of the occurrence of disease in the subject relative to a measured level on the other side of the predetermined diagnostic threshold.
[0074] Similarly, a prognostic risk signals a probability ("a likelihood") that a given course or outcome will occur. A level or a change in level of a prognostic indicator, which in turn is associated with an increased probability of morbidity (e.g., worsening renal function, future ARF, or death) is referred to as being "indicative of an increased likelihood" of an adverse outcome in a patient.
[0075] Marker Assays
[0076] In general, immunoassays involve contacting a sample containing or suspected of containing a biomarker of interest with at least one antibody that specifically binds to the biomarker. A signal is then generated indicative of the presence or amount of complexes formed by the binding of polypeptides in the sample to the antibody. The signal is then related to the presence or amount of the biomarker in the sample. Numerous methods and devices are well known to the skilled artisan for the detection and analysis of biomarkers. See, e.g., U.S. Patents 6,143,576; 6,113,855; 6,019,944; 5,985,579; 5,947,124; 5,939,272; 5,922,615;
5,885,527; 5,851,776; 5,824,799; 5,679,526; 5,525,524; and 5,480,792, and The Immunoassay Handbook, David Wild, ed. Stockton Press, New York, 1994, each of which is hereby incorporated by reference in its entirety, including all tables, figures and claims.
[0077] The assay devices and methods known in the art can utilize labeled molecules in various sandwich, competitive, or non-competitive assay formats, to generate a signal that is related to the presence or amount of the biomarker of interest. Suitable assay formats also
include chromatographic, mass spectrographic, and protein "blotting" methods. Additionally, certain methods and devices, such as biosensors and optical immunoassays, may be employed to determine the presence or amount of analytes without the need for a labeled molecule. See, e.g., U.S. Patents 5,631,171 ; and 5,955,377, each of which is hereby incorporated by reference in its entirety, including all tables, figures and claims. One skilled in the art also recognizes that robotic instrumentation including but not limited to Beckman ACCESS®, Abbott AXSYM®, Roche ELECSYS®, Dade Behring STRATUS® systems are among the immunoassay analyzers that are capable of performing immunoassays. But any suitable immunoassay may be utilized, for example, enzyme-linked immunoassays (ELISA), radioimmunoassays (RIAs), competitive binding assays, and the like.
[0078] Antibodies or other polypeptides may be immobilized onto a variety of solid supports for use in assays. Solid phases that may be used to immobilize specific binding members include include those developed and/or used as solid phases in solid phase binding assays. Examples of suitable solid phases include membrane filters, cellulose-based papers, beads (including polymeric, latex and paramagnetic particles), glass, silicon wafers, microparticles, nanoparticles, TentaGels, AgroGels, PEGA gels, SPOCC gels, and multiple- well plates. An assay strip could be prepared by coating the antibody or a plurality of antibodies in an array on solid support. This strip could then be dipped into the test sample and then processed quickly through washes and detection steps to generate a measurable signal, such as a colored spot. Antibodies or other polypeptides may be bound to specific zones of assay devices either by conjugating directly to an assay device surface, or by indirect binding. In an example of the later case, antibodies or other polypeptides may be immobilized on particles or other solid supports, and that solid support immobilized to the device surface.
[0079] Biological assays require methods for detection, and one of the most common methods for quantitation of results is to conjugate a detectable label to a protein or nucleic acid that has affinity for one of the components in the biological system being studied. Detectable labels may include molecules that are themselves detectable (e.g., fluorescent moieties, electrochemical labels, metal chelates, etc.) as well as molecules that may be indirectly detected by production of a detectable reaction product (e.g., enzymes such as horseradish peroxidase, alkaline phosphatase, etc.) or by a specific binding molecule which itself may be detectable (e.g., biotin, digoxigenin, maltose, oligohistidine, 2,4-dintrobenzene, phenylarsenate, ssDNA, dsDNA, etc.).
[0080] Preparation of solid phases and detectable label conjugates often comprise the use of chemical cross-linkers. Cross-linking reagents contain at least two reactive groups, and are divided generally into homofunctional cross-linkers (containing identical reactive groups) and heterofunctional cross-linkers (containing non-identical reactive groups). Homobifunctional cross-linkers that couple through amines, sulfhydryls or react non- specifically are available from many commercial sources. Maleimides, alkyl and aryl halides, alpha-haloacyls and pyridyl disulfides are thiol reactive groups. Maleimides, alkyl and aryl halides, and alpha- haloacyls react with sulfhydryls to form thiol ether bonds, while pyridyl disulfides react with sulfhydryls to produce mixed disulfides. The pyridyl disulfide product is cleavable. Imidoesters are also very useful for protein-protein cross-links. A variety of heterobifunctional cross- linkers, each combining different attributes for successful conjugation, are commercially available.
[0081] In certain aspects, the present invention provides kits for the analysis of the described kidney injury markers. The kit comprises reagents for the analysis of at least one test sample which comprise at least one antibody that a kidney injury marker. The kit can also include devices and instructions for performing one or more of the diagnostic and/or prognostic correlations described herein. Preferred kits will comprise an antibody pair for performing a sandwich assay, or a labeled species for performing a competitive assay, for the analyte.
Preferably, an antibody pair comprises a first antibody conjugated to a solid phase and a second antibody conjugated to a detectable label, wherein each of the first and second antibodies that bind a kidney injury marker. Most preferably each of the antibodies are monoclonal antibodies. The instructions for use of the kit and performing the correlations can be in the form of labeling, which refers to any written or recorded material that is attached to, or otherwise accompanies a kit at any time during its manufacture, transport, sale or use. For example, the term labeling encompasses advertising leaflets and brochures, packaging materials, instructions, audio or video cassettes, computer discs, as well as writing imprinted directly on kits.
[0082] Antibodies
[0083] The term "antibody" as used herein refers to a peptide or polypeptide derived from, modeled after or substantially encoded by an immunoglobulin gene or immunoglobulin genes, or fragments thereof, capable of specifically binding an antigen or epitope. See, e.g.
Fundamental Immunology, 3rd Edition, W.E. Paul, ed., Raven Press, N.Y. (1993); Wilson (1994; J. Immunol. Methods 175:267-273; Yarmush (1992) J. Biochem. Biophys. Methods 25:85-97. The term antibody includes antigen-binding portions, i.e., "antigen binding sites,"
(e.g., fragments, subsequences, complementarity determining regions (CDRs)) that retain capacity to bind antigen, including (i) a Fab fragment, a monovalent fragment consisting of the VL, VH, CL and CHI domains; (ii) a F(ab')2 fragment, a bivalent fragment comprising two Fab fragments linked by a disulfide bridge at the hinge region; (iii) a Fd fragment consisting of the VH and CHI domains; (iv) a Fv fragment consisting of the VL and VH domains of a single arm of an antibody, (v) a dAb fragment (Ward et al., (1989) Nature 341 :544-546), which consists of a VH domain; and (vi) an isolated complementarity determining region (CDR). Single chain antibodies are also included by reference in the term "antibody."
[0084] Antibodies used in the immunoassays described herein preferably specifically bind to a kidney injury marker of the present invention. The term "specifically binds" is not intended to indicate that an antibody binds exclusively to its intended target since, as noted above, an antibody binds to any polypeptide displaying the epitope(s) to which the antibody binds.
Rather, an antibody "specifically binds" if its affinity for its intended target is about 5-fold greater when compared to its affinity for a non-target molecule which does not display the appropriate epitope(s). Preferably the affinity of the antibody will be at least about 5 fold, preferably 10 fold, more preferably 25-fold, even more preferably 50-fold, and most preferably 100-fold or more, greater for a target molecule than its affinity for a non-target molecule. In preferred embodiments, Preferred antibodies bind with affinities of at least about 107 M"1, and preferably between about 108 M"1 to about 109 NT1, about 109 M"1 to about 1010 NT1, or about 1010 M 1 to about 1012 M 1 .
[0085] Affinity is calculated as Kd = k0ff/kon (k0ff is the dissociation rate constant, Kon is the association rate constant and Kd is the equilibrium constant). Affinity can be determined at equilibrium by measuring the fraction bound (r) of labeled ligand at various concentrations (c). The data are graphed using the Scatchard equation: r/c = K(n-r): where r = moles of bound ligand/mole of receptor at equilibrium; c = free ligand concentration at equilibrium; K = equilibrium association constant; and n = number of ligand binding sites per receptor molecule. By graphical analysis, r/c is plotted on the Y-axis versus r on the X-axis, thus producing a Scatchard plot. Antibody affinity measurement by Scatchard analysis is well known in the art. See, e.g., van Erp et al., J. Immunoassay 12: 425-43, 1991 ; Nelson and Griswold, Comput. Methods Programs Biomed. 27: 65-8, 1988.
[0086] The term "epitope" refers to an antigenic determinant capable of specific binding to an antibody. Epitopes usually consist of chemically active surface groupings of molecules such as amino acids or sugar side chains and usually have specific three dimensional structural
characteristics, as well as specific charge characteristics. Conformational and
nonconformational epitopes are distinguished in that the binding to the former but not the latter is lost in the presence of denaturing solvents.
[0087] Numerous publications discuss the use of phage display technology to produce and screen libraries of polypeptides for binding to a selected analyte. See, e.g, Cwirla et al., Proc. Natl. Acad. Sci. USA 87, 6378-82, 1990; Devlin et al, Science 249, 404-6, 1990, Scott and Smith, Science 249, 386-88, 1990; and Ladner et al, U.S. Pat. No. 5,571,698. A basic concept of phage display methods is the establishment of a physical association between DNA encoding a polypeptide to be screened and the polypeptide. This physical association is provided by the phage particle, which displays a polypeptide as part of a capsid enclosing the phage genome which encodes the polypeptide. The establishment of a physical association between polypeptides and their genetic material allows simultaneous mass screening of very large numbers of phage bearing different polypeptides. Phage displaying a polypeptide with affinity to a target bind to the target and these phage are enriched by affinity screening to the target. The identity of polypeptides displayed from these phage can be determined from their respective genomes. Using these methods a polypeptide identified as having a binding affinity for a desired target can then be synthesized in bulk by conventional means. See, e.g., U.S. Patent No. 6,057,098, which is hereby incorporated in its entirety, including all tables, figures, and claims.
[0088] The antibodies that are generated by these methods may then be selected by first screening for affinity and specificity with the purified polypeptide of interest and, if required, comparing the results to the affinity and specificity of the antibodies with polypeptides that are desired to be excluded from binding. The screening procedure can involve immobilization of the purified polypeptides in separate wells of microtiter plates. The solution containing a potential antibody or groups of antibodies is then placed into the respective microtiter wells and incubated for about 30 min to 2 h. The microtiter wells are then washed and a labeled secondary antibody (for example, an anti-mouse antibody conjugated to alkaline phosphatase if the raised antibodies are mouse antibodies) is added to the wells and incubated for about 30 min and then washed. Substrate is added to the wells and a color reaction will appear where antibody to the immobilized polypeptide(s) are present.
[0089] The antibodies so identified may then be further analyzed for affinity and specificity in the assay design selected. In the development of immunoassays for a target protein, the purified target protein acts as a standard with which to judge the sensitivity and specificity of the immunoassay using the antibodies that have been selected. Because the binding affinity of
various antibodies may differ; certain antibody pairs (e.g., in sandwich assays) may interfere with one another sterically, etc., assay performance of an antibody may be a more important measure than absolute affinity and specificity of an antibody.
[0090] Assay Correlations
[0091] The term "correlating" as used herein in reference to the use of biomarkers refers to comparing the presence or amount of the biomarker(s) in a patient to its presence or amount in persons known to suffer from, or known to be at risk of, a given condition; or in persons known to be free of a given condition. Often, this takes the form of comparing an assay result in the form of a biomarker concentration to a predetermined threshold selected to be indicative of the occurrence or nonoccurrence of a disease or the likelihood of some future outcome.
[0092] Selecting a diagnostic threshold involves, among other things, consideration of the probability of disease, distribution of true and false diagnoses at different test thresholds, and estimates of the consequences of treatment (or a failure to treat) based on the diagnosis. For example, when considering administering a specific therapy which is highly efficacious and has a low level of risk, few tests are needed because clinicians can accept substantial diagnostic uncertainty. On the other hand, in situations where treatment options are less effective and more risky, clinicians often need a higher degree of diagnostic certainty. Thus, cost/benefit analysis is involved in selecting a diagnostic threshold.
[0093] Suitable thresholds may be determined in a variety of ways. For example, one recommended diagnostic threshold for the diagnosis of acute myocardial infarction using cardiac troponin is the 97.5th percentile of the concentration seen in a normal population.
Another method may be to look at serial samples from the same patient, where a prior
"baseline" result is used to monitor for temporal changes in a biomarker level.
[0094] Population studies may also be used to select a decision threshold. Reciever
Operating Characteristic ("ROC") arose from the field of signal dectection therory developed during World War II for the analysis of radar images, and ROC analysis is often used to select a threshold able to best distinguish a "diseased" subpopulation from a "nondiseased"
subpopulation. A false positive in this case occurs when the person tests positive, but actually does not have the disease. A false negative, on the other hand, occurs when the person tests negative, suggesting they are healthy, when they actually do have the disease. To draw a ROC curve, the true positive rate (TPR) and false positive rate (FPR) are determined as the decision threshold is varied continuously. Since TPR is equivalent with sensitivity and FPR is equal to 1
- specificity, the ROC graph is sometimes called the sensitivity vs (1 - specificity) plot. A perfect test will have an area under the ROC curve of 1.0; a random test will have an area of 0.5. A threshold is selected to provide an acceptable level of specificity and sensitivity.
[0095] In this context, "diseased" is meant to refer to a population having one characteristic (the presence of a disease or condition or the occurrence of some outcome) and "nondiseased" is meant to refer to a population lacking the characteristic. While a single decision threshold is the simplest application of such a method, multiple decision thresholds may be used. For example, below a first threshold, the absence of disease may be assigned with relatively high confidence, and above a second threshold the presence of disease may also be assigned with relatively high confidence. Between the two thresholds may be considered indeterminate. This is meant to be exemplary in nature only.
[0096] In addition to threshold comparisons, other methods for correlating assay results to a patient classification (occurrence or nonoccurrence of disease, likelihood of an outcome, etc.) include decision trees, rule sets, Bayesian methods, and neural network methods. These methods can produce probability values representing the degree to which a subject belongs to one classification out of a plurality of classifications.
[0097] Measures of test accuracy may be obtained as described in Fischer et ah, Intensive Care Med. 29: 1043-51, 2003, and used to determine the effectiveness of a given biomarker. These measures include sensitivity and specificity, predictive values, likelihood ratios, diagnostic odds ratios, and ROC curve areas. The area under the curve ("AUC") of a ROC plot is equal to the probability that a classifier will rank a randomly chosen positive instance higher than a randomly chosen negative one. The area under the ROC curve may be thought of as equivalent to the Mann- Whitney U test, which tests for the median difference between scores obtained in the two groups considered if the groups are of continuous data, or to the Wilcoxon test of ranks.
[0098] As discussed above, suitable tests may exhibit one or more of the following results on these various measures: a specificity of greater than 0.5, preferably at least 0.6, more preferably at least 0.7, still more preferably at least 0.8, even more preferably at least 0.9 and most preferably at least 0.95, with a corresponding sensitivity greater than 0.2, preferably greater than 0.3, more preferably greater than 0.4, still more preferably at least 0.5, even more preferably 0.6, yet more preferably greater than 0.7, still more preferably greater than 0.8, more preferably greater than 0.9, and most preferably greater than 0.95; a sensitivity of greater than
0.5, preferably at least 0.6, more preferably at least 0.7, still more preferably at least 0.8, even more preferably at least 0.9 and most preferably at least 0.95, with a corresponding specificity greater than 0.2, preferably greater than 0.3, more preferably greater than 0.4, still more preferably at least 0.5, even more preferably 0.6, yet more preferably greater than 0.7, still more preferably greater than 0.8, more preferably greater than 0.9, and most preferably greater than
0.95; at least 75% sensitivity, combined with at least 75% specificity; a ROC curve area of greater than 0.5, preferably at least 0.6, more preferably 0.7, still more preferably at least 0.8, even more preferably at least 0.9, and most preferably at least 0.95; an odds ratio different from
1, preferably at least about 2 or more or about 0.5 or less, more preferably at least about 3 or more or about 0.33 or less, still more preferably at least about 4 or more or about 0.25 or less, even more preferably at least about 5 or more or about 0.2 or less, and most preferably at least about 10 or more or about 0.1 or less; a positive likelihood ratio (calculated as sensitivity/(l- specificity)) of greater than 1, at least 2, more preferably at least 3, still more preferably at least 5, and most preferably at least 10; and or a negative likelihood ratio (calculated as (1- sensitivity)/specificity) of less than 1, less than or equal to 0.5, more preferably less than or equal to 0.3, and most preferably less than or equal to 0.1
[0099] Additional clinical indicia may be combined with the kidney injury marker assay result(s) of the present invention. These include other biomarkers related to renal status.
Examples include the following, which recite the common biomarker name, followed by the Swiss-Prot entry number for that biomarker or its parent: Actin (P68133); Adenosine deaminase binding protein (DPP4, P27487); Alpha-l-acid glycoprotein 1 (P02763); Alpha-1- microglobulin (P02760); Albumin (P02768); Angiotensinogenase (Renin, P00797); Annexin A2 (P07355); Beta-glucuronidase (P08236); B-2-microglobulin (P61769); Beta-galactosidase (P16278); BMP-7 (P18075); Brain natriuretic peptide (proBNP, BNP-32, NTproBNP; P16860); Calcium-binding protein Beta (S lOO-beta, P04271); Carbonic anhydrase 9 (Q16790); Casein Kinase 2 (P68400); Clusterin (P10909); Complement C3 (P01024); Cysteine-rich protein (CYR61, 000622); Cytochrome C (P99999); Epidermal growth factor (EGF, P01133);
Endothelin-1 (P05305); Exosomal Fetuin-A (P02765); Fatty acid-binding protein, heart (FABP3, P05413); Fatty acid-binding protein, liver (P07148); Ferritin (light chain, P02792; heavy chain P02794); Fructose- 1,6-biphosphatase (P09467); GRO-alpha (CXCL1, (P09341); Growth Hormone (P01241); Hepatocyte growth factor (PI 4210); Insulin-like growth factor I (P05019); Immunoglobulin G; Immunoglobulin Light Chains (Kappa and Lambda); Interferon gamma (P01579); Lysozyme (P61626); Interleukin-1 alpha (P01583); Interleukin-2 (P60568);
Interleukin-4 (P05112); Interleukin-9 (P15248); Interleukin-12p40 (P29460); Interleukin-13 (P35225); Interleukin-16 (Q14005); LI cell adhesion molecule (P32004); Lactate
dehydrogenase (P00338); Leucine Aminopeptidase (P28838); Meprin A-alpha subunit
(Q16819); Meprin A-beta subunit (Q16820); Midkine (P21741); MJP2-alpha (CXCL2, P19875); MMP-2 (P08253); MMP-9 (P14780); Netrin-1 (095631); Neutral endopeptidase (P08473); Osteopontin (P10451); Renal papillary antigen 1 (RPAl); Renal papillary antigen 2 (RPA2); Retinol binding protein (P09455); Ribonuclease; S 100 calcium-binding protein A6 (P06703); Serum Amyloid P Component (P02743); Sodium/Hydrogen exchanger isoform (NHE3, P48764); Spermidine/spermine Nl-acetyltransferase (P21673); TGF-Betal (P01137); Transferrin (P02787); Trefoil factor 3 (TFF3, Q07654); Toll-Like protein 4 (000206); Total protein; Tubulointerstitial nephritis antigen (Q9UJW2); Uromodulin (Tamm-Horsfall protein, P07911).
[00100] For purposes of risk stratification, Adiponectin (Q15848); Alkaline phosphatase (P05186); Aminopeptidase N (P15144); CalbindinD28k (P05937); Cystatin C (P01034); 8 subunit of FIFO ATPase (P03928); Gamma-glutamyltransferase (P19440); GSTa (alpha- glutathione-S-transferase, P08263); GSTpi (Glutathione-S -transferase P; GST class-pi;
P09211); IGFBP-1 (P08833); IGFBP-2 (P18065); IGFBP-6 (P24592); Integral membrane protein 1 (Itml, P46977); Interleukin-6 (P05231); Interleukin-8 (P10145); Interleukin-18 (Q14116); IP-10 (10 kDa interferon-gamma-induced protein, P02778); IRPR (IFRD1,
000458); Isovaleryl-CoA dehydrogenase (IVD, P26440); I-TAC/CXCL11 (014625); Keratin 19 (P08727); Kim-1 (Hepatitis A virus cellular receptor 1, Q96D42); L-arginine:glycine amidinotransferase (P50440); Leptin (P41159); Lipocalin2 (NGAL, P80188); MCP-1
(P13500); MIG (Gamma-interferon-induced monokine Q07325); MIP-la (P10147); MIP-3a (P78556); MIP-lbeta (P13236); MIP-ld (Q16663); NAG (N-acetyl-beta-D-glucosaminidase, P54802); Organic ion transporter (OCT2, 015244); Osteoprotegerin (000300); P8 protein (060356); Plasminogen activator inhibitor 1 (PAI-1, P05121); ProANP(l-98) (P01160); Protein phosphatase 1-beta (PPI-beta, P62140); Rab GDI-beta (P50395); Renal kallikrein (P06870); RTl.B-1 (alpha) chain of the integral membrane protein (Q5Y7A8); soluble tumor necrosis factor receptor superfamily member 1 A (sTNFR-I, P19438); soluble tumor necrosis factor receptor superfamily member IB (sTNFR-II, P20333); Tissue inhibitor of metalloproteinases 3 (TIMP-3, P35625); uPAR (Q03405) may be combined with the kidney injury marker assay result(s) of the present invention.
[00101] Other clinical indicia which may be combined with the kidney injury marker assay result(s) of the present invention includes demographic information (e.g., weight, sex, age, race), medical history (e.g., family history, type of surgery, pre-existing disease such as aneurism, congestive heart failure, preeclampsia, eclampsia, diabetes mellitus, hypertension, coronary artery disease, proteinuria, renal insufficiency, or sepsis, type of toxin exposure such as NSAIDs, cyclosporines, tacrolimus, aminoglycosides, foscarnet, ethylene glycol, hemoglobin, myoglobin, ifosfamide, heavy metals, methotrexate, radiopaque contrast agents, or streptozotocin), clinical variables (e.g., blood pressure, temperature, respiration rate), risk scores (APACHE score, PREDICT score, TIMI Risk Score for UA/NSTEMI, Framingham Risk Score), a urine total protein measurement, a glomerular filtration rate, an estimated glomerular filtration rate, a urine production rate, a serum or plasma creatinine concentration, a renal papillary antigen 1 (RPA1) measurement; a renal papillary antigen 2 (RPA2)
measurement; a urine creatinine concentration, a fractional excretion of sodium, a urine sodium concentration, a urine creatinine to serum or plasma creatinine ratio, a urine specific gravity, a urine osmolality, a urine urea nitrogen to plasma urea nitrogen ratio, a plasma BUN to creatnine ratio, and/or a renal failure index calculated as urine sodium / (urine creatinine / plasma creatinine). Other measures of renal function which may be combined with the kidney injury marker assay result(s) are described hereinafter and in Harrison' s Principles of Internal Medicine, 17th Ed., McGraw Hill, New York, pages 1741-1830, and Current Medical Diagnosis & Treatment 2008, 47th Ed, McGraw Hill, New York, pages 785-815, each of which are hereby incorporated by reference in their entirety.
[00102] Combining assay results/clinical indicia in this manner can comprise the use of multivariate logistical regression, loglinear modeling, neural network analysis, n-of-m analysis, decision tree analysis, etc. This list is not meant to be limiting.
[00103] Diagnosis of Acute Renal Failure
[00104] As noted above, the terms "acute renal (or kidney) injury" and "acute renal (or kidney) failure" as used herein are defined in part in terms of changes in serum creatinine from a baseline value. Most definitions of ARF have common elements, including the use of serum creatinine and, often, urine output. Patients may present with renal dysfunction without an available baseline measure of renal function for use in this comparison. In such an event, one may estimate a baseline serum creatinine value by assuming the patient initially had a normal GFR. Glomerular filtration rate (GFR) is the volume of fluid filtered from the renal (kidney) glomerular capillaries into the Bowman's capsule per unit time. Glomerular filtration rate
(GFR) can be calculated by measuring any chemical that has a steady level in the blood, and is freely filtered but neither reabsorbed nor secreted by the kidneys. GFR is typically expressed in units of ml/min:
Urine Concentration x Urine Flow
G F li—
Plasma Coiieenir atkm
[00105] By normalizing the GFR to the body surface area, a GFR of approximately 75-100 ml/min per 1.73 m2 can be assumed. The rate therefore measured is the quantity of the substance in the urine that originated from a calculable volume of blood.
[00106] There are several different techniques used to calculate or estimate the glomerular filtration rate (GFR or eGFR). In clinical practice, however, creatinine clearance is used to measure GFR. Creatinine is produced naturally by the body (creatinine is a metabolite of creatine, which is found in muscle). It is freely filtered by the glomerulus, but also actively secreted by the renal tubules in very small amounts such that creatinine clearance overestimates actual GFR by 10-20%. This margin of error is acceptable considering the ease with which creatinine clearance is measured.
[00107] Creatinine clearance (CCr) can be calculated if values for creatinine's urine concentration (U&), urine flow rate (V), and creatinine's plasma concentration (P&) are known. Since the product of urine concentration and urine flow rate yields creatinine's excretion rate, creatinine clearance is also said to be its excretion rate (U&xV) divided by its plasma concentration. This is commonly represented mathematically as:
UCr x v
1 C'r
[00108] Commonly a 24 hour urine collection is undertaken, from empty-bladder one morning to the contents of the bladder the following morning, with a comparative blood test then taken:
¾X-> x 24-hour volume
^•-C'r
X 24 X 60mm s
[00109] To allow comparison of results between people of different sizes, the CCr is often corrected for the body surface area (BSA) and expressed compared to the average sized man as
ml/min/1.73 m2. While most adults have a BSA that approaches 1.7 (1.6-1.9), extremely obese or slim patients should have their CCr corrected for their actual BSA:

[00110] The accuracy of a creatinine clearance measurement (even when collection is complete) is limited because as glomerular filtration rate (GFR) falls creatinine secretion is increased, and thus the rise in serum creatinine is less. Thus, creatinine excretion is much greater than the filtered load, resulting in a potentially large overestimation of the GFR (as much as a twofold difference). However, for clinical purposes it is important to determine whether renal function is stable or getting worse or better. This is often determined by monitoring serum creatinine alone. Like creatinine clearance, the serum creatinine will not be an accurate reflection of GFR in the non- steady- state condition of ARF. Nonetheless, the degree to which serum creatinine changes from baseline will reflect the change in GFR. Serum creatinine is readily and easily measured and it is specific for renal function.
[00111] For purposes of determining urine output on a Urine output on a mL/kg/hr basis, hourly urine collection and measurement is adequate. In the case where, for example, only a cumulative 24-h output was available and no patient weights are provided, minor modifications of the RIFLE urine output criteria have been described. For example, Bagshaw et ah, Nephrol. Dial. Transplant. 23: 1203-1210, 2008, assumes an average patient weight of 70 kg, and patients are assigned a RIFLE classification based on the following: <35 mL/h (Risk), <21 mL/h (Injury) or <4 mL/h (Failure).
[00112] Selecting a Treatment Regimen
[00113] Once a diagnosis is obtained, the clinician can readily select a treatment regimen that is compatible with the diagnosis, such as initiating renal replacement therapy, withdrawing delivery of compounds that are known to be damaging to the kidney, kidney transplantation, delaying or avoiding procedures that are known to be damaging to the kidney, modifying diuretic administration, initiating goal directed therapy, etc. The skilled artisan is aware of appropriate treatments for numerous diseases discussed in relation to the methods of diagnosis described herein. See, e.g., Merck Manual of Diagnosis and Therapy, 17th Ed. Merck Research Laboratories, Whitehouse Station, NJ, 1999. In addition, since the methods and compositions described herein provide prognostic information, the markers of the present invention may be
used to monitor a course of treatment. For example, improved or worsened prognostic state may indicate that a particular treatment is or is not efficacious.
[00114] One skilled in the art readily appreciates that the present invention is well adapted to carry out the objects and obtain the ends and advantages mentioned, as well as those inherent therein. The examples provided herein are representative of preferred embodiments, are exemplary, and are not intended as limitations on the scope of the invention.
[00115] Example 1: Contrast-induced nephropathy sample collection
[00116] The objective of this sample collection study is to collect samples of plasma and urine and clinical data from patients before and after receiving intravascular contrast media. Approximately 250 adults undergoing radiographic/angiographic procedures involving intravascular administration of iodinated contrast media are enrolled. To be enrolled in the study, each patient must meet all of the following inclusion criteria and none of the following exclusion criteria:
Inclusion Criteria males and females 18 years of age or older; undergoing a radiographic / angiographic procedure (such as a CT scan or coronary
intervention) involving the intravascular administration of contrast media; expected to be hospitalized for at least 48 hours after contrast administration. able and willing to provide written informed consent for study participation and to comply with all study procedures.
Exclusion Criteria renal transplant recipients; acutely worsening renal function prior to the contrast procedure; already receiving dialysis (either acute or chronic) or in imminent need of dialysis at enrollment; expected to undergo a major surgical procedure (such as involving cardiopulmonary bypass) or an additional imaging procedure with contrast media with significant risk for further renal insult within the 48 hrs following contrast administration;
participation in an interventional clinical study with an experimental therapy within the previous 30 days; known infection with human immunodeficiency virus (HIV) or a hepatitis virus.
[00117] Immediately prior to the first contrast administration (and after any pre-procedure hydration), an EDTA anti-coagulated blood sample (10 mL) and a urine sample (10 mL) are collected from each patient. Blood and urine samples are then collected at 4 (±0.5), 8 (±1), 24 (±2) 48 (±2), and 72 (±2) hrs following the last administration of contrast media during the index contrast procedure. Blood is collected via direct venipuncture or via other available venous access, such as an existing femoral sheath, central venous line, peripheral intravenous line or hep-lock. These study blood samples are processed to plasma at the clinical site, frozen and shipped to Astute Medical, Inc., San Diego, CA. The study urine samples are frozen and shipped to Astute Medical, Inc.
[00118] Serum creatinine is assessed at the site immediately prior to the first contrast administration (after any pre-procedure hydration) and at 4 (±0.5), 8 (±1), 24 (±2) and 48 (±2) ), and 72 (±2) hours following the last administration of contrast (ideally at the same time as the study samples are obtained). In addition, each patient's status is evaluated through day 30 with regard to additional serum and urine creatinine measurements, a need for dialysis,
hospitalization status, and adverse clinical outcomes (including mortality).
[00119] Prior to contrast administration, each patient is assigned a risk based on the following assessment: systolic blood pressure <80 mm Hg = 5 points; intra- arterial balloon pump = 5 points; congestive heart failure (Class III- IV or history of pulmonary edema) = 5 points; age >75 yrs = 4 points; hematocrit level <39% for men, <35% for women = 3 points; diabetes = 3 points; contrast media volume = 1 point for each 100 mL; serum creatinine level >1.5 g/dL = 4 points OR estimated GFR 40-60 mL/min/1.73 m2 = 2 points, 20-40 mL/min/1.73 m2 = 4 points, < 20 mL/min/1.73 m2 = 6 points. The risks assigned are as follows: risk for CIN and dialysis: 5 or less total points = risk of CIN - 7.5%, risk of dialysis - 0.04%; 6-10 total points = risk of CIN - 14%, risk of dialysis - 0.12%; 11-16 total points = risk of CIN - 26.1%, risk of dialysis - 1.09%; >16 total points = risk of CIN - 57.3%, risk of dialysis - 12.8%.
[00120] Example 2: Cardiac surgery sample collection
[00121] The objective of this sample collection study is to collect samples of plasma and urine and clinical data from patients before and after undergoing cardiovascular surgery, a procedure known to be potentially damaging to kidney function. Approximately 900 adults
undergoing such surgery are enrolled. To be enrolled in the study, each patient must meet all of the following inclusion criteria and none of the following exclusion criteria:
Inclusion Criteria males and females 18 years of age or older; undergoing cardiovascular surgery;
Toronto/Ottawa Predictive Risk Index for Renal Replacement risk score of at least 2
(Wijeysundera et al, JAMA 297: 1801-9, 2007); and able and willing to provide written informed consent for study participation and to comply with all study procedures.
Exclusion Criteria known pregnancy; previous renal transplantation; acutely worsening renal function prior to enrollment (e.g., any category of RIFLE criteria); already receiving dialysis (either acute or chronic) or in imminent need of dialysis at enrollment; currently enrolled in another clinical study or expected to be enrolled in another clinical study within 7 days of cardiac surgery that involves drug infusion or a therapeutic intervention for AKI; known infection with human immunodeficiency virus (HIV) or a hepatitis virus.
[00122] Within 3 hours prior to the first incision (and after any pre -procedure hydration), an EDTA anti-coagulated blood sample (10 mL), whole blood (3 mL), and a urine sample (35 mL) are collected from each patient. Blood and urine samples are then collected at 3 (±0.5), 6 (±0.5), 12 (±1), 24 (±2) and 48 (±2) hrs following the procedure and then daily on days 3 through 7 if the subject remains in the hospital. Blood is collected via direct venipuncture or via other available venous access, such as an existing femoral sheath, central venous line, peripheral intravenous line or hep-lock. These study blood samples are frozen and shipped to Astute Medical, Inc., San Diego, CA. The study urine samples are frozen and shipped to Astute Medical, Inc.
[00123] Example 3: Acutely ill subject sample collection
[00124] The objective of this study is to collect samples from acutely ill patients.
Approximately 2200 adults expected to be in the ICU for at least 48 hours will be enrolled. To be enrolled in the study, each patient must meet all of the following inclusion criteria and none of the following exclusion criteria:
Inclusion Criteria males and females 18 years of age or older;
Study population 1 : approximately 300 patients that have at least one of: shock (SBP < 90 mmHg and/or need for vasopressor support to maintain MAP > 60 mmHg and/or documented drop in SBP of at least 40 mmHg); and sepsis;
Study population 2: approximately 300 patients that have at least one of:
IV antibiotics ordered in computerized physician order entry (CPOE) within 24 hours of enrollment; contrast media exposure within 24 hours of enrollment; increased Intra- Abdominal Pressure with acute decompensated heart failure; and severe trauma as the primary reason for ICU admission and likely to be hospitalized in the ICU for 48 hours after enrollment;
Study population 3: approximately 300 patients expected to be hospitalized through acute care setting (ICU or ED) with a known risk factor for acute renal injury (e.g. sepsis,
hypotension/shock (Shock = systolic BP < 90 mmHg and/or the need for vasopressor support to maintain a MAP > 60 mmHg and/or a documented drop in SBP > 40 mmHg), major trauma, hemorrhage, or major surgery); and/or expected to be hospitalized to the ICU for at least 24 hours after enrollment;
Study population 4: approximately 1000 patients that are 21 years of age or older, within 24 hours of being admitted into the ICU, expected to have an indwelling urinary catheter for at least 48 hours after enrollment, and have at least one of the following acute conditions within 24 hours prior to enrollment:
(i) respiratory SOFA score of > 2 (Pa02/Fi02 <300), (ii) cardiovascular SOFA score of > 1 (MAP < 70 mm Hg and/or any vasopressor required).
Study population 5: approximately 300 patients that are 21 years of age or older, receiving care in the ICU, have an indwelling urinary catheter as standard care at the time of enrollment, have acute kidney injury (KDIGO stage 2 or stage 3) at the time of the first sample collection, and have their first sample collected within 36 hours of meeting KDIGO stage 2 criteria
Exclusion Criteria known pregnancy; prisoners or institutionalized individuals; previous renal transplantation; comfort-measures-only status for study population 5; known acutely worsening renal function prior to enrollment (e.g., any category of RIFLE criteria) for study populations 1, 2, 3, and 4; received dialysis (either acute or chronic) within 5 days prior to enrollment or in imminent need of dialysis at the time of enrollment; known infection with human immunodeficiency virus (HIV) or a hepatitis virus; meets any of the following in study populations 4 and 5:
(i) active bleeding with an anticipated need for > 4 units PRBC in a day;
(ii) hemoglobin < 7 g/dL;
(iii) any other condition that in the physician's opinion would contraindicate drawing serial blood samples for clinical study purposes; meets only the SBP < 90 mmHg inclusion criterion set forth above, and does not have shock in the attending physician's or principal investigator's opinion.
[00125] After obtaining informed consent, an EDTA anti-coagulated blood sample (10 mL) and a urine sample (25-50 mL) are collected from each patient. Blood and urine samples are then collected at 4 (+ 0.5) and 8 (+ 1) hours after contrast administration (if applicable); at 12 (± 1), 24 (± 2), 36 (± 2), 48 (± 2), 60 (± 2), 72 (± 2), and 84 (± 2) hours after enrollment, and thereafter daily up to day 7 to day 14 while the subject is hospitalized. Blood is collected via direct venipuncture or via other available venous access, such as an existing femoral sheath, central venous line, peripheral intravenous line or hep-lock. These study blood samples are
processed to plasma at the clinical site, frozen and shipped to Astute Medical, Inc., San Diego, CA. The study urine samples are frozen and shipped to Astute Medical, Inc.
[00126] Example 4. Immunoassay format
[00127] Analytes are measured using standard sandwich enzyme immunoassay techniques. A first antibody which binds the analyte is immobilized in wells of a 96 well polystyrene microplate. Analyte standards and test samples are pipetted into the appropriate wells and any analyte present is bound by the immobilized antibody. After washing away any unbound substances, a horseradish peroxidase-conjugated second antibody which binds the analyte is added to the wells, thereby forming sandwich complexes with the analyte (if present) and the first antibody. Following a wash to remove any unbound antibody-enzyme reagent, a substrate solution comprising tetramethylbenzidine and hydrogen peroxide is added to the wells. Color develops in proportion to the amount of analyte present in the sample. The color development is stopped and the intensity of the color is measured at 540 nm or 570 nm. An analyte
concentration is assigned to the test sample by comparison to a standard curve determined from the analyte standards.
[00128] Table of Swiss-Prot numbers, preferred names and units for the analytes in the examples below.

[00129] Example 5. Apparently Healthy Donor and Chronic Disease Patient Samples
[00130] Human urine samples from donors with no known chronic or acute disease
("Apparently Healthy Donors") were purchased from two vendors (Golden West Biologicals, Inc., 27625 Commerce Center Dr., Temecula, CA 92590 and Virginia Medical Research, Inc., 915 First Colonial Rd., Virginia Beach, VA 23454). The urine samples were shipped and stored frozen at less than -20° C. The vendors supplied demographic information for the individual donors including gender, race (Black /White), smoking status and age.
[00131] Human urine samples from donors with various chronic diseases ("Chronic Disease Patients") including congestive heart failure, coronary artery disease, chronic kidney disease, chronic obstructive pulmonary disease, diabetes mellitus and hypertension were purchased from Virginia Medical Research, Inc., 915 First Colonial Rd., Virginia Beach, VA 23454. The urine samples were shipped and stored frozen at less than -20 degrees centigrade. The vendor provided a case report form for each individual donor with age, gender, race (Black/White), smoking status and alcohol use, height, weight, chronic disease(s) diagnosis, current medications and previous surgeries.
[00132] Example 6. Use of Metalloproteinase inhibitor 1 for evaluating renal status in patients admitted to the ICU: Recovery to RIFLE 0 from RIFLE I and F
[00133] Patients from the intensive care unit (ICU) with RIFLE stage of injury (I) or failure (F) are enrolled in the following study. EDTA anti-coagulated blood samples (10 mL) and urine samples (50 mL) are collected from each patient at enrollment, and at every 12 hours up to day 3, and then every 24 hours thereafter up to day 7 while the subject is hospitalized.
Metalloproteinase inhibitor 1 is measured in the enrollment samples by standard immunoassay methods using commercially available assay reagents.
[00134] Kidney status is assessed by RIFLE criteria based on serum creatinine, urine output, or both serum creatinine and urine output. Two cohorts are defined to represent a "recovered" and a "non-recovered" population. "Recovered" indicates those patients whose maximum RIFLE stage during a period of 24, 48 or 72 hours is non-injury (RIFLE 0) where the recovery period can start from the time of sample collection to 24, 48, 72, 96 or 168 hours after sample collection. "Non-recovered" indicates those patients whose maximum RIFLE stage during a period of 24, 48 or 72 hours is risk of injury (R), injury (I) or failure (F) where the recovery period can start from the time of sample collection to 24, 48, 72, 96 or 168 hours after sample collection. If a patient dies or is placed on renal replacement therapy (RRT) at any time from sample collection to 24, 48, 72, 96 or 168 hours after sample collection, the patient is considered "non-recovered".
[00135] The ability to distinguish the "recovered" and "non-recovered" cohorts is determined using receiver operating characteristic (ROC) analysis.
[00136] Table 6.1: Comparison of marker levels and the area under the ROC curve (AUC) in urine samples for the "recovered" and "non-recovered" cohorts where recovery starts within
24 hours after sample collection and renal status is assessed by serum creatinine (sCr) only, urine output (UO) only, or serum creatinine or urine output RIFLE criteria.
sCr or UO

sCr only

UO only


Cutoff Quartile 2 6030 6020 6080 6030 6020 6080 6030 6020 6080
Sensitivity 82% 81 % 88% 80% 81 % 86% 79% 80% 85%
Specificity 54% 43% 34% 52% 43% 34% 54% 43% 35%
Cutoff Quartile 3 14200 14100 14200 14200 14100 14200 14200 14100 14200
Sensitivity 58% 58% 66% 56% 58% 63% 56% 58% 63%
Specificity 84% 76% 60% 87% 76% 61 % 88% 77% 63%
Cutoff Quartile 4 35900 35400 36300 35900 35400 36300 35900 35400 36300
Sensitivity 30% 31 % 35% 30% 31 % 33% 29% 31 % 33%
Specificity 98% 95% 81 % 100% 95% 82% 100% 96% 83%
OR Quartile 2 5.27 3.24 3.85 4.28 3.16 3.16 4.45 3.02 3.06 p Value 8.6E-8 3.5E-5 2.9E-5 1.1E-5 5.5E-5 7.2E-5 1.7E-5 1.4E-4 5.6E-5
Lower limit of 95%
CI 2.87 1.86 2.05 2.24 1.81 1.79 2.25 1.71 1.78
Upper limit of 95%
CI 9.67 5.64 7.24 8.21 5.53 5.57 8.78 5.32 5.28
OR Quartile 3 7.27 4.51 2.90 8.64 4.27 2.67 9.09 4.61 2.86 p Value 2.4E-7 5.1E-7 1.0E-5 2.1E-6 1.4E-6 2.6E-5 7.4E-6 1.0E-6 6.4E-6
Lower limit of 95%
CI 3.42 2.51 1.81 3.55 2.37 1.69 3.46 2.50 1.81
Upper limit of 95%
CI 15.4 8.12 4.66 21.1 7.70 4.22 23.9 8.50 4.52
OR Quartile 4 24.4 8.18 2.26 39.1 7.86 2.18 34.0 9.98 2.50 p Value 0.0017 7.8E-5 0.0021 0.010 1.1E-4 0.0033 0.014 1.5E-4 7.9E-4
Lower limit of 95%
CI 3.32 2.88 1.34 2.38 2.77 1.30 2.07 3.04 1.46
Upper limit of 95%
CI 180 23.2 3.79 642 22.3 3.66 559 32.7 4.27
[00137] Table 6.2: Comparison of marker levels and the area under the ROC curve (AUC) in urine samples for the "recovered" and "non-recovered" cohorts where recovery starts within 48 hours after sample collection and renal status is assessed by serum creatinine (sCr) only, urine output (UO) only, or serum creatinine or urine output RIFLE criteria. sCr or UO

Duration (hr) 24 48 72
Non- Non- Non-
Recovered recovered Recovered recovered Recovered recovered
Cohort Cohort Cohort Cohort Cohort Cohort
Median 8310 20500 8310 20000 8210 19800
Average 15500 35500 15700 35200 14700 35200
Stdev 21000 36300 21100 36300 19000 36400 p (t-test) 2.9E-7 6.5E-7 2.4E-7
Min 634 297 634 297 634 297
Max 116000 146000 116000 146000 110000 146000 n (Patient) 106 211 104 213 99 218 O only


Upper limit of 95%
CI 9.72 7.09 4.59 8.03 6.74 3.28 8.80 7.42 3.32
OR Quartile 4 5.62 4.77 1.58 4.55 4.60 1.39 3.86 4.83 1.68 p Value 3.7E-5 1.7E-5 0.089 3.1E-4 2.6E-5 0.21 0.0014 3.1E-5 0.046
Lower limit of 95%
CI 2.48 2.34 0.933 2.00 2.26 0.827 1.69 2.30 1.01
Upper limit of 95%
CI 12.8 9.71 2.68 10.4 9.38 2.33 8.82 10.1 2.81
[00138] Table 6.3: Comparison of marker levels and the area under the ROC curve (AUC) in urine samples for the "recovered" and "non-recovered" cohorts where recovery starts within 72 hours after sample collection and renal status is assessed by serum creatinine (sCr) only, urine output (UO) only, or serum creatinine or urine output RIFLE criteria. sCr or UO


UO only

Min 297 399 297 399 297 399
Max 146000 140000 146000 140000 127000 146000 n (Patient) 214 101 204 111 190 125

[00139] Table 6.4: Comparison of marker levels and the area under the ROC curve (AUC) in urine samples for the "recovered" and "non-recovered" cohorts where recovery starts within 96 hours after sample collection and renal status is assessed by serum creatinine (sCr) only, urine output (UO) only, or serum creatinine or urine output RIFLE criteria. sCr or UO
 Cohort recovered Cohort recovered Cohort recovered
Cohort Cohort Cohort
Median 8180 22000 8150 21100 7940 20000
Average 15800 38300 16200 37000 16600 35700
Stdev 21300 37200 21900 36900 22700 36300 p (t-test) 1.1E-9 2.9E-8 6.2E-7
Min 419 297 419 297 419 297
Max 111000 146000 111000 146000 111000 146000 n (Patient) 134 183 125 192 114 203 sCr only
Recovery Period
Duration (hr) 24 48 72
Non- Non- Non-
Recovered recovered Recovered recovered Recovered recovered Cohort Cohort Cohort Cohort Cohort Cohort
Median 8710 21900 8740 21300 8730 21600
Average 17200 38000 17400 37700 16600 37900
Stdev 22900 37300 23000 37200 21600 37500 p (t-test) 1.6E-8 4.2E-8 9.3E-9
Min 419 297 419 297 419 297
Max 116000 146000 116000 146000 111000 146000 n (Patient) 140 177 138 179 135 182
UO only
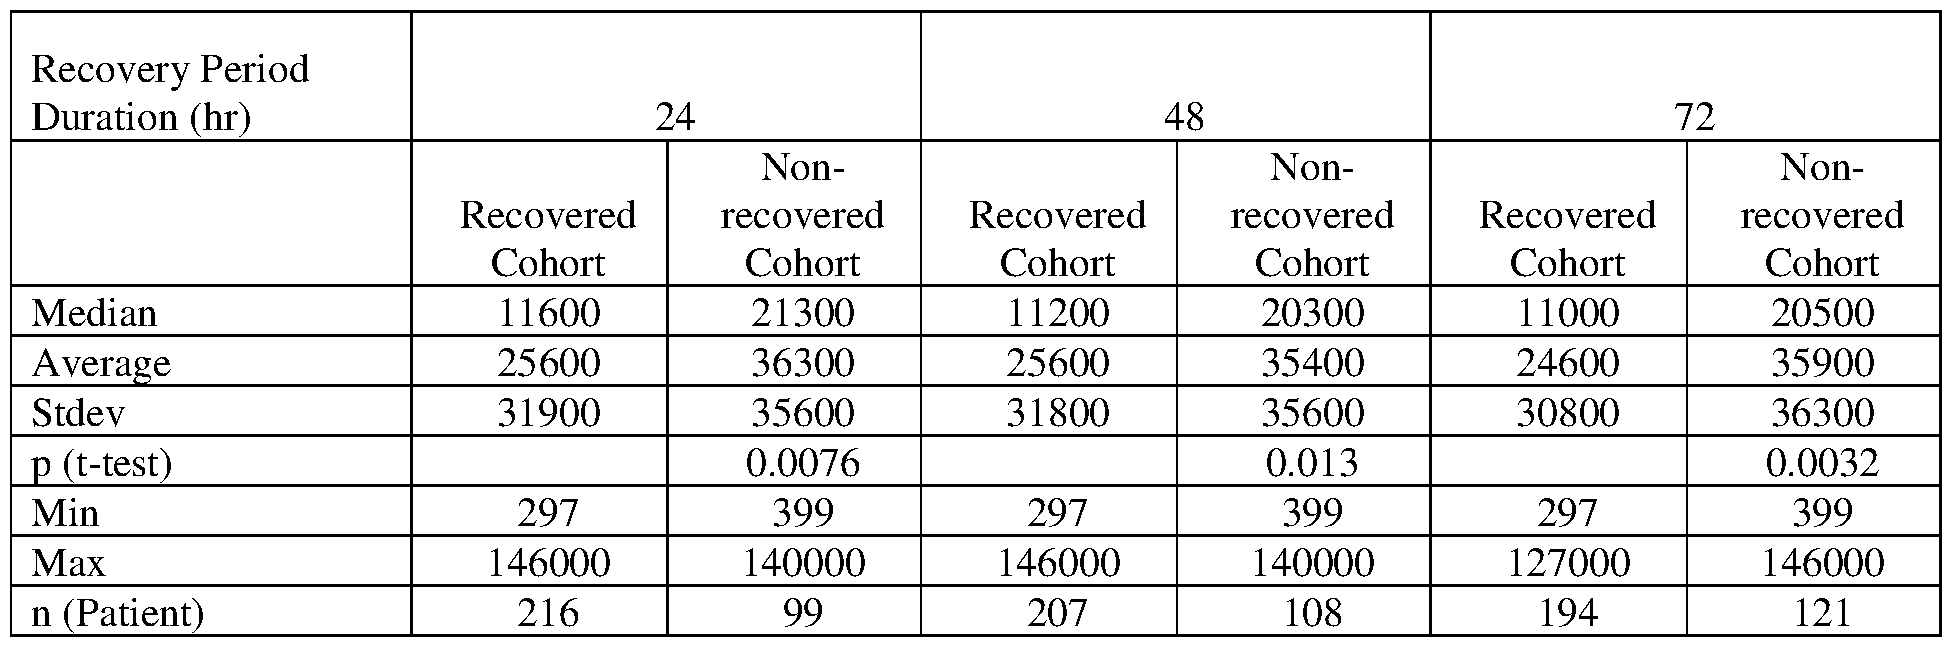

Cutoff Quartile 4 35900 35900 36300 35900 35900 36300 35900 35900 36300
Sensitivity 37% 36% 33% 35% 36% 31 % 33% 36% 33%
Specificity 90% 89% 79% 90% 88% 78% 89% 89% 80%
OR Quartile 2 5.42 4.46 3.26 4.70 4.28 3.42 4.35 4.19 2.87 p Value 3.8E-9 1.2E-7 5.3E-4 2.6E-8 2.1E-7 2.0E-4 7.9E-8 2.6E-7 5.1E-4
Lower limit of 95%
CI 3.09 2.57 1.67 2.73 2.47 1.79 2.54 2.43 1.58
Upper limit of 95%
CI 9.50 7.76 6.36 8.10 7.41 6.55 7.43 7.22 5.21
OR Quartile 3 5.24 4.29 2.53 4.41 4.07 2.21 4.28 4.23 2.31 p Value 2.8E-11 1.8E-9 2.4E-4 2.3E-9 6.2E-9 0.0011 1.0E-8 3.1E-9 4.4E-4
Lower limit of 95%
CI 3.22 2.67 1.54 2.71 2.53 1.37 2.60 2.62 1.45
Upper limit of 95%
CI 8.54 6.89 4.15 7.17 6.53 3.56 7.04 6.81 3.68
OR Quartile 4 5.38 4.39 1.85 4.62 4.24 1.65 3.83 4.44 1.96 p Value 3.4E-7 1.6E-6 0.023 3.5E-6 2.7E-6 0.060 4.8E-5 2.1E-6 0.011
Lower limit of 95%
CI 2.82 2.40 1.09 2.42 2.32 0.980 2.00 2.40 1.17
Upper limit of 95%
CI 10.3 8.03 3.14 8.81 7.76 2.79 7.31 8.23 3.29
[00140] Table 6.5: Comparison of marker levels and the area under the ROC curve (AUC) in urine samples for the "recovered" and "non-recovered" cohorts where recovery starts within 168 hours after sample collection and renal status is assessed by serum creatinine (sCr) only, urine output (UO) only, or serum creatinine or urine output RIFLE criteria.
sCr or UO

sCr only

Recovery Period
Duration (hr) 24 48 72
Non- Non- Non-
Recovered recovered Recovered recovered Recovered recovered Cohort Cohort Cohort Cohort Cohort Cohort
Median 11300 21500 11600 20800 11300 21100
Average 24300 38300 24500 37500 24500 37300
Stdev 29900 38000 30100 37800 30200 37400 p (t-test) 4.4E-4 0.0010 0.0012
Min 297 399 297 399 297 399
Max 127000 146000 127000 146000 127000 146000 n (Patient) 211 104 208 107 205 110

sCr or UO

sCr only

UO only


SE 0.032 0.031 0.031 0.032 0.031 0.030 0.034 0.032 0.030 p Value 7.8E-14 4.5E-13 8.1E-8 0 3.7E-14 5.0E-10 6.9E-15 1.3E-11 3.1E-9 nCohort Recovered 52 69 197 42 67 176 38 63 159 nCohort Non- recovered 275 257 128 285 259 149 289 263 166
Cutoff Quartile 2 260000 260000 262000 260000 260000 262000 260000 260000 262000
Sensitivity 80% 82% 84% 80% 82% 85% 79% 81 % 85%
Specificity 52% 51 % 31 % 57% 52% 33% 58% 51 % 35%
Cutoff Quartile 3 437000 433000 437000 437000 433000 437000 437000 433000 437000
Sensitivity 56% 57% 62% 55% 57% 63% 54% 56% 60%
Specificity 81 % 75% 58% 83% 76% 61 % 82% 75% 60%
Cutoff Quartile 4 707000 704000 708000 707000 704000 708000 707000 704000 708000
Sensitivity 28% 29% 41 % 28% 29% 40% 28% 29% 37%
Specificity 92% 88% 85% 98% 90% 88% 97% 89% 87%
OR Quartile 2 4.32 4.60 2.42 5.22 4.93 2.69 5.25 4.40 3.07 p Value 3.6E-6 1.4E-7 0.0021 1.7E-6 5.1E-8 3.6E-4 3.9E-6 6.1E-7 4.1E-5
Lower limit of 95%
CI 2.33 2.61 1.38 2.65 2.78 1.56 2.60 2.46 1.79
Upper limit of 95%
CI 8.02 8.12 4.26 10.3 8.76 4.64 10.6 7.87 5.24
OR Quartile 3 5.35 4.02 2.29 6.13 4.18 2.65 5.27 3.72 2.19 p Value 6.7E-6 5.6E-6 3.7E-4 2.6E-5 4.8E-6 2.2E-5 1.3E-4 3.0E-5 5.2E-4
Lower limit of 95%
CI 2.58 2.21 1.45 2.64 2.27 1.69 2.25 2.01 1.41
Upper limit of 95%
CI 11.1 7.34 3.61 14.3 7.72 4.16 12.4 6.90 3.42
OR Quartile 4 4.75 3.08 4.09 16.3 3.49 4.72 14.4 3.19 4.14 p Value 0.0037 0.0049 1.7E-7 0.0063 0.0030 4.0E-8 0.0090 0.0061 8.0E-7
Lower limit of 95%
CI 1.66 1.41 2.41 2.20 1.53 2.71 1.94 1.39 2.36
Upper limit of 95%
CI 13.6 6.76 6.94 120 7.99 8.21 107 7.32 7.29
[00142] Table 6.7: Comparison of marker levels and the area under the ROC curve (AUC) in EDTA samples for the "recovered" and "non-recovered" cohorts where recovery starts within 48 hours after sample collection and renal status is assessed by serum creatinine (sCr) only, urine output (UO) only, or serum creatinine or urine output RIFLE criteria.
sCr or UO

sCr only
Recovery Period
Duration (hr) 24 48 72
Non- Non- Non-
Recovered recovered Recovered recovered Recovered recovered
Cohort Cohort Cohort Cohort Cohort Cohort
Median 282000 528000 282000 528000 291000 521000
Average 380000 547000 376000 547000 382000 541000
Stdev 248000 273000 245000 273000 249000 274000 p (t-test) 3.0E-7 1.7E-7 1.8E-6
Min 66700 13600 66700 13600 66700 13600
Max 1040000 1120000 1040000 1120000 1040000 1120000 n (Patient) 101 226 99 228 94 233 O only


Upper limit of 95%
CI 5.37 4.65 3.96 4.71 4.73 3.52 4.59 4.47 2.81
OR Quartile 4 3.79 2.98 4.01 3.55 3.21 3.37 3.07 2.93 3.05 p Value 4.4E-4 9.7E-4 2.2E-7 0.0015 5.9E-4 4.6E-6 0.0051 0.0016 2.8E-5
Lower limit of 95%
CI 1.80 1.56 2.37 1.63 1.65 2.00 1.40 1.51 1.81
Upper limit of 95%
CI 7.96 5.68 6.77 7.76 6.25 5.66 6.72 5.72 5.14
[00143] Table 6.8: Comparison of marker levels and the area under the ROC curve (AUC) in EDTA samples for the "recovered" and "non-recovered" cohorts where recovery starts within 72 hours after sample collection and renal status is assessed by serum creatinine (sCr) only, urine output (UO) only, or serum creatinine or urine output RIFLE criteria.
sCr or UO


UO only

Min 13600 135000 13600 135000 13600 135000
Max 1120000 1090000 1120000 1090000 1120000 1090000 n (Patient) 219 106 208 117 193 132

[00144] Table 6.9: Comparison of marker levels and the area under the ROC curve (AUC) in EDTA samples for the "recovered" and "non-recovered" cohorts where recovery starts within 96 hours after sample collection and renal status is assessed by serum creatinine (sCr) only, urine output (UO) only, or serum creatinine or urine output RIFLE criteria.
sCr or UO
 Cohort recovered Cohort recovered Cohort recovered
Cohort Cohort Cohort
Median 296000 564000 293000 536000 279000 529000
Average 383000 573000 381000 566000 372000 561000
Stdev 232000 278000 233000 277000 236000 274000 p (t-test) 3.3E-10 1.7E-9 1.6E-9
Min 13600 105000 13600 105000 13600 105000
Max 1040000 1120000 1040000 1120000 1040000 1120000 n (Patient) 134 193 125 202 113 214 sCr only
Recovery Period
Duration (hr) 24 48 72
Non- Non- Non-
Recovered recovered Recovered recovered Recovered recovered Cohort Cohort Cohort Cohort Cohort Cohort
Median 293000 567000 289000 567000 282000 565000
Average 381000 580000 377000 581000 376000 577000
Stdev 234000 275000 231000 275000 233000 274000 p (t-test) 3.6E-11 l .OE-11 2.7E-11
Min 13600 105000 13600 105000 13600 105000
Max 1040000 1120000 1040000 1120000 1040000 1120000 n (Patient) 139 188 137 190 133 194
UO only

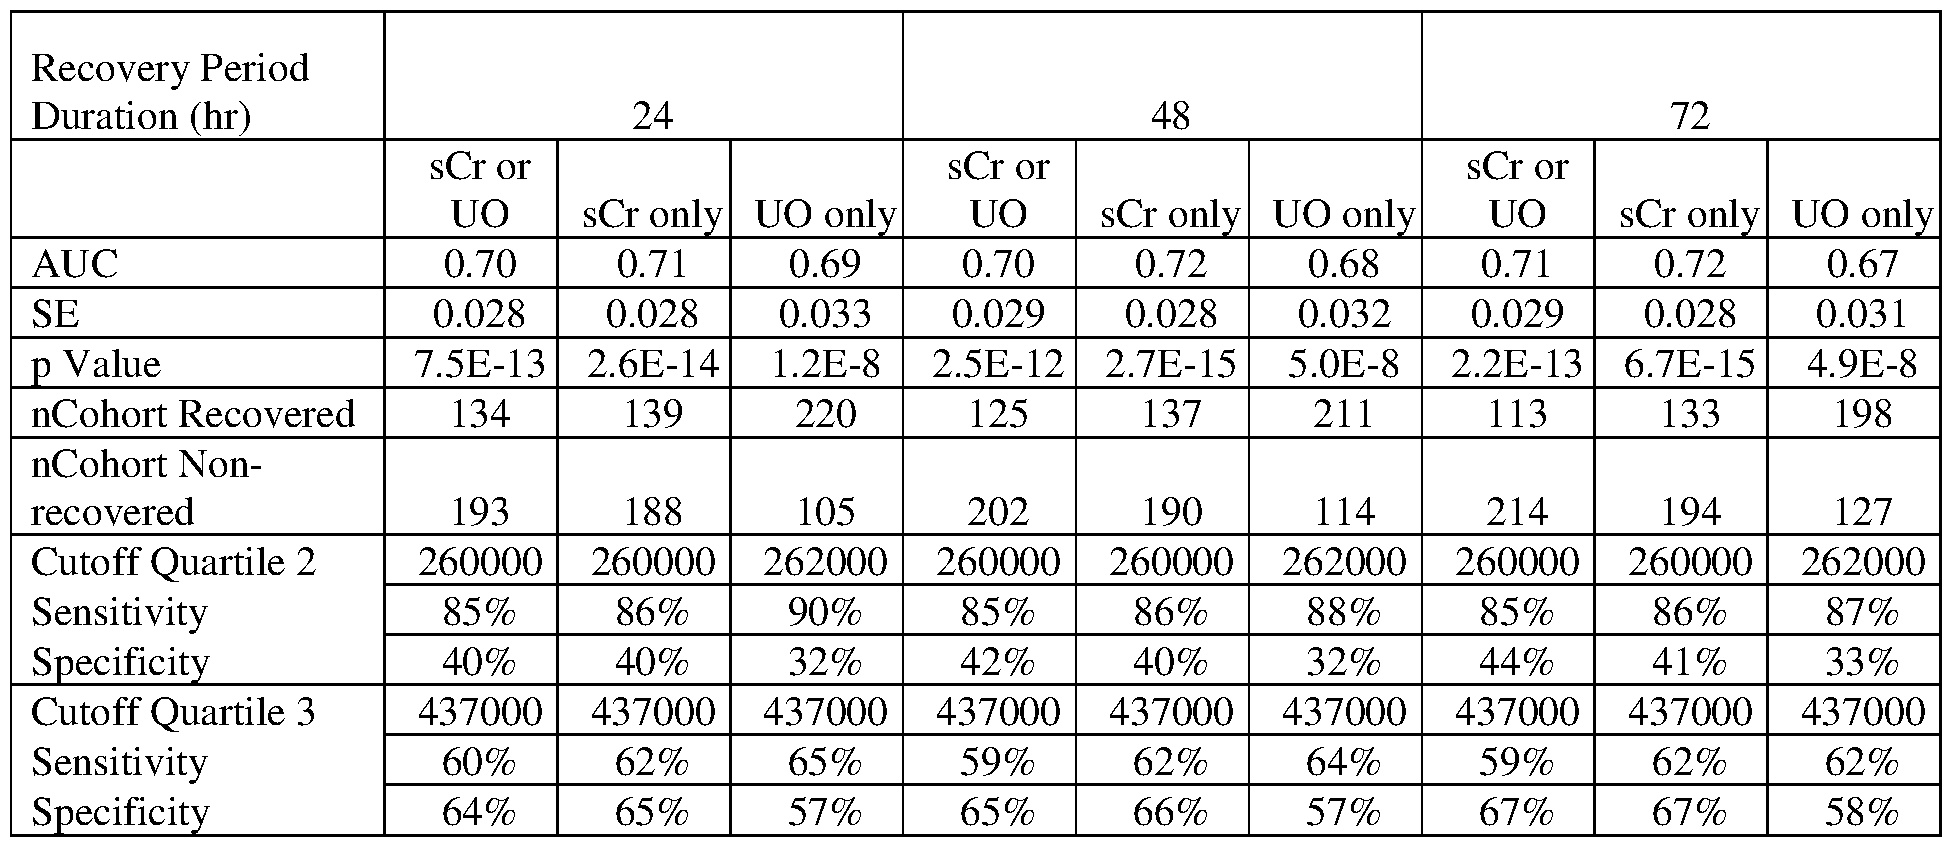
Sensitivity 35% 36% 41 % 34% 36% 40% 33% 35% 39%
Specificity 90% 89% 82% 90% 90% 83% 89% 89% 84%
OR Quartile 2 3.98 3.90 3.99 4.08 4.05 3.32 4.51 4.05 3.39 p Value 3.1E-7 4.9E-7 7.7E-5 1.6E-7 2.5E-7 1.9E-4 2.2E-8 2.2E-7 7.1E-5
Lower limit of 95%
CI 2.34 2.30 2.01 2.41 2.38 1.77 2.66 2.39 1.86
Upper limit of 95%
CI 6.75 6.64 7.92 6.91 6.89 6.24 7.65 6.88 6.19
OR Quartile 3 2.70 3.05 2.42 2.69 3.24 2.39 3.00 3.28 2.23 p Value 2.0E-5 1.7E-6 3.2E-4 2.6E-5 5.4E-7 2.7E-4 6.8E-6 5.0E-7 5.5E-4
Lower limit of 95%
CI 1.71 1.93 1.49 1.70 2.05 1.50 1.86 2.06 1.42
Upper limit of 95%
CI 4.26 4.82 3.91 4.28 5.14 3.83 4.84 5.21 3.52
OR Quartile 4 4.66 4.58 3.22 4.47 4.90 3.29 4.09 4.59 3.37 p Value 1.5E-6 1.2E-6 1.1E-5 5.1E-6 6.9E-7 6.8E-6 3.1E-5 1.9E-6 4.6E-6
Lower limit of 95%
CI 2.49 2.48 1.91 2.35 2.61 1.96 2.11 2.45 2.00
Upper limit of 95%
CI 8.73 8.45 5.42 8.51 9.17 5.52 7.94 8.59 5.66
[00145] Table 6.10: Comparison of marker levels and the area under the ROC curve (AUC) in EDTA samples for the "recovered" and "non-recovered" cohorts where recovery starts within 168 hours after sample collection and renal status is assessed by serum creatinine (sCr) only, urine output (UO) only, or serum creatinine or urine output RIFLE criteria.
sCr or UO
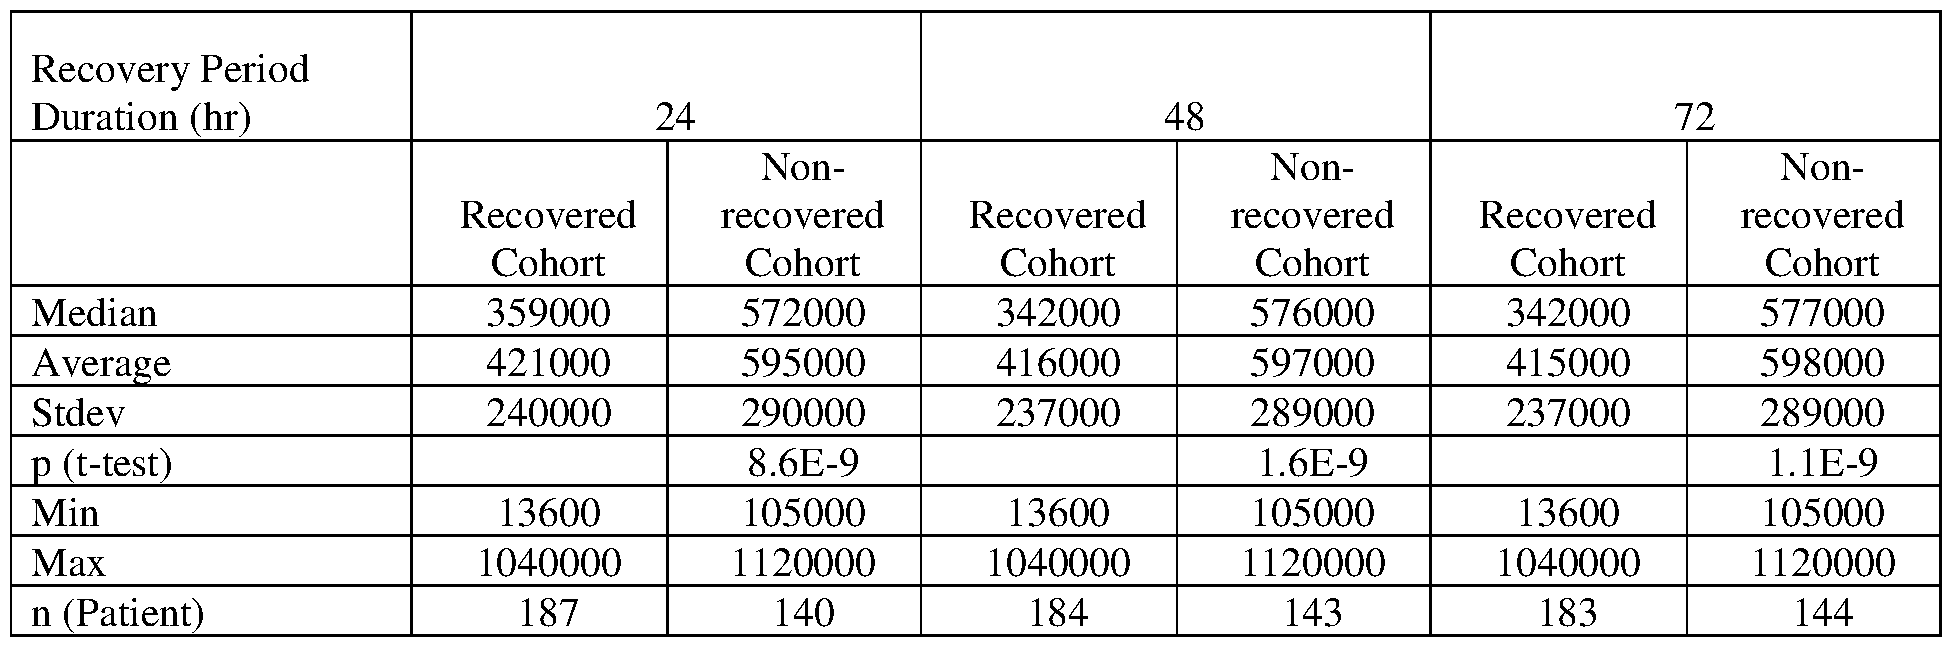
sCr only

Recovery Period
Duration (hr) 24 48 72
Non- Non- Non-
Recovered recovered Recovered recovered Recovered recovered Cohort Cohort Cohort Cohort Cohort Cohort
Median 375000 582000 369000 586000 359000 596000
Average 436000 616000 433000 617000 428000 622000
Stdev 245000 296000 243000 294000 241000 292000 p (t-test) 1.4E-8 4.2E-9 3.7E-10
Min 13600 135000 13600 135000 13600 135000
Max 1040000 1120000 1040000 1120000 1040000 1120000 n (Patient) 215 110 212 113 209 116

[00147] Patients from the intensive care unit (ICU) with RIFLE stage of injury (I) or failure (F) are enrolled in the following study. EDTA anti-coagulated blood samples (10 mL) and urine samples (50 mL) are collected from each patient at enrollment, and at every 12 hours up to day 3, and then every 24 hours thereafter up to day 7 while the subject is hospitalized.
Metalloproteinase inhibitor 1 is measured in the enrollment samples by standard immunoassay methods using commercially available assay reagents.
[00148] Kidney status is assessed by RIFLE criteria based on serum creatinine, urine output, or both serum creatinine and urine output. Two cohorts are defined to represent a "recovered" and a "non-recovered" population. "Recovered" indicates those patients whose maximum RIFLE stage during a period of 24, 48 or 72 hours is non-injury (RIFLE 0) or risk of injury (R) where the recovery period can start from the time of sample collection to 24, 48, 72, 96 or 168 hours after sample collection. "Non-recovered" indicates those patients whose maximum RIFLE stage during a period of 24, 48 or 72 hours is injury (I) or failure (F) where the recovery period can start from the time of sample collection to 24, 48, 72, 96 or 168 hours after sample collection. If a patient dies or is placed on renal replacement therapy (RRT) at any time from sample collection to 24, 48, 72, 96 or 168 hours after sample collection, the patient is considered "non-recovered".
[00149] The ability to distinguish the "recovered" and "non-recovered" cohorts is determined using receiver operating characteristic (ROC) analysis.
[00150] Table 7.1: Comparison of marker levels and the area under the ROC curve (AUC) in urine samples for the "recovered" and "non-recovered" cohorts where recovery starts within 24 hours after sample collection and renal status is assessed by serum creatinine (sCr) only, urine output (UO) only, or serum creatinine or urine output RIFLE criteria.
sCr or UO

Recovery Period
Duration (hr) 24 48 72
Non- Non- Non-
Recovered recovered Recovered recovered Recovered recovered Cohort Cohort Cohort Cohort Cohort Cohort
Median 8650 20500 8510 20500 8310 20500
Average 16400 36800 16400 36600 16500 36400
Stdev 22300 36800 22400 36700 22600 36500 p (t-test) 5.2E-8 8.5E-8 1.3E-7
Min 475 297 475 297 475 297
Max 116000 146000 116000 146000 116000 146000 n (Patient) 126 190 124 192 122 194
UO only


CI 7.87 5.76 7.65 7.99 6.00 7.33 8.15 6.24 6.03
OR Quartile 3 4.80 4.22 2.81 4.99 4.26 2.74 5.62 4.31 2.47 p Value 2.2E-9 5.6E-9 7.2E-5 1.8E-9 5.3E-9 4.8E-5 3.9E-10 4.9E-9 1.7E-4
Lower limit of 95%
CI 2.87 2.60 1.69 2.96 2.62 1.69 3.27 2.64 1.54
Upper limit of 95%
CI 8.02 6.85 4.67 8.42 6.93 4.46 9.65 7.02 3.96
OR Quartile 4 3.86 4.63 2.10 4.60 4.47 2.41 4.29 4.32 2.27 p Value 7.1E-5 3.5E-6 0.0064 2.6E-5 5.7E-6 9.9E-4 6.3E-5 9.3E-6 0.0019
Lower limit of 95%
CI 1.98 2.42 1.23 2.26 2.34 1.43 2.10 2.26 1.35
Upper limit of 95%
CI 7.51 8.84 3.59 9.38 8.54 4.07 8.74 8.26 3.82
[00151] Table 7.2: Comparison of marker levels and the area under the ROC curve (AUC) in urine samples for the "recovered" and "non-recovered" cohorts where recovery starts within 48 hours after sample collection and renal status is assessed by serum creatinine (sCr) only, urine output (UO) only, or serum creatinine or urine output RIFLE criteria.
sCr or UO


Recovered recovered Recovered recovered Recovered recovered Cohort Cohort Cohort Cohort Cohort Cohort
Median 11900 21700 11800 21300 11200 20900
Average 25200 38600 25300 37400 24900 36700
Stdev 31100 37200 31400 36500 31200 36200 p (t-test) 0.0012 0.0030 0.0029
Min 297 399 297 399 297 399
Max 146000 140000 146000 140000 146000 140000 n (Patient) 226 89 220 95 207 108

[00152] Table 7.3: Comparison of marker levels and the area under the ROC curve (AUC) in urine samples for the "recovered" and "non-recovered" cohorts where recovery starts within 72 hours after sample collection and renal status is assessed by serum creatinine (sCr) only, urine output (UO) only, or serum creatinine or urine output RIFLE criteria.
sCr or UO
 sCr only

UO only

 Sensitivity 87% 86% 88% 87% 86% 87% 86% 86% 86% Specificity 37% 35% 30% 38% 36% 30% 38% 36% 31 %
Cutoff Quartile 3 14200 14200 14200 14200 14200 14200 14200 14200 14200
Sensitivity 66% 66% 65% 65% 66% 64% 65% 65% 63%
Specificity 67% 65% 56% 66% 65% 56% 67% 65% 56%
Cutoff Quartile 4 35900 35900 36300 35900 35900 36300 35900 35900 36300
Sensitivity 37% 38% 32% 36% 38% 32% 36% 37% 32%
Specificity 87% 87% 78% 87% 87% 78% 87% 87% 78%
OR Quartile 2 3.77 3.34 3.17 3.90 3.40 2.86 3.86 3.45 2.81 p Value 2.9E-6 2.0E-5 0.0011 1.6E-6 1.6E-5 0.0021 1.5E-6 1.2E-5 0.0014
Lower limit of 95%
CI 2.16 1.92 1.59 2.24 1.95 1.46 2.23 1.98 1.49
Upper limit of 95%
CI 6.57 5.81 6.33 6.80 5.91 5.60 6.70 6.02 5.30
OR Quartile 3 3.97 3.64 2.33 3.75 3.54 2.24 3.77 3.44 2.19 p Value 7.3E-9 4.6E-8 0.0010 2.5E-8 8.4E-8 0.0016 2.4E-8 1.5E-7 0.0015
Lower limit of 95%
CI 2.49 2.29 1.41 2.36 2.23 1.36 2.36 2.17 1.35
Upper limit of 95%
CI 6.33 5.79 3.86 5.97 5.63 3.70 6.00 5.46 3.55
OR Quartile 4 3.90 4.05 1.63 3.77 3.98 1.59 3.83 3.92 1.70 p Value 2.6E-6 1.0E-6 0.078 4.5E-6 1.4E-6 0.092 4.6E-6 1.8E-6 0.048
Lower limit of 95%
CI 2.21 2.31 0.947 2.14 2.27 0.927 2.16 2.23 1.00
Upper limit of 95%
CI 6.88 7.11 2.80 6.65 6.98 2.74 6.81 6.86 2.88
[00153] Table 7.4: Comparison of marker levels and the area under the ROC curve (AUC) in urine samples for the "recovered" and "non-recovered" cohorts where recovery starts within 96 hours after sample collection and renal status is assessed by serum creatinine (sCr) only, urine output (UO) only, or serum creatinine or urine output RIFLE criteria.
sCr or UO


Stdev 24900 38400 24900 38400 25000 38300 p (t-test) 2.4E-8 3.7E-8 5.7E-8
Min 419 297 419 297 419 297
Max 116000 146000 116000 146000 116000 146000 n (Patient) 172 145 171 146 170 147 O only
Recovery Period
Duration (hr) 24 48 72
Non- Non- Non-
Recovered recovered Recovered recovered Recovered recovered Cohort Cohort Cohort Cohort Cohort Cohort
Median 11800 21500 11900 21300 11800 20500
Average 25400 37400 25500 37200 25200 37000
Stdev 31500 36500 31500 36400 31100 36700 p (t-test) 0.0036 0.0046 0.0033
Min 297 399 297 399 297 399
Max 146000 140000 146000 140000 146000 140000 n (Patient) 223 92 222 93 214 101

Upper limit of 95%
CI 6.23 6.17 3.41 5.90 6.06 3.34 5.98 5.95 3.23
[00154] Table 7.5: Comparison of marker levels and the area under the ROC curve (AUC) in urine samples for the "recovered" and "non-recovered" cohorts where recovery starts within 168 hours after sample collection and renal status is assessed by serum creatinine (sCr) only, urine output (UO) only, or serum creatinine or urine output RIFLE criteria.
sCr or UO

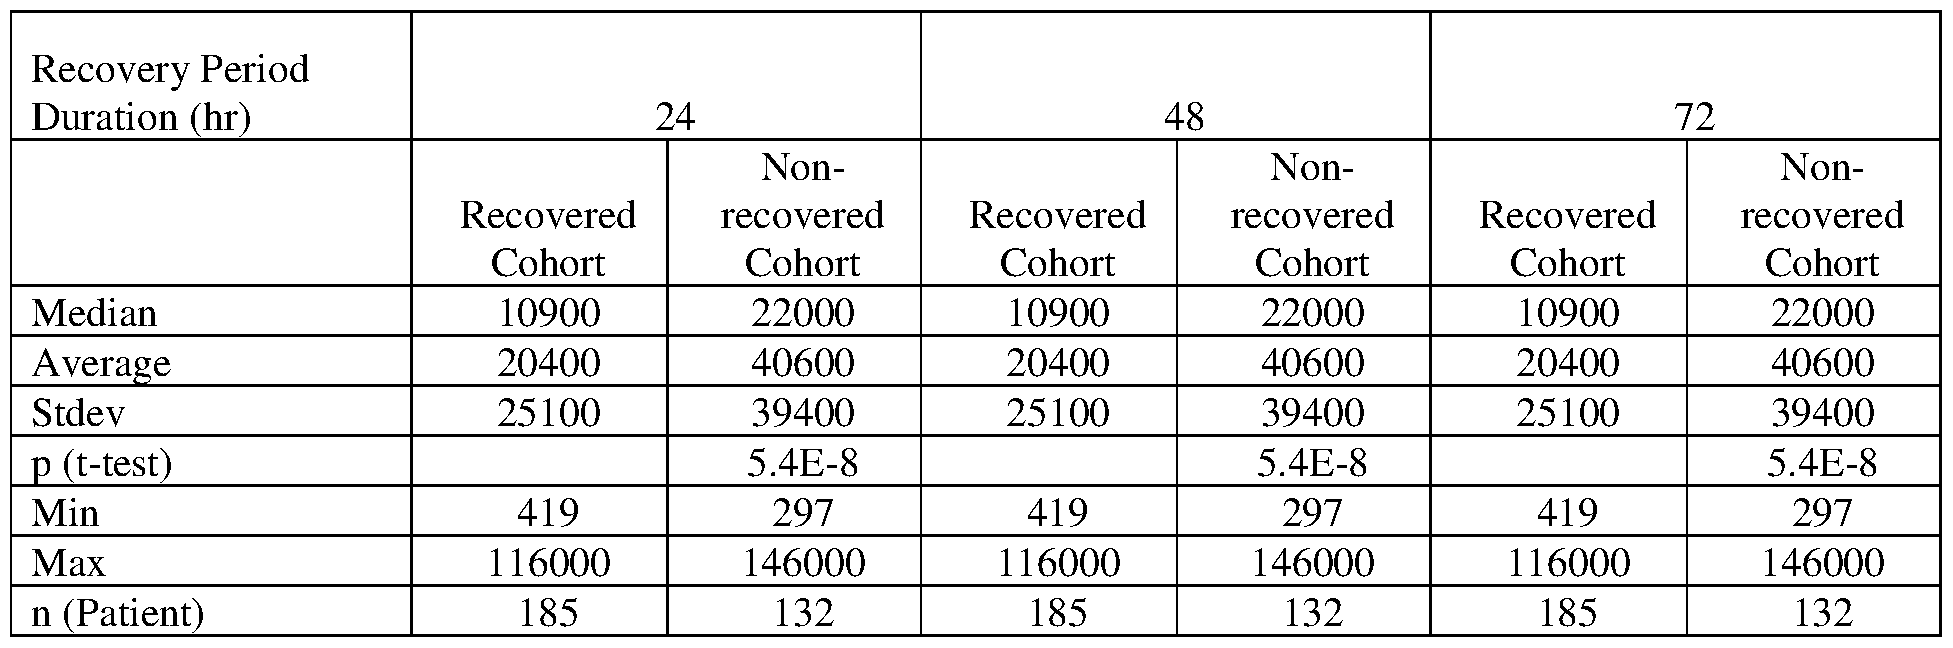
UO only

Duration (hr) 24 48 72
sCr or sCr or sCr or
UO sCr only UO only UO sCr only UO only UO sCr only UO only
AUC 0.65 0.67 0.63 0.65 0.67 0.63 0.64 0.67 0.63
SE 0.033 0.031 0.035 0.033 0.031 0.035 0.033 0.031 0.035 p Value 4.4E-6 2.0E-8 1.3E-4 8.7E-6 2.0E-8 1.5E-4 9.7E-6 2.0E-8 2.5E-4 nCohort Recovered 203 185 217 201 185 216 200 185 214 nCohort Non- recovered 114 132 98 116 132 99 117 132 101
Cutoff Quartile 2 6030 6030 6080 6030 6030 6080 6030 6030 6080
Sensitivity 86% 87% 87% 86% 87% 87% 86% 87% 87%
Specificity 31 % 34% 30% 31 % 34% 31 % 32% 34% 31 %
Cutoff Quartile 3 14200 14200 14200 14200 14200 14200 14200 14200 14200
Sensitivity 66% 65% 64% 65% 65% 64% 64% 65% 62%
Specificity 59% 61 % 56% 58% 61 % 56% 58% 61 % 56%
Cutoff Quartile 4 35900 35900 36300 35900 35900 36300 35900 35900 36300
Sensitivity 37% 39% 35% 36% 39% 34% 36% 39% 34%
Specificity 81 % 84% 79% 81 % 84% 79% 81 % 84% 79%
OR Quartile 2 2.76 3.41 2.86 2.85 3.41 2.91 2.90 3.41 3.02 p Value 0.0010 5.1E-5 0.0016 7.0E-4 5.1E-5 0.0013 5.7E-4 5.1E-5 8.7E-4
Lower limit of 95%
CI 1.50 1.88 1.49 1.56 1.88 1.52 1.58 1.88 1.57
Upper limit of 95%
CI 5.05 6.17 5.48 5.23 6.17 5.58 5.32 6.17 5.79
OR Quartile 3 2.72 2.87 2.31 2.55 2.87 2.23 2.47 2.87 2.08 p Value 3.9E-5 8.5E-6 8.6E-4 1.1E-4 8.5E-6 0.0013 1.7E-4 8.5E-6 0.0031
Lower limit of 95%
CI 1.69 1.80 1.41 1.59 1.80 1.37 1.54 1.80 1.28
Upper limit of 95%
CI 4.39 4.56 3.78 4.09 4.56 3.64 3.95 4.56 3.37
OR Quartile 4 2.53 3.39 2.03 2.43 3.39 1.99 2.39 3.39 1.91 p Value 4.5E-4 6.2E-6 0.0088 7.6E-4 6.2E-6 0.011 9.7E-4 6.2E-6 0.017
Lower limit of 95%
CI 1.51 2.00 1.20 1.45 2.00 1.17 1.42 2.00 1.12
Upper limit of 95%
CI 4.26 5.75 3.45 4.09 5.75 3.37 4.00 5.75 3.23
[00155] Table 7.6: Comparison of marker levels and the area under the ROC curve (AUC) in EDTA samples for the "recovered" and "non-recovered" cohorts where recovery starts within 24 hours after sample collection and renal status is assessed by serum creatinine (sCr) only, urine output (UO) only, or serum creatinine or urine output RIFLE criteria.
sCr or UO

Recovery Period
Duration (hr) 24 48 72
Non- Non- Non-
Recovered recovered Recovered recovered Recovered recovered Cohort Cohort Cohort Cohort Cohort Cohort
Median 279000 566000 279000 566000 275000 566000
Average 365000 569000 362000 569000 358000 570000
Stdev 235000 269000 235000 268000 232000 268000 p (t-test) 2.1E-11 1.4E-11 4.4E-12
Min 13600 105000 13600 105000 13600 105000
Max 1040000 1120000 1040000 1120000 1040000 1120000 n (Patient) 121 205 119 207 117 209
UO only


OR Quartile 3 3.81 3.84 2.50 3.78 3.89 2.41 3.92 3.94 2.26 p Value 1.8E-7 4.1E-8 2.6E-4 2.7E-7 3.8E-8 2.6E-4 2.2E-7 3.5E-8 5.1E-4
Lower limit of 95%
CI 2.31 2.38 1.53 2.28 2.40 1.50 2.34 2.42 1.43
Upper limit of 95%
CI 6.29 6.22 4.08 6.26 6.31 3.87 6.56 6.41 3.57
OR Quartile 4 5.23 4.21 3.96 4.96 4.08 3.68 6.33 4.41 3.64 p Value 1.1E-5 1.2E-5 3.3E-7 2.1E-5 1.9E-5 1.0E-6 9.5E-6 1.2E-5 1.2E-6
Lower limit of 95%
CI 2.50 2.21 2.33 2.37 2.14 2.18 2.80 2.27 2.16
Upper limit of 95%
CI 10.9 8.03 6.71 10.4 7.77 6.20 14.3 8.55 6.13
[00156] Table 7.7: Comparison of marker levels and the area under the ROC curve (AUC) in EDTA samples for the "recovered" and "non-recovered" cohorts where recovery starts within 48 hours after sample collection and renal status is assessed by serum creatinine (sCr) only, urine output (UO) only, or serum creatinine or urine output RIFLE criteria.
sCr or UO


UO only
 Cohort recovered Cohort recovered Cohort recovered
Cohort Cohort Cohort
Median 375000 598000 375000 598000 369000 596000
Average 448000 619000 443000 618000 432000 616000
Stdev 256000 287000 253000 288000 247000 288000 p (t-test) 2.5E-7 7.7E-8 4.4E-9
Min 13600 135000 13600 135000 13600 135000
Max 1120000 1090000 1120000 1090000 1120000 1090000 n (Patient) 231 94 225 100 210 115

[00157] Table 7.8: Comparison of marker levels and the area under the ROC curve (AUC) in EDTA samples for the "recovered" and "non-recovered" cohorts where recovery starts within 72 hours after sample collection and renal status is assessed by serum creatinine (sCr) only, urine output (UO) only, or serum creatinine or urine output RIFLE criteria.
sCr or UO
Recovery Period
Duration (hr) 24 48 72
Non- Non- Non-
Recovered recovered Recovered recovered Recovered recovered
Cohort Cohort Cohort Cohort Cohort Cohort
Median 303000 573000 300000 576000 296000 576000
Average 394000 586000 390000 587000 384000 587000
Stdev 239000 276000 238000 275000 232000 276000 p (t-test) l.OE-10 2.8E-11 7.0E-12
Min 13600 105000 13600 105000 13600 105000
Max 1040000 1120000 1040000 1120000 1040000 1120000 n (Patient) 154 173 152 175 148 179 sCr only

UO only


Cutoff Quartile 3 437000 437000 437000 437000 437000 437000 437000 437000 437000
Sensitivity 62% 63% 66% 62% 63% 66% 62% 64% 65%
Specificity 63% 63% 57% 64% 64% 57% 64% 64% 57%
Cutoff Quartile 4 707000 707000 708000 707000 707000 708000 707000 707000 708000
Sensitivity 36% 37% 42% 36% 37% 42% 36% 37% 42%
Specificity 87% 87% 82% 88% 87% 82% 89% 87% 83%
OR Quartile 2 4.38 4.57 3.34 4.54 4.65 3.07 4.50 4.73 3.45 p Value 1.6E-7 1.3E-7 5.9E-4 8.3E-8 9.8E-8 9.7E-4 7.4E-8 7.2E-8 1.7E-4
Lower limit of 95%
CI 2.52 2.60 1.68 2.61 2.64 1.58 2.60 2.69 1.81
Upper limit of 95%
CI 7.61 8.04 6.65 7.88 8.18 5.99 7.78 8.32 6.59
OR Quartile 3 2.76 2.98 2.56 2.91 3.06 2.53 2.93 3.14 2.43 p Value 9.2E-6 2.0E-6 2.2E-4 3.3E-6 1.2E-6 2.4E-4 3.2E-6 6.9E-7 2.4E-4
Lower limit of 95%
CI 1.76 1.90 1.55 1.86 1.95 1.54 1.86 2.00 1.51
Upper limit of 95%
CI 4.32 4.67 4.22 4.57 4.80 4.15 4.60 4.93 3.91
OR Quartile 4 3.74 3.87 3.26 3.94 3.81 3.34 4.39 4.07 3.57 p Value 4.4E-6 1.9E-6 1.1E-5 2.6E-6 2.5E-6 7.0E-6 8.8E-7 1.1E-6 1.7E-6
Lower limit of 95%
CI 2.13 2.22 1.92 2.22 2.18 1.97 2.44 2.31 2.12
Upper limit of 95%
CI 6.57 6.76 5.51 6.97 6.65 5.65 7.93 7.14 6.02
[00158] Table 7.9: Comparison of marker levels and the area under the ROC curve (AUC) in EDTA samples for the "recovered" and "non-recovered" cohorts where recovery starts within 96 hours after sample collection and renal status is assessed by serum creatinine (sCr) only, urine output (UO) only, or serum creatinine or urine output RIFLE criteria.
sCr or UO


Min 13600 105000 13600 105000 13600 105000
Max 1040000 1120000 1040000 1120000 1040000 1120000 n (Patient) 169 158 168 159 167 160 O only
Recovery Period
Duration (hr) 24 48 72
Non- Non- Non-
Recovered recovered Recovered recovered Recovered recovered Cohort Cohort Cohort Cohort Cohort Cohort
Median 377000 598000 375000 596000 371000 596000
Average 441000 626000 441000 624000 436000 621000
Stdev 251000 289000 251000 288000 249000 287000 p (t-test) 1.2E-8 1.7E-8 5.7E-9
Min 13600 135000 13600 135000 13600 135000
Max 1120000 1090000 1120000 1090000 1120000 1090000 n (Patient) 226 99 225 100 217 108

CI 6.20 6.53 5.39 6.41 6.41 5.26 7.14 6.86 5.85
[00159] Table 7.10: Comparison of marker levels and the area under the ROC curve (AUC) in EDTA samples for the "recovered" and "non-recovered" cohorts where recovery starts within 168 hours after sample collection and renal status is assessed by serum creatinine (sCr) only, urine output (UO) only, or serum creatinine or urine output RIFLE criteria.
sCr or UO

sCr only

UO only

Duration (hr) 24 48 72
sCr or sCr or sCr or
UO sCr only UO only UO sCr only UO only UO sCr only UO only
AUC 0.68 0.70 0.68 0.69 0.70 0.68 0.69 0.70 0.69
SE 0.031 0.030 0.033 0.031 0.030 0.033 0.031 0.030 0.032 p Value 3.2E-9 1.9E-11 3.8E-8 1.8E-9 1.9E-11 4.5E-8 5.7E-10 1.9E-11 8.2E-9 nCohort Recovered 204 184 220 202 184 219 201 184 217 nCohort Non- recovered 123 143 105 125 143 106 126 143 108
Cutoff Quartile 2 260000 260000 262000 260000 260000 262000 260000 260000 262000
Sensitivity 89% 88% 89% 89% 88% 89% 89% 88% 89%
Specificity 33% 35% 31 % 34% 35% 32% 34% 35% 32%
Cutoff Quartile 3 437000 437000 437000 437000 437000 437000 437000 437000 437000
Sensitivity 64% 64% 65% 64% 64% 64% 64% 64% 65%
Specificity 58% 61 % 57% 58% 61 % 57% 59% 61 % 57%
Cutoff Quartile 4 707000 707000 708000 707000 707000 708000 707000 707000 708000
Sensitivity 39% 38% 40% 39% 38% 40% 40% 38% 41 %
Specificity 83% 85% 82% 84% 85% 82% 84% 85% 82%
OR Quartile 2 3.89 4.05 3.54 4.02 4.05 3.60 4.09 4.05 3.73 p Value 2.2E-5 3.4E-6 1.9E-4 1.4E-5 3.4E-6 1.6E-4 1.1E-5 3.4E-6 1.0E-4
Lower limit of 95%
CI 2.08 2.24 1.82 2.15 2.24 1.85 2.18 2.24 1.92
Upper limit of 95%
CI 7.29 7.30 6.89 7.54 7.30 7.01 7.66 7.30 7.25
OR Quartile 3 2.51 2.81 2.42 2.50 2.81 2.34 2.56 2.81 2.46 p Value 9.2E-5 7.8E-6 3.2E-4 9.7E-5 7.8E-6 5.1E-4 6.2E-5 7.8E-6 2.3E-4
Lower limit of 95%
CI 1.58 1.78 1.49 1.58 1.78 1.45 1.62 1.78 1.52
Upper limit of 95%
CI 3.99 4.41 3.91 3.96 4.41 3.77 4.05 4.41 3.96
OR Quartile 4 3.20 3.63 3.00 3.30 3.63 2.94 3.47 3.63 3.24 p Value 1.0E-5 1.8E-6 3.4E-5 6.1E-6 1.8E-6 4.7E-5 2.6E-6 1.8E-6 9.3E-6
Lower limit of 95%
CI 1.91 2.14 1.78 1.97 2.14 1.75 2.07 2.14 1.93
Upper limit of 95%
CI 5.36 6.17 5.04 5.54 6.17 4.93 5.84 6.17 5.44
[00160] Example 8. Use of Metalloproteinase inhibitor 1 for evaluating renal status in patients admitted to the ICU: Persistent at RIFLE F
[00161] Patients from the intensive care unit (ICU) with RIFLE stage of injury (I) or failure (F) are enrolled in the following study. EDTA anti-coagulated blood samples (10 mL) and urine samples (50 mL) are collected from each patient at enrollment, and at every 12 hours up to day 3, and then every 24 hours thereafter up to day 7 while the subject is hospitalized.
Metalloproteinase inhibitor 1 is measured in the enrollment samples by standard immunoassay methods using commercially available assay reagents.
[00162] Kidney status is assessed by RIFLE criteria based on serum creatinine, urine output, or both serum creatinine and urine output. Two cohorts are defined to represent a "persistent" and a "non-persistent" population. "Persistent" indicates those patients whose
minimum RIFLE stage during a period of 24, 48 or 72 hours is failure (F) where the persistence period can start from the time of sample collection to 24, 48, 72, 96 or 168 hours after sample collection. "Non-persistent" indicates those patients who are not persistent at failure (F) and whose minimum RIFLE stage during a period of 24, 48 or 72 hours is non-injury (RIFLE 0), risk of injury (R), or injury (I) where the persistence period can start from the time of sample collection to 24, 48, 72, 96 or 168 hours after sample collection. If a patient dies after failure (F) or is placed on renal replacement therapy (RRT) at any time from sample collection to 24, 48, 72, 96 or 168 hours after sample collection, the patient is considered "persistent".
[00163] The ability to distinguish the "persistent" and "non-persistent" cohorts is determined using receiver operating characteristic (ROC) analysis.
[00164] Table 8.1: Comparison of marker levels and the area under the ROC curve (AUC) in urine samples for the "persistent" and "non-persistent" cohorts where persistence starts within 24 hours after sample collection and renal status is assessed by serum creatinine (sCr) only, urine output (UO) only, or serum creatinine or urine output RIFLE criteria.
sCr or UO

sCr only

UO only
Persistence Period
Duration (hr) 24 48 72
Non-persistent Persistent Non-persistent Persistent Non-persistent Persistent
Cohort Cohort Cohort Cohort Cohort Cohort
Median 12400 25100 12500 28600 12700 30000
Average 26300 47200 26300 48500 26300 49300
Stdev 31200 42100 31100 43100 31000 43400 p (t-test) 2.0E-4 1.3E-4 8.7E-5
Min 297 873 297 873 297 873
Max 146000 140000 146000 140000 146000 140000 n (Patient) 275 40 278 37 279 36

[00165] Table 8.2: Comparison of marker levels and the area under the ROC curve (AUC) in urine samples for the "persistent" and "non-persistent" cohorts where persistence starts within 48 hours after sample collection and renal status is assessed by serum creatinine (sCr) only, urine output (UO) only, or serum creatinine or urine output RIFLE criteria.

Median 10100 23400 10600 31500 10800 31500
Average 18900 42900 18900 46800 20700 46900
Stdev 23700 39500 23400 40500 26300 39900 p (t-test) 7.7E-11 9.3E-14 2.4E-11
Min 419 297 297 399 297 399
Max 121000 146000 121000 146000 121000 146000 n (Patient) 186 131 204 113 219 98 sCr only
Persistence Period
Duration (hr) 24 48 72
Non-persistent Persistent Non-persistent Persistent Non-persistent Persistent Cohort Cohort Cohort Cohort Cohort Cohort
Median 11000 22400 10900 29300 11000 27300
Average 19500 42800 19400 46000 21400 44900
Stdev 23700 40400 23600 41200 26500 40600 p (t-test) 4.0E-10 2.3E-12 2.6E-9
Min 419 297 297 399 297 399
Max 121000 146000 121000 146000 121000 146000 n (Patient) 192 124 206 110 218 98
UO only


Lower limit of 95% CI 2.01 1.66 1.99 2.33 2.02 1.80 2.81 2.23 1.76 Upper limit of 95% CI 6.74 5.44 16.3 9.21 7.67 14.8 14.4 9.82 14.4
OR Quartile 3 3.51 2.98 2.46 4.36 3.60 2.36 4.52 3.45 2.28 p Value 1.8E-7 5.6E-6 0.0032 8.2E-9 3.8E-7 0.0061 2.3E-8 2.0E-6 0.0088
Lower limit of 95% CI 2.19 1.86 1.35 2.64 2.20 1.28 2.66 2.07 1.23 Upper limit of 95% CI 5.63 4.77 4.48 7.20 5.90 4.36 7.66 5.75 4.22
OR Quartile 4 5.04 4.41 2.28 6.27 5.09 2.37 5.19 3.95 2.46 p Value 8.7E-9 7.5E-8 0.0072 7.7E-11 4.4E-9 0.0058 2.6E-9 5.0E-7 0.0042
Lower limit of 95% CI 2.90 2.57 1.25 3.61 2.95 1.28 3.02 2.31 1.33 Upper limit of 95% CI 8.74 7.58 4.16 10.9 8.76 4.39 8.93 6.75 4.56
[00166] Table 8.3: Comparison of marker levels and the area under the ROC curve (AUC) in urine samples for the "persistent" and "non-persistent" cohorts where persistence starts within 72 hours after sample collection and renal status is assessed by serum creatinine (sCr) only, urine output (UO) only, or serum creatinine or urine output RIFLE criteria.
sCr or UO


UO only

Min 297 399 297 399 297 399
Max 146000 140000 146000 140000 146000 140000 n (Patient) 246 69 251 64 251 64

[00167] Table 8.4: Comparison of marker levels and the area under the ROC curve (AUC) in urine samples for the "persistent" and "non-persistent" cohorts where persistence starts within 96 hours after sample collection and renal status is assessed by serum creatinine (sCr) only, urine output (UO) only, or serum creatinine or urine output RIFLE criteria.
sCr or UO
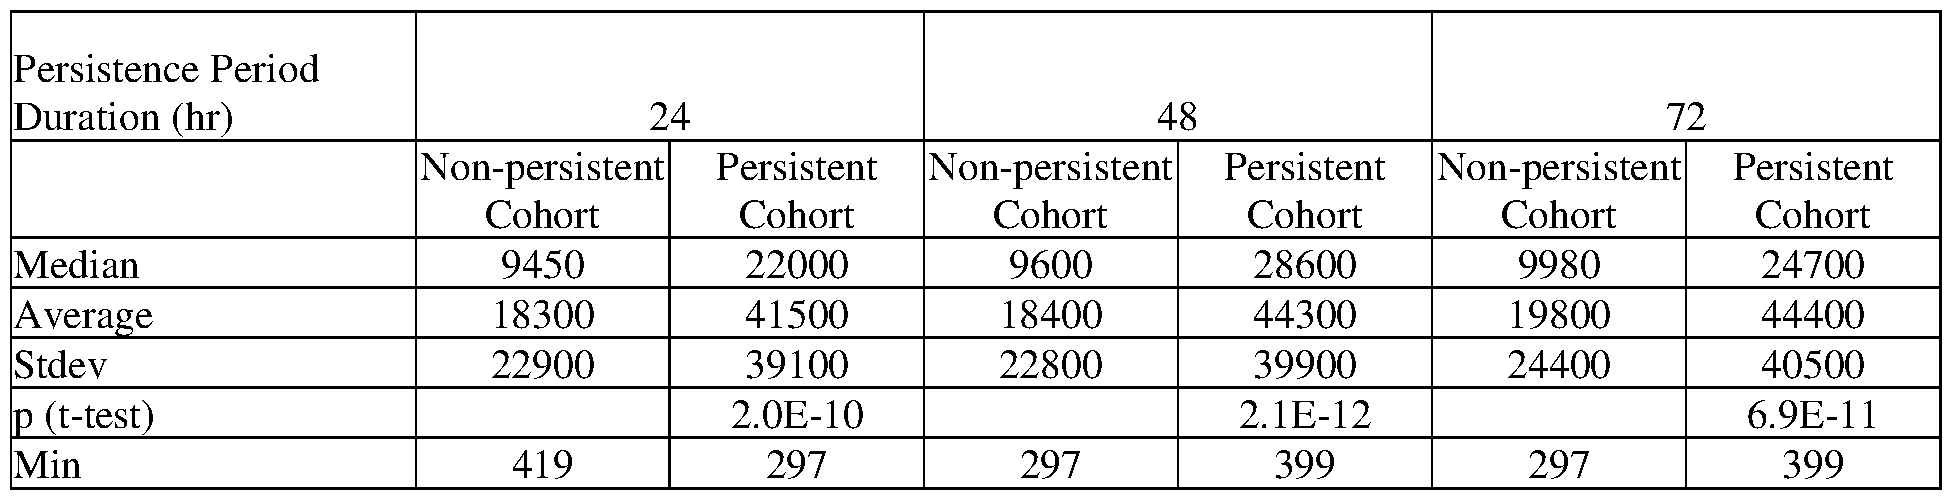
Persistence Period
Duration (hr) 24 48 72
Non-persistent Persistent Non-persistent Persistent Non-persistent Persistent Cohort Cohort Cohort Cohort Cohort Cohort
Median 10800 22000 10200 27300 10800 22700
Average 19100 41400 18800 43900 20200 44100
Stdev 23100 39900 22900 40400 24400 41100 p (t-test) 1.4E-9 1.3E-11 3.8E-10
Min 419 297 297 399 297 399
Max 116000 146000 116000 146000 116000 146000 n (Patient) 180 136 192 124 204 112
UO only

OR Quartile 4 4.63 4.08 2.33 5.35 4.77 2.33 4.32 3.89 2.33 p Value 7.2E-8 4.1E-7 0.0029 2.7E-9 2.0E-8 0.0036 8.1E-8 5.7E-7 0.0036
Lower limit of 95% CI 2.65 2.37 1.33 3.08 2.76 1.32 2.53 2.28 1.32 Upper limit of 95% CI 8.08 7.04 4.08 9.29 8.22 4.12 7.37 6.62 4.12
[00168] Table 8.5: Comparison of marker levels and the area under the ROC curve (AUC) in urine samples for the "persistent" and "non-persistent" cohorts where persistence starts within 168 hours after sample collection and renal status is assessed by serum creatinine (sCr) only, urine output (UO) only, or serum creatinine or urine output RIFLE criteria.
sCr or UO


UO only

Duration (hr) 24 48 72
sCr or sCr or sCr or
UO sCr only UO only UO sCr only UO only UO sCr only UO only
AUC 0.70 0.68 0.67 0.73 0.71 0.66 0.71 0.70 0.66
SE 0.030 0.031 0.037 0.029 0.030 0.037 0.031 0.032 0.037 p Value 1.4E-11 4.0E-9 5.2E-6 8.0E-15 8.8E-12 1.3E-5 5.9E-12 5.9E-10 1.3E-5 nCohort Non- persistent 169 176 234 184 188 237 197 200 237 nCohort Persistent 148 140 81 133 128 78 120 116 78
Cutoff Quartile 2 6030 6020 6080 6030 6020 6080 6030 6020 6080
Sensitivity 86% 86% 91 % 89% 88% 91 % 90% 90% 91 %
Specificity 35% 34% 31 % 35% 34% 30% 34% 34% 30%
Cutoff Quartile 3 14200 14100 14200 14200 14100 14200 14200 14100 14200
Sensitivity 66% 65% 68% 70% 68% 68% 70% 68% 68%
Specificity 64% 62% 56% 64% 62% 56% 62% 60% 56%
Cutoff Quartile 4 35900 35400 36300 35900 35400 36300 35900 35400 36300
Sensitivity 40% 39% 40% 44% 42% 40% 42% 41 % 40%
Specificity 88% 86% 80% 88% 87% 80% 85% 84% 80%
OR Quartile 2 3.43 3.03 4.70 4.20 3.89 4.43 4.64 4.37 4.43 p Value 2.1E-5 1.3E-4 2.3E-4 5.2E-6 1.6E-5 4.1E-4 6.2E-6 1.4E-5 4.1E-4
Lower limit of 95% CI 1.95 1.72 2.06 2.26 2.10 1.94 2.38 2.24 1.94
Upper limit of 95% CI 6.06 5.34 10.7 7.78 7.21 10.1 9.02 8.50 10.1
OR Quartile 3 3.47 3.02 2.69 4.16 3.50 2.67 3.80 3.27 2.67 p Value 1.4E-7 2.7E-6 2.7E-4 5.0E-9 2.3E-7 3.8E-4 7.0E-8 1.5E-6 3.8E-4
Lower limit of 95% CI 2.18 1.90 1.58 2.58 2.18 1.55 2.34 2.02 1.55
Upper limit of 95% CI 5.51 4.79 4.59 6.70 5.62 4.57 6.16 5.30 4.57
OR Quartile 4 4.67 4.10 2.60 5.69 4.76 2.60 4.28 3.85 2.60 p Value 8.1E-8 4.6E-7 6.4E-4 1.3E-9 2.4E-8 7.2E-4 1.0E-7 6.9E-7 7.2E-4
Lower limit of 95% CI 2.66 2.37 1.50 3.25 2.75 1.49 2.51 2.26 1.49
Upper limit of 95% CI 8.21 7.09 4.50 9.99 8.23 4.52 7.31 6.55 4.52
[00169] Table 8.6: Comparison of marker levels and the area under the ROC curve (AUC) in EDTA samples for the "persistent" and "non-persistent" cohorts where persistence starts within 24 hours after sample collection and renal status is assessed by serum creatinine (sCr) only, urine output (UO) only, or serum creatinine or urine output RIFLE criteria.
sCr or UO

sCr only
Persistence Period
Duration (hr) 24 48 72
Non-persistent Persistent Non-persistent Persistent Non-persistent Persistent
Cohort Cohort Cohort Cohort Cohort Cohort
Median 350000 596000 359000 594000 375000 590000
Average 432000 602000 443000 604000 450000 607000
Stdev 255000 276000 261000 273000 261000 278000 p (t-test) 3.8E-8 5.1E-7 2.9E-6
Min 13600 105000 13600 151000 13600 154000
Max 1040000 1120000 1040000 1120000 1040000 1120000 n (Patient) 208 118 223 103 236 90
UO only


[00170] Table 8.7: Comparison of marker levels and the area under the ROC curve (AUC) in EDTA samples for the "persistent" and "non-persistent" cohorts where persistence starts within 48 hours after sample collection and renal status is assessed by serum creatinine (sCr) only, urine output (UO) only, or serum creatinine or urine output RIFLE criteria.
sCr or UO

sCr only

UO only

Duration (hr) 24 48 72
sCr or sCr or sCr or
UO sCr only UO only UO sCr only UO only UO sCr only UO only
AUC 0.68 0.68 0.68 0.67 0.66 0.68 0.67 0.66 0.68
SE 0.030 0.031 0.040 0.031 0.032 0.040 0.033 0.033 0.041 p Value 1.3E-9 7.6E-9 6.7E-6 4.7E-8 4.9E-7 4.9E-6 1.3E-7 1.3E-6 8.7E-6 nCohort Non- persistent 187 192 260 204 205 263 219 217 265 nCohort Persistent 140 134 65 123 121 62 108 109 60
Cutoff Quartile 2 260000 260000 262000 260000 260000 262000 260000 260000 262000
Sensitivity 86% 86% 89% 86% 86% 89% 86% 86% 88%
Specificity 33% 33% 28% 32% 32% 28% 31 % 31 % 28%
Cutoff Quartile 3 437000 433000 437000 437000 433000 437000 437000 433000 437000
Sensitivity 66% 66% 68% 65% 64% 69% 66% 65% 70%
Specificity 61 % 61 % 54% 59% 59% 54% 58% 58% 54%
Cutoff Quartile 4 707000 704000 708000 707000 704000 708000 707000 704000 708000
Sensitivity 38% 37% 43% 38% 36% 45% 40% 37% 45%
Specificity 84% 83% 79% 83% 81 % 79% 82% 81 % 79%
OR Quartile 2 2.98 2.96 3.30 2.92 2.84 3.08 2.73 2.80 2.93 p Value 1.5E-4 2.0E-4 0.0048 3.8E-4 5.4E-4 0.0081 0.0014 0.0011 0.011
Lower limit of 95%
CI 1.70 1.67 1.44 1.62 1.57 1.34 1.48 1.51 1.28
Upper limit of 95%
CI 5.22 5.23 7.55 5.26 5.13 7.06 5.06 5.18 6.75
OR Quartile 3 3.06 3.15 2.48 2.66 2.56 2.70 2.60 2.54 2.78 p Value 1.6E-6 1.1E-6 0.0019 3.6E-5 7.3E-5 0.0010 9.3E-5 1.3E-4 9.0E-4
Lower limit of 95%
CI 1.94 1.99 1.40 1.67 1.61 1.49 1.61 1.58 1.52
Upper limit of 95%
CI 4.83 5.00 4.41 4.23 4.08 4.87 4.20 4.09 5.07
OR Quartile 4 3.32 2.98 2.89 2.99 2.51 3.19 3.05 2.42 3.12 p Value 6.9E-6 3.5E-5 3.0E-4 3.1E-5 4.1E-4 9.7E-5 2.4E-5 7.9E-4 1.5E-4
Lower limit of 95%
CI 1.97 1.78 1.62 1.78 1.51 1.78 1.82 1.44 1.73
Upper limit of 95%
CI 5.60 4.99 5.13 5.00 4.19 5.71 5.13 4.04 5.63
[00171] Table 8.8: Comparison of marker levels and the area under the ROC curve (AUC) in EDTA samples for the "persistent" and "non-persistent" cohorts where persistence starts within 72 hours after sample collection and renal status is assessed by serum creatinine (sCr) only, urine output (UO) only, or serum creatinine or urine output RIFLE criteria.
sCr or UO

Max 1040000 1120000 1040000 1120000 1040000 1120000 n (Patient) 176 151 190 137 205 122 sCr only
Persistence Period
Duration (hr) 24 48 72
Non-persistent Persistent Non-persistent Persistent Non-persistent Persistent Cohort Cohort Cohort Cohort Cohort Cohort
Median 326000 594000 339000 582000 342000 586000
Average 411000 598000 422000 598000 432000 601000
Stdev 248000 272000 252000 274000 255000 275000 p (t-test) 3.0E-10 6.3E-9 4.2E-8
Min 13600 105000 13600 151000 13600 154000
Max 1040000 1120000 1040000 1120000 1040000 1120000 n (Patient) 182 144 194 132 207 119
UO only


[00172] Table 8.9: Comparison of marker levels and the area under the ROC curve (AUC) in EDTA samples for the "persistent" and "non-persistent" cohorts where persistence starts within 96 hours after sample collection and renal status is assessed by serum creatinine (sCr) only, urine output (UO) only, or serum creatinine or urine output RIFLE criteria.
sCr or UO

sCr only

UO only
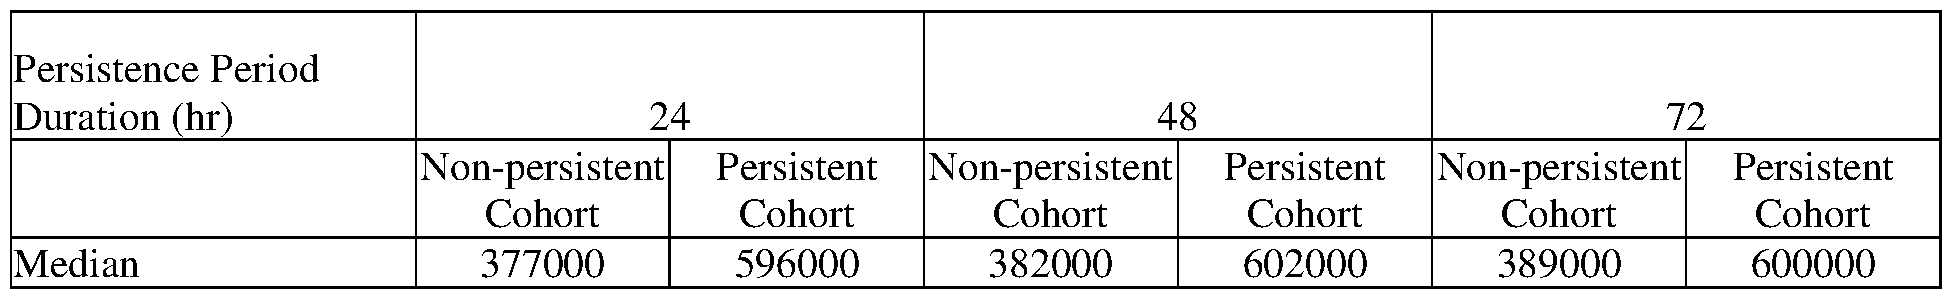 Average 449000 632000 451000 637000 453000 634000
Stdev 257000 285000 256000 289000 257000 290000 p (t-test) 8.9E-8 1.0E-7 2.4E-7
Min 13600 135000 13600 135000 13600 135000
Max 1120000 1090000 1120000 1090000 1120000 1090000 n (Patient) 240 85 245 80 246 79

[00173] Table 8.10: Comparison of marker levels and the area under the ROC curve (AUC) in EDTA samples for the "persistent" and "non-persistent" cohorts where persistence starts within 168 hours after sample collection and renal status is assessed by serum creatinine (sCr) only, urine output (UO) only, or serum creatinine or urine output RIFLE criteria.
 Non-persistent Persistent Non-persistent Persistent Non-persistent Persistent Cohort Cohort Cohort Cohort Cohort Cohort
Median 314000 577000 327000 572000 339000 578000
Average 407000 590000 417000 595000 424000 602000
Stdev 248000 273000 250000 276000 252000 277000 p (t-test) 6.5E-10 2.6E-9 5.7E-9
Min 13600 105000 13600 135000 13600 135000
Max 1040000 1120000 1040000 1120000 1040000 1120000 n (Patient) 169 158 183 144 196 131 sCr only
Persistence Period
Duration (hr) 24 48 72
Non-persistent Persistent Non-persistent Persistent Non-persistent Persistent Cohort Cohort Cohort Cohort Cohort Cohort
Median 321000 586000 328000 577000 340000 582000
Average 406000 595000 416000 597000 424000 602000
Stdev 246000 272000 249000 274000 252000 275000 p (t-test) 1.8E-10 1.4E-9 5.1E-9
Min 13600 105000 13600 151000 13600 154000
Max 1040000 1120000 1040000 1120000 1040000 1120000 n (Patient) 175 151 186 140 198 128
UO only


OR Quartile 2 3.68 3.59 4.62 3.76 3.56 4.45 3.65 3.50 4.37 p Value 4.3E-6 8.6E-6 1.1E-4 7.4E-6 1.8E-5 1.7E-4 2.4E-5 4.5E-5 2.0E-4
Lower limit of 95%
CI 2.11 2.05 2.12 2.11 1.99 2.05 2.00 1.92 2.01
Upper limit of 95%
CI 6.43 6.31 10.0 6.72 6.35 9.68 6.66 6.39 9.51
OR Quartile 3 3.50 3.68 2.74 3.03 3.10 2.79 3.06 3.04 2.71 p Value 7.0E-8 2.6E-8 1.1E-4 1.7E-6 1.2E-6 1.0E-4 2.2E-6 2.7E-6 1.6E-4
Lower limit of 95%
CI 2.22 2.33 1.64 1.93 1.96 1.66 1.92 1.91 1.62
Upper limit of 95%
CI 5.52 5.83 4.58 4.78 4.91 4.67 4.85 4.84 4.56
OR Quartile 4 3.25 3.38 3.17 3.09 3.07 3.33 2.95 2.89 3.17 p Value 1.5E-5 7.2E-6 2.1E-5 2.2E-5 2.3E-5 9.9E-6 3.8E-5 5.1E-5 2.3E-5
Lower limit of 95%
CI 1.90 1.99 1.86 1.84 1.83 1.95 1.76 1.73 1.86
Upper limit of 95%
CI 5.55 5.75 5.40 5.21 5.17 5.69 4.94 4.84 5.42
[00174] Example 9. Use of Metalloproteinase inhibitor 1 for evaluating renal status in patients admitted to the ICU: Persistent at RIFLE I or F
[00175] Patients from the intensive care unit (ICU) with RIFLE stage of injury (I) or failure (F) are enrolled in the following study. EDTA anti-coagulated blood samples (10 mL) and urine samples (50 mL) are collected from each patient at enrollment, and at every 12 hours up to day 3, and then every 24 hours thereafter up to day 7 while the subject is hospitalized.
Metalloproteinase inhibitor 1 is measured in the enrollment samples by standard immunoassay methods using commercially available assay reagents.
[00176] Kidney status is assessed by RIFLE criteria based on serum creatinine, urine output, or both serum creatinine and urine output. Two cohorts are defined to represent a "persistent" and a "non-persistent" population. "Persistent" indicates those patients whose minimum RIFLE stage during a period of 24, 48 or 72 hours is injury (I) or failure (F) where the persistence period can start from the time of sample collection to 24, 48, 72, 96 or 168 hours after sample collection. "Non-persistent" indicates those patients who are not persistent at injury (I) or failure (F) and whose minimum RIFLE stage during a period of 24, 48 or 72 hours is non-injury (RIFLE 0) or risk of injury (R) where the persistence period can start from the time of sample collection to 24, 48, 72, 96 or 168 hours after sample collection. If a patient dies after injury (I) or failure (F) or is placed on renal replacement therapy (RRT) at any time from sample collection to 24, 48, 72, 96 or 168 hours after sample collection, the patient is considered "persistent".
[00177] The ability to distinguish the "persistent" and "non-persistent" cohorts is determined using receiver operating characteristic (ROC) analysis.
[00178] Table 9.1: Comparison of marker levels and the area under the ROC curve (AUC) in urine samples for the "persistent" and "non-persistent" cohorts where persistence starts within 24 hours after sample collection and renal status is assessed by serum creatinine (sCr) only, urine output (UO) only, or serum creatinine or urine output RIFLE criteria.
sCr or UO

sCr only

UO only

UO sCr only UO only UO sCr only UO only UO sCr only UO only
AUC 0.73 0.70 0.68 0.68 0.68 0.68 0.70 0.70 0.69
SE 0.028 0.029 0.038 0.030 0.030 0.041 0.030 0.030 0.043 p Value 6.7E-16 7.2E-12 1.0E-6 1.7E-9 2.5E-9 7.7E-6 2.7E-11 4.0E-11 7.8E-6 nCohort Non- persistent 119 130 241 158 162 256 179 184 263 nCohort Persistent 198 186 74 159 154 59 138 132 52
Cutoff Quartile 2 6030 6020 6080 6030 6020 6080 6030 6020 6080
Sensitivity 86% 84% 92% 86% 85% 92% 88% 86% 90%
Specificity 43% 38% 30% 36% 35% 29% 35% 33% 28%
Cutoff Quartile 3 14200 14100 14200 14200 14100 14200 14200 14100 14200
Sensitivity 65% 65% 70% 64% 64% 71 % 69% 70% 73%
Specificity 74% 71 % 56% 64% 64% 55% 64% 64% 54%
Cutoff Quartile 4 35900 35400 36300 35900 35400 36300 35900 35400 36300
Sensitivity 34% 35% 39% 37% 38% 41 % 40% 41 % 42%
Specificity 90% 89% 79% 87% 88% 79% 86% 86% 78%
OR Quartile 2 4.55 3.38 4.92 3.51 3.01 4.39 3.77 3.14 3.68 p Value 3.8E-8 6.8E-6 3.8E-4 9.1E-6 8.3E-5 0.0024 1.2E-5 1.2E-4 0.0078
Lower limit of 95% CI 2.65 1.99 2.05 2.02 1.74 1.69 2.08 1.75 1.41
Upper limit of 95% CI 7.81 5.75 11.9 6.12 5.21 11.4 6.83 5.63 9.62
OR Quartile 3 5.19 4.40 3.01 3.17 3.14 2.98 3.97 4.11 3.23 p Value 1.3E-10 1.8E-9 1.1E-4 8.2E-7 1.0E-6 5.0E-4 1.1E-8 6.8E-9 4.8E-4
Lower limit of 95% CI 3.14 2.72 1.72 2.00 1.98 1.61 2.48 2.55 1.67
Upper limit of 95% CI 8.58 7.13 5.27 5.02 4.97 5.51 6.37 6.63 6.25
OR Quartile 4 4.66 4.45 2.46 3.85 4.41 2.51 4.08 4.40 2.65 p Value 5.6E-6 3.5E-6 0.0016 2.5E-6 3.3E-7 0.0026 3.8E-7 1.0E-7 0.0022
Lower limit of 95% CI 2.40 2.37 1.40 2.20 2.49 1.38 2.37 2.55 1.42
Upper limit of 95% CI 9.07 8.37 4.31 6.74 7.80 4.56 7.02 7.60 4.94
[00179] Table 9.2: Comparison of marker levels and the area under the ROC curve (AUC) in urine samples for the "persistent" and "non-persistent" cohorts where persistence starts within 48 hours after sample collection and renal status is assessed by serum creatinine (sCr) only, urine output (UO) only, or serum creatinine or urine output RIFLE criteria.
sCr or UO

sCr only
 Median 8650 20500 9980 20500 9450 22000
Average 16600 36700 18300 38600 18900 39900
Stdev 22600 36700 22800 38400 24300 38400 p (t-test) 9.4E-8 3.1E-8 1.0E-8
Min 475 297 419 297 419 297
Max 116000 146000 116000 146000 116000 146000 n (Patient) 126 190 154 162 169 147
UO only
Persistence Period
Duration (hr) 24 48 72
Non-persistent Persistent Non-persistent Persistent Non-persistent Persistent Cohort Cohort Cohort Cohort Cohort Cohort
Median 11600 21900 12100 21900 12100 24700
Average 24400 39900 25100 41000 25200 41900
Stdev 30500 37400 30600 38700 30600 39300 p (t-test) 1.6E-4 2.6E-4 2.0E-4
Min 297 399 297 399 297 399
Max 146000 140000 146000 140000 146000 140000 n (Patient) 222 93 238 77 245 70

sCr or UO

sCr only

UO only


Cutoff Quartile 2 6030 6020 6080 6030 6020 6080 6030 6020 6080
Sensitivity 86% 84% 89% 87% 86% 89% 87% 86% 88%
Specificity 45% 40% 32% 40% 37% 31 % 37% 36% 30%
Cutoff Quartile 3 14200 14100 14200 14200 14100 14200 14200 14100 14200
Sensitivity 63% 63% 63% 64% 62% 63% 66% 65% 64%
Specificity 74% 70% 56% 66% 64% 55% 66% 64% 55%
Cutoff Quartile 4 35900 35400 36300 35900 35400 36300 35900 35400 36300
Sensitivity 33% 34% 34% 36% 36% 34% 38% 37% 35%
Specificity 90% 89% 79% 88% 87% 79% 87% 86% 78%
OR Quartile 2 5.00 3.53 3.95 4.50 3.64 3.54 4.14 3.47 3.09 p Value 5.9E-9 3.2E-6 9.2E-5 1.3E-7 4.2E-6 5.4E-4 9.8E-7 1.4E-5 0.0021
Lower limit of 95% CI 2.91 2.08 1.98 2.57 2.10 1.73 2.34 1.98 1.51 Upper limit of 95% CI 8.60 6.00 7.86 7.86 6.31 7.24 7.32 6.09 6.34
OR Quartile 3 4.84 4.01 2.19 3.39 2.90 2.12 3.74 3.23 2.14 p Value 1.3E-9 1.8E-8 0.0015 2.5E-7 5.0E-6 0.0034 2.5E-8 5.9E-7 0.0040
Lower limit of 95% CI 2.91 2.47 1.35 2.13 1.84 1.28 2.35 2.04 1.27 Upper limit of 95% CI 8.05 6.50 3.55 5.38 4.58 3.51 5.96 5.12 3.58
OR Quartile 4 4.58 4.02 1.97 4.28 3.65 1.94 4.18 3.51 1.95 p Value 1.4E-5 1.6E-5 0.012 1.6E-6 8.1E-6 0.016 8.0E-7 7.6E-6 0.017
Lower limit of 95% CI 2.30 2.14 1.16 2.36 2.07 1.13 2.37 2.03 1.13 Upper limit of 95% CI 9.10 7.56 3.32 7.74 6.43 3.32 7.38 6.09 3.39
[00181] Table 9.4: Comparison of marker levels and the area under the ROC curve (AUC) in urine samples for the "persistent" and "non-persistent" cohorts where persistence starts within 96 hours after sample collection and renal status is assessed by serum creatinine (sCr) only, urine output (UO) only, or serum creatinine or urine output RIFLE criteria.
sCr or UO

sCr only

Max 116000 146000 116000 146000 116000 146000 n (Patient) 124 192 150 166 162 154
UO only
Persistence Period
Duration (hr) 24 48 72
Non-persistent Persistent Non-persistent Persistent Non-persistent Persistent Cohort Cohort Cohort Cohort Cohort Cohort
Median 11800 20500 11900 20500 11900 21300
Average 25100 36400 25300 37300 25500 37600
Stdev 31300 36300 31300 36700 31400 36900 p (t-test) 0.0044 0.0034 0.0038
Min 297 399 297 399 297 399
Max 146000 140000 146000 140000 146000 140000 n (Patient) 208 107 220 95 226 89

[00182] Table 9.5: Comparison of marker levels and the area under the ROC curve (AUC) in urine samples for the "persistent" and "non-persistent" cohorts where persistence starts
within 168 hours after sample collection and renal status is assessed by serum creatinine (sCr) only, urine output (UO) only, or serum creatinine or urine output RIFLE criteria.
sCr or UO

sCr only

UO only


Sensitivity 85% 85% 88% 87% 86% 89% 87% 86% 89%
Specificity 45% 40% 33% 40% 38% 32% 38% 36% 31 %
Cutoff Quartile 3 14200 14100 14200 14200 14100 14200 14200 14100 14200
Sensitivity 63% 63% 64% 63% 62% 64% 65% 65% 64%
Specificity 75% 71 % 57% 66% 64% 57% 66% 65% 56%
Cutoff Quartile 4 35900 35400 36300 35900 35400 36300 35900 35400 36300
Sensitivity 34% 34% 35% 36% 36% 35% 37% 37% 35%
Specificity 92% 90% 80% 88% 88% 80% 87% 87% 79%
OR Quartile 2 4.81 3.74 3.73 4.28 3.68 3.95 4.04 3.49 3.61 p Value 1.2E-8 1.2E-6 6.8E-5 2.1E-7 3.0E-6 9.2E-5 8.8E-7 1.0E-5 2.6E-4
Lower limit of 95% CI 2.80 2.20 1.95 2.47 2.13 1.98 2.32 2.00 1.81 Upper limit of 95% CI 8.25 6.37 7.14 7.41 6.35 7.86 7.05 6.08 7.19
OR Quartile 3 4.89 4.20 2.37 3.24 2.99 2.33 3.55 3.32 2.31 p Value 2.0E-9 8.9E-9 3.6E-4 7.1E-7 2.9E-6 6.5E-4 8.2E-8 3.4E-7 8.6E-4
Lower limit of 95% CI 2.91 2.57 1.47 2.03 1.89 1.43 2.24 2.09 1.41 Upper limit of 95% CI 8.21 6.84 3.81 5.15 4.74 3.78 5.65 5.26 3.78
OR Quartile 4 5.47 4.75 2.13 4.24 3.98 2.11 3.97 3.78 2.03 p Value 6.9E-6 4.4E-6 0.0042 2.7E-6 3.6E-6 0.0053 2.6E-6 3.4E-6 0.0088
Lower limit of 95% CI 2.61 2.44 1.27 2.32 2.22 1.25 2.23 2.16 1.20 Upper limit of 95% CI 11.5 9.25 3.59 7.76 7.14 3.57 7.05 6.64 3.45
[00183] Table 9.6: Comparison of marker levels and the area under the ROC curve (AUC) in EDTA samples for the "persistent" and "non-persistent" cohorts where persistence starts within 24 hours after sample collection and renal status is assessed by serum creatinine (sCr) only, urine output (UO) only, or serum creatinine or urine output RIFLE criteria.
sCr or UO

sCr only


[00184] Table 9.7: Comparison of marker levels and the area under the ROC curve (AUC) in EDTA samples for the "persistent" and "non-persistent" cohorts where persistence starts
within 48 hours after sample collection and renal status is assessed by serum creatinine (sCr) only, urine output (UO) only, or serum creatinine or urine output RIFLE criteria.
sCr or UO

sCr only

UO only


Sensitivity 85% 86% 86% 86% 86% 89% 88% 88% 90%
Specificity 45% 44% 30% 39% 39% 30% 38% 37% 29%
Cutoff Quartile 3 437000 433000 437000 437000 433000 437000 437000 433000 437000
Sensitivity 61 % 63% 63% 62% 64% 65% 63% 64% 69%
Specificity 72% 72% 56% 65% 66% 55% 63% 63% 56%
Cutoff Quartile 4 707000 704000 708000 707000 704000 708000 707000 704000 708000
Sensitivity 33% 34% 42% 35% 36% 44% 37% 37% 45%
Specificity 92% 90% 82% 88% 87% 81 % 87% 86% 81 %
OR Quartile 2 4.68 4.83 2.60 3.84 4.06 3.55 4.35 4.17 3.60 p Value 1.1E-8 7.0E-9 0.0030 7.5E-7 4.0E-7 8.5E-4 3.4E-7 7.0E-7 0.0013
Lower limit of 95%
CI 2.76 2.83 1.38 2.25 2.36 1.69 2.47 2.37 1.65
Upper limit of 95%
CI 7.95 8.23 4.91 6.55 6.99 7.47 7.64 7.34 7.86
OR Quartile 3 4.10 4.24 2.13 3.11 3.50 2.34 2.90 3.03 2.77 p Value 3.4E-8 6.3E-9 0.0022 1.1E-6 8.4E-8 0.0013 3.4E-6 1.5E-6 2.4E-4
Lower limit of 95%
CI 2.48 2.60 1.31 1.97 2.21 1.39 1.85 1.93 1.61
Upper limit of 95%
CI 6.77 6.90 3.45 4.90 5.53 3.91 4.54 4.75 4.77
OR Quartile 4 5.50 4.63 3.35 3.76 3.78 3.43 4.07 3.63 3.56 p Value 6.0E-6 5.7E-6 6.1E-6 7.4E-6 5.0E-6 7.4E-6 7.8E-7 3.5E-6 5.8E-6
Lower limit of 95%
CI 2.63 2.39 1.98 2.11 2.14 2.00 2.33 2.11 2.06
Upper limit of 95%
CI 11.5 8.98 5.66 6.72 6.69 5.88 7.11 6.26 6.17
[00185] Table 9.8: Comparison of marker levels and the area under the ROC curve (AUC) in EDTA samples for the "persistent" and "non-persistent" cohorts where persistence starts within 72 hours after sample collection and renal status is assessed by serum creatinine (sCr) only, urine output (UO) only, or serum creatinine or urine output RIFLE criteria.
sCr or UO


Min 13600 105000 13600 105000 13600 105000
Max 1040000 1120000 1040000 1120000 1040000 1120000 n (Patient) 118 208 146 180 160 166
UO only
Persistence Period
Duration (hr) 24 48 72
Non-persistent Persistent Non-persistent Persistent Non-persistent Persistent Cohort Cohort Cohort Cohort Cohort Cohort
Median 371000 595000 373000 598000 371000 602000
Average 440000 609000 446000 620000 447000 633000
Stdev 253000 286000 256000 285000 256000 283000 p (t-test) 1.1E-7 1.5E-7 3.7E-8
Min 13600 135000 13600 135000 13600 135000
Max 1120000 1090000 1120000 1090000 1120000 1090000 n (Patient) 216 109 230 95 237 88

sCr or UO

sCr only

UO only


SE 0.027 0.027 0.033 0.028 0.028 0.033 0.028 0.028 0.034 p Value 0 0 9.4E-7 1.7E-13 4.4E-16 2.2E-7 1.2E-13 2.2E-15 8.9E-8 nCohort Non- persistent 106 118 211 140 144 223 155 158 229 nCohort Persistent 221 208 114 187 182 102 172 168 96
Cutoff Quartile 2 260000 260000 262000 260000 260000 262000 260000 260000 262000
Sensitivity 85% 86% 86% 86% 87% 89% 88% 88% 90%
Specificity 45% 45% 31 % 40% 40% 31 % 39% 39% 31 %
Cutoff Quartile 3 437000 433000 437000 437000 433000 437000 437000 433000 437000
Sensitivity 61 % 63% 61 % 62% 64% 64% 62% 64% 66%
Specificity 73% 73% 56% 66% 67% 56% 63% 65% 56%
Cutoff Quartile 4 707000 704000 708000 707000 704000 708000 707000 704000 708000
Sensitivity 33% 34% 39% 34% 35% 39% 35% 36% 40%
Specificity 92% 91 % 82% 87% 88% 81 % 86% 87% 81 %
OR Quartile 2 4.55 5.03 2.73 4.13 4.44 3.78 4.67 4.78 3.86 p Value 2.0E-8 3.1E-9 0.0011 2.0E-7 7.6E-8 1.4E-4 6.6E-8 6.0E-8 2.0E-4
Lower limit of 95%
CI 2.68 2.95 1.49 2.42 2.58 1.90 2.67 2.71 1.90
Upper limit of 95%
CI 7.73 8.59 4.99 7.05 7.64 7.52 8.16 8.41 7.88
OR Quartile 3 4.17 4.57 2.02 3.13 3.63 2.24 2.83 3.19 2.46 p Value 3.1E-8 1.6E-9 0.0031 9.9E-7 4.3E-8 0.0010 5.6E-6 5.0E-7 3.6E-4
Lower limit of 95%
CI 2.51 2.79 1.27 1.98 2.29 1.38 1.81 2.03 1.50
Upper limit of 95%
CI 6.91 7.49 3.21 4.95 5.75 3.63 4.43 5.03 4.04
OR Quartile 4 5.32 5.04 2.86 3.53 3.80 2.78 3.51 3.72 2.75 p Value 9.2E-6 3.5E-6 6.3E-5 2.0E-5 6.6E-6 1.2E-4 9.8E-6 3.7E-6 1.5E-4
Lower limit of 95%
CI 2.54 2.54 1.71 1.97 2.13 1.65 2.01 2.13 1.63
Upper limit of 95%
CI 11.1 9.99 4.79 6.30 6.78 4.68 6.11 6.49 4.66
[00187] Table 9.10: Comparison of marker levels and the area under the ROC curve (AUC) in EDTA samples for the "persistent" and "non-persistent" cohorts where persistence starts within 168 hours after sample collection and renal status is assessed by serum creatinine (sCr) only, urine output (UO) only, or serum creatinine or urine output RIFLE criteria.
sCr or UO

sCr only
Persistence Period
Duration (hr) 24 48 72
Non- Non- Non- persistent Persistent persistent Persistent persistent Persistent
Cohort Cohort Cohort Cohort Cohort Cohort
Median 275000 568000 293000 571000 303000 574000
Average 351000 571000 381000 579000 390000 586000
Stdev 225000 269000 236000 272000 238000 273000 p (t-test) 8.4E-13 3.2E-11 3.4E-11
Min 13600 105000 13600 105000 13600 105000
Max 1040000 1120000 1040000 1120000 1040000 1120000 n (Patient) 115 211 140 186 154 172 O only


Upper limit of 95%
CI 6.73 6.96 3.40 5.17 5.50 4.01 4.72 4.77 4.27
OR Quartile 4 4.96 4.79 3.07 3.55 3.56 3.26 3.75 3.48 3.15 p Value 2.1E-5 7.0E-6 2.1E-5 2.5E-5 1.8E-5 7.9E-6 5.8E-6 1.1E-5 1.5E-5
Lower limit of 95%
CI 2.37 2.42 1.83 1.97 1.99 1.94 2.12 2.00 1.87
Upper limit of 95%
CI 10.4 9.50 5.14 6.41 6.35 5.48 6.64 6.07 5.30
[00188] Example 10. Use of Metalloproteinase inhibitor 2 for evaluating renal status in patients admitted to the ICU: Recovery to RIFLE 0 from RIFLE I and F
[00189] Patients from the intensive care unit (ICU) with RIFLE stage of injury (I) or failure (F) are enrolled in the following study. EDTA anti-coagulated blood samples (10 mL) and urine samples (50 mL) are collected from each patient at enrollment, and at every 12 hours up to day 3, and then every 24 hours thereafter up to day 7 while the subject is hospitalized.
Metalloproteinase inhibitor 2 is measured in the enrollment samples by standard immunoassay methods using commercially available assay reagents.
[00190] Kidney status is assessed by RIFLE criteria based on serum creatinine, urine output, or both serum creatinine and urine output. Two cohorts are defined to represent a "recovered" and a "non-recovered" population. "Recovered" indicates those patients whose maximum RIFLE stage during a period of 24, 48 or 72 hours is non-injury (RIFLE 0) where the recovery period can start from the time of sample collection to 24, 48, 72, 96 or 168 hours after sample collection. "Non-recovered" indicates those patients whose maximum RIFLE stage during a period of 24, 48 or 72 hours is risk of injury (R), injury (I) or failure (F) where the recovery period can start from the time of sample collection to 24, 48, 72, 96 or 168 hours after sample collection. If a patient dies or is placed on renal replacement therapy (RRT) at any time from sample collection to 24, 48, 72, 96 or 168 hours after sample collection, the patient is considered "non-recovered".
[00191] The ability to distinguish the "recovered" and "non-recovered" cohorts is determined using receiver operating characteristic (ROC) analysis.
[00192] Table 10.1: Comparison of marker levels and the area under the ROC curve (AUC) in urine samples for the "recovered" and "non-recovered" cohorts where recovery starts within 24 hours after sample collection and renal status is assessed by serum creatinine (sCr) only, urine output (UO) only, or serum creatinine or urine output RIFLE criteria.
sCr or UO
Recovery Period
Duration (hr) 24 48 72
Non- Non- Non-
Recovered recovered Recovered recovered Recovered recovered
Cohort Cohort Cohort Cohort Cohort Cohort
Median 9920 16000 10100 15400 10000 15100
Average 12700 33200 13500 32200 13000 31900
Stdev 10100 58100 10900 57100 10500 56600 p (t-test) 0.0084 0.027 0.034
Min 200 658 200 658 200 658
Max 42400 465000 42400 465000 38600 465000 n (Patient) 57 260 46 271 41 276 sCr only

UO only


Cutoff Quartile 3 13500 13500 13500 13500 13500 13500 13500 13500 13500
Sensitivity 54% 52% 69% 53% 52% 67% 53% 52% 66%
Specificity 68% 57% 62% 67% 57% 64% 68% 57% 66%
Cutoff Quartile 4 28900 28100 29400 28900 28100 29400 28900 28100 29400
Sensitivity 28% 28% 40% 27% 28% 37% 27% 28% 35%
Specificity 89% 84% 85% 87% 84% 85% 88% 86% 85%
OR Quartile 2 2.71 1.43 8.15 2.47 1.50 6.12 2.76 1.66 5.03 p Value 0.0012 0.23 1.1E-7 0.0066 0.17 4.2E-8 0.0034 0.087 6.8E-8
Lower limit of 95%
CI 1.48 0.803 3.76 1.29 0.842 3.20 1.40 0.929 2.80
Upper limit of 95% CI 4.96 2.53 17.7 4.76 2.66 11.7 5.44 2.97 9.04
OR Quartile 3 2.57 1.42 3.68 2.34 1.43 3.53 2.42 1.45 3.78 p Value 0.0024 0.19 1.2E-7 0.012 0.19 1.2E-7 0.013 0.18 2.3E-8
Lower limit of 95%
CI 1.40 0.842 2.27 1.21 0.844 2.21 1.20 0.847 2.37
Upper limit of 95% CI 4.72 2.38 5.97 4.54 2.41 5.63 4.87 2.47 6.02
OR Quartile 4 3.38 2.07 3.72 2.50 1.98 3.37 2.69 2.34 2.91 p Value 0.0071 0.036 1.3E-6 0.045 0.049 9.8E-6 0.046 0.022 1.2E-4
Lower limit of 95%
CI 1.39 1.05 2.19 1.02 1.00 1.97 1.02 1.13 1.69
Upper limit of 95% CI 8.22 4.07 6.33 6.15 3.90 5.77 7.10 4.83 5.01
[00193] Table 10.2: Comparison of marker levels and the area under the ROC curve (AUC) in urine samples for the "recovered" and "non-recovered" cohorts where recovery starts within 48 hours after sample collection and renal status is assessed by serum creatinine (sCr) only, urine output (UO) only, or serum creatinine or urine output RIFLE criteria.
sCr or UO

sCr only

UO only
Recovery Period
Duration (hr) 24 48 72
Non- Non- Non-
Recovered recovered Recovered recovered Recovered recovered Cohort Cohort Cohort Cohort Cohort Cohort
Median 11400 21700 11200 21100 10900 19500
Average 20000 49400 19900 45100 19900 42300
Stdev 37100 73200 38400 68700 39800 65300 p (t-test) 3.4E-6 3.9E-5 2.0E-4
Min 200 2170 200 2170 200 2170
Max 465000 428000 465000 428000 465000 428000 n (Patient) 212 103 194 121 178 137

[00194] Table 10.3: Comparison of marker levels and the area under the ROC curve (AUC) in urine samples for the "recovered" and "non-recovered" cohorts where recovery starts within 72
hours after sample collection and renal status is assessed by serum creatinine (sCr) only, output (UO) only, or serum creatinine or urine output RIFLE criteria.
sCr or UO

sCr only

UO only


Cutoff Quartile 2 7990 7990 8020 7990 7990 8020 7990 7990 8020
Sensitivity 80% 79% 87% 80% 79% 86% 80% 79% 86%
Specificity 34% 31 % 31 % 35% 31 % 31 % 36% 32% 33%
Cutoff Quartile 3 13500 13500 13500 13500 13500 13500 13500 13500 13500
Sensitivity 57% 55% 65% 57% 55% 64% 56% 55% 64%
Specificity 62% 57% 57% 63% 57% 57% 63% 58% 59%
Cutoff Quartile 4 28900 28900 29400 28900 28900 29400 28900 28900 29400
Sensitivity 33% 32% 41 % 31 % 32% 39% 31 % 32% 38%
Specificity 88% 85% 82% 87% 85% 82% 89% 87% 83%
OR Quartile 2 2.12 1.78 3.02 2.11 1.76 2.93 2.26 1.80 3.08 p Value 0.0046 0.028 8.7E-4 0.0050 0.032 6.8E-4 0.0026 0.026 2.1E-4
Lower limit of 95%
CI 1.26 1.06 1.57 1.25 1.05 1.57 1.33 1.07 1.70
Upper limit of 95% CI 3.56 2.98 5.79 3.57 2.94 5.44 3.84 3.01 5.58
OR Quartile 3 2.20 1.67 2.50 2.19 1.63 2.39 2.15 1.69 2.55 p Value 9.9E-4 0.027 2.5E-4 0.0013 0.035 3.5E-4 0.0022 0.025 8.0E-5
Lower limit of 95%
CI 1.38 1.06 1.53 1.36 1.04 1.48 1.32 1.07 1.60
Upper limit of 95% CI 3.52 2.63 4.09 3.53 2.57 3.84 3.51 2.68 4.07
OR Quartile 4 3.44 2.69 3.16 3.04 2.55 2.95 3.57 3.07 2.98 p Value 1.3E-4 7.5E-4 2.0E-5 5.7E-4 0.0014 5.3E-5 2.9E-4 2.7E-4 4.7E-5
Lower limit of 95%
CI 1.83 1.51 1.86 1.62 1.44 1.75 1.79 1.68 1.76
Upper limit of 95% CI 6.47 4.78 5.38 5.73 4.54 4.99 7.12 5.63 5.03
[00195] Table 10.4: Comparison of marker levels and the area under the ROC curve (AUC) in urine samples for the "recovered" and "non-recovered" cohorts where recovery starts within 96 hours after sample collection and renal status is assessed by serum creatinine (sCr) only, urine output (UO) only, or serum creatinine or urine output RIFLE criteria.
sCr or UO

sCr only
 Median 11800 18200 11800 18100 11600 18100
Average 18000 38600 18100 38300 17800 38200
Stdev 22400 67300 22600 66900 22400 66500 p (t-test) 6.0E-4 7.8E-4 6.9E-4
Min 200 658 200 658 200 658
Max 215000 465000 215000 465000 215000 465000 n (Patient) 140 177 138 179 135 182
UO only
Recovery Period
Duration (hr) 24 48 72
Non- Non- Non-
Recovered recovered Recovered recovered Recovered recovered Cohort Cohort Cohort Cohort Cohort Cohort
Median 11600 21400 11400 21500 11400 20600
Average 20700 49000 20600 46900 20200 44700
Stdev 37500 74400 38100 71700 38500 68700 p (t-test) 1.0E-5 2.8E-5 6.8E-5
Min 200 2170 200 2170 200 2170
Max 465000 428000 465000 428000 465000 428000 n (Patient) 216 99 207 108 194 121

[00196] Table 10.5: Comparison of marker levels and the area under the ROC curve (AUC) in urine samples for the "recovered" and "non-recovered" cohorts where recovery starts within 168 hours after sample collection and renal status is assessed by serum creatinine (sCr) only, urine output (UO) only, or serum creatinine or urine output RIFLE criteria.
sCr or UO

sCr only

UO only

Duration (hr) 24 48 72
sCr or sCr or sCr or
UO sCr only UO only UO sCr only UO only UO sCr only UO only
AUC 0.63 0.62 0.68 0.64 0.61 0.68 0.64 0.62 0.68
SE 0.032 0.031 0.033 0.032 0.031 0.033 0.032 0.031 0.033 p Value 3.2E-5 1.8E-4 9.2E-8 1.6E-5 4.8E-4 5.0E-8 1.6E-5 2.4E-4 2.9E-8 nCohort Recovered 188 160 211 185 157 208 185 156 205 nCohort Non- recovered 129 157 104 132 160 107 132 161 110
Cutoff Quartile 2 7990 7990 8020 7990 7990 8020 7990 7990 8020
Sensitivity 83% 82% 85% 83% 81 % 85% 83% 81 % 85%
Specificity 30% 31 % 30% 31 % 31 % 30% 31 % 31 % 30%
Cutoff Quartile 3 13500 13500 13500 13500 13500 13500 13500 13500 13500
Sensitivity 60% 57% 65% 60% 56% 65% 60% 56% 65%
Specificity 56% 56% 57% 57% 55% 58% 57% 56% 58%
Cutoff Quartile 4 28900 28900 29400 28900 28900 29400 28900 28900 29400
Sensitivity 36% 34% 41 % 36% 34% 41 % 36% 34% 41 %
Specificity 82% 84% 83% 82% 83% 83% 82% 84% 83%
OR Quartile 2 2.12 2.01 2.34 2.23 1.97 2.47 2.23 2.00 2.37 p Value 0.0080 0.0092 0.0062 0.0046 0.011 0.0035 0.0046 0.0092 0.0046
Lower limit of 95%
CI 1.22 1.19 1.27 1.28 1.17 1.35 1.28 1.19 1.31
Upper limit of 95% CI 3.68 3.39 4.30 3.87 3.31 4.54 3.87 3.37 4.31
OR Quartile 3 1.91 1.68 2.54 1.96 1.56 2.58 1.96 1.60 2.62 p Value 0.0051 0.022 1.8E-4 0.0037 0.050 1.2E-4 0.0037 0.038 8.6E-5
Lower limit of 95%
CI 1.21 1.08 1.56 1.24 1.00 1.59 1.24 1.03 1.62
Upper limit of 95% CI 3.02 2.62 4.13 3.08 2.43 4.19 3.08 2.49 4.24
OR Quartile 4 2.51 2.70 3.43 2.55 2.57 3.45 2.55 2.72 3.48 p Value 4.9E-4 2.6E-4 5.3E-6 4.1E-4 5.3E-4 4.5E-6 4.1E-4 2.7E-4 3.8E-6
Lower limit of 95%
CI 1.50 1.58 2.02 1.52 1.51 2.03 1.52 1.59 2.05
Upper limit of 95% CI 4.21 4.61 5.82 4.28 4.38 5.86 4.28 4.65 5.91
[00197] Table 10.6: Comparison of marker levels and the area under the ROC curve (AUC) in EDTA samples for the "recovered" and "non-recovered" cohorts where recovery starts within 24 hours after sample collection and renal status is assessed by serum creatinine (sCr) only, urine output (UO) only, or serum creatinine or urine output RIFLE criteria.
sCr or UO


UO only

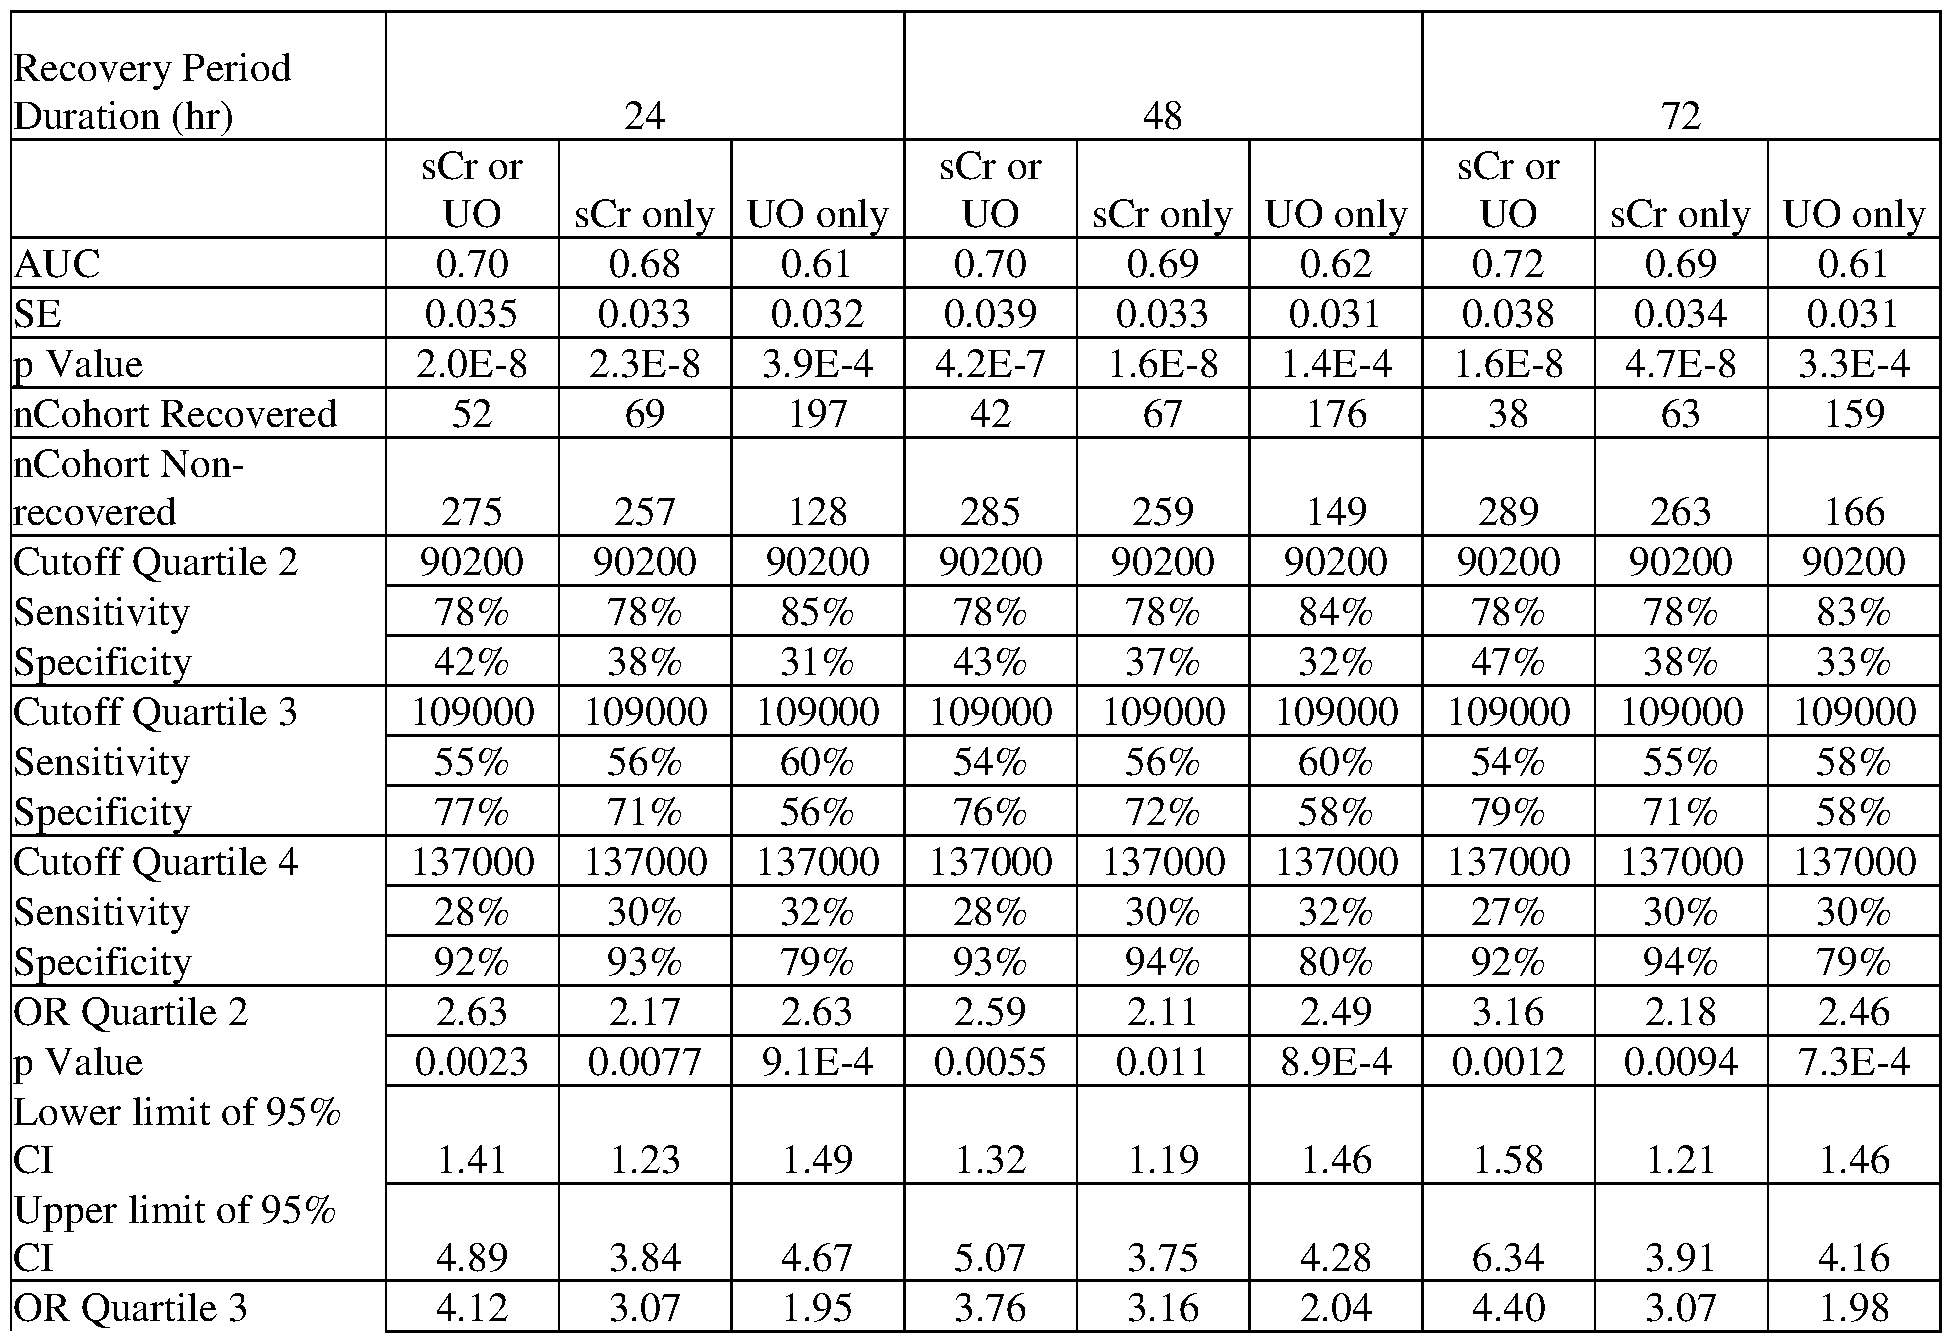 p Value 5.4E-5 1.3E-4 0.0038 5.1E-4 1.1E-4 0.0016 3.6E-4 2.4E-4 0.0024
Lower limit of 95%
CI 2.07 1.73 1.24 1.78 1.76 1.31 1.95 1.69 1.27
Upper limit of 95%
CI 8.19 5.46 3.06 7.94 5.68 3.19 9.92 5.59 3.08
OR Quartile 4 4.75 5.48 1.79 4.99 6.79 1.86 4.39 6.22 1.60 p Value 0.0037 4.4E-4 0.024 0.0088 3.3E-4 0.017 0.016 6.2E-4 0.070
Lower limit of 95%
CI 1.66 2.12 1.08 1.50 2.39 1.12 1.31 2.18 0.962
Upper limit of 95%
CI 13.6 14.1 2.97 16.6 19.3 3.08 14.7 17.7 2.66
[00198] Table 10.7: Comparison of marker levels and the area under the ROC curve (AUC) in EDTA samples for the "recovered" and "non-recovered" cohorts where recovery starts within 48 hours after sample collection and renal status is assessed by serum creatinine (sCr) only, urine output (UO) only, or serum creatinine or urine output RIFLE criteria.
sCr or UO


UO only

Average 117000 133000 116000 131000 116000 129000
Stdev 42700 45300 42100 45900 42900 44600 p (t-test) 0.0019 0.0029 0.0066
Min 57600 57000 57600 57000 57600 57000
Max 299000 281000 299000 281000 299000 281000 n (Patient) 217 108 198 127 181 144

[00199] Table 10.8: Comparison of marker levels and the area under the ROC curve (AUC) in EDTA samples for the "recovered" and "non-recovered" cohorts where recovery starts within 72 hours after sample collection and renal status is assessed by serum creatinine (sCr) only, urine output (UO) only, or serum creatinine or urine output RIFLE criteria.
sCr or UO
Recovery Period
Duration (hr) 24 48 72
Non- Non- Non-
Recovered recovered Recovered recovered Recovered recovered
Cohort Cohort Cohort Cohort Cohort Cohort
Median 98600 117000 98600 117000 98000 116000
Average 112000 127000 112000 126000 112000 126000
Stdev 40700 45000 40800 44900 41900 44400 p (t-test) 0.0049 0.0082 0.012
Min 57600 57000 57600 57000 57600 57000
Max 257000 299000 257000 299000 257000 299000 n (Patient) 111 216 104 223 94 233 sCr only

UO only


Cutoff Quartile 3 109000 109000 109000 109000 109000 109000 109000 109000 109000
Sensitivity 58% 59% 66% 57% 59% 65% 57% 59% 64%
Specificity 66% 65% 58% 65% 65% 58% 66% 66% 59%
Cutoff Quartile 4 137000 137000 137000 137000 137000 137000 137000 137000 137000
Sensitivity 29% 31 % 39% 29% 31 % 37% 28% 31 % 34%
Specificity 83% 84% 81 % 83% 85% 81 % 82% 85% 81 %
OR Quartile 2 1.66 1.71 3.60 1.54 1.69 3.16 1.76 1.61 3.07 p Value 0.055 0.039 1.6E-4 0.11 0.044 2.5E-4 0.037 0.066 1.6E-4
Lower limit of 95%
CI 0.990 1.03 1.85 0.912 1.01 1.71 1.03 0.968 1.72
Upper limit of 95%
CI 2.77 2.83 7.01 2.59 2.80 5.85 2.98 2.69 5.49
OR Quartile 3 2.69 2.63 2.63 2.55 2.73 2.58 2.53 2.71 2.53 p Value 4.7E-5 4.2E-5 8.5E-5 1.5E-4 2.4E-5 7.6E-5 2.6E-4 3.4E-5 6.9E-5
Lower limit of 95%
CI 1.67 1.66 1.63 1.57 1.71 1.61 1.54 1.69 1.60
Upper limit of 95%
CI 4.33 4.17 4.27 4.13 4.35 4.12 4.17 4.34 3.99
OR Quartile 4 1.99 2.29 2.74 1.92 2.58 2.52 1.75 2.59 2.18 p Value 0.019 0.0041 1.4E-4 0.028 0.0014 4.1E-4 0.066 0.0016 0.0026
Lower limit of 95%
CI 1.12 1.30 1.63 1.07 1.44 1.51 0.964 1.43 1.31
Upper limit of 95%
CI 3.54 4.02 4.60 3.45 4.61 4.20 3.19 4.69 3.62
[00200] Table 10.9: Comparison of marker levels and the area under the ROC curve (AUC) in EDTA samples for the "recovered" and "non-recovered" cohorts where recovery starts within 96 hours after sample collection and renal status is assessed by serum creatinine (sCr) only, urine output (UO) only, or serum creatinine or urine output RIFLE criteria.
sCr or UO

sCr only

Min 57600 57000 57600 57000 57600 57000
Max 269000 299000 269000 299000 269000 299000 n (Patient) 139 188 137 190 133 194
UO only
Recovery Period
Duration (hr) 24 48 72
Non- Non- Non-
Recovered recovered Recovered recovered Recovered recovered Cohort Cohort Cohort Cohort Cohort Cohort
Median 103000 128000 103000 124000 103000 123000
Average 114000 139000 114000 136000 114000 134000
Stdev 39800 47800 40400 47200 41200 46000 p (t-test) 9.4E-7 1.2E-5 7.2E-5
Min 57600 57000 57600 57000 57600 57000
Max 299000 281000 299000 281000 299000 281000 n (Patient) 220 105 211 114 198 127

CI 3.66 4.32 5.04 3.74 4.98 4.47 4.03 5.11 3.71
[00201] Table 10.10: Comparison of marker levels and the area under the ROC curve (AUC) in EDTA samples for the "recovered" and "non-recovered" cohorts where recovery starts within 168 hours after sample collection and renal status is assessed by serum creatinine (sCr) only, urine output (UO) only, or serum creatinine or urine output RIFLE criteria.
sCr or UO

sCr only

UO only

Duration (hr) 24 48 72
sCr or sCr or sCr or
UO sCr only UO only UO sCr only UO only UO sCr only UO only
AUC 0.63 0.62 0.66 0.63 0.64 0.67 0.63 0.63 0.67
SE 0.031 0.031 0.033 0.031 0.030 0.032 0.031 0.031 0.032 p Value 5.0E-5 8.3E-5 4.7E-7 1.9E-5 8.0E-6 2.1E-7 3.2E-5 3.2E-5 2.0E-7 nCohort Recovered 187 159 215 184 156 212 183 154 209 nCohort Non- recovered 140 168 110 143 171 113 144 173 116
Cutoff Quartile 2 90200 90200 90200 90200 90200 90200 90200 90200 90200
Sensitivity 83% 80% 86% 83% 81 % 87% 83% 80% 87%
Specificity 31 % 31 % 31 % 32% 31 % 31 % 31 % 31 % 32%
Cutoff Quartile 3 109000 109000 109000 109000 109000 109000 109000 109000 109000
Sensitivity 61 % 60% 65% 61 % 60% 65% 60% 60% 66%
Specificity 58% 60% 58% 58% 61 % 58% 58% 60% 58%
Cutoff Quartile 4 137000 137000 137000 137000 137000 137000 137000 137000 137000
Sensitivity 33% 32% 39% 34% 33% 39% 33% 33% 38%
Specificity 81 % 82% 82% 82% 84% 82% 81 % 84% 82%
OR Quartile 2 2.17 1.82 2.81 2.28 1.92 2.95 2.15 1.73 3.11 p Value 0.0047 0.021 0.0010 0.0026 0.012 5.7E-4 0.0048 0.033 3.1E-4
Lower limit of 95%
CI 1.27 1.10 1.51 1.33 1.15 1.59 1.26 1.04 1.68
Upper limit of 95%
CI 3.72 3.03 5.20 3.91 3.18 5.47 3.67 2.87 5.75
OR Quartile 3 2.11 2.18 2.58 2.16 2.36 2.62 2.10 2.24 2.66 p Value 0.0010 5.4E-4 9.8E-5 7.1E-4 1.5E-4 6.7E-5 0.0011 3.5E-4 4.6E-5
Lower limit of 95%
CI 1.35 1.40 1.60 1.38 1.51 1.63 1.35 1.44 1.66
Upper limit of 95%
CI 3.30 3.40 4.16 3.37 3.68 4.21 3.28 3.49 4.27
OR Quartile 4 2.05 2.22 2.90 2.23 2.62 2.92 2.19 2.54 2.75 p Value 0.0054 0.0028 5.5E-5 0.0020 4.0E-4 4.7E-5 0.0025 6.2E-4 1.1E-4
Lower limit of 95%
CI 1.24 1.32 1.73 1.34 1.54 1.74 1.32 1.49 1.64
Upper limit of 95%
CI 3.41 3.73 4.86 3.71 4.46 4.89 3.64 4.32 4.60
[00202] Example 11. Use of Metalloproteinase inhibitor 2 for evaluating renal status in patients admitted to the ICU: Recovery to RIFLE 0 and R from RIFLE I and F
[00203] Patients from the intensive care unit (ICU) with RIFLE stage of injury (I) or failure (F) are enrolled in the following study. EDTA anti-coagulated blood samples (10 mL) and urine samples (50 mL) are collected from each patient at enrollment, and at every 12 hours up to day 3, and then every 24 hours thereafter up to day 7 while the subject is hospitalized.
Metalloproteinase inhibitor 2 is measured in the enrollment samples by standard immunoassay methods using commercially available assay reagents.
[00204] Kidney status is assessed by RIFLE criteria based on serum creatinine, urine output, or both serum creatinine and urine output. Two cohorts are defined to represent a "recovered" and a "non-recovered" population. "Recovered" indicates those patients whose maximum RIFLE
stage during a period of 24, 48 or 72 hours is non-injury (RIFLE 0) or risk of injury (R) where the recovery period can start from the time of sample collection to 24, 48, 72, 96 or 168 hours after sample collection. "Non-recovered" indicates those patients whose maximum RIFLE stage during a period of 24, 48 or 72 hours is injury (I) or failure (F) where the recovery period can start from the time of sample collection to 24, 48, 72, 96 or 168 hours after sample collection. If a patient dies or is placed on renal replacement therapy (RRT) at any time from sample collection to 24, 48, 72, 96 or 168 hours after sample collection, the patient is considered "non- recovered".
[00205] The ability to distinguish the "recovered" and "non-recovered" cohorts is determined using receiver operating characteristic (ROC) analysis.
[00206] Table 11.1: Comparison of marker levels and the area under the ROC curve (AUC) in urine samples for the "recovered" and "non-recovered" cohorts where recovery starts within 24 hours after sample collection and renal status is assessed by serum creatinine (sCr) only, urine output (UO) only, or serum creatinine or urine output RIFLE criteria.
sCr or UO

sCr only
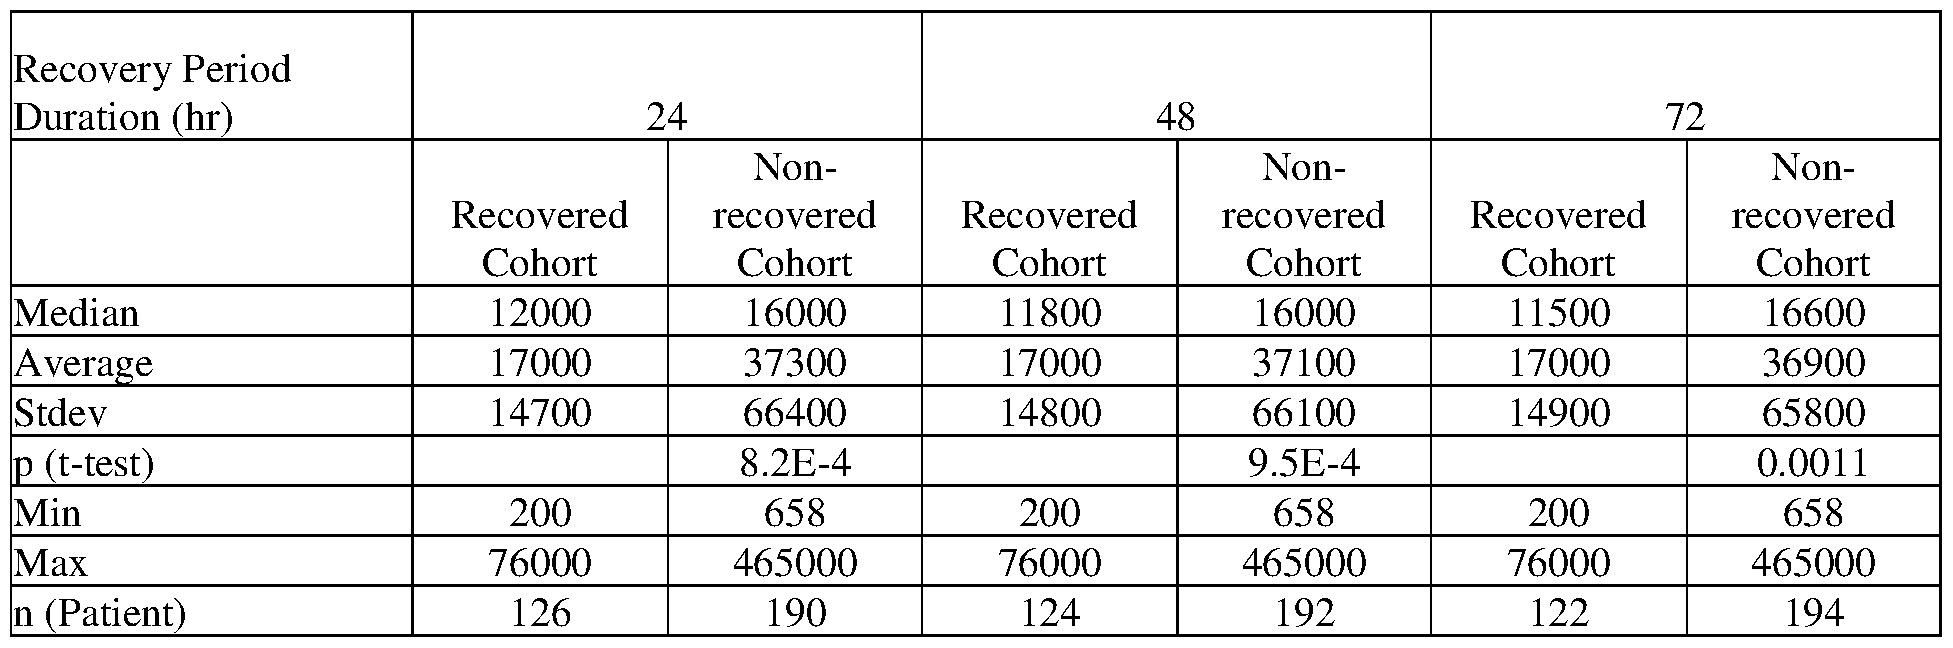
UO only
Recovery Period
Duration (hr) 24 48 72
Non- Non- Non-
Recovered recovered Recovered recovered Recovered recovered
Cohort Cohort Cohort Cohort Cohort Cohort
Median 11400 25100 11000 22700 11000 21700
Average 20500 51500 19900 48500 19900 46000
Stdev 38100 74800 38900 70600 39600 68200 p (t-test) 1.9E-6 5.3E-6 2.4E-5
Min 200 2170 200 2170 200 2170
Max 465000 428000 465000 428000 465000 428000 n (Patient) 222 93 208 107 198 117

[00207] Table 11.2: Comparison of marker levels and the area under the ROC curve (AUC) in urine samples for the "recovered" and "non-recovered" cohorts where recovery starts within 48 hours after sample collection and renal status is assessed by serum creatinine (sCr) only, urine output (UO) only, or serum creatinine or urine output RIFLE criteria.
sCr or UO
Recovery Period
Duration (hr) 24 48 72
Non- Non- Non-
Recovered recovered Recovered recovered Recovered recovered
Cohort Cohort Cohort Cohort Cohort Cohort
Median 11300 19300 11100 19300 11000 19300
Average 15500 40000 15400 39800 14900 39500
Stdev 13800 67800 13800 67400 13300 66600 p (t-test) 4.4E-5 4.7E-5 4.7E-5
Min 200 658 200 658 200 658
Max 76000 465000 76000 465000 76000 465000 n (Patient) 136 181 134 183 129 188 sCr only

UO only


Cutoff Quartile 3 13500 13500 13500 13500 13500 13500 13500 13500 13500
Sensitivity 59% 56% 69% 59% 56% 68% 60% 57% 68%
Specificity 61 % 56% 57% 62% 57% 58% 64% 58% 59%
Cutoff Quartile 4 28900 28900 29400 28900 28900 29400 28900 28900 29400
Sensitivity 34% 35% 44% 34% 34% 44% 35% 34% 43%
Specificity 87% 85% 82% 87% 85% 83% 88% 85% 84%
OR Quartile 2 2.14 1.59 3.47 2.22 1.62 3.88 2.26 1.68 3.42 p Value 0.0039 0.075 6.6E-4 0.0026 0.065 2.0E-4 0.0020 0.048 2.0E-4
Lower limit of 95%
CI 1.28 0.954 1.70 1.32 0.970 1.90 1.35 1.00 1.79
Upper limit of 95% CI 3.58 2.66 7.11 3.72 2.70 7.94 3.80 2.80 6.55
OR Quartile 3 2.21 1.64 2.90 2.34 1.68 2.96 2.57 1.78 2.99 p Value 6.1E-4 0.029 5.9E-5 2.6E-4 0.022 2.9E-5 6.2E-5 0.012 1.1E-5
Lower limit of 95%
CI 1.41 1.05 1.72 1.48 1.08 1.78 1.62 1.14 1.84
Upper limit of 95% CI 3.49 2.56 4.87 3.70 2.63 4.92 4.08 2.78 4.88
OR Quartile 4 3.42 3.04 3.63 3.61 2.99 3.92 4.02 2.89 3.91 p Value 3.7E-5 8.0E-5 3.0E-6 2.2E-5 1.0E-4 6.3E-7 9.9E-6 1.7E-4 5.2E-7
Lower limit of 95%
CI 1.91 1.75 2.11 2.00 1.72 2.29 2.17 1.66 2.30
Upper limit of 95% CI 6.12 5.29 6.23 6.54 5.20 6.71 7.44 5.03 6.67
[00208] Table 11.3: Comparison of marker levels and the area under the ROC curve (AUC) in urine samples for the "recovered" and "non-recovered" cohorts where recovery starts within 72 hours after sample collection and renal status is assessed by serum creatinine (sCr) only, urine output (UO) only, or serum creatinine or urine output RIFLE criteria.
sCr or UO


UO only
Recovery Period
Duration (hr) 24 48 72
Non- Non- Non-
Recovered recovered Recovered recovered Recovered recovered Cohort Cohort Cohort Cohort Cohort Cohort
Median 11900 21500 11900 21500 11500 21500
Average 21500 49500 21600 49100 21200 46900
Stdev 38600 75700 38600 75400 39400 71800 p (t-test) 2.1E-5 2.7E-5 5.4E-5
Min 200 2170 200 2170 200 2170
Max 465000 428000 465000 428000 465000 428000 n (Patient) 224 91 223 92 212 103

[00209] Table 11.4: Comparison of marker levels and the area under the ROC curve (AUC) in urine samples for the "recovered" and "non-recovered" cohorts where recovery starts within 96
hours after sample collection and renal status is assessed by serum creatinine (sCr) only, output (UO) only, or serum creatinine or urine output RIFLE criteria.
sCr or UO

sCr only

UO only
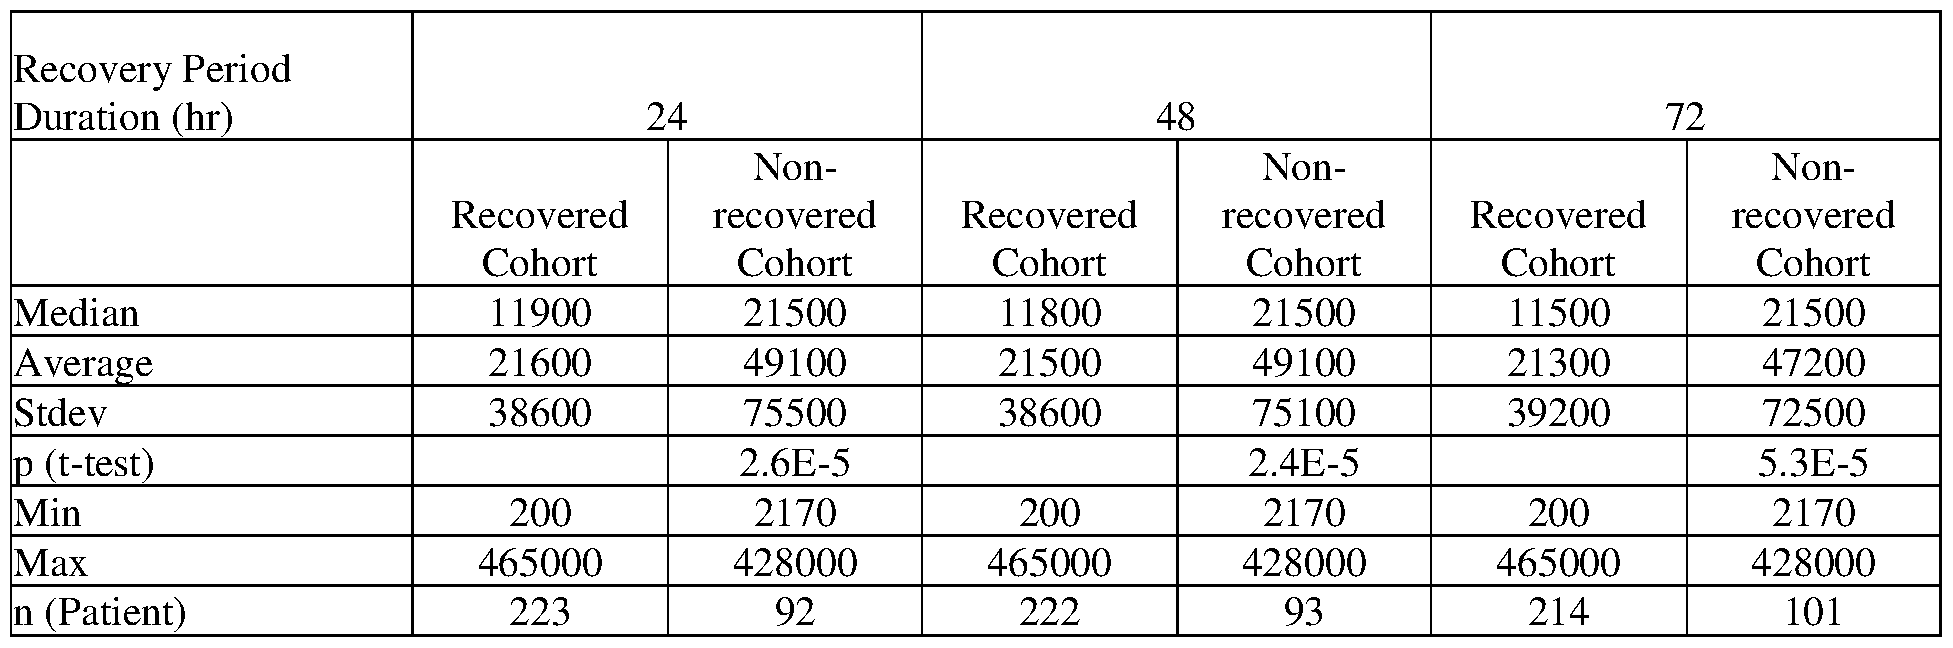

Cutoff Quartile 2 7990 7990 8020 7990 7990 8020 7990 7990 8020
Sensitivity 83% 81 % 85% 83% 82% 85% 83% 82% 86%
Specificity 32% 30% 29% 32% 30% 29% 33% 31 % 30%
Cutoff Quartile 3 13500 13500 13500 13500 13500 13500 13500 13500 13500
Sensitivity 60% 58% 65% 60% 58% 66% 61 % 59% 66%
Specificity 58% 56% 56% 59% 57% 56% 60% 57% 57%
Cutoff Quartile 4 28900 28900 29400 28900 28900 29400 28900 28900 29400
Sensitivity 36% 37% 41 % 36% 36% 42% 36% 36% 41 %
Specificity 84% 84% 82% 84% 84% 82% 85% 84% 82%
OR Quartile 2 2.18 1.89 2.29 2.29 1.93 2.34 2.45 1.96 2.71 p Value 0.0042 0.018 0.011 0.0023 0.015 0.0091 9.9E-4 0.013 0.0021
Lower limit of 95%
CI 1.28 1.11 1.21 1.34 1.13 1.23 1.44 1.15 1.44
Upper limit of 95% CI 3.72 3.22 4.34 3.91 3.27 4.42 4.19 3.33 5.12
OR Quartile 3 2.08 1.78 2.39 2.13 1.83 2.46 2.36 1.87 2.66 p Value 0.0014 0.011 7.0E-4 9.7E-4 0.0082 4.7E-4 1.9E-4 0.0059 1.0E-4
Lower limit of 95%
CI 1.33 1.14 1.44 1.36 1.17 1.48 1.50 1.20 1.63
Upper limit of 95% CI 3.25 2.78 3.96 3.33 2.86 4.06 3.70 2.93 4.36
OR Quartile 4 2.88 3.09 3.12 2.95 3.04 3.29 3.20 2.99 3.16 p Value 9.3E-5 3.2E-5 3.1E-5 7.4E-5 4.2E-5 1.3E-5 2.8E-5 5.5E-5 2.0E-5
Lower limit of 95%
CI 1.70 1.82 1.83 1.73 1.79 1.92 1.86 1.76 1.86
Upper limit of 95% CI 4.90 5.27 5.34 5.03 5.17 5.61 5.50 5.08 5.38
[00210] Table 11.5: Comparison of marker levels and the area under the ROC curve (AUC) in urine samples for the "recovered" and "non-recovered" cohorts where recovery starts within 168 hours after sample collection and renal status is assessed by serum creatinine (sCr) only, urine output (UO) only, or serum creatinine or urine output RIFLE criteria.
sCr or UO

sCr only
 Median 11900 19000 11900 19000 11900 19000
Average 19100 44000 19100 44000 19100 44000
Stdev 24400 75300 24400 75300 24400 75300 p (t-test) 3.4E-5 3.4E-5 3.4E-5
Min 200 658 200 658 200 658
Max 215000 465000 215000 465000 215000 465000 n (Patient) 185 132 185 132 185 132
UO only
Recovery Period
Duration (hr) 24 48 72
Non- Non- Non-
Recovered recovered Recovered recovered Recovered recovered Cohort Cohort Cohort Cohort Cohort Cohort
Median 11800 21500 11700 21500 11700 21500
Average 21700 47200 21600 47200 21600 46600
Stdev 39100 73500 39200 73100 39400 72500 p (t-test) 7.4E-5 6.6E-5 9.6E-5
Min 200 2170 200 2170 200 2170
Max 465000 428000 465000 428000 465000 428000 n (Patient) 217 98 216 99 214 101

[00211] Table 11.6: Comparison of marker levels and the area under the ROC curve (AUC) in EDTA samples for the "recovered" and "non-recovered" cohorts where recovery starts within 24 hours after sample collection and renal status is assessed by serum creatinine (sCr) only, urine output (UO) only, or serum creatinine or urine output RIFLE criteria.
sCr or UO

sCr only

UO only

Duration (hr) 24 48 72
sCr or sCr or sCr or
UO sCr only UO only UO sCr only UO only UO sCr only UO only
AUC 0.66 0.68 0.62 0.66 0.68 0.63 0.66 0.68 0.63
SE 0.031 0.030 0.035 0.031 0.030 0.033 0.031 0.030 0.032 p Value 7.3E-8 1.9E-9 9.0E-4 2.6E-7 1.6E-9 4.9E-5 7.9E-7 9.3E-10 5.1E-5 nCohort Recovered 105 121 226 102 119 213 98 117 202 nCohort Non- recovered 222 205 99 225 207 112 229 209 123
Cutoff Quartile 2 90200 90200 90200 90200 90200 90200 90200 90200 90200
Sensitivity 80% 80% 86% 80% 80% 87% 79% 80% 86%
Specificity 35% 34% 30% 35% 34% 31 % 35% 34% 32%
Cutoff Quartile 3 109000 109000 109000 109000 109000 109000 109000 109000 109000
Sensitivity 59% 60% 61 % 58% 60% 62% 58% 60% 60%
Specificity 68% 67% 54% 68% 67% 56% 67% 68% 56%
Cutoff Quartile 4 137000 137000 137000 137000 137000 137000 137000 137000 137000
Sensitivity 32% 33% 35% 31 % 33% 37% 31 % 33% 34%
Specificity 89% 88% 79% 88% 88% 81 % 88% 89% 80%
OR Quartile 2 2.14 2.05 2.56 2.12 2.13 2.90 2.00 2.07 2.89 p Value 0.0039 0.0057 0.0036 0.0045 0.0037 7.0E-4 0.0093 0.0053 4.4E-4
Lower limit of 95%
CI 1.28 1.23 1.36 1.26 1.28 1.57 1.19 1.24 1.60
Upper limit of 95%
CI 3.59 3.41 4.82 3.57 3.54 5.38 3.38 3.44 5.23
OR Quartile 3 2.95 3.04 1.84 2.91 3.06 2.03 2.81 3.09 1.92 p Value 1.4E-5 3.7E-6 0.013 2.1E-5 3.5E-6 0.0029 4.7E-5 3.3E-6 0.0051
Lower limit of 95%
CI 1.81 1.90 1.14 1.78 1.91 1.27 1.71 1.92 1.22
Upper limit of 95%
CI 4.81 4.86 2.97 4.77 4.92 3.24 4.61 4.98 3.02
OR Quartile 4 3.57 3.79 2.08 3.39 3.67 2.42 3.16 3.94 2.10 p Value 1.7E-4 3.2E-5 0.0059 3.2E-4 5.0E-5 7.3E-4 7.2E-4 3.0E-5 0.0042
Lower limit of 95%
CI 1.84 2.02 1.24 1.74 1.96 1.45 1.62 2.07 1.26
Upper limit of 95%
CI 6.94 7.11 3.51 6.59 6.88 4.05 6.14 7.51 3.49
[00212] Table 11.7: Comparison of marker levels and the area under the ROC curve (AUC) in EDTA samples for the "recovered" and "non-recovered" cohorts where recovery starts within 48 hours after sample collection and renal status is assessed by serum creatinine (sCr) only, urine output (UO) only, or serum creatinine or urine output RIFLE criteria.
sCr or UO

Recovery Period
Duration (hr) 24 48 72
Non- Non- Non-
Recovered recovered Recovered recovered Recovered recovered Cohort Cohort Cohort Cohort Cohort Cohort
Median 98600 121000 98600 121000 98600 121000
Average 110000 131000 110000 131000 110000 131000
Stdev 39300 45700 39400 45600 39500 45400 p (t-test) 1.9E-5 2.1E-5 2.0E-5
Min 57600 57000 57600 57000 57600 57000
Max 299000 281000 299000 281000 299000 281000 n (Patient) 146 181 145 182 143 184
UO only


CI 4.06 3.77 6.53 4.14 3.84 7.26 3.69 3.71 5.66
OR Quartile 3 3.01 2.93 2.34 3.10 3.02 2.56 2.90 3.03 2.45 p Value 2.6E-6 3.1E-6 8.1E-4 1.5E-6 1.8E-6 1.7E-4 6.4E-6 1.8E-6 1.8E-4
Lower limit of 95%
CI 1.90 1.87 1.42 1.96 1.92 1.57 1.83 1.92 1.53
Upper limit of 95%
CI 4.76 4.61 3.84 4.92 4.75 4.18 4.60 4.77 3.92
OR Quartile 4 2.30 2.59 2.50 2.26 2.54 2.71 2.08 2.66 2.45 p Value 0.0030 6.0E-4 6.6E-4 0.0036 7.5E-4 1.8E-4 0.0091 4.7E-4 6.3E-4
Lower limit of 95%
CI 1.33 1.50 1.47 1.30 1.48 1.61 1.20 1.54 1.46
Upper limit of 95%
CI 3.98 4.45 4.23 3.91 4.38 4.56 3.60 4.61 4.08
[00213] Table 11.8: Comparison of marker levels and the area under the ROC curve (AUC) in EDTA samples for the "recovered" and "non-recovered" cohorts where recovery starts within 72 hours after sample collection and renal status is assessed by serum creatinine (sCr) only, urine output (UO) only, or serum creatinine or urine output RIFLE criteria.
sCr or UO


Recovered recovered Recovered recovered Recovered recovered
Cohort Cohort Cohort Cohort Cohort Cohort
Median 104000 124000 104000 125000 103000 127000
Average 115000 138000 115000 139000 114000 138000
Stdev 41100 47300 40900 47000 40200 47200 p (t-test) 2.2E-5 7.1E-6 2.8E-6
Min 57600 57000 57600 57000 57600 57000
Max 299000 281000 299000 281000 299000 281000 n (Patient) 230 95 228 97 215 110

[00214] Table 11.9: Comparison of marker levels and the area under the ROC curve (AUC) in EDTA samples for the "recovered" and "non-recovered" cohorts where recovery starts within 96 hours after sample collection and renal status is assessed by serum creatinine (sCr) only, urine output (UO) only, or serum creatinine or urine output RIFLE criteria.
sCr or UO
 sCr only

UO only

 Sensitivity 83% 83% 89% 83% 83% 89% 82% 83% 87% Specificity 33% 33% 31 % 33% 33% 31 % 33% 33% 31 %
Cutoff Quartile 3 109000 109000 109000 109000 109000 109000 109000 109000 109000
Sensitivity 63% 63% 69% 63% 64% 68% 62% 64% 68%
Specificity 62% 62% 58% 63% 62% 58% 63% 63% 59%
Cutoff Quartile 4 137000 137000 137000 137000 137000 137000 137000 137000 137000
Sensitivity 32% 33% 42% 31 % 33% 42% 31 % 33% 40%
Specificity 81 % 82% 82% 81 % 82% 82% 81 % 83% 82%
OR Quartile 2 2.29 2.34 3.59 2.41 2.38 3.65 2.24 2.42 3.00 p Value 0.0018 0.0015 2.7E-4 9.6E-4 0.0012 2.2E-4 0.0022 9.7E-4 6.5E-4
Lower limit of 95%
CI 1.36 1.39 1.81 1.43 1.41 1.84 1.34 1.43 1.60
Upper limit of 95%
CI 3.86 3.96 7.14 4.05 4.02 7.26 3.74 4.09 5.64
OR Quartile 3 2.75 2.83 3.02 2.82 2.90 2.91 2.82 2.98 2.94 p Value 9.3E-6 5.6E-6 1.4E-5 5.7E-6 3.3E-6 2.5E-5 5.7E-6 2.0E-6 1.3E-5
Lower limit of 95%
CI 1.76 1.81 1.83 1.80 1.85 1.77 1.80 1.90 1.81
Upper limit of 95%
CI 4.31 4.43 4.99 4.42 4.55 4.78 4.42 4.67 4.78
OR Quartile 4 2.02 2.27 3.43 1.92 2.24 3.35 1.93 2.36 3.02 p Value 0.0072 0.0018 4.3E-6 0.012 0.0022 6.1E-6 0.012 0.0012 2.9E-5
Lower limit of 95%
CI 1.21 1.36 2.03 1.15 1.34 1.98 1.15 1.40 1.80
Upper limit of 95%
CI 3.37 3.81 5.79 3.21 3.74 5.66 3.22 3.96 5.07
[00215] Table 11.10: Comparison of marker levels and the area under the ROC curve (AUC) in EDTA samples for the "recovered" and "non-recovered" cohorts where recovery starts within 168 hours after sample collection and renal status is assessed by serum creatinine (sCr) only, urine output (UO) only, or serum creatinine or urine output RIFLE criteria.
sCr or UO

sCr only

Stdev 41500 45600 41500 45600 41500 45600 p (t-test) 4.5E-4 4.5E-4 4.5E-4
Min 57600 57000 57600 57000 57600 57000
Max 299000 281000 299000 281000 299000 281000 n (Patient) 184 143 184 143 184 143
UO only
Recovery Period
Duration (hr) 24 48 72
Non- Non- Non-
Recovered recovered Recovered recovered Recovered recovered Cohort Cohort Cohort Cohort Cohort Cohort
Median 103000 125000 103000 125000 102000 126000
Average 114000 139000 114000 139000 114000 139000
Stdev 39400 48400 39500 48400 39600 47900 p (t-test) 6.0E-7 8.8E-7 6.3E-7
Min 57600 57000 57600 57000 57600 57000
Max 299000 281000 299000 281000 299000 281000 n (Patient) 220 105 219 106 217 108


[00216] Example 12. Use of Metalloproteinase inhibitor 2 for evaluating renal status in patients admitted to the ICU: Persistent at RIFLE F
[00217] Patients from the intensive care unit (ICU) with RIFLE stage of injury (I) or failure (F) are enrolled in the following study. EDTA anti-coagulated blood samples (10 mL) and urine samples (50 mL) are collected from each patient at enrollment, and at every 12 hours up to day 3, and then every 24 hours thereafter up to day 7 while the subject is hospitalized.
Metalloproteinase inhibitor 2 is measured in the enrollment samples by standard immunoassay methods using commercially available assay reagents.
[00218] Kidney status is assessed by RIFLE criteria based on serum creatinine, urine output, or both serum creatinine and urine output. Two cohorts are defined to represent a "persistent" and a "non-persistent" population. "Persistent" indicates those patients whose minimum RIFLE stage during a period of 24, 48 or 72 hours is failure (F) where the persistence period can start from the time of sample collection to 24, 48, 72, 96 or 168 hours after sample collection. "Non- persistent" indicates those patients who are not persistent at failure (F) and whose minimum RIFLE stage during a period of 24, 48 or 72 hours is non-injury (RIFLE 0), risk of injury (R), or injury (I) where the persistence period can start from the time of sample collection to 24, 48, 72, 96 or 168 hours after sample collection. If a patient dies after failure (F) or is placed on renal replacement therapy (RRT) at any time from sample collection to 24, 48, 72, 96 or 168 hours after sample collection, the patient is considered "persistent".
[00219] The ability to distinguish the "persistent" and "non-persistent" cohorts is determined using receiver operating characteristic (ROC) analysis.
[00220] Table 12.1: Comparison of marker levels and the area under the ROC curve (AUC) in urine samples for the "persistent" and "non-persistent" cohorts where persistence starts within 24 hours after sample collection and renal status is assessed by serum creatinine (sCr) only, urine output (UO) only, or serum creatinine or urine output RIFLE criteria.
sCr or UO

Min 200 2940 200 2940 200 3000
Max 183000 428000 183000 428000 396000 428000 n (Patient) 205 112 221 96 236 81 sCr only
Persistence Period
Duration (hr) 24 48 72
Non-persistent Persistent Non-persistent Persistent Non-persistent Persistent Cohort Cohort Cohort Cohort Cohort Cohort
Median 11800 21800 11800 25200 12000 24300
Average 19900 46400 20500 49500 23200 45800
Stdev 35400 70300 35500 73900 44300 65800 p (t-test) 1.1E-5 3.7E-6 5.9E-4
Min 200 2940 200 2940 200 2940
Max 428000 396000 428000 396000 428000 371000 n (Patient) 208 108 223 93 235 81
UO only


OR Quartile 3 2.75 2.37 5.66 3.03 2.83 5.02 3.12 2.52 5.90 p Value 3.6E-5 4.3E-4 6.4E-5 1.9E-5 6.3E-5 2.2E-4 3.9E-5 6.2E-4 1.3E-4
Lower limit of 95% CI 1.70 1.46 2.42 1.82 1.70 2.13 1.81 1.48 2.38 Upper limit of 95% CI 4.44 3.82 13.2 5.03 4.71 11.8 5.36 4.28 14.6
OR Quartile 4 5.07 4.24 7.78 5.46 4.82 7.49 5.18 3.86 8.15 p Value 4.0E-9 1.2E-7 1.9E-8 1.0E-9 1.4E-8 8.5E-8 6.3E-9 1.5E-6 4.8E-8
Lower limit of 95% CI 2.95 2.48 3.80 3.17 2.80 3.58 2.97 2.23 3.84 Upper limit of 95% CI 8.72 7.24 15.9 9.42 8.31 15.6 9.02 6.70 17.3
[00221] Table 12.2: Comparison of marker levels and the area under the ROC curve (AUC) in urine samples for the "persistent" and "non-persistent" cohorts where persistence starts within 48 hours after sample collection and renal status is assessed by serum creatinine (sCr) only, urine output (UO) only, or serum creatinine or urine output RIFLE criteria.
sCr or UO


UO only


[00222] Table 12.3: Comparison of marker levels and the area under the ROC curve (AUC) in urine samples for the "persistent" and "non-persistent" cohorts where persistence starts within 72 hours after sample collection and renal status is assessed by serum creatinine (sCr) only, urine output (UO) only, or serum creatinine or urine output RIFLE criteria.
sCr or UO

Persistence Period
Duration (hr) 24 48 72
Non-persistent Persistent Non-persistent Persistent Non-persistent Persistent Cohort Cohort Cohort Cohort Cohort Cohort
Median 11800 19600 11600 20600 11800 20900
Average 19700 41600 19900 43600 23100 40400
Stdev 35700 65400 36300 67100 46100 59200 p (t-test) 1.6E-4 6.2E-5 0.0044
Min 200 658 200 2170 200 2170
Max 428000 396000 428000 396000 428000 371000 n (Patient) 182 134 195 121 208 108
UO only


Lower limit of 95%
CI 1.60 1.26 1.60 1.77 1.46 1.36 1.70 1.38 1.36
Upper limit of 95% CI 3.97 3.11 5.00 4.51 3.71 4.32 4.44 3.59 4.32
OR Quartile 4 4.10 3.38 3.99 4.67 3.74 3.97 4.05 3.16 3.97 p Value 4.3E-7 7.4E-6 2.1E-6 2.7E-8 1.2E-6 3.5E-6 2.4E-7 1.9E-5 3.5E-6
Lower limit of 95%
CI 2.37 1.98 2.25 2.71 2.20 2.22 2.38 1.87 2.22
Upper limit of 95% CI 7.08 5.76 7.05 8.03 6.37 7.11 6.90 5.35 7.11
[00223] Table 12.4: Comparison of marker levels and the area under the ROC curve (AUC) in urine samples for the "persistent" and "non-persistent" cohorts where persistence starts within 96 hours after sample collection and renal status is assessed by serum creatinine (sCr) only, urine output (UO) only, or serum creatinine or urine output RIFLE criteria.
sCr or UO


UO only


[00224] Table 12.5: Comparison of marker levels and the area under the ROC curve (AUC) in urine samples for the "persistent" and "non-persistent" cohorts where persistence starts within 168 hours after sample collection and renal status is assessed by serum creatinine (sCr) only, urine output (UO) only, or serum creatinine or urine output RIFLE criteria.
sCr or UO

Persistence Period
Duration (hr) 24 48 72
Non-persistent Persistent Non-persistent Persistent Non-persistent Persistent Cohort Cohort Cohort Cohort Cohort Cohort
Median 11600 19200 11500 20000 11600 20400
Average 19800 40600 19300 43300 20700 43300
Stdev 36300 64200 35200 66400 37400 67300 p (t-test) 3.4E-4 3.9E-5 1.5E-4
Min 200 658 200 2170 200 2170
Max 428000 396000 428000 396000 428000 396000 n (Patient) 176 140 188 128 200 116
UO only


Lower limit of 95%
CI 1.59 1.25 1.95 1.85 1.48 1.79 1.76 1.44 1.79
Upper limit of 95% CI 3.93 3.08 5.85 4.68 3.73 5.39 4.52 3.67 5.39
OR Quartile 4 3.98 3.26 4.16 4.48 3.78 3.87 3.98 3.33 3.87 p Value 8.9E-7 1.5E-5 4.0E-7 6.7E-8 1.1E-6 1.7E-6 3.6E-7 7.9E-6 1.7E-6
Lower limit of 95%
CI 2.29 1.91 2.40 2.60 2.22 2.22 2.34 1.96 2.22
Upper limit of 95% CI 6.89 5.56 7.22 7.73 6.46 6.73 6.77 5.63 6.73
[00225] Table 12.6: Comparison of marker levels and the area under the ROC curve (AUC) in EDTA samples for the "persistent" and "non-persistent" cohorts where persistence starts within 24 hours after sample collection and renal status is assessed by serum creatinine (sCr) only, urine output (UO) only, or serum creatinine or urine output RIFLE criteria.
sCr or UO

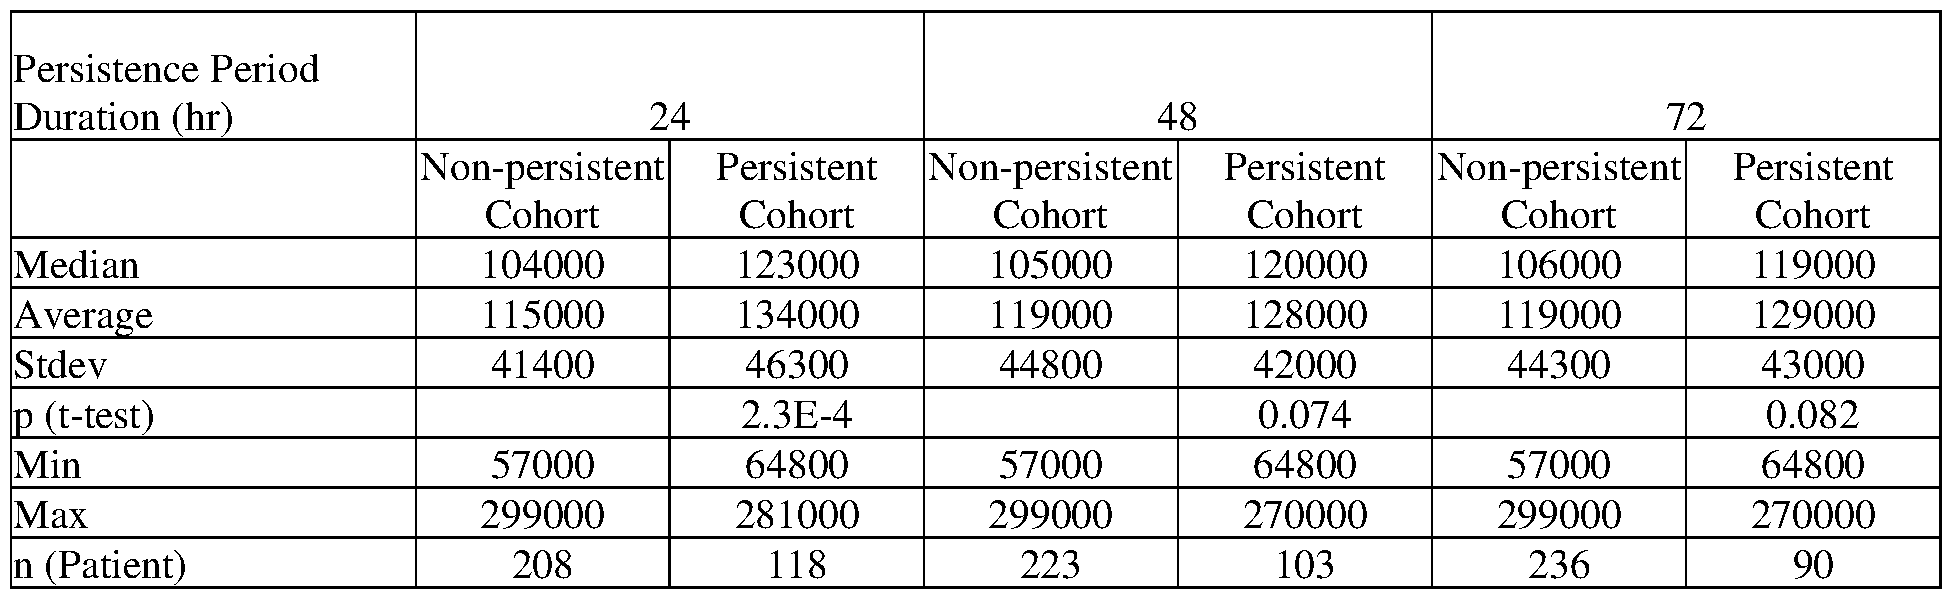
UO only


[00226] Table 12.7: Comparison of marker levels and the area under the ROC curve (AUC) in EDTA samples for the "persistent" and "non-persistent" cohorts where persistence starts within 48 hours after sample collection and renal status is assessed by serum creatinine (sCr) only, urine output (UO) only, or serum creatinine or urine output RIFLE criteria.
sCr or UO

Min 57600 57000 57600 57000 57600 57000
Max 299000 281000 299000 281000 299000 281000 n (Patient) 187 140 204 123 219 108 sCr only
Persistence Period
Duration (hr) 24 48 72
Non-persistent Persistent Non-persistent Persistent Non-persistent Persistent Cohort Cohort Cohort Cohort Cohort Cohort
Median 103000 123000 104000 120000 105000 120000
Average 115000 132000 117000 130000 117000 131000
Stdev 41500 45800 43100 44800 42100 46400 p (t-test) 4.2E-4 0.013 0.0051
Min 57600 57000 57600 57000 57600 57000
Max 299000 281000 299000 281000 299000 281000 n (Patient) 192 134 205 121 217 109
UO only


[00227] Table 12.8: Comparison of marker levels and the area under the ROC curve (AUC) in EDTA samples for the "persistent" and "non-persistent" cohorts where persistence starts within 72 hours after sample collection and renal status is assessed by serum creatinine (sCr) only, urine output (UO) only, or serum creatinine or urine output RIFLE criteria.
sCr or UO

sCr only

UO only
 Cohort Cohort Cohort Cohort Cohort Cohort
Median 104000 133000 104000 133000 104000 133000
Average 115000 145000 115000 146000 115000 146000
Stdev 40400 48000 40200 48400 40200 48700 p (t-test) 1.6E-7 4.8E-8 7.4E-8
Min 57600 57000 57600 57000 57600 57000
Max 299000 281000 299000 281000 299000 281000 n (Patient) 249 76 253 72 254 71

[00228] Table 12.9: Comparison of marker levels and the area under the ROC curve (AUC) in EDTA samples for the "persistent" and "non-persistent" cohorts where persistence starts within 96 hours after sample collection and renal status is assessed by serum creatinine (sCr) only, urine output (UO) only, or serum creatinine or urine output RIFLE criteria.
sCr or UO
Persistence Period
Duration (hr) 24 48 72
Non-persistent Persistent Non-persistent Persistent Non-persistent Persistent
Cohort Cohort Cohort Cohort Cohort Cohort
Median 99600 120000 103000 120000 103000 123000
Average 113000 132000 115000 131000 114000 134000
Stdev 40000 46100 41400 45700 40300 47100 p (t-test) 4.6E-5 5.8E-4 1.0E-4
Min 57600 57000 57600 57000 57600 57000
Max 299000 281000 299000 281000 299000 281000 n (Patient) 173 154 188 139 200 127 sCr only

UO only
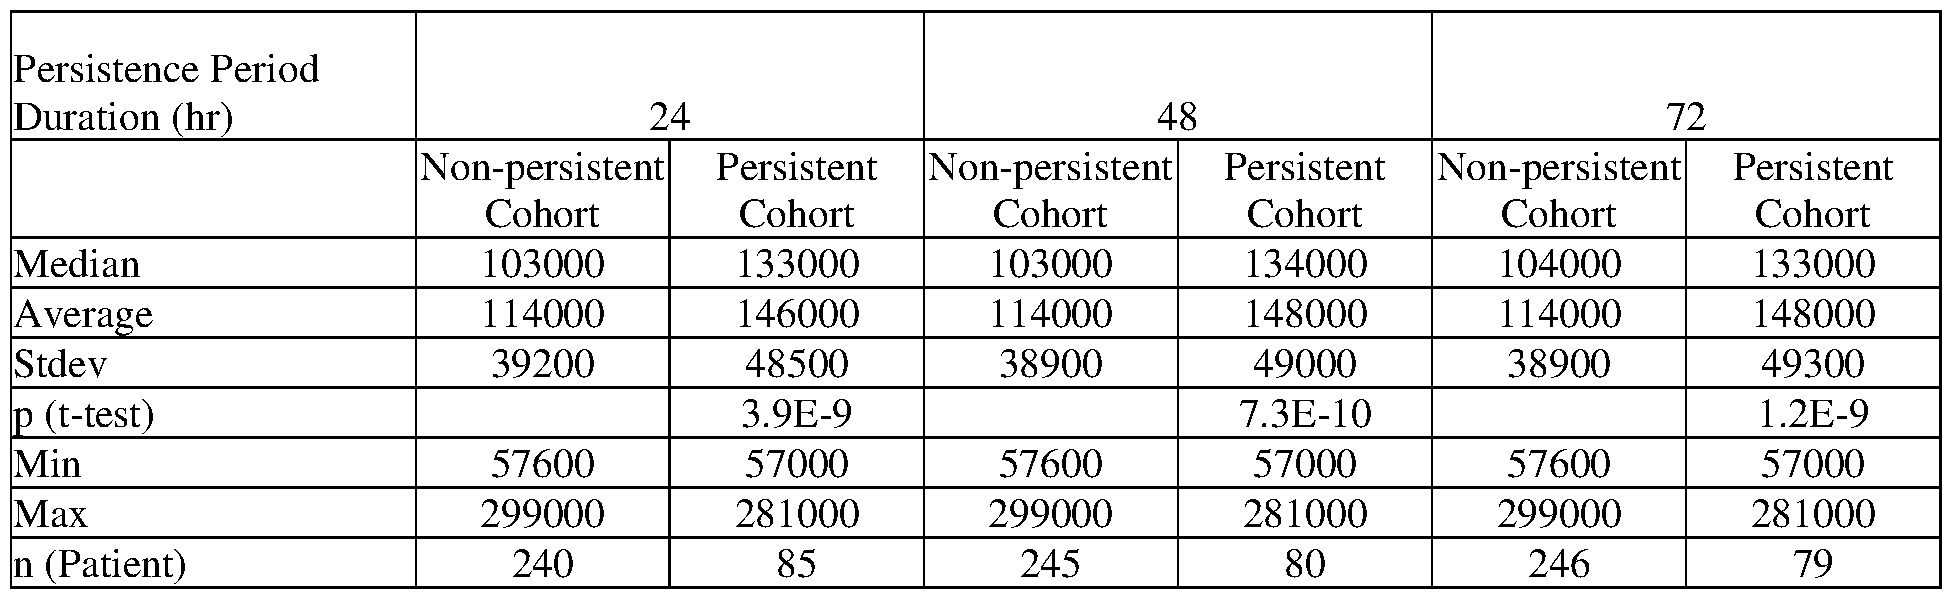

Cutoff Quartile 4 137000 137000 137000 137000 137000 137000 137000 137000 137000
Sensitivity 34% 35% 47% 33% 33% 49% 36% 36% 48%
Specificity 83% 83% 82% 81 % 81 % 82% 82% 82% 82%
OR Quartile 2 2.54 2.28 4.97 2.14 2.05 4.51 2.05 1.96 4.43 p Value 6.2E-4 0.0024 1.3E-4 0.0056 0.0089 3.3E-4 0.011 0.017 3.9E-4
Lower limit of 95%
CI 1.49 1.34 2.19 1.25 1.20 1.98 1.18 1.13 1.94
Upper limit of 95%
CI 4.32 3.89 11.3 3.66 3.51 10.3 3.55 3.40 10.1
OR Quartile 3 2.69 2.68 3.71 2.29 2.15 4.14 2.23 2.09 4.03 p Value 1.5E-5 1.7E-5 2.2E-6 3.0E-4 8.2E-4 8.9E-7 5.7E-4 0.0015 1.4E-6
Lower limit of 95%
CI 1.72 1.71 2.16 1.46 1.37 2.35 1.41 1.33 2.29
Upper limit of 95%
CI 4.21 4.21 6.38 3.58 3.37 7.28 3.51 3.30 7.10
OR Quartile 4 2.43 2.54 4.19 2.09 2.04 4.47 2.59 2.54 4.25 p Value 7.5E-4 4.0E-4 2.1E-7 0.0044 0.0056 8.7E-8 2.7E-4 3.5E-4 2.3E-7
Lower limit of 95%
CI 1.45 1.52 2.44 1.26 1.23 2.58 1.55 1.52 2.46
Upper limit of 95%
CI 4.07 4.24 7.20 3.47 3.39 7.73 4.31 4.23 7.37
[00229] Table 12.10: Comparison of marker levels and the area under the ROC curve (AUC) in EDTA samples for the "persistent" and "non-persistent" cohorts where persistence starts within 168 hours after sample collection and renal status is assessed by serum creatinine (sCr) only, urine output (UO) only, or serum creatinine or urine output RIFLE criteria.
sCr or UO

sCr only


[00230] Example 13. Use of Metalloproteinase inhibitor 2 for evaluating renal status in patients admitted to the ICU: Persistent at RIFLE I or F
[00231] Patients from the intensive care unit (ICU) with RIFLE stage of injury (I) or failure (F) are enrolled in the following study. EDTA anti-coagulated blood samples (10 mL) and urine samples (50 mL) are collected from each patient at enrollment, and at every 12 hours up to day 3, and then every 24 hours thereafter up to day 7 while the subject is hospitalized.
Metalloproteinase inhibitor 2 is measured in the enrollment samples by standard immunoassay methods using commercially available assay reagents.
[00232] Kidney status is assessed by RIFLE criteria based on serum creatinine, urine output, or both serum creatinine and urine output. Two cohorts are defined to represent a "persistent" and a "non-persistent" population. "Persistent" indicates those patients whose minimum RIFLE stage during a period of 24, 48 or 72 hours is injury (I) or failure (F) where the persistence period can start from the time of sample collection to 24, 48, 72, 96 or 168 hours after sample collection. "Non-persistent" indicates those patients who are not persistent at injury (I) or failure (F) and whose minimum RIFLE stage during a period of 24, 48 or 72 hours is non-injury (RIFLE 0) or risk of injury (R) where the persistence period can start from the time of sample collection to 24, 48, 72, 96 or 168 hours after sample collection. If a patient dies after injury (I) or failure (F) or is placed on renal replacement therapy (RRT) at any time from sample collection to 24, 48, 72, 96 or 168 hours after sample collection, the patient is considered "persistent".
[00233] The ability to distinguish the "persistent" and "non-persistent" cohorts is determined using receiver operating characteristic (ROC) analysis.
[00234] Table 13.1: Comparison of marker levels and the area under the ROC curve (AUC) in urine samples for the "persistent" and "non-persistent" cohorts where persistence starts within 24 hours after sample collection and renal status is assessed by serum creatinine (sCr) only, urine output (UO) only, or serum creatinine or urine output RIFLE criteria.
sCr or UO


UO only

 Upper limit of 95% CI 2.99 2.15 7.64 3.41 2.88 7.78 4.00 3.30 8.16
OR Quartile 4 3.39 2.56 5.15 3.28 3.19 5.27 3.78 3.26 5.96 p Value 1.1E-4 0.0012 1.4E-8 2.2E-5 2.9E-5 6.3E-8 1.3E-6 1.2E-5 3.1E-8
Lower limit of 95%
CI 1.83 1.45 2.92 1.90 1.85 2.89 2.21 1.92 3.17
Upper limit of 95% CI 6.28 4.51 9.07 5.68 5.51 9.62 6.48 5.54 11.2
[00235] Table 13.2: Comparison of marker levels and the area under the ROC curve (AUC) in urine samples for the "persistent" and "non-persistent" cohorts where persistence starts within 48 hours after sample collection and renal status is assessed by serum creatinine (sCr) only, urine output (UO) only, or serum creatinine or urine output RIFLE criteria.
sCr or UO


UO only

Duration (hr) 24 48 72
sCr or sCr or sCr or
UO sCr only UO only UO sCr only UO only UO sCr only UO only
AUC 0.65 0.59 0.73 0.65 0.62 0.72 0.67 0.64 0.71
SE 0.031 0.032 0.033 0.031 0.031 0.036 0.030 0.031 0.038 p Value 1.6E-6 0.0039 1.9E-12 7.9E-7 1.1E-4 1.3E-9 1.7E-8 9.4E-6 1.8E-8 nCohort Non- persistent 112 126 222 147 154 238 165 169 245 nCohort Persistent 205 190 93 170 162 77 152 147 70
Cutoff Quartile 2 7990 7980 8020 7990 7980 8020 7990 7980 8020
Sensitivity 81 % 79% 89% 81 % 80% 87% 84% 82% 86%
Specificity 36% 31 % 31 % 32% 30% 29% 33% 31 % 28%
Cutoff Quartile 3 13500 13500 13500 13500 13500 13500 13500 13500 13500
Sensitivity 57% 54% 71 % 60% 57% 70% 62% 59% 70%
Specificity 62% 56% 59% 61 % 58% 56% 61 % 58% 56%
Cutoff Quartile 4 28900 28100 29400 28900 28100 29400 28900 28100 29400
Sensitivity 33% 32% 46% 35% 35% 47% 38% 37% 49%
Specificity 88% 85% 84% 86% 85% 82% 86% 85% 82%
OR Quartile 2 2.36 1.68 3.74 2.03 1.66 2.74 2.67 2.13 2.35 p Value 0.0012 0.048 3.0E-4 0.0075 0.052 0.0062 4.0E-4 0.0056 0.021
Lower limit of 95%
CI 1.40 1.01 1.83 1.21 0.995 1.33 1.55 1.25 1.14
Upper limit of 95% CI 3.98 2.81 7.65 3.40 2.79 5.63 4.59 3.63 4.86
OR Quartile 3 2.22 1.45 3.45 2.37 1.85 3.03 2.63 2.00 2.91 p Value 9.5E-4 0.11 3.2E-6 1.8E-4 0.0071 8.3E-5 3.0E-5 0.0024 2.4E-4
Lower limit of 95%
CI 1.38 0.921 2.05 1.51 1.18 1.74 1.67 1.28 1.65
Upper limit of 95% CI 3.55 2.28 5.82 3.72 2.88 5.25 4.14 3.14 5.15
OR Quartile 4 3.70 2.60 4.44 3.19 3.01 3.98 3.70 3.34 4.20 p Value 7.6E-5 0.0012 6.8E-8 4.9E-5 8.3E-5 1.1E-6 3.0E-6 1.2E-5 7.9E-7
Lower limit of 95% CI 1.93 1.46 2.58 1.82 1.74 2.28 2.14 1.95 2.38
Upper limit of 95% CI 7.07 4.62 7.64 5.58 5.21 6.95 6.42 5.75 7.42
[00236] Table 13.3: Comparison of marker levels and the area under the ROC curve (AUC) in urine samples for the "persistent" and "non-persistent" cohorts where persistence starts within 72 hours after sample collection and renal status is assessed by serum creatinine (sCr) only, urine output (UO) only, or serum creatinine or urine output RIFLE criteria.
sCr or UO

Duration (hr) 24 48 72
Non-persistent Persistent Non-persistent Persistent Non-persistent Persistent
Cohort Cohort Cohort Cohort Cohort Cohort
Median 11500 16000 11600 18600 11600 18800
Average 17200 36600 16900 40100 18100 40600
Stdev 15000 63900 14800 68100 21500 68900 p (t-test) 9.8E-4 5.3E-5 8.5E-5
Min 200 658 200 658 200 658
Max 76000 428000 76000 428000 215000 428000 n (Patient) 124 192 151 165 163 153
UO only


Lower limit of 95%
CI 1.90 1.41 2.21 1.87 1.65 2.06 2.04 1.75 2.11
Upper limit of 95% CI 6.95 4.47 6.43 5.80 4.95 6.06 6.18 5.17 6.29
[00237] Table 13.4: Comparison of marker levels and the area under the ROC curve (AUC) in urine samples for the "persistent" and "non-persistent" cohorts where persistence starts within 96 hours after sample collection and renal status is assessed by serum creatinine (sCr) only, urine output (UO) only, or serum creatinine or urine output RIFLE criteria.
sCr or UO


UO only

Duration (hr) 24 48 72
sCr or sCr or sCr or
UO sCr only UO only UO sCr only UO only UO sCr only UO only
AUC 0.65 0.60 0.69 0.65 0.62 0.69 0.65 0.63 0.68
SE 0.031 0.032 0.033 0.031 0.031 0.034 0.031 0.031 0.035 p Value 3.2E-6 0.0030 3.4E-9 9.4E-7 1.8E-4 4.8E-8 3.8E-7 6.6E-5 4.3E-7 nCohort Non- persistent 110 124 208 143 150 220 156 162 226 nCohort Persistent 207 192 107 174 166 95 161 154 89
Cutoff Quartile 2 7990 7980 8020 7990 7980 8020 7990 7980 8020
Sensitivity 81 % 79% 86% 81 % 80% 85% 83% 81 % 84%
Specificity 35% 31 % 31 % 32% 30% 30% 33% 31 % 29%
Cutoff Quartile 3 13500 13500 13500 13500 13500 13500 13500 13500 13500
Sensitivity 57% 54% 66% 60% 57% 66% 61 % 58% 66%
Specificity 63% 56% 58% 62% 58% 57% 61 % 58% 56%
Cutoff Quartile 4 28900 28100 29400 28900 28100 29400 28900 28100 29400
Sensitivity 32% 31 % 41 % 34% 34% 42% 36% 35% 43%
Specificity 88% 85% 83% 86% 85% 82% 86% 85% 82%
OR Quartile 2 2.29 1.74 2.73 2.03 1.66 2.43 2.31 1.92 2.16 p Value 0.0018 0.034 0.0015 0.0074 0.052 0.0064 0.0019 0.014 0.018
Lower limit of 95%
CI 1.36 1.04 1.47 1.21 0.995 1.28 1.36 1.14 1.14
Upper limit of 95% CI 3.86 2.92 5.07 3.40 2.78 4.59 3.91 3.25 4.10
OR Quartile 3 2.23 1.53 2.74 2.38 1.85 2.59 2.42 1.94 2.52 p Value 9.1E-4 0.066 4.8E-5 1.8E-4 0.0071 2.0E-4 1.2E-4 0.0036 4.0E-4
Lower limit of 95%
CI 1.39 0.972 1.69 1.51 1.18 1.57 1.54 1.24 1.51
Upper limit of 95% CI 3.59 2.41 4.46 3.74 2.89 4.28 3.80 3.04 4.21
OR Quartile 4 3.57 2.51 3.45 3.24 2.81 3.38 3.43 2.96 3.36 p Value 1.2E-4 0.0017 4.5E-6 4.8E-5 2.2E-4 8.1E-6 1.3E-5 8.1E-5 1.1E-5
Lower limit of 95%
CI 1.87 1.41 2.03 1.84 1.62 1.98 1.97 1.73 1.96
Upper limit of 95% CI 6.83 4.47 5.86 5.70 4.86 5.76 5.97 5.08 5.77
[00238] Table 13.5: Comparison of marker levels and the area under the ROC curve (AUC) in urine samples for the "persistent" and "non-persistent" cohorts where persistence starts within 168 hours after sample collection and renal status is assessed by serum creatinine (sCr) only, urine output (UO) only, or serum creatinine or urine output RIFLE criteria.
sCr or UO


UO only

 Upper limit of 95% CI 3.44 2.36 5.19 3.88 2.90 4.91 3.81 3.04 4.95
OR Quartile 4 3.72 2.60 3.78 3.53 3.08 3.50 3.64 3.22 3.39 p Value 1.1E-4 0.0013 9.3E-7 2.2E-5 8.3E-5 3.7E-6 7.8E-6 3.0E-5 7.1E-6
Lower limit of 95%
CI 1.91 1.45 2.22 1.97 1.76 2.06 2.07 1.86 1.99
Upper limit of 95% CI 7.25 4.68 6.44 6.33 5.40 5.96 6.43 5.58 5.77
[00239] Table 13.6: Comparison of marker levels and the area under the ROC curve (AUC) in EDTA samples for the "persistent" and "non-persistent" cohorts where persistence starts within 24 hours after sample collection and renal status is assessed by serum creatinine (sCr) only, urine output (UO) only, or serum creatinine or urine output RIFLE criteria.
sCr or UO


UO only

Duration (hr) 24 48 72
sCr or sCr or sCr or
UO sCr only UO only UO sCr only UO only UO sCr only UO only
AUC 0.65 0.67 0.62 0.64 0.66 0.66 0.62 0.62 0.69
SE 0.031 0.030 0.037 0.030 0.030 0.040 0.031 0.031 0.042 p Value 4.4E-7 4.0E-9 0.0013 2.8E-6 6.2E-8 9.2E-5 1.6E-4 2.2E-4 5.8E-6 nCohort Non- persistent 114 124 245 155 157 261 179 182 269 nCohort Persistent 213 202 80 172 169 64 148 144 56
Cutoff Quartile 2 90400 90300 90600 90400 90300 90600 90400 90300 90600
Sensitivity 80% 80% 85% 83% 83% 89% 83% 82% 91 %
Specificity 34% 34% 28% 34% 34% 28% 32% 31 % 28%
Cutoff Quartile 3 109000 109000 109000 109000 109000 109000 109000 109000 109000
Sensitivity 58% 60% 62% 61 % 63% 66% 63% 63% 71 %
Specificity 65% 66% 54% 62% 64% 54% 60% 60% 54%
Cutoff Quartile 4 137000 137000 137000 137000 137000 137000 137000 137000 137000
Sensitivity 31 % 33% 38% 31 % 33% 41 % 31 % 32% 45%
Specificity 87% 88% 79% 81 % 83% 79% 80% 80% 79%
OR Quartile 2 2.06 2.07 2.22 2.56 2.46 3.22 2.30 2.02 4.02 p Value 0.0058 0.0049 0.020 3.8E-4 6.7E-4 0.0057 0.0022 0.0093 0.0044
Lower limit of 95%
CI 1.23 1.25 1.13 1.52 1.46 1.41 1.35 1.19 1.54
Upper limit of 95%
CI 3.43 3.45 4.36 4.31 4.13 7.39 3.92 3.42 10.4
OR Quartile 3 2.58 2.92 1.95 2.55 2.95 2.21 2.57 2.62 2.97 p Value 8.2E-5 6.8E-6 0.012 3.9E-5 2.5E-6 0.0065 3.6E-5 2.7E-5 6.8E-4
Lower limit of 95%
CI 1.61 1.83 1.16 1.63 1.88 1.25 1.64 1.67 1.58
Upper limit of 95%
CI 4.13 4.65 3.27 3.98 4.63 3.91 4.03 4.12 5.56
OR Quartile 4 3.03 3.61 2.23 1.94 2.50 2.50 1.79 1.90 3.00 p Value 4.2E-4 4.2E-5 0.0041 0.012 7.0E-4 0.0019 0.024 0.013 3.5E-4
Lower limit of 95%
CI 1.64 1.95 1.29 1.15 1.47 1.40 1.08 1.15 1.64
Upper limit of 95%
CI 5.60 6.66 3.85 3.25 4.24 4.47 2.97 3.16 5.48
[00240] Table 13.7: Comparison of marker levels and the area under the ROC curve (AUC) in EDTA samples for the "persistent" and "non-persistent" cohorts where persistence starts within 48 hours after sample collection and renal status is assessed by serum creatinine (sCr) only, urine output (UO) only, or serum creatinine or urine output RIFLE criteria.
sCr or UO

Persistence Period
Duration (hr) 24 48 72
Non-persistent Persistent Non-persistent Persistent Non-persistent Persistent Cohort Cohort Cohort Cohort Cohort Cohort
Median 97500 120000 98700 121000 100000 121000
Average 105000 132000 111000 131000 115000 129000
Stdev 31200 47500 41100 44700 43800 43300 p (t-test) 8.4E-8 6.2E-5 0.0032
Min 57600 57000 57600 57000 57600 57000
Max 252000 299000 299000 281000 299000 281000 n (Patient) 120 206 149 177 166 160
UO only


Lower limit of 95%
CI 1.95 2.07 1.39 1.78 1.89 1.49 1.76 1.74 1.73
Upper limit of 95%
CI 5.18 5.36 3.68 4.38 4.68 4.21 4.30 4.26 5.18
OR Quartile 4 3.76 4.15 2.52 2.15 2.54 2.73 1.95 2.04 3.05 p Value 9.3E-5 1.5E-5 5.1E-4 0.0048 6.9E-4 2.5E-4 0.010 0.0065 7.0E-5
Lower limit of 95%
CI 1.93 2.18 1.50 1.26 1.48 1.60 1.17 1.22 1.76
Upper limit of 95%
CI 7.30 7.90 4.25 3.67 4.35 4.68 3.26 3.40 5.27
[00241] Table 13.8: Comparison of marker levels and the area under the ROC curve (AUC) in EDTA samples for the "persistent" and "non-persistent" cohorts where persistence starts within 72 hours after sample collection and renal status is assessed by serum creatinine (sCr) only, urine output (UO) only, or serum creatinine or urine output RIFLE criteria.
sCr or UO


UO only

Min 57600 57000 57600 57000 57600 57000
Max 299000 281000 299000 281000 299000 281000 n (Patient) 216 109 230 95 237 88

[00242] Table 13.9: Comparison of marker levels and the area under the ROC curve (AUC) in EDTA samples for the "persistent" and "non-persistent" cohorts where persistence starts within 96 hours after sample collection and renal status is assessed by serum creatinine (sCr) only, urine output (UO) only, or serum creatinine or urine output RIFLE criteria.
sCr or UO
 Median 96500 118000 98000 120000 98700 120000
Average 106000 129000 111000 130000 113000 129000
Stdev 33600 46300 41000 44600 42500 44100 p (t-test) 3.6E-6 1.1E-4 9.9E-4
Min 57600 57000 57600 57000 57600 57000
Max 252000 299000 299000 281000 299000 281000 n (Patient) 106 221 140 187 155 172 sCr only
Persistence Period
Duration (hr) 24 48 72
Non-persistent Persistent Non-persistent Persistent Non-persistent Persistent Cohort Cohort Cohort Cohort Cohort Cohort
Median 97100 120000 98300 122000 98800 122000
Average 104000 132000 110000 131000 112000 131000
Stdev 31100 47300 39100 45500 41100 44900 p (t-test) 4.6E-8 7.0E-6 1.0E-4
Min 57600 57000 57600 57000 57600 57000
Max 252000 299000 299000 281000 299000 281000 n (Patient) 118 208 144 182 158 168
UO only

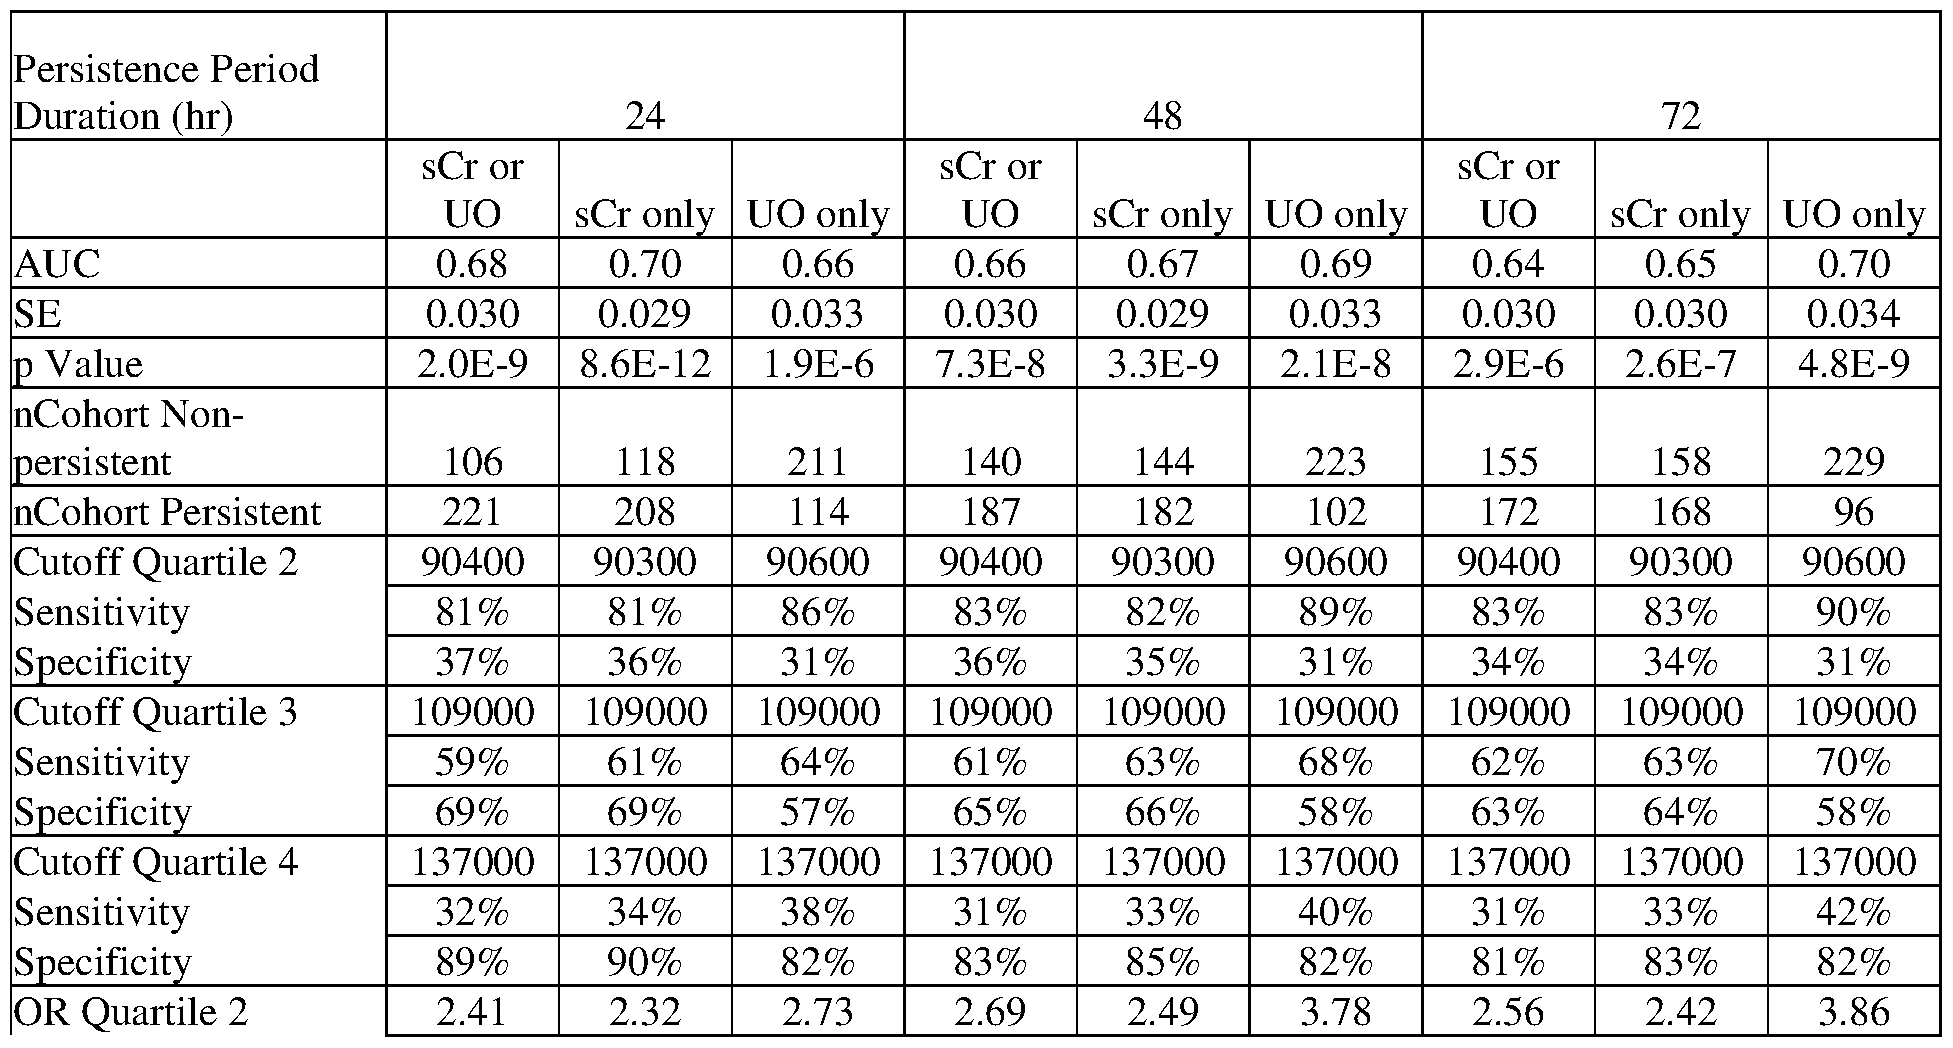
Lower limit of 95%
CI 1.44 1.39 1.49 1.61 1.49 1.90 1.52 1.44 1.90
Upper limit of 95%
CI 4.04 3.87 4.99 4.50 4.17 7.52 4.31 4.06 7.88
OR Quartile 3 3.22 3.57 2.39 2.97 3.25 2.87 2.83 3.03 3.20 p Value 3.0E-6 2.1E-7 2.7E-4 2.9E-6 4.3E-7 2.7E-5 5.6E-6 1.5E-6 7.4E-6
Lower limit of 95%
CI 1.97 2.21 1.50 1.88 2.06 1.75 1.81 1.93 1.92
Upper limit of 95%
CI 5.26 5.78 3.83 4.68 5.13 4.70 4.43 4.76 5.32
OR Quartile 4 3.63 4.48 2.67 2.17 2.73 2.98 1.94 2.36 3.18 p Value 1.4E-4 9.2E-6 1.8E-4 0.0047 3.4E-4 3.9E-5 0.012 0.0013 1.6E-5
Lower limit of 95%
CI 1.87 2.31 1.60 1.27 1.57 1.77 1.15 1.40 1.88
Upper limit of 95%
CI 7.06 8.69 4.47 3.72 4.72 5.02 3.25 3.99 5.38
[00243] Table 13.10: Comparison of marker levels and the area under the ROC curve (AUC) in EDTA samples for the "persistent" and "non-persistent" cohorts where persistence starts within 168 hours after sample collection and renal status is assessed by serum creatinine (sCr) only, urine output (UO) only, or serum creatinine or urine output RIFLE criteria.
sCr or UO


UO only
Persistence Period
Duration (hr) 24 48 72
Non-persistent Persistent Non-persistent Persistent Non-persistent Persistent
Cohort Cohort Cohort Cohort Cohort Cohort
Median 104000 123000 103000 125000 103000 125000
Average 115000 134000 114000 137000 114000 138000
Stdev 40800 46800 40500 46800 40200 47400 p (t-test) 1.3E-4 5.9E-6 3.3E-6
Min 57600 57000 57600 57000 57600 57000
Max 299000 281000 299000 281000 299000 281000 n (Patient) 204 121 214 111 219 106

[00244] Example 14. Use of Metalloproteinase inhibitor 4 for evaluating renal status in patients admitted to the ICU: Recovery to RIFLE 0 from RIFLE I and F
[00245] Patients from the intensive care unit (ICU) with RIFLE stage of injury (I) or failure (F) are enrolled in the following study. EDTA anti-coagulated blood samples (10 mL) and urine
samples (50 mL) are collected from each patient at enrollment, and at every 12 hours up to day 3, and then every 24 hours thereafter up to day 7 while the subject is hospitalized.
Metalloproteinase inhibitor 4 is measured in the enrollment samples by standard immunoassay methods using commercially available assay reagents.
[00246] Kidney status is assessed by RIFLE criteria based on serum creatinine, urine output, or both serum creatinine and urine output. Two cohorts are defined to represent a "recovered" and a "non-recovered" population. "Recovered" indicates those patients whose maximum RIFLE stage during a period of 24, 48 or 72 hours is non-injury (RIFLE 0) where the recovery period can start from the time of sample collection to 24, 48, 72, 96 or 168 hours after sample collection. "Non-recovered" indicates those patients whose maximum RIFLE stage during a period of 24, 48 or 72 hours is risk of injury (R), injury (I) or failure (F) where the recovery period can start from the time of sample collection to 24, 48, 72, 96 or 168 hours after sample collection. If a patient dies or is placed on renal replacement therapy (RRT) at any time from sample collection to 24, 48, 72, 96 or 168 hours after sample collection, the patient is considered "non-recovered".
[00247] The ability to distinguish the "recovered" and "non-recovered" cohorts is determined using receiver operating characteristic (ROC) analysis.
[00248] Table 14.1: Comparison of marker levels and the area under the ROC curve (AUC) in urine samples for the "recovered" and "non-recovered" cohorts where recovery starts within 24 hours after sample collection and renal status is assessed by serum creatinine (sCr) only, urine output (UO) only, or serum creatinine or urine output RIFLE criteria.
sCr or UO


Median 13.0 29.0 13.3 28.8 13.3 28.8
Average 22.6 203 23.1 201 21.3 199
Stdev 27.4 884 27.6 880 21.5 873 p (t-test) 0.077 0.083 0.091
Min 0.00110 0.00167 0.00167 0.00110 0.00167 0.00110
Max 173 9030 173 9030 108 9030 n (Patient) 76 240 74 242 70 246
UO only
Recovery Period
Duration (hr) 24 48 72
Non- Non- Non-
Recovered recovered Recovered recovered Recovered recovered Cohort Cohort Cohort Cohort Cohort Cohort
Median 17.0 38.8 16.9 34.6 15.7 33.7
Average 97.5 261 98.2 236 98.8 220
Stdev 655 931 691 863 725 819 p (t-test) 0.069 0.12 0.16
Min 0.00110 0.00277 0.00110 0.00273 0.00110 0.00273
Max 9030 7570 9030 7570 9030 7570 n (Patient) 194 121 173 142 156 159

Upper limit of 95% CI 49.5 23.2 4.07 37.6 22.3 3.66 32.6 32.7 3.95
[00249] Table 14.2: Comparison of marker levels and the area under the ROC curve (AUC) in urine samples for the "recovered" and "non-recovered" cohorts where recovery starts within 48 hours after sample collection and renal status is assessed by serum creatinine (sCr) only, urine output (UO) only, or serum creatinine or urine output RIFLE criteria.
sCr or UO


UO only

Duration (hr) 24 48 72
sCr or sCr or sCr or
UO sCr only UO only UO sCr only UO only UO sCr only UO only
AUC 0.71 0.68 0.64 0.68 0.67 0.61 0.69 0.67 0.62
SE 0.030 0.030 0.034 0.032 0.031 0.033 0.032 0.031 0.032 p Value 2.8E-12 7.0E-9 7.9E-5 2.9E-8 5.4E-8 0.0012 2.0E-9 3.6E-8 1.9E-4 nCohort Recovered 90 106 212 79 104 194 71 99 178 nCohort Non- recovered 227 211 103 238 213 121 246 218 137
Cutoff Quartile 2 8.33 8.33 8.36 8.33 8.33 8.36 8.33 8.33 8.36
Sensitivity 83% 81 % 89% 81 % 81 % 86% 81 % 80% 85%
Specificity 44% 37% 32% 42% 37% 32% 45% 36% 33%
Cutoff Quartile 3 24.1 24.1 24.1 24.1 24.1 24.1 24.1 24.1 24.1
Sensitivity 58% 57% 62% 56% 57% 59% 57% 57% 60%
Specificity 70% 64% 56% 68% 63% 55% 73% 65% 57%
Cutoff Quartile 4 60.9 60.9 61.8 60.9 60.9 61.8 60.9 60.9 61.8
Sensitivity 33% 34% 33% 31 % 33% 30% 30% 33% 31 %
Specificity 93% 92% 79% 92% 91 % 78% 93% 92% 79%
OR Quartile 2 3.86 2.49 3.95 2.99 2.42 2.87 3.47 2.33 2.90 p Value 9.7E-7 6.5E-4 9.2E-5 9.5E-5 9.9E-4 5.1E-4 1.6E-5 0.0017 2.4E-4
Lower limit of 95% CI 2.25 1.47 1.98 1.73 1.43 1.58 1.97 1.37 1.64 Upper limit of 95% CI 6.62 4.20 7.86 5.19 4.08 5.21 6.11 3.94 5.12
OR Quartile 3 3.24 2.41 2.06 2.78 2.28 1.75 3.61 2.41 2.00 p Value 1.0E-5 3.5E-4 0.0033 2.0E-4 7.9E-4 0.017 1.6E-5 4.5E-4 0.0027
Lower limit of 95% CI 1.92 1.49 1.27 1.62 1.41 1.10 2.02 1.48 1.27 Upper limit of 95% CI 5.47 3.89 3.33 4.77 3.70 2.76 6.47 3.94 3.15
OR Quartile 4 6.77 5.47 1.83 5.49 5.28 1.49 5.79 5.61 1.68 p Value 1.8E-5 6.9E-6 0.025 1.4E-4 1.1E-5 0.13 2.9E-4 1.3E-5 0.046
Lower limit of 95% CI 2.83 2.61 1.08 2.29 2.52 0.887 2.24 2.58 1.01 Upper limit of 95% CI 16.2 11.5 3.10 13.2 11.1 2.49 15.0 12.2 2.81
[00250] Table 14.3: Comparison of marker levels and the area under the ROC curve (AUC) in urine samples for the "recovered" and "non-recovered" cohorts where recovery starts within 72 hours after sample collection and renal status is assessed by serum creatinine (sCr) only, urine output (UO) only, or serum creatinine or urine output RIFLE criteria.
sCr or UO
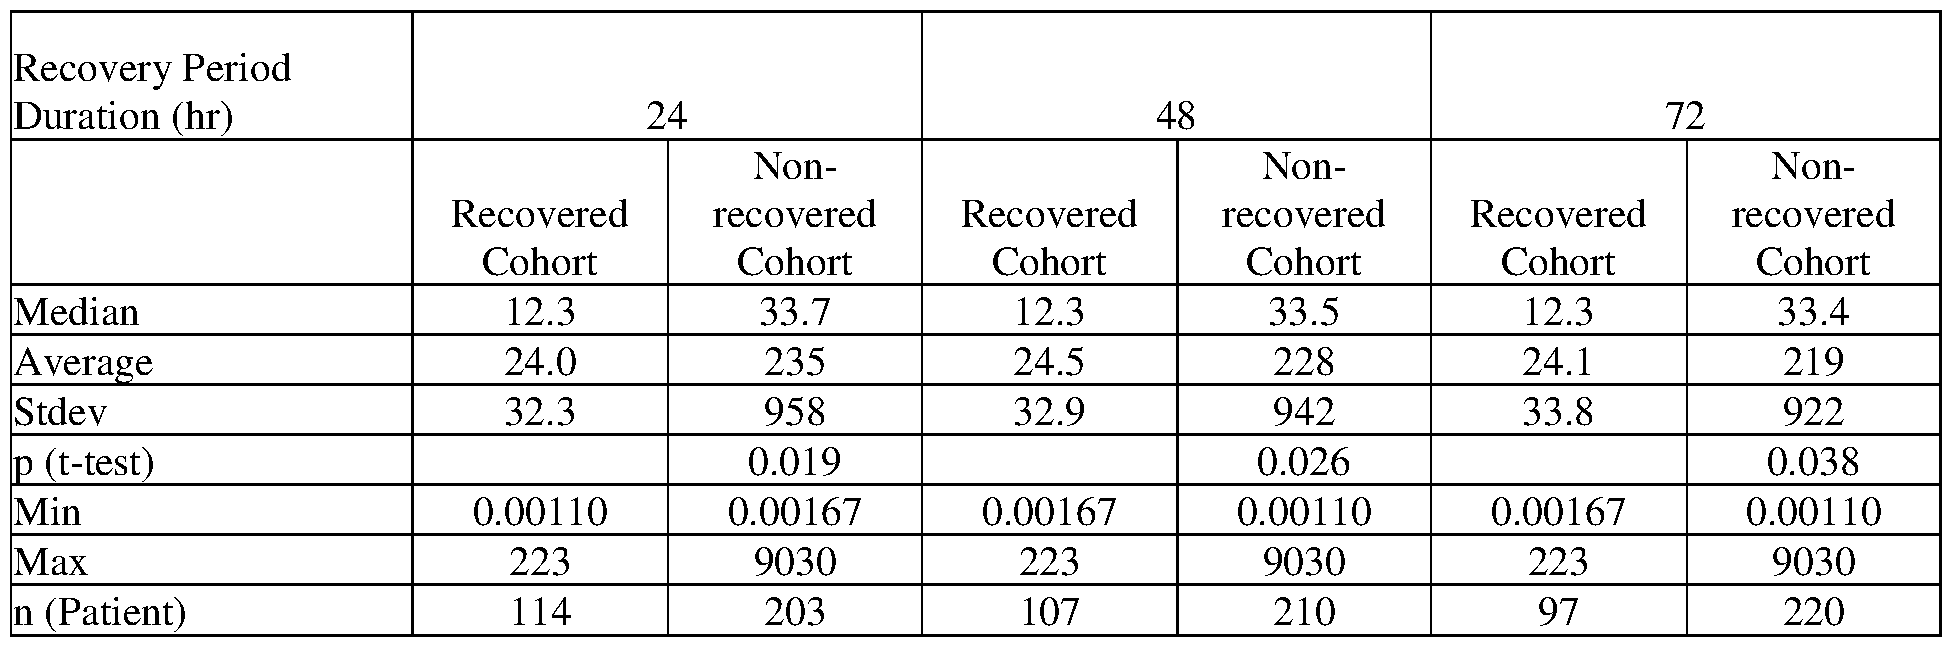
Duration (hr) 24 48 72
Non- Non- Non-
Recovered recovered Recovered recovered Recovered recovered
Cohort Cohort Cohort Cohort Cohort Cohort
Median 12.7 35.5 13.3 33.4 13.3 34.0
Average 27.3 248 27.8 244 26.9 239
Stdev 36.2 989 36.5 982 34.6 970 p (t-test) 0.013 0.015 0.018
Min 0.00110 0.00167 0.00167 0.00110 0.00167 0.00110
Max 223 9030 223 9030 223 9030 n (Patient) 127 190 124 193 119 198
UO only


Lower limit of 95% CI 2.69 2.50 0.970 2.38 2.38 0.861 2.49 2.40 1.09
Upper limit of 95% CI 11.1 9.12 2.80 9.88 8.67 2.45 11.8 9.07 3.05
[00251] Table 14.4: Comparison of marker levels and the area under the ROC curve (AUC) in urine samples for the "recovered" and "non-recovered" cohorts where recovery starts within 96 hours after sample collection and renal status is assessed by serum creatinine (sCr) only, urine output (UO) only, or serum creatinine or urine output RIFLE criteria.
sCr or UO


UO only

Duration (hr) 24 48 72
sCr or sCr or sCr or
UO sCr only UO only UO sCr only UO only UO sCr only UO only
AUC 0.71 0.69 0.64 0.70 0.68 0.63 0.70 0.69 0.65
SE 0.028 0.029 0.035 0.029 0.030 0.034 0.029 0.029 0.032 p Value 6.0E-14 5.9E-11 7.2E-5 9.9E-12 5.2E-10 8.2E-5 2.5E-11 2.4E-10 5.1E-6 nCohort Recovered 134 140 216 125 138 207 114 135 194 nCohort Non- recovered 183 177 99 192 179 108 203 182 121
Cutoff Quartile 2 8.33 8.33 8.36 8.33 8.33 8.36 8.33 8.33 8.36
Sensitivity 85% 84% 86% 83% 83% 86% 83% 83% 86%
Specificity 38% 36% 30% 38% 36% 31 % 39% 36% 32%
Cutoff Quartile 3 24.1 24.1 24.1 24.1 24.1 24.1 24.1 24.1 24.1
Sensitivity 62% 60% 64% 61 % 60% 64% 61 % 60% 65%
Specificity 66% 63% 56% 67% 62% 57% 69% 63% 59%
Cutoff Quartile 4 60.9 60.9 61.8 60.9 60.9 61.8 60.9 60.9 61.8
Sensitivity 37% 37% 34% 35% 36% 32% 34% 36% 33%
Specificity 90% 89% 79% 90% 89% 79% 90% 90% 80%
OR Quartile 2 3.40 2.84 2.61 3.01 2.73 2.77 3.02 2.69 2.87 p Value 6.6E-6 1.1E-4 0.0031 3.8E-5 1.7E-4 0.0013 3.6E-5 2.1E-4 5.1E-4
Lower limit of 95% CI 2.00 1.67 1.38 1.78 1.62 1.49 1.79 1.59 1.58 Upper limit of 95% CI 5.79 4.80 4.94 5.09 4.62 5.16 5.10 4.53 5.21
OR Quartile 3 3.27 2.59 2.23 3.27 2.46 2.35 3.54 2.54 2.74 p Value 6.6E-7 4.5E-5 0.0013 9.4E-7 1.1E-4 4.9E-4 3.7E-7 6.7E-5 2.8E-5
Lower limit of 95% CI 2.05 1.64 1.37 2.04 1.56 1.45 2.18 1.61 1.71 Upper limit of 95% CI 5.21 4.08 3.64 5.24 3.88 3.79 5.77 4.01 4.39
OR Quartile 4 5.38 4.84 1.99 4.62 4.68 1.78 4.82 4.92 1.96 p Value 3.4E-7 5.4E-7 0.011 3.5E-6 9.4E-7 0.031 7.0E-6 7.4E-7 0.011
Lower limit of 95% CI 2.82 2.61 1.17 2.42 2.52 1.05 2.43 2.62 1.17 Upper limit of 95% CI 10.3 8.96 3.37 8.81 8.66 3.00 9.58 9.24 3.29
[00252] Table 14.5: Comparison of marker levels and the area under the ROC curve (AUC) in urine samples for the "recovered" and "non-recovered" cohorts where recovery starts within 168 hours after sample collection and renal status is assessed by serum creatinine (sCr) only, urine output (UO) only, or serum creatinine or urine output RIFLE criteria.
sCr or UO

Duration (hr) 24 48 72
Non- Non- Non-
Recovered recovered Recovered recovered Recovered recovered Cohort Cohort Cohort Cohort Cohort Cohort
Median 15.1 38.6 15.4 37.8 15.1 38.6
Average 36.5 284 36.8 280 35.9 279
Stdev 67.1 1080 67.5 1070 66.9 1070 p (t-test) 0.0041 0.0050 0.0050
Min 0.00110 0.00167 0.00110 0.00167 0.00110 0.00167
Max 453 9030 453 9030 453 9030 n (Patient) 160 157 157 160 156 161
UO only


Lower limit of 95% CI 1.71 2.27 1.31 1.74 2.33 1.24 1.74 2.47 1.25
Upper limit of 95% CI 4.87 6.98 3.76 4.95 7.25 3.52 4.95 7.82 3.55
[00253] Table 14.6: Comparison of marker levels and the area under the ROC curve (AUC) in EDTA samples for the "recovered" and "non-recovered" cohorts where recovery starts within 24 hours after sample collection and renal status is assessed by serum creatinine (sCr) only, urine output (UO) only, or serum creatinine or urine output RIFLE criteria.
sCr or UO


UO only

Duration (hr) 24 48 72
sCr or sCr or sCr or
UO sCr only UO only UO sCr only UO only UO sCr only UO only
AUC 0.56 0.56 0.62 0.56 0.57 0.62 0.56 0.56 0.61
SE 0.042 0.038 0.032 0.046 0.038 0.031 0.048 0.039 0.031 p Value 0.13 0.12 2.5E-4 0.16 0.062 1.5E-4 0.22 0.12 5.5E-4 nCohort Recovered 52 69 197 42 67 176 38 63 159 nCohort Non- recovered 275 257 128 285 259 149 289 263 166
Cutoff Quartile 2 2320 2320 2330 2320 2320 2330 2320 2320 2330
Sensitivity 76% 76% 83% 76% 76% 82% 76% 76% 82%
Specificity 33% 30% 30% 33% 31 % 31 % 32% 30% 32%
Cutoff Quartile 3 3280 3280 3280 3280 3280 3280 3280 3280 3280
Sensitivity 51 % 51 % 60% 51 % 51 % 59% 51 % 51 % 57%
Specificity 52% 52% 56% 52% 54% 57% 53% 54% 57%
Cutoff Quartile 4 4720 4710 4720 4720 4710 4720 4720 4710 4720
Sensitivity 27% 28% 32% 27% 28% 31 % 26% 27% 30%
Specificity 85% 84% 79% 86% 85% 80% 84% 84% 79%
OR Quartile 2 1.57 1.41 2.06 1.60 1.48 2.00 1.44 1.37 2.14 p Value 0.17 0.26 0.010 0.19 0.19 0.0098 0.33 0.31 0.0039
Lower limit of 95% CI 0.825 0.781 1.19 0.795 0.821 1.18 0.692 0.746 1.28 Upper limit of 95% CI 2.98 2.53 3.57 3.20 2.67 3.38 3.01 2.52 3.59
OR Quartile 3 1.10 1.12 1.95 1.12 1.21 1.94 1.13 1.22 1.70 p Value 0.74 0.68 0.0038 0.73 0.49 0.0033 0.72 0.48 0.017
Lower limit of 95% CI 0.610 0.656 1.24 0.587 0.704 1.25 0.576 0.702 1.10 Upper limit of 95% CI 2.00 1.90 3.06 2.15 2.07 3.02 2.23 2.11 2.64
OR Quartile 4 2.02 2.01 1.79 2.18 2.19 1.74 1.90 2.00 1.60 p Value 0.084 0.050 0.024 0.090 0.034 0.032 0.17 0.062 0.070
Lower limit of 95% CI 0.911 0.999 1.08 0.884 1.06 1.05 0.766 0.965 0.962 Upper limit of 95% CI 4.50 4.05 2.97 5.38 4.53 2.88 4.73 4.14 2.66
[00254] Table 14.7: Comparison of marker levels and the area under the ROC curve (AUC) in EDTA samples for the "recovered" and "non-recovered" cohorts where recovery starts within 48 hours after sample collection and renal status is assessed by serum creatinine (sCr) only, urine output (UO) only, or serum creatinine or urine output RIFLE criteria.
sCr or UO

Duration (hr) 24 48 72
Non- Non- Non-
Recovered recovered Recovered recovered Recovered recovered
Cohort Cohort Cohort Cohort Cohort Cohort
Median 3040 3390 3040 3440 2980 3430
Average 3380 4090 3310 4110 3330 4090
Stdev 1640 2680 1520 2700 1530 2680 p (t-test) 0.015 0.0059 0.011
Min 1080 863 1080 863 1080 863
Max 9820 19700 9100 19700 9100 19700 n (Patient) 101 226 99 228 94 233
UO only


Lower limit of 95% CI 1.20 1.10 1.11 1.05 1.15 1.10 0.994 1.05 1.07
Upper limit of 95% CI 4.41 3.62 3.11 4.05 3.88 3.03 4.03 3.54 2.93
[00255] Table 14.8: Comparison of marker levels and the area under the ROC curve (AUC) in EDTA samples for the "recovered" and "non-recovered" cohorts where recovery starts within 72 hours after sample collection and renal status is assessed by serum creatinine (sCr) only, urine output (UO) only, or serum creatinine or urine output RIFLE criteria.
sCr or UO

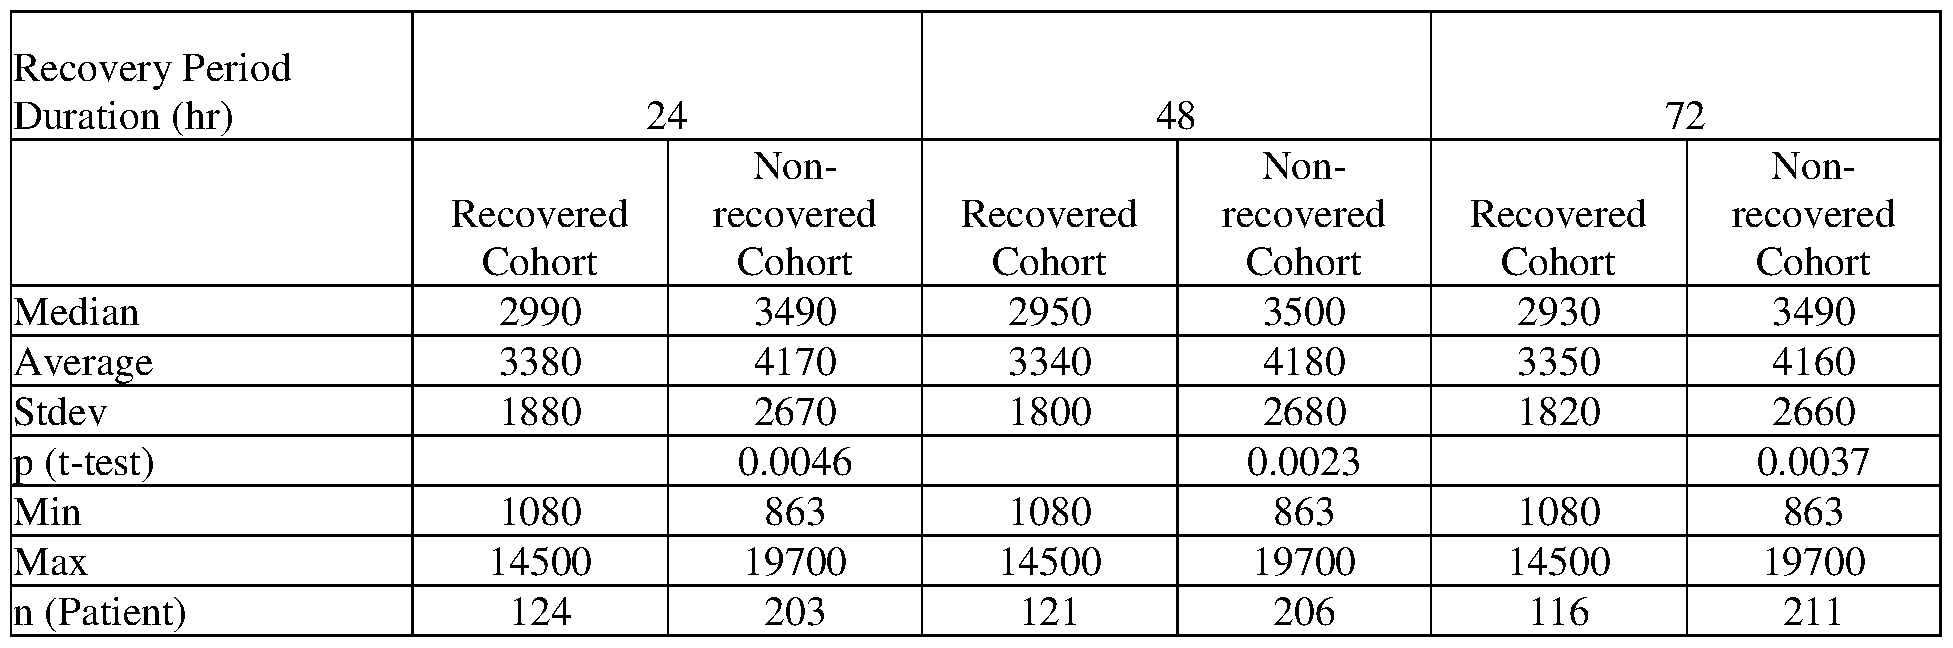
UO only

Duration (hr) 24 48 72
sCr or sCr or sCr or
UO sCr only UO only UO sCr only UO only UO sCr only UO only
AUC 0.58 0.59 0.60 0.57 0.60 0.59 0.58 0.60 0.61
SE 0.033 0.032 0.034 0.033 0.032 0.033 0.034 0.032 0.032 p Value 0.013 0.0032 0.0029 0.034 0.0020 0.0070 0.013 0.0028 8.2E-4 nCohort Recovered 111 124 219 104 121 208 94 116 193 nCohort Non- recovered 216 203 106 223 206 117 233 211 132
Cutoff Quartile 2 2320 2320 2330 2320 2320 2330 2320 2320 2330
Sensitivity 79% 80% 83% 78% 80% 81 % 79% 80% 82%
Specificity 32% 34% 29% 33% 34% 28% 34% 34% 30%
Cutoff Quartile 3 3280 3280 3280 3280 3280 3280 3280 3280 3280
Sensitivity 53% 54% 58% 52% 54% 56% 54% 55% 58%
Specificity 56% 56% 53% 55% 57% 53% 59% 58% 55%
Cutoff Quartile 4 4720 4720 4720 4720 4720 4720 4720 4720 4720
Sensitivity 29% 30% 31 % 28% 30% 30% 27% 29% 31 %
Specificity 83% 83% 78% 82% 83% 77% 81 % 83% 79%
OR Quartile 2 1.77 2.09 1.97 1.77 2.06 1.71 1.89 1.98 1.89 p Value 0.029 0.0045 0.023 0.031 0.0053 0.057 0.018 0.0088 0.021
Lower limit of 95% CI 1.06 1.26 1.10 1.05 1.24 0.983 1.11 1.19 1.10 Upper limit of 95% CI 2.97 3.47 3.55 2.98 3.43 2.97 3.21 3.30 3.24
OR Quartile 3 1.44 1.53 1.55 1.34 1.58 1.48 1.63 1.64 1.65 p Value 0.12 0.063 0.064 0.22 0.047 0.091 0.047 0.034 0.027
Lower limit of 95% CI 0.909 0.978 0.974 0.839 1.01 0.939 1.01 1.04 1.06 Upper limit of 95% CI 2.28 2.40 2.48 2.14 2.49 2.34 2.65 2.59 2.58
OR Quartile 4 1.99 2.11 1.57 1.76 2.17 1.46 1.60 2.00 1.67 p Value 0.019 0.0087 0.090 0.054 0.0070 0.15 0.12 0.017 0.046
Lower limit of 95% CI 1.12 1.21 0.933 0.990 1.24 0.876 0.887 1.13 1.01 Upper limit of 95% CI 3.54 3.68 2.64 3.14 3.82 2.44 2.88 3.52 2.77
[00256] Table 14.9: Comparison of marker levels and the area under the ROC curve (AUC) in EDTA samples for the "recovered" and "non-recovered" cohorts where recovery starts within 96 hours after sample collection and renal status is assessed by serum creatinine (sCr) only, urine output (UO) only, or serum creatinine or urine output RIFLE criteria.
sCr or UO

Duration (hr) 24 48 72
Non- Non- Non-
Recovered recovered Recovered recovered Recovered recovered Cohort Cohort Cohort Cohort Cohort Cohort
Median 3130 3450 3130 3450 3110 3470
Average 3470 4170 3430 4190 3430 4170
Stdev 1860 2740 1790 2760 1800 2740 p (t-test) 0.0099 0.0054 0.0061
Min 1080 863 1080 863 1080 863
Max 14500 19700 14500 19700 14500 19700 n (Patient) 139 188 137 190 133 194
UO only


Lower limit of 95% CI 1.07 1.09 1.02 0.921 1.13 0.925 0.862 1.05 1.03
Upper limit of 95% CI 3.12 3.13 2.88 2.68 3.27 2.58 2.57 3.06 2.83
[00257] Table 14.10: Comparison of marker levels and the area under the ROC curve (AUC) in EDTA samples for the "recovered" and "non-recovered" cohorts where recovery starts within 168 hours after sample collection and renal status is assessed by serum creatinine (sCr) only, urine output (UO) only, or serum creatinine or urine output RIFLE criteria.
sCr or UO


UO only

Duration (hr) 24 48 72
sCr or sCr or sCr or
UO sCr only UO only UO sCr only UO only UO sCr only UO only
AUC 0.58 0.56 0.62 0.59 0.56 0.62 0.59 0.55 0.63
SE 0.032 0.032 0.034 0.032 0.032 0.033 0.032 0.032 0.033 p Value 0.0081 0.071 3.9E-4 0.0063 0.072 2.7E-4 0.0052 0.094 4.6E-5 nCohort Recovered 187 159 215 184 156 212 183 154 209 nCohort Non- recovered 140 168 110 143 171 113 144 173 116
Cutoff Quartile 2 2320 2320 2330 2320 2320 2330 2320 2320 2330
Sensitivity 81 % 79% 85% 82% 79% 85% 82% 79% 85%
Specificity 30% 30% 30% 30% 29% 30% 31 % 29% 31 %
Cutoff Quartile 3 3280 3280 3280 3280 3280 3280 3280 3280 3280
Sensitivity 55% 52% 57% 55% 52% 58% 56% 52% 59%
Specificity 53% 52% 53% 54% 52% 54% 54% 52% 55%
Cutoff Quartile 4 4720 4720 4720 4720 4720 4720 4720 4720 4720
Sensitivity 31 % 29% 32% 31 % 29% 32% 31 % 29% 34%
Specificity 79% 79% 78% 79% 79% 78% 79% 79% 79%
OR Quartile 2 1.87 1.59 2.32 1.97 1.57 2.44 2.00 1.52 2.57 p Value 0.020 0.070 0.0055 0.012 0.080 0.0032 0.010 0.10 0.0018
Lower limit of 95%
CI 1.10 0.963 1.28 1.16 0.948 1.35 1.18 0.918 1.42
Upper limit of 95% CI 3.18 2.64 4.20 3.34 2.59 4.42 3.39 2.51 4.65
OR Quartile 3 1.40 1.20 1.54 1.44 1.17 1.58 1.47 1.17 1.70 p Value 0.13 0.41 0.067 0.10 0.47 0.053 0.084 0.47 0.023
Lower limit of 95%
CI 0.905 0.778 0.970 0.927 0.759 0.994 0.950 0.759 1.07
Upper limit of 95% CI 2.18 1.85 2.45 2.23 1.81 2.50 2.28 1.81 2.69
OR Quartile 4 1.68 1.57 1.67 1.71 1.60 1.69 1.68 1.55 1.96 p Value 0.043 0.081 0.052 0.037 0.070 0.046 0.044 0.092 0.010
Lower limit of 95%
CI 1.02 0.946 0.996 1.03 0.962 1.01 1.01 0.931 1.17
Upper limit of 95% CI 2.78 2.61 2.79 2.83 2.67 2.82 2.78 2.58 3.26
[00258] Example 15. Use of Metalloproteinase inhibitor 4 for evaluating renal status in patients admitted to the ICU: Recovery to RIFLE 0 and R from RIFLE I and F
[00259] Patients from the intensive care unit (ICU) with RIFLE stage of injury (I) or failure (F) are enrolled in the following study. EDTA anti-coagulated blood samples (10 mL) and urine samples (50 mL) are collected from each patient at enrollment, and at every 12 hours up to day 3, and then every 24 hours thereafter up to day 7 while the subject is hospitalized.
Metalloproteinase inhibitor 4 is measured in the enrollment samples by standard immunoassay methods using commercially available assay reagents.
[00260] Kidney status is assessed by RIFLE criteria based on serum creatinine, urine output, or both serum creatinine and urine output. Two cohorts are defined to represent a "recovered" and a "non-recovered" population. "Recovered" indicates those patients whose maximum RIFLE stage during a period of 24, 48 or 72 hours is non-injury (RIFLE 0) or risk of injury (R) where the recovery period can start from the time of sample collection to 24, 48, 72, 96 or 168 hours
after sample collection. "Non-recovered" indicates those patients whose maximum RIFLE stage during a period of 24, 48 or 72 hours is injury (I) or failure (F) where the recovery period can start from the time of sample collection to 24, 48, 72, 96 or 168 hours after sample collection. If a patient dies or is placed on renal replacement therapy (RRT) at any time from sample collection to 24, 48, 72, 96 or 168 hours after sample collection, the patient is considered "non- recovered".
[00261] The ability to distinguish the "recovered" and "non-recovered" cohorts is determined using receiver operating characteristic (ROC) analysis.
[00262] Table 15.1: Comparison of marker levels and the area under the ROC curve (AUC) in urine samples for the "recovered" and "non-recovered" cohorts where recovery starts within 24 hours after sample collection and renal status is assessed by serum creatinine (sCr) only, urine output (UO) only, or serum creatinine or urine output RIFLE criteria.
sCr or UO


UO only
 Cohort Cohort Cohort
Median 18.5 39.3 18.1 39.3 18.1 36.7
Average 99.9 304 101 275 104 255
Stdev 623 1040 643 976 658 936 p (t-test) 0.033 0.059 0.094
Min 0.00110 0.00277 0.00110 0.00277 0.00110 0.00277
Max 9030 7570 9030 7570 9030 7570 n (Patient) 222 93 208 107 198 117

[00263] Table 15.2: Comparison of marker levels and the area under the ROC curve (AUC) in urine samples for the "recovered" and "non-recovered" cohorts where recovery starts within 48 hours after sample collection and renal status is assessed by serum creatinine (sCr) only, urine output (UO) only, or serum creatinine or urine output RIFLE criteria.
sCr or UO
 Cohort Cohort Cohort
Median 13.3 36.5 13.3 33.4 13.3 33.4
Average 29.4 257 29.6 254 28.6 249
Stdev 47.4 1010 47.7 1010 46.7 994 p (t-test) 0.0093 0.010 0.012
Min 0.00110 0.00167 0.00110 0.00167 0.00110 0.00167
Max 409 9030 409 9030 409 9030 n (Patient) 136 181 134 183 129 188 sCr only
Recovery Period
Duration (hr) 24 48 72
Non- Non- Non-
Recovered recovered Recovered recovered Recovered recovered Cohort Cohort Cohort Cohort Cohort Cohort
Median 15.4 36.9 15.9 36.7 15.9 36.7
Average 30.5 274 30.7 272 30.6 269
Stdev 47.1 1050 47.2 1050 47.4 1040 p (t-test) 0.0050 0.0054 0.0060
Min 0.00110 0.00167 0.00110 0.00167 0.00110 0.00167
Max 409 9030 409 9030 409 9030 n (Patient) 149 168 148 169 146 171
UO only


OR Quartile 2 2.83 2.10 3.05 2.94 2.14 3.03 3.00 2.21 2.77 p Value 1.0E-4 0.0051 0.0016 5.9E-5 0.0042 0.0012 4.1E-5 0.0028 0.0013
Lower limit of 95%
CI 1.68 1.25 1.53 1.74 1.27 1.55 1.77 1.31 1.49
Upper limit of 95% CI 4.79 3.53 6.10 4.98 3.59 5.92 5.07 3.72 5.16
OR Quartile 3 2.47 2.24 2.36 2.47 2.19 2.13 2.57 2.19 1.96 p Value 1.1E-4 4.4E-4 9.6E-4 1.1E-4 6.5E-4 0.0027 6.2E-5 6.5E-4 0.0053
Lower limit of 95%
CI 1.56 1.43 1.42 1.57 1.39 1.30 1.62 1.40 1.22
Upper limit of 95% CI 3.89 3.52 3.92 3.91 3.43 3.50 4.08 3.43 3.16
OR Quartile 4 5.00 5.12 2.14 4.84 5.03 2.01 4.94 4.86 1.91 p Value 5.6E-7 1.2E-7 0.0057 9.6E-7 1.7E-7 0.010 1.3E-6 3.0E-7 0.015
Lower limit of 95%
CI 2.66 2.79 1.25 2.57 2.75 1.18 2.59 2.65 1.13
Upper limit of 95% CI 9.39 9.37 3.67 9.08 9.21 3.43 9.43 8.90 3.22
[00264] Table 15.3: Comparison of marker levels and the area under the ROC curve (AUC) in urine samples for the "recovered" and "non-recovered" cohorts where recovery starts within 72 hours after sample collection and renal status is assessed by serum creatinine (sCr) only, urine output (UO) only, or serum creatinine or urine output RIFLE criteria.
sCr or UO


UO only
Recovery Period
Duration (hr) 24 48 72
Non- Non- Non-
Recovered recovered Recovered recovered Recovered recovered
Cohort Cohort Cohort Cohort Cohort Cohort
Median 18.1 38.8 18.2 37.8 18.1 33.4
Average 109 286 110 283 112 259
Stdev 628 1050 629 1040 645 986 p (t-test) 0.066 0.071 0.11
Min 0.00110 0.00277 0.00110 0.00277 0.00110 0.00277
Max 9030 7570 9030 7570 9030 7570 n (Patient) 224 91 223 92 212 103

[00265] Table 15.4: Comparison of marker levels and the area under the ROC curve (AUC) in urine samples for the "recovered" and "non-recovered" cohorts where recovery starts within 96 hours after sample collection and renal status is assessed by serum creatinine (sCr) only, urine output (UO) only, or serum creatinine or urine output RIFLE criteria.
 Non- Non- Non-
Recovered recovered Recovered recovered Recovered recovered Cohort Cohort Cohort Cohort Cohort Cohort
Median 15.1 38.8 15.4 37.0 15.4 36.9
Average 36.0 298 36.4 293 35.9 287
Stdev 62.4 1110 62.9 1100 62.7 1090 p (t-test) 0.0024 0.0030 0.0037
Min 0.00110 0.00167 0.00110 0.00167 0.00110 0.00167
Max 453 9030 453 9030 453 9030 n (Patient) 168 149 165 152 161 156 sCr only
Recovery Period
Duration (hr) 24 48 72
Non- Non- Non-
Recovered recovered Recovered recovered Recovered recovered Cohort Cohort Cohort Cohort Cohort Cohort
Median 15.9 37.0 16.3 37.0 16.3 37.0
Average 36.4 305 36.6 303 36.7 301
Stdev 61.8 1130 61.9 1120 62.1 1120 p (t-test) 0.0019 0.0021 0.0023
Min 0.00110 0.00167 0.00110 0.00167 0.00110 0.00167
Max 453 9030 453 9030 453 9030 n (Patient) 172 145 171 146 170 147
UO only


Cutoff Quartile 4 60.9 60.9 61.8 60.9 60.9 61.8 60.9 60.9 61.8
Sensitivity 38% 38% 35% 37% 38% 34% 37% 37% 34%
Specificity 86% 85% 79% 85% 85% 79% 86% 85% 79%
OR Quartile 2 2.54 2.20 2.55 2.67 2.23 2.60 2.64 2.27 2.45 p Value 7.8E-4 0.0041 0.0049 4.0E-4 0.0034 0.0041 4.0E-4 0.0028 0.0048
Lower limit of 95%
CI 1.47 1.28 1.33 1.55 1.30 1.36 1.54 1.33 1.31
Upper limit of 95% CI 4.36 3.76 4.91 4.59 3.83 5.00 4.53 3.89 4.55
OR Quartile 3 2.71 2.44 2.24 2.63 2.38 2.30 2.63 2.31 2.21 p Value 1.8E-5 1.1E-4 0.0016 3.0E-5 1.8E-4 0.0011 3.0E-5 2.8E-4 0.0014
Lower limit of 95%
CI 1.72 1.55 1.36 1.67 1.51 1.39 1.67 1.47 1.36
Upper limit of 95% CI 4.27 3.84 3.70 4.14 3.73 3.80 4.13 3.63 3.59
OR Quartile 4 3.61 3.59 2.00 3.43 3.53 1.95 3.45 3.47 1.91 p Value 3.8E-6 3.5E-6 0.011 9.1E-6 4.8E-6 0.014 9.5E-6 6.4E-6 0.017
Lower limit of 95%
CI 2.10 2.09 1.17 1.99 2.06 1.14 2.00 2.02 1.12
Upper limit of 95% CI 6.23 6.17 3.41 5.90 6.06 3.34 5.98 5.95 3.23
[00266] Table 15.5: Comparison of marker levels and the area under the ROC curve (AUC) in urine samples for the "recovered" and "non-recovered" cohorts where recovery starts within 168 hours after sample collection and renal status is assessed by serum creatinine (sCr) only, urine output (UO) only, or serum creatinine or urine output RIFLE criteria.
sCr or UO
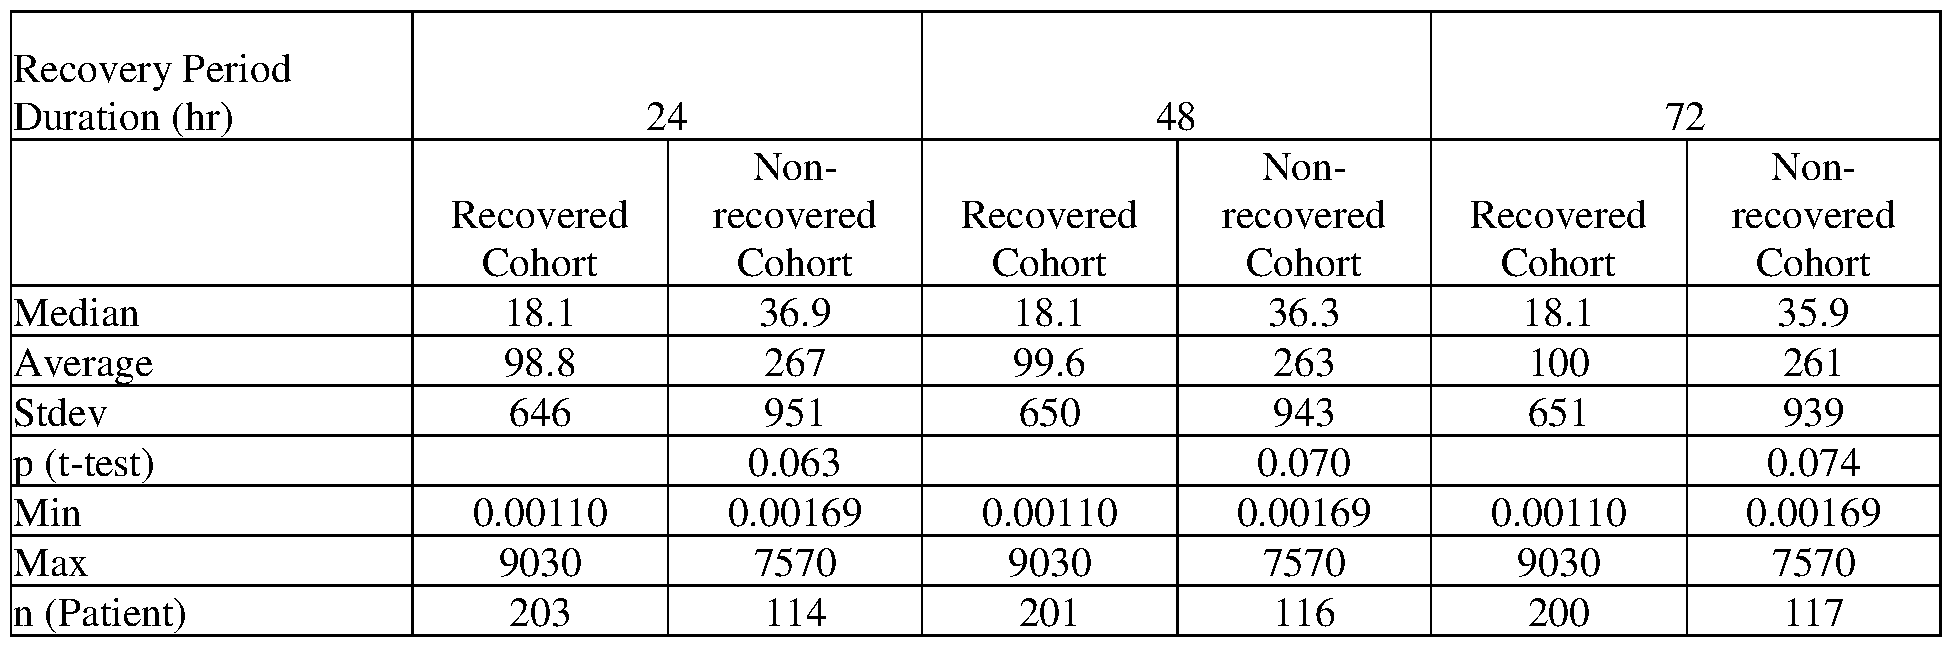


[00267] Table 15.6: Comparison of marker levels and the area under the ROC curve (AUC) in EDTA samples for the "recovered" and "non-recovered" cohorts where recovery starts within 24 hours after sample collection and renal status is assessed by serum creatinine (sCr) only, urine output (UO) only, or serum creatinine or urine output RIFLE criteria.
sCr or UO
 sCr only

UO only

 Sensitivity 82% 81 % 85% 81 % 81 % 86% 81 % 81 % 84% Specificity 39% 36% 29% 39% 36% 31 % 39% 37% 30%
Cutoff Quartile 3 3280 3280 3280 3280 3280 3280 3280 3280 3280
Sensitivity 55% 55% 65% 56% 55% 64% 55% 56% 61 %
Specificity 61 % 58% 56% 62% 59% 57% 61 % 60% 56%
Cutoff Quartile 4 4720 4710 4720 4720 4710 4720 4720 4710 4720
Sensitivity 30% 31 % 35% 30% 31 % 35% 30% 31 % 34%
Specificity 86% 84% 79% 86% 85% 80% 86% 85% 80%
OR Quartile 2 2.83 2.35 2.31 2.81 2.44 2.64 2.66 2.53 2.23 p Value 8.4E-5 0.0010 0.0081 9.8E-5 6.4E-4 0.0017 2.4E-4 3.8E-4 0.0055
Lower limit of 95%
CI 1.68 1.41 1.24 1.67 1.46 1.44 1.58 1.52 1.27
Upper limit of 95% CI 4.75 3.91 4.29 4.73 4.06 4.82 4.49 4.23 3.92
OR Quartile 3 1.94 1.65 2.35 2.02 1.75 2.41 1.93 1.86 2.02 p Value 0.0061 0.030 6.3E-4 0.0040 0.016 2.6E-4 0.0075 0.0082 0.0025
Lower limit of 95%
CI 1.21 1.05 1.44 1.25 1.11 1.50 1.19 1.17 1.28
Upper limit of 95% CI 3.11 2.60 3.82 3.26 2.76 3.87 3.13 2.94 3.20
OR Quartile 4 2.59 2.38 2.08 2.72 2.51 2.11 2.53 2.66 2.10 p Value 0.0025 0.0030 0.0059 0.0019 0.0019 0.0043 0.0040 0.0012 0.0042
Lower limit of 95%
CI 1.40 1.34 1.24 1.45 1.40 1.26 1.35 1.47 1.26
Upper limit of 95% CI 4.81 4.22 3.51 5.12 4.49 3.53 4.77 4.80 3.49
[00268] Table 15.7: Comparison of marker levels and the area under the ROC curve (AUC) in EDTA samples for the "recovered" and "non-recovered" cohorts where recovery starts within 48 hours after sample collection and renal status is assessed by serum creatinine (sCr) only, urine output (UO) only, or serum creatinine or urine output RIFLE criteria.
sCr or UO


Max 9820 19700 9820 19700 9100 19700 n (Patient) 146 181 145 182 143 184
UO only
Recovery Period
Duration (hr) 24 48 72
Non- Non- Non-
Recovered recovered Recovered recovered Recovered recovered Cohort Cohort Cohort Cohort Cohort Cohort
Median 3060 3890 3040 3930 3050 3920
Average 3530 4670 3500 4670 3460 4600
Stdev 2060 2970 2060 2910 2040 2840 p (t-test) 9.7E-5 5.0E-5 3.9E-5
Min 893 863 893 863 893 863
Max 19700 18800 19700 18800 19700 18800 n (Patient) 231 94 225 100 210 115
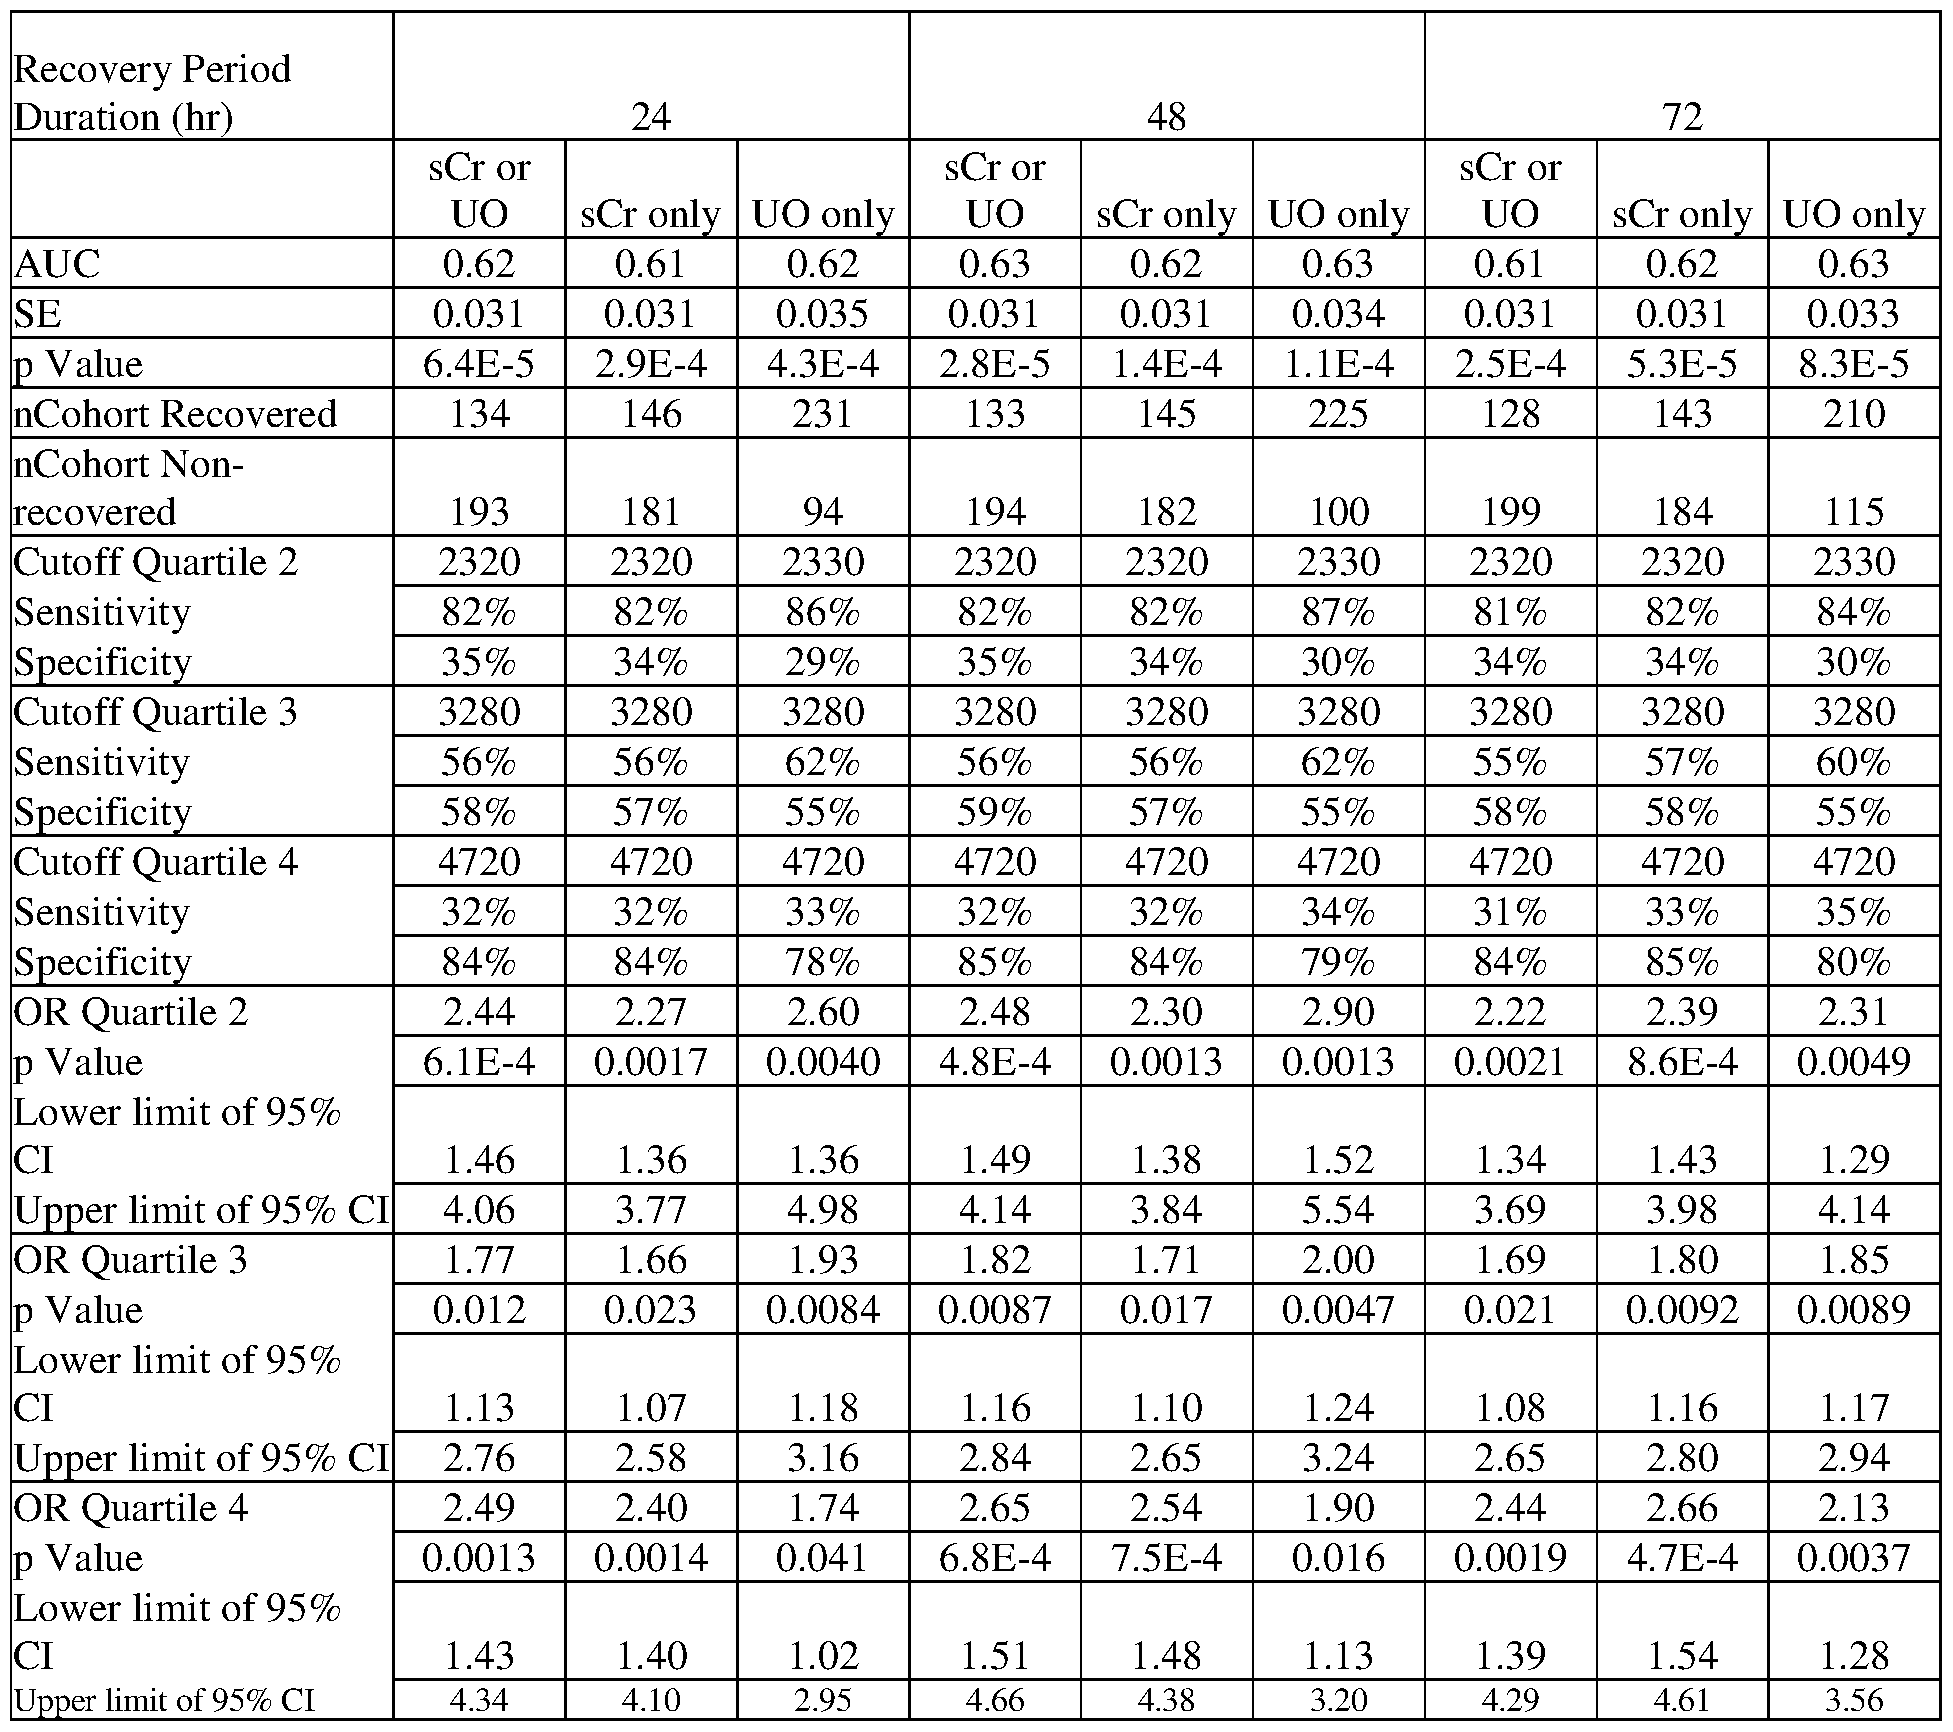
[00269] Table 15.8: Comparison of marker levels and the area under the ROC curve (AUC) in EDTA samples for the "recovered" and "non-recovered" cohorts where recovery starts within
72 hours after sample collection and renal status is assessed by serum creatinine (sCr) only, urine output (UO) only, or serum creatinine or urine output RIFLE criteria.
sCr or UO

sCr only

UO only


Cutoff Quartile 3 3280 3280 3280 3280 3280 3280 3280 3280 3280
Sensitivity 53% 53% 59% 54% 53% 60% 53% 54% 58%
Specificity 53% 53% 53% 54% 53% 54% 53% 53% 54%
Cutoff Quartile 4 4720 4720 4720 4720 4720 4720 4720 4720 4720
Sensitivity 29% 30% 32% 30% 30% 33% 29% 30% 33%
Specificity 79% 80% 77% 80% 80% 78% 80% 81 % 79%
OR Quartile 2 1.85 1.89 2.38 1.91 1.92 2.47 1.79 1.95 2.32 p Value 0.017 0.015 0.0075 0.012 0.012 0.0052 0.024 0.010 0.0055
Lower limit of 95% CI 1.12 1.13 1.26 1.15 1.15 1.31 1.08 1.17 1.28 Upper limit of 95% CI 3.07 3.14 4.49 3.18 3.19 4.65 2.97 3.25 4.20
OR Quartile 3 1.29 1.26 1.65 1.36 1.29 1.74 1.23 1.33 1.63 p Value 0.25 0.29 0.042 0.17 0.25 0.024 0.35 0.20 0.039
Lower limit of 95% CI 0.837 0.817 1.02 0.879 0.837 1.08 0.797 0.858 1.02 Upper limit of 95% CI 2.00 1.95 2.68 2.10 2.00 2.82 1.91 2.05 2.59
OR Quartile 4 1.55 1.62 1.58 1.72 1.71 1.75 1.61 1.80 1.79 p Value 0.092 0.061 0.092 0.039 0.039 0.037 0.069 0.024 0.027
Lower limit of 95% CI 0.931 0.978 0.928 1.03 1.03 1.03 0.963 1.08 1.07 Upper limit of 95% CI 2.58 2.70 2.69 2.88 2.85 2.97 2.69 3.00 2.99
[00270] Table 15.9: Comparison of marker levels and the area under the ROC curve (AUC) in EDTA samples for the "recovered" and "non-recovered" cohorts where recovery starts within 96 hours after sample collection and renal status is assessed by serum creatinine (sCr) only, urine output (UO) only, or serum creatinine or urine output RIFLE criteria.
sCr or UO


[00271] Table 15.10: Comparison of marker levels and the area under the ROC curve (AUC) in EDTA samples for the "recovered" and "non-recovered" cohorts where recovery starts within 168 hours after sample collection and renal status is assessed by serum creatinine (sCr) only, urine output (UO) only, or serum creatinine or urine output RIFLE criteria.
sCr or UO
Recovery Period
Duration (hr) 24 48 72
Non- Non- Non-
Recovered recovered Recovered recovered Recovered recovered Cohort Cohort Cohort Cohort Cohort Cohort
Median 3100 3510 3080 3520 3090 3510
Average 3560 4390 3550 4390 3550 4380
Stdev 2090 2830 2100 2810 2100 2800 p (t-test) 0.0026 0.0020 0.0025
Min 1080 863 1080 863 1080 863
Max 19700 18800 19700 18800 19700 18800 n (Patient) 204 123 202 125 201 126 sCr only

UO only


Cutoff Quartile 3 3280 3280 3280 3280 3280 3280 3280 3280 3280
Sensitivity 55% 55% 58% 56% 55% 58% 56% 55% 58%
Specificity 53% 53% 54% 53% 53% 54% 53% 53% 54%
Cutoff Quartile 4 4720 4720 4720 4720 4720 4720 4720 4720 4720
Sensitivity 29% 30% 32% 30% 30% 32% 29% 30% 32%
Specificity 77% 79% 78% 78% 79% 78% 78% 79% 78%
OR Quartile 2 2.07 1.97 2.85 2.14 1.97 2.90 2.18 1.97 3.00 p Value 0.010 0.012 0.0012 0.0073 0.012 9.6E-4 0.0061 0.012 6.5E-4
Lower limit of 95% CI 1.19 1.16 1.51 1.23 1.16 1.54 1.25 1.16 1.60 Upper limit of 95% CI 3.62 3.34 5.35 3.74 3.34 5.45 3.80 3.34 5.64
OR Quartile 3 1.39 1.37 1.60 1.46 1.37 1.65 1.42 1.37 1.64 p Value 0.15 0.16 0.049 0.097 0.16 0.037 0.12 0.16 0.038
Lower limit of 95% CI 0.887 0.882 1.00 0.934 0.882 1.03 0.910 0.882 1.03 Upper limit of 95% CI 2.18 2.12 2.57 2.29 2.12 2.63 2.23 2.12 2.61
OR Quartile 4 1.42 1.60 1.72 1.47 1.60 1.68 1.44 1.60 1.73 p Value 0.18 0.067 0.041 0.14 0.067 0.049 0.16 0.067 0.037
Lower limit of 95% CI 0.855 0.967 1.02 0.883 0.967 1.00 0.868 0.967 1.03 Upper limit of 95% CI 2.36 2.64 2.88 2.44 2.64 2.83 2.39 2.64 2.91
[00272] Example 16. Use of Metalloproteinase inhibitor 4 for evaluating renal status in patients admitted to the ICU: Persistent at RIFLE F
[00273] Patients from the intensive care unit (ICU) with RIFLE stage of injury (I) or failure (F) are enrolled in the following study. EDTA anti-coagulated blood samples (10 mL) and urine samples (50 mL) are collected from each patient at enrollment, and at every 12 hours up to day 3, and then every 24 hours thereafter up to day 7 while the subject is hospitalized.
Metalloproteinase inhibitor 4 is measured in the enrollment samples by standard immunoassay methods using commercially available assay reagents.
[00274] Kidney status is assessed by RIFLE criteria based on serum creatinine, urine output, or both serum creatinine and urine output. Two cohorts are defined to represent a "persistent" and a "non-persistent" population. "Persistent" indicates those patients whose minimum RIFLE stage during a period of 24, 48 or 72 hours is failure (F) where the persistence period can start from the time of sample collection to 24, 48, 72, 96 or 168 hours after sample collection. "Non- persistent" indicates those patients who are not persistent at failure (F) and whose minimum RIFLE stage during a period of 24, 48 or 72 hours is non-injury (RIFLE 0), risk of injury (R), or injury (I) where the persistence period can start from the time of sample collection to 24, 48, 72, 96 or 168 hours after sample collection. If a patient dies after failure (F) or is placed on renal replacement therapy (RRT) at any time from sample collection to 24, 48, 72, 96 or 168 hours after sample collection, the patient is considered "persistent".
[00275] The ability to distinguish the "persistent" and "non-persistent" cohorts is determined using receiver operating characteristic (ROC) analysis.
[00276] Table 16.1: Comparison of marker levels and the area under the ROC curve (AUC) in urine samples for the "persistent" and "non-persistent" cohorts where persistence starts within 24 hours after sample collection and renal status is assessed by serum creatinine (sCr) only, urine output (UO) only, or serum creatinine or urine output RIFLE criteria.
sCr or UO

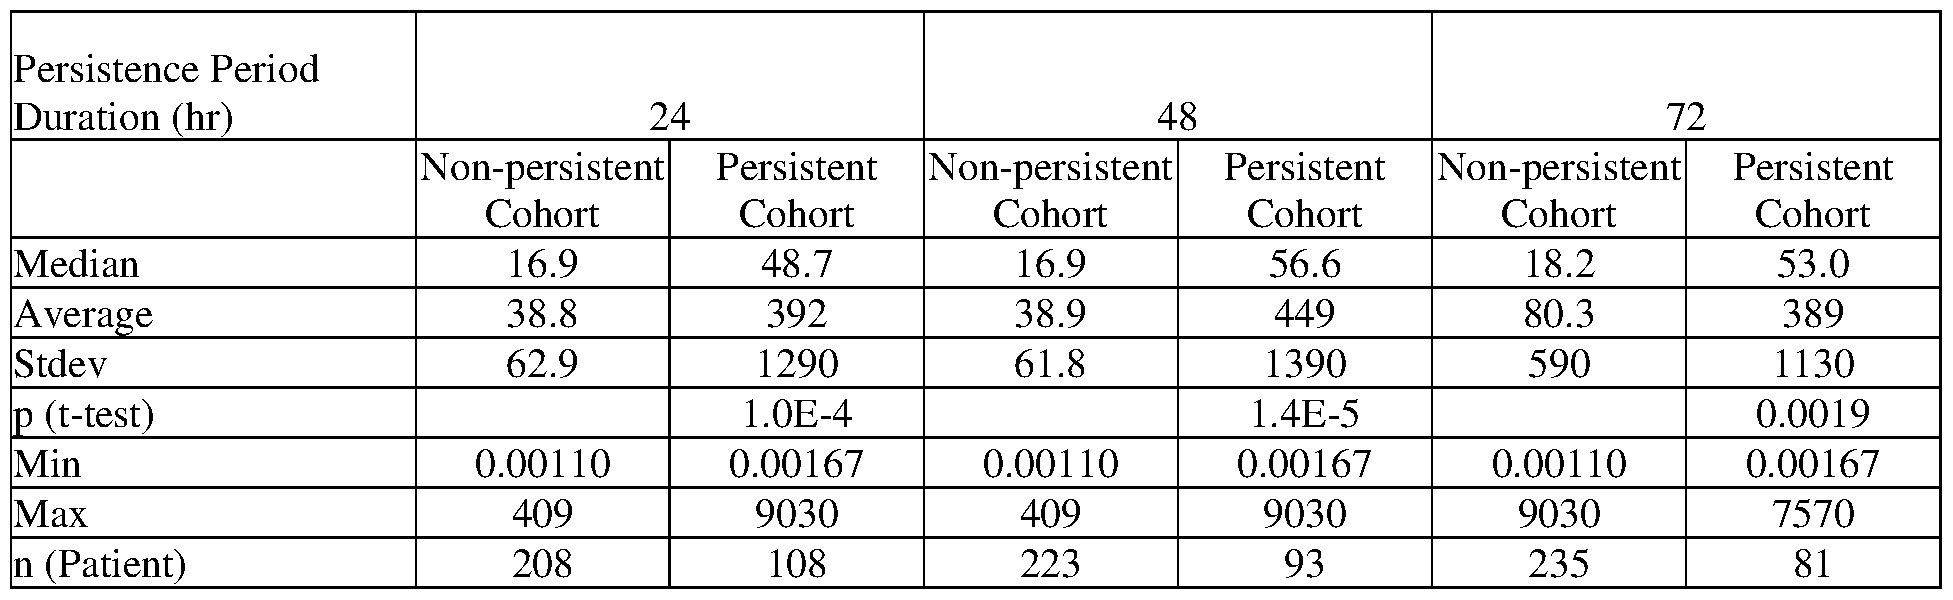
UO only


Cutoff Quartile 2 8.33 8.31 8.36 8.33 8.31 8.36 8.33 8.31 8.36
Sensitivity 86% 84% 88% 89% 87% 86% 89% 86% 86%
Specificity 31 % 30% 27% 31 % 30% 27% 30% 29% 27%
Cutoff Quartile 3 24.1 23.6 24.1 24.1 23.6 24.1 24.1 23.6 24.1
Sensitivity 71 % 69% 80% 74% 72% 78% 77% 73% 78%
Specificity 61 % 60% 54% 60% 59% 54% 59% 58% 53%
Cutoff Quartile 4 60.9 60.8 61.8 60.9 60.8 61.8 60.9 60.8 61.8
Sensitivity 46% 45% 45% 50% 48% 46% 48% 46% 47%
Specificity 86% 86% 78% 86% 85% 78% 83% 82% 78%
OR Quartile 2 2.66 2.27 2.58 3.43 2.90 2.32 3.37 2.59 2.24 p Value 0.0016 0.0070 0.057 4.6E-4 0.0019 0.092 0.0014 0.0073 0.11
Lower limit of 95%
CI 1.45 1.25 0.973 1.72 1.48 0.872 1.60 1.29 0.839
Upper limit of 95% CI 4.88 4.13 6.83 6.85 5.67 6.18 7.12 5.19 5.97
OR Quartile 3 3.74 3.21 4.73 4.29 3.74 4.19 4.68 3.68 4.01 p Value 1.6E-7 3.3E-6 1.7E-4 6.9E-8 8.9E-7 6.0E-4 1.5E-7 3.9E-6 9.0E-4
Lower limit of 95%
CI 2.28 1.97 2.10 2.53 2.21 1.85 2.63 2.12 1.77
Upper limit of 95% CI 6.13 5.25 10.6 7.29 6.32 9.48 8.32 6.41 9.11
OR Quartile 4 5.07 4.93 2.87 5.91 5.21 2.96 4.42 3.86 3.13 p Value 4.0E-9 7.8E-9 0.0025 2.1E-10 3.2E-9 0.0026 1.3E-7 1.5E-6 0.0017
Lower limit of 95%
CI 2.95 2.87 1.45 3.41 3.02 1.46 2.55 2.23 1.54
Upper limit of 95% CI 8.72 8.47 5.69 10.2 9.00 6.00 7.66 6.70 6.39
[00277] Table 16.2: Comparison of marker levels and the area under the ROC curve (AUC) in urine samples for the "persistent" and "non-persistent" cohorts where persistence starts within 48 hours after sample collection and renal status is assessed by serum creatinine (sCr) only, urine output (UO) only, or serum creatinine or urine output RIFLE criteria.
sCr or UO


Min 0.00110 0.00167 0.00110 0.00167 0.00110 0.00167
Max 409 9030 409 9030 9030 7570 n (Patient) 192 124 206 110 218 98
UO only
Persistence Period
Duration (hr) 24 48 72
Non-persistent Persistent Non-persistent Persistent Non-persistent Persistent Cohort Cohort Cohort Cohort Cohort Cohort
Median 20.0 43.9 20.4 50.8 20.5 51.9
Average 101 416 100 443 100 451
Stdev 588 1280 584 1330 583 1340 p (t-test) 0.0048 0.0027 0.0023
Min 0.00110 0.00277 0.00110 0.00277 0.00110 0.00277
Max 9030 7570 9030 7570 9030 7570 n (Patient) 256 59 260 55 261 54

sCr or UO


UO only


Cutoff Quartile 2 8.33 8.31 8.36 8.33 8.31 8.36 8.33 8.31 8.36
Sensitivity 85% 83% 86% 87% 85% 84% 87% 85% 84%
Specificity 33% 31 % 28% 33% 31 % 27% 31 % 30% 27%
Cutoff Quartile 3 24.1 23.6 24.1 24.1 23.6 24.1 24.1 23.6 24.1
Sensitivity 65% 64% 70% 69% 68% 70% 70% 67% 70%
Specificity 62% 60% 55% 63% 61 % 55% 60% 59% 55%
Cutoff Quartile 4 60.9 60.8 61.8 60.9 60.8 61.8 60.9 60.8 61.8
Sensitivity 41 % 41 % 39% 45% 44% 41 % 44% 42% 41 %
Specificity 87% 87% 79% 88% 87% 79% 85% 84% 79%
OR Quartile 2 2.63 2.14 2.30 3.13 2.60 2.05 2.94 2.50 2.05 p Value 6.0E-4 0.0064 0.024 1.6E-4 0.0013 0.054 6.5E-4 0.0031 0.054
Lower limit of 95% CI 1.51 1.24 1.11 1.73 1.45 0.987 1.58 1.36 0.987 Upper limit of 95% CI 4.58 3.71 4.75 5.68 4.68 4.25 5.45 4.59 4.25
OR Quartile 3 3.13 2.74 2.83 3.78 3.29 2.89 3.51 2.84 2.89 p Value 1.2E-6 1.9E-5 3.6E-4 4.9E-8 1.0E-6 4.3E-4 5.2E-7 2.6E-5 4.3E-4
Lower limit of 95% CI 1.98 1.73 1.60 2.34 2.04 1.60 2.15 1.75 1.60 Upper limit of 95% CI 4.97 4.34 5.00 6.10 5.31 5.22 5.74 4.61 5.22
OR Quartile 4 4.80 4.58 2.40 5.91 5.07 2.56 4.37 3.66 2.56 p Value 3.6E-8 5.9E-8 0.0027 4.6E-10 6.2E-9 0.0016 6.4E-8 1.7E-6 0.0016
Lower limit of 95% CI 2.75 2.64 1.35 3.38 2.93 1.43 2.56 2.15 1.43 Upper limit of 95% CI 8.39 7.95 4.25 10.3 8.76 4.58 7.45 6.21 4.58
[00279] Table 16.4: Comparison of marker levels and the area under the ROC curve (AUC) in urine samples for the "persistent" and "non-persistent" cohorts where persistence starts within 96 hours after sample collection and renal status is assessed by serum creatinine (sCr) only, urine output (UO) only, or serum creatinine or urine output RIFLE criteria.
sCr or UO


UO only
Persistence Period
Duration (hr) 24 48 72
Non-persistent Persistent Non-persistent Persistent Non-persistent Persistent Cohort Cohort Cohort Cohort Cohort Cohort
Median 18.2 42.1 18.8 47.4 18.8 47.4
Average 104 337 102 363 102 363
Stdev 608 1140 601 1180 601 1180 p (t-test) 0.022 0.013 0.013
Min 0.00110 0.00277 0.00110 0.00277 0.00110 0.00277
Max 9030 7570 9030 7570 9030 7570 n (Patient) 239 76 245 70 245 70

[00280] Table 16.5: Comparison of marker levels and the area under the ROC curve (AUC) in urine samples for the "persistent" and "non-persistent" cohorts where persistence starts within 168 hours after sample collection and renal status is assessed by serum creatinine (sCr) only, urine output (UO) only, or serum creatinine or urine output RIFLE criteria.
sCr or UO
 sCr only

UO only

 Sensitivity 65% 63% 70% 69% 66% 71 % 68% 66% 71 % Specificity 63% 60% 57% 64% 61 % 57% 61 % 59% 57%
Cutoff Quartile 4 60.9 60.8 61.8 60.9 60.8 61.8 60.9 60.8 61.8
Sensitivity 41 % 40% 41 % 44% 43% 41 % 42% 41 % 41 %
Specificity 88% 87% 80% 89% 87% 80% 85% 84% 80%
OR Quartile 2 2.49 2.04 2.61 2.90 2.47 2.45 2.78 2.39 2.45 p Value 9.7E-4 0.0096 0.0069 2.8E-4 0.0018 0.012 7.4E-4 0.0036 0.012
Lower limit of 95% CI 1.45 1.19 1.30 1.63 1.40 1.22 1.54 1.33 1.22 Upper limit of 95% CI 4.29 3.49 5.23 5.16 4.36 4.92 5.04 4.29 4.92
OR Quartile 3 3.11 2.56 3.13 3.92 3.11 3.11 3.36 2.73 3.11 p Value 1.3E-6 5.4E-5 3.8E-5 1.7E-8 2.1E-6 5.3E-5 7.1E-7 3.4E-5 5.3E-5
Lower limit of 95% CI 1.96 1.62 1.82 2.44 1.95 1.79 2.08 1.70 1.79 Upper limit of 95% CI 4.92 4.05 5.38 6.30 4.98 5.39 5.43 4.40 5.39
OR Quartile 4 5.08 4.43 2.81 6.19 5.15 2.81 4.28 3.85 2.81 p Value 2.4E-8 1.3E-7 2.2E-4 3.4E-10 6.4E-9 2.5E-4 1.0E-7 6.9E-7 2.5E-4
Lower limit of 95% CI 2.87 2.55 1.62 3.50 2.96 1.62 2.51 2.26 1.62 Upper limit of 95% CI 8.99 7.71 4.86 10.9 8.95 4.89 7.31 6.55 4.89
[00281] Table 16.6: Comparison of marker levels and the area under the ROC curve (AUC) in EDTA samples for the "persistent" and "non-persistent" cohorts where persistence starts within 24 hours after sample collection and renal status is assessed by serum creatinine (sCr) only, urine output (UO) only, or serum creatinine or urine output RIFLE criteria.
sCr or UO


Median 3140 4580 3150 4610 3140 4750
Average 3580 5670 3580 5740 3570 5940
Stdev 2020 3670 2010 3740 2010 3720 p (t-test) 5.0E-8 3.4E-8 2.5E-9
Min 893 863 893 863 893 863
Max 19700 18800 19700 18800 19700 18800 n (Patient) 281 44 283 42 285 40

[00282] Table 16.7: Comparison of marker levels and the area under the ROC curve (AUC) in EDTA samples for the "persistent" and "non-persistent" cohorts where persistence starts within 48 hours after sample collection and renal status is assessed by serum creatinine (sCr) only, urine output (UO) only, or serum creatinine or urine output RIFLE criteria.
sCr or UO

Min 1080 863 1080 863 1080 863
Max 9820 19700 14500 19700 19700 18800 n (Patient) 187 140 204 123 219 108 sCr only
Persistence Period
Duration (hr) 24 48 72
Non-persistent Persistent Non-persistent Persistent Non-persistent Persistent Cohort Cohort Cohort Cohort Cohort Cohort
Median 3100 3620 3090 3810 3130 3520
Average 3420 4490 3490 4480 3600 4380
Stdev 1580 3180 1790 3140 2090 2930 p (t-test) 8.1E-5 3.4E-4 0.0059
Min 1080 863 1080 863 1080 863
Max 9820 19700 14500 19700 19700 18800 n (Patient) 192 134 205 121 217 109
UO only


OR Quartile 3 1.48 1.43 1.78 1.47 1.49 1.75 1.46 1.36 1.93 p Value 0.082 0.12 0.042 0.096 0.086 0.053 0.11 0.20 0.025
Lower limit of 95% CI 0.951 0.916 1.02 0.935 0.945 0.993 0.919 0.854 1.09 Upper limit of 95% CI 2.29 2.22 3.11 2.30 2.33 3.08 2.32 2.15 3.45
OR Quartile 4 1.92 1.85 1.87 1.86 1.79 2.04 1.64 1.49 2.17 p Value 0.011 0.017 0.037 0.017 0.025 0.018 0.062 0.13 0.011
Lower limit of 95% CI 1.16 1.12 1.04 1.12 1.08 1.13 0.976 0.887 1.20 Upper limit of 95% CI 3.18 3.07 3.35 3.09 2.98 3.68 2.75 2.50 3.94
[00283] Table 16.8: Comparison of marker levels and the area under the ROC curve (AUC) in EDTA samples for the "persistent" and "non-persistent" cohorts where persistence starts within 72 hours after sample collection and renal status is assessed by serum creatinine (sCr) only, urine output (UO) only, or serum creatinine or urine output RIFLE criteria.
sCr or UO


UO only


[00284] Table 16.9: Comparison of marker levels and the area under the ROC curve (AUC) in EDTA samples for the "persistent" and "non-persistent" cohorts where persistence starts within 96 hours after sample collection and renal status is assessed by serum creatinine (sCr) only, urine output (UO) only, or serum creatinine or urine output RIFLE criteria.
sCr or UO

Duration (hr) 24 48 72
Non-persistent Persistent Non-persistent Persistent Non-persistent Persistent
Cohort Cohort Cohort Cohort Cohort Cohort
Median 3090 3510 3080 3620 3100 3620
Average 3390 4430 3450 4430 3480 4480
Stdev 1520 3110 1740 3060 1730 3170 p (t-test) 9.8E-5 2.9E-4 2.7E-4
Min 1080 863 1080 863 1080 863
Max 9100 19700 14500 19700 14500 19700 n (Patient) 179 147 190 136 202 124
UO only


Lower limit of 95%
CI 1.04 1.09 1.15 1.10 1.08 1.19 0.976 0.955 1.22
Upper limit of 95% CI 2.87 3.00 3.39 3.03 2.97 3.56 2.68 2.64 3.66
[00285] Table 16.10: Comparison of marker levels and the area under the ROC curve (AUC) in EDTA samples for the "persistent" and "non-persistent" cohorts where persistence starts within 168 hours after sample collection and renal status is assessed by serum creatinine (sCr) only, urine output (UO) only, or serum creatinine or urine output RIFLE criteria.
sCr or UO


UO only

UO sCr only UO only UO sCr only UO only UO sCr only UO only
AUC 0.59 0.60 0.66 0.60 0.60 0.66 0.59 0.59 0.67
SE 0.031 0.032 0.035 0.032 0.032 0.035 0.032 0.033 0.035 p Value 0.0032 0.0022 7.1E-6 0.0024 0.0019 3.7E-6 0.0084 0.0044 1.3E-6 nCohort Non- persistent 169 175 235 183 186 237 196 198 238 nCohort Persistent 158 151 90 144 140 88 131 128 87
Cutoff Quartile 2 2320 2320 2330 2320 2320 2330 2320 2320 2330
Sensitivity 80% 80% 89% 82% 81 % 90% 82% 81 % 91 %
Specificity 30% 30% 30% 31 % 30% 30% 30% 29% 31 %
Cutoff Quartile 3 3280 3280 3280 3280 3280 3280 3280 3280 3280
Sensitivity 54% 55% 62% 55% 56% 62% 55% 56% 63%
Specificity 54% 54% 54% 54% 54% 54% 53% 54% 55%
Cutoff Quartile 4 4720 4710 4720 4720 4710 4720 4720 4710 4720
Sensitivity 30% 32% 36% 31 % 32% 36% 30% 31 % 37%
Specificity 80% 81 % 79% 80% 80% 79% 78% 79% 79%
OR Quartile 2 1.77 1.71 3.46 2.00 1.89 3.83 1.87 1.80 4.37 p Value 0.029 0.042 6.5E-4 0.010 0.018 4.0E-4 0.022 0.033 2.0E-4
Lower limit of 95%
CI 1.06 1.02 1.70 1.18 1.11 1.82 1.09 1.05 2.01
Upper limit of 95% CI 2.95 2.85 7.07 3.39 3.20 8.05 3.21 3.08 9.51
OR Quartile 3 1.39 1.45 1.97 1.40 1.49 1.99 1.38 1.51 2.07 p Value 0.14 0.096 0.0075 0.13 0.074 0.0071 0.16 0.070 0.0048
Lower limit of 95%
CI 0.902 0.936 1.20 0.904 0.962 1.21 0.885 0.967 1.25
Upper limit of 95% CI 2.15 2.24 3.24 2.17 2.32 3.29 2.15 2.36 3.43
OR Quartile 4 1.73 1.93 2.04 1.79 1.91 2.14 1.51 1.69 2.19 p Value 0.033 0.011 0.0087 0.023 0.012 0.0054 0.11 0.042 0.0042
Lower limit of 95%
CI 1.04 1.16 1.20 1.08 1.15 1.25 0.911 1.02 1.28
Upper limit of 95% CI 2.87 3.21 3.48 2.97 3.16 3.65 2.50 2.80 3.74
[00286] Example 17. Use of Metalloproteinase inhibitor 4 for evaluating renal status in patients admitted to the ICU: Persistent at RIFLE I or F
[00287] Patients from the intensive care unit (ICU) with RIFLE stage of injury (I) or failure (F) are enrolled in the following study. EDTA anti-coagulated blood samples (10 mL) and urine samples (50 mL) are collected from each patient at enrollment, and at every 12 hours up to day 3, and then every 24 hours thereafter up to day 7 while the subject is hospitalized.
Metalloproteinase inhibitor 4 is measured in the enrollment samples by standard immunoassay methods using commercially available assay reagents.
[00288] Kidney status is assessed by RIFLE criteria based on serum creatinine, urine output, or both serum creatinine and urine output. Two cohorts are defined to represent a "persistent" and a "non-persistent" population. "Persistent" indicates those patients whose minimum RIFLE stage during a period of 24, 48 or 72 hours is injury (I) or failure (F) where the persistence period can start from the time of sample collection to 24, 48, 72, 96 or 168 hours after sample collection. "Non-persistent" indicates those patients who are not persistent at injury (I) or
failure (F) and whose minimum RIFLE stage during a period of 24, 48 or 72 hours is non-injury (RIFLE 0) or risk of injury (R) where the persistence period can start from the time of sample collection to 24, 48, 72, 96 or 168 hours after sample collection. If a patient dies after injury (I) or failure (F) or is placed on renal replacement therapy (RRT) at any time from sample collection to 24, 48, 72, 96 or 168 hours after sample collection, the patient is considered "persistent".
[00289] The ability to distinguish the "persistent" and "non-persistent" cohorts is determined using receiver operating characteristic (ROC) analysis.
[00290] Table 17.1: Comparison of marker levels and the area under the ROC curve (AUC) in urine samples for the "persistent" and "non-persistent" cohorts where persistence starts within 24 hours after sample collection and renal status is assessed by serum creatinine (sCr) only, urine output (UO) only, or serum creatinine or urine output RIFLE criteria.
sCr or UO


UO only

Min 0.00110 1.76 0.00110 1.76 0.00110 1.76
Max 9030 7570 9030 7570 9030 7570 n (Patient) 241 74 256 59 263 52

[00291] Table 17.2: Comparison of marker levels and the area under the ROC curve (AUC) in urine samples for the "persistent" and "non-persistent" cohorts where persistence starts within 48 hours after sample collection and renal status is assessed by serum creatinine (sCr) only, urine output (UO) only, or serum creatinine or urine output RIFLE criteria.
sCr or UO

Persistence Period
Duration (hr) 24 48 72
Non-persistent Persistent Non-persistent Persistent Non-persistent Persistent Cohort Cohort Cohort Cohort Cohort Cohort
Median 13.3 34.9 16.3 36.9 15.4 40.1
Average 29.5 246 31.6 281 32.9 305
Stdev 47.4 989 47.8 1070 52.3 1120 p (t-test) 0.015 0.0041 0.0017
Min 0.00110 0.00167 0.00110 0.00167 0.00110 0.00167
Max 409 9030 409 9030 409 9030 n (Patient) 126 190 154 162 169 147
UO only


OR Quartile 4 5.29 4.63 2.44 4.94 4.56 2.46 4.73 4.23 2.54 p Value 4.4E-6 3.5E-6 0.0010 2.2E-7 3.7E-7 0.0015 9.0E-8 3.9E-7 0.0013
Lower limit of 95% CI 2.60 2.42 1.43 2.70 2.54 1.41 2.68 2.42 1.44
Upper limit of 95% CI 10.8 8.84 4.16 9.05 8.19 4.29 8.36 7.39 4.48
[00292] Table 17.3: Comparison of marker levels and the area under the ROC curve (AUC) in urine samples for the "persistent" and "non-persistent" cohorts where persistence starts within 72 hours after sample collection and renal status is assessed by serum creatinine (sCr) only, urine output (UO) only, or serum creatinine or urine output RIFLE criteria.
sCr or UO


UO only

Duration (hr) 24 48 72
sCr or sCr or sCr or
UO sCr only UO only UO sCr only UO only UO sCr only UO only
AUC 0.69 0.66 0.64 0.68 0.66 0.64 0.69 0.67 0.64
SE 0.030 0.030 0.034 0.030 0.030 0.036 0.030 0.030 0.037 p Value 1.8E-10 8.1E-8 5.9E-5 1.0E-9 1.4E-7 1.5E-4 1.2E-10 2.2E-8 1.6E-4 nCohort Non- persistent 111 124 212 144 151 225 158 163 232 nCohort Persistent 206 192 103 173 165 90 159 153 83
Cutoff Quartile 2 8.33 8.31 8.36 8.33 8.31 8.36 8.33 8.31 8.36
Sensitivity 82% 81 % 85% 83% 82% 86% 85% 84% 86%
Specificity 38% 34% 30% 35% 32% 29% 35% 33% 29%
Cutoff Quartile 3 24.1 23.6 24.1 24.1 23.6 24.1 24.1 23.6 24.1
Sensitivity 59% 58% 63% 61 % 59% 64% 63% 61 % 66%
Specificity 67% 63% 56% 63% 60% 56% 63% 60% 56%
Cutoff Quartile 4 60.9 60.8 61.8 60.9 60.8 61.8 60.9 60.8 61.8
Sensitivity 34% 34% 35% 37% 37% 36% 38% 37% 36%
Specificity 91 % 90% 80% 89% 88% 79% 87% 87% 79%
OR Quartile 2 2.78 2.15 2.54 2.64 2.16 2.46 3.00 2.54 2.40 p Value 1.3E-4 0.0038 0.0033 3.0E-4 0.0038 0.0070 7.4E-5 7.1E-4 0.011
Lower limit of 95% CI 1.65 1.28 1.36 1.56 1.28 1.28 1.74 1.48 1.22
Upper limit of 95% CI 4.69 3.60 4.72 4.47 3.64 4.73 5.17 4.35 4.72
OR Quartile 3 2.90 2.37 2.19 2.72 2.22 2.27 2.84 2.34 2.46 p Value 1.5E-5 2.6E-4 0.0015 1.8E-5 5.2E-4 0.0015 6.9E-6 2.3E-4 7.5E-4
Lower limit of 95% CI 1.79 1.49 1.35 1.72 1.41 1.37 1.80 1.49 1.46
Upper limit of 95% CI 4.71 3.77 3.55 4.29 3.48 3.76 4.48 3.67 4.15
OR Quartile 4 5.20 4.47 2.11 4.70 4.33 2.09 4.18 3.81 2.11 p Value 5.5E-6 5.7E-6 0.0053 5.3E-7 9.0E-7 0.0073 8.0E-7 2.5E-6 0.0074
Lower limit of 95% CI 2.55 2.34 1.25 2.57 2.41 1.22 2.37 2.18 1.22
Upper limit of 95% CI 10.6 8.54 3.57 8.60 7.78 3.58 7.38 6.64 3.66
[00293] Table 17.4: Comparison of marker levels and the area under the ROC curve (AUC) in urine samples for the "persistent" and "non-persistent" cohorts where persistence starts within 96 hours after sample collection and renal status is assessed by serum creatinine (sCr) only, urine output (UO) only, or serum creatinine or urine output RIFLE criteria.
sCr or UO


Median 13.3 34.7 16.3 34.9 15.9 36.9
Average 29.7 243 32.0 275 33.7 292
Stdev 47.7 984 48.4 1060 53.3 1090 p (t-test) 0.016 0.0052 0.0029
Min 0.00110 0.00167 0.00110 0.00167 0.00110 0.00167
Max 409 9030 409 9030 409 9030 n (Patient) 124 192 150 166 162 154
UO only
Persistence Period
Duration (hr) 24 48 72
Non-persistent Persistent Non-persistent Persistent Non-persistent Persistent Cohort Cohort Cohort Cohort Cohort Cohort
Median 18.2 36.7 18.2 37.0 18.2 38.8
Average 104 270 108 281 108 294
Stdev 643 977 633 1030 625 1060 p (t-test) 0.071 0.068 0.055
Min 0.00110 0.00277 0.00110 0.00277 0.00110 0.00277
Max 9030 7570 9030 7570 9030 7570 n (Patient) 208 107 220 95 226 89

sCr or UO


UO only


Cutoff Quartile 2 8.33 8.31 8.36 8.33 8.31 8.36 8.33 8.31 8.36
Sensitivity 82% 81 % 85% 83% 82% 86% 84% 84% 87%
Specificity 38% 35% 31 % 35% 33% 31 % 35% 34% 30%
Cutoff Quartile 3 24.1 23.6 24.1 24.1 23.6 24.1 24.1 23.6 24.1
Sensitivity 59% 58% 63% 60% 59% 63% 62% 61 % 64%
Specificity 67% 64% 57% 63% 61 % 56% 63% 61 % 56%
Cutoff Quartile 4 60.9 60.8 61.8 60.9 60.8 61.8 60.9 60.8 61.8
Sensitivity 34% 34% 35% 36% 36% 35% 37% 37% 35%
Specificity 92% 90% 81 % 89% 88% 80% 87% 87% 79%
OR Quartile 2 2.67 2.27 2.50 2.55 2.20 2.81 2.96 2.56 2.86 p Value 2.4E-4 0.0019 0.0026 4.5E-4 0.0030 0.0014 7.1E-5 5.6E-4 0.0016
Lower limit of 95% CI 1.58 1.35 1.38 1.51 1.31 1.49 1.73 1.50 1.49 Upper limit of 95% CI 4.52 3.81 4.54 4.29 3.70 5.30 5.06 4.37 5.48
OR Quartile 3 2.89 2.46 2.23 2.59 2.29 2.19 2.70 2.40 2.31 p Value 2.1E-5 1.6E-4 8.5E-4 4.4E-5 3.4E-4 0.0015 1.8E-5 1.5E-4 8.6E-4
Lower limit of 95% CI 1.77 1.54 1.39 1.64 1.45 1.35 1.71 1.53 1.41 Upper limit of 95% CI 4.71 3.93 3.58 4.10 3.59 3.55 4.26 3.77 3.78
OR Quartile 4 5.47 4.75 2.29 4.68 4.36 2.11 3.97 3.78 2.03 p Value 6.9E-6 4.4E-6 0.0018 9.4E-7 1.2E-6 0.0053 2.6E-6 3.4E-6 0.0088
Lower limit of 95% CI 2.61 2.44 1.36 2.52 2.40 1.25 2.23 2.16 1.20 Upper limit of 95% CI 11.5 9.25 3.85 8.66 7.89 3.57 7.05 6.64 3.45
[00295] Table 17.6: Comparison of marker levels and the area under the ROC curve (AUC) in EDTA samples for the "persistent" and "non-persistent" cohorts where persistence starts within 24 hours after sample collection and renal status is assessed by serum creatinine (sCr) only, urine output (UO) only, or serum creatinine or urine output RIFLE criteria.
sCr or UO


UO only
Persistence Period
Duration (hr) 24 48 72
Non-persistent Persistent Non-persistent Persistent Non-persistent Persistent Cohort Cohort Cohort Cohort Cohort Cohort
Median 3040 4350 3100 4340 3100 4390
Average 3520 4910 3570 5040 3570 5240
Stdev 2050 3060 2050 3280 2050 3390 p (t-test) 6.0E-6 1.0E-5 1.8E-6
Min 893 863 893 863 893 863
Max 19700 18800 19700 18800 19700 18800 n (Patient) 245 80 261 64 269 56

[00296] Table 17.7: Comparison of marker levels and the area under the ROC curve (AUC) in EDTA samples for the "persistent" and "non-persistent" cohorts where persistence starts within
48 hours after sample collection and renal status is assessed by serum creatinine (sCr) only, urine output (UO) only, or serum creatinine or urine output RIFLE criteria.
sCr or UO


UO only


Sensitivity 82% 81 % 86% 82% 82% 87% 80% 80% 88%
Specificity 39% 36% 30% 34% 34% 29% 30% 30% 29%
Cutoff Quartile 3 3280 3280 3280 3280 3280 3280 3280 3280 3280
Sensitivity 57% 55% 64% 57% 56% 62% 55% 54% 62%
Specificity 63% 59% 56% 58% 57% 54% 54% 54% 54%
Cutoff Quartile 4 4720 4710 4720 4720 4710 4720 4720 4710 4720
Sensitivity 31 % 31 % 36% 33% 32% 33% 31 % 30% 34%
Specificity 87% 85% 80% 85% 83% 78% 80% 80% 77%
OR Quartile 2 2.85 2.39 2.60 2.34 2.29 2.72 1.68 1.72 3.09 p Value 7.2E-5 8.2E-4 0.0030 0.0011 0.0015 0.0047 0.046 0.036 0.0031
Lower limit of 95% CI 1.70 1.44 1.38 1.41 1.37 1.36 1.01 1.04 1.46 Upper limit of 95% CI 4.78 3.98 4.91 3.91 3.82 5.43 2.79 2.87 6.53
OR Quartile 3 2.22 1.80 2.26 1.84 1.69 1.90 1.43 1.34 1.91 p Value 9.6E-4 0.012 9.9E-4 0.0067 0.020 0.013 0.11 0.18 0.015
Lower limit of 95% CI 1.38 1.14 1.39 1.18 1.09 1.15 0.924 0.869 1.13 Upper limit of 95% CI 3.56 2.83 3.68 2.87 2.62 3.16 2.21 2.08 3.23
OR Quartile 4 3.02 2.55 2.19 2.71 2.36 1.73 1.83 1.66 1.75 p Value 5.8E-4 0.0016 0.0032 3.8E-4 0.0016 0.049 0.021 0.049 0.050
Lower limit of 95% CI 1.61 1.43 1.30 1.56 1.38 1.00 1.10 1.00 1.00 Upper limit of 95% CI 5.68 4.57 3.69 4.68 4.01 2.99 3.04 2.76 3.05
[00297] Table 17.8: Comparison of marker levels and the area under the ROC curve (AUC) in EDTA samples for the "persistent" and "non-persistent" cohorts where persistence starts within 72 hours after sample collection and renal status is assessed by serum creatinine (sCr) only, urine output (UO) only, or serum creatinine or urine output RIFLE criteria.
sCr or UO


[00298] Table 17.9: Comparison of marker levels and the area under the ROC curve (AUC) in EDTA samples for the "persistent" and "non-persistent" cohorts where persistence starts within 96 hours after sample collection and renal status is assessed by serum creatinine (sCr) only, urine output (UO) only, or serum creatinine or urine output RIFLE criteria.
 Non-persistent Persistent Non-persistent Persistent Non-persistent Persistent Cohort Cohort Cohort Cohort Cohort Cohort
Median 2820 3520 2910 3560 3090 3500
Average 3130 4230 3240 4340 3440 4250
Stdev 1540 2680 1520 2840 1810 2820 p (t-test) 1.1E-4 3.6E-5 0.0024
Min 1080 863 1080 863 1080 863
Max 9100 19700 9100 19700 14500 19700 n (Patient) 106 221 140 187 155 172 sCr only
Persistence Period
Duration (hr) 24 48 72
Non-persistent Persistent Non-persistent Persistent Non-persistent Persistent Cohort Cohort Cohort Cohort Cohort Cohort
Median 2870 3510 2930 3520 3100 3480
Average 3210 4230 3260 4340 3450 4250
Stdev 1540 2740 1520 2870 1800 2850 p (t-test) 2.1E-4 5.4E-5 0.0027
Min 1080 863 1080 863 1080 863
Max 9100 19700 9100 19700 14500 19700 n (Patient) 118 208 144 182 158 168
UO only


OR Quartile 2 2.77 2.48 2.48 2.35 2.33 2.44 1.82 1.84 2.70 p Value 1.1E-4 4.9E-4 0.0026 0.0010 0.0012 0.0048 0.020 0.019 0.0028
Lower limit of 95%
CI 1.65 1.49 1.37 1.41 1.40 1.31 1.10 1.11 1.41
Upper limit of 95% CI 4.65 4.14 4.50 3.91 3.88 4.53 3.02 3.06 5.16
OR Quartile 3 2.11 1.80 1.81 1.76 1.65 1.57 1.33 1.28 1.60 p Value 0.0020 0.012 0.012 0.012 0.026 0.062 0.20 0.27 0.057
Lower limit of 95%
CI 1.31 1.14 1.14 1.13 1.06 0.978 0.858 0.828 0.986
Upper limit of 95% CI 3.39 2.85 2.87 2.74 2.56 2.52 2.05 1.98 2.58
OR Quartile 4 2.92 2.70 2.03 2.53 2.34 1.82 1.69 1.67 1.79 p Value 8.7E-4 1.0E-3 0.0066 9.0E-4 0.0020 0.024 0.045 0.049 0.031
Lower limit of 95%
CI 1.55 1.49 1.22 1.46 1.37 1.08 1.01 1.00 1.06
Upper limit of 95% CI 5.49 4.88 3.39 4.39 4.00 3.07 2.81 2.78 3.03
[00299] Table 17.10: Comparison of marker levels and the area under the ROC curve (AUC) in EDTA samples for the "persistent" and "non-persistent" cohorts where persistence starts within 168 hours after sample collection and renal status is assessed by serum creatinine (sCr) only, urine output (UO) only, or serum creatinine or urine output RIFLE criteria.
sCr or UO

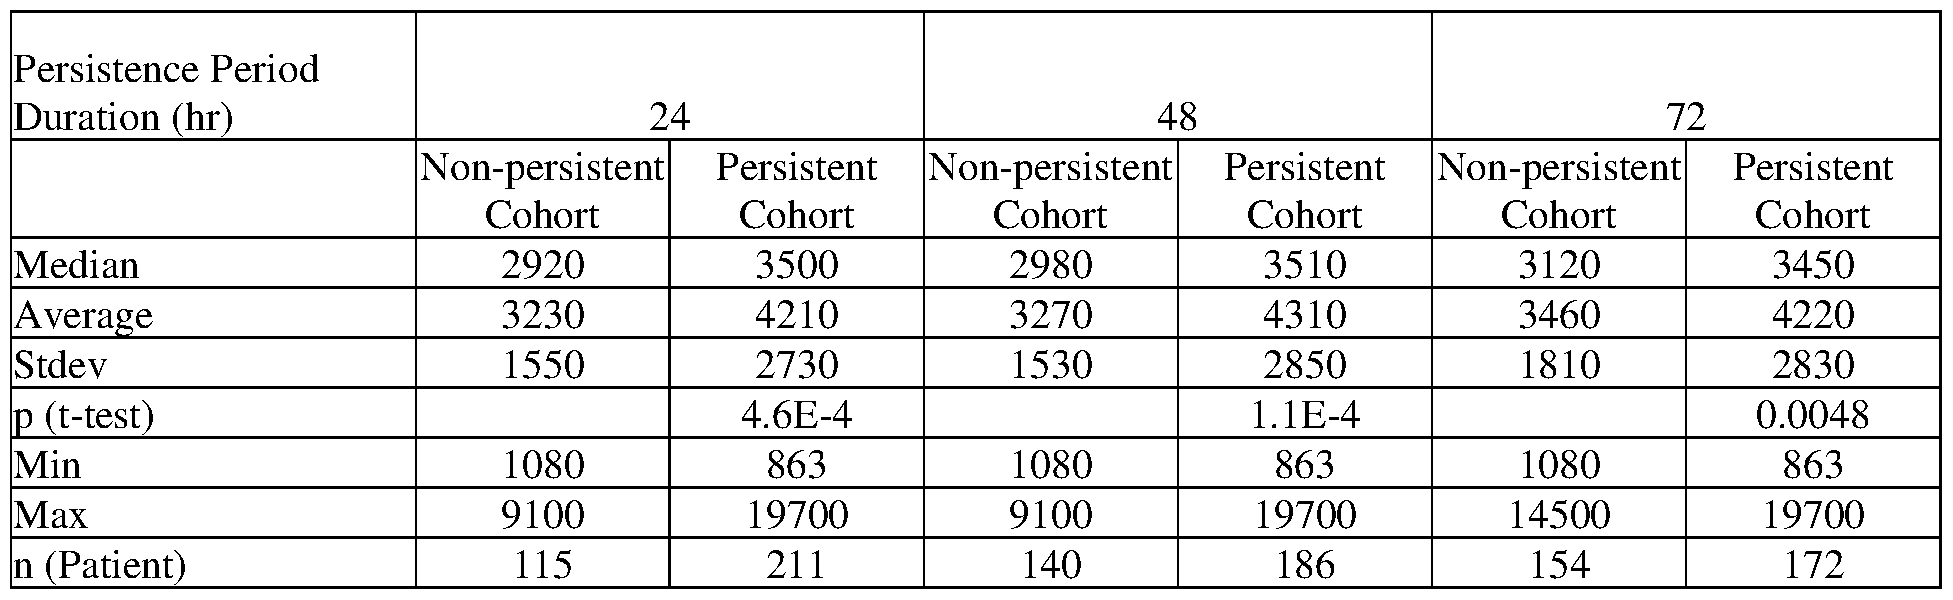
UO only
 Cohort Cohort Cohort Cohort Cohort Cohort
Median 3010 3910 3050 3860 3040 3890
Average 3430 4580 3470 4620 3470 4670
Stdev 2030 2810 2010 2900 2020 2910 p (t-test) 2.7E-5 3.4E-5 2.0E-5
Min 893 863 893 863 893 863
Max 19700 18800 19700 18800 19700 18800 n (Patient) 204 121 214 111 219 106

[00300] Example 18. Use of C-C motif chemokine 15 for evaluating renal status in patients admitted to the ICU: Recovery to RIFLE 0 from RIFLE I and F
[00301] Patients from the intensive care unit (ICU) with RIFLE stage of injury (I) or failure (F) are enrolled in the following study. EDTA anti-coagulated blood samples (10 mL) and urine samples (50 mL) are collected from each patient at enrollment, and at every 12 hours up to day 3, and then every 24 hours thereafter up to day 7 while the subject is hospitalized. C-C motif
chemokine 15 is measured in the enrollment samples by standard immunoassay methods using commercially available assay reagents.
[00302] Kidney status is assessed by RIFLE criteria based on serum creatinine, urine output, or both serum creatinine and urine output. Two cohorts are defined to represent a "recovered" and a "non-recovered" population. "Recovered" indicates those patients whose maximum RIFLE stage during a period of 24, 48 or 72 hours is non-injury (RIFLE 0) where the recovery period can start from the time of sample collection to 24, 48, 72, 96 or 168 hours after sample collection. "Non-recovered" indicates those patients whose maximum RIFLE stage during a period of 24, 48 or 72 hours is risk of injury (R), injury (I) or failure (F) where the recovery period can start from the time of sample collection to 24, 48, 72, 96 or 168 hours after sample collection. If a patient dies or is placed on renal replacement therapy (RRT) at any time from sample collection to 24, 48, 72, 96 or 168 hours after sample collection, the patient is considered "non-recovered".
[00303] The ability to distinguish the "recovered" and "non-recovered" cohorts is determined using receiver operating characteristic (ROC) analysis.
[00304] Table 18.1: Comparison of marker levels and the area under the ROC curve (AUC) in urine samples for the "recovered" and "non-recovered" cohorts where recovery starts within 24 hours after sample collection and renal status is assessed by serum creatinine (sCr) only, urine output (UO) only, or serum creatinine or urine output RIFLE criteria.
sCr or UO


Min 0.0116 0.0116 0.0116 0.0116 0.0187 0.0116
Max 1300 53500 1300 53500 1300 53500 n (Patient) 76 239 74 241 70 245
UO only
Recovery Period
Duration (hr) 24 48 72
Non- Non- Non-
Recovered recovered Recovered recovered Recovered recovered Cohort Cohort Cohort Cohort Cohort Cohort
Median 118 248 104 275 103 237
Average 1880 1470 1750 1690 1460 1980
Stdev 6590 3060 6510 3970 5360 5640 p (t-test) 0.53 0.92 0.41
Min 0.0116 0.0116 0.0187 0.0116 0.0187 0.0116
Max 53500 19200 53500 30000 52500 53500 n (Patient) 193 121 172 142 155 159

sCr or UO


UO only


SE 0.029 0.028 0.035 0.030 0.028 0.034 0.030 0.029 0.033 p Value 3.0E-14 0 0.18 3.1E-14 6.7E-16 0.33 8.2E-15 3.1E-15 0.23 nCohort Recovered 90 106 211 79 104 193 71 99 177 nCohort Non- recovered 226 210 103 237 212 121 245 217 137
Cutoff Quartile 2 0.0489 0.0489 0.0489 0.0489 0.0489 0.0489 0.0489 0.0489 0.0489
Sensitivity 81 % 84% 79% 81 % 83% 78% 82% 83% 79%
Specificity 36% 38% 24% 38% 38% 24% 41 % 37% 25%
Cutoff Quartile 3 155 155 155 155 155 155 155 155 155
Sensitivity 61 % 63% 57% 60% 62% 56% 58% 61 % 55%
Specificity 78% 75% 54% 80% 75% 54% 79% 75% 54%
Cutoff Quartile 4 909 909 902 909 909 902 909 909 902
Sensitivity 33% 35% 28% 32% 34% 26% 31 % 34% 26%
Specificity 96% 94% 76% 95% 94% 75% 96% 95% 76%
OR Quartile 2 2.42 3.14 1.17 2.69 3.03 1.09 3.07 2.90 1.23 p Value 0.0015 3.1E-5 0.58 5.5E-4 5.2E-5 0.76 1.3E-4 1.1E-4 0.44
Lower limit of 95%
CI 1.40 1.83 0.666 1.53 1.77 0.634 1.73 1.69 0.723
Upper limit of 95% CI 4.17 5.37 2.07 4.70 5.19 1.87 5.44 4.98 2.10
OR Quartile 3 5.49 5.21 1.55 5.89 4.95 1.50 5.23 4.69 1.40 p Value 3.3E-9 6.5E-10 0.072 1.0E-8 2.1E-9 0.083 2.0E-7 1.1E-8 0.14
Lower limit of 95%
CI 3.12 3.08 0.962 3.21 2.93 0.949 2.80 2.76 0.896
Upper limit of 95% CI 9.65 8.79 2.49 10.8 8.36 2.37 9.77 7.96 2.19
OR Quartile 4 10.7 8.88 1.26 8.68 8.58 1.04 10.2 9.73 1.11 p Value 8.1E-6 9.0E-7 0.39 4.8E-5 1.3E-6 0.88 1.3E-4 2.2E-6 0.69
Lower limit of 95%
CI 3.77 3.72 0.740 3.06 3.59 0.617 3.11 3.79 0.665
Upper limit of 95% CI 30.2 21.2 2.15 24.6 20.5 1.75 33.4 25.0 1.85
[00306] Table 18.3: Comparison of marker levels and the area under the ROC curve (AUC) in urine samples for the "recovered" and "non-recovered" cohorts where recovery starts within 72 hours after sample collection and renal status is assessed by serum creatinine (sCr) only, urine output (UO) only, or serum creatinine or urine output RIFLE criteria.
sCr or UO

Recovered recovered Recovered recovered Recovered recovered Cohort Cohort Cohort Cohort Cohort Cohort
Median 36.6 423 39.4 403 36.6 366
Average 365 2620 373 2580 370 2530
Stdev 1060 6900 1070 6850 1080 6770 p (t-test) 3.0E-4 4.3E-4 6.4E-4
Min 0.0116 0.0116 0.0116 0.0116 0.0116 0.0116
Max 7940 53500 7940 53500 7940 53500 n (Patient) 127 189 124 192 119 197
UO only
Recovery Period
Duration (hr) 24 48 72
Non- Non- Non-
Recovered recovered Recovered recovered Recovered recovered Cohort Cohort Cohort Cohort Cohort Cohort
Median 118 338 118 237 115 222
Average 1870 1420 1950 1310 1740 1700
Stdev 6330 3100 6480 2970 5520 5490 p (t-test) 0.50 0.33 0.95
Min 0.0116 0.0116 0.0116 0.0116 0.0116 0.0116
Max 53500 19200 53500 19200 52500 53500 n (Patient) 213 101 203 111 189 125

Lower limit of 95%
CI 2.95 2.98 0.769 2.61 2.84 0.637 2.45 2.89 0.664
Upper limit of 95% CI 13.0 11.8 2.24 11.5 11.2 1.84 11.6 12.0 1.87
[00307] Table 18.4: Comparison of marker levels and the area under the ROC curve (AUC) in urine samples for the "recovered" and "non-recovered" cohorts where recovery starts within 96 hours after sample collection and renal status is assessed by serum creatinine (sCr) only, urine output (UO) only, or serum creatinine or urine output RIFLE criteria.
sCr or UO


UO only

Duration (hr) 24 48 72
sCr or sCr or sCr or
UO sCr only UO only UO sCr only UO only UO sCr only UO only
AUC 0.70 0.71 0.55 0.69 0.70 0.54 0.69 0.70 0.54
SE 0.029 0.029 0.035 0.030 0.029 0.034 0.030 0.029 0.034 p Value 2.3E-12 2.8E-13 0.13 2.5E-10 6.1E-12 0.25 2.2E-10 7.9E-12 0.19 nCohort Recovered 134 140 215 125 138 206 114 135 193 nCohort Non- recovered 182 176 99 191 178 108 202 181 121
Cutoff Quartile 2 0.0489 0.0489 0.0489 0.0489 0.0489 0.0489 0.0489 0.0489 0.0489
Sensitivity 84% 85% 81 % 83% 84% 81 % 84% 83% 81 %
Specificity 33% 34% 25% 34% 33% 25% 36% 33% 26%
Cutoff Quartile 3 155 155 155 155 155 155 155 155 155
Sensitivity 64% 65% 58% 62% 64% 56% 61 % 64% 55%
Specificity 69% 69% 53% 69% 68% 53% 69% 68% 53%
Cutoff Quartile 4 909 909 902 909 909 902 909 909 902
Sensitivity 37% 38% 28% 35% 37% 26% 34% 37% 26%
Specificity 91 % 91 % 76% 90% 91 % 75% 90% 91 % 76%
OR Quartile 2 2.48 2.79 1.41 2.51 2.49 1.40 2.88 2.43 1.49 p Value 8.4E-4 1.9E-4 0.25 6.7E-4 8.3E-4 0.25 1.1E-4 0.0010 0.16
Lower limit of 95%
CI 1.45 1.63 0.785 1.48 1.46 0.790 1.69 1.43 0.854
Upper limit of 95% CI 4.22 4.78 2.54 4.28 4.24 2.48 4.91 4.14 2.60
OR Quartile 3 4.08 4.01 1.56 3.64 3.81 1.40 3.51 3.73 1.42 p Value 7.1E-9 8.1E-9 0.069 1.2E-7 2.7E-8 0.15 4.5E-7 4.6E-8 0.13
Lower limit of 95%
CI 2.54 2.50 0.965 2.26 2.38 0.880 2.16 2.33 0.899
Upper limit of 95% CI 6.57 6.43 2.52 5.88 6.10 2.24 5.73 5.98 2.24
OR Quartile 4 5.92 5.86 1.27 5.09 5.67 1.06 4.75 6.02 1.12 p Value 1.6E-7 8.5E-8 0.39 1.6E-6 1.5E-7 0.82 8.7E-6 1.2E-7 0.68
Lower limit of 95%
CI 3.05 3.07 0.740 2.62 2.97 0.624 2.39 3.10 0.663
Upper limit of 95% CI 11.5 11.2 2.17 9.90 10.8 1.81 9.44 11.7 1.88
[00308] Table 18.5: Comparison of marker levels and the area under the ROC curve (AUC) in urine samples for the "recovered" and "non-recovered" cohorts where recovery starts within 168 hours after sample collection and renal status is assessed by serum creatinine (sCr) only, urine output (UO) only, or serum creatinine or urine output RIFLE criteria.
sCr or UO


UO only

 Lower limit of 95%
CI 1.69 2.39 1.11 1.64 2.33 1.01 1.64 2.27 1.04
Upper limit of 95% CI 4.29 6.08 2.88 4.13 5.91 2.60 4.13 5.74 2.65
OR Quartile 4 2.25 4.98 1.54 2.13 4.72 1.45 2.13 4.64 1.47 p Value 0.0021 8.1E-8 0.11 0.0041 2.0E-7 0.16 0.0041 2.8E-7 0.15
Lower limit of 95%
CI 1.34 2.77 0.909 1.27 2.63 0.858 1.27 2.59 0.872
Upper limit of 95% CI 3.77 8.95 2.61 3.57 8.49 2.46 3.57 8.34 2.48
[00309] Table 18.6: Comparison of marker levels and the area under the ROC curve (AUC) in EDTA samples for the "recovered" and "non-recovered" cohorts where recovery starts within 24 hours after sample collection and renal status is assessed by serum creatinine (sCr) only, urine output (UO) only, or serum creatinine or urine output RIFLE criteria.
sCr or UO


UO only
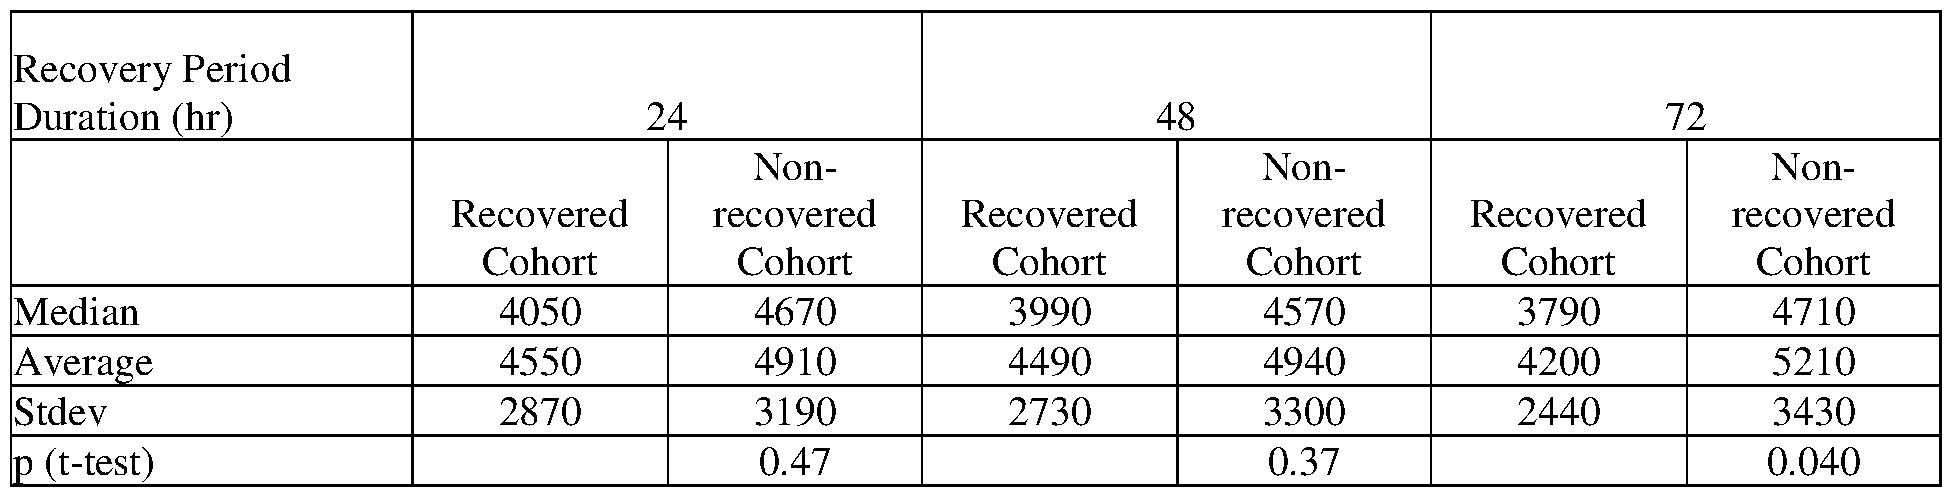
Max 13800 21200 13800 21200 11800 21200 n (Patient) 91 59 84 66 77 73

[00310] Table 18.7: Comparison of marker levels and the area under the ROC curve (AUC) in EDTA samples for the "recovered" and "non-recovered" cohorts where recovery starts within 48 hours after sample collection and renal status is assessed by serum creatinine (sCr) only, urine output (UO) only, or serum creatinine or urine output RIFLE criteria.
sCr or UO


UO only

 Lower limit of 95% CI 1.96 1.41 0.725 1.55 1.33 0.767 1.66 1.11 0.950 Upper limit of 95% CI 9.89 6.20 2.84 7.93 5.87 2.89 9.63 4.97 3.51
OR Quartile 4 3.97 3.48 0.899 3.36 3.34 0.936 4.03 2.96 1.24 p Value 0.015 0.016 0.79 0.033 0.020 0.86 0.029 0.037 0.56
Lower limit of 95% CI 1.31 1.26 0.409 1.10 1.21 0.437 1.15 1.07 0.594 Upper limit of 95% CI 12.0 9.62 1.98 10.2 9.26 2.00 14.1 8.23 2.61
[00311] Table 18.8: Comparison of marker levels and the area under the ROC curve (AUC) in EDTA samples for the "recovered" and "non-recovered" cohorts where recovery starts within 72 hours after sample collection and renal status is assessed by serum creatinine (sCr) only, urine output (UO) only, or serum creatinine or urine output RIFLE criteria.
sCr or UO


UO only


[00312] Table 18.9: Comparison of marker levels and the area under the ROC curve (AUC) in EDTA samples for the "recovered" and "non-recovered" cohorts where recovery starts within 96 hours after sample collection and renal status is assessed by serum creatinine (sCr) only, urine output (UO) only, or serum creatinine or urine output RIFLE criteria.
sCr or UO


UO only

 Upper limit of 95% CI 5.02 3.88 3.99 4.96 3.68 3.86 6.26 3.31 4.19
OR Quartile 4 1.49 1.60 1.05 1.45 1.54 1.05 1.63 1.43 1.29 p Value 0.32 0.24 0.90 0.36 0.28 0.91 0.25 0.37 0.50
Lower limit of 95% CI 0.682 0.734 0.489 0.654 0.708 0.492 0.702 0.657 0.616
Upper limit of 95% CI 3.25 3.49 2.25 3.23 3.36 2.22 3.80 3.13 2.71
[00313] Table 18.10: Comparison of marker levels and the area under the ROC curve (AUC) in EDTA samples for the "recovered" and "non-recovered" cohorts where recovery starts within 168 hours after sample collection and renal status is assessed by serum creatinine (sCr) only, urine output (UO) only, or serum creatinine or urine output RIFLE criteria.
sCr or UO


UO only

Duration (hr) 24 48 72
sCr or sCr or sCr or
UO sCr only UO only UO sCr only UO only UO sCr only UO only
AUC 0.50 0.56 0.54 0.51 0.55 0.53 0.51 0.55 0.53
SE 0.047 0.047 0.049 0.047 0.047 0.049 0.047 0.047 0.049 p Value 0.92 0.23 0.44 0.91 0.31 0.59 0.91 0.31 0.52 nCohort Recovered 81 67 95 80 65 93 80 65 91 nCohort Non- recovered 70 84 55 71 86 57 71 86 59
Cutoff Quartile 2 2740 2740 2740 2740 2740 2740 2740 2740 2740
Sensitivity 73% 77% 75% 73% 77% 74% 73% 77% 75%
Specificity 23% 28% 25% 24% 28% 25% 24% 28% 25%
Cutoff Quartile 3 4230 4230 4260 4230 4230 4260 4230 4230 4260
Sensitivity 53% 57% 56% 54% 57% 56% 54% 57% 56%
Specificity 52% 58% 54% 52% 58% 54% 52% 58% 54%
Cutoff Quartile 4 6010 6010 6060 6010 6010 6060 6010 6010 6060
Sensitivity 24% 26% 24% 24% 26% 23% 24% 26% 24%
Specificity 74% 76% 74% 74% 75% 73% 74% 75% 74%
OR Quartile 2 0.823 1.35 0.990 0.852 1.26 0.920 0.852 1.26 0.992 p Value 0.60 0.42 0.98 0.67 0.53 0.83 0.67 0.53 0.98
Lower limit of 95% CI 0.394 0.648 0.462 0.408 0.604 0.433 0.408 0.604 0.467 Upper limit of 95% CI 1.72 2.83 2.12 1.78 2.65 1.96 1.78 2.65 2.11
OR Quartile 3 1.21 1.86 1.50 1.27 1.86 1.49 1.27 1.86 1.48 p Value 0.56 0.062 0.24 0.46 0.061 0.24 0.46 0.061 0.24
Lower limit of 95% CI 0.636 0.970 0.767 0.671 0.971 0.767 0.671 0.971 0.766 Upper limit of 95% CI 2.29 3.56 2.92 2.41 3.58 2.89 2.41 3.58 2.86
OR Quartile 4 0.916 1.13 0.867 0.884 1.05 0.804 0.884 1.05 0.869 p Value 0.82 0.75 0.72 0.74 0.89 0.58 0.74 0.89 0.72
Lower limit of 95% CI 0.438 0.538 0.401 0.423 0.500 0.372 0.423 0.500 0.406 Upper limit of 95% CI 1.92 2.38 1.87 1.85 2.21 1.74 1.85 2.21 1.86
[00314] Example 19. Use of C-C motif chemokine 15 for evaluating renal status in patients admitted to the ICU: Recovery to RIFLE 0 and R from RIFLE I and F
[00315] Patients from the intensive care unit (ICU) with RIFLE stage of injury (I) or failure (F) are enrolled in the following study. EDTA anti-coagulated blood samples (10 mL) and urine samples (50 mL) are collected from each patient at enrollment, and at every 12 hours up to day 3, and then every 24 hours thereafter up to day 7 while the subject is hospitalized. C-C motif chemokine 15 is measured in the enrollment samples by standard immunoassay methods using commercially available assay reagents.
[00316] Kidney status is assessed by RIFLE criteria based on serum creatinine, urine output, or both serum creatinine and urine output. Two cohorts are defined to represent a "recovered" and a "non-recovered" population. "Recovered" indicates those patients whose maximum RIFLE stage during a period of 24, 48 or 72 hours is non-injury (RIFLE 0) or risk of injury (R) where the recovery period can start from the time of sample collection to 24, 48, 72, 96 or 168 hours after sample collection. "Non-recovered" indicates those patients whose maximum RIFLE stage
during a period of 24, 48 or 72 hours is injury (I) or failure (F) where the recovery period can start from the time of sample collection to 24, 48, 72, 96 or 168 hours after sample collection. If a patient dies or is placed on renal replacement therapy (RRT) at any time from sample collection to 24, 48, 72, 96 or 168 hours after sample collection, the patient is considered "non- recovered".
[00317] The ability to distinguish the "recovered" and "non-recovered" cohorts is determined using receiver operating characteristic (ROC) analysis.
[00318] Table 19.1: Comparison of marker levels and the area under the ROC curve (AUC) in urine samples for the "recovered" and "non-recovered" cohorts where recovery starts within 24 hours after sample collection and renal status is assessed by serum creatinine (sCr) only, urine output (UO) only, or serum creatinine or urine output RIFLE criteria.
sCr or UO

UO only

Stdev 6210 3290 6400 3100 5420 5670 p (t-test) 0.77 0.49 0.83
Min 0.0116 0.0116 0.0187 0.0116 0.0187 0.0116
Max 53500 19200 53500 19200 52500 53500 n (Patient) 221 93 207 107 197 117

[00319] Table 19.2: Comparison of marker levels and the area under the ROC curve (AUC) in urine samples for the "recovered" and "non-recovered" cohorts where recovery starts within 48 hours after sample collection and renal status is assessed by serum creatinine (sCr) only, urine output (UO) only, or serum creatinine or urine output RIFLE criteria.
sCr or UO

Stdev 4000 6310 4030 6280 4090 6220 p (t-test) 0.018 0.022 0.029
Min 0.0116 0.0116 0.0116 0.0116 0.0116 0.0116
Max 34200 53500 34200 53500 34200 53500 n (Patient) 135 181 133 183 129 187 sCr only
Recovery Period
Duration (hr) 24 48 72
Non- Non- Non-
Recovered recovered Recovered recovered Recovered recovered Cohort Cohort Cohort Cohort Cohort Cohort
Median 48.7 436 49.4 434 51.3 434
Average 836 2490 841 2480 847 2460
Stdev 3820 6530 3840 6510 3850 6490 p (t-test) 0.0072 0.0080 0.0089
Min 0.01 16 0.0116 0.0116 0.0116 0.0116 0.0116
Max 34200 53500 34200 53500 34200 53500 n (Patient) 148 168 147 169 146 170
UO only


Lower limit of 95%
CI 1.54 1.77 0.763 1.48 1.80 0.726 1.38 1.70 0.677
Upper limit of 95% CI 4.47 5.31 2.58 4.29 5.40 2.36 3.97 5.06 2.07
OR Quartile 3 3.95 3.73 1.95 3.75 3.63 1.78 3.59 3.54 1.57 p Value 1.4E-8 3.1E-8 0.0090 4.4E-8 5.6E-8 0.020 1.3E-7 1.0E-7 0.058
Lower limit of 95%
CI 2.46 2.34 1.18 2.34 2.28 1.09 2.23 2.22 0.985
Upper limit of 95% CI 6.35 5.95 3.22 6.02 5.79 2.91 5.77 5.63 2.52
OR Quartile 4 4.38 4.51 1.45 4.23 4.43 1.28 3.95 4.36 1.23 p Value 2.8E-6 6.9E-7 0.18 4.6E-6 9.2E-7 0.38 1.3E-5 1.2E-6 0.44
Lower limit of 95%
CI 2.36 2.49 0.838 2.28 2.45 0.740 2.13 2.40 0.726
Upper limit of 95% CI 8.11 8.17 2.51 7.84 8.03 2.20 7.33 7.89 2.09
[00320] Table 19.3: Comparison of marker levels and the area under the ROC curve (AUC) in urine samples for the "recovered" and "non-recovered" cohorts where recovery starts within 72 hours after sample collection and renal status is assessed by serum creatinine (sCr) only, urine output (UO) only, or serum creatinine or urine output RIFLE criteria.
sCr or UO


Recovered recovered Recovered recovered Recovered recovered
Cohort Cohort Cohort Cohort Cohort Cohort
Median 115 354 113 351 115 261
Average 1790 1550 1800 1530 1640 1900
Stdev 6200 3230 6210 3220 5260 5980 p (t-test) 0.72 0.69 0.69
Min 0.0116 0.0116 0.0116 0.0116 0.0116 0.0116
Max 53500 19200 53500 19200 52500 53500 n (Patient) 223 91 222 92 211 103

[00321] Table 19.4: Comparison of marker levels and the area under the ROC curve (AUC) in urine samples for the "recovered" and "non-recovered" cohorts where recovery starts within 96 hours after sample collection and renal status is assessed by serum creatinine (sCr) only, urine output (UO) only, or serum creatinine or urine output RIFLE criteria.
 Non- Non- Non-
Recovered recovered Recovered recovered Recovered recovered Cohort Cohort Cohort Cohort Cohort Cohort
Median 53.2 555 54.2 544 57.7 492
Average 856 2680 871 2630 893 2560
Stdev 3670 6870 3700 6810 3740 6740 p (t-test) 0.0030 0.0043 0.0067
Min 0.0116 0.0116 0.0116 0.0116 0.0116 0.0116
Max 34200 53500 34200 53500 34200 53500 n (Patient) 167 149 164 152 160 156 sCr only
Recovery Period
Duration (hr) 24 48 72
Non- Non- Non-
Recovered recovered Recovered recovered Recovered recovered Cohort Cohort Cohort Cohort Cohort Cohort
Median 55.3 555 55.7 553 56.1 550
Average 847 2740 852 2720 857 2700
Stdev 3620 6950 3630 6930 3640 6910 p (t-test) 0.0021 0.0024 0.0027
Min 0.0116 0.0116 0.0116 0.0116 0.0116 0.0116
Max 34200 53500 34200 53500 34200 53500 n (Patient) 171 145 170 146 169 147
UO only


Cutoff Quartile 4 909 909 902 909 909 902 909 909 902
Sensitivity 38% 39% 29% 38% 38% 29% 37% 38% 28%
Specificity 87% 87% 77% 87% 86% 76% 86% 86% 76%
OR Quartile 2 2.41 2.65 1.49 2.34 2.70 1.38 2.14 2.53 1.34 p Value 0.0018 7.1E-4 0.20 0.0024 5.8E-4 0.29 0.0057 0.0012 0.32
Lower limit of 95%
CI 1.39 1.51 0.811 1.35 1.53 0.759 1.25 1.44 0.751
Upper limit of 95% CI 4.19 4.67 2.73 4.05 4.74 2.51 3.68 4.41 2.40
OR Quartile 3 4.06 3.86 1.86 3.72 3.74 1.80 3.32 3.63 1.55 p Value 4.9E-9 1.6E-8 0.014 3.2E-8 3.1E-8 0.020 3.4E-7 5.6E-8 0.071
Lower limit of 95%
CI 2.54 2.41 1.14 2.33 2.35 1.10 2.09 2.28 0.963
Upper limit of 95% CI 6.49 6.16 3.06 5.92 5.97 2.94 5.26 5.79 2.50
OR Quartile 4 4.08 4.05 1.36 3.87 3.98 1.33 3.61 3.91 1.22 p Value 7.4E-7 6.9E-7 0.27 1.8E-6 9.4E-7 0.31 5.9E-6 1.3E-6 0.47
Lower limit of 95%
CI 2.34 2.33 0.787 2.22 2.29 0.771 2.07 2.25 0.712
Upper limit of 95% CI 7.13 7.03 2.34 6.76 6.90 2.29 6.29 6.78 2.09
[00322] Table 19.5: Comparison of marker levels and the area under the ROC curve (AUC) in urine samples for the "recovered" and "non-recovered" cohorts where recovery starts within 168 hours after sample collection and renal status is assessed by serum creatinine (sCr) only, urine output (UO) only, or serum creatinine or urine output RIFLE criteria.
sCr or UO


[00323] Table 19.6: Comparison of marker levels and the area under the ROC curve (AUC) in EDTA samples for the "recovered" and "non-recovered" cohorts where recovery starts within 24 hours after sample collection and renal status is assessed by serum creatinine (sCr) only, urine output (UO) only, or serum creatinine or urine output RIFLE criteria.
sCr or UO
 sCr only

UO only

 Sensitivity 79% 78% 76% 79% 78% 75% 78% 77% 76% Specificity 35% 31 % 26% 33% 31 % 26% 33% 29% 26%
Cutoff Quartile 3 4230 4260 4260 4230 4260 4260 4230 4260 4260
Sensitivity 58% 57% 52% 57% 57% 53% 57% 57% 56%
Specificity 65% 63% 51 % 65% 63% 52% 65% 63% 54%
Cutoff Quartile 4 6010 6060 6060 6010 6060 6060 6010 6060 6060
Sensitivity 31 % 33% 24% 31 % 33% 23% 30% 32% 25%
Specificity 88% 88% 74% 88% 88% 73% 87% 88% 75%
OR Quartile 2 2.05 1.54 1.12 1.84 1.54 1.07 1.73 1.38 1.15 p Value 0.064 0.27 0.79 0.12 0.27 0.87 0.17 0.41 0.72
Lower limit of 95%
CI 0.959 0.721 0.498 0.858 0.721 0.493 0.798 0.643 0.539
Upper limit of 95% CI 4.38 3.27 2.50 3.95 3.27 2.32 3.73 2.95 2.46
OR Quartile 3 2.58 2.32 1.13 2.45 2.32 1.19 2.50 2.19 1.48 p Value 0.0086 0.017 0.72 0.013 0.017 0.61 0.013 0.026 0.24
Lower limit of 95%
CI 1.27 1.16 0.566 1.20 1.16 0.609 1.22 1.10 0.766
Upper limit of 95% CI 5.24 4.63 2.27 4.97 4.63 2.33 5.13 4.39 2.86
OR Quartile 4 3.28 3.72 0.896 3.15 3.72 0.799 2.92 3.58 1.01 p Value 0.014 0.0067 0.79 0.018 0.0067 0.58 0.027 0.0085 0.98
Lower limit of 95%
CI 1.27 1.44 0.400 1.22 1.44 0.365 1.13 1.38 0.475
Upper limit of 95% CI 8.48 9.61 2.01 8.17 9.61 1.75 7.58 9.26 2.14
[00324] Table 19.7: Comparison of marker levels and the area under the ROC curve (AUC) in EDTA samples for the "recovered" and "non-recovered" cohorts where recovery starts within 48 hours after sample collection and renal status is assessed by serum creatinine (sCr) only, urine output (UO) only, or serum creatinine or urine output RIFLE criteria.
sCr or UO

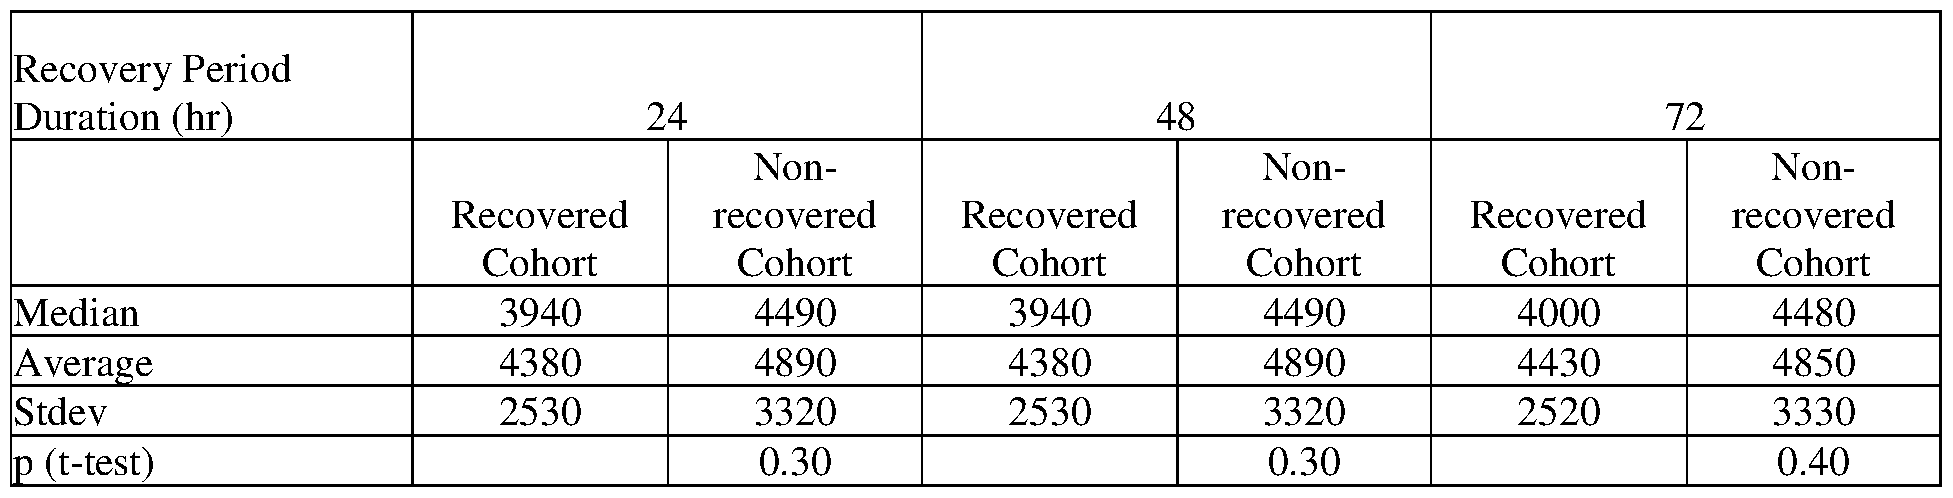
Max 11800 21200 11800 21200 11800 21200 n (Patient) 67 84 67 84 66 85
UO only
Recovery Period
Duration (hr) 24 48 72
Non- Non- Non-
Recovered recovered Recovered recovered Recovered recovered Cohort Cohort Cohort Cohort Cohort Cohort
Median 4060 4710 4050 4710 3930 4780
Average 4550 5020 4540 5010 4420 5170
Stdev 2710 3580 2730 3500 2620 3520 p (t-test) 0.37 0.37 0.14
Min 62.8 276 62.8 276 62.8 276
Max 13800 21200 13800 21200 13800 21200 n (Patient) 105 45 103 47 95 55

[00325] Table 19.8: Comparison of marker levels and the area under the ROC curve (AUC) in EDTA samples for the "recovered" and "non-recovered" cohorts where recovery starts within
72 hours after sample collection and renal status is assessed by serum creatinine (sCr) only, urine output (UO) only, or serum creatinine or urine output RIFLE criteria.
sCr or UO

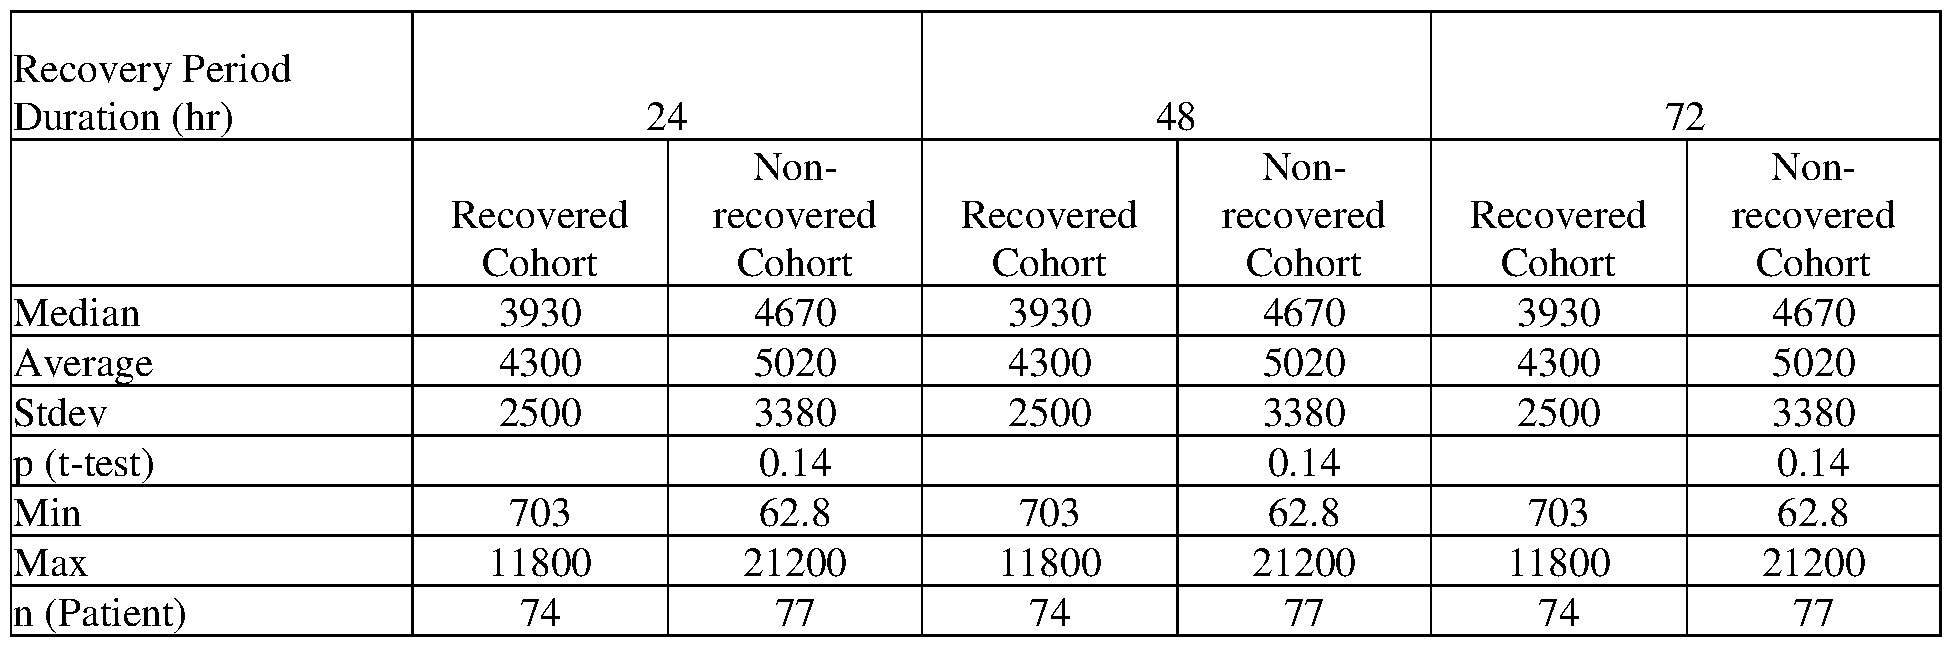
UO only


Cutoff Quartile 2 2740 2740 2740 2740 2740 2740 2740 2740 2740
Sensitivity 77% 75% 73% 76% 75% 72% 77% 75% 74%
Specificity 27% 26% 25% 26% 26% 24% 27% 26% 25%
Cutoff Quartile 3 4230 4230 4260 4230 4230 4260 4230 4230 4260
Sensitivity 60% 58% 62% 59% 58% 62% 60% 58% 63%
Specificity 60% 58% 55% 60% 58% 55% 61 % 58% 57%
Cutoff Quartile 4 6010 6010 6060 6010 6010 6060 6010 6010 6060
Sensitivity 29% 30% 29% 29% 30% 28% 28% 30% 28%
Specificity 79% 80% 76% 79% 80% 76% 79% 80% 76%
OR Quartile 2 1.26 1.05 0.905 1.13 1.05 0.838 1.22 1.05 0.952 p Value 0.54 0.89 0.81 0.74 0.89 0.66 0.60 0.89 0.90
Lower limit of 95% CI 0.602 0.506 0.408 0.543 0.506 0.384 0.582 0.506 0.444 Upper limit of 95% CI 2.63 2.20 2.01 2.36 2.20 1.83 2.54 2.20 2.04
OR Quartile 3 2.30 1.95 2.03 2.18 1.95 2.00 2.44 1.95 2.28 p Value 0.012 0.043 0.052 0.019 0.043 0.055 0.0077 0.043 0.018
Lower limit of 95% CI 1.20 1.02 0.994 1.14 1.02 0.987 1.27 1.02 1.15 Upper limit of 95% CI 4.42 3.73 4.15 4.18 3.73 4.04 4.70 3.73 4.52
OR Quartile 4 1.62 1.68 1.30 1.56 1.68 1.19 1.45 1.68 1.22 p Value 0.21 0.18 0.51 0.24 0.18 0.66 0.33 0.18 0.61
Lower limit of 95% CI 0.765 0.793 0.593 0.739 0.793 0.546 0.688 0.793 0.572 Upper limit of 95% CI 3.42 3.54 2.85 3.30 3.54 2.61 3.07 3.54 2.60
[00326] Table 19.9: Comparison of marker levels and the area under the ROC curve (AUC) in EDTA samples for the "recovered" and "non-recovered" cohorts where recovery starts within 96 hours after sample collection and renal status is assessed by serum creatinine (sCr) only, urine output (UO) only, or serum creatinine or urine output RIFLE criteria.
sCr or UO


Min 703 62.8 703 62.8 703 62.8
Max 11800 21200 11800 21200 11800 21200 n (Patient) 77 74 77 74 77 74
UO only
Recovery Period
Duration (hr) 24 48 72
Non- Non- Non-
Recovered recovered Recovered recovered Recovered recovered Cohort Cohort Cohort Cohort Cohort Cohort
Median 3930 4820 3930 4820 3920 4840
Average 4460 5160 4460 5160 4380 5230
Stdev 2670 3540 2670 3540 2600 3530 p (t-test) 0.18 0.18 0.092
Min 62.8 276 62.8 276 62.8 276
Max 13800 21200 13800 21200 13800 21200 n (Patient) 100 50 100 50 95 55

[00327] Table 19.10: Comparison of marker levels and the area under the ROC curve (AUC) in EDTA samples for the "recovered" and "non-recovered" cohorts where recovery starts within
168 hours after sample collection and renal status is assessed by serum creatinine (sCr) only, urine output (UO) only, or serum creatinine or urine output RIFLE criteria.
sCr or UO


UO only


Cutoff Quartile 2 2740 2740 2740 2740 2740 2740 2740 2740 2740
Sensitivity 74% 78% 75% 73% 78% 75% 73% 78% 74%
Specificity 25% 28% 26% 24% 28% 26% 24% 28% 25%
Cutoff Quartile 3 4230 4230 4260 4230 4230 4260 4230 4230 4260
Sensitivity 56% 58% 60% 56% 58% 60% 56% 58% 59%
Specificity 54% 57% 55% 53% 57% 55% 54% 57% 55%
Cutoff Quartile 4 6010 6010 6060 6010 6010 6060 6010 6010 6060
Sensitivity 24% 28% 25% 24% 28% 25% 23% 28% 24%
Specificity 74% 77% 74% 74% 77% 74% 74% 77% 74%
OR Quartile 2 0.944 1.35 1.03 0.848 1.35 1.03 0.880 1.35 0.952 p Value 0.88 0.43 0.95 0.66 0.43 0.95 0.73 0.43 0.90
Lower limit of 95% CI 0.448 0.643 0.473 0.404 0.643 0.473 0.419 0.643 0.444 Upper limit of 95% CI 1.99 2.84 2.23 1.78 2.84 2.23 1.85 2.84 2.04
OR Quartile 3 1.52 1.85 1.81 1.43 1.85 1.81 1.51 1.85 1.79 p Value 0.21 0.061 0.088 0.28 0.061 0.088 0.21 0.061 0.090
Lower limit of 95% CI 0.790 0.971 0.916 0.748 0.971 0.916 0.789 0.971 0.912 Upper limit of 95% CI 2.91 3.54 3.58 2.74 3.54 3.58 2.89 3.54 3.52
OR Quartile 4 0.916 1.30 0.973 0.883 1.30 0.973 0.852 1.30 0.900 p Value 0.82 0.48 0.95 0.75 0.48 0.95 0.67 0.48 0.79
Lower limit of 95% CI 0.432 0.624 0.449 0.417 0.624 0.449 0.403 0.624 0.416 Upper limit of 95% CI 1.94 2.72 2.11 1.87 2.72 2.11 1.80 2.72 1.95
[00328] Example 20. Use of C-C motif chemokine 15 for evaluating renal status in patients admitted to the ICU: Persistent at RIFLE F
[00329] Patients from the intensive care unit (ICU) with RIFLE stage of injury (I) or failure (F) are enrolled in the following study. EDTA anti-coagulated blood samples (10 mL) and urine samples (50 mL) are collected from each patient at enrollment, and at every 12 hours up to day 3, and then every 24 hours thereafter up to day 7 while the subject is hospitalized. C-C motif chemokine 15 is measured in the enrollment samples by standard immunoassay methods using commercially available assay reagents.
[00330] Kidney status is assessed by RIFLE criteria based on serum creatinine, urine output, or both serum creatinine and urine output. Two cohorts are defined to represent a "persistent" and a "non-persistent" population. "Persistent" indicates those patients whose minimum RIFLE stage during a period of 24, 48 or 72 hours is failure (F) where the persistence period can start from the time of sample collection to 24, 48, 72, 96 or 168 hours after sample collection. "Non- persistent" indicates those patients who are not persistent at failure (F) and whose minimum RIFLE stage during a period of 24, 48 or 72 hours is non-injury (RIFLE 0), risk of injury (R), or injury (I) where the persistence period can start from the time of sample collection to 24, 48, 72, 96 or 168 hours after sample collection. If a patient dies after failure (F) or is placed on renal replacement therapy (RRT) at any time from sample collection to 24, 48, 72, 96 or 168 hours after sample collection, the patient is considered "persistent".
[00331] The ability to distinguish the "persistent" and "non-persistent" cohorts is determined using receiver operating characteristic (ROC) analysis.
[00332] Table 20.1: Comparison of marker levels and the area under the ROC curve (AUC) in urine samples for the "persistent" and "non-persistent" cohorts where persistence starts within 24 hours after sample collection and renal status is assessed by serum creatinine (sCr) only, urine output (UO) only, or serum creatinine or urine output RIFLE criteria.
sCr or UO


UO only


AUC 0.70 0.71 0.58 0.73 0.74 0.60 0.72 0.72 0.61
SE 0.032 0.032 0.050 0.033 0.033 0.052 0.035 0.035 0.052 p Value 3.6E-10 2.6E-11 0.12 4.4E-12 2.8E-13 0.065 1.0E-9 6.9E-10 0.034 nCohort Non- persistent 204 207 274 220 222 277 235 234 278 nCohort Persistent 112 108 40 96 93 37 81 81 36
Cutoff Quartile 2 0.0489 0.0489 0.0489 0.0489 0.0489 0.0489 0.0489 0.0489 0.0489
Sensitivity 88% 90% 82% 90% 91 % 84% 90% 93% 86%
Specificity 29% 30% 24% 29% 30% 24% 28% 29% 24%
Cutoff Quartile 3 155 154 155 155 154 155 155 154 155
Sensitivity 71 % 71 % 68% 75% 75% 70% 77% 74% 72%
Specificity 61 % 61 % 53% 61 % 60% 53% 59% 58% 53%
Cutoff Quartile 4 909 912 902 909 912 902 909 912 902
Sensitivity 42% 44% 32% 46% 48% 35% 46% 47% 36%
Specificity 84% 85% 76% 84% 85% 76% 82% 82% 76%
OR Quartile 2 2.92 3.86 1.50 3.53 4.50 1.65 3.56 5.12 2.01 p Value 9.7E-4 1.3E-4 0.36 5.6E-4 1.6E-4 0.29 0.0015 2.7E-4 0.16
Lower limit of 95%
CI 1.54 1.93 0.632 1.72 2.06 0.659 1.63 2.13 0.751
Upper limit of 95% CI 5.51 7.69 3.54 7.22 9.81 4.12 7.80 12.3 5.37
OR Quartile 3 3.79 3.86 2.30 4.67 4.63 2.63 4.72 3.97 2.92 p Value 1.3E-7 1.3E-7 0.020 1.7E-8 3.0E-8 0.011 1.3E-7 1.5E-6 0.0062
Lower limit of 95%
CI 2.31 2.34 1.14 2.74 2.69 1.25 2.66 2.26 1.36
Upper limit of 95% CI 6.21 6.38 4.65 7.99 7.97 5.54 8.41 6.95 6.28
OR Quartile 4 3.89 4.21 1.52 4.47 5.18 1.73 3.86 4.16 1.82 p Value 5.7E-7 1.4E-7 0.25 5.4E-8 3.6E-9 0.14 1.5E-6 4.0E-7 0.11
Lower limit of 95%
CI 2.28 2.47 0.741 2.61 3.00 0.835 2.23 2.40 0.871
Upper limit of 95% CI 6.62 7.20 3.11 7.68 8.95 3.59 6.70 7.22 3.78
[00333] Table 20.2: Comparison of marker levels and the area under the ROC curve (AUC) in urine samples for the "persistent" and "non-persistent" cohorts where persistence starts within 48 hours after sample collection and renal status is assessed by serum creatinine (sCr) only, urine output (UO) only, or serum creatinine or urine output RIFLE criteria.
sCr or UO

Median 60.0 577 59.2 717 65.2 616
Average 1140 2610 1090 2900 1460 2300
Stdev 5190 5840 5020 6140 6090 3820 p (t-test) 0.021 0.0050 0.21
Min 0.0116 0.0116 0.0116 0.0116 0.0116 0.0116
Max 53500 52500 53500 52500 53500 19200 n (Patient) 191 124 205 110 217 98
UO only
Persistence Period
Duration (hr) 24 48 72
Non-persistent Persistent Non-persistent Persistent Non-persistent Persistent Cohort Cohort Cohort Cohort Cohort Cohort
Median 118 406 118 488 118 521
Average 1790 1450 1760 1530 1760 1560
Stdev 5950 2870 5910 2960 5900 2980 p (t-test) 0.67 0.78 0.81
Min 0.0116 0.0116 0.0116 0.0116 0.0116 0.0116
Max 53500 18400 53500 18400 53500 18400 n (Patient) 255 59 259 55 260 54

Upper limit of 95% CI 6.59 7.54 2.61 7.56 8.71 2.97 5.80 6.22 3.08
[00334] Table 20.3: Comparison of marker levels and the area under the ROC curve (AUC) in urine samples for the "persistent" and "non-persistent" cohorts where persistence starts within 72 hours after sample collection and renal status is assessed by serum creatinine (sCr) only, urine output (UO) only, or serum creatinine or urine output RIFLE criteria.
sCr or UO


UO only


SE 0.029 0.029 0.040 0.029 0.030 0.041 0.031 0.032 0.041 p Value 3.3E-13 4.0E-14 0.018 4.4E-16 2.2E-16 0.0070 1.2E-11 l . lE-11 0.0070 nCohort Non- persistent 174 181 245 189 194 250 204 207 250 nCohort Persistent 142 134 69 127 121 64 112 108 64
Cutoff Quartile 2 0.0489 0.0489 0.0489 0.0489 0.0489 0.0489 0.0489 0.0489 0.0489
Sensitivity 87% 89% 84% 89% 91 % 86% 88% 91 % 86%
Specificity 32% 33% 25% 32% 32% 26% 30% 31 % 26%
Cutoff Quartile 3 155 154 155 155 154 155 155 154 155
Sensitivity 70% 70% 65% 72% 73% 67% 72% 71 % 67%
Specificity 66% 65% 54% 65% 64% 54% 62% 61 % 54%
Cutoff Quartile 4 909 912 902 909 912 902 909 912 902
Sensitivity 40% 43% 30% 44% 46% 33% 42% 44% 33%
Specificity 87% 88% 76% 88% 88% 77% 84% 85% 77%
OR Quartile 2 2.99 3.84 1.79 3.75 4.81 2.10 3.25 4.39 2.10 p Value 2.1E-4 2.2E-5 0.11 4.3E-5 7.9E-6 0.055 3.9E-4 5.0E-5 0.055
Lower limit of 95%
CI 1.68 2.06 0.882 1.99 2.42 0.984 1.69 2.15 0.984
Upper limit of 95% CI 5.34 7.14 3.62 7.08 9.58 4.50 6.23 8.96 4.50
OR Quartile 3 4.49 4.30 2.23 4.90 4.72 2.44 4.31 3.86 2.44 p Value 6.4E-10 2.5E-9 0.0047 2.2E-10 8.4E-10 0.0025 1.1E-8 1.3E-7 0.0025
Lower limit of 95%
CI 2.79 2.66 1.28 3.00 2.88 1.37 2.61 2.34 1.37
Upper limit of 95% CI 7.22 6.94 3.88 8.00 7.76 4.35 7.12 6.38 4.35
OR Quartile 4 4.63 5.35 1.41 5.69 6.41 1.62 3.89 4.21 1.62 p Value 7.6E-8 5.0E-9 0.25 1.1E-9 l .OE-10 0.12 5.7E-7 1.4E-7 0.12
Lower limit of 95%
CI 2.65 3.05 0.781 3.25 3.65 0.888 2.28 2.47 0.888
Upper limit of 95% CI 8.10 9.39 2.55 9.96 11.2 2.94 6.62 7.20 2.94
[00335] Table 20.4: Comparison of marker levels and the area under the ROC curve (AUC) in urine samples for the "persistent" and "non-persistent" cohorts where persistence starts within 96 hours after sample collection and renal status is assessed by serum creatinine (sCr) only, urine output (UO) only, or serum creatinine or urine output RIFLE criteria.
sCr or UO

Persistence Period
Duration (hr) 24 48 72
Non-persistent Persistent Non-persistent Persistent Non-persistent Persistent
Cohort Cohort Cohort Cohort Cohort Cohort
Median 56.1 585 55.3 701 61.1 616
Average 1080 2560 1030 2790 1150 2740
Stdev 5270 5680 5110 5900 5060 6090 p (t-test) 0.017 0.0053 0.014
Min 0.0116 0.0116 0.0116 0.0116 0.0116 0.0116
Max 53500 52500 53500 52500 53500 52500 n (Patient) 179 136 191 124 203 112
UO only
Persistence Period
Duration (hr) 24 48 72
Non-persistent Persistent Non-persistent Persistent Non-persistent Persistent Cohort Cohort Cohort Cohort Cohort Cohort
Median 116 351 116 380 116 380
Average 1750 1650 1710 1760 1710 1760
Stdev 6010 3470 5940 3590 5940 3590 p (t-test) 0.90 0.95 0.95
Min 0.0116 0.0116 0.0116 0.0116 0.0116 0.0116
Max 53500 19200 53500 19200 53500 19200 n (Patient) 238 76 244 70 244 70

[00336] Table 20.5: Comparison of marker levels and the area under the ROC curve (AUC) in urine samples for the "persistent" and "non-persistent" cohorts where persistence starts within 168 hours after sample collection and renal status is assessed by serum creatinine (sCr) only, urine output (UO) only, or serum creatinine or urine output RIFLE criteria.
sCr or UO


UO only


SE 0.029 0.029 0.037 0.029 0.029 0.038 0.031 0.031 0.038 p Value 3.4E-14 1.0E-13 0.0019 0 2.2E-16 0.0012 2.3E-12 3.5E-12 0.0012 nCohort Non- persistent 168 175 233 183 187 236 196 199 236 nCohort Persistent 148 140 81 133 128 78 120 116 78
Cutoff Quartile 2 0.0489 0.0489 0.0489 0.0489 0.0489 0.0489 0.0489 0.0489 0.0489
Sensitivity 86% 87% 85% 89% 89% 86% 89% 89% 86%
Specificity 32% 32% 26% 33% 32% 26% 31 % 31 % 26%
Cutoff Quartile 3 155 154 155 155 154 155 155 154 155
Sensitivity 69% 69% 68% 72% 71 % 69% 71 % 70% 69%
Specificity 67% 65% 56% 66% 64% 56% 63% 61 % 56%
Cutoff Quartile 4 909 912 902 909 912 902 909 912 902
Sensitivity 41 % 42% 32% 44% 45% 33% 42% 43% 33%
Specificity 89% 89% 77% 89% 89% 78% 85% 85% 78%
OR Quartile 2 3.03 3.19 2.04 4.15 3.85 2.17 3.72 3.50 2.17 p Value 1.4E-4 1.1E-4 0.040 1.1E-5 3.1E-5 0.030 7.5E-5 1.6E-4 0.030
Lower limit of 95%
CI 1.71 1.77 1.03 2.20 2.04 1.08 1.94 1.83 1.08
Upper limit of 95% CI 5.37 5.74 4.02 7.82 7.25 4.37 7.13 6.71 4.37
OR Quartile 3 4.43 3.98 2.72 5.06 4.41 2.91 4.09 3.67 2.91 p Value 6.9E-10 1.0E-8 2.4E-4 6.9E-11 2.1E-9 1.3E-4 1.6E-8 1.8E-7 1.3E-4
Lower limit of 95%
CI 2.76 2.48 1.59 3.11 2.71 1.68 2.51 2.25 1.68
Upper limit of 95% CI 7.12 6.38 4.63 8.24 7.16 5.01 6.67 5.98 5.01
OR Quartile 4 5.35 5.65 1.61 6.50 6.55 1.73 4.11 4.44 1.73 p Value 1.4E-8 3.4E-9 0.096 2.0E-10 1.2E-10 0.057 2.3E-7 5.8E-8 0.057
Lower limit of 95%
CI 3.00 3.18 0.919 3.65 3.70 0.985 2.41 2.59 0.985
Upper limit of 95% CI 9.54 10.0 2.81 11.6 11.6 3.03 7.03 7.61 3.03
[00337] Table 20.6: Comparison of marker levels and the area under the ROC curve (AUC) in EDTA samples for the "persistent" and "non-persistent" cohorts where persistence starts within 24 hours after sample collection and renal status is assessed by serum creatinine (sCr) only, urine output (UO) only, or serum creatinine or urine output RIFLE criteria.
sCr or UO

Persistence Period
Duration (hr) 24 48 72
Non-persistent Persistent Non-persistent Persistent Non-persistent Persistent
Cohort Cohort Cohort Cohort Cohort Cohort
Median 4150 4490 4120 4500 4230 4300
Average 4520 4930 4480 5090 4660 4720
Stdev 2700 3470 2660 3650 2780 3560 p (t-test) 0.42 0.26 0.91
Min 276 62.8 276 62.8 276 62.8
Max 11800 21200 11800 21200 13800 21200 n (Patient) 94 56 103 47 108 42
UO only
Persistence Period
Duration (hr) 24 48 72
Non-persistent Persistent Non-persistent Persistent Non-persistent Persistent Cohort Cohort Cohort Cohort Cohort Cohort
Median 4170 4800 4170 4800 4150 4880
Average 4560 5570 4560 5570 4540 5820
Stdev 2670 4660 2670 4660 2680 4660 p (t-test) 0.17 0.17 0.089
Min 62.8 1120 62.8 1120 62.8 1630
Max 13800 21200 13800 21200 13800 21200 n (Patient) 131 19 131 19 132 18

sCr or UO


UO only


Cutoff Quartile 2 2740 2730 2740 2740 2730 2740 2740 2730 2740
Sensitivity 76% 74% 70% 79% 77% 70% 78% 75% 73%
Specificity 26% 25% 24% 28% 27% 24% 27% 25% 25%
Cutoff Quartile 3 4230 4260 4260 4230 4260 4260 4230 4260 4260
Sensitivity 57% 55% 59% 58% 56% 59% 54% 51 % 62%
Specificity 55% 53% 52% 54% 54% 52% 51 % 51 % 52%
Cutoff Quartile 4 6010 6060 6060 6010 6060 6060 6010 6060 6060
Sensitivity 27% 27% 22% 26% 28% 22% 20% 22% 23%
Specificity 76% 76% 74% 76% 76% 74% 72% 73% 74%
OR Quartile 2 1.13 0.958 0.766 1.43 1.24 0.766 1.29 0.988 0.905 p Value 0.75 0.91 0.57 0.37 0.58 0.57 0.53 0.97 0.84
Lower limit of 95% CI 0.535 0.455 0.304 0.657 0.576 0.304 0.581 0.455 0.347 Upper limit of 95% CI 2.40 2.02 1.93 3.13 2.69 1.93 2.88 2.15 2.36
OR Quartile 3 1.60 1.39 1.58 1.63 1.49 1.58 1.25 1.06 1.76 p Value 0.16 0.32 0.29 0.15 0.24 0.29 0.53 0.86 0.20
Lower limit of 95% CI 0.834 0.725 0.678 0.839 0.767 0.678 0.632 0.540 0.742 Upper limit of 95% CI 3.07 2.67 3.67 3.17 2.89 3.67 2.46 2.09 4.19
OR Quartile 4 1.18 1.21 0.812 1.10 1.26 0.812 0.652 0.733 0.862 p Value 0.66 0.62 0.68 0.80 0.55 0.68 0.31 0.45 0.77
Lower limit of 95% CI 0.562 0.574 0.301 0.519 0.595 0.301 0.287 0.329 0.318 Upper limit of 95% CI 2.47 2.53 2.19 2.34 2.67 2.19 1.48 1.63 2.34
[00339] Table 20.8: Comparison of marker levels and the area under the ROC curve (AUC) in EDTA samples for the "persistent" and "non-persistent" cohorts where persistence starts within 72 hours after sample collection and renal status is assessed by serum creatinine (sCr) only, urine output (UO) only, or serum creatinine or urine output RIFLE criteria.
sCr or UO


UO only
Persistence Period
Duration (hr) 24 48 72
Non-persistent Persistent Non-persistent Persistent Non-persistent Persistent Cohort Cohort Cohort Cohort Cohort Cohort
Median 4060 4780 4060 4780 4050 4790
Average 4550 5150 4550 5150 4520 5270
Stdev 2750 3690 2750 3690 2750 3680 p (t-test) 0.30 0.30 0.20
Min 62.8 513 62.8 513 62.8 513
Max 13800 21200 13800 21200 13800 21200 n (Patient) 115 35 115 35 116 34

[00340] Table 20.9: Comparison of marker levels and the area under the ROC curve (AUC) in EDTA samples for the "persistent" and "non-persistent" cohorts where persistence starts within 96 hours after sample collection and renal status is assessed by serum creatinine (sCr) only, urine output (UO) only, or serum creatinine or urine output RIFLE criteria.
sCr or UO
 sCr only

UO only

 Sensitivity 60% 58% 63% 59% 58% 62% 57% 55% 64% Specificity 58% 57% 55% 56% 56% 55% 54% 53% 55%
Cutoff Quartile 4 6010 6060 6060 6010 6060 6060 6010 6060 6060
Sensitivity 27% 28% 24% 27% 27% 25% 25% 25% 26%
Specificity 77% 77% 74% 76% 76% 75% 75% 74% 75%
OR Quartile 2 1.45 1.24 1.07 1.46 1.28 1.02 1.37 1.19 1.18 p Value 0.33 0.58 0.87 0.33 0.52 0.95 0.42 0.65 0.71
Lower limit of 95% CI 0.688 0.587 0.466 0.686 0.606 0.445 0.636 0.559 0.500 Upper limit of 95% CI 3.07 2.60 2.46 3.11 2.71 2.36 2.95 2.55 2.78
OR Quartile 3 2.07 1.81 2.12 1.87 1.72 2.00 1.53 1.40 2.18 p Value 0.028 0.073 0.046 0.059 0.10 0.067 0.21 0.32 0.043
Lower limit of 95% CI 1.08 0.947 1.01 0.977 0.899 0.952 0.792 0.725 1.03 Upper limit of 95% CI 3.97 3.47 4.44 3.60 3.31 4.20 2.94 2.69 4.63
OR Quartile 4 1.22 1.24 0.933 1.22 1.20 0.976 0.986 0.971 1.02 p Value 0.60 0.57 0.87 0.60 0.63 0.95 0.97 0.94 0.96
Lower limit of 95% CI 0.582 0.593 0.406 0.583 0.573 0.424 0.465 0.458 0.443 Upper limit of 95% CI 2.54 2.59 2.14 2.55 2.51 2.25 2.09 2.06 2.36
[00341] Table 20.10: Comparison of marker levels and the area under the ROC curve (AUC) in EDTA samples for the "persistent" and "non-persistent" cohorts where persistence starts within 168 hours after sample collection and renal status is assessed by serum creatinine (sCr) only, urine output (UO) only, or serum creatinine or urine output RIFLE criteria.
sCr or UO


Median 3930 4790 3930 4790 3930 4800
Average 4500 5170 4500 5170 4470 5270
Stdev 2780 3480 2780 3480 2780 3460 p (t-test) 0.22 0.22 0.15
Min 62.8 513 62.8 513 62.8 513
Max 13800 21200 13800 21200 13800 21200 n (Patient) 108 42 108 42 109 41

[00342] Example 21. Use of C-C motif chemokine 15 for evaluating renal status in patients admitted to the ICU: Persistent at RIFLE I or F
[00343] Patients from the intensive care unit (ICU) with RIFLE stage of injury (I) or failure (F) are enrolled in the following study. EDTA anti-coagulated blood samples (10 mL) and urine samples (50 mL) are collected from each patient at enrollment, and at every 12 hours up to day 3, and then every 24 hours thereafter up to day 7 while the subject is hospitalized. C-C motif chemokine 15 is measured in the enrollment samples by standard immunoassay methods using commercially available assay reagents.
[00344] Kidney status is assessed by RIFLE criteria based on serum creatinine, urine output, or both serum creatinine and urine output. Two cohorts are defined to represent a "persistent" and a "non-persistent" population. "Persistent" indicates those patients whose minimum RIFLE stage during a period of 24, 48 or 72 hours is injury (I) or failure (F) where the persistence period can start from the time of sample collection to 24, 48, 72, 96 or 168 hours after sample collection. "Non-persistent" indicates those patients who are not persistent at injury (I) or failure (F) and whose minimum RIFLE stage during a period of 24, 48 or 72 hours is non-injury (RIFLE 0) or risk of injury (R) where the persistence period can start from the time of sample collection to 24, 48, 72, 96 or 168 hours after sample collection. If a patient dies after injury (I) or failure (F) or is placed on renal replacement therapy (RRT) at any time from sample collection to 24, 48, 72, 96 or 168 hours after sample collection, the patient is considered "persistent".
[00345] The ability to distinguish the "persistent" and "non-persistent" cohorts is determined using receiver operating characteristic (ROC) analysis.
[00346] Table 21.1: Comparison of marker levels and the area under the ROC curve (AUC) in urine samples for the "persistent" and "non-persistent" cohorts where persistence starts within 24 hours after sample collection and renal status is assessed by serum creatinine (sCr) only, urine output (UO) only, or serum creatinine or urine output RIFLE criteria.
sCr or UO


UO only
Persistence Period
Duration (hr) 24 48 72
Non-persistent Persistent Non-persistent Persistent Non-persistent Persistent Cohort Cohort Cohort Cohort Cohort Cohort
Median 108 420 127 434 127 585
Average 1750 1620 1740 1630 1710 1780
Stdev 6070 2990 5930 3050 5860 3210 p (t-test) 0.86 0.88 0.94
Min 0.0116 0.0116 0.0116 0.0116 0.0116 0.0116
Max 53500 18400 53500 18400 53500 18400 n (Patient) 240 74 255 59 262 52

[00347] Table 21.2: Comparison of marker levels and the area under the ROC curve (AUC) in urine samples for the "persistent" and "non-persistent" cohorts where persistence starts within
48 hours after sample collection and renal status is assessed by serum creatinine (sCr) only, urine output (UO) only, or serum creatinine or urine output RIFLE criteria.
sCr or UO


UO only


Sensitivity 84% 86% 84% 84% 86% 82% 85% 86% 83%
Specificity 38% 38% 26% 32% 33% 25% 31 % 32% 25%
Cutoff Quartile 3 155 154 155 155 154 155 155 154 155
Sensitivity 64% 65% 63% 64% 65% 65% 68% 69% 67%
Specificity 76% 73% 56% 66% 65% 55% 66% 66% 55%
Cutoff Quartile 4 909 912 902 909 912 902 909 912 902
Sensitivity 35% 36% 31 % 36% 38% 31 % 39% 40% 33%
Specificity 93% 92% 77% 88% 88% 77% 88% 88% 77%
OR Quartile 2 3.29 3.64 1.85 2.51 3.02 1.49 2.53 3.01 1.61 p Value 1.4E-5 3.4E-6 0.055 7.9E-4 9.3E-5 0.23 0.0010 1.6E-4 0.17
Lower limit of 95%
CI 1.92 2.11 0.987 1.47 1.74 0.779 1.46 1.70 0.811
Upper limit of 95% CI 5.64 6.27 3.47 4.31 5.26 2.86 4.40 5.33 3.20
OR Quartile 3 5.51 5.03 2.18 3.54 3.48 2.25 4.17 4.28 2.49 p Value 1.2E-10 1.5E-10 0.0022 1.0E-7 1.4E-7 0.0029 2.6E-9 1.7E-9 0.0014
Lower limit of 95%
CI 3.28 3.07 1.32 2.22 2.19 1.32 2.60 2.66 1.42
Upper limit of 95% CI 9.25 8.24 3.59 5.63 5.53 3.84 6.66 6.86 4.35
OR Quartile 4 6.82 6.56 1.55 4.36 4.53 1.50 4.57 4.96 1.64 p Value 1.2E-6 2.1E-7 0.11 1.2E-6 4.3E-7 0.16 1.8E-7 4.0E-8 0.094
Lower limit of 95%
CI 3.14 3.22 0.903 2.40 2.52 0.848 2.58 2.80 0.919
Upper limit of 95% CI 14.8 13.3 2.66 7.89 8.14 2.65 8.08 8.79 2.94
[00348] Table 21.3: Comparison of marker levels and the area under the ROC curve (AUC) in urine samples for the "persistent" and "non-persistent" cohorts where persistence starts within 72 hours after sample collection and renal status is assessed by serum creatinine (sCr) only, urine output (UO) only, or serum creatinine or urine output RIFLE criteria.
sCr or UO


UO only
Persistence Period
Duration (hr) 24 48 72
Non-persistent Persistent Non-persistent Persistent Non-persistent Persistent Cohort Cohort Cohort Cohort Cohort Cohort
Median 91.3 347 116 351 118 406
Average 1810 1540 1780 1570 1740 1660
Stdev 6340 3150 6180 3250 6100 3360 p (t-test) 0.67 0.76 0.91
Min 0.0116 0.0116 0.0116 0.0116 0.0116 0.0116
Max 53500 19200 53500 19200 53500 19200 n (Patient) 211 103 224 90 231 83

[00349] Table 21.4: Comparison of marker levels and the area under the ROC curve (AUC) in urine samples for the "persistent" and "non-persistent" cohorts where persistence starts within
96 hours after sample collection and renal status is assessed by serum creatinine (sCr) only, urine output (UO) only, or serum creatinine or urine output RIFLE criteria.
sCr or UO


UO only


Sensitivity 84% 85% 83% 83% 85% 81 % 84% 86% 82%
Specificity 38% 37% 27% 32% 33% 25% 32% 32% 25%
Cutoff Quartile 3 155 154 155 155 154 155 155 154 155
Sensitivity 64% 65% 60% 63% 64% 60% 66% 66% 62%
Specificity 76% 72% 55% 66% 65% 54% 66% 65% 55%
Cutoff Quartile 4 909 912 902 909 912 902 909 912 902
Sensitivity 34% 36% 30% 36% 37% 29% 37% 38% 30%
Specificity 93% 92% 77% 88% 88% 77% 88% 88% 77%
OR Quartile 2 3.18 3.24 1.79 2.32 2.76 1.43 2.51 2.86 1.55 p Value 2.5E-5 1.9E-5 0.055 0.0020 2.6E-4 0.24 9.0E-4 2.3E-4 0.17
Lower limit of 95%
CI 1.86 1.89 0.989 1.36 1.60 0.790 1.46 1.64 0.834
Upper limit of 95% CI 5.44 5.56 3.24 3.95 4.77 2.61 4.34 5.01 2.87
OR Quartile 3 5.62 4.77 1.82 3.37 3.30 1.78 3.82 3.68 1.95 p Value l . lE-10 5.4E-10 0.013 3.1E-7 4.3E-7 0.020 1.8E-8 4.2E-8 0.0090
Lower limit of 95%
CI 3.33 2.91 1.14 2.12 2.08 1.09 2.40 2.31 1.18
Upper limit of 95% CI 9.49 7.82 2.93 5.36 5.23 2.91 6.08 5.86 3.22
OR Quartile 4 6.59 6.34 1.45 4.07 4.23 1.38 4.25 4.38 1.45 p Value 1.9E-6 3.5E-7 0.16 3.6E-6 1.4E-6 0.25 8.7E-7 3.8E-7 0.18
Lower limit of 95%
CI 3.04 3.11 0.858 2.25 2.36 0.801 2.39 2.48 0.838
Upper limit of 95% CI 14.3 12.9 2.46 7.37 7.59 2.36 7.57 7.74 2.51
[00350] Table 21.5: Comparison of marker levels and the area under the ROC curve (AUC) in urine samples for the "persistent" and "non-persistent" cohorts where persistence starts within 168 hours after sample collection and renal status is assessed by serum creatinine (sCr) only, urine output (UO) only, or serum creatinine or urine output RIFLE criteria.
sCr or UO


UO only
Persistence Period
Duration (hr) 24 48 72
Non-persistent Persistent Non-persistent Persistent Non-persistent Persistent Cohort Cohort Cohort Cohort Cohort Cohort
Median 81.4 347 88.0 341 97.4 344
Average 1830 1530 1820 1530 1790 1570
Stdev 6480 3070 6350 3120 6280 3180 p (t-test) 0.65 0.66 0.74
Min 0.0116 0.0116 0.0116 0.0116 0.0116 0.0116
Max 53500 19200 53500 19200 53500 19200 n (Patient) 201 113 211 103 216 98

[00351] Table 21.6: Comparison of marker levels and the area under the ROC curve (AUC) in EDTA samples for the "persistent" and "non-persistent" cohorts where persistence starts within
24 hours after sample collection and renal status is assessed by serum creatinine (sCr) only, urine output (UO) only, or serum creatinine or urine output RIFLE criteria.
sCr or UO


UO only


Sensitivity 79% 78% 76% 75% 73% 80% 76% 77% 80%
Specificity 34% 31 % 26% 25% 23% 27% 26% 27% 26%
Cutoff Quartile 3 4230 4260 4260 4230 4260 4260 4230 4260 4260
Sensitivity 58% 57% 58% 57% 56% 67% 56% 58% 64%
Specificity 66% 63% 53% 56% 56% 54% 54% 56% 53%
Cutoff Quartile 4 6010 6060 6060 6010 6060 6060 6010 6060 6060
Sensitivity 32% 33% 24% 29% 30% 30% 29% 31 % 28%
Specificity 88% 88% 74% 79% 79% 76% 78% 79% 75%
OR Quartile 2 1.96 1.54 1.13 1.02 0.810 1.45 1.09 1.19 1.43 p Value 0.081 0.27 0.79 0.96 0.58 0.45 0.82 0.65 0.50
Lower limit of 95% CI 0.920 0.721 0.477 0.488 0.387 0.545 0.519 0.563 0.498 Upper limit of 95% CI 4.18 3.27 2.66 2.12 1.70 3.88 2.29 2.52 4.13
OR Quartile 3 2.73 2.32 1.53 1.66 1.62 2.36 1.50 1.73 1.99 p Value 0.0054 0.017 0.26 0.12 0.14 0.045 0.22 0.100 0.13
Lower limit of 95% CI 1.35 1.16 0.728 0.872 0.850 1.02 0.788 0.900 0.818 Upper limit of 95% CI 5.53 4.63 3.22 3.16 3.09 5.47 2.87 3.33 4.84
OR Quartile 4 3.40 3.72 0.888 1.50 1.65 1.34 1.40 1.72 1.18 p Value 0.012 0.0067 0.79 0.28 0.19 0.51 0.37 0.15 0.74
Lower limit of 95% CI 1.31 1.44 0.376 0.715 0.779 0.555 0.671 0.818 0.450 Upper limit of 95% CI 8.80 9.61 2.10 3.16 3.48 3.26 2.94 3.60 3.09
[00352] Table 21.7: Comparison of marker levels and the area under the ROC curve (AUC) in EDTA samples for the "persistent" and "non-persistent" cohorts where persistence starts within 48 hours after sample collection and renal status is assessed by serum creatinine (sCr) only, urine output (UO) only, or serum creatinine or urine output RIFLE criteria.
sCr or UO


[00353] Table 21.8: Comparison of marker levels and the area under the ROC curve (AUC) in EDTA samples for the "persistent" and "non-persistent" cohorts where persistence starts within 72 hours after sample collection and renal status is assessed by serum creatinine (sCr) only, urine output (UO) only, or serum creatinine or urine output RIFLE criteria.
 Non-persistent Persistent Non-persistent Persistent Non-persistent Persistent Cohort Cohort Cohort Cohort Cohort Cohort
Median 3620 4600 3930 4580 3920 4690
Average 3690 5130 4300 4980 4240 5090
Stdev 2220 3210 2550 3310 2530 3360 p (t-test) 0.0053 0.17 0.081
Min 62.8 276 62.8 276 62.8 276
Max 10700 21200 11800 21200 11800 21200 n (Patient) 49 102 69 82 75 76 sCr only
Persistence Period
Duration (hr) 24 48 72
Non-persistent Persistent Non-persistent Persistent Non-persistent Persistent Cohort Cohort Cohort Cohort Cohort Cohort
Median 3730 4670 3940 4500 3930 4670
Average 3820 5120 4370 4930 4300 5040
Stdev 2120 3300 2500 3370 2490 3430 p (t-test) 0.012 0.25 0.13
Min 703 62.8 703 62.8 703 62.8
Max 10700 21200 11800 21200 11800 21200 n (Patient) 51 99 69 81 75 75
UO only


OR Quartile 2 1.76 1.38 1.20 0.950 0.810 1.53 1.17 1.00 1.50 p Value 0.14 0.41 0.64 0.89 0.58 0.33 0.67 1.0 0.37
Lower limit of 95% CI 0.824 0.643 0.549 0.454 0.385 0.655 0.561 0.479 0.621 Upper limit of 95% CI 3.77 2.95 2.64 1.99 1.70 3.56 2.45 2.09 3.62
OR Quartile 3 2.58 2.19 2.05 1.85 1.62 3.07 2.06 1.81 2.68 p Value 0.0086 0.026 0.041 0.062 0.14 0.0030 0.029 0.073 0.011
Lower limit of 95% CI 1.27 1.10 1.03 0.969 0.851 1.46 1.08 0.945 1.25 Upper limit of 95% CI 5.24 4.39 4.07 3.54 3.10 6.44 3.94 3.45 5.74
OR Quartile 4 3.28 3.58 1.32 1.63 1.65 1.78 1.74 1.77 1.64 p Value 0.014 0.0085 0.47 0.21 0.19 0.14 0.15 0.14 0.23
Lower limit of 95% CI 1.27 1.38 0.618 0.764 0.777 0.823 0.822 0.837 0.737 Upper limit of 95% CI 8.48 9.26 2.83 3.46 3.52 3.86 3.67 3.74 3.64
[00354] Table 21.9: Comparison of marker levels and the area under the ROC curve (AUC) in EDTA samples for the "persistent" and "non-persistent" cohorts where persistence starts within 96 hours after sample collection and renal status is assessed by serum creatinine (sCr) only, urine output (UO) only, or serum creatinine or urine output RIFLE criteria.
sCr or UO


UO only

Min 62.8 513 62.8 513 62.8 513
Max 13800 21200 13800 21200 13800 21200 n (Patient) 95 55 100 50 105 45

[00355] Table 21.10: Comparison of marker levels and the area under the ROC curve (AUC) in EDTA samples for the "persistent" and "non-persistent" cohorts where persistence starts within 168 hours after sample collection and renal status is assessed by serum creatinine (sCr) only, urine output (UO) only, or serum creatinine or urine output RIFLE criteria.
sCr or UO

Persistence Period
Duration (hr) 24 48 72
Non-persistent Persistent Non-persistent Persistent Non-persistent Persistent Cohort Cohort Cohort Cohort Cohort Cohort
Median 3700 4680 3930 4580 3930 4690
Average 3790 5120 4360 4920 4290 5030
Stdev 2130 3280 2540 3320 2520 3370 p (t-test) 0.010 0.26 0.14
Min 703 62.8 703 62.8 703 62.8
Max 10700 21200 11800 21200 11800 21200 n (Patient) 50 100 66 84 72 78
UO only


OR Quartile 4 3.04 3.45 1.05 1.41 1.49 1.17 1.45 1.59 1.01 p Value 0.022 0.011 0.91 0.37 0.31 0.68 0.33 0.23 0.97
Lower limit of 95% CI 1.17 1.33 0.492 0.662 0.697 0.551 0.688 0.752 0.466 Upper limit of 95% CI 7.87 8.93 2.22 3.00 3.17 2.50 3.07 3.36 2.20
[00356] Example 22. Use of C-C motif chemokine 18 for evaluating renal status in patients admitted to the ICU: Recovery to RIFLE 0 from RIFLE I and F
[00357] Patients from the intensive care unit (ICU) with RIFLE stage of injury (I) or failure (F) are enrolled in the following study. EDTA anti-coagulated blood samples (10 mL) and urine samples (50 mL) are collected from each patient at enrollment, and at every 12 hours up to day 3, and then every 24 hours thereafter up to day 7 while the subject is hospitalized. C-C motif chemokine 18 is measured in the enrollment samples by standard immunoassay methods using commercially available assay reagents.
[00358] Kidney status is assessed by RIFLE criteria based on serum creatinine, urine output, or both serum creatinine and urine output. Two cohorts are defined to represent a "recovered" and a "non-recovered" population. "Recovered" indicates those patients whose maximum RIFLE stage during a period of 24, 48 or 72 hours is non-injury (RIFLE 0) where the recovery period can start from the time of sample collection to 24, 48, 72, 96 or 168 hours after sample collection. "Non-recovered" indicates those patients whose maximum RIFLE stage during a period of 24, 48 or 72 hours is risk of injury (R), injury (I) or failure (F) where the recovery period can start from the time of sample collection to 24, 48, 72, 96 or 168 hours after sample collection. If a patient dies or is placed on renal replacement therapy (RRT) at any time from sample collection to 24, 48, 72, 96 or 168 hours after sample collection, the patient is considered "non-recovered".
[00359] The ability to distinguish the "recovered" and "non-recovered" cohorts is determined using receiver operating characteristic (ROC) analysis.
[00360] Table 22.1: Comparison of marker levels and the area under the ROC curve (AUC) in urine samples for the "recovered" and "non-recovered" cohorts where recovery starts within 24 hours after sample collection and renal status is assessed by serum creatinine (sCr) only, urine output (UO) only, or serum creatinine or urine output RIFLE criteria.
sCr or UO

Average 0.858 2.90 0.745 2.86 0.739 2.83
Stdev 0.658 9.70 0.561 9.57 0.588 9.49 p (t-test) 0.32 0.33 0.35
Min 0.0264 0.00242 0.0264 0.00242 0.0264 0.00242
Max 2.61 60.0 2.01 60.0 2.01 60.0 n (Patient) 23 109 20 112 18 114 sCr only
Recovery Period
Duration (hr) 24 48 72
Non- Non- Non-
Recovered recovered Recovered recovered Recovered recovered Cohort Cohort Cohort Cohort Cohort Cohort
Median 0.797 1.27 0.819 1.26 0.797 1.24
Average 0.783 3.07 0.794 3.04 0.786 3.02
Stdev 0.513 10.1 0.519 10.0 0.527 9.96 p (t-test) 0.22 0.23 0.24
Min 0.0264 0.00242 0.0264 0.00242 0.0264 0.00242
Max 2.01 60.0 2.01 60.0 2.01 60.0 n (Patient) 30 101 29 102 28 103
UO only


OR Quartile 2 1.79 2.08 4.38 2.32 1.81 5.83 2.85 1.93 4.95 p Value 0.24 0.10 0.0050 0.099 0.20 8.0E-4 0.046 0.15 7.0E-4
Lower limit of 95% CI 0.681 0.862 1.56 0.854 0.738 2.08 1.02 0.784 1.96 Upper limit of 95% CI 4.71 5.01 12.3 6.30 4.43 16.4 7.98 4.76 12.5
OR Quartile 3 2.70 3.02 2.88 3.59 2.81 3.83 2.99 2.62 3.21 p Value 0.044 0.013 0.0052 0.020 0.021 3.6E-4 0.050 0.033 0.0014
Lower limit of 95% CI 1.03 1.26 1.37 1.22 1.17 1.83 1.00 1.08 1.57 Upper limit of 95% CI 7.08 7.25 6.06 10.5 6.78 8.01 8.95 6.33 6.55
OR Quartile 4 2.53 6.20 1.64 3.44 5.89 2.77 2.99 5.60 2.78 p Value 0.16 0.017 0.23 0.11 0.020 0.014 0.16 0.024 0.015
Lower limit of 95% CI 0.701 1.39 0.735 0.755 1.32 1.23 0.649 1.25 1.22 Upper limit of 95% CI 9.14 27.7 3.66 15.7 26.3 6.23 13.8 25.1 6.36
[00361] Table 22.2: Comparison of marker levels and the area under the ROC curve (AUC) in urine samples for the "recovered" and "non-recovered" cohorts where recovery starts within 48 hours after sample collection and renal status is assessed by serum creatinine (sCr) only, urine output (UO) only, or serum creatinine or urine output RIFLE criteria.
sCr or UO


UO only
 Cohort Cohort Cohort
Median 0.978 1.39 0.974 1.42 0.983 1.36
Average 1.08 5.69 1.06 5.25 1.04 4.66
Stdev 0.846 15.3 0.838 14.5 0.843 13.4 p (t-test) 0.0051 0.0091 0.020
Min 0.00242 0.273 0.00242 0.273 0.00242 0.273
Max 4.23 60.0 4.23 60.0 4.23 60.0 n (Patient) 89 42 84 47 76 55

[00362] Table 22.3: Comparison of marker levels and the area under the ROC curve (AUC) in urine samples for the "recovered" and "non-recovered" cohorts where recovery starts within 72 hours after sample collection and renal status is assessed by serum creatinine (sCr) only, urine output (UO) only, or serum creatinine or urine output RIFLE criteria.
sCr or UO
 Cohort Cohort Cohort
Median 0.739 1.30 0.700 1.30 0.700 1.28
Average 0.865 3.50 0.851 3.45 0.842 3.34
Stdev 0.690 11.0 0.700 10.9 0.702 10.6 p (t-test) 0.100 0.11 0.13
Min 0.0264 0.00242 0.0264 0.00242 0.0264 0.00242
Max 3.02 60.0 3.02 60.0 3.02 60.0 n (Patient) 48 84 46 86 42 90 sCr only
Recovery Period
Duration (hr) 24 48 72
Non- Non- Non-
Recovered recovered Recovered recovered Recovered recovered Cohort Cohort Cohort Cohort Cohort Cohort
Median 0.797 1.34 0.819 1.33 0.819 1.28
Average 0.857 3.71 0.864 3.67 0.874 3.59
Stdev 0.614 11.4 0.617 11.3 0.622 11.2 p (t-test) 0.068 0.074 0.086
Min 0.0264 0.00242 0.0264 0.00242 0.0264 0.00242
Max 2.07 60.0 2.07 60.0 2.07 60.0 n (Patient) 54 78 53 79 51 81
UO only


OR Quartile 2 3.28 2.94 2.50 3.62 2.59 2.97 3.75 2.40 3.29 p Value 0.0043 0.0092 0.066 0.0021 0.020 0.028 0.0017 0.033 0.012
Lower limit of 95%
CI 1.45 1.31 0.942 1.59 1.16 1.12 1.64 1.08 1.30
Upper limit of 95% CI 7.40 6.63 6.64 8.22 5.81 7.87 8.56 5.36 8.28
OR Quartile 3 2.55 2.44 2.17 2.60 2.30 2.40 2.35 2.04 2.25 p Value 0.012 0.014 0.046 0.012 0.022 0.021 0.027 0.051 0.026
Lower limit of 95%
CI 1.23 1.20 1.01 1.24 1.13 1.14 1.10 0.998 1.10
Upper limit of 95% CI 5.32 4.99 4.63 5.47 4.69 5.06 5.02 4.16 4.60
OR Quartile 4 3.32 4.24 1.62 3.05 4.07 1.59 3.34 3.75 1.83 p Value 0.015 0.0035 0.25 0.024 0.0045 0.26 0.022 0.0075 0.14
Lower limit of 95%
CI 1.26 1.61 0.713 1.15 1.54 0.708 1.19 1.42 0.825
Upper limit of 95% CI 8.75 11.2 3.71 8.06 10.7 3.58 9.41 9.88 4.06
[00363] Table 22.4: Comparison of marker levels and the area under the ROC curve (AUC) in urine samples for the "recovered" and "non-recovered" cohorts where recovery starts within 96 hours after sample collection and renal status is assessed by serum creatinine (sCr) only, urine output (UO) only, or serum creatinine or urine output RIFLE criteria.
sCr or UO


UO only
Recovery Period
Duration (hr) 24 48 72
Non- Non- Non-
Recovered recovered Recovered recovered Recovered recovered
Cohort Cohort Cohort Cohort Cohort Cohort
Median 1.02 1.36 1.00 1.36 1.02 1.35
Average 1.09 5.57 1.08 5.20 1.08 4.67
Stdev 0.825 15.1 0.840 14.5 0.864 13.6 p (t-test) 0.0063 0.010 0.022
Min 0.00242 0.233 0.00242 0.233 0.00242 0.233
Max 4.23 60.0 4.23 60.0 4.23 60.0 n (Patient) 88 43 84 47 77 54

[00364] Table 22.5: Comparison of marker levels and the area under the ROC curve (AUC) in urine samples for the "recovered" and "non-recovered" cohorts where recovery starts within 168 hours after sample collection and renal status is assessed by serum creatinine (sCr) only, urine output (UO) only, or serum creatinine or urine output RIFLE criteria.
sCr or UO
Recovery Period
Duration (hr) 24 48 72
Non- Non- Non-
Recovered recovered Recovered recovered Recovered recovered
Cohort Cohort Cohort Cohort Cohort Cohort
Median 1.02 1.35 1.02 1.33 1.02 1.33
Average 1.04 4.93 1.04 4.78 1.04 4.78
Stdev 0.797 13.9 0.805 13.7 0.805 13.7 p (t-test) 0.013 0.017 0.017
Min 0.00242 0.197 0.00242 0.197 0.00242 0.197
Max 4.23 60.0 4.23 60.0 4.23 60.0 n (Patient) 81 51 79 53 79 53 sCr only

UO only


Cutoff Quartile 3 1.07 1.07 1.07 1.07 1.07 1.07 1.07 1.07 1.07
Sensitivity 59% 61 % 61 % 58% 61 % 61 % 58% 61 % 62%
Specificity 56% 60% 55% 56% 60% 55% 56% 60% 56%
Cutoff Quartile 4 1.65 1.65 1.66 1.65 1.65 1.66 1.65 1.65 1.66
Sensitivity 35% 34% 34% 34% 34% 33% 34% 34% 32%
Specificity 81 % 84% 79% 81 % 84% 79% 81 % 84% 79%
OR Quartile 2 2.97 2.76 2.25 3.22 2.76 2.46 3.22 2.76 2.56 p Value 0.021 0.018 0.087 0.013 0.018 0.058 0.013 0.018 0.047
Lower limit of 95% CI 1.18 1.19 0.890 1.28 1.19 0.971 1.28 1.19 1.01 Upper limit of 95% CI 7.49 6.40 5.71 8.12 6.40 6.21 8.12 6.40 6.47
OR Quartile 3 1.79 2.37 1.95 1.77 2.37 1.92 1.77 2.37 2.05 p Value 0.11 0.016 0.076 0.11 0.016 0.079 0.11 0.016 0.054
Lower limit of 95% CI 0.879 1.18 0.933 0.876 1.18 0.927 0.876 1.18 0.987 Upper limit of 95% CI 3.63 4.76 4.09 3.58 4.76 3.99 3.58 4.76 4.24
OR Quartile 4 2.40 2.71 1.98 2.19 2.71 1.80 2.19 2.71 1.72 p Value 0.033 0.018 0.098 0.054 0.018 0.15 0.054 0.018 0.19
Lower limit of 95% CI 1.08 1.19 0.881 0.986 1.19 0.804 0.986 1.19 0.769 Upper limit of 95% CI 5.36 6.20 4.46 4.88 6.20 4.04 4.88 6.20 3.84
[00365] Example 23. Use of C-C motif chemokine 18 for evaluating renal status in patients admitted to the ICU: Recovery to RIFLE 0 and R from RIFLE I and F
[00366] Patients from the intensive care unit (ICU) with RIFLE stage of injury (I) or failure (F) are enrolled in the following study. EDTA anti-coagulated blood samples (10 mL) and urine samples (50 mL) are collected from each patient at enrollment, and at every 12 hours up to day 3, and then every 24 hours thereafter up to day 7 while the subject is hospitalized. C-C motif chemokine 18 is measured in the enrollment samples by standard immunoassay methods using commercially available assay reagents.
[00367] Kidney status is assessed by RIFLE criteria based on serum creatinine, urine output, or both serum creatinine and urine output. Two cohorts are defined to represent a "recovered" and a "non-recovered" population. "Recovered" indicates those patients whose maximum RIFLE stage during a period of 24, 48 or 72 hours is non-injury (RIFLE 0) or risk of injury (R) where the recovery period can start from the time of sample collection to 24, 48, 72, 96 or 168 hours after sample collection. "Non-recovered" indicates those patients whose maximum RIFLE stage during a period of 24, 48 or 72 hours is injury (I) or failure (F) where the recovery period can start from the time of sample collection to 24, 48, 72, 96 or 168 hours after sample collection. If a patient dies or is placed on renal replacement therapy (RRT) at any time from sample collection to 24, 48, 72, 96 or 168 hours after sample collection, the patient is considered "non- recovered".
[00368] The ability to distinguish the "recovered" and "non-recovered" cohorts is determined using receiver operating characteristic (ROC) analysis.
[00369] Table 23.1:Comparison of marker levels and the area under the ROC curve (AUC) in urine samples for the "recovered" and "non-recovered" cohorts where recovery starts within 24 hours after sample collection and renal status is assessed by serum creatinine (sCr) only, urine output (UO) only, or serum creatinine or urine output RIFLE criteria.
sCr or UO


UO only


SE 0.048 0.047 0.055 0.048 0.047 0.051 0.049 0.047 0.051 p Value 8.0E-4 2.0E-4 0.0031 8.0E-4 2.0E-4 2.0E-4 0.0020 8.6E-4 0.0019 nCohort Recovered 46 55 93 46 55 88 44 53 84 nCohort Non- recovered 86 76 38 86 76 43 88 78 47
Cutoff Quartile 2 0.561 0.557 0.569 0.561 0.557 0.569 0.561 0.557 0.569
Sensitivity 81 % 83% 87% 81 % 83% 88% 81 % 81 % 87%
Specificity 37% 36% 30% 37% 36% 32% 36% 34% 32%
Cutoff Quartile 3 1.07 1.07 1.07 1.07 1.07 1.07 1.07 1.07 1.07
Sensitivity 58% 61 % 68% 58% 61 % 70% 57% 59% 64%
Specificity 65% 64% 57% 65% 64% 59% 64% 62% 57%
Cutoff Quartile 4 1.65 1.64 1.66 1.65 1.64 1.66 1.65 1.64 1.66
Sensitivity 29% 33% 34% 29% 33% 37% 28% 32% 34%
Specificity 83% 85% 78% 83% 85% 81 % 82% 85% 80%
OR Quartile 2 2.56 2.77 2.84 2.56 2.77 3.55 2.39 2.16 3.24 p Value 0.022 0.014 0.049 0.022 0.014 0.016 0.035 0.059 0.018
Lower limit of 95%
CI 1.14 1.23 1.01 1.14 1.23 1.26 1.06 0.970 1.23
Upper limit of 95% CI 5.76 6.23 8.04 5.76 6.23 9.98 5.37 4.81 8.55
OR Quartile 3 2.60 2.68 2.87 2.60 2.68 3.33 2.30 2.37 2.35 p Value 0.012 0.0069 0.0096 0.012 0.0069 0.0024 0.028 0.018 0.023
Lower limit of 95%
CI 1.24 1.31 1.29 1.24 1.31 1.53 1.09 1.16 1.13
Upper limit of 95% CI 5.47 5.49 6.37 5.47 5.49 7.25 4.85 4.85 4.91
OR Quartile 4 1.95 2.88 1.90 1.95 2.88 2.47 1.79 2.65 2.03 p Value 0.14 0.020 0.13 0.14 0.020 0.029 0.20 0.032 0.084
Lower limit of 95%
CI 0.797 1.18 0.825 0.797 1.18 1.10 0.729 1.09 0.910
Upper limit of 95% CI 4.76 7.01 4.37 4.76 7.01 5.59 4.37 6.46 4.55
[00370] Table 23.2: Comparison of marker levels and the area under the ROC curve (AUC) in urine samples for the "recovered" and "non-recovered" cohorts where recovery starts within 48 hours after sample collection and renal status is assessed by serum creatinine (sCr) only, urine output (UO) only, or serum creatinine or urine output RIFLE criteria.
sCr or UO

Recovered recovered Recovered recovered Recovered recovered Cohort Cohort Cohort Cohort Cohort Cohort
Median 0.905 1.36 0.905 1.36 0.950 1.35
Average 0.928 4.06 0.928 4.06 0.943 3.96
Stdev 0.731 12.1 0.731 12.1 0.738 12.0 p (t-test) 0.041 0.041 0.050
Min 0.0264 0.00242 0.0264 0.00242 0.0264 0.00242
Max 4.23 60.0 4.23 60.0 4.23 60.0 n (Patient) 64 68 64 68 62 70
UO only
Recovery Period
Duration (hr) 24 48 72
Non- Non- Non-
Recovered recovered Recovered recovered Recovered recovered Cohort Cohort Cohort Cohort Cohort Cohort
Median 0.983 1.36 0.974 1.42 1.00 1.36
Average 1.71 4.72 1.69 4.60 1.75 4.10
Stdev 6.13 13.4 6.20 13.1 6.41 12.2 p (t-test) 0.080 0.086 0.15
Min 0.00242 0.310 0.00242 0.310 0.00242 0.310
Max 60.0 60.0 60.0 60.0 60.0 60.0 n (Patient) 94 37 92 39 86 45

Lower limit of 95%
CI 1.26 1.67 0.719 1.26 1.67 0.942 1.16 1.54 0.708
Upper limit of 95% CI 7.44 9.91 3.87 7.44 9.91 4.92 6.87 9.12 3.58
[00371] Table 23.3: Comparison of marker levels and the area under the ROC curve (AUC) in urine samples for the "recovered" and "non-recovered" cohorts where recovery starts within 72 hours after sample collection and renal status is assessed by serum creatinine (sCr) only, urine output (UO) only, or serum creatinine or urine output RIFLE criteria.
sCr or UO


UO only

Duration (hr) 24 48 72
sCr or sCr or sCr or
UO sCr only UO only UO sCr only UO only UO sCr only UO only
AUC 0.65 0.68 0.64 0.65 0.68 0.64 0.65 0.67 0.63
SE 0.048 0.047 0.056 0.048 0.047 0.056 0.047 0.047 0.053 p Value 0.0014 1.1E-4 0.012 0.0014 1.1E-4 0.012 0.0014 2.5E-4 0.012 nCohort Recovered 65 67 95 65 67 95 63 66 89 nCohort Non- recovered 67 65 36 67 65 36 69 66 42
Cutoff Quartile 2 0.561 0.561 0.569 0.561 0.561 0.569 0.561 0.561 0.569
Sensitivity 84% 85% 86% 84% 85% 86% 84% 83% 88%
Specificity 34% 34% 29% 34% 34% 29% 35% 33% 31 %
Cutoff Quartile 3 1.07 1.07 1.07 1.07 1.07 1.07 1.07 1.07 1.07
Sensitivity 58% 60% 64% 58% 60% 64% 58% 59% 62%
Specificity 58% 60% 55% 58% 60% 55% 59% 59% 55%
Cutoff Quartile 4 1.65 1.65 1.66 1.65 1.65 1.66 1.65 1.65 1.66
Sensitivity 34% 37% 33% 34% 37% 33% 33% 36% 31 %
Specificity 85% 87% 78% 85% 87% 78% 84% 86% 78%
OR Quartile 2 2.60 2.88 2.59 2.60 2.88 2.59 2.83 2.50 3.40 p Value 0.023 0.014 0.073 0.023 0.014 0.073 0.014 0.030 0.021
Lower limit of 95%
CI 1.14 1.24 0.914 1.14 1.24 0.914 1.24 1.10 1.21
Upper limit of 95% CI 5.95 6.67 7.35 5.95 6.67 7.35 6.47 5.71 9.57
OR Quartile 3 1.96 2.22 2.14 1.96 2.22 2.14 1.96 2.09 1.99 p Value 0.057 0.025 0.059 0.057 0.025 0.059 0.056 0.038 0.072
Lower limit of 95%
CI 0.981 1.11 0.970 0.981 1.11 0.970 0.982 1.04 0.940
Upper limit of 95% CI 3.92 4.46 4.72 3.92 4.46 4.72 3.92 4.18 4.21
OR Quartile 4 2.87 3.77 1.76 2.87 3.77 1.76 2.65 3.62 1.55 p Value 0.014 0.0026 0.19 0.014 0.0026 0.19 0.023 0.0035 0.30
Lower limit of 95%
CI 1.24 1.59 0.756 1.24 1.59 0.756 1.14 1.53 0.680
Upper limit of 95% CI 6.67 8.95 4.10 6.67 8.95 4.10 6.14 8.58 3.52
[00372] Table 23.4: Comparison of marker levels and the area under the ROC curve (AUC) in urine samples for the "recovered" and "non-recovered" cohorts where recovery starts within 96 hours after sample collection and renal status is assessed by serum creatinine (sCr) only, urine output (UO) only, or serum creatinine or urine output RIFLE criteria.
sCr or UO


UO only

 Lower limit of 95%
CI 0.982 1.04 0.949 0.924 1.04 0.880 0.923 0.982 0.933
Upper limit of 95% CI 3.92 4.19 4.35 3.68 4.19 3.96 3.67 3.92 4.09
OR Quartile 4 2.83 3.54 2.04 2.71 3.54 1.94 2.50 3.39 1.67 p Value 0.014 0.0034 0.090 0.018 0.0034 0.11 0.030 0.0046 0.22
Lower limit of 95%
CI 1.24 1.52 0.896 1.19 1.52 0.853 1.10 1.46 0.741
Upper limit of 95% CI 6.47 8.24 4.65 6.20 8.24 4.40 5.71 7.89 3.77
[00373] Table 23.5: Comparison of marker levels and the area under the ROC curve (AUC) in urine samples for the "recovered" and "non-recovered" cohorts where recovery starts within 168 hours after sample collection and renal status is assessed by serum creatinine (sCr) only, urine output (UO) only, or serum creatinine or urine output RIFLE criteria.
sCr or UO


UO only
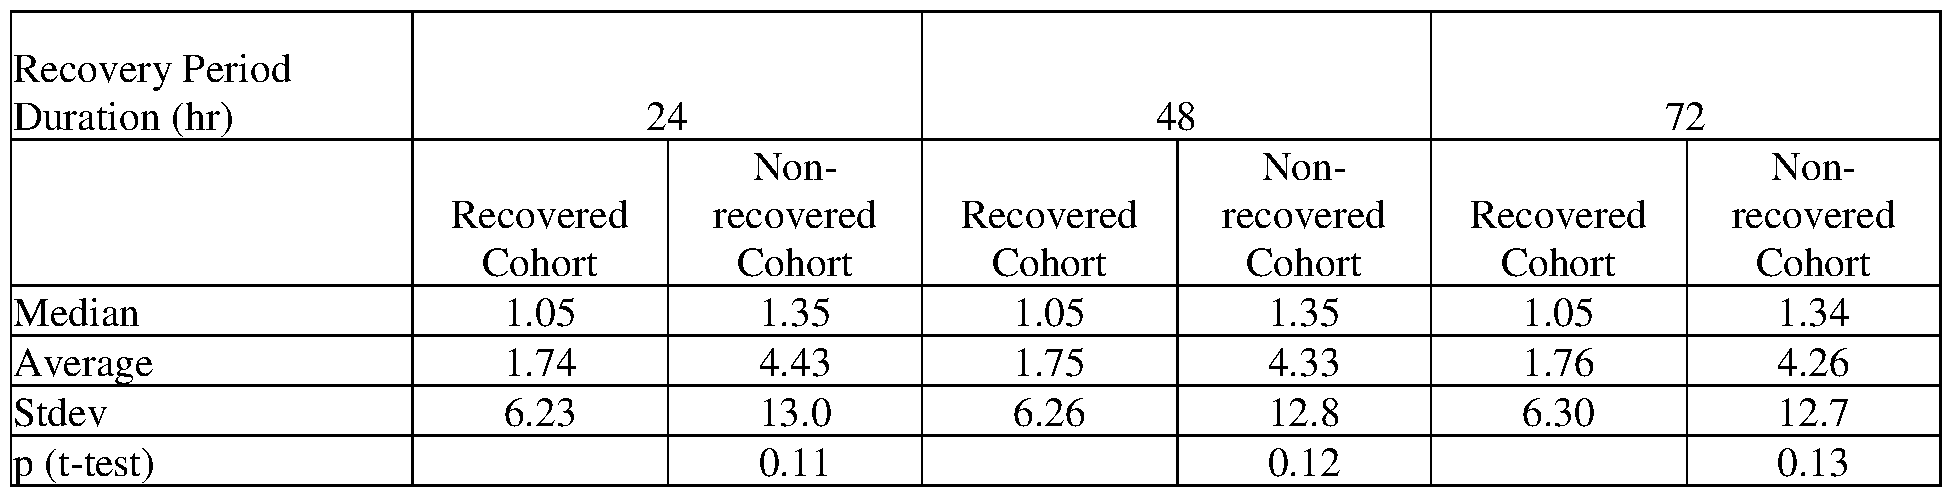
Max 60.0 60.0 60.0 60.0 60.0 60.0 n (Patient) 91 40 90 41 89 42

[00374] Example 24. Use of C-C motif chemokine 18 for evaluating renal status in patients admitted to the ICU: Persistent at RIFLE F
[00375] Patients from the intensive care unit (ICU) with RIFLE stage of injury (I) or failure (F) are enrolled in the following study. EDTA anti-coagulated blood samples (10 mL) and urine samples (50 mL) are collected from each patient at enrollment, and at every 12 hours up to day 3, and then every 24 hours thereafter up to day 7 while the subject is hospitalized. C-C motif chemokine 18 is measured in the enrollment samples by standard immunoassay methods using commercially available assay reagents.
[00376] Kidney status is assessed by RIFLE criteria based on serum creatinine, urine output, or both serum creatinine and urine output. Two cohorts are defined to represent a "persistent" and a "non-persistent" population. "Persistent" indicates those patients whose minimum RIFLE stage during a period of 24, 48 or 72 hours is failure (F) where the persistence period can start
from the time of sample collection to 24, 48, 72, 96 or 168 hours after sample collection. "Non- persistent" indicates those patients who are not persistent at failure (F) and whose minimum RIFLE stage during a period of 24, 48 or 72 hours is non-injury (RIFLE 0), risk of injury (R), or injury (I) where the persistence period can start from the time of sample collection to 24, 48, 72, 96 or 168 hours after sample collection. If a patient dies after failure (F) or is placed on renal replacement therapy (RRT) at any time from sample collection to 24, 48, 72, 96 or 168 hours after sample collection, the patient is considered "persistent".
[00377] The ability to distinguish the "persistent" and "non-persistent" cohorts is determined using receiver operating characteristic (ROC) analysis.
[00378] Table 24.1: Comparison of marker levels and the area under the ROC curve (AUC) in urine samples for the "persistent" and "non-persistent" cohorts where persistence starts within 24 hours after sample collection and renal status is assessed by serum creatinine (sCr) only, urine output (UO) only, or serum creatinine or urine output RIFLE criteria.
sCr or UO


UO only
 Median 1.06 1.58 1.06 1.74 1.06 1.74
Average 1.65 8.26 1.64 9.16 1.64 9.16
Stdev 5.60 18.9 5.55 19.9 5.55 19.9 p (t-test) 0.0030 0.0013 0.0013
Min 0.00242 0.310 0.00242 0.310 0.00242 0.310
Max 60.0 60.0 60.0 60.0 60.0 60.0 n (Patient) 113 18 115 16 115 16

[00379] Table 24.2: Comparison of marker levels and the area under the ROC curve (AUC) in urine samples for the "persistent" and "non-persistent" cohorts where persistence starts within 48 hours after sample collection and renal status is assessed by serum creatinine (sCr) only, urine output (UO) only, or serum creatinine or urine output RIFLE criteria.
sCr or UO

Stdev 6.68 11.3 6.45 12.0 6.30 12.5 p (t-test) 0.20 0.13 0.11
Min 0.0156 0.00242 0.00242 0.233 0.00242 0.310
Max 60.0 60.0 60.0 60.0 60.0 60.0 n (Patient) 79 53 85 47 89 43 sCr only
Persistence Period
Duration (hr) 24 48 72
Non-persistent Persistent Non-persistent Persistent Non-persistent Persistent Cohort Cohort Cohort Cohort Cohort Cohort
Median 0.965 1.36 0.965 1.43 0.978 1.39
Average 1.72 3.84 1.68 4.09 1.71 4.20
Stdev 6.64 11.5 6.48 12.0 6.37 12.4 p (t-test) 0.18 0.14 0.13
Min 0.0156 0.00242 0.00242 0.233 0.00242 0.233
Max 60.0 60.0 60.0 60.0 60.0 60.0 n (Patient) 80 51 84 47 87 44
UO only


CI 1.28 1.20 0.995 1.20 1.23 0.876 1.24 1.08 0.876
Upper limit of 95% CI 8.12 7.63 20.2 8.40 8.55 18.0 9.81 7.54 18.0
OR Quartile 3 2.30 2.61 2.28 3.20 2.71 2.44 3.40 2.61 2.44 p Value 0.022 0.0096 0.082 0.0024 0.0085 0.073 0.0020 0.013 0.073
Lower limit of 95%
CI 1.13 1.26 0.900 1.51 1.29 0.921 1.56 1.23 0.921
Upper limit of 95% CI 4.69 5.40 5.78 6.78 5.70 6.45 7.38 5.56 6.45
OR Quartile 4 3.08 2.80 2.61 3.44 2.86 3.12 2.98 2.35 3.12 p Value 0.0068 0.013 0.044 0.0030 0.011 0.020 0.0087 0.039 0.020
Lower limit of 95%
CI 1.36 1.25 1.03 1.52 1.27 1.20 1.32 1.05 1.20
Upper limit of 95% CI 6.94 6.29 6.63 7.79 6.42 8.11 6.75 5.30 8.11
[00380] Table 24.3: Comparison of marker levels and the area under the ROC curve (AUC) in urine samples for the "persistent" and "non-persistent" cohorts where persistence starts within 72 hours after sample collection and renal status is assessed by serum creatinine (sCr) only, urine output (UO) only, or serum creatinine or urine output RIFLE criteria.
sCr or UO


UO only

Min 0.00242 0.310 0.00242 0.310 0.00242 0.310
Max 60.0 60.0 60.0 60.0 60.0 60.0 n (Patient) 102 29 105 26 105 26

[00381] Table 24.4: Comparison of marker levels and the area under the ROC curve (AUC) in urine samples for the "persistent" and "non-persistent" cohorts where persistence starts within 96 hours after sample collection and renal status is assessed by serum creatinine (sCr) only, urine output (UO) only, or serum creatinine or urine output RIFLE criteria.
sCr or UO

Persistence Period
Duration (hr) 24 48 72
Non-persistent Persistent Non-persistent Persistent Non-persistent Persistent Cohort Cohort Cohort Cohort Cohort Cohort
Median 0.960 1.36 0.960 1.39 0.970 1.39
Average 1.77 3.59 1.73 3.79 1.74 3.86
Stdev 6.86 11.0 6.68 11.4 6.60 11.6 p (t-test) 0.25 0.19 0.18
Min 0.0156 0.00242 0.00242 0.233 0.00242 0.233
Max 60.0 60.0 60.0 60.0 60.0 60.0 n (Patient) 75 56 79 52 81 50
UO only
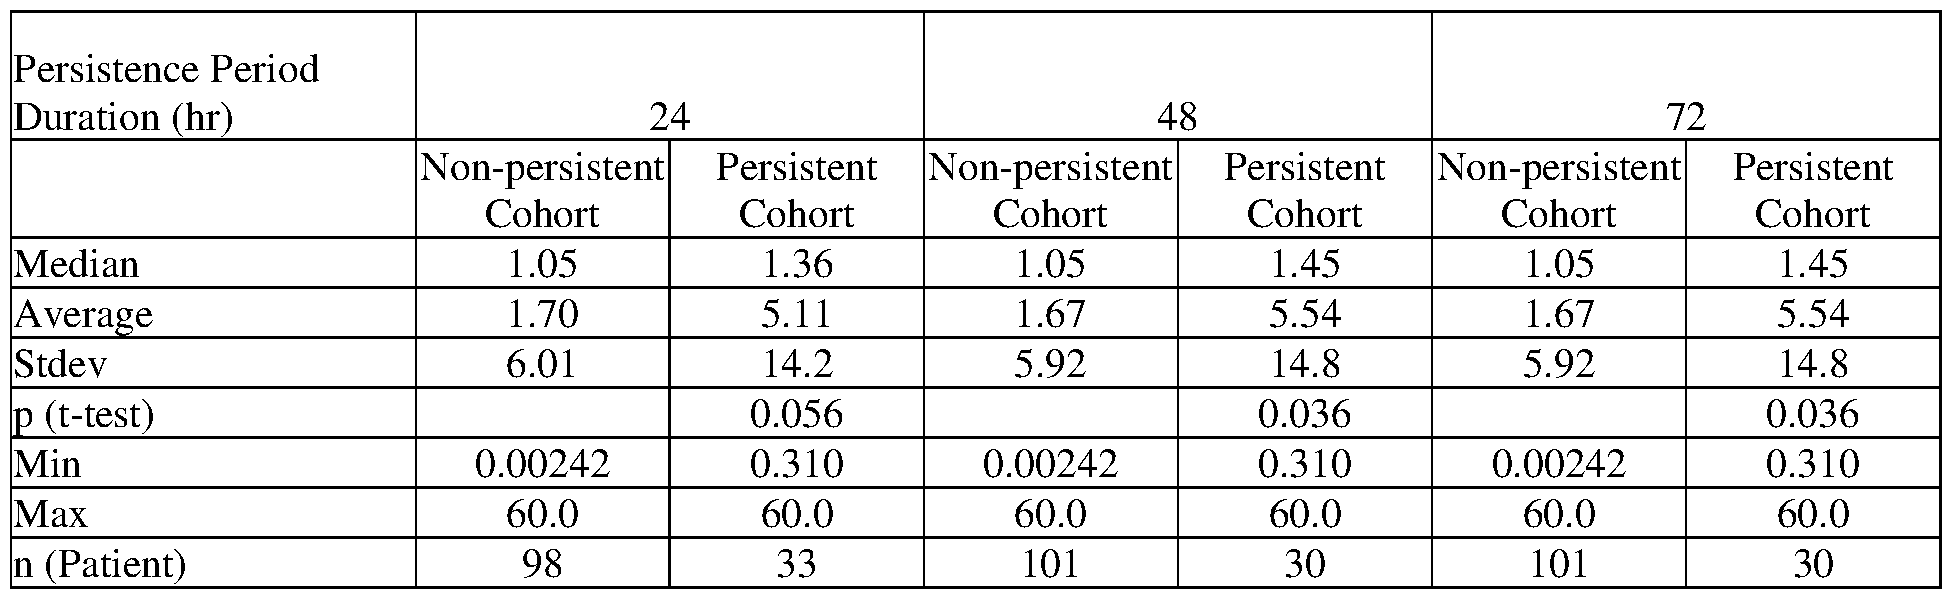

OR Quartile 4 2.81 2.65 2.54 2.94 2.67 3.10 2.71 2.47 3.10 p Value 0.013 0.018 0.033 0.0092 0.017 0.011 0.015 0.027 0.011
Lower limit of 95% CI 1.24 1.18 1.08 1.31 1.19 1.29 1.21 1.11 1.29
Upper limit of 95% CI 6.36 5.96 5.95 6.63 5.99 7.41 6.08 5.53 7.41
[00382] Table 24.5: Comparison of marker levels and the area under the ROC curve (AUC) in urine samples for the "persistent" and "non-persistent" cohorts where persistence starts within 168 hours after sample collection and renal status is assessed by serum creatinine (sCr) only, urine output (UO) only, or serum creatinine or urine output RIFLE criteria.
sCr or UO


UO only

Duration (hr) 24 48 72
sCr or sCr or sCr or
UO sCr only UO only UO sCr only UO only UO sCr only UO only
AUC 0.67 0.65 0.64 0.69 0.67 0.65 0.67 0.65 0.65
SE 0.048 0.049 0.057 0.048 0.049 0.058 0.049 0.050 0.058 p Value 5.6E-4 0.0016 0.013 1.0E-4 7.0E-4 0.0093 3.5E-4 0.0020 0.0093 nCohort Non- persistent 73 74 96 78 78 98 80 80 98 nCohort Persistent 59 57 35 54 53 33 52 51 33
Cutoff Quartile 2 0.561 0.557 0.569 0.561 0.557 0.569 0.561 0.557 0.569
Sensitivity 85% 82% 89% 85% 83% 88% 85% 82% 88%
Specificity 33% 31 % 30% 32% 31 % 30% 31 % 30% 30%
Cutoff Quartile 3 1.07 1.07 1.07 1.07 1.07 1.07 1.07 1.07 1.07
Sensitivity 61 % 61 % 60% 65% 62% 61 % 65% 63% 61 %
Specificity 59% 58% 53% 60% 58% 53% 60% 57% 53%
Cutoff Quartile 4 1.65 1.64 1.66 1.65 1.64 1.66 1.65 1.64 1.66
Sensitivity 36% 35% 37% 37% 36% 39% 37% 35% 39%
Specificity 84% 82% 79% 83% 82% 80% 82% 81 % 80%
OR Quartile 2 2.72 2.12 3.35 2.71 2.17 3.05 2.50 2.00 3.05 p Value 0.023 0.080 0.036 0.028 0.078 0.054 0.043 0.12 0.054
Lower limit of 95% CI 1.15 0.914 1.08 1.12 0.916 0.983 1.03 0.843 0.983
Upper limit of 95% CI 6.44 4.92 10.4 6.60 5.15 9.45 6.08 4.75 9.45
OR Quartile 3 2.24 2.21 1.70 2.79 2.25 1.74 2.83 2.28 1.74 p Value 0.024 0.028 0.19 0.0051 0.026 0.18 0.0049 0.025 0.18
Lower limit of 95% CI 1.11 1.09 0.775 1.36 1.10 0.779 1.37 1.11 0.779
Upper limit of 95% CI 4.52 4.47 3.73 5.73 4.60 3.88 5.85 4.68 3.88
OR Quartile 4 2.81 2.54 2.25 2.94 2.55 2.54 2.71 2.36 2.54 p Value 0.013 0.024 0.060 0.0092 0.023 0.033 0.015 0.036 0.033
Lower limit of 95% CI 1.24 1.13 0.965 1.31 1.14 1.08 1.21 1.06 1.08
Upper limit of 95% CI 6.36 5.70 5.22 6.63 5.72 5.95 6.08 5.28 5.95
[00383] Example 25. Use of C-C motif chemokine 18 for evaluating renal status in patients admitted to the ICU: Persistent at RIFLE I or F
[00384] Patients from the intensive care unit (ICU) with RIFLE stage of injury (I) or failure (F) are enrolled in the following study. EDTA anti-coagulated blood samples (10 mL) and urine samples (50 mL) are collected from each patient at enrollment, and at every 12 hours up to day 3, and then every 24 hours thereafter up to day 7 while the subject is hospitalized. C-C motif chemokine 18 is measured in the enrollment samples by standard immunoassay methods using commercially available assay reagents.
[00385] Kidney status is assessed by RIFLE criteria based on serum creatinine, urine output, or both serum creatinine and urine output. Two cohorts are defined to represent a "persistent" and a "non-persistent" population. "Persistent" indicates those patients whose minimum RIFLE stage during a period of 24, 48 or 72 hours is injury (I) or failure (F) where the persistence period can start from the time of sample collection to 24, 48, 72, 96 or 168 hours after sample collection. "Non-persistent" indicates those patients who are not persistent at injury (I) or failure (F) and whose minimum RIFLE stage during a period of 24, 48 or 72 hours is non-injury
(RIFLE 0) or risk of injury (R) where the persistence period can start from the time of sample collection to 24, 48, 72, 96 or 168 hours after sample collection. If a patient dies after injury (I) or failure (F) or is placed on renal replacement therapy (RRT) at any time from sample collection to 24, 48, 72, 96 or 168 hours after sample collection, the patient is considered "persistent".
[00386] The ability to distinguish the "persistent" and "non-persistent" cohorts is determined using receiver operating characteristic (ROC) analysis.
[00387] Table 25.1:Comparison of marker levels and the area under the ROC curve (AUC) in urine samples for the "persistent" and "non-persistent" cohorts where persistence starts within 24 hours after sample collection and renal status is assessed by serum creatinine (sCr) only, urine output (UO) only, or serum creatinine or urine output RIFLE criteria.
sCr or UO


UO only

Max 60.0 60.0 60.0 60.0 60.0 60.0 n (Patient) 102 29 108 23 110 21

[00388] Table 25.2: Comparison of marker levels and the area under the ROC curve (AUC) in urine samples for the "persistent" and "non-persistent" cohorts where persistence starts within 48 hours after sample collection and renal status is assessed by serum creatinine (sCr) only, urine output (UO) only, or serum creatinine or urine output RIFLE criteria.
sCr or UO


UO only

 Upper limit of 95% CI 6.56 5.94 8.76 3.68 4.35 7.43 4.18 4.10 6.51
OR Quartile 4 2.74 3.42 1.67 2.30 2.56 1.95 2.71 2.90 2.22 p Value 0.033 0.0090 0.23 0.047 0.026 0.13 0.018 0.012 0.077
Lower limit of 95%
CI 1.09 1.36 0.719 1.01 1.12 0.813 1.19 1.27 0.916
Upper limit of 95% CI 6.90 8.62 3.87 5.26 5.85 4.68 6.20 6.64 5.39
[00389] Table 25.3: Comparison of marker levels and the area under the ROC curve (AUC) in urine samples for the "persistent" and "non-persistent" cohorts where persistence starts within 72 hours after sample collection and renal status is assessed by serum creatinine (sCr) only, urine output (UO) only, or serum creatinine or urine output RIFLE criteria.
sCr or UO


UO only

Duration (hr) 24 48 72
sCr or sCr or sCr or
UO sCr only UO only UO sCr only UO only UO sCr only UO only
AUC 0.69 0.68 0.64 0.65 0.66 0.62 0.64 0.66 0.62
SE 0.046 0.046 0.053 0.048 0.047 0.057 0.048 0.048 0.058 p Value 4.1E-5 1.1E-4 0.0096 0.0023 6.6E-4 0.031 0.0028 8.3E-4 0.046 nCohort Non- persistent 49 53 89 64 65 95 66 67 97 nCohort Persistent 83 78 42 68 66 36 66 64 34
Cutoff Quartile 2 0.561 0.557 0.569 0.561 0.557 0.569 0.561 0.557 0.569
Sensitivity 83% 82% 88% 84% 83% 86% 83% 83% 85%
Specificity 39% 36% 31 % 34% 34% 29% 33% 33% 29%
Cutoff Quartile 3 1.07 1.07 1.07 1.07 1.07 1.07 1.07 1.07 1.07
Sensitivity 60% 60% 64% 57% 59% 61 % 58% 58% 59%
Specificity 67% 64% 56% 58% 58% 54% 58% 57% 53%
Cutoff Quartile 4 1.65 1.64 1.66 1.65 1.64 1.66 1.65 1.64 1.66
Sensitivity 31 % 33% 29% 32% 33% 31 % 33% 34% 32%
Specificity 86% 87% 76% 83% 83% 77% 83% 84% 77%
OR Quartile 2 3.12 2.55 3.40 2.71 2.56 2.59 2.50 2.36 2.35 p Value 0.0060 0.023 0.021 0.018 0.026 0.073 0.030 0.042 0.11
Lower limit of 95% CI 1.38 1.14 1.21 1.19 1.12 0.914 1.10 1.03 0.827
Upper limit of 95% CI 7.03 5.72 9.57 6.20 5.85 7.35 5.71 5.38 6.70
OR Quartile 3 3.12 2.71 2.31 1.84 2.03 1.82 1.84 1.80 1.58 p Value 0.0026 0.0067 0.030 0.083 0.046 0.13 0.083 0.098 0.25
Lower limit of 95% CI 1.49 1.32 1.08 0.924 1.01 0.833 0.923 0.898 0.718
Upper limit of 95% CI 6.56 5.58 4.92 3.68 4.08 3.98 3.67 3.59 3.49
OR Quartile 4 2.74 3.29 1.30 2.30 2.45 1.46 2.50 2.67 1.63 p Value 0.033 0.012 0.54 0.047 0.033 0.39 0.030 0.020 0.27
Lower limit of 95% CI 1.09 1.30 0.565 1.01 1.07 0.621 1.10 1.17 0.689
Upper limit of 95% CI 6.90 8.28 2.97 5.26 5.61 3.43 5.71 6.10 3.86
[00390] Table 25.4: Comparison of marker levels and the area under the ROC curve (AUC) in urine samples for the "persistent" and "non-persistent" cohorts where persistence starts within 96 hours after sample collection and renal status is assessed by serum creatinine (sCr) only, urine output (UO) only, or serum creatinine or urine output RIFLE criteria.
sCr or UO


Median 0.819 1.34 0.950 1.35 0.965 1.36
Average 0.911 3.66 0.949 4.07 0.955 4.16
Stdev 0.755 11.4 0.736 12.2 0.726 12.4 p (t-test) 0.082 0.044 0.038
Min 0.0264 0.00242 0.0264 0.00242 0.0264 0.00242
Max 4.23 60.0 4.23 60.0 4.23 60.0 n (Patient) 53 78 64 67 66 65
UO only
Persistence Period
Duration (hr) 24 48 72
Non-persistent Persistent Non-persistent Persistent Non-persistent Persistent Cohort Cohort Cohort Cohort Cohort Cohort
Median 1.00 1.36 1.05 1.35 1.06 1.34
Average 1.75 4.11 1.76 4.39 1.75 4.55
Stdev 6.41 12.2 6.23 13.0 6.16 13.3 p (t-test) 0.15 0.12 0.10
Min 0.00242 0.233 0.00242 0.233 0.00242 0.233
Max 60.0 60.0 60.0 60.0 60.0 60.0 n (Patient) 86 45 91 40 93 38

sCr or UO


UO only


Cutoff Quartile 2 0.561 0.557 0.569 0.561 0.557 0.569 0.561 0.557 0.569
Sensitivity 83% 82% 87% 84% 84% 86% 84% 83% 85%
Specificity 39% 36% 32% 35% 34% 31 % 34% 33% 30%
Cutoff Quartile 3 1.07 1.07 1.07 1.07 1.07 1.07 1.07 1.07 1.07
Sensitivity 60% 60% 64% 59% 60% 60% 59% 58% 59%
Specificity 67% 64% 57% 60% 59% 55% 59% 58% 53%
Cutoff Quartile 4 1.65 1.64 1.66 1.65 1.64 1.66 1.65 1.64 1.66
Sensitivity 31 % 33% 30% 33% 34% 30% 34% 35% 32%
Specificity 86% 87% 77% 84% 84% 77% 84% 85% 78%
OR Quartile 2 3.12 2.55 3.24 2.95 2.67 2.73 2.71 2.45 2.50 p Value 0.0060 0.023 0.018 0.010 0.020 0.043 0.018 0.033 0.066
Lower limit of 95% CI 1.38 1.14 1.23 1.29 1.17 1.03 1.19 1.07 0.942 Upper limit of 95% CI 7.03 5.72 8.55 6.75 6.10 7.23 6.20 5.61 6.64
OR Quartile 3 3.12 2.71 2.35 2.09 2.17 1.84 2.09 1.91 1.61 p Value 0.0026 0.0067 0.023 0.037 0.030 0.11 0.038 0.068 0.21
Lower limit of 95% CI 1.49 1.32 1.13 1.04 1.08 0.874 1.04 0.954 0.765 Upper limit of 95% CI 6.56 5.58 4.91 4.19 4.35 3.85 4.18 3.82 3.40
OR Quartile 4 2.74 3.29 1.45 2.54 2.82 1.47 2.76 3.07 1.62 p Value 0.033 0.012 0.37 0.029 0.016 0.35 0.018 0.0092 0.25
Lower limit of 95% CI 1.09 1.30 0.647 1.10 1.22 0.649 1.19 1.32 0.713 Upper limit of 95% CI 6.90 8.28 3.25 5.90 6.55 3.34 6.40 7.13 3.71
[00392] Example 26. Use of C-C motif chemokine 23 for evaluating renal status in patients admitted to the ICU: Recovery to RIFLE 0 from RIFLE I and F
[00393] Patients from the intensive care unit (ICU) with RIFLE stage of injury (I) or failure (F) are enrolled in the following study. EDTA anti-coagulated blood samples (10 mL) and urine samples (50 mL) are collected from each patient at enrollment, and at every 12 hours up to day 3, and then every 24 hours thereafter up to day 7 while the subject is hospitalized. C-C motif chemokine 23 is measured in the enrollment samples by standard immunoassay methods using commercially available assay reagents.
[00394] Kidney status is assessed by RIFLE criteria based on serum creatinine, urine output, or both serum creatinine and urine output. Two cohorts are defined to represent a "recovered" and a "non-recovered" population. "Recovered" indicates those patients whose maximum RIFLE stage during a period of 24, 48 or 72 hours is non-injury (RIFLE 0) where the recovery period can start from the time of sample collection to 24, 48, 72, 96 or 168 hours after sample collection. "Non-recovered" indicates those patients whose maximum RIFLE stage during a period of 24, 48 or 72 hours is risk of injury (R), injury (I) or failure (F) where the recovery period can start from the time of sample collection to 24, 48, 72, 96 or 168 hours after sample collection. If a patient dies or is placed on renal replacement therapy (RRT) at any time from
sample collection to 24, 48, 72, 96 or 168 hours after sample collection, the patient is considered "non-recovered".
[00395] The ability to distinguish the "recovered" and "non-recovered" cohorts is determined using receiver operating characteristic (ROC) analysis.
[00396] Table 26.1: Comparison of marker levels and the area under the ROC curve (AUC) in urine samples for the "recovered" and "non-recovered" cohorts where recovery starts within 24 hours after sample collection and renal status is assessed by serum creatinine (sCr) only, urine output (UO) only, or serum creatinine or urine output RIFLE criteria.
sCr or UO
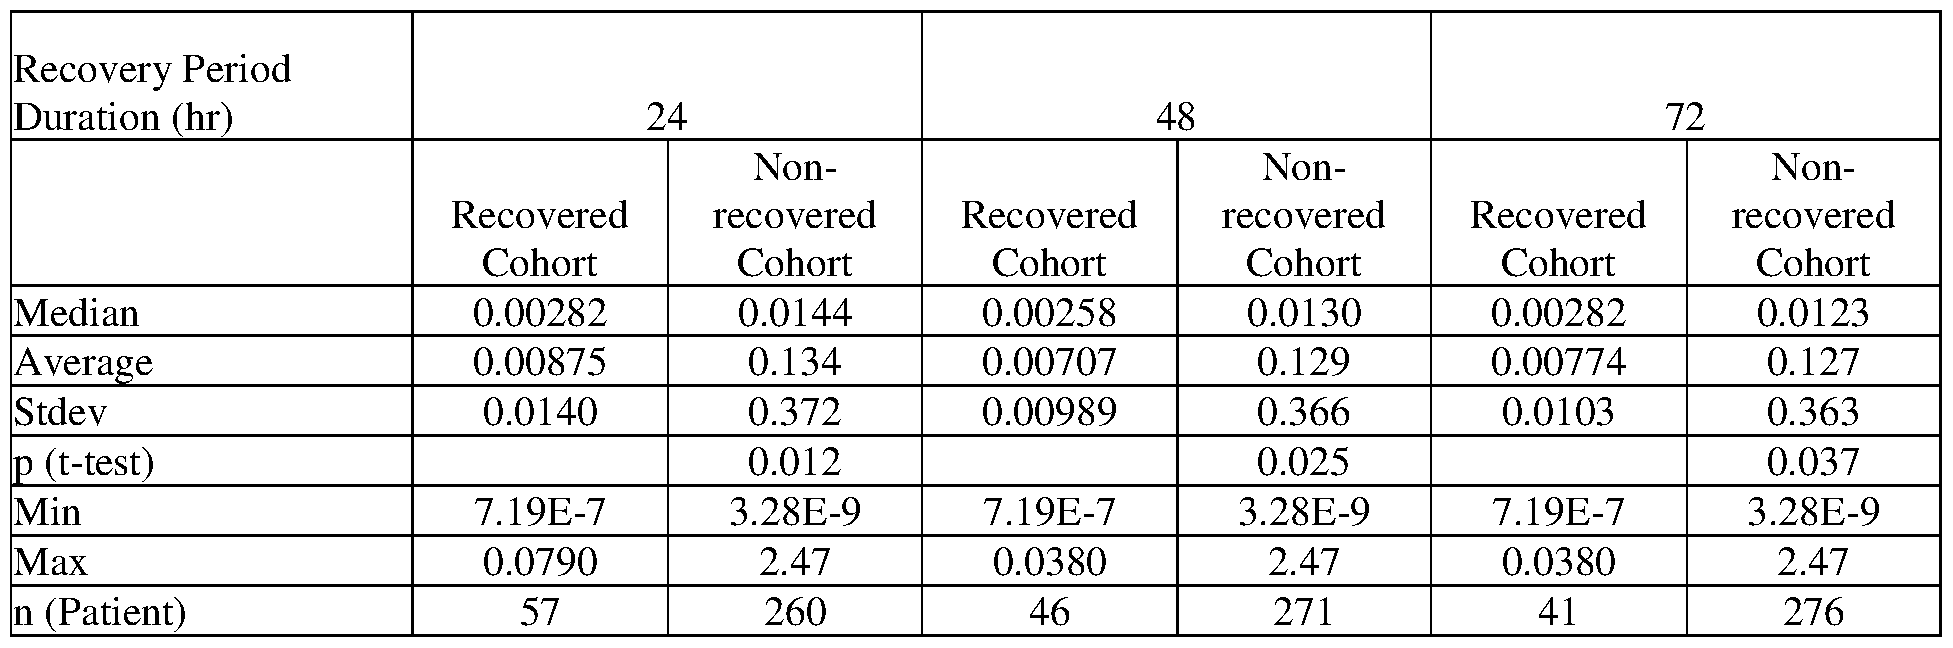

UO only


[00397] Table 26.2: Comparison of marker levels and the area under the ROC curve (AUC) in urine samples for the "recovered" and "non-recovered" cohorts where recovery starts within 48 hours after sample collection and renal status is assessed by serum creatinine (sCr) only, urine output (UO) only, or serum creatinine or urine output RIFLE criteria.
sCr or UO

Min 7.09E-7 3.28E-9 7.09E-7 3.28E-9 7.09E-7 3.28E-9
Max 0.102 2.47 0.102 2.47 0.102 2.47 n (Patient) 90 227 79 238 71 246 sCr only
Recovery Period
Duration (hr) 24 48 72
Non- Non- Non-
Recovered recovered Recovered recovered Recovered recovered Cohort Cohort Cohort Cohort Cohort Cohort
Median 0.00328 0.0222 0.00328 0.0220 0.00329 0.0213
Average 0.00870 0.163 0.00881 0.161 0.00872 0.158
Stdev 0.0153 0.408 0.0154 0.406 0.0155 0.402 p (t-test) 1.3E-4 1.6E-4 2.7E-4
Min 3.28E-9 3.28E-9 3.28E-9 3.28E-9 3.28E-9 3.28E-9
Max 0.102 2.47 0.102 2.47 0.102 2.47 n (Patient) 106 211 104 213 99 218
UO only


CI 1.55 1.82 0.717 1.73 1.77 0.863 1.54 1.70 0.861
Upper limit of 95%
CI 4.53 5.23 2.18 5.19 5.08 2.54 4.77 4.91 2.46
OR Quartile 3 4.71 6.07 1.72 4.51 5.77 1.48 3.95 5.48 1.46 p Value 3.3E-8 3.9E-11 0.026 3.1E-7 1.3E-10 0.091 5.2E-6 7.1E-10 0.098
Lower limit of 95%
CI 2.72 3.56 1.07 2.53 3.38 0.939 2.19 3.19 0.932
Upper limit of 95%
CI 8.15 10.4 2.77 8.03 9.85 2.34 7.14 9.41 2.28
OR Quartile 4 14.9 19.7 2.27 18.8 19.1 1.96 16.0 17.5 1.93 p Value 7.7E-6 7.6E-7 0.0022 5.8E-5 1.0E-6 0.011 1.5E-4 2.1E-6 0.012
Lower limit of 95%
CI 4.56 6.05 1.34 4.49 5.85 1.17 3.83 5.36 1.15
Upper limit of 95%
CI 48.6 64.3 3.84 78.4 62.1 3.29 67.0 57.0 3.24
[00398] Table 26.3: Comparison of marker levels and the area under the ROC curve (AUC) in urine samples for the "recovered" and "non-recovered" cohorts where recovery starts within 72 hours after sample collection and renal status is assessed by serum creatinine (sCr) only, urine output (UO) only, or serum creatinine or urine output RIFLE criteria.
sCr or UO


UO only
Recovery Period
Duration (hr) 24 48 72
Non- Non- Non-
Recovered recovered Recovered recovered Recovered recovered
Cohort Cohort Cohort Cohort Cohort Cohort
Median 0.00730 0.0207 0.00764 0.0182 0.00724 0.0182
Average 0.0934 0.151 0.0971 0.139 0.0964 0.135
Stdev 0.335 0.354 0.342 0.340 0.350 0.328 p (t-test) 0.16 0.30 0.32
Min 3.28E-9 3.28E-9 3.28E-9 3.28E-9 3.28E-9 3.28E-9
Max 2.47 1.82 2.47 1.82 2.47 1.82 n (Patient) 214 101 204 111 190 125

[00399] Table 26.4: Comparison of marker levels and the area under the ROC curve (AUC) in urine samples for the "recovered" and "non-recovered" cohorts where recovery starts within 96
hours after sample collection and renal status is assessed by serum creatinine (sCr) only, output (UO) only, or serum creatinine or urine output RIFLE criteria.
sCr or UO


UO only


Cutoff Quartile 2 0.00202 0.00202 0.00207 0.00202 0.00202 0.00207 0.00202 0.00202 0.00207
Sensitivity 83% 84% 80% 83% 84% 80% 82% 84% 79%
Specificity 35% 36% 27% 37% 36% 28% 38% 37% 28%
Cutoff Quartile 3 0.0104 0.0104 0.0104 0.0104 0.0104 0.0104 0.0104 0.0104 0.0104
Sensitivity 64% 66% 65% 62% 65% 61 % 61 % 65% 60%
Specificity 69% 70% 56% 68% 70% 56% 68% 70% 56%
Cutoff Quartile 4 0.0477 0.0477 0.0478 0.0477 0.0477 0.0478 0.0477 0.0477 0.0478
Sensitivity 38% 40% 34% 36% 40% 32% 34% 39% 32%
Specificity 93% 94% 79% 92% 93% 79% 91 % 93% 79%
OR Quartile 2 2.55 3.05 1.48 2.81 2.94 1.49 2.81 3.10 1.48 p Value 4.3E-4 3.8E-5 0.18 1.1E-4 6.2E-5 0.17 1.1E-4 2.7E-5 0.15
Lower limit of 95%
CI 1.51 1.79 0.836 1.66 1.73 0.849 1.67 1.83 0.863
Upper limit of 95%
CI 4.29 5.18 2.64 4.73 4.98 2.60 4.74 5.27 2.54
OR Quartile 3 4.12 4.55 2.37 3.46 4.31 1.96 3.33 4.49 1.85 p Value 5.7E-9 4.8E-10 5.8E-4 3.0E-7 1.7E-9 0.0053 1.2E-6 8.4E-10 0.0091
Lower limit of 95%
CI 2.56 2.82 1.45 2.15 2.68 1.22 2.05 2.78 1.16
Upper limit of 95%
CI 6.63 7.33 3.88 5.57 6.94 3.16 5.41 7.24 2.92
OR Quartile 4 7.68 9.75 1.99 6.60 9.42 1.78 5.47 8.95 1.83 p Value 1.8E-8 1.6E-9 0.011 1.9E-7 2.7E-9 0.031 2.7E-6 6.1E-9 0.022
Lower limit of 95%
CI 3.78 4.66 1.17 3.24 4.50 1.05 2.69 4.28 1.09
Upper limit of 95%
CI 15.6 20.4 3.37 13.4 19.7 3.00 11.1 18.7 3.07
[00400] Table 26.5: Comparison of marker levels and the area under the ROC curve (AUC) in urine samples for the "recovered" and "non-recovered" cohorts where recovery starts within 168 hours after sample collection and renal status is assessed by serum creatinine (sCr) only, urine output (UO) only, or serum creatinine or urine output RIFLE criteria.
sCr or UO

Recovered recovered Recovered recovered Recovered recovered Cohort Cohort Cohort Cohort Cohort Cohort
Median 0.00460 0.0298 0.00458 0.0284 0.00443 0.0284
Average 0.0332 0.191 0.0336 0.187 0.0338 0.186
Stdev 0.161 0.443 0.163 0.439 0.163 0.438 p (t-test) 3.2E-5 4.9E-5 5.7E-5
Min 3.28E-9 3.28E-9 3.28E-9 3.28E-9 3.28E-9 3.28E-9
Max 1.92 2.47 1.92 2.47 1.92 2.47 n (Patient) 160 157 157 160 156 161
UO only
Recovery Period
Duration (hr) 24 48 72
Non- Non- Non-
Recovered recovered Recovered recovered Recovered recovered Cohort Cohort Cohort Cohort Cohort Cohort
Median 0.00709 0.0213 0.00710 0.0207 0.00709 0.0209
Average 0.0861 0.164 0.0872 0.160 0.0868 0.159
Stdev 0.328 0.363 0.330 0.359 0.332 0.355 p (t-test) 0.056 0.074 0.075
Min 3.28E-9 3.28E-9 3.28E-9 3.28E-9 3.28E-9 3.28E-9
Max 2.47 1.82 2.47 1.82 2.47 1.82 n (Patient) 211 104 208 107 205 110

Lower limit of 95%
CI 1.50 3.38 1.22 1.42 3.20 1.15 1.42 3.15 1.17
Upper limit of 95%
CI 4.21 11.4 3.50 3.98 10.8 3.28 3.98 10.6 3.31
[00401] Example 27. Use of C-C motif chemokine 23 for evaluating renal status in patients admitted to the ICU: Recovery to RIFLE 0 and R from RIFLE I and F
[00402] Patients from the intensive care unit (ICU) with RIFLE stage of injury (I) or failure (F) are enrolled in the following study. EDTA anti-coagulated blood samples (10 mL) and urine samples (50 mL) are collected from each patient at enrollment, and at every 12 hours up to day 3, and then every 24 hours thereafter up to day 7 while the subject is hospitalized. C-C motif chemokine 23 is measured in the enrollment samples by standard immunoassay methods using commercially available assay reagents.
[00403] Kidney status is assessed by RIFLE criteria based on serum creatinine, urine output, or both serum creatinine and urine output. Two cohorts are defined to represent a "recovered" and a "non-recovered" population. "Recovered" indicates those patients whose maximum RIFLE stage during a period of 24, 48 or 72 hours is non-injury (RIFLE 0) or risk of injury (R) where the recovery period can start from the time of sample collection to 24, 48, 72, 96 or 168 hours after sample collection. "Non-recovered" indicates those patients whose maximum RIFLE stage during a period of 24, 48 or 72 hours is injury (I) or failure (F) where the recovery period can start from the time of sample collection to 24, 48, 72, 96 or 168 hours after sample collection. If a patient dies or is placed on renal replacement therapy (RRT) at any time from sample collection to 24, 48, 72, 96 or 168 hours after sample collection, the patient is considered "non- recovered".
[00404] The ability to distinguish the "recovered" and "non-recovered" cohorts is determined using receiver operating characteristic (ROC) analysis.
[00405] Table 27.1: Comparison of marker levels and the area under the ROC curve (AUC) in urine samples for the "recovered" and "non-recovered" cohorts where recovery starts within 24 hours after sample collection and renal status is assessed by serum creatinine (sCr) only, urine output (UO) only, or serum creatinine or urine output RIFLE criteria.
sCr or UO
Average 0.0505 0.143 0.0522 0.140 0.0531 0.138
Stdev 0.299 0.357 0.305 0.354 0.311 0.351 p (t-test) 0.022 0.031 0.039
Min 6.85E-7 3.28E-9 6.85E-7 3.28E-9 6.85E-7 3.28E-9
Max 2.47 2.43 2.47 2.43 2.47 2.43 n (Patient) 108 209 104 213 100 217 sCr only
Recovery Period
Duration (hr) 24 48 72
Non- Non- Non-
Recovered recovered Recovered recovered Recovered recovered Cohort Cohort Cohort Cohort Cohort Cohort
Median 0.00335 0.0249 0.00335 0.0235 0.00335 0.0231
Average 0.0443 0.156 0.0449 0.154 0.0456 0.153
Stdev 0.277 0.372 0.279 0.370 0.282 0.368 p (t-test) 0.0042 0.0052 0.0063
Min 3.28E-9 3.28E-9 3.28E-9 3.28E-9 3.28E-9 3.28E-9
Max 2.47 2.43 2.47 2.43 2.47 2.43 n (Patient) 126 190 124 192 122 194
UO only


OR Quartile 2 2.22 2.94 1.03 2.42 2.84 1.35 2.63 2.75 1.49 p Value 0.0027 5.6E-5 0.93 9.9E-4 9.0E-5 0.29 3.3E-4 1.4E-4 0.15
Lower limit of 95%
CI 1.32 1.74 0.586 1.43 1.68 0.773 1.55 1.63 0.863
Upper limit of 95%
CI 3.75 4.96 1.80 4.08 4.79 2.34 4.46 4.63 2.57
OR Quartile 3 4.19 5.42 1.57 3.79 5.14 1.52 3.92 4.89 1.58 p Value 2.7E-8 2.8E-11 0.070 2.4E-7 l .OE-10 0.082 2.0E-7 3.6E-10 0.053
Lower limit of 95%
CI 2.53 3.30 0.963 2.29 3.13 0.949 2.34 2.98 0.994
Upper limit of 95%
CI 6.95 8.91 2.56 6.28 8.45 2.43 6.55 8.02 2.50
OR Quartile 4 11.5 12.5 2.63 10.8 12.1 2.78 12.9 11.7 2.81 p Value 3.5E-7 1.3E-8 3.9E-4 7.5E-7 2.1E-8 1.4E-4 1.4E-6 3.2E-8 1.1E-4
Lower limit of 95%
CI 4.50 5.23 1.54 4.20 5.05 1.64 4.58 4.88 1.66
Upper limit of 95%
CI 29.5 29.8 4.48 27.6 28.8 4.70 36.5 27.9 4.73
[00406] Table 27.2: Comparison of marker levels and the area under the ROC curve (AUC) in urine samples for the "recovered" and "non-recovered" cohorts where recovery starts within 48 hours after sample collection and renal status is assessed by serum creatinine (sCr) only, urine output (UO) only, or serum creatinine or urine output RIFLE criteria.
sCr or UO


[00407] Table 27.3: Comparison of marker levels and the area under the ROC curve (AUC) in urine samples for the "recovered" and "non-recovered" cohorts where recovery starts within 72
hours after sample collection and renal status is assessed by serum creatinine (sCr) only, output (UO) only, or serum creatinine or urine output RIFLE criteria.
sCr or UO

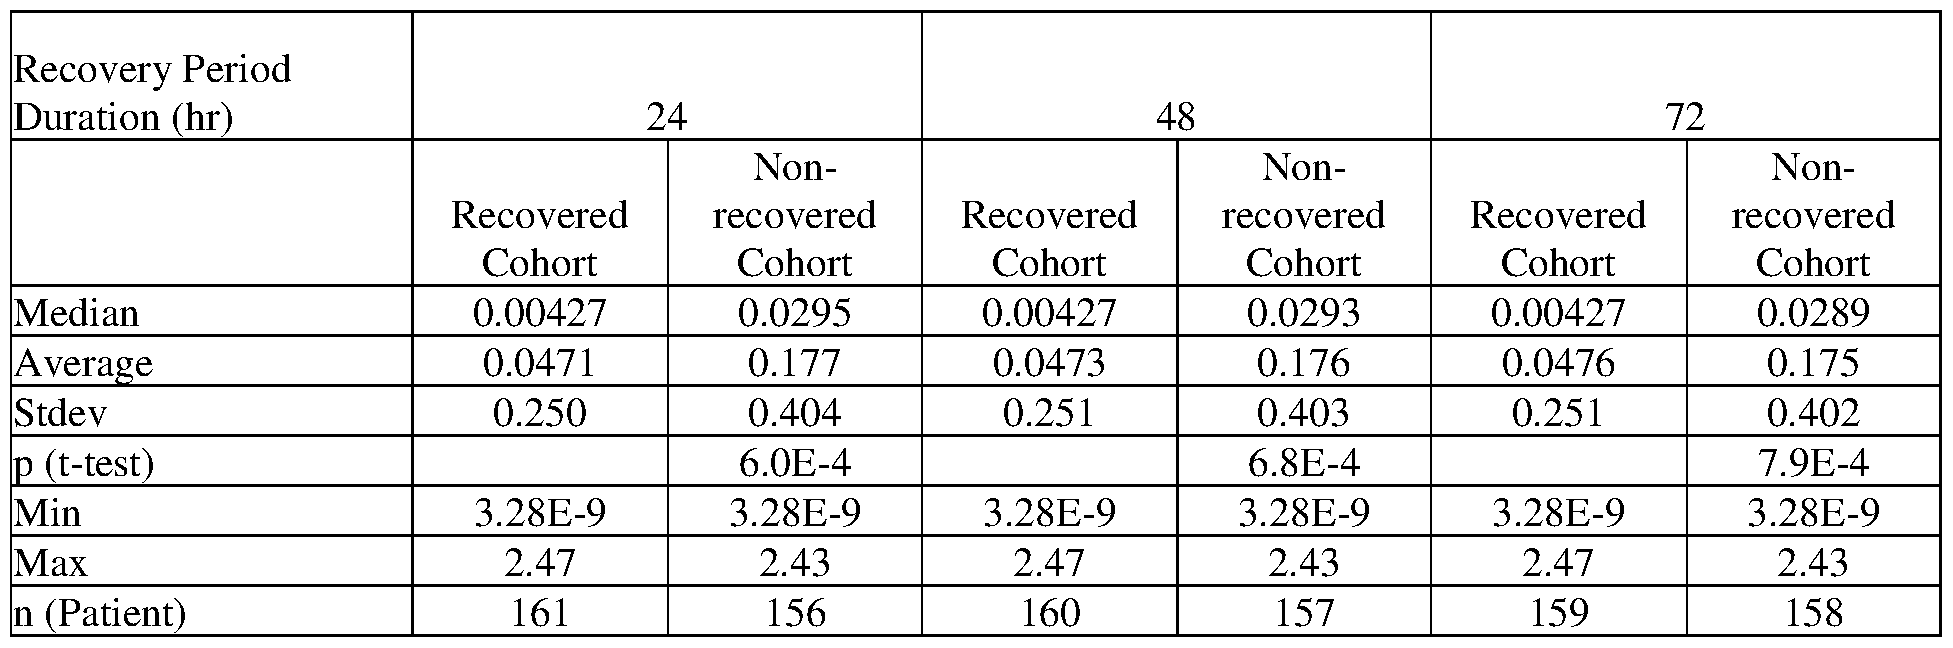
UO only


Cutoff Quartile 2 0.00202 0.00202 0.00207 0.00202 0.00202 0.00207 0.00202 0.00202 0.00207
Sensitivity 84% 85% 81 % 84% 85% 82% 84% 85% 83%
Specificity 34% 35% 28% 34% 35% 28% 35% 35% 29%
Cutoff Quartile 3 0.0104 0.0104 0.0104 0.0104 0.0104 0.0104 0.0104 0.0104 0.0104
Sensitivity 65% 67% 67% 64% 67% 66% 63% 66% 62%
Specificity 66% 66% 57% 65% 66% 57% 65% 66% 56%
Cutoff Quartile 4 0.0477 0.0477 0.0478 0.0477 0.0477 0.0478 0.0477 0.0477 0.0478
Sensitivity 39% 41 % 37% 39% 41 % 37% 38% 41 % 35%
Specificity 90% 90% 80% 89% 90% 80% 89% 90% 80%
OR Quartile 2 2.77 3.08 1.67 2.66 3.14 1.70 2.85 2.95 1.91 p Value 1.9E-4 5.7E-5 0.097 3.1E-4 4.4E-5 0.085 1.2E-4 9.5E-5 0.032
Lower limit of 95%
CI 1.62 1.78 0.912 1.56 1.81 0.930 1.67 1.71 1.06
Upper limit of 95%
CI 4.72 5.34 3.04 4.52 5.43 3.10 4.85 5.09 3.44
OR Quartile 3 3.54 4.08 2.66 3.36 3.96 2.56 3.19 3.85 2.06 p Value 8.4E-8 3.9E-9 1.7E-4 2.7E-7 7.3E-9 2.9E-4 8.0E-7 1.4E-8 0.0033
Lower limit of 95%
CI 2.23 2.56 1.60 2.12 2.49 1.54 2.01 2.42 1.27
Upper limit of 95%
CI 5.63 6.51 4.44 5.32 6.32 4.24 5.05 6.14 3.33
OR Quartile 4 5.58 6.30 2.37 5.39 6.19 2.32 5.03 6.09 2.11 p Value 2.7E-8 2.7E-9 0.0016 5.0E-8 3.8E-9 0.0021 1.7E-7 5.4E-9 0.0053
Lower limit of 95%
CI 3.04 3.44 1.39 2.94 3.38 1.36 2.75 3.32 1.25
Upper limit of 95%
CI 10.2 11.6 4.06 9.87 11.4 3.96 9.21 11.2 3.57
[00408] Table 27.4: Comparison of marker levels and the area under the ROC curve (AUC) in urine samples for the "recovered" and "non-recovered" cohorts where recovery starts within 96 hours after sample collection and renal status is assessed by serum creatinine (sCr) only, urine output (UO) only, or serum creatinine or urine output RIFLE criteria.
sCr or UO

Recovered recovered Recovered recovered Recovered recovered Cohort Cohort Cohort Cohort Cohort Cohort
Median 0.00443 0.0336 0.00428 0.0317 0.00443 0.0298
Average 0.0468 0.188 0.0471 0.186 0.0473 0.185
Stdev 0.243 0.417 0.243 0.416 0.244 0.415 p (t-test) 2.2E-4 2.5E-4 2.9E-4
Min 3.28E-9 3.28E-9 3.28E-9 3.28E-9 3.28E-9 3.28E-9
Max 2.47 2.43 2.47 2.43 2.47 2.43 n (Patient) 172 145 171 146 170 147
UO only
Recovery Period
Duration (hr) 24 48 72
Non- Non- Non-
Recovered recovered Recovered recovered Recovered recovered Cohort Cohort Cohort Cohort Cohort Cohort
Median 0.00711 0.0227 0.00710 0.0222 0.00710 0.0215
Average 0.0898 0.165 0.0902 0.164 0.0927 0.153
Stdev 0.328 0.368 0.329 0.366 0.335 0.354 p (t-test) 0.074 0.081 0.15
Min 3.28E-9 3.28E-9 3.28E-9 3.28E-9 3.28E-9 3.28E-9
Max 2.47 1.82 2.47 1.82 2.47 1.82 n (Patient) 223 92 222 93 214 101

Lower limit of 95%
CI 3.05 3.55 1.36 2.89 3.48 1.33 2.70 3.42 1.21
Upper limit of 95% CI 9.69 11.5 3.96 9.18 11.3 3.87 8.54 11.1 3.47
[00409] Table 27.5: Comparison of marker levels and the area under the ROC curve (AUC) in urine samples for the "recovered" and "non-recovered" cohorts where recovery starts within 168 hours after sample collection and renal status is assessed by serum creatinine (sCr) only, urine output (UO) only, or serum creatinine or urine output RIFLE criteria.
sCr or UO


UO only
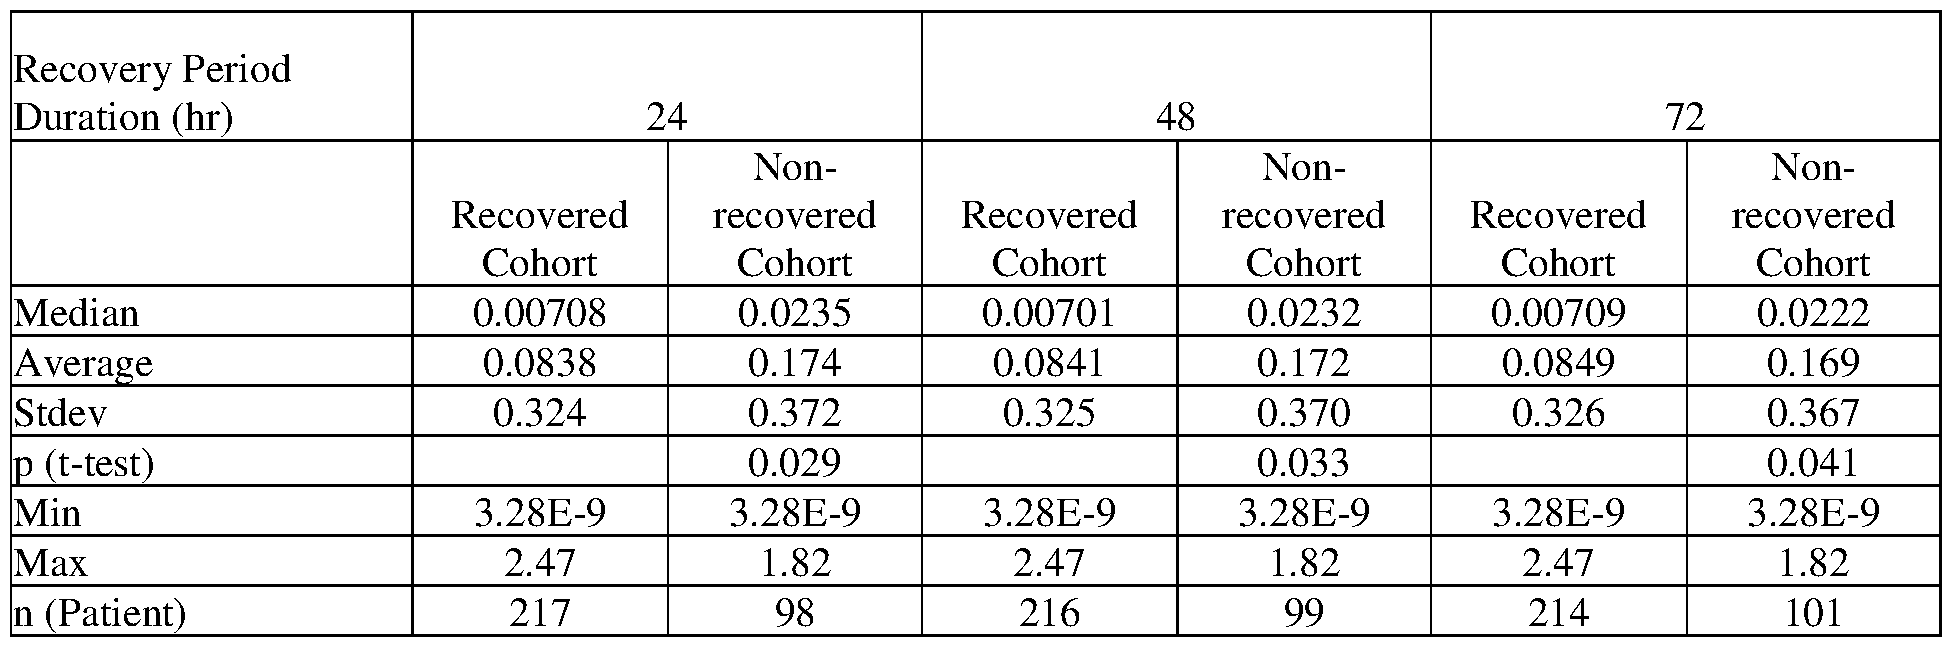
Duration (hr) 24 48 72
sCr or sCr or sCr or
UO sCr only UO only UO sCr only UO only UO sCr only UO only
AUC 0.65 0.71 0.64 0.64 0.71 0.64 0.64 0.71 0.63
SE 0.033 0.030 0.035 0.033 0.030 0.035 0.033 0.030 0.035 p Value 4.7E-6 7.9E-12 6.6E-5 1.1E-5 7.9E-12 7.0E-5 1.5E-5 7.9E-12 1.9E-4 nCohort Recovered 203 185 217 201 185 216 200 185 214 nCohort Non- recovered 114 132 98 116 132 99 117 132 101
Cutoff Quartile 2 0.00202 0.00202 0.00207 0.00202 0.00202 0.00207 0.00202 0.00202 0.00207
Sensitivity 83% 84% 83% 83% 84% 83% 83% 84% 82%
Specificity 30% 31 % 29% 29% 31 % 29% 30% 31 % 29%
Cutoff Quartile 3 0.0104 0.0104 0.0104 0.0104 0.0104 0.0104 0.0104 0.0104 0.0104
Sensitivity 69% 71 % 69% 68% 71 % 69% 68% 71 % 67%
Specificity 61 % 65% 59% 60% 65% 58% 60% 65% 58%
Cutoff Quartile 4 0.0477 0.0477 0.0478 0.0477 0.0477 0.0478 0.0477 0.0477 0.0478
Sensitivity 37% 42% 37% 36% 42% 36% 36% 42% 36%
Specificity 81 % 87% 80% 81 % 87% 80% 81 % 87% 80%
OR Quartile 2 2.10 2.41 1.91 1.99 2.41 1.94 2.03 2.41 1.84 p Value 0.012 0.0021 0.035 0.017 0.0021 0.030 0.015 0.0021 0.043
Lower limit of 95%
CI 1.18 1.38 1.05 1.13 1.38 1.07 1.15 1.38 1.02
Upper limit of 95%
CI 3.74 4.23 3.47 3.52 4.23 3.54 3.59 4.23 3.32
OR Quartile 3 3.47 4.57 3.20 3.23 4.57 3.07 3.12 4.57 2.84 p Value 5.7E-7 7.0E-10 7.1E-6 1.9E-6 7.0E-10 1.3E-5 3.3E-6 7.0E-10 3.8E-5
Lower limit of 95%
CI 2.13 2.82 1.93 1.99 2.82 1.86 1.93 2.82 1.73
Upper limit of 95%
CI 5.65 7.40 5.31 5.23 7.40 5.08 5.04 7.40 4.66
OR Quartile 4 2.53 4.94 2.35 2.43 4.94 2.30 2.39 4.94 2.20 p Value 4.5E-4 1.3E-8 0.0016 7.6E-4 1.3E-8 0.0020 9.7E-4 1.3E-8 0.0033
Lower limit of 95%
CI 1.51 2.85 1.38 1.45 2.85 1.36 1.42 2.85 1.30
Upper limit of 95%
CI 4.26 8.57 3.99 4.09 8.57 3.90 4.00 8.57 3.73
[00410] Example 28. Use of C-C motif chemokine 23 for evaluating renal status in patients admitted to the ICU: Persistent at RIFLE F
[00411] Patients from the intensive care unit (ICU) with RIFLE stage of injury (I) or failure (F) are enrolled in the following study. EDTA anti-coagulated blood samples (10 mL) and urine samples (50 mL) are collected from each patient at enrollment, and at every 12 hours up to day 3, and then every 24 hours thereafter up to day 7 while the subject is hospitalized. C-C motif chemokine 23 is measured in the enrollment samples by standard immunoassay methods using commercially available assay reagents.
[00412] Kidney status is assessed by RIFLE criteria based on serum creatinine, urine output, or both serum creatinine and urine output. Two cohorts are defined to represent a "persistent" and
a "non-persistent" population. "Persistent" indicates those patients whose minimum RIFLE stage during a period of 24, 48 or 72 hours is failure (F) where the persistence period can start from the time of sample collection to 24, 48, 72, 96 or 168 hours after sample collection. "Non- persistent" indicates those patients who are not persistent at failure (F) and whose minimum RIFLE stage during a period of 24, 48 or 72 hours is non-injury (RIFLE 0), risk of injury (R), or injury (I) where the persistence period can start from the time of sample collection to 24, 48, 72, 96 or 168 hours after sample collection. If a patient dies after failure (F) or is placed on renal replacement therapy (RRT) at any time from sample collection to 24, 48, 72, 96 or 168 hours after sample collection, the patient is considered "persistent".
[00413] The ability to distinguish the "persistent" and "non-persistent" cohorts is determined using receiver operating characteristic (ROC) analysis.
[00414] Table 28.1: Comparison of marker levels and the area under the ROC curve (AUC) in urine samples for the "persistent" and "non-persistent" cohorts where persistence starts within 24 hours after sample collection and renal status is assessed by serum creatinine (sCr) only, urine output (UO) only, or serum creatinine or urine output RIFLE criteria.
sCr or UO


UO only
Persistence Period
Duration (hr) 24 48 72
Non-persistent Persistent Non-persistent Persistent Non-persistent Persistent
Cohort Cohort Cohort Cohort Cohort Cohort
Median 0.00870 0.0349 0.00864 0.0832 0.00859 0.0861
Average 0.0897 0.265 0.0887 0.286 0.0884 0.294
Stdev 0.311 0.484 0.309 0.497 0.309 0.502 p (t-test) 0.0023 9.0E-4 6.2E-4
Min 3.28E-9 3.28E-9 3.28E-9 3.28E-9 3.28E-9 3.28E-9
Max 2.47 1.82 2.47 1.82 2.47 1.82 n (Patient) 275 40 278 37 279 36

[00415] Table 28.2: Comparison of marker levels and the area under the ROC curve (AUC) in urine samples for the "persistent" and "non-persistent" cohorts where persistence starts within 48 hours after sample collection and renal status is assessed by serum creatinine (sCr) only, urine output (UO) only, or serum creatinine or urine output RIFLE criteria.
sCr or UO
 sCr only

UO only

 Sensitivity 72% 72% 71 % 76% 75% 75% 74% 74% 76% Specificity 65% 64% 55% 64% 64% 55% 61 % 61 % 55%
Cutoff Quartile 4 0.0477 0.0468 0.0478 0.0477 0.0468 0.0478 0.0477 0.0468 0.0478
Sensitivity 45% 44% 46% 50% 47% 47% 50% 46% 48%
Specificity 89% 87% 80% 88% 87% 80% 86% 84% 80%
OR Quartile 2 2.37 2.51 1.58 2.99 3.16 1.88 2.53 2.84 2.15 p Value 0.0025 0.0017 0.21 5.3E-4 3.7E-4 0.10 0.0042 0.0017 0.061
Lower limit of 95%
CI 1.36 1.41 0.775 1.61 1.68 0.876 1.34 1.48 0.967
Upper limit of 95%
CI 4.16 4.47 3.22 5.54 5.95 4.05 4.78 5.45 4.78
OR Quartile 3 4.73 4.53 2.98 5.72 5.37 3.58 4.52 4.57 3.88 p Value 3.5E-10 1.5E-9 5.0E-4 4.4E-11 2.2E-10 1.3E-4 2.3E-8 1.9E-8 7.2E-5
Lower limit of 95%
CI 2.91 2.78 1.61 3.40 3.20 1.86 2.66 2.69 1.99
Upper limit of 95%
CI 7.68 7.40 5.51 9.60 9.02 6.88 7.66 7.76 7.58
OR Quartile 4 6.44 5.15 3.31 7.37 5.94 3.50 6.06 4.59 3.64 p Value 1.5E-10 5.2E-9 8.2E-5 3.7E-12 2.3E-10 5.5E-5 1.2E-10 3.1E-8 3.6E-5
Lower limit of 95%
CI 3.64 2.97 1.82 4.19 3.43 1.90 3.50 2.68 1.97
Upper limit of 95%
CI 11.4 8.93 6.01 12.9 10.3 6.44 10.5 7.89 6.73
[00416] Table 28.3: Comparison of marker levels and the area under the ROC curve (AUC) in urine samples for the "persistent" and "non-persistent" cohorts where persistence starts within 72 hours after sample collection and renal status is assessed by serum creatinine (sCr) only, urine output (UO) only, or serum creatinine or urine output RIFLE criteria.
sCr or UO

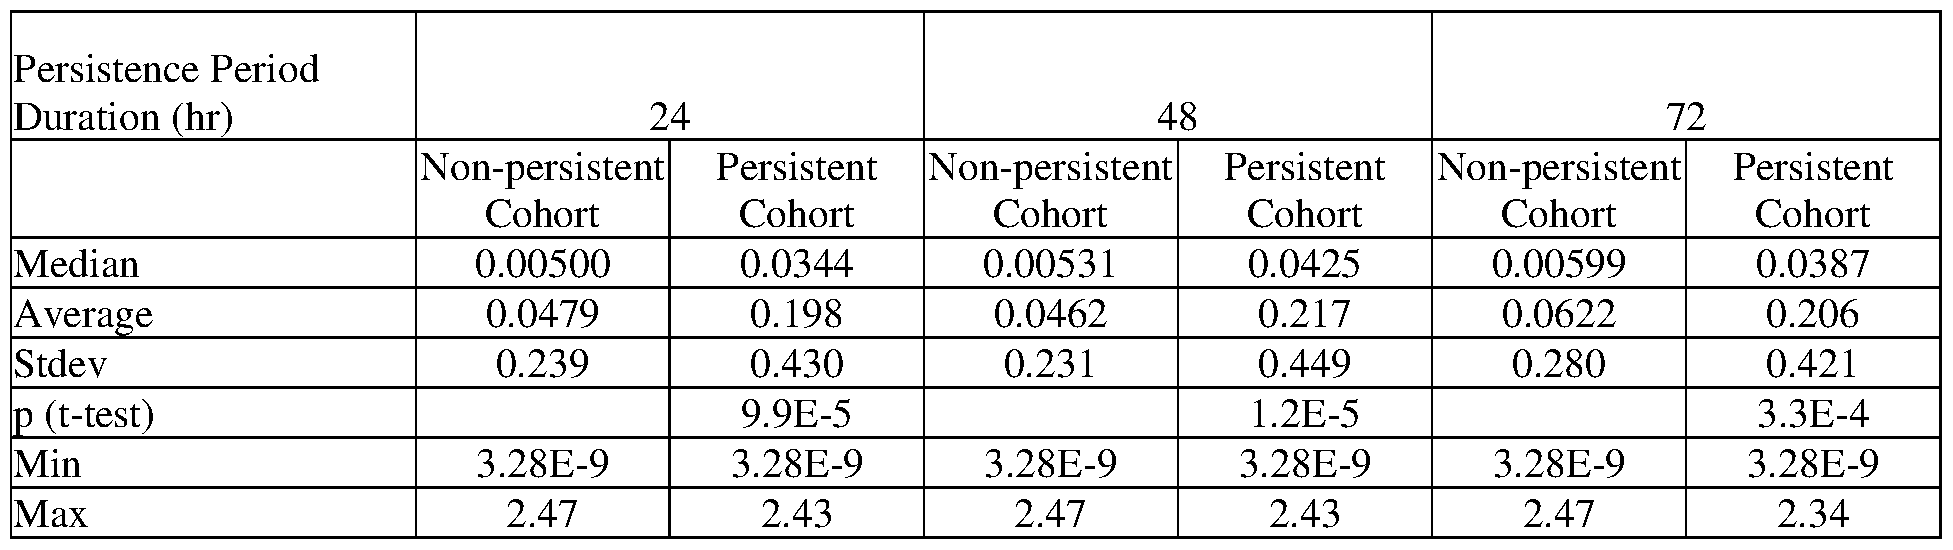
UO only
Persistence Period
Duration (hr) 24 48 72
Non-persistent Persistent Non-persistent Persistent Non-persistent Persistent Cohort Cohort Cohort Cohort Cohort Cohort
Median 0.00765 0.0238 0.00751 0.0272 0.00751 0.0272
Average 0.0863 0.203 0.0849 0.218 0.0849 0.218
Stdev 0.314 0.415 0.311 0.428 0.311 0.428 p (t-test) 0.012 0.0053 0.0053
Min 3.28E-9 3.28E-9 3.28E-9 3.28E-9 3.28E-9 3.28E-9
Max 2.47 1.82 2.47 1.82 2.47 1.82 n (Patient) 246 69 251 64 251 64

sCr or UO


UO only


Cutoff Quartile 2 0.00202 0.00200 0.00207 0.00202 0.00200 0.00207 0.00202 0.00200 0.00207
Sensitivity 84% 85% 83% 87% 87% 86% 86% 87% 86%
Specificity 32% 32% 28% 33% 33% 28% 31 % 31 % 28%
Cutoff Quartile 3 0.0104 0.0104 0.0104 0.0104 0.0104 0.0104 0.0104 0.0104 0.0104
Sensitivity 70% 71 % 67% 75% 74% 71 % 74% 73% 71 %
Specificity 66% 66% 55% 67% 66% 56% 64% 63% 56%
Cutoff Quartile 4 0.0477 0.0468 0.0478 0.0477 0.0468 0.0478 0.0477 0.0468 0.0478
Sensitivity 44% 43% 41 % 48% 47% 43% 47% 46% 43%
Specificity 90% 89% 80% 90% 89% 80% 87% 86% 80%
OR Quartile 2 2.52 2.60 1.85 3.19 3.30 2.35 2.85 2.96 2.35 p Value 9.5E-4 8.2E-4 0.068 1.3E-4 1.1E-4 0.021 7.0E-4 6.0E-4 0.021
Lower limit of 95%
CI 1.46 1.49 0.955 1.76 1.80 1.14 1.56 1.59 1.14
Upper limit of 95%
CI 4.36 4.56 3.58 5.77 6.04 4.86 5.23 5.49 4.86
OR Quartile 3 4.66 4.57 2.52 6.00 5.49 3.17 5.03 4.60 3.17 p Value 2.5E-10 5.6E-10 8.5E-4 2.5E-12 2.6E-11 8.8E-5 3.8E-10 3.2E-9 8.8E-5
Lower limit of 95%
CI 2.89 2.83 1.46 3.63 3.33 1.78 3.03 2.78 1.78
Upper limit of 95%
CI 7.50 7.38 4.33 9.91 9.05 5.65 8.33 7.63 5.65
OR Quartile 4 7.14 6.13 2.74 8.15 7.16 3.00 5.86 5.26 3.00 p Value 1.3E-10 6.6E-10 3.8E-4 2.6E-12 1.9E-11 1.5E-4 3.0E-10 2.5E-9 1.5E-4
Lower limit of 95%
CI 3.92 3.45 1.57 4.53 4.03 1.70 3.38 3.05 1.70
Upper limit of 95%
CI 13.0 10.9 4.78 14.7 12.7 5.29 10.2 9.07 5.29
[00418] Table 28.5: Comparison of marker levels and the area under the ROC curve (AUC) in urine samples for the "persistent" and "non-persistent" cohorts where persistence starts within 168 hours after sample collection and renal status is assessed by serum creatinine (sCr) only, urine output (UO) only, or serum creatinine or urine output RIFLE criteria.
sCr or UO


Median 0.00552 0.0317 0.00552 0.0369 0.00599 0.0351
Average 0.0493 0.190 0.0469 0.206 0.0516 0.215
Stdev 0.243 0.423 0.235 0.438 0.231 0.458 p (t-test) 2.5E-4 3.8E-5 3.5E-5
Min 3.28E-9 3.28E-9 3.28E-9 3.28E-9 3.28E-9 3.28E-9
Max 2.47 2.43 2.47 2.43 2.47 2.43 n (Patient) 176 140 188 128 200 116
UO only
Persistence Period
Duration (hr) 24 48 72
Non-persistent Persistent Non-persistent Persistent Non-persistent Persistent Cohort Cohort Cohort Cohort Cohort Cohort
Median 0.00717 0.0285 0.00722 0.0291 0.00722 0.0291
Average 0.0798 0.205 0.0791 0.212 0.0791 0.212
Stdev 0.312 0.402 0.311 0.409 0.311 0.409 p (t-test) 0.0045 0.0028 0.0028
Min 3.28E-9 3.28E-9 3.28E-9 3.28E-9 3.28E-9 3.28E-9
Max 2.47 1.82 2.47 1.82 2.47 1.82 n (Patient) 234 81 237 78 237 78

CI 3.64 3.20 1.76 4.10 3.72 1.75 3.11 2.80 1.75
Upper limit of 95%
CI 12.0 10.1 5.26 13.2 11.7 5.29 9.30 8.29 5.29
[00419] Example 29. Use of C-C motif chemokine 23 for evaluating renal status in patients admitted to the ICU: Persistent at RIFLE I or F
[00420] Patients from the intensive care unit (ICU) with RIFLE stage of injury (I) or failure (F) are enrolled in the following study. EDTA anti-coagulated blood samples (10 mL) and urine samples (50 mL) are collected from each patient at enrollment, and at every 12 hours up to day 3, and then every 24 hours thereafter up to day 7 while the subject is hospitalized. C-C motif chemokine 23 is measured in the enrollment samples by standard immunoassay methods using commercially available assay reagents.
[00421] Kidney status is assessed by RIFLE criteria based on serum creatinine, urine output, or both serum creatinine and urine output. Two cohorts are defined to represent a "persistent" and a "non-persistent" population. "Persistent" indicates those patients whose minimum RIFLE stage during a period of 24, 48 or 72 hours is injury (I) or failure (F) where the persistence period can start from the time of sample collection to 24, 48, 72, 96 or 168 hours after sample collection. "Non-persistent" indicates those patients who are not persistent at injury (I) or failure (F) and whose minimum RIFLE stage during a period of 24, 48 or 72 hours is non-injury (RIFLE 0) or risk of injury (R) where the persistence period can start from the time of sample collection to 24, 48, 72, 96 or 168 hours after sample collection. If a patient dies after injury (I) or failure (F) or is placed on renal replacement therapy (RRT) at any time from sample collection to 24, 48, 72, 96 or 168 hours after sample collection, the patient is considered "persistent".
[00422] The ability to distinguish the "persistent" and "non-persistent" cohorts is determined using receiver operating characteristic (ROC) analysis.
[00423] Table 29.1: Comparison of marker levels and the area under the ROC curve (AUC) in urine samples for the "persistent" and "non-persistent" cohorts where persistence starts within 24 hours after sample collection and renal status is assessed by serum creatinine (sCr) only, urine output (UO) only, or serum creatinine or urine output RIFLE criteria.
sCr or UO
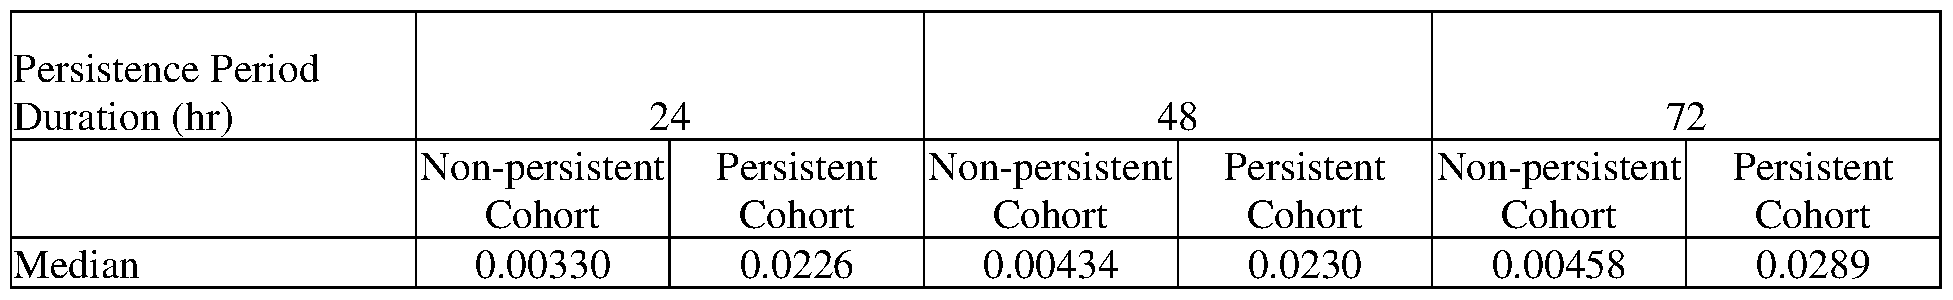
Stdev 0.285 0.365 0.250 0.402 0.239 0.426 p (t-test) 0.0087 8.3E-4 1.7E-4
Min 6.85E-7 3.28E-9 6.85E-7 3.28E-9 3.28E-9 3.28E-9
Max 2.47 2.43 2.47 2.43 2.47 2.43 n (Patient) 119 198 158 159 179 138 sCr only
Persistence Period
Duration (hr) 24 48 72
Non-persistent Persistent Non-persistent Persistent Non-persistent Persistent Cohort Cohort Cohort Cohort Cohort Cohort
Median 0.00367 0.0249 0.00428 0.0259 0.00460 0.0351
Average 0.0479 0.156 0.0473 0.179 0.0487 0.199
Stdev 0.277 0.374 0.250 0.406 0.238 0.433 p (t-test) 0.0055 5.6E-4 9.8E-5
Min 3.28E-9 3.28E-9 3.28E-9 3.28E-9 3.28E-9 3.28E-9
Max 2.47 2.43 2.47 2.43 2.47 2.43 n (Patient) 130 186 162 154 184 132
UO only


CI 1.51 1.62 0.688 1.23 1.40 0.564 1.53 1.62 0.632
Upper limit of 95%
CI 4.28 4.60 2.39 3.50 4.08 2.12 4.68 5.12 2.67
OR Quartile 3 4.56 4.98 1.76 3.35 3.93 2.24 3.54 3.88 2.60 p Value 1.9E-9 1.2E-10 0.037 2.7E-7 9.5E-9 0.0075 1.2E-7 2.3E-8 0.0033
Lower limit of 95%
CI 2.78 3.05 1.03 2.11 2.46 1.24 2.22 2.41 1.38
Upper limit of 95%
CI 7.48 8.12 2.99 5.31 6.27 4.06 5.65 6.24 4.92
OR Quartile 4 11.2 9.42 2.67 4.97 5.75 3.63 5.17 5.60 4.38 p Value 5.0E-8 1.4E-8 5.9E-4 7.8E-8 9.3E-9 2.2E-5 8.7E-9 2.0E-9 3.3E-6
Lower limit of 95%
CI 4.71 4.34 1.53 2.77 3.16 2.00 2.96 3.19 2.35
Upper limit of 95% CI 26.8 20.4 4.68 8.93 10.4 6.59 9.06 9.83 8.17
[00424] Table 29.2: Comparison of marker levels and the area under the ROC curve (AUC) in urine samples for the "persistent" and "non-persistent" cohorts where persistence starts within 48 hours after sample collection and renal status is assessed by serum creatinine (sCr) only, urine output (UO) only, or serum creatinine or urine output RIFLE criteria.
sCr or UO


UO only
 Median 0.00730 0.0215 0.00744 0.0285 0.00737 0.0326
Average 0.0880 0.169 0.0843 0.197 0.0833 0.212
Stdev 0.328 0.367 0.318 0.396 0.314 0.412 p (t-test) 0.055 0.011 0.0053
Min 6.85E-7 3.28E-9 6.85E-7 3.28E-9 3.28E-9 3.28E-9
Max 2.47 1.82 2.47 1.82 2.47 1.82 n (Patient) 222 93 238 77 245 70

[00425] Table 29.3: Comparison of marker levels and the area under the ROC curve (AUC) in urine samples for the "persistent" and "non-persistent" cohorts where persistence starts within 72 hours after sample collection and renal status is assessed by serum creatinine (sCr) only, urine output (UO) only, or serum creatinine or urine output RIFLE criteria.
 Non-persistent Persistent Non-persistent Persistent Non-persistent Persistent Cohort Cohort Cohort Cohort Cohort Cohort
Median 0.00321 0.0217 0.00424 0.0232 0.00424 0.0285
Average 0.0488 0.145 0.0472 0.164 0.0478 0.174
Stdev 0.295 0.359 0.261 0.388 0.252 0.401 p (t-test) 0.016 0.0022 8.8E-4
Min 6.85E-7 3.28E-9 6.85E-7 3.28E-9 3.28E-9 3.28E-9
Max 2.47 2.43 2.47 2.43 2.47 2.43 n (Patient) 111 206 144 173 158 159 sCr only
Persistence Period
Duration (hr) 24 48 72
Non-persistent Persistent Non-persistent Persistent Non-persistent Persistent Cohort Cohort Cohort Cohort Cohort Cohort
Median 0.00352 0.0235 0.00427 0.0259 0.00427 0.0293
Average 0.0493 0.152 0.0490 0.169 0.0500 0.177
Stdev 0.283 0.369 0.259 0.394 0.252 0.407 p (t-test) 0.0091 0.0018 8.9E-4
Min 3.28E-9 3.28E-9 3.28E-9 3.28E-9 3.28E-9 3.28E-9
Max 2.47 2.43 2.47 2.43 2.47 2.43 n (Patient) 124 192 151 165 163 153
UO only

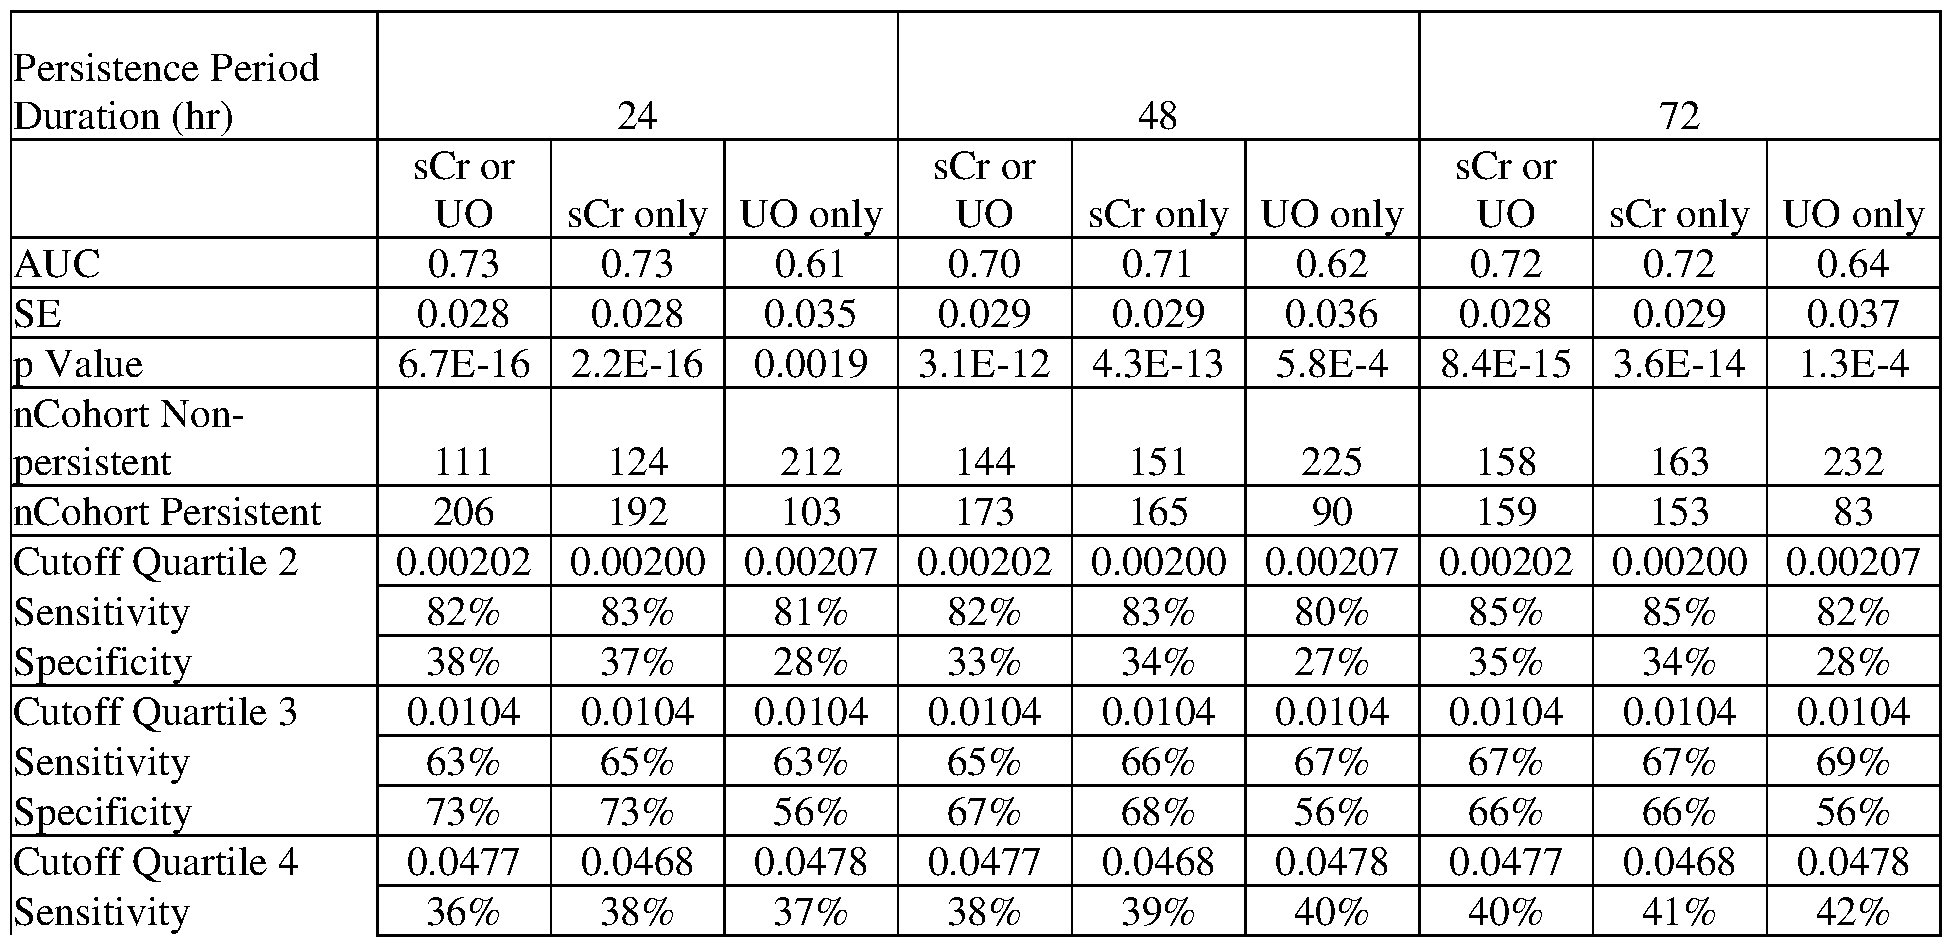
OR Quartile 2 2.78 2.84 1.60 2.29 2.50 1.49 3.00 2.96 1.73 p Value 1.3E-4 9.0E-5 0.11 0.0018 6.9E-4 0.19 7.4E-5 1.1E-4 0.089
Lower limit of 95%
CI 1.65 1.68 0.902 1.36 1.47 0.821 1.74 1.71 0.921
Upper limit of 95%
CI 4.69 4.79 2.84 3.85 4.23 2.70 5.17 5.12 3.24
OR Quartile 3 4.52 4.83 2.19 3.79 4.05 2.59 3.96 4.05 2.84 p Value 4.7E-9 3.9E-10 0.0015 2.3E-8 5.0E-9 2.6E-4 7.4E-9 5.0E-9 1.2E-4
Lower limit of 95%
CI 2.73 2.95 1.35 2.37 2.54 1.55 2.48 2.53 1.67
Upper limit of 95%
CI 7.50 7.90 3.55 6.05 6.48 4.32 6.32 6.46 4.84
OR Quartile 4 12.1 10.0 2.44 5.73 5.75 2.82 5.98 5.85 3.12 p Value 2.0E-7 3.2E-8 8.9E-4 5.9E-8 3.0E-8 1.5E-4 7.4E-9 6.6E-9 4.4E-5
Lower limit of 95%
CI 4.74 4.43 1.44 3.05 3.10 1.65 3.26 3.22 1.81
Upper limit of 95%
CI 31.1 22.7 4.12 10.8 10.7 4.83 11.0 10.6 5.38
[00426] Table 29.4: Comparison of marker levels and the area under the ROC curve (AUC) in urine samples for the "persistent" and "non-persistent" cohorts where persistence starts within 96 hours after sample collection and renal status is assessed by serum creatinine (sCr) only, urine output (UO) only, or serum creatinine or urine output RIFLE criteria.
sCr or UO


UO only
Persistence Period
Duration (hr) 24 48 72
Non-persistent Persistent Non-persistent Persistent Non-persistent Persistent
Cohort Cohort Cohort Cohort Cohort Cohort
Median 0.00710 0.0207 0.00717 0.0222 0.00717 0.0232
Average 0.0925 0.150 0.0897 0.163 0.0888 0.170
Stdev 0.339 0.345 0.330 0.363 0.326 0.373 p (t-test) 0.16 0.079 0.056
Min 6.85E-7 3.28E-9 6.85E-7 3.28E-9 3.28E-9 3.28E-9
Max 2.47 1.82 2.47 1.82 2.47 1.82 n (Patient) 208 107 220 95 226 89

[00427] Table 29.5: Comparison of marker levels and the area under the ROC curve (AUC) in urine samples for the "persistent" and "non-persistent" cohorts where persistence starts within 168 hours after sample collection and renal status is assessed by serum creatinine (sCr) only, urine output (UO) only, or serum creatinine or urine output RIFLE criteria.
sCr or UO
 sCr only

UO only

 Sensitivity 63% 65% 65% 64% 66% 67% 65% 68% 68% Specificity 75% 74% 58% 68% 69% 58% 67% 68% 58%
Cutoff Quartile 4 0.0477 0.0468 0.0478 0.0477 0.0468 0.0478 0.0477 0.0468 0.0478
Sensitivity 36% 37% 35% 37% 38% 37% 38% 39% 38%
Specificity 95% 94% 81 % 90% 90% 81 % 89% 89% 81 %
OR Quartile 2 3.09 3.01 1.92 2.55 2.72 1.75 2.96 3.22 1.91 p Value 2.7E-5 3.8E-5 0.025 4.5E-4 2.1E-4 0.060 7.1E-5 3.0E-5 0.035
Lower limit of 95%
CI 1.82 1.78 1.08 1.51 1.60 0.976 1.73 1.86 1.05
Upper limit of 95%
CI 5.23 5.09 3.39 4.29 4.62 3.12 5.06 5.58 3.47
OR Quartile 3 4.89 5.42 2.51 3.84 4.45 2.80 3.76 4.40 2.99 p Value 2.0E-9 4.6E-11 1.5E-4 2.1E-8 6.8E-10 4.1E-5 2.5E-8 7.3E-10 2.0E-5
Lower limit of 95%
CI 2.91 3.28 1.56 2.40 2.77 1.71 2.36 2.75 1.81
Upper limit of 95%
CI 8.21 8.97 4.04 6.15 7.15 4.59 5.99 7.05 4.95
OR Quartile 4 11.1 9.53 2.29 5.17 5.27 2.44 5.20 5.36 2.53 p Value 5.2E-7 6.3E-8 0.0018 3.2E-7 1.3E-7 8.9E-4 9.1E-8 3.4E-8 6.0E-4
Lower limit of 95%
CI 4.35 4.21 1.36 2.75 2.84 1.44 2.84 2.95 1.49
Upper limit of 95%
CI 28.6 21.6 3.85 9.72 9.78 4.12 9.53 9.72 4.29
[00428] Example 30. Use of C-C motif chemokine 24 for evaluating renal status in patients admitted to the ICU: Recovery to RIFLE 0 from RIFLE I and F
[00429] Patients from the intensive care unit (ICU) with RIFLE stage of injury (I) or failure (F) are enrolled in the following study. EDTA anti-coagulated blood samples (10 mL) and urine samples (50 mL) are collected from each patient at enrollment, and at every 12 hours up to day 3, and then every 24 hours thereafter up to day 7 while the subject is hospitalized. C-C motif chemokine 24 is measured in the enrollment samples by standard immunoassay methods using commercially available assay reagents.
[00430] Kidney status is assessed by RIFLE criteria based on serum creatinine, urine output, or both serum creatinine and urine output. Two cohorts are defined to represent a "recovered" and a "non-recovered" population. "Recovered" indicates those patients whose maximum RIFLE stage during a period of 24, 48 or 72 hours is non-injury (RIFLE 0) where the recovery period can start from the time of sample collection to 24, 48, 72, 96 or 168 hours after sample collection. "Non-recovered" indicates those patients whose maximum RIFLE stage during a period of 24, 48 or 72 hours is risk of injury (R), injury (I) or failure (F) where the recovery period can start from the time of sample collection to 24, 48, 72, 96 or 168 hours after sample collection. If a patient dies or is placed on renal replacement therapy (RRT) at any time from sample collection to 24, 48, 72, 96 or 168 hours after sample collection, the patient is considered "non-recovered".
[00431] The ability to distinguish the "recovered" and "non-recovered" cohorts is determined using receiver operating characteristic (ROC) analysis.
[00432] Table 30.1: Comparison of marker levels and the area under the ROC curve (AUC) in urine samples for the "recovered" and "non-recovered" cohorts where recovery starts within 24 hours after sample collection and renal status is assessed by serum creatinine (sCr) only, urine output (UO) only, or serum creatinine or urine output RIFLE criteria.
sCr or UO


UO only

Duration (hr) 24 48 72
sCr or sCr or sCr or
UO sCr only UO only UO sCr only UO only UO sCr only UO only
AUC 0.65 0.62 0.66 0.64 0.63 0.66 0.63 0.65 0.64
SE 0.037 0.035 0.032 0.041 0.035 0.031 0.043 0.035 0.031 p Value 8.8E-5 4.2E-4 3.1E-7 8.5E-4 1.5E-4 1.3E-7 0.0027 1.7E-5 8.6E-6 nCohort Recovered 57 76 193 46 74 172 41 70 155 nCohort Non- recovered 259 239 121 270 241 142 275 245 159
Cutoff Quartile 2 4.17 4.15 4.13 4.17 4.15 4.13 4.17 4.15 4.13
Sensitivity 78% 79% 87% 77% 79% 85% 77% 79% 82%
Specificity 40% 37% 33% 39% 38% 34% 39% 40% 33%
Cutoff Quartile 3 29.6 29.3 28.8 29.6 29.3 28.8 29.6 29.3 28.8
Sensitivity 54% 55% 65% 53% 56% 63% 53% 56% 60%
Specificity 68% 66% 60% 67% 68% 61 % 68% 70% 61 %
Cutoff Quartile 4 74.9 74.4 74.6 74.9 74.4 74.6 74.9 74.4 74.6
Sensitivity 28% 28% 39% 27% 28% 36% 27% 28% 35%
Specificity 88% 84% 83% 87% 85% 84% 85% 86% 85%
OR Quartile 2 2.45 2.15 3.18 2.20 2.27 2.93 2.15 2.54 2.29 p Value 0.0037 0.0073 1.8E-4 0.019 0.0043 1.7E-4 0.029 0.0013 0.0021
Lower limit of 95%
CI 1.34 1.23 1.73 1.14 1.29 1.67 1.08 1.44 1.35
Upper limit of 95% CI 4.50 3.76 5.83 4.25 3.98 5.14 4.28 4.48 3.89
OR Quartile 3 2.55 2.37 2.77 2.33 2.61 2.71 2.40 2.96 2.35 p Value 0.0026 0.0017 2.3E-5 0.012 6.2E-4 2.0E-5 0.014 1.9E-4 2.2E-4
Lower limit of 95%
CI 1.39 1.39 1.73 1.20 1.51 1.71 1.19 1.67 1.49
Upper limit of 95% CI 4.69 4.06 4.45 4.51 4.52 4.29 4.83 5.23 3.69
OR Quartile 4 2.75 2.08 3.20 2.47 2.25 2.88 2.11 2.35 2.89 p Value 0.018 0.035 1.5E-5 0.049 0.023 9.2E-5 0.11 0.021 1.3E-4
Lower limit of 95%
CI 1.19 1.05 1.89 1.01 1.12 1.70 0.852 1.14 1.68
Upper limit of 95% CI 6.35 4.09 5.41 6.07 4.53 4.90 5.22 4.86 4.97
[00433] Table 30.2: Comparison of marker levels and the area under the ROC curve (AUC) in urine samples for the "recovered" and "non-recovered" cohorts where recovery starts within 48 hours after sample collection and renal status is assessed by serum creatinine (sCr) only, urine output (UO) only, or serum creatinine or urine output RIFLE criteria.
sCr or UO


UO only

 Lower limit of 95%
CI 1.47 1.39 1.63 1.22 1.48 1.55 1.26 1.65 1.36
Upper limit of 95% CI 4.06 3.63 4.35 3.48 3.91 3.95 3.78 4.47 3.37
OR Quartile 4 4.70 2.95 3.75 3.80 3.16 3.20 3.81 3.65 3.16 p Value 9.9E-5 8.4E-4 1.2E-6 8.3E-4 5.1E-4 1.5E-5 0.0015 2.3E-4 2.3E-5
Lower limit of 95%
CI 2.16 1.56 2.20 1.74 1.65 1.89 1.66 1.83 1.85
Upper limit of 95% CI 10.2 5.55 6.39 8.30 6.06 5.41 8.70 7.27 5.37
[00434] Table 30.3: Comparison of marker levels and the area under the ROC curve (AUC) in urine samples for the "recovered" and "non-recovered" cohorts where recovery starts within 72 hours after sample collection and renal status is assessed by serum creatinine (sCr) only, urine output (UO) only, or serum creatinine or urine output RIFLE criteria.
sCr or UO


UO only

Max 1140 1150 1140 1150 1140 1150 n (Patient) 213 101 203 111 189 125

[00435] Table 30.4: Comparison of marker levels and the area under the ROC curve (AUC) in urine samples for the "recovered" and "non-recovered" cohorts where recovery starts within 96 hours after sample collection and renal status is assessed by serum creatinine (sCr) only, urine output (UO) only, or serum creatinine or urine output RIFLE criteria.
sCr or UO

Min 0.00127 0.00127 0.00127 0.00127 0.00127 0.00127
Max 1070 1150 1070 1150 670 1150 n (Patient) 134 182 125 191 114 202 sCr only
Recovery Period
Duration (hr) 24 48 72
Non- Non- Non-
Recovered recovered Recovered recovered Recovered recovered Cohort Cohort Cohort Cohort Cohort Cohort
Median 17.2 40.6 16.4 40.6 15.8 41.4
Average 51.7 92.3 51.8 91.8 49.7 92.7
Stdev 119 163 120 162 120 161 p (t-test) 0.014 0.016 0.0097
Min 0.00127 0.00127 0.00127 0.00127 0.00127 0.00127
Max 1070 1150 1070 1150 1070 1150 n (Patient) 140 176 138 178 135 181
UO only


OR Quartile 3 2.20 2.30 3.32 2.06 2.31 2.85 2.31 2.52 2.62 p Value 7.0E-4 3.2E-4 3.6E-6 0.0020 3.2E-4 2.5E-5 5.0E-4 8.1E-5 6.0E-5
Lower limit of 95% CI 1.39 1.46 2.00 1.30 1.46 1.75 1.44 1.59 1.64 Upper limit of 95% CI 3.47 3.62 5.51 3.26 3.64 4.63 3.71 3.98 4.19
OR Quartile 4 2.73 2.57 3.82 2.35 2.69 3.36 3.06 3.30 3.20 p Value 5.1E-4 8.4E-4 9.2E-7 0.0033 5.3E-4 7.1E-6 3.9E-4 6.1E-5 1.5E-5
Lower limit of 95% CI 1.55 1.48 2.24 1.33 1.54 1.98 1.65 1.84 1.89 Upper limit of 95% CI 4.82 4.47 6.52 4.14 4.72 5.70 5.68 5.93 5.41
[00436] Table 30.5: Comparison of marker levels and the area under the ROC curve (AUC) in urine samples for the "recovered" and "non-recovered" cohorts where recovery starts within 168 hours after sample collection and renal status is assessed by serum creatinine (sCr) only, urine output (UO) only, or serum creatinine or urine output RIFLE criteria.
sCr or UO


UO only

Min 0.00127 0.00127 0.00127 0.00127 0.00127 0.00127
Max 1140 1150 1140 1150 1140 1150 n (Patient) 210 104 207 107 204 110
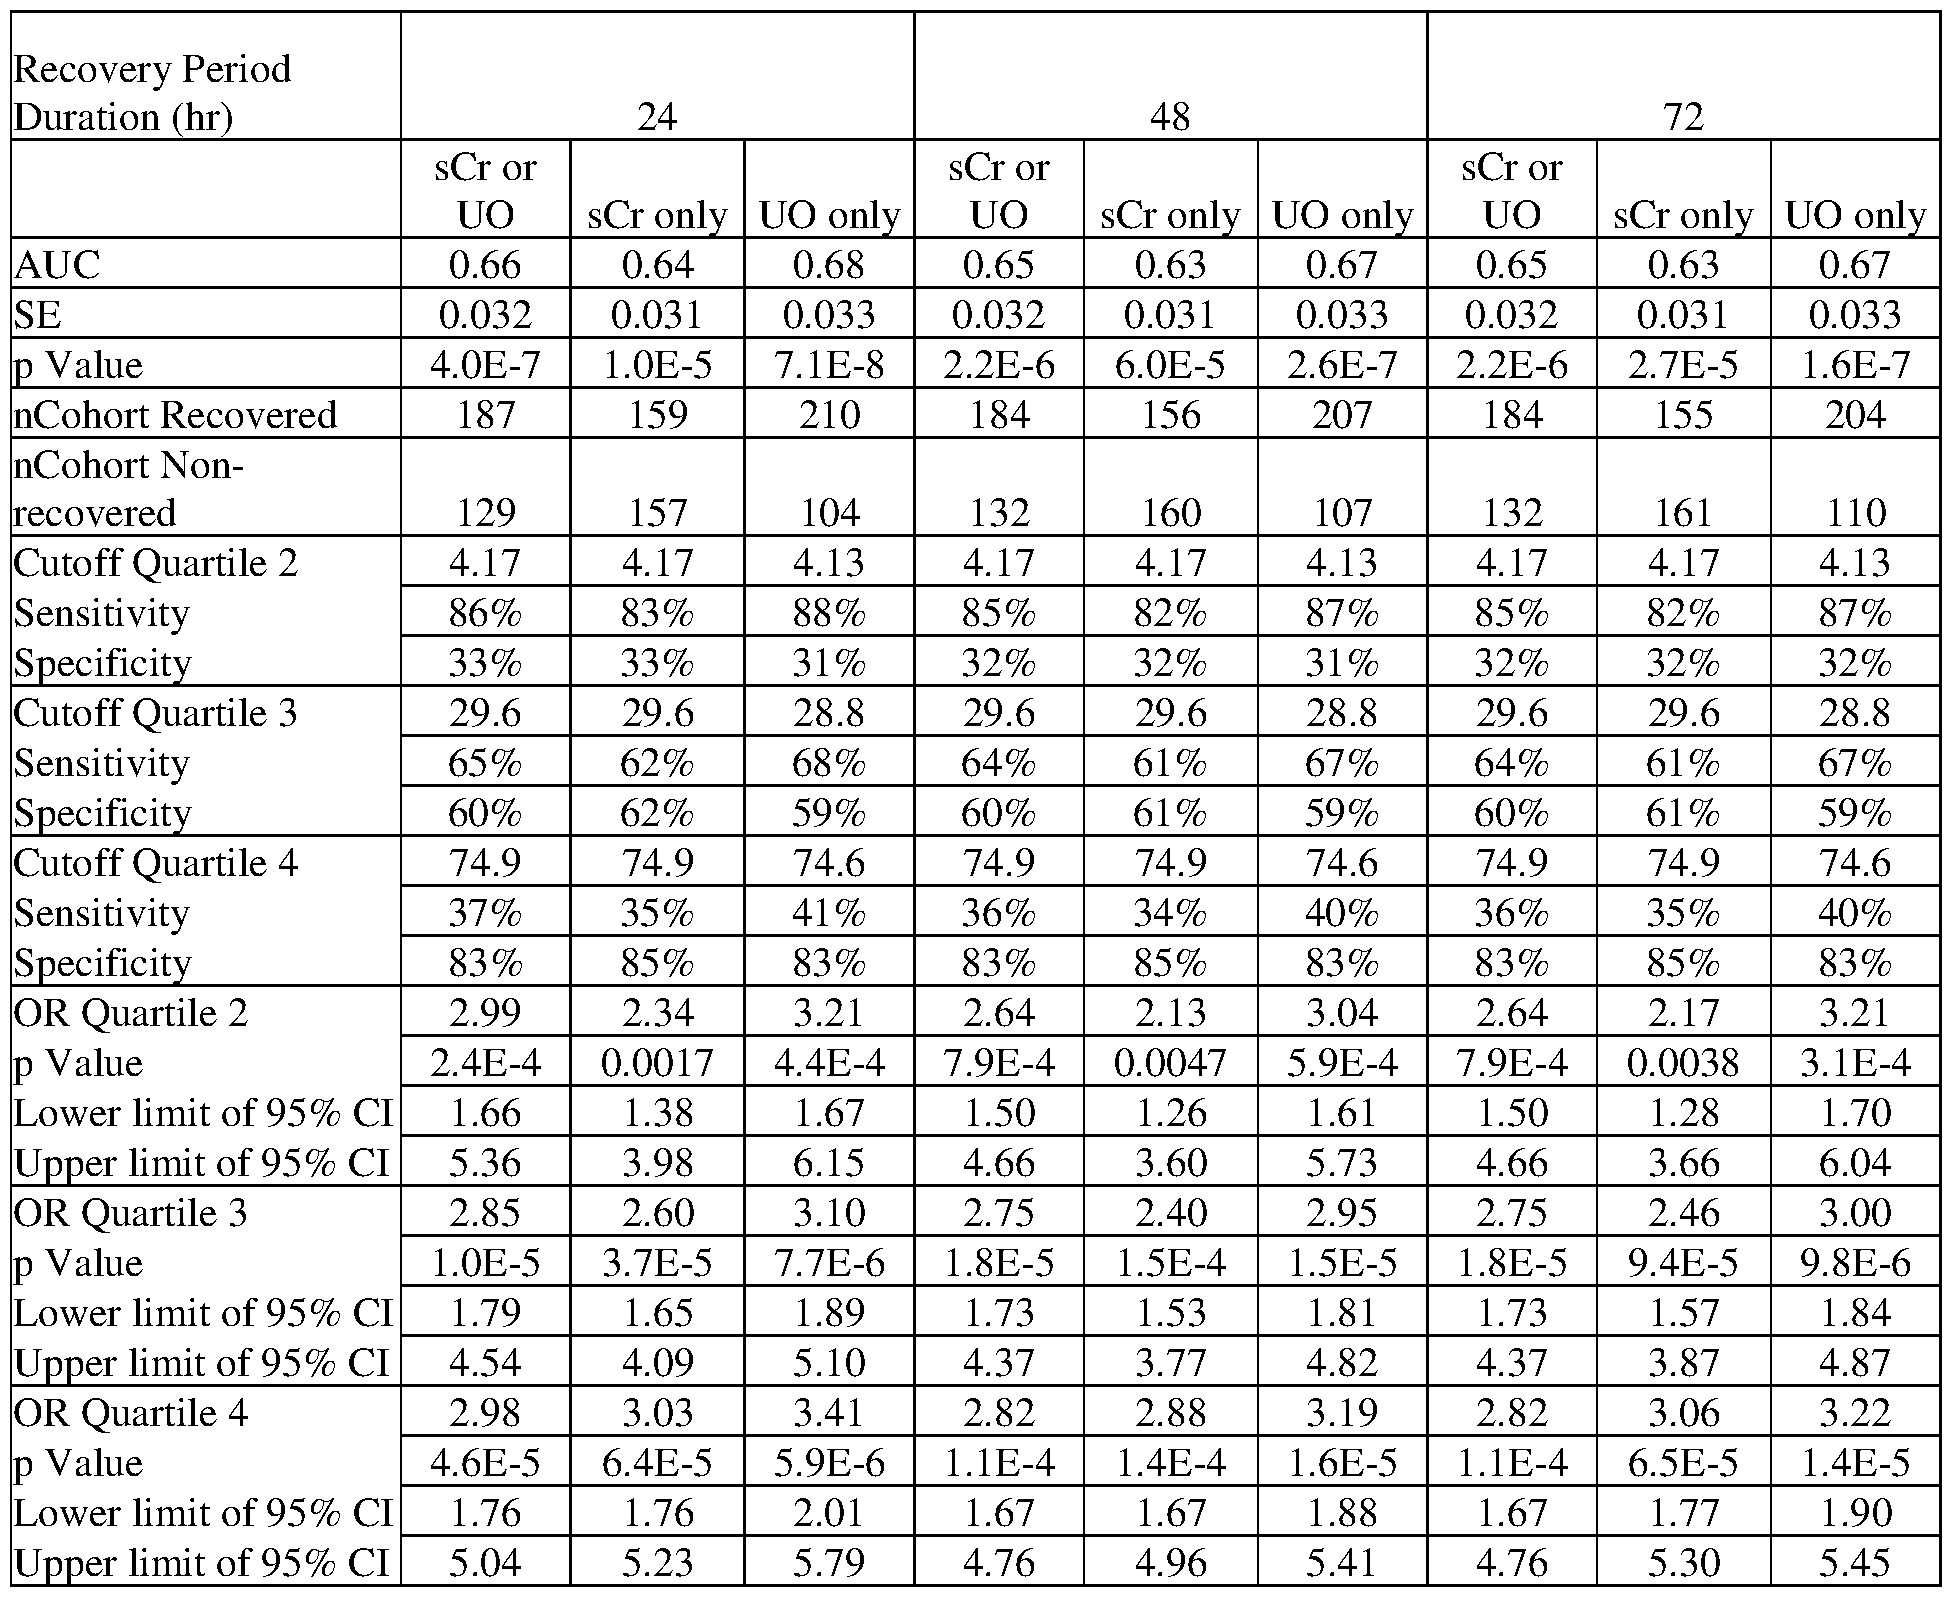
[00437] Table 30.6: Comparison of marker levels and the area under the ROC curve (AUC) in EDTA samples for the "recovered" and "non-recovered" cohorts where recovery starts within 24 hours after sample collection and renal status is assessed by serum creatinine (sCr) only, urine output (UO) only, or serum creatinine or urine output RIFLE criteria.
sCr or UO

Recovery Period
Duration (hr) 24 48 72
Non- Non- Non-
Recovered recovered Recovered recovered Recovered recovered Cohort Cohort Cohort Cohort Cohort Cohort
Median 330 374 287 375 304 374
Average 428 535 423 535 433 531
Stdev 402 536 408 534 422 530 p (t-test) 0.32 0.30 0.38
Min 46.8 50.8 46.8 50.8 46.8 50.8
Max 1880 4690 1880 4690 1880 4690 n (Patient) 29 121 28 122 26 124
UO only
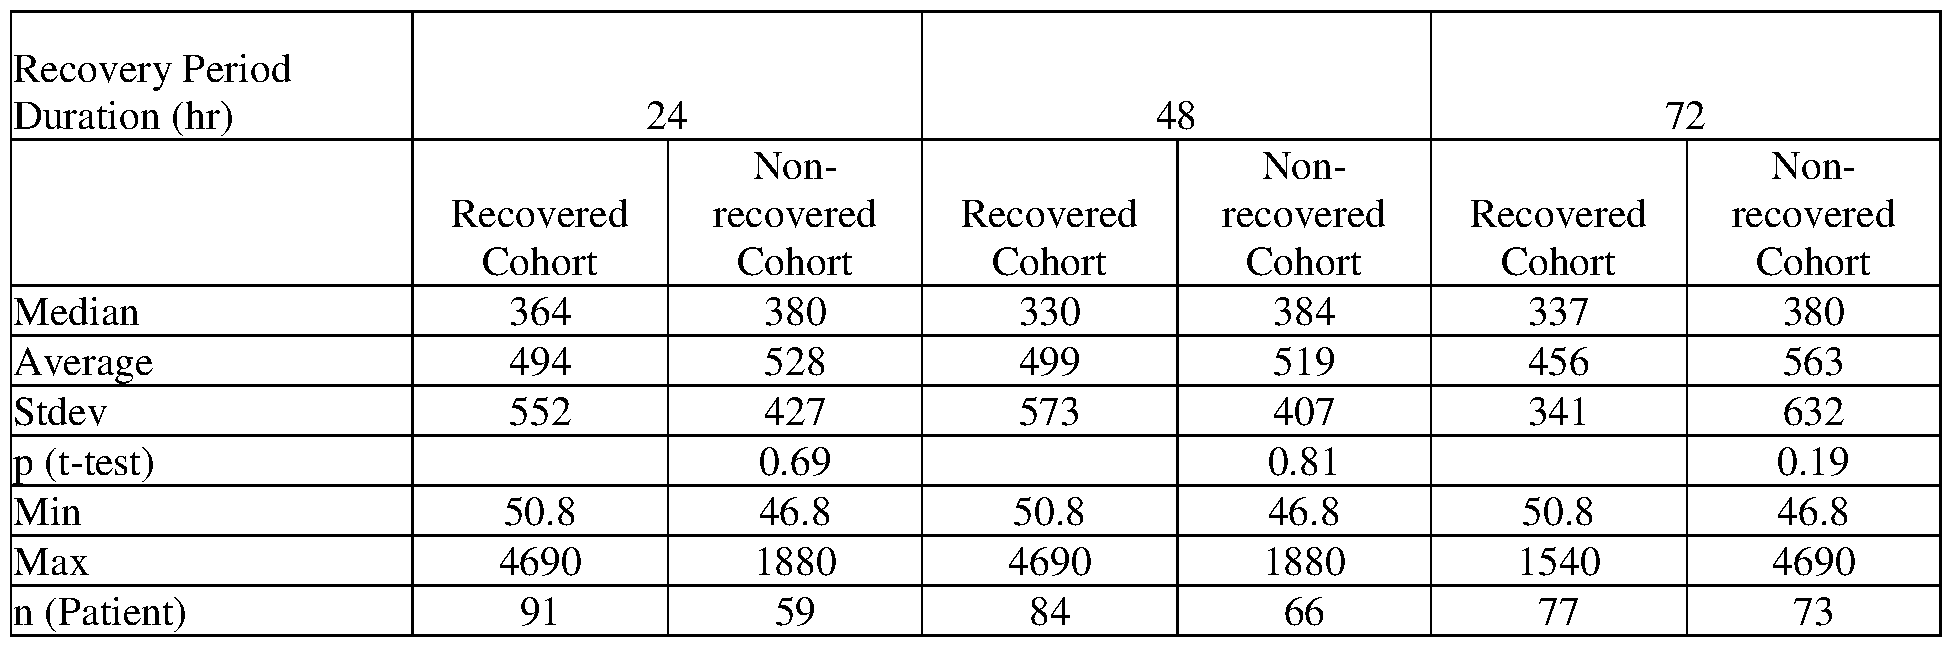

Lower limit of 95% CI 0.572 0.573 0.614 0.559 0.622 0.651 0.437 0.516 0.618 Upper limit of 95% CI 3.22 2.92 2.28 3.59 3.26 2.37 3.00 2.81 2.23
OR Quartile 4 1.94 1.38 1.35 1.51 1.30 1.04 1.30 1.16 1.07 p Value 0.25 0.52 0.43 0.49 0.60 0.92 0.66 0.77 0.85
Lower limit of 95% CI 0.621 0.515 0.640 0.473 0.485 0.496 0.404 0.428 0.514 Upper limit of 95% CI 6.06 3.69 2.84 4.79 3.50 2.18 4.19 3.14 2.24
[00438] Table 30.7: Comparison of marker levels and the area under the ROC curve (AUC) in EDTA samples for the "recovered" and "non-recovered" cohorts where recovery starts within 48 hours after sample collection and renal status is assessed by serum creatinine (sCr) only, urine output (UO) only, or serum creatinine or urine output RIFLE criteria.
sCr or UO


UO only

Max 4690 1880 4690 1880 1540 4690 n (Patient) 100 50 93 57 85 65

[00439] Table 30.8: Comparison of marker levels and the area under the ROC curve (AUC) in EDTA samples for the "recovered" and "non-recovered" cohorts where recovery starts within 72 hours after sample collection and renal status is assessed by serum creatinine (sCr) only, urine output (UO) only, or serum creatinine or urine output RIFLE criteria.
sCr or UO


UO only

 Lower limit of 95% CI 0.518 0.660 0.815 0.653 0.740 0.909 0.647 0.785 0.725 Upper limit of 95% CI 2.01 2.51 3.17 2.62 2.85 3.47 2.76 3.10 2.66
OR Quartile 4 1.29 1.51 1.78 1.31 1.66 1.52 1.22 1.77 1.29 p Value 0.53 0.31 0.13 0.52 0.23 0.28 0.65 0.19 0.50
Lower limit of 95% CI 0.581 0.679 0.838 0.575 0.732 0.717 0.518 0.761 0.616 Upper limit of 95% CI 2.88 3.35 3.79 2.98 3.75 3.20 2.86 4.10 2.71
[00440] Table 30.9: Comparison of marker levels and the area under the ROC curve (AUC) in EDTA samples for the "recovered" and "non-recovered" cohorts where recovery starts within 96 hours after sample collection and renal status is assessed by serum creatinine (sCr) only, urine output (UO) only, or serum creatinine or urine output RIFLE criteria.
sCr or UO


UO only


[00441] Table 30.10: Comparison of marker levels and the area under the ROC curve (AUC) in EDTA samples for the "recovered" and "non-recovered" cohorts where recovery starts within 168 hours after sample collection and renal status is assessed by serum creatinine (sCr) only, urine output (UO) only, or serum creatinine or urine output RIFLE criteria.
sCr or UO


UO only

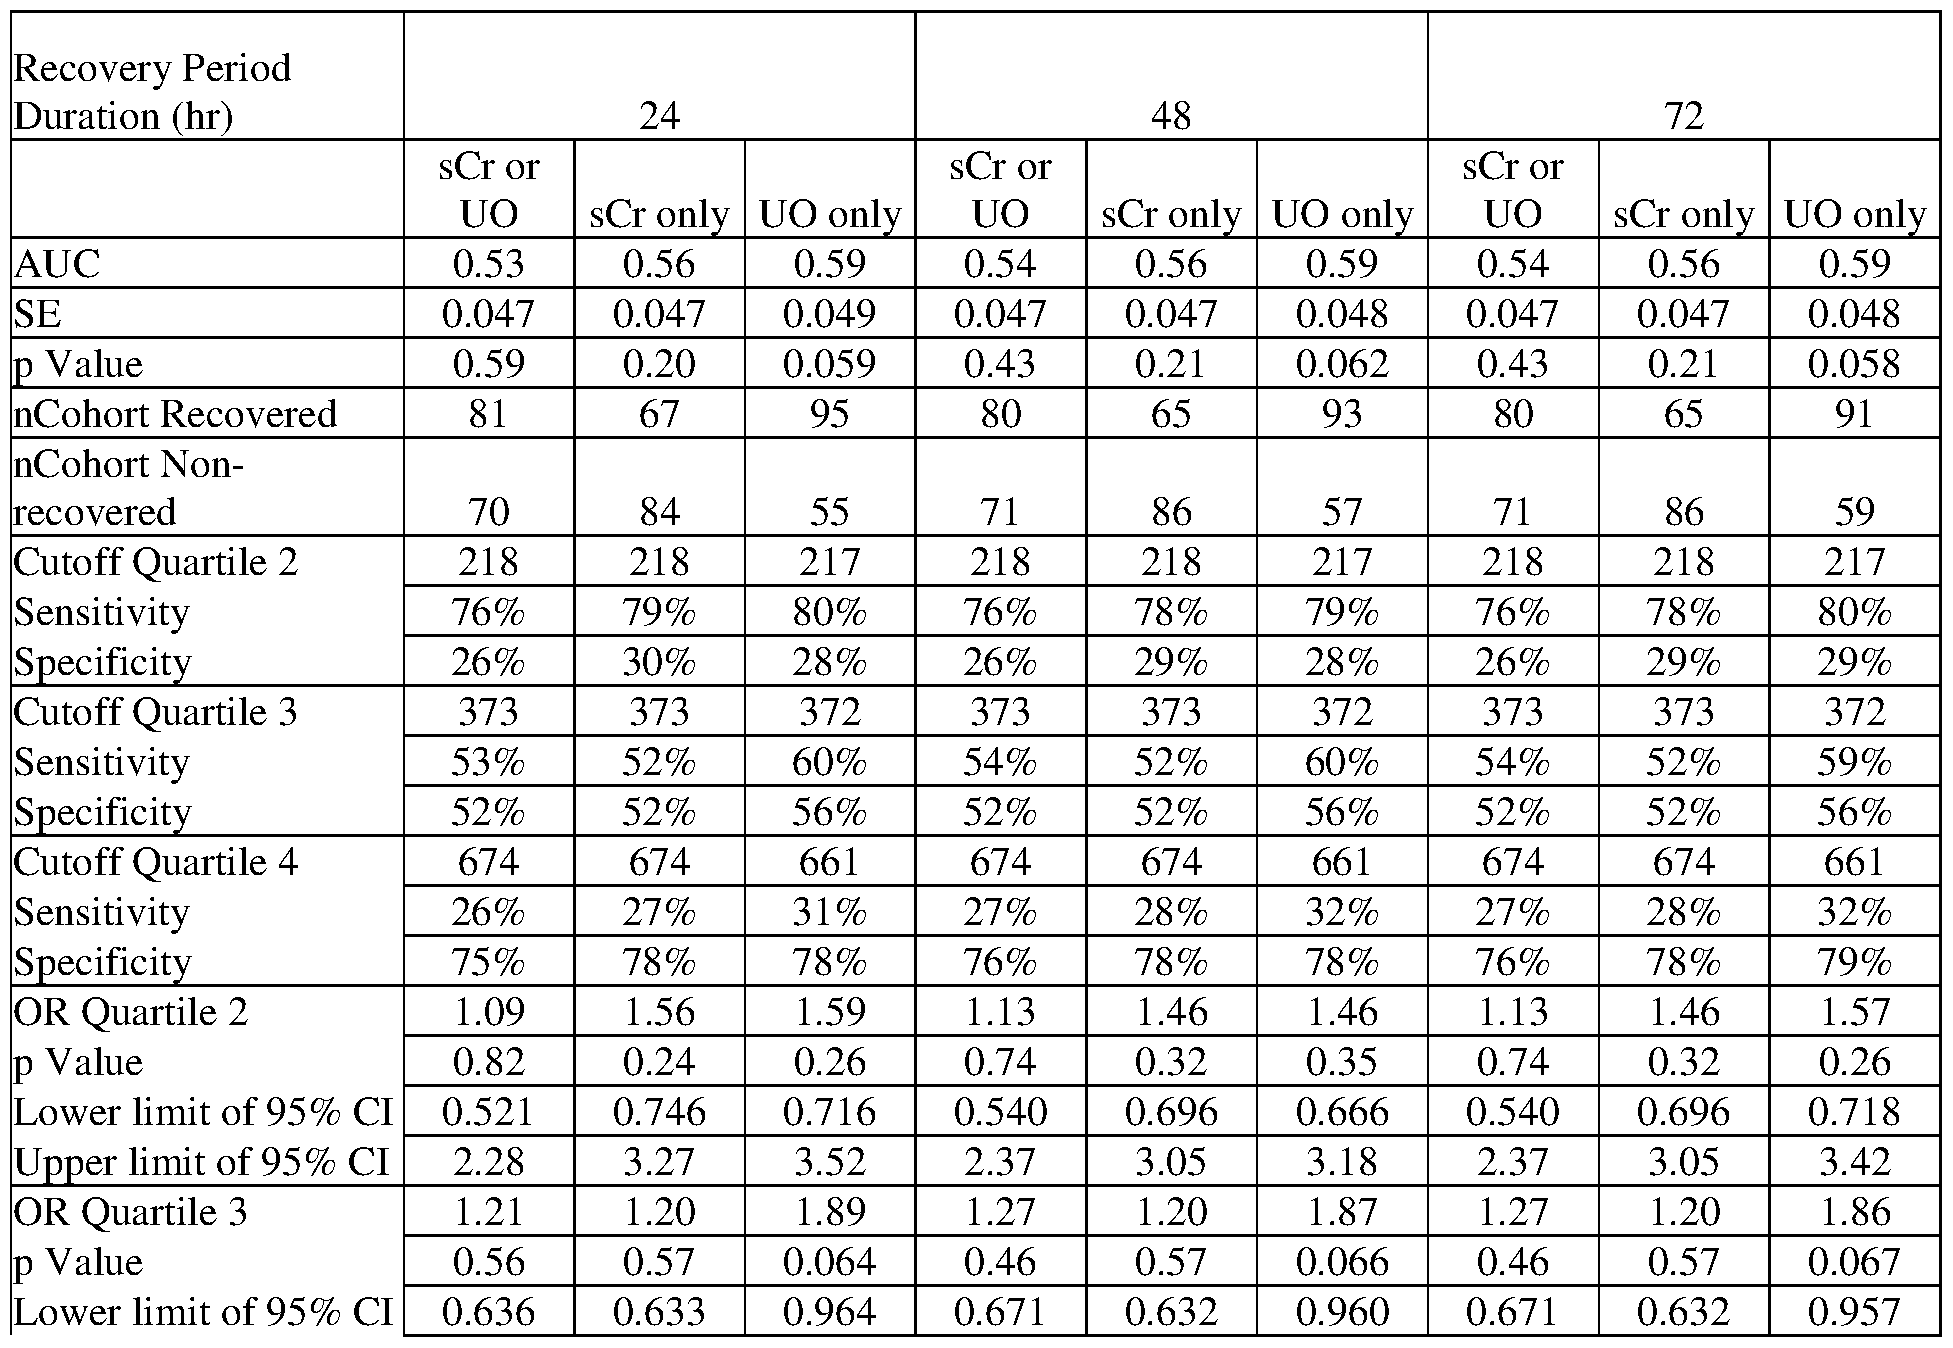 Upper limit of 95% CI 2.29 2.29 3.72 2.41 2.29 3.66 2.41 2.29 3.61
OR Quartile 4 1.06 1.31 1.58 1.17 1.41 1.68 1.17 1.41 1.80 p Value 0.89 0.48 0.23 0.67 0.37 0.17 0.67 0.37 0.12
Lower limit of 95% CI 0.506 0.618 0.745 0.562 0.662 0.799 0.562 0.662 0.855
Upper limit of 95% CI 2.20 2.76 3.34 2.45 3.00 3.55 2.45 3.00 3.79
[00442] Example 31. Use of C-C motif chemokine 24 for evaluating renal status in patients admitted to the ICU: Recovery to RIFLE 0 and R from RIFLE I and F
[00443] Patients from the intensive care unit (ICU) with RIFLE stage of injury (I) or failure (F) are enrolled in the following study. EDTA anti-coagulated blood samples (10 mL) and urine samples (50 mL) are collected from each patient at enrollment, and at every 12 hours up to day 3, and then every 24 hours thereafter up to day 7 while the subject is hospitalized. C-C motif chemokine 24 is measured in the enrollment samples by standard immunoassay methods using commercially available assay reagents.
[00444] Kidney status is assessed by RIFLE criteria based on serum creatinine, urine output, or both serum creatinine and urine output. Two cohorts are defined to represent a "recovered" and a "non-recovered" population. "Recovered" indicates those patients whose maximum RIFLE stage during a period of 24, 48 or 72 hours is non-injury (RIFLE 0) or risk of injury (R) where the recovery period can start from the time of sample collection to 24, 48, 72, 96 or 168 hours after sample collection. "Non-recovered" indicates those patients whose maximum RIFLE stage during a period of 24, 48 or 72 hours is injury (I) or failure (F) where the recovery period can start from the time of sample collection to 24, 48, 72, 96 or 168 hours after sample collection. If a patient dies or is placed on renal replacement therapy (RRT) at any time from sample collection to 24, 48, 72, 96 or 168 hours after sample collection, the patient is considered "non- recovered".
[00445] The ability to distinguish the "recovered" and "non-recovered" cohorts is determined using receiver operating characteristic (ROC) analysis.
[00446] Table 31.1: Comparison of marker levels and the area under the ROC curve (AUC) in urine samples for the "recovered" and "non-recovered" cohorts where recovery starts within 24 hours after sample collection and renal status is assessed by serum creatinine (sCr) only, urine output (UO) only, or serum creatinine or urine output RIFLE criteria.
sCr or UO

Stdev 87.7 166 88.2 165 89.4 164 p (t-test) 0.0035 0.0029 0.0044
Min 0.00127 0.00127 0.00127 0.00127 0.00127 0.00127
Max 670 1150 670 1150 670 1150 n (Patient) 107 209 103 213 100 216 sCr only
Recovery Period
Duration (hr) 24 48 72
Non- Non- Non-
Recovered recovered Recovered recovered Recovered recovered Cohort Cohort Cohort Cohort Cohort Cohort
Median 15.8 39.8 14.5 40.3 14.5 40.4
Average 51.4 88.2 51.4 87.7 51.2 87.7
Stdev 125 157 126 156 127 156 p (t-test) 0.029 0.031 0.031
Min 0.00127 0.00127 0.00127 0.00127 0.00127 0.00127
Max 1070 1150 1070 1150 1070 1150 n (Patient) 125 190 123 192 122 193
UO only


Lower limit of 95% CI 1.34 1.34 1.66 1.45 1.39 2.15 1.44 1.41 1.92 Upper limit of 95% CI 3.81 3.76 6.61 4.15 3.91 8.50 4.12 3.99 6.82
OR Quartile 3 2.94 2.61 3.04 3.21 2.78 3.81 2.98 2.87 3.37 p Value 1.5E-5 5.5E-5 2.2E-5 4.5E-6 2.0E-5 1.8E-7 1.9E-5 1.2E-5 8.4E-7
Lower limit of 95% CI 1.80 1.64 1.82 1.95 1.74 2.31 1.80 1.79 2.08 Upper limit of 95% CI 4.80 4.16 5.08 5.29 4.44 6.30 4.90 4.60 5.46
OR Quartile 4 3.34 2.81 3.52 3.92 2.72 3.98 3.72 2.92 3.46 p Value 2.7E-4 5.3E-4 4.3E-6 1.0E-4 8.2E-4 4.0E-7 1.9E-4 4.1E-4 4.2E-6
Lower limit of 95% CI 1.74 1.57 2.06 1.97 1.51 2.33 1.87 1.61 2.04 Upper limit of 95% CI 6.39 5.04 6.02 7.81 4.88 6.78 7.40 5.30 5.88
[00447] Table 31.2: Comparison of marker levels and the area under the ROC curve (AUC) in urine samples for the "recovered" and "non-recovered" cohorts where recovery starts within 48 hours after sample collection and renal status is assessed by serum creatinine (sCr) only, urine output (UO) only, or serum creatinine or urine output RIFLE criteria.
sCr or UO


UO only

Average 53.3 127 51.1 127 51.6 117
Stdev 117 195 115 192 118 183 p (t-test) 4.9E-5 1.9E-5 1.5E-4
Min 0.00127 0.00127 0.00127 0.00127 0.00127 0.00127
Max 1140 1150 1140 1150 1140 1150 n (Patient) 225 89 219 95 206 108

[00448] Table 31.3: Comparison of marker levels and the area under the ROC curve (AUC) in urine samples for the "recovered" and "non-recovered" cohorts where recovery starts within 72 hours after sample collection and renal status is assessed by serum creatinine (sCr) only, urine output (UO) only, or serum creatinine or urine output RIFLE criteria.
sCr or UO

Min 0.00127 0.00127 0.00127 0.00127 0.00127 0.00127
Max 1070 1150 1070 1150 1070 1150 n (Patient) 153 163 151 165 147 169 sCr only
Recovery Period
Duration (hr) 24 48 72
Non- Non- Non-
Recovered recovered Recovered recovered Recovered recovered Cohort Cohort Cohort Cohort Cohort Cohort
Median 17.2 44.7 16.9 44.6 16.4 44.7
Average 47.8 102 47.8 101 47.6 101
Stdev 112 171 112 170 113 170 p (t-test) 0.0010 0.0011 0.0011
Min 0.00127 0.00127 0.00127 0.00127 0.00127 0.00127
Max 1070 1150 1070 1150 1070 1150 n (Patient) 160 156 159 157 158 158
UO only


OR Quartile 3 2.90 2.97 2.88 2.90 3.06 2.96 2.91 3.14 2.84 p Value 5.1E-6 3.0E-6 5.6E-5 5.0E-6 1.8E-6 3.6E-5 4.9E-6 1.0E-6 3.5E-5
Lower limit of 95% CI 1.83 1.88 1.72 1.84 1.93 1.77 1.84 1.98 1.73 Upper limit of 95% CI 4.57 4.70 4.82 4.58 4.83 4.95 4.60 4.97 4.65
OR Quartile 4 3.47 3.34 3.99 3.36 3.28 3.89 3.41 3.49 3.48 p Value 1.4E-5 1.7E-5 5.2E-7 2.3E-5 2.3E-5 7.9E-7 2.3E-5 1.0E-5 4.1E-6
Lower limit of 95% CI 1.98 1.93 2.32 1.91 1.89 2.27 1.93 2.00 2.05 Upper limit of 95% CI 6.09 5.78 6.86 5.88 5.68 6.68 6.01 6.08 5.93
[00449] Table 31.4: Comparison of marker levels and the area under the ROC curve (AUC) in urine samples for the "recovered" and "non-recovered" cohorts where recovery starts within 96 hours after sample collection and renal status is assessed by serum creatinine (sCr) only, urine output (UO) only, or serum creatinine or urine output RIFLE criteria.
sCr or UO


UO only

Min 0.00127 0.00127 0.00127 0.00127 0.00127 0.00127
Max 1140 1150 1140 1150 1140 1150 n (Patient) 222 92 221 93 213 101

[00450] Table 31.5: Comparison of marker levels and the area under the ROC curve (AUC) in urine samples for the "recovered" and "non-recovered" cohorts where recovery starts within 168 hours after sample collection and renal status is assessed by serum creatinine (sCr) only, urine output (UO) only, or serum creatinine or urine output RIFLE criteria.
sCr or UO

Recovery Period
Duration (hr) 24 48 72
Non- Non- Non-
Recovered recovered Recovered recovered Recovered recovered Cohort Cohort Cohort Cohort Cohort Cohort
Median 18.8 46.0 18.8 46.0 18.8 46.0
Average 53.6 103 53.6 103 53.6 103
Stdev 120 173 120 173 120 173 p (t-test) 0.0028 0.0028 0.0028
Min 0.00127 0.00127 0.00127 0.00127 0.00127 0.00127
Max 1070 1150 1070 1150 1070 1150 n (Patient) 184 132 184 132 184 132
UO only


Lower limit of 95% CI 1.92 1.83 1.83 1.80 1.83 1.76 1.85 1.83 1.75 Upper limit of 95% CI 5.04 4.63 5.01 4.68 4.63 4.80 4.80 4.63 4.72
OR Quartile 4 3.22 3.51 3.37 3.09 3.51 3.29 3.03 3.51 3.15 p Value 1.3E-5 4.0E-6 7.8E-6 2.5E-5 4.0E-6 1.1E-5 3.4E-5 4.0E-6 2.2E-5
Lower limit of 95% CI 1.90 2.06 1.98 1.83 2.06 1.93 1.80 2.06 1.85 Upper limit of 95% CI 5.45 5.98 5.74 5.23 5.98 5.60 5.12 5.98 5.35
[00451] Table 31.6: Comparison of marker levels and the area under the ROC curve (AUC) in EDTA samples for the "recovered" and "non-recovered" cohorts where recovery starts within 24 hours after sample collection and renal status is assessed by serum creatinine (sCr) only, urine output (UO) only, or serum creatinine or urine output RIFLE criteria.
sCr or UO


UO only

Max 4690 1880 4690 1880 4690 1880 n (Patient) 104 46 97 53 91 59

[00452] Table 31.7: Comparison of marker levels and the area under the ROC curve (AUC) in EDTA samples for the "recovered" and "non-recovered" cohorts where recovery starts within 48 hours after sample collection and renal status is assessed by serum creatinine (sCr) only, urine output (UO) only, or serum creatinine or urine output RIFLE criteria.
sCr or UO

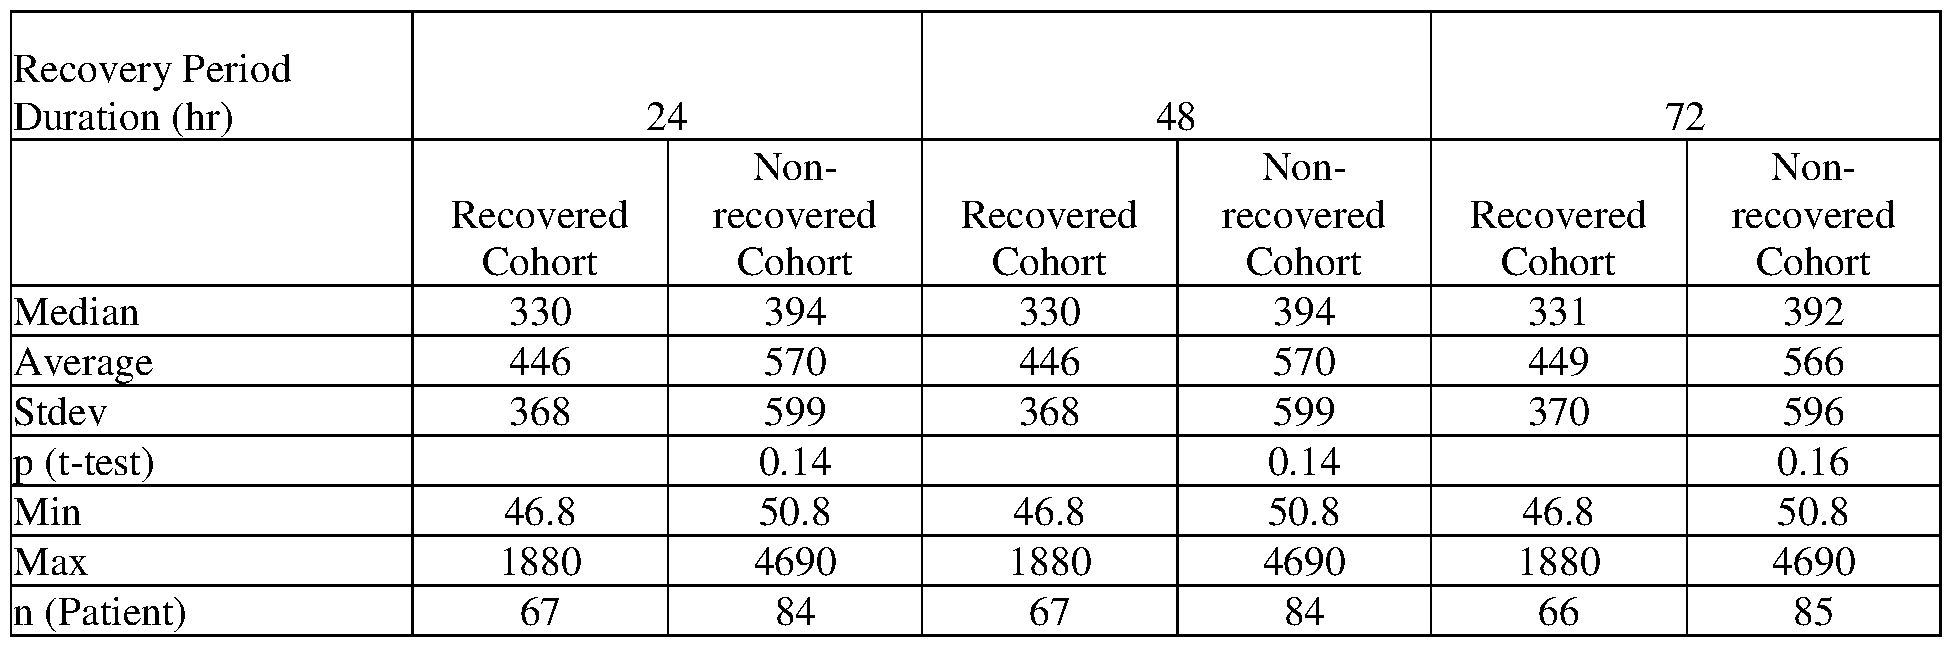
UO only

 Lower limit of 95% CI 0.742 0.783 0.682 0.742 0.783 0.682 0.665 0.742 0.685 Upper limit of 95% CI 2.71 2.85 2.77 2.71 2.85 2.73 2.44 2.70 2.60
OR Quartile 4 1.58 1.76 1.78 1.58 1.76 1.90 1.47 1.70 1.58 p Value 0.24 0.15 0.14 0.24 0.15 0.10 0.32 0.17 0.23
Lower limit of 95% CI 0.736 0.819 0.823 0.736 0.819 0.884 0.684 0.790 0.745 Upper limit of 95% CI 3.40 3.78 3.86 3.40 3.78 4.09 3.17 3.65 3.34
[00453] Table 31.8: Comparison of marker levels and the area under the ROC curve (AUC) in EDTA samples for the "recovered" and "non-recovered" cohorts where recovery starts within 72 hours after sample collection and renal status is assessed by serum creatinine (sCr) only, urine output (UO) only, or serum creatinine or urine output RIFLE criteria.
sCr or UO


UO only


[00454] Table 31.9: Comparison of marker levels and the area under the ROC curve (AUC) in EDTA samples for the "recovered" and "non-recovered" cohorts where recovery starts within 96 hours after sample collection and renal status is assessed by serum creatinine (sCr) only, urine output (UO) only, or serum creatinine or urine output RIFLE criteria.
sCr or UO


UO only

 Upper limit of 95% CI 2.41 2.83 3.65 2.28 2.83 3.65 2.28 2.83 2.92
OR Quartile 4 1.35 1.61 1.43 1.30 1.61 1.43 1.40 1.61 1.36 p Value 0.43 0.21 0.35 0.48 0.21 0.35 0.37 0.21 0.42
Lower limit of 95% CI 0.645 0.768 0.669 0.623 0.768 0.669 0.666 0.768 0.642
Upper limit of 95% CI 2.82 3.39 3.08 2.73 3.39 3.08 2.94 3.39 2.89
[00455] Table 31.10: Comparison of marker levels and the area under the ROC curve (AUC) in EDTA samples for the "recovered" and "non-recovered" cohorts where recovery starts within 168 hours after sample collection and renal status is assessed by serum creatinine (sCr) only, urine output (UO) only, or serum creatinine or urine output RIFLE criteria.
sCr or UO


UO only

Duration (hr) 24 48 72
sCr or sCr or sCr or
UO sCr only UO only UO sCr only UO only UO sCr only UO only
AUC 0.56 0.58 0.59 0.55 0.58 0.59 0.56 0.58 0.59
SE 0.048 0.047 0.050 0.048 0.047 0.050 0.048 0.047 0.049 p Value 0.22 0.096 0.068 0.34 0.096 0.068 0.23 0.096 0.072 nCohort Recovered 89 79 98 88 79 98 87 79 96 nCohort Non- recovered 62 72 52 63 72 52 64 72 54
Cutoff Quartile 2 218 218 217 218 218 217 218 218 217
Sensitivity 77% 79% 81 % 76% 79% 81 % 77% 79% 80%
Specificity 27% 29% 29% 26% 29% 29% 26% 29% 28%
Cutoff Quartile 3 373 373 372 373 373 372 373 373 372
Sensitivity 56% 56% 62% 56% 56% 62% 56% 56% 61 %
Specificity 54% 54% 56% 53% 54% 56% 54% 54% 56%
Cutoff Quartile 4 674 674 661 674 674 661 674 674 661
Sensitivity 27% 29% 31 % 27% 29% 31 % 28% 29% 31 %
Specificity 76% 78% 78% 76% 78% 78% 77% 78% 78%
OR Quartile 2 1.27 1.56 1.68 1.13 1.56 1.68 1.17 1.56 1.53 p Value 0.54 0.24 0.21 0.75 0.24 0.21 0.67 0.24 0.30
Lower limit of 95% CI 0.594 0.739 0.742 0.535 0.739 0.742 0.555 0.739 0.689 Upper limit of 95% CI 2.70 3.30 3.80 2.40 3.30 3.80 2.48 3.30 3.40
OR Quartile 3 1.52 1.49 2.05 1.43 1.49 2.05 1.51 1.49 2.02 p Value 0.21 0.22 0.041 0.28 0.22 0.041 0.21 0.22 0.043
Lower limit of 95% CI 0.790 0.786 1.03 0.748 0.786 1.03 0.789 0.786 1.02 Upper limit of 95% CI 2.91 2.84 4.07 2.74 2.84 4.07 2.89 2.84 3.99
OR Quartile 4 1.22 1.50 1.54 1.18 1.50 1.54 1.31 1.50 1.64 p Value 0.59 0.28 0.27 0.66 0.28 0.27 0.47 0.28 0.20
Lower limit of 95% CI 0.582 0.717 0.721 0.562 0.717 0.721 0.626 0.717 0.774 Upper limit of 95% CI 2.57 3.14 3.27 2.47 3.14 3.27 2.75 3.14 3.48
[00456] Example 32. Use of C-C motif chemokine 24 for evaluating renal status in patients admitted to the ICU: Persistent at RIFLE F
[00457] Patients from the intensive care unit (ICU) with RIFLE stage of injury (I) or failure (F) are enrolled in the following study. EDTA anti-coagulated blood samples (10 mL) and urine samples (50 mL) are collected from each patient at enrollment, and at every 12 hours up to day 3, and then every 24 hours thereafter up to day 7 while the subject is hospitalized. C-C motif chemokine 24 is measured in the enrollment samples by standard immunoassay methods using commercially available assay reagents.
[00458] Kidney status is assessed by RIFLE criteria based on serum creatinine, urine output, or both serum creatinine and urine output. Two cohorts are defined to represent a "persistent" and a "non-persistent" population. "Persistent" indicates those patients whose minimum RIFLE stage during a period of 24, 48 or 72 hours is failure (F) where the persistence period can start from the time of sample collection to 24, 48, 72, 96 or 168 hours after sample collection. "Non- persistent" indicates those patients who are not persistent at failure (F) and whose minimum
RIFLE stage during a period of 24, 48 or 72 hours is non-injury (RIFLE 0), risk of injury (R), or injury (I) where the persistence period can start from the time of sample collection to 24, 48, 72, 96 or 168 hours after sample collection. If a patient dies after failure (F) or is placed on renal replacement therapy (RRT) at any time from sample collection to 24, 48, 72, 96 or 168 hours after sample collection, the patient is considered "persistent".
[00459] The ability to distinguish the "persistent" and "non-persistent" cohorts is determined using receiver operating characteristic (ROC) analysis.
[00460] Table 32.1: Comparison of marker levels and the area under the ROC curve (AUC) in urine samples for the "persistent" and "non-persistent" cohorts where persistence starts within 24 hours after sample collection and renal status is assessed by serum creatinine (sCr) only, urine output (UO) only, or serum creatinine or urine output RIFLE criteria.
sCr or UO


UO only

Max 1140 1150 1140 1150 1140 1150 n (Patient) 274 40 277 37 278 36

[00461] Table 32.2: Comparison of marker levels and the area under the ROC curve (AUC) in urine samples for the "persistent" and "non-persistent" cohorts where persistence starts within 48 hours after sample collection and renal status is assessed by serum creatinine (sCr) only, urine output (UO) only, or serum creatinine or urine output RIFLE criteria.
sCr or UO


UO only

 p Value 2.6E-7 3.6E-6 1.4E-6 1.5E-8 1.1E-6 8.5E-7 1.3E-7 7.1E-6 5.0E-7
Lower limit of 95% CI 2.42 2.06 2.39 2.77 2.20 2.53 2.49 1.99 2.63
Upper limit of 95% CI 7.14 5.96 7.91 8.18 6.37 8.60 7.29 5.77 9.03
[00462] Table 32.3: Comparison of marker levels and the area under the ROC curve (AUC) in urine samples for the "persistent" and "non-persistent" cohorts where persistence starts within 72 hours after sample collection and renal status is assessed by serum creatinine (sCr) only, urine output (UO) only, or serum creatinine or urine output RIFLE criteria.
sCr or UO


UO only


AUC 0.67 0.65 0.67 0.70 0.67 0.67 0.67 0.65 0.67
SE 0.031 0.032 0.039 0.031 0.032 0.040 0.033 0.033 0.040 p Value 4.2E-8 1.1E-6 1.3E-5 1.2E-10 5.1E-8 1.5E-5 1.2E-7 8.7E-6 1.5E-5 nCohort Non- persistent 174 181 245 189 194 250 204 207 250 nCohort Persistent 142 134 69 127 121 64 112 108 64
Cutoff Quartile 2 4.17 4.15 4.13 4.17 4.15 4.13 4.17 4.15 4.13
Sensitivity 82% 82% 86% 85% 85% 86% 85% 85% 86%
Specificity 30% 30% 28% 32% 31 % 28% 30% 30% 28%
Cutoff Quartile 3 29.6 29.3 28.8 29.6 29.3 28.8 29.6 29.3 28.8
Sensitivity 64% 63% 68% 68% 66% 69% 67% 65% 69%
Specificity 61 % 60% 55% 62% 60% 55% 59% 57% 55%
Cutoff Quartile 4 74.9 74.4 74.6 74.9 74.4 74.6 74.9 74.4 74.6
Sensitivity 39% 38% 46% 42% 40% 47% 41 % 39% 47%
Specificity 86% 85% 81 % 86% 84% 80% 84% 82% 80%
OR Quartile 2 1.95 2.00 2.31 2.64 2.62 2.38 2.44 2.52 2.38 p Value 0.014 0.012 0.024 9.4E-4 0.0012 0.025 0.0034 0.0029 0.025
Lower limit of 95% CI 1.15 1.16 1.12 1.49 1.46 1.11 1.34 1.37 1.11 Upper limit of 95% CI 3.33 3.44 4.78 4.70 4.71 5.07 4.43 4.62 5.07
OR Quartile 3 2.85 2.57 2.62 3.41 2.90 2.67 2.96 2.49 2.67 p Value 7.8E-6 6.0E-5 8.3E-4 3.9E-7 1.0E-5 1.0E-3 1.1E-5 2.0E-4 1.0E-3
Lower limit of 95% CI 1.80 1.62 1.49 2.12 1.81 1.49 1.82 1.54 1.49 Upper limit of 95% CI 4.51 4.07 4.62 5.47 4.66 4.78 4.79 4.03 4.78
OR Quartile 4 3.95 3.36 3.64 4.49 3.46 3.62 3.61 2.92 3.62 p Value 8.7E-7 8.4E-6 8.8E-6 6.2E-8 4.4E-6 1.5E-5 2.0E-6 6.3E-5 1.5E-5
Lower limit of 95% CI 2.29 1.97 2.06 2.61 2.04 2.02 2.13 1.73 2.02 Upper limit of 95% CI 6.83 5.72 6.44 7.73 5.87 6.48 6.13 4.94 6.48
[00463] Table 32.4: Comparison of marker levels and the area under the ROC curve (AUC) in urine samples for the "persistent" and "non-persistent" cohorts where persistence starts within 96 hours after sample collection and renal status is assessed by serum creatinine (sCr) only, urine output (UO) only, or serum creatinine or urine output RIFLE criteria.
sCr or UO


Stdev 146 144 142 149 160 116 p (t-test) 0.039 0.012 0.17
Min 0.00127 0.00127 0.00127 0.00127 0.00127 0.00127
Max 1150 1140 1150 1140 1150 679 n (Patient) 179 136 191 124 203 112
UO only
Persistence Period
Duration (hr) 24 48 72
Non-persistent Persistent Non-persistent Persistent Non-persistent Persistent Cohort Cohort Cohort Cohort Cohort Cohort
Median 23.8 71.6 24.1 73.6 24.1 73.6
Average 62.3 111 61.9 117 61.9 117
Stdev 137 169 135 175 135 175 p (t-test) 0.011 0.0053 0.0053
Min 0.00127 0.00127 0.00127 0.00127 0.00127 0.00127
Max 1140 1150 1140 1150 1140 1150 n (Patient) 238 76 244 70 244 70

sCr or UO


UO only


Cutoff Quartile 2 4.17 4.15 4.13 4.17 4.15 4.13 4.17 4.15 4.13
Sensitivity 82% 81 % 86% 85% 84% 87% 86% 84% 87%
Specificity 31 % 30% 29% 32% 32% 29% 32% 31 % 29%
Cutoff Quartile 3 29.6 29.3 28.8 29.6 29.3 28.8 29.6 29.3 28.8
Sensitivity 64% 64% 68% 67% 66% 69% 67% 66% 69%
Specificity 62% 61 % 56% 62% 61 % 56% 60% 59% 56%
Cutoff Quartile 4 74.9 74.4 74.6 74.9 74.4 74.6 74.9 74.4 74.6
Sensitivity 38% 38% 44% 41 % 40% 45% 41 % 40% 45%
Specificity 86% 85% 82% 86% 85% 81 % 85% 83% 81 %
OR Quartile 2 2.01 1.90 2.62 2.69 2.49 2.81 2.80 2.41 2.81 p Value 0.0099 0.018 0.0066 6.4E-4 0.0017 0.0050 6.8E-4 0.0033 0.0050
Lower limit of 95% CI 1.18 1.12 1.31 1.52 1.41 1.37 1.55 1.34 1.37 Upper limit of 95% CI 3.41 3.25 5.26 4.74 4.39 5.78 5.08 4.32 5.78
OR Quartile 3 2.83 2.68 2.72 3.34 3.09 2.91 3.03 2.71 2.91 p Value 8.3E-6 2.5E-5 2.4E-4 4.6E-7 2.6E-6 1.3E-4 5.0E-6 4.0E-5 1.3E-4
Lower limit of 95% CI 1.79 1.69 1.59 2.09 1.93 1.68 1.88 1.68 1.68 Upper limit of 95% CI 4.47 4.24 4.63 5.34 4.94 5.01 4.87 4.36 5.01
OR Quartile 4 3.84 3.49 3.53 4.32 3.76 3.55 3.82 3.31 3.55 p Value 1.7E-6 5.4E-6 6.6E-6 1.5E-7 1.2E-6 7.2E-6 8.2E-7 8.8E-6 7.2E-6
Lower limit of 95% CI 2.21 2.04 2.04 2.50 2.20 2.04 2.24 1.95 2.04 Upper limit of 95% CI 6.66 5.98 6.12 7.46 6.42 6.18 6.50 5.60 6.18
[00465] Table 32.6: Comparison of marker levels and the area under the ROC curve (AUC) in EDTA samples for the "persistent" and "non-persistent" cohorts where persistence starts within 24 hours after sample collection and renal status is assessed by serum creatinine (sCr) only, urine output (UO) only, or serum creatinine or urine output RIFLE criteria.
sCr or UO


UO only
Persistence Period
Duration (hr) 24 48 72
Non-persistent Persistent Non-persistent Persistent Non-persistent Persistent Cohort Cohort Cohort Cohort Cohort Cohort
Median 364 392 364 392 350 394
Average 518 435 518 435 517 441
Stdev 531 260 531 260 529 265 p (t-test) 0.50 0.50 0.55
Min 46.8 66.1 46.8 66.1 46.8 66.1
Max 4690 1050 4690 1050 4690 1050 n (Patient) 131 19 131 19 132 18

[00466] Table 32.7: Comparison of marker levels and the area under the ROC curve (AUC) in EDTA samples for the "persistent" and "non-persistent" cohorts where persistence starts within 48 hours after sample collection and renal status is assessed by serum creatinine (sCr) only, urine output (UO) only, or serum creatinine or urine output RIFLE criteria.
sCr or UO
 sCr only

UO only

 Sensitivity 54% 55% 56% 54% 56% 56% 50% 53% 58% Specificity 52% 53% 51 % 52% 54% 51 % 50% 52% 52%
Cutoff Quartile 4 674 661 661 674 661 661 674 661 661
Sensitivity 30% 31 % 26% 32% 32% 26% 26% 27% 27%
Specificity 78% 78% 75% 79% 78% 75% 75% 76% 75%
OR Quartile 2 1.53 1.50 1.61 1.69 1.71 1.61 1.53 1.62 1.52 p Value 0.28 0.30 0.37 0.20 0.19 0.37 0.31 0.25 0.43
Lower limit of 95% CI 0.709 0.695 0.565 0.761 0.772 0.565 0.677 0.714 0.531 Upper limit of 95% CI 3.28 3.22 4.61 3.73 3.79 4.61 3.48 3.66 4.37
OR Quartile 3 1.28 1.39 1.31 1.30 1.49 1.31 0.980 1.20 1.45 p Value 0.45 0.32 0.52 0.44 0.24 0.52 0.95 0.61 0.39
Lower limit of 95% CI 0.671 0.725 0.568 0.671 0.767 0.568 0.498 0.608 0.619 Upper limit of 95% CI 2.46 2.67 3.03 2.51 2.89 3.03 1.93 2.35 3.42
OR Quartile 4 1.57 1.60 1.04 1.71 1.68 1.04 1.07 1.18 1.11 p Value 0.23 0.21 0.94 0.16 0.17 0.94 0.87 0.67 0.84
Lower limit of 95% CI 0.748 0.765 0.401 0.810 0.799 0.401 0.491 0.549 0.424 Upper limit of 95% CI 3.29 3.37 2.69 3.60 3.55 2.69 2.32 2.55 2.88
[00467] Table 32.8: Comparison of marker levels and the area under the ROC curve (AUC) in EDTA samples for the "persistent" and "non-persistent" cohorts where persistence starts within 72 hours after sample collection and renal status is assessed by serum creatinine (sCr) only, urine output (UO) only, or serum creatinine or urine output RIFLE criteria.
sCr or UO


UO only
Persistence Period
Duration (hr) 24 48 72
Non-persistent Persistent Non-persistent Persistent Non-persistent Persistent
Cohort Cohort Cohort Cohort Cohort Cohort
Median 332 396 332 396 331 397
Average 498 540 498 540 496 547
Stdev 538 383 538 383 536 386 p (t-test) 0.66 0.66 0.61
Min 46.8 66.1 46.8 66.1 46.8 66.1
Max 4690 1510 4690 1510 4690 1510 n (Patient) 115 35 115 35 116 34

[00468] Table 32.9: Comparison of marker levels and the area under the ROC curve (AUC) in EDTA samples for the "persistent" and "non-persistent" cohorts where persistence starts within 96 hours after sample collection and renal status is assessed by serum creatinine (sCr) only, urine output (UO) only, or serum creatinine or urine output RIFLE criteria.
sCr or UO
 Cohort Cohort Cohort Cohort Cohort Cohort
Median 332 394 330 397 330 397
Average 455 585 447 603 498 541
Stdev 363 638 360 650 576 398 p (t-test) 0.12 0.063 0.61
Min 50.8 46.8 46.8 50.8 46.8 63.9
Max 1880 4690 1880 4690 4690 1700 n (Patient) 81 70 85 66 91 60 sCr only
Persistence Period
Duration (hr) 24 48 72
Non-persistent Persistent Non-persistent Persistent Non-persistent Persistent Cohort Cohort Cohort Cohort Cohort Cohort
Median 330 396 329 397 329 397
Average 442 598 440 608 492 547
Stdev 359 642 356 652 576 403 p (t-test) 0.064 0.045 0.52
Min 46.8 50.8 46.8 50.8 46.8 63.9
Max 1880 4690 1880 4690 4690 1700 n (Patient) 81 69 84 66 90 60
UO only


Lower limit of 95% CI 0.599 0.675 0.650 0.686 0.697 0.741 0.850 0.863 0.708 Upper limit of 95% CI 2.64 3.02 3.77 3.11 3.17 4.62 4.16 4.22 4.43
OR Quartile 3 1.34 1.46 1.61 1.50 1.54 1.74 1.53 1.56 1.88 p Value 0.37 0.25 0.20 0.22 0.19 0.14 0.21 0.18 0.096
Lower limit of 95% CI 0.707 0.765 0.777 0.788 0.807 0.832 0.792 0.809 0.893 Upper limit of 95% CI 2.55 2.78 3.32 2.87 2.95 3.62 2.94 3.02 3.97
OR Quartile 4 1.61 1.65 1.32 1.62 1.59 1.38 1.32 1.30 1.45 p Value 0.21 0.19 0.50 0.20 0.22 0.43 0.47 0.49 0.37
Lower limit of 95% CI 0.770 0.785 0.591 0.773 0.761 0.618 0.626 0.617 0.647 Upper limit of 95% CI 3.38 3.46 2.95 3.39 3.34 3.10 2.77 2.73 3.26
[00469] Table 32.10: Comparison of marker levels and the area under the ROC curve (AUC) in EDTA samples for the "persistent" and "non-persistent" cohorts where persistence starts within 168 hours after sample collection and renal status is assessed by serum creatinine (sCr) only, urine output (UO) only, or serum creatinine or urine output RIFLE criteria.
sCr or UO


UO only

Min 50.8 46.8 50.8 46.8 50.8 46.8
Max 4690 1510 4690 1510 4690 1510 n (Patient) 108 42 108 42 109 41

[00470] Example 33. Use of C-C motif chemokine 24 for evaluating renal status in patients admitted to the ICU: Persistent at RIFLE I or F
[00471] Patients from the intensive care unit (ICU) with RIFLE stage of injury (I) or failure (F) are enrolled in the following study. EDTA anti-coagulated blood samples (10 mL) and urine samples (50 mL) are collected from each patient at enrollment, and at every 12 hours up to day 3, and then every 24 hours thereafter up to day 7 while the subject is hospitalized. C-C motif chemokine 24 is measured in the enrollment samples by standard immunoassay methods using commercially available assay reagents.
[00472] Kidney status is assessed by RIFLE criteria based on serum creatinine, urine output, or both serum creatinine and urine output. Two cohorts are defined to represent a "persistent" and a "non-persistent" population. "Persistent" indicates those patients whose minimum RIFLE
stage during a period of 24, 48 or 72 hours is injury (I) or failure (F) where the persistence period can start from the time of sample collection to 24, 48, 72, 96 or 168 hours after sample collection. "Non-persistent" indicates those patients who are not persistent at injury (I) or failure (F) and whose minimum RIFLE stage during a period of 24, 48 or 72 hours is non-injury (RIFLE 0) or risk of injury (R) where the persistence period can start from the time of sample collection to 24, 48, 72, 96 or 168 hours after sample collection. If a patient dies after injury (I) or failure (F) or is placed on renal replacement therapy (RRT) at any time from sample collection to 24, 48, 72, 96 or 168 hours after sample collection, the patient is considered "persistent".
[00473] The ability to distinguish the "persistent" and "non-persistent" cohorts is determined using receiver operating characteristic (ROC) analysis.
[00474] Table 33.1: Comparison of marker levels and the area under the ROC curve (AUC) in urine samples for the "persistent" and "non-persistent" cohorts where persistence starts within 24 hours after sample collection and renal status is assessed by serum creatinine (sCr) only, urine output (UO) only, or serum creatinine or urine output RIFLE criteria.
sCr or UO


UO only
Persistence Period
Duration (hr) 24 48 72
Non-persistent Persistent Non-persistent Persistent Non-persistent Persistent
Cohort Cohort Cohort Cohort Cohort Cohort
Median 22.9 73.9 24.4 89.6 25.6 97.6
Average 57.8 127 59.3 138 60.8 142
Stdev 131 181 130 191 131 197 p (t-test) 3.2E-4 1.7E-4 2.6E-4
Min 0.00127 0.00127 0.00127 0.00127 0.00127 0.00127
Max 1140 1150 1140 1150 1140 1150 n (Patient) 240 74 255 59 262 52

[00475] Table 33.2: Comparison of marker levels and the area under the ROC curve (AUC) in urine samples for the "persistent" and "non-persistent" cohorts where persistence starts within 48 hours after sample collection and renal status is assessed by serum creatinine (sCr) only, urine output (UO) only, or serum creatinine or urine output RIFLE criteria.
sCr or UO
Persistence Period
Duration (hr) 24 48 72
Non-persistent Persistent Non-persistent Persistent Non-persistent Persistent
Cohort Cohort Cohort Cohort Cohort Cohort
Median 14.3 40.4 17.9 42.7 17.9 44.7
Average 47.1 89.0 47.9 97.0 49.1 101
Stdev 125 155 115 166 114 171 p (t-test) 0.015 0.0028 0.0014
Min 0.00127 0.00127 0.00127 0.00127 0.00127 0.00127
Max 1070 1150 1070 1150 1070 1150 n (Patient) 111 205 146 170 164 152 sCr only

UO only


Cutoff Quartile 4 74.9 74.4 74.6 74.9 74.4 74.6 74.9 74.4 74.6
Sensitivity 32% 32% 46% 35% 35% 49% 37% 37% 50%
Specificity 88% 86% 84% 86% 86% 83% 86% 85% 82%
OR Quartile 2 2.23 2.24 3.31 2.20 2.39 3.17 2.49 2.70 3.18 p Value 0.0025 0.0022 6.8E-4 0.0030 0.0012 0.0026 8.8E-4 4.0E-4 0.0039
Lower limit of 95% CI 1.33 1.34 1.66 1.31 1.41 1.50 1.46 1.56 1.45 Upper limit of 95% CI 3.76 3.76 6.61 3.70 4.06 6.70 4.27 4.67 6.98
OR Quartile 3 2.88 2.61 3.75 2.54 2.50 3.59 2.82 2.88 3.20 p Value 1.8E-5 5.5E-5 8.6E-7 5.7E-5 7.3E-5 8.8E-6 8.5E-6 6.1E-6 7.7E-5
Lower limit of 95% CI 1.78 1.64 2.22 1.61 1.59 2.04 1.79 1.82 1.80 Upper limit of 95% CI 4.67 4.16 6.35 4.01 3.94 6.31 4.45 4.56 5.70
OR Quartile 4 3.58 2.81 4.42 3.35 3.23 4.66 3.58 3.32 4.55 p Value 1.2E-4 5.3E-4 7.7E-8 3.0E-5 3.4E-5 7.0E-8 5.7E-6 1.4E-5 2.0E-7
Lower limit of 95% CI 1.87 1.57 2.57 1.90 1.86 2.66 2.06 1.93 2.57 Upper limit of 95% CI 6.85 5.04 7.60 5.91 5.63 8.15 6.20 5.71 8.05
[00476] Table 33.3: Comparison of marker levels and the area under the ROC curve (AUC) in urine samples for the "persistent" and "non-persistent" cohorts where persistence starts within 72 hours after sample collection and renal status is assessed by serum creatinine (sCr) only, urine output (UO) only, or serum creatinine or urine output RIFLE criteria.
sCr or UO


UO only
 Cohort Cohort Cohort Cohort Cohort Cohort
Median 20.3 54.7 22.9 64.0 23.7 69.8
Average 58.5 106 60.1 109 61.7 109
Stdev 138 159 138 163 138 164 p (t-test) 0.0064 0.0069 0.012
Min 0.00127 0.00127 0.00127 0.00127 0.00127 0.00127
Max 1140 1150 1140 1150 1140 1150 n (Patient) 211 103 224 90 231 83

[00477] Table 33.4: Comparison of marker levels and the area under the ROC curve (AUC) in urine samples for the "persistent" and "non-persistent" cohorts where persistence starts within 96 hours after sample collection and renal status is assessed by serum creatinine (sCr) only, urine output (UO) only, or serum creatinine or urine output RIFLE criteria.
sCr or UO

Min 0.00127 0.00127 0.00127 0.00127 0.00127 0.00127
Max 1070 1150 1070 1150 1070 1150 n (Patient) 109 207 142 174 155 161 sCr only
Persistence Period
Duration (hr) 24 48 72
Non-persistent Persistent Non-persistent Persistent Non-persistent Persistent Cohort Cohort Cohort Cohort Cohort Cohort
Median 14.5 39.7 16.9 42.7 16.9 44.6
Average 48.7 89.5 45.9 98.4 48.1 100
Stdev 120 159 111 168 112 171 p (t-test) 0.015 0.0014 0.0014
Min 0.00127 0.00127 0.00127 0.00127 0.00127 0.00127
Max 1070 1150 1070 1150 1070 1150 n (Patient) 123 192 149 166 161 154
UO only


OR Quartile 3 2.74 2.62 3.14 2.70 2.65 3.20 3.06 2.95 2.93 p Value 4.4E-5 5.3E-5 5.2E-6 2.1E-5 2.8E-5 8.7E-6 1.8E-6 3.8E-6 5.1E-5
Lower limit of 95% CI 1.69 1.64 1.92 1.71 1.68 1.92 1.93 1.86 1.74 Upper limit of 95% CI 4.44 4.19 5.14 4.26 4.17 5.35 4.83 4.66 4.92
OR Quartile 4 3.46 2.97 3.69 3.41 3.27 3.90 3.31 3.17 3.61 p Value 1.8E-4 3.3E-4 1.5E-6 3.0E-5 3.4E-5 7.0E-7 2.3E-5 3.3E-5 3.3E-6
Lower limit of 95% CI 1.81 1.64 2.17 1.92 1.87 2.28 1.90 1.84 2.10 Upper limit of 95% CI 6.61 5.39 6.28 6.06 5.74 6.67 5.77 5.47 6.19
[00478] Table 33.5: Comparison of marker levels and the area under the ROC curve (AUC) in urine samples for the "persistent" and "non-persistent" cohorts where persistence starts within 168 hours after sample collection and renal status is assessed by serum creatinine (sCr) only, urine output (UO) only, or serum creatinine or urine output RIFLE criteria.
sCr or UO


UO only


[00479] Table 33.6: Comparison of marker levels and the area under the ROC curve (AUC) in EDTA samples for the "persistent" and "non-persistent" cohorts where persistence starts within 24 hours after sample collection and renal status is assessed by serum creatinine (sCr) only, urine output (UO) only, or serum creatinine or urine output RIFLE criteria.
sCr or UO

Duration (hr) 24 48 72
Non-persistent Persistent Non-persistent Persistent Non-persistent Persistent
Cohort Cohort Cohort Cohort Cohort Cohort
Median 327 386 371 374 376 332
Average 437 555 481 545 491 544
Stdev 379 569 387 610 393 642 p (t-test) 0.18 0.45 0.54
Min 46.8 50.8 46.8 50.8 46.8 50.8
Max 1880 4690 1880 4690 1880 4690 n (Patient) 52 98 73 77 86 64
UO only


[00480] Table 33.7: Comparison of marker levels and the area under the ROC curve (AUC) in EDTA samples for the "persistent" and "non-persistent" cohorts where persistence starts within 48 hours after sample collection and renal status is assessed by serum creatinine (sCr) only, urine output (UO) only, or serum creatinine or urine output RIFLE criteria.
sCr or UO


UO only


Cutoff Quartile 2 218 217 217 218 217 217 218 217 217
Sensitivity 75% 77% 77% 74% 75% 79% 75% 76% 79%
Specificity 27% 29% 26% 24% 26% 27% 25% 27% 27%
Cutoff Quartile 3 373 372 372 373 372 372 373 372 372
Sensitivity 53% 54% 53% 52% 52% 56% 50% 51 % 59%
Specificity 55% 57% 51 % 51 % 53% 52% 49% 51 % 53%
Cutoff Quartile 4 674 661 661 674 661 661 674 661 661
Sensitivity 28% 28% 34% 30% 30% 33% 28% 28% 32%
Specificity 82% 80% 79% 80% 80% 77% 77% 77% 77%
OR Quartile 2 1.11 1.38 1.16 0.916 1.04 1.44 1.02 1.15 1.41 p Value 0.79 0.41 0.71 0.82 0.92 0.42 0.96 0.71 0.47
Lower limit of 95% CI 0.511 0.643 0.520 0.438 0.497 0.594 0.487 0.549 0.556 Upper limit of 95% CI 2.42 2.95 2.60 1.92 2.17 3.47 2.12 2.41 3.56
OR Quartile 3 1.38 1.52 1.20 1.14 1.24 1.42 0.975 1.05 1.58 p Value 0.36 0.23 0.60 0.69 0.51 0.35 0.94 0.87 0.24
Lower limit of 95% CI 0.697 0.769 0.604 0.601 0.652 0.679 0.515 0.556 0.731 Upper limit of 95% CI 2.74 3.00 2.40 2.16 2.36 2.95 1.85 2.00 3.44
OR Quartile 4 1.77 1.62 1.90 1.68 1.71 1.72 1.30 1.33 1.58 p Value 0.19 0.25 0.10 0.18 0.16 0.18 0.48 0.45 0.29
Lower limit of 95% CI 0.761 0.714 0.884 0.791 0.805 0.772 0.624 0.636 0.682 Upper limit of 95% CI 4.10 3.66 4.09 3.58 3.65 3.83 2.72 2.78 3.64
[00481] Table 33.8: Comparison of marker levels and the area under the ROC curve (AUC) in EDTA samples for the "persistent" and "non-persistent" cohorts where persistence starts within 72 hours after sample collection and renal status is assessed by serum creatinine (sCr) only, urine output (UO) only, or serum creatinine or urine output RIFLE criteria.
sCr or UO


Min 46.8 50.8 46.8 50.8 46.8 50.8
Max 1880 4690 1880 4690 1880 4690 n (Patient) 51 99 69 81 75 75
UO only
Persistence Period
Duration (hr) 24 48 72
Non-persistent Persistent Non-persistent Persistent Non-persistent Persistent Cohort Cohort Cohort Cohort Cohort Cohort
Median 334 394 332 396 331 397
Average 491 538 495 538 501 527
Stdev 551 408 544 403 546 376 p (t-test) 0.59 0.63 0.78
Min 50.8 46.8 50.8 46.8 50.8 46.8
Max 4690 1700 4690 1700 4690 1510 n (Patient) 98 52 105 45 110 40

[00482] Table 33.9: Comparison of marker levels and the area under the ROC curve (AUC) in EDTA samples for the "persistent" and "non-persistent" cohorts where persistence starts within
96 hours after sample collection and renal status is assessed by serum creatinine (sCr) only, urine output (UO) only, or serum creatinine or urine output RIFLE criteria.
sCr or UO

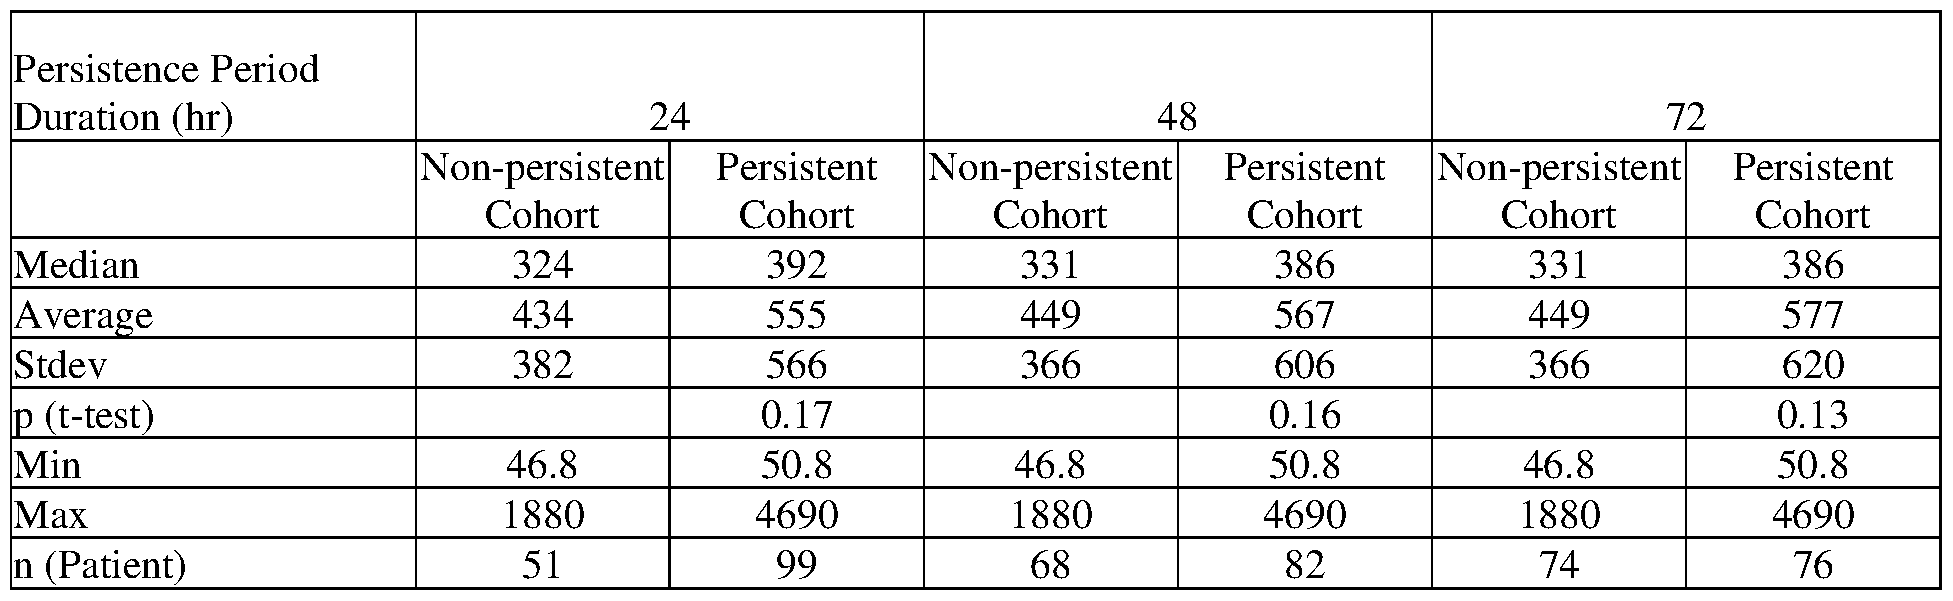
UO only


Sensitivity 75% 77% 78% 75% 76% 80% 77% 78% 80%
Specificity 27% 29% 27% 25% 26% 28% 27% 28% 28%
Cutoff Quartile 3 373 372 372 373 372 372 373 372 372
Sensitivity 53% 54% 58% 53% 54% 60% 53% 54% 62%
Specificity 55% 57% 55% 53% 54% 55% 53% 54% 55%
Cutoff Quartile 4 674 661 661 674 661 661 674 661 661
Sensitivity 28% 28% 33% 29% 29% 32% 27% 28% 31 %
Specificity 82% 80% 79% 79% 79% 78% 77% 77% 77%
OR Quartile 2 1.11 1.38 1.35 0.984 1.12 1.56 1.21 1.38 1.53 p Value 0.79 0.41 0.45 0.97 0.77 0.29 0.61 0.40 0.33
Lower limit of 95% CI 0.511 0.643 0.617 0.470 0.534 0.686 0.582 0.657 0.655 Upper limit of 95% CI 2.42 2.95 2.95 2.06 2.33 3.53 2.53 2.88 3.56
OR Quartile 3 1.38 1.52 1.68 1.27 1.38 1.83 1.27 1.38 2.03 p Value 0.36 0.23 0.13 0.47 0.33 0.085 0.47 0.33 0.052
Lower limit of 95% CI 0.697 0.769 0.860 0.668 0.725 0.920 0.670 0.725 0.994 Upper limit of 95% CI 2.74 3.00 3.29 2.41 2.63 3.65 2.40 2.62 4.15
OR Quartile 4 1.77 1.62 1.82 1.57 1.60 1.67 1.26 1.28 1.52 p Value 0.19 0.25 0.12 0.24 0.23 0.19 0.54 0.51 0.29
Lower limit of 95% CI 0.761 0.714 0.863 0.737 0.749 0.781 0.601 0.611 0.700 Upper limit of 95% CI 4.10 3.66 3.86 3.34 3.40 3.57 2.63 2.68 3.32
[00483] Table 33.10: Comparison of marker levels and the area under the ROC curve (AUC) in EDTA samples for the "persistent" and "non-persistent" cohorts where persistence starts within 168 hours after sample collection and renal status is assessed by serum creatinine (sCr) only, urine output (UO) only, or serum creatinine or urine output RIFLE criteria.
sCr or UO


[00484] While the invention has been described and exemplified in sufficient detail for those skilled in this art to make and use it, various alternatives, modifications, and improvements should be apparent without departing from the spirit and scope of the invention. The examples provided herein are representative of preferred embodiments, are exemplary, and are not intended as limitations on the scope of the invention. Modifications therein and other uses will
occur to those skilled in the art. These modifications are encompassed within the spirit of the invention and are defined by the scope of the claims.
[00485] It will be readily apparent to a person skilled in the art that varying substitutions and modifications may be made to the invention disclosed herein without departing from the scope and spirit of the invention.
[00486] All patents and publications mentioned in the specification are indicative of the levels of those of ordinary skill in the art to which the invention pertains. All patents and publications are herein incorporated by reference to the same extent as if each individual publication was specifically and individually indicated to be incorporated by reference.
[00487] The invention illustratively described herein suitably may be practiced in the absence of any element or elements, limitation or limitations which is not specifically disclosed herein. Thus, for example, in each instance herein any of the terms "comprising", "consisting essentially of and "consisting of may be replaced with either of the other two terms. The terms and expressions which have been employed are used as terms of description and not of limitation, and there is no intention that in the use of such terms and expressions of excluding any equivalents of the features shown and described or portions thereof, but it is recognized that various modifications are possible within the scope of the invention claimed. Thus, it should be understood that although the present invention has been specifically disclosed by preferred embodiments and optional features, modification and variation of the concepts herein disclosed may be resorted to by those skilled in the art, and that such modifications and variations are considered to be within the scope of this invention as defined by the appended claims.
[00488] Other embodiments are set forth within the following claims.
Claims
1. A method for evaluating renal status in a subject, comprising: performing one or more of an assay method configured to detect Metalloproteinase inhibitor 1, an assay method configured to detect Metalloproteinase inhibitor 2, an assay method configured to detect Metalloproteinase inhibitor 4, an assay method configured to detect C-C motif chemokine 15, an assay method configured to detect C-C motif chemokine 18, an assay method configured to detect C-C motif chemokine 23, and/or an assay method configured to detect C-C motif chemokine 24, on a body fluid sample obtained from the subject to provide one or more assay result(s); and correlating the assay result(s) to the renal status of the subject.
2. A method according to claim 1, wherein said correlation step comprises correlating the assay result(s) to one or more of risk stratification, diagnosis, staging, prognosis, classifying and monitoring of the renal status of the subject.
3. A method according to claim 1, wherein said correlating step comprises assigning a likelihood of one or more future changes in renal status to the subject based on the assay result(s).
4. A method according to claim 3, wherein said one or more future changes in renal status comprise one or more of a future injury to renal function, future reduced renal function, future improvement in renal function, future acute renal failure (ARF), and future persistence of existing ARF.
5. A method according to one of claims 1-4, wherein said assay result(s) comprise one or more of a measured concentration of Metalloproteinase inhibitor 1, a measured concentration of Metalloproteinase inhibitor 2, a measured concentration of Metalloproteinase inhibitor 4, a measured concentration of C-C motif chemokine 15,
a measured concentration of C-C motif chemokine 18, a measured concentration of C-C motif chemokine 23, and/or a measured concentration of C-C motif chemokine 24.
6. A method according to one of claims 1-5, wherein said correlating step comprises combining a plurality of assay results using a function that converts the plurality of assay results into a single composite result.
7. A method according to claim 3, wherein said one or more future changes in renal status comprise a clinical outcome related to a renal injury suffered by the subject.
8. A method according to claim 3, wherein the likelihood of one or more future changes in renal status is that an event of interest is more or less likely to occur within 30 days of the time at which the body fluid sample is obtained from the subject.
9. A method according to claim 8, wherein the likelihood of one or more future changes in renal status is that an event of interest is more or less likely to occur within a period selected from the group consisting of 21 days, 14 days, 7 days, 5 days, 96 hours, 72 hours, 48 hours, 36 hours, 24 hours, and 12 hours.
10. A method according to one of claims 1-5, wherein the subject is selected for evaluation of renal status based on the pre-existence in the subject of one or more known risk factors for prerenal, intrinsic renal, or postrenal ARF.
11. A method according to one of claims 1-5, wherein the subject is selected for evaluation of renal status based on an existing diagnosis of one or more of congestive heart failure, preeclampsia, eclampsia, diabetes mellitus, hypertension, coronary artery disease, proteinuria, renal insufficiency, glomerular filtration below the normal range, cirrhosis, serum creatinine above the normal range, sepsis, injury to renal function, reduced renal function, or ARF, or based on undergoing or having undergone major vascular surgery, coronary artery bypass, or other cardiac surgery, or based on exposure to NSAIDs, cyclosporines, tacrolimus,
aminoglycosides, foscamet, ethylene glycol, hemoglobin, myoglobin, ifosfamide, heavy metals, methotrexate, radiopaque contrast agents, or streptozotocin.
12. A method according to one of claims 1-5, wherein said correlating step comprises assigning a diagnosis of the occurrence or nonoccurrence of one or more of an injury to renal function, reduced renal function, or ARF to the subject based on the assay result.
13. A method according to one of claims 1-5, wherein said correlating step comprises assessing whether or not renal function is improving or worsening in a subject who has suffered from an injury to renal function, reduced renal function, or ARF based on the assay result.
14. A method according to one of claims 1-5, wherein said method is a method of diagnosing the occurrence or nonoccurrence of an injury to renal function in said subject.
15. A method according to one of claims 1-5, wherein said method is a method of diagnosing the occurrence or nonoccurrence of reduced renal function in said subject.
16. A method according to one of claims 1-5, wherein said method is a method of diagnosing the occurrence or nonoccurrence of acute renal failure in said subject.
17. A method according to one of claims 1-5, wherein said method is a method of diagnosing the occurrence or nonoccurrence of a need for renal replacement therapy in said subject.
18. A method according to one of claims 1-5, wherein said method is a method of diagnosing the occurrence or nonoccurrence of a need for renal transplantation in said subject.
19. A method according to one of claims 1-5, wherein said method is a method of assigning a risk of the future occurrence or nonoccurrence of an injury to renal function in said subject.
20. A method according to one of claims 1-5, wherein said method is a method of assigning a risk of the future occurrence or nonoccurrence of reduced renal function in said subject.
21. A method according to one of claims 1-5, wherein said method is a method of assigning a risk of the future occurrence or nonoccurrence of acute renal failure in said subject.
22. A method according to one of claims 1-5, wherein said method is a method of assigning a risk of the future occurrence or nonoccurrence of a need for renal replacement therapy in said subject.
23. A method according to one of claims 1-5, wherein said method is a method of assigning a risk of the future occurrence or nonoccurrence of a need for renal transplantation in said subject.
24. A method according to one of claims 1-5, wherein said one or more future changes in renal status comprise one or more of a future injury to renal function, future reduced renal function, future improvement in renal function, and future acute renal failure (ARF) within 72 hours of the time at which the body fluid sample is obtained.
25. A method according to one of claims 1-5, wherein said one or more future changes in renal status comprise one or more of a future injury to renal function, future reduced renal function, future improvement in renal function, and future acute renal failure (ARF) within 48 hours of the time at which the body fluid sample is obtained.
26. A method according to one of claims 1-5, wherein said one or more future changes in renal status comprise one or more of a future injury to renal function, future reduced renal function, future improvement in renal function, and future acute renal failure (ARF) within 24 hours of the time at which the body fluid sample is obtained.
27. A method according to one of claims 1-5, wherein the subject is in RIFLE stage 0 or R.
28. A method according to claim 27, wherein the subject is in RIFLE stage 0, and said correlating step comprises assigning a likelihood that the subject will reach RIFLE stage R, I or F within 72 hours.
29. A method according to claim 28, wherein the subject is in RIFLE stage 0, and said correlating step comprises assigning a likelihood that the subject will reach RIFLE stage I or F within 72 hours.
30. A method according to claim 28, wherein the subject is in RIFLE stage 0, and said correlating step comprises assigning a likelihood that the subject will reach RIFLE stage F within 72 hours.
31. A method according to claim 27, wherein the subject is in RIFLE stage 0 or R, and said correlating step comprises assigning a likelihood that the subject will reach RIFLE stage I or F within 72 hours.
32. A method according to claim 31, wherein the subject is in RIFLE stage 0 or R, and said correlating step comprises assigning a likelihood that the subject will reach RIFLE stage F within 72 hours.
33. A method according to claim 27, wherein the subject is in RIFLE stage R, and said correlating step comprises assigning a likelihood that the subject will reach RIFLE stage I or F within 72 hours.
34. A method according to claim 33, wherein the subject is in RIFLE stage R, and said correlating step comprises assigning a likelihood that the subject will reach RIFLE stage F within 72 hours.
35. A method according to one of claims 1-5, wherein the subject is in RIFLE stage 0, R, or I, and said correlating step comprises assigning a likelihood that the subject will reach RIFLE stage F within 72 hours.
36. A method according to claim 35, wherein the subject is in RIFLE stage I, and said correlating step comprises assigning a likelihood that the subject will reach RIFLE stage F within 72 hours.
37. A method according to claim 28, wherein said correlating step comprises assigning a likelihood that the subject will reach RIFLE stage R, I or F within 48 hours.
38. A method according to claim 29, wherein said correlating step comprises assigning a likelihood that the subject will reach RIFLE stage I or F within 48 hours.
39. A method according to claim 30, wherein said correlating step comprises assigning a likelihood that the subject will reach RIFLE stage F within 48 hours.
40. A method according to claim 31, wherein said correlating step comprises assigning a likelihood that the subject will reach RIFLE stage I or F within 48 hours.
41. A method according to claim 32, wherein said correlating step comprises assigning a likelihood that the subject will reach RIFLE stage F within 48 hours.
42. A method according to claim 33, wherein said correlating step comprises assigning a likelihood that the subject will reach RIFLE stage I or F within 48 hours.
43. A method according to claim 34, wherein said correlating step comprises assigning a likelihood that the subject will reach RIFLE stage F within 48 hours.
44. A method according to claim 35, wherein said correlating step comprises assigning a likelihood that the subject will reach RIFLE stage F within 48 hours.
45. A method according to claim 36, wherein said correlating step comprises assigning a likelihood that the subject will reach RIFLE stage F within 48 hours.
46. A method according to claim 28, wherein said correlating step comprises assigning a likelihood that the subject will reach RIFLE stage R, I or F within 24 hours.
47. A method according to claim 29, wherein said correlating step comprises assigning a likelihood that the subject will reach RIFLE stage I or F within 24 hours.
48. A method according to claim 30, wherein said correlating step comprises assigning a likelihood that the subject will reach RIFLE stage F within 24 hours.
49. A method according to claim 31, wherein said correlating step comprises assigning a likelihood that the subject will reach RIFLE stage I or F within 24 hours.
50. A method according to claim 32, wherein said correlating step comprises assigning a likelihood that the subject will reach RIFLE stage F within 24 hours.
51. A method according to claim 33, wherein said correlating step comprises assigning a likelihood that the subject will reach RIFLE stage I or F within 24 hours.
52. A method according to claim 34, wherein said correlating step comprises assigning a likelihood that the subject will reach RIFLE stage F within 24 hours.
53. A method according to claim 35, wherein said correlating step comprises assigning a likelihood that the subject will reach RIFLE stage F within 24 hours.
54. A method according to claim 36, wherein said correlating step comprises assigning a likelihood that the subject will reach RIFLE stage F within 24 hours.
55. A method according to one of claims 1-5, wherein the subject is not in acute renal failure.
56. A method according to one of claims 1-5, wherein the subject has not experienced a 1.5- fold or greater increase in serum creatinine over a baseline value determined prior to the time at which the body fluid sample is obtained.
57. A method according to one of claims 1-5, wherein the subject has a urine output of at least 0.5 ml/kg/hr over the 6 hours preceding the time at which the body fluid sample is obtained.
58. A method according to one of claims 1-5, wherein the subject has not experienced an increase of 0.3 mg/dL or greater in serum creatinine over a baseline value determined prior to the time at which the body fluid sample is obtained.
59. A method according to one of claims 1-5, wherein the subject (i) has not experienced a 1.5-fold or greater increase in serum creatinine over a baseline value determined prior to the time at which the body fluid sample is obtained, (ii) has a urine output of at least 0.5 ml/kg/hr over the 6 hours preceding the time at which the body fluid sample is obtained, and (iii) has not experienced an increase of 0.3 mg/dL or greater in serum creatinine over a baseline value determined prior to the time at which the body fluid sample is obtained.
60. A method according to one of claims 1-5, wherein the subject has not experienced a 1.5- fold or greater increase in serum creatinine over a baseline value determined prior to the time at which the body fluid sample is obtained.
61. A method according to one of claims 1-5, wherein the subject has a urine output of at least 0.5 ml/kg/hr over the 6 hours preceding the time at which the body fluid sample is obtained.
62. A method according to one of claims 1-5, wherein the subject (i) has not experienced a 1.5-fold or greater increase in serum creatinine over a baseline value determined prior to the time at which the body fluid sample is obtained, (ii) has a urine output of at least 0.5 ml/kg/hr over the 12 hours preceding the time at which the body fluid sample is obtained, and (iii) has not experienced an increase of 0.3 mg/dL or greater in serum creatinine over a baseline value determined prior to the time at which the body fluid sample is obtained.
63. A method according to one of claims 1-5, wherein said correlating step comprises assigning one or more of: a likelihood that within 72 hours the subject will (i) experience a 1.5- fold or greater increase in serum creatinine (ii) have a urine output of less than 0.5 ml/kg/hr over a 6 hour period, or (iii) experience an increase of 0.3 mg/dL or greater in serum creatinine.
64. A method according to claim 63, wherein said correlating step comprises assigning one or more of: a likelihood that within 48 hours the subject will (i) experience a 1.5-fold or greater increase in serum creatinine (ii) have a urine output of less than 0.5 ml/kg/hr over a 6 hour period, or (iii) experience an increase of 0.3 mg/dL or greater in serum creatinine.
65. A method according to claim 63, wherein said correlating step comprises assigning one or more of: a likelihood that within 24 hours the subject will (i) experience a 1.5-fold or greater increase in serum creatinine (ii) have a urine output of less than 0.5 ml/kg/hr over a 6 hour period, or (iii) experience an increase of 0.3 mg/dL or greater in serum creatinine.
66. A method according to claim 63, wherein said correlating step comprises assigning a likelihood that within 72 hours the subject will experience a 1.5-fold or greater increase in serum creatinine.
67. A method according to claim 63, wherein said correlating step comprises assigning a likelihood that within 72 hours the subject will have a urine output of less than 0.5 ml/kg/hr over a 6 hour period.
68. A method according to claim 63, wherein said correlating step comprises assigning a likelihood that within 72 hours the subject will experience an increase of 0.3 mg/dL or greater in serum creatinine.
69. A method according to claim 63, wherein said correlating step comprises assigning a likelihood that within 48 hours the subject will experience a 1.5-fold or greater increase in serum creatinine.
70. A method according to claim 63, wherein said correlating step comprises assigning a likelihood that within 48 hours the subject will have a urine output of less than 0.5 ml/kg/hr over a 6 hour period.
71. A method according to claim 63, wherein said correlating step comprises assigning a likelihood that within 48 hours the subject will experience an increase of 0.3 mg/dL or greater in serum creatinine.
72. A method according to claim 63, wherein said correlating step comprises assigning a likelihood that within 24 hours the subject will experience a 1.5-fold or greater increase in serum creatinine.
73. A method according to claim 63, wherein said correlating step comprises assigning a likelihood that within 24 hours the subject will have a urine output of less than 0.5 ml/kg/hr over a 6 hour period.
74. A method according to claim 63, wherein said correlating step comprises assigning a likelihood that within 24 hours the subject will experience an increase of 0.3 mg/dL or greater in serum creatinine.
75. A method according to one of claims 1-5, wherein the subject has not experienced a 2- fold or greater increase in serum creatinine over a baseline value determined prior to the time at which the body fluid sample is obtained.
76. A method according to one of claims 1-5, wherein the subject has a urine output of at least 0.5 ml/kg/hr over the 12 hours preceding the time at which the body fluid sample is obtained.
77. A method according to one of claims 1-5, wherein the subject (i) has not experienced a 2-fold or greater increase in serum creatinine over a baseline value determined prior to the time at which the body fluid sample is obtained, (ii) has a urine output of at least 0.5 ml/kg/hr over the 2 hours preceding the time at which the body fluid sample is obtained, and (iii) has not
experienced an increase of 0.3 mg/dL or greater in serum creatinine over a baseline value determined prior to the time at which the body fluid sample is obtained.
78. A method according to one of claims 1-5, wherein the subject has not experienced a 3- fold or greater increase in serum creatinine over a baseline value determined prior to the time at which the body fluid sample is obtained.
79. A method according to one of claims 1-5, wherein the subject has a urine output of at least 0.3 ml/kg/hr over the 24 hours preceding the time at which the body fluid sample is obtained, or anuria over the 12 hours preceding the time at which the body fluid sample is obtained.
80. A method according to one of claims 1-5, wherein the subject (i) has not experienced a 3 -fold or greater increase in serum creatinine over a baseline value determined prior to the time at which the body fluid sample is obtained, (ii) has a urine output of at least 0.3 ml/kg/hr over the 24 hours preceding the time at which the body fluid sample is obtained, or anuria over the 12 hours preceding the time at which the body fluid sample is obtained, and (iii) has not experienced an increase of 0.3 mg/dL or greater in serum creatinine over a baseline value determined prior to the time at which the body fluid sample is obtained.
81. A method according to one of claims 1-5, wherein said correlating step comprises assigning one or more of: a likelihood that within 72 hours the subject will (i) experience a 2- fold or greater increase in serum creatinine (ii) have a urine output of less than 0.5 ml/kg/hr over a 12 hour period, or (iii) experience an increase of 0.3 mg/dL or greater in serum creatinine.
82. A method according to claim 81, wherein said correlating step comprises assigning one or more of: a likelihood that within 48 hours the subject will (i) experience a 2-fold or greater increase in serum creatinine (ii) have a urine output of less than 0.5 ml/kg/hr over a 6 hour period, or (iii) experience an increase of 0.3 mg/dL or greater in serum creatinine.
83. A method according to claim 81, wherein said correlating step comprises assigning one or more of: a likelihood that within 24 hours the subject will (i) experience a 2-fold or greater increase in serum creatinine, or (ii) have a urine output of less than 0.5 ml/kg/hr over a 6 hour period.
84. A method according to claim 81, wherein said correlating step comprises assigning a likelihood that within 72 hours the subject will experience a 2-fold or greater increase in serum creatinine.
85. A method according to claim 81, wherein said correlating step comprises assigning a likelihood that within 72 hours the subject will have a urine output of less than 0.5 ml/kg/hr over a 6 hour period.
86. A method according to claim 81, wherein said correlating step comprises assigning a likelihood that within 48 hours the subject will experience a 2-fold or greater increase in serum creatinine.
87. A method according to claim 81, wherein said correlating step comprises assigning a likelihood that within 48 hours the subject will have a urine output of less than 0.5 ml/kg/hr over a 6 hour period.
88. A method according to claim 81, wherein said correlating step comprises assigning a likelihood that within 24 hours the subject will experience a 2-fold or greater increase in serum creatinine.
89. A method according to claim 81, wherein said correlating step comprises assigning a likelihood that within 24 hours the subject will have a urine output of less than 0.5 ml/kg/hr over a 6 hour period.
90. A method according to one of claims 1-5, wherein said correlating step comprises assigning one or more of: a likelihood that within 72 hours the subject will (i) experience a 3- fold or greater increase in serum creatinine, or (ii) have a urine output of less than 0.3 ml/kg/hr over a 24 hour period or anuria over a 12 hour period.
91. A method according to claim 90, wherein said correlating step comprises assigning one or more of: a likelihood that within 48 hours the subject will (i) experience a 3-fold or greater increase in serum creatinine, or (ii) have a urine output of less than 0.3 ml/kg/hr over a 24 hour period or anuria over a 12 hour period.
92. A method according to claim 90, wherein said correlating step comprises assigning one or more of: a likelihood that within 24 hours the subject will (i) experience a 3-fold or greater increase in serum creatinine, or (ii) have a urine output of less than 0.3 ml/kg/hr over a 24 hour period or anuria over a 12 hour period.
93. A method according to claim 90, wherein said correlating step comprises assigning a likelihood that within 72 hours the subject will experience a 3-fold or greater increase in serum creatinine.
94. A method according to claim 90, wherein said correlating step comprises assigning a likelihood that within 72 hours the subject will have a urine output of less than 0.3 ml/kg/hr over a 24 hour period or anuria over a 12 hour period.
95. A method according to claim 90, wherein said correlating step comprises assigning a likelihood that within 48 hours the subject will experience a 3-fold or greater increase in serum creatinine.
96. A method according to claim 90, wherein said correlating step comprises assigning a likelihood that within 48 hours the subject will have a urine output of less than 0.3 ml/kg/hr over a 24 hour period or anuria over a 12 hour period.
97. A method according to claim 90, wherein said correlating step comprises assigning a likelihood that within 24 hours the subject will experience a 3-fold or greater increase in serum creatinine.
98. A method according to claim 90, wherein said correlating step comprises assigning a likelihood that within 24 hours the subject will have a urine output of less than 0.3 ml/kg/hr over a 24 hour period or anuria over a 12 hour period.
99. A method according to one of claims 1-98, wherein the body fluid sample is a urine sample.
100. A method according to one of claims 1-98, wherein the body fluid sample is a blood, serum, or plasma sample.
101. A method according to one of claims 1-100, wherein the assay method comprises introducing the body fluid sample obtained from the subject into an assay instrument which (i) contacts the body fluid sample with one or more reagents which specifically bind for detection one or more of Metalloproteinase inhibitor 1, Metalloproteinase inhibitor 2, Metalloproteinase inhibitor 4, C-C motif chemokine 15, C-C motif chemokine 18, C-C motif chemokine 23, and/or, C-C motif chemokine 24,
(ii) generates one or more assay results indicative of one or more of Metalloproteinase inhibitor 1, Metalloproteinase inhibitor 2, Metalloproteinase inhibitor 4, C-C motif chemokine 15, C-C motif chemokine 18, C-C motif chemokine 23, and/or, C-C motif chemokine 24 in the urine sample, and (iii) uses the assay result(s) to assign the subject to a predetermined subpopulation of individuals having a known predisposition of a current or future acute renal injury or current or future acute renal failure.
102. A method according to claim 101, further comprising treating the subject based on the predetermined subpopulation of individuals to which the patient is assigned, wherein the treatment comprises one or more of initiating renal replacement therapy, withdrawing delivery of compounds that are known to be damaging to the kidney, delaying or avoiding procedures that are known to be damaging to the kidney, and modifying diuretic administration.
103. A method according to claim 101 or 102, wherein the subject does not have a current acute renal injury or acute renal failure, and the assay result is used to assign the subject to a predetermined subpopulation of individuals having a known predisposition of a future acute renal injury or future acute renal failure.
104. A method according to claim 103, wherein the future acute renal injury or future acute renal failure is within a period selected from the group consisting of 21 days, 14 days, 7 days, 5 days, 96 hours, 72 hours, 48 hours, 36 hours, 24 hours, and 12 hours
105. A method according to claim 101 or 102, wherein the subject has a current acute renal injury or acute renal failure, and the assay result is used to assign the subject to a predetermined subpopulation of individuals having a known predisposition of future recovery from acute renal injury or acute renal failure.
106. A method according to claim 105, wherein the future recovery from acute renal injury or acute renal failure is within a period selected from the group consisting of 21 days, 14 days, 7 days, 5 days, 96 hours, 72 hours, 48 hours, 36 hours, 24 hours, and 12 hours
107. A method according to claim 101 or 102, wherein the assay result is used to assign the subject to a predetermined subpopulation of individuals having a known predisposition of future persistence of an acute renal injury or acute renal failure.
108. A method according to claim 107, wherein the future persistence is over a period selected from the group consisting of 21 days, 14 days, 7 days, 5 days, 96 hours, 72 hours, 48 hours, 36 hours, 24 hours, and 12 hours.
109. A method according to claim 107 or 108, wherein the subject has an acute renal injury or acute renal failure at the time the body fluid sample is obtained.
110. Measurement of one or more of Metalloproteinase inhibitor 1, Metalloproteinase inhibitor 2, Metalloproteinase inhibitor 4, C-C motif chemokine 15, C-C motif chemokine 18, C-C motif chemokine 23, and/or, C-C motif chemokine 24 for the evaluation of renal injury, particularly acute renal injury, and most particularly persistent acute renal injury.
111. A kit, comprising: reagents for performing one or more assays configured to detect one or more of
Metalloproteinase inhibitor 1, Metalloproteinase inhibitor 2, Metalloproteinase inhibitor 4, C-C motif chemokine 15, C-C motif chemokine 18, C-C motif chemokine 23, and/or, C-C motif chemokine 24, and a device which contains one or more encoded calibration curves for correlating results from performing said assay(s) to a concentration of one or more of Metalloproteinase inhibitor 1, Metalloproteinase inhibitor 2, Metalloproteinase inhibitor 4, C-C motif chemokine 15, C-C motif chemokine 18, C-C motif chemokine 23, and/or, C-C motif chemokine 24, wherein the concentration range of said calibration curve(s) comprise a normal concentration of one or more of Metalloproteinase inhibitor 1, Metalloproteinase inhibitor 2, Metalloproteinase inhibitor 4, C-C motif chemokine 15, C-C motif chemokine 18, C-C motif chemokine 23, and/or, C-C motif chemokine 24, and a threshold concentration of one or more of Metalloproteinase inhibitor 1, Metalloproteinase inhibitor 2, Metalloproteinase inhibitor 4, C-C motif chemokine 15, C-C motif chemokine 18, C-C motif chemokine 23, and/or, C-C motif chemokine 24 that indicates persistent acute renal injury in a human.
Priority Applications (4)
| Application Number | Priority Date | Filing Date | Title |
|---|---|---|---|
| CN201880019261.4A CN110431422A (en) | 2017-02-06 | 2018-02-06 | The method and composition of diagnosis and prognosis for injury of kidney and kidney failure |
| US16/483,519 US11346846B2 (en) | 2017-02-06 | 2018-02-06 | Methods and compositions for diagnosis and prognosis of renal injury and renal failure |
| EP18747952.2A EP3577458A4 (en) | 2017-02-06 | 2018-02-06 | Methods and compositions for diagnosis and prognosis of renal injury and renal failure |
| US17/827,148 US20230038581A1 (en) | 2017-02-06 | 2022-05-27 | Methods and Compositions for Diagnosis and Prognosis of Renal Injury and Renal Failure |
Applications Claiming Priority (2)
| Application Number | Priority Date | Filing Date | Title |
|---|---|---|---|
| US201762455503P | 2017-02-06 | 2017-02-06 | |
| US62/455,503 | 2017-02-06 |
Related Child Applications (2)
| Application Number | Title | Priority Date | Filing Date |
|---|---|---|---|
| US16/483,519 A-371-Of-International US11346846B2 (en) | 2017-02-06 | 2018-02-06 | Methods and compositions for diagnosis and prognosis of renal injury and renal failure |
| US17/827,148 Continuation US20230038581A1 (en) | 2017-02-06 | 2022-05-27 | Methods and Compositions for Diagnosis and Prognosis of Renal Injury and Renal Failure |
Publications (1)
| Publication Number | Publication Date |
|---|---|
| WO2018145117A1 true WO2018145117A1 (en) | 2018-08-09 |
Family
ID=63040116
Family Applications (1)
| Application Number | Title | Priority Date | Filing Date |
|---|---|---|---|
| PCT/US2018/017118 WO2018145117A1 (en) | 2017-02-06 | 2018-02-06 | Methods and compositions for diagnosis and prognosis of renal injury and renal failure |
Country Status (4)
| Country | Link |
|---|---|
| US (2) | US11346846B2 (en) |
| EP (1) | EP3577458A4 (en) |
| CN (1) | CN110431422A (en) |
| WO (1) | WO2018145117A1 (en) |
Cited By (10)
| Publication number | Priority date | Publication date | Assignee | Title |
|---|---|---|---|---|
| US10823733B2 (en) | 2008-10-21 | 2020-11-03 | Astute Medical, Inc. | Methods and compositions for diagnosis and prognosis of renal injury and renal failure |
| US10823742B2 (en) | 2010-06-23 | 2020-11-03 | Astute Medical, Inc. | Methods and compositions for diagnosis and prognosis of renal injury and renal failure |
| US10830773B2 (en) | 2009-12-20 | 2020-11-10 | Astute Medical, Inc. | Methods for prognosis of future acute renal injury and acute renal failure |
| US10935548B2 (en) | 2011-12-08 | 2021-03-02 | Astute Medical, Inc. | Methods for diagnosis and prognosis of renal injury and renal failure using insulin-like growth factor-binding protein 7 and metalloproteinase inhibitor 2 |
| US11099194B2 (en) | 2013-01-17 | 2021-08-24 | Astute Medical, Inc. | Methods and compositions for diagnosis and prognosis of renal injury and renal failure |
| US11229676B2 (en) | 2013-12-03 | 2022-01-25 | Astute Medical, Inc. | Methods and compositions for diagnosis and prognosis of renal injury and renal failure |
| US11243217B2 (en) | 2016-06-06 | 2022-02-08 | Astute Medical, Inc. | Management of acute kidney injury using insulin-like growth factor-binding protein 7 and tissue inhibitor of metalloproteinase 2 |
| US11243202B2 (en) | 2015-04-09 | 2022-02-08 | Astute Medical, Inc. | Methods and compositions for diagnosis and prognosis of renal injury and renal failure |
| US11346846B2 (en) | 2017-02-06 | 2022-05-31 | Astute Medical, Inc. | Methods and compositions for diagnosis and prognosis of renal injury and renal failure |
| US11718682B2 (en) | 2017-04-05 | 2023-08-08 | Astute Medical, Inc. | Assays for TIMP2 having improved performance in biological samples |
Citations (1)
| Publication number | Priority date | Publication date | Assignee | Title |
|---|---|---|---|---|
| US20160274128A1 (en) * | 2013-01-17 | 2016-09-22 | Astute Medical, Inc. | Methods and compositions for diagnosis and prognosis of renal injury and renal failure |
Family Cites Families (63)
| Publication number | Priority date | Publication date | Assignee | Title |
|---|---|---|---|---|
| US5324634A (en) | 1992-03-31 | 1994-06-28 | The Research Foundation Of State University Of New York | Diagnostic tests measuring gelatinase/inhibitor complexes for detection of aggressive and metastatic cancer |
| JP3569577B2 (en) | 1995-09-04 | 2004-09-22 | 株式会社いかがく | Kit for differential diagnosis of kidney and urinary tract diseases |
| JP3599895B2 (en) | 1996-04-05 | 2004-12-08 | 株式会社いかがく | Kit for early diagnosis of diabetic nephropathy and glomerulonephritis |
| US6218122B1 (en) | 1998-06-19 | 2001-04-17 | Rosetta Inpharmatics, Inc. | Methods of monitoring disease states and therapies using gene expression profiles |
| WO2001028500A2 (en) | 1999-10-18 | 2001-04-26 | The Board Of Trustees Of The University Of Arkansas | Uses of antileukoprotease in carcinoma |
| WO2001088544A2 (en) | 2000-05-17 | 2001-11-22 | Nederlandse Organisatie Voor Toegepast-Natuurwetenschappelijk Onderzoek Tno | Proteolytic enzymes in diagnosis of kidney disorders |
| JP2004504813A (en) | 2000-05-25 | 2004-02-19 | キュラジェン コーポレイション | How to detect inflammatory lung injury |
| WO2002054081A2 (en) | 2000-12-29 | 2002-07-11 | Oxford Glycosciences (Uk) Limited | Proteins, genes and their use for diagnosis and treatment of kidney response |
| ATE479101T1 (en) | 2001-07-12 | 2010-09-15 | Kyowa Medex Co Ltd | METHOD FOR QUANTIFYING DENATURATED LIPOPROTEIN |
| US7138230B2 (en) | 2002-12-06 | 2006-11-21 | Renovar, Inc. | Systems and methods for characterizing kidney diseases |
| AU2003231853A1 (en) | 2002-05-22 | 2003-12-12 | The Cleveland Clinic Foundation | Methods and kits for the detection of renal cell carcinoma in a biological fluid of a patient |
| JP2005120070A (en) | 2003-03-10 | 2005-05-12 | Taisho Pharmaceut Co Ltd | Elastase release-inhibitor and cerebral infarction-treating agent |
| CN1791797A (en) | 2003-03-27 | 2006-06-21 | 儿童医院医疗中心 | A method and kit for detecting the early onset of renal tubular cell injury |
| DK2360475T3 (en) | 2003-03-27 | 2020-01-06 | Childrens Hospital Med Ct | Method and kit for detecting early onset of renal tubular cell damage |
| WO2005002416A2 (en) | 2003-06-04 | 2005-01-13 | Joslin Diabetes Center, Inc. | Predictors of renal disease |
| US20050272101A1 (en) | 2004-06-07 | 2005-12-08 | Prasad Devarajan | Method for the early detection of renal injury |
| CN101010001A (en) | 2004-05-06 | 2007-08-01 | 哥伦比亚大学受托人 | NGAL for reduction and amelioration of ischemic and nephrotoxic injuries |
| EP2604703B1 (en) | 2005-03-14 | 2017-02-01 | The Board of Trustees of the Leland Stanford Junior University | Methods for evaluating graft survival in a solid organ transplant recipient |
| US20070087387A1 (en) | 2005-04-21 | 2007-04-19 | Prasad Devarajan | Method for the Early Detection of Renal Disease Using Proteomics |
| WO2006129849A1 (en) | 2005-06-03 | 2006-12-07 | Mochida Pharmaceutical Co., Ltd. | Anti-cd14 antibody-fused protein |
| CA2619825A1 (en) | 2005-08-19 | 2007-03-01 | Centocor, Inc. | Proteolysis resistant antibody preparations |
| DK1764372T3 (en) | 2005-09-20 | 2009-11-30 | Peter Jon Nelson | Tissue inhibitor of metalloproteinases (TIMP) bound to glycosylphosphatidylinositol (GPI) anchors for cancer treatment |
| WO2007084397A2 (en) | 2006-01-12 | 2007-07-26 | Janssen Pharmaceutica N.V. | Processing of slpi by chymase |
| US20070203216A1 (en) | 2006-02-14 | 2007-08-30 | Bjarke Ebert | Method of treating inflammatory diseases |
| WO2007144781A2 (en) | 2006-04-21 | 2007-12-21 | Diagnotech Pty. Ltd. | Diagnostic methods and kits utilizing antibodies for metalloproteases |
| WO2008084331A2 (en) | 2006-06-21 | 2008-07-17 | Hopitaux Universitaires De Geneve | Biomarkers for renal disorders |
| US20080206794A1 (en) | 2006-09-15 | 2008-08-28 | Renovar Incorporated | Systems And Methods For Characterizing Contrast Induced-Nephropathy |
| US8524462B2 (en) | 2006-11-14 | 2013-09-03 | Alere San Diego, Inc. | Methods and compositions for diagnosis and prognosis of renal artery stenosis |
| EP2500723B1 (en) | 2006-11-14 | 2015-07-08 | Alere San Diego, Inc. | Methods for monitoring and risk prediction in cardiorenal syndrome |
| ES2430290T3 (en) | 2007-03-06 | 2013-11-19 | F. Hoffmann-La Roche Ag | Use of PNC type peptides to predict the need for dialysis |
| JP5105583B2 (en) | 2007-03-14 | 2012-12-26 | 国立大学法人信州大学 | Methods for distinguishing past cardiovascular diseases |
| BRPI0809432A2 (en) | 2007-03-26 | 2014-09-09 | Novartis Ag | PREDICTIVE RENAL SAFETY BIOMARKERS AND BIOMARKERS SIGNATURES TO MONITOR RENAL FUNCTION |
| EP2215481B2 (en) | 2007-11-15 | 2017-01-18 | Bioporto Diagnostics A/S | Diagnostic use of individual molecular forms of a biomarker |
| US20110111427A1 (en) | 2008-02-29 | 2011-05-12 | Kenji Kadomatsu | Biomarker for the estimation of acute renal disorder and prognosis of the disorder, and use of the biomarker |
| CN101358976A (en) | 2008-04-28 | 2009-02-04 | 北京华大吉比爱生物技术有限公司 | Micro array-ELISA detecting kit for detecting six tumor markers |
| EP2743702B1 (en) | 2008-08-28 | 2017-08-09 | Astute Medical, Inc. | Methods and compositions for diagnosis and prognosis of renal injury and renal failure |
| CN105021826A (en) | 2008-08-29 | 2015-11-04 | 阿斯图特医药公司 | Methods and compositions for diagnosis and prognosis of renal injury and renal failure |
| EP2347260A4 (en) | 2008-10-21 | 2012-09-26 | Astute Medical Inc | Methods and compositions for diagnosis and prognosis of renal injury and renal failure |
| EP3246707B1 (en) | 2008-10-21 | 2020-09-30 | Astute Medical, Inc. | Methods and compositions for diagnosis and prognosis of renal injury and renal failure |
| EP2913676A1 (en) | 2008-11-10 | 2015-09-02 | Astute Medical, Inc. | Methods and compositions for diagnosis and prognosis of renal injury and renal failure |
| US9229010B2 (en) | 2009-02-06 | 2016-01-05 | Astute Medical, Inc. | Methods and compositions for diagnosis and prognosis of renal injury and renal failure |
| EP2462440B1 (en) | 2009-08-07 | 2017-05-17 | Astute Medical, Inc. | Methods and compositions for diagnosis and prognosis of renal injury and renal failure |
| NZ599105A (en) | 2009-09-21 | 2014-08-29 | Astute Medical Inc | Methods and compositions for diagnosis and prognosis of renal injury and renal failure |
| MX2009012633A (en) | 2009-11-23 | 2011-05-24 | Univ Mexico Nacional Autonoma | Diagnostic method for detecting acute kidney injury using heat shock protein 72 as a sensitive biomarker. |
| NZ600828A (en) | 2009-12-20 | 2014-09-26 | Astute Medical Inc | Methods and compositions for diagnosis and prognosis of renal injury and renal failure |
| SI2666872T1 (en) | 2010-02-05 | 2016-08-31 | Astute Medical, Inc. | Methods and compositions for diagnosis and prognosis of renal injury and renal failure |
| AU2011220413B2 (en) | 2010-02-26 | 2015-07-23 | Astute Medical, Inc. | Methods and compositions for diagnosis and prognosis of renal injury and renal failure |
| WO2011162821A1 (en) | 2010-06-23 | 2011-12-29 | Astute Medical, Inc. | Methods and compositions for diagnosis and prognosis of renal injury and renal failure |
| US20130210043A1 (en) | 2010-06-23 | 2013-08-15 | Astute Medical, Inc. | Methods and compositions for diagnosis and prognosis of renal injury and renal failure |
| US20130030034A9 (en) | 2010-09-30 | 2013-01-31 | Quark Pharmaceuticals, Inc. | Modulation of timp1 and timp2 expression |
| WO2013043310A1 (en) | 2011-08-26 | 2013-03-28 | Astute Medical, Inc. | Methods and compositions for diagnosis and prognosis of renal injury and renal failure |
| WO2013086359A1 (en) | 2011-12-08 | 2013-06-13 | Astute Medical, Inc. | Methods and compositions for diagnosis and prognosis of renal injury and renal failure |
| CN105556305A (en) | 2013-06-05 | 2016-05-04 | 阿斯图特医药公司 | Methods and compositions for diagnosis and prognosis of renal injury and renal failure |
| CN105531291A (en) | 2013-08-07 | 2016-04-27 | 阿斯图特医药公司 | Assays for timp2 having improved performance in biological samples |
| EP3066221A4 (en) | 2013-11-06 | 2017-09-20 | Astute Medical, Inc. | Assays for igfbp7 having improved performance in biological samples |
| WO2015084939A1 (en) | 2013-12-03 | 2015-06-11 | Astute Medical, Inc. | Methods and compositions for diagnosis and prognosis of renal injury and renal failure |
| JP6792553B2 (en) | 2014-10-20 | 2020-11-25 | アスチュート メディカル,インコーポレイテッド | Methods and compositions for the diagnosis and prognosis of renal damage and failure |
| WO2016164854A1 (en) | 2015-04-09 | 2016-10-13 | Astute Medical, Inc. | Methods and compositions for diagnosis and prognosis of renal injury and renal failure |
| US11243217B2 (en) | 2016-06-06 | 2022-02-08 | Astute Medical, Inc. | Management of acute kidney injury using insulin-like growth factor-binding protein 7 and tissue inhibitor of metalloproteinase 2 |
| WO2018081578A1 (en) | 2016-10-28 | 2018-05-03 | Astute Medical, Inc. | Use of antibodies to timp-2 for the improvement of renal function |
| EP3577458A4 (en) | 2017-02-06 | 2021-04-07 | Astute Medical, Inc. | Methods and compositions for diagnosis and prognosis of renal injury and renal failure |
| EP3606554A4 (en) | 2017-04-05 | 2020-12-09 | Astute Medical, Inc. | Assays for timp2 having improved performance in biological samples |
| US20210025875A1 (en) | 2017-05-07 | 2021-01-28 | Astute Medical, Inc. | Use of insulin-like growth factor-binding protein 7 and tissue inhibitor of metalloproteinase 2 in the management of renal replacement therapy |
-
2018
- 2018-02-06 EP EP18747952.2A patent/EP3577458A4/en not_active Withdrawn
- 2018-02-06 US US16/483,519 patent/US11346846B2/en active Active
- 2018-02-06 WO PCT/US2018/017118 patent/WO2018145117A1/en unknown
- 2018-02-06 CN CN201880019261.4A patent/CN110431422A/en active Pending
-
2022
- 2022-05-27 US US17/827,148 patent/US20230038581A1/en active Pending
Patent Citations (1)
| Publication number | Priority date | Publication date | Assignee | Title |
|---|---|---|---|---|
| US20160274128A1 (en) * | 2013-01-17 | 2016-09-22 | Astute Medical, Inc. | Methods and compositions for diagnosis and prognosis of renal injury and renal failure |
Non-Patent Citations (2)
| Title |
|---|
| HORSTRUP, JH ET AL.: "Elevation of serum and urine levels of TIMP-1 and tenascin in patients with renal disease", NEPHROLOGY, DIALYSIS, TRANSPLANTATION, vol. 17, no. 6, June 2002 (2002-06-01), pages 1005 - 1013, XP055529915 * |
| See also references of EP3577458A4 * |
Cited By (13)
| Publication number | Priority date | Publication date | Assignee | Title |
|---|---|---|---|---|
| US11754566B2 (en) | 2008-10-21 | 2023-09-12 | Astute Medical, Inc. | Methods and compositions for diagnosis and prognosis of renal injury and renal failure |
| US10823733B2 (en) | 2008-10-21 | 2020-11-03 | Astute Medical, Inc. | Methods and compositions for diagnosis and prognosis of renal injury and renal failure |
| US10830773B2 (en) | 2009-12-20 | 2020-11-10 | Astute Medical, Inc. | Methods for prognosis of future acute renal injury and acute renal failure |
| US11262363B2 (en) | 2009-12-20 | 2022-03-01 | Astute Medical, Inc. | Methods and compositions for diagnosis and prognosis of renal injury and renal failure |
| US10823742B2 (en) | 2010-06-23 | 2020-11-03 | Astute Medical, Inc. | Methods and compositions for diagnosis and prognosis of renal injury and renal failure |
| US11761967B2 (en) | 2010-06-23 | 2023-09-19 | Astute Medical, Inc. | Methods and compositions for diagnosis and prognosis of renal injury and renal failure |
| US10935548B2 (en) | 2011-12-08 | 2021-03-02 | Astute Medical, Inc. | Methods for diagnosis and prognosis of renal injury and renal failure using insulin-like growth factor-binding protein 7 and metalloproteinase inhibitor 2 |
| US11099194B2 (en) | 2013-01-17 | 2021-08-24 | Astute Medical, Inc. | Methods and compositions for diagnosis and prognosis of renal injury and renal failure |
| US11229676B2 (en) | 2013-12-03 | 2022-01-25 | Astute Medical, Inc. | Methods and compositions for diagnosis and prognosis of renal injury and renal failure |
| US11243202B2 (en) | 2015-04-09 | 2022-02-08 | Astute Medical, Inc. | Methods and compositions for diagnosis and prognosis of renal injury and renal failure |
| US11243217B2 (en) | 2016-06-06 | 2022-02-08 | Astute Medical, Inc. | Management of acute kidney injury using insulin-like growth factor-binding protein 7 and tissue inhibitor of metalloproteinase 2 |
| US11346846B2 (en) | 2017-02-06 | 2022-05-31 | Astute Medical, Inc. | Methods and compositions for diagnosis and prognosis of renal injury and renal failure |
| US11718682B2 (en) | 2017-04-05 | 2023-08-08 | Astute Medical, Inc. | Assays for TIMP2 having improved performance in biological samples |
Also Published As
| Publication number | Publication date |
|---|---|
| US20230038581A1 (en) | 2023-02-09 |
| US11346846B2 (en) | 2022-05-31 |
| US20200103415A1 (en) | 2020-04-02 |
| CN110431422A (en) | 2019-11-08 |
| EP3577458A1 (en) | 2019-12-11 |
| EP3577458A4 (en) | 2021-04-07 |
Similar Documents
| Publication | Publication Date | Title |
|---|---|---|
| EP3361255B1 (en) | Methods and compositions for diagnosis and prognosis of renal injury and renal failure | |
| AU2009313189B2 (en) | Methods and compositions for diagnosis and prognosis of renal injury and renal failure | |
| US11346846B2 (en) | Methods and compositions for diagnosis and prognosis of renal injury and renal failure | |
| EP2813848A2 (en) | Methods and compositions for diagnosis and prognosis of renal injury and renal failure | |
| AU2009308375A1 (en) | Methods and compositions for diagnosis and prognosis of renal injury and renal failure | |
| CA2751435A1 (en) | Methods and compositions for diagnosis and prognosis of renal injury and failure | |
| EP2894473A1 (en) | Methods and compositions for diagnosis and prognosis of renal injury and renal failure | |
| EP3244213A1 (en) | Methods and compositions for diagnosis and prognosis of renal injury and renal failure | |
| CA2770393A1 (en) | Methods and compositions for diagnosis and prognosis of renal injury and renal failure | |
| CA2965153A1 (en) | Methods and compositions for diagnosis and prognosis of renal injury and renal failure | |
| WO2018145119A1 (en) | Methods and compositions for diagnosis and prognosis of renal injury and renal failure | |
| US20190120858A1 (en) | Methods for evaluating renal injury and renal failure using urine levels of chitinase-3-like protein 1 | |
| US20220113319A1 (en) | Methods and compositions for diagnosis and prognosis of renal injury and renal failure | |
| CA2865559A1 (en) | Methods and compositions for diagnosis and prognosis of renal injury and renal failure | |
| CA2880793A1 (en) | Methods and compositions for diagnosis and prognosis of renal injury and renal failure | |
| US11506672B2 (en) | Follistatin-related protein 3 for diagnosis and prognosis of renal injury and renal failure | |
| US11143658B2 (en) | Methods and compositions for diagnosis and prognosis of renal injury and renal failure | |
| AU2015203434A1 (en) | Methods and compositions for diagnosis and prognosis of renal injury and renal failure | |
| AU2014277715A1 (en) | Methods and compositions for diagnosis and prognosis of renal injury and renal failure | |
| AU2014212609A1 (en) | Methods and compositions for diagnosis and prognosis of renal injury and renal failure |
Legal Events
| Date | Code | Title | Description |
|---|---|---|---|
| 121 | Ep: the epo has been informed by wipo that ep was designated in this application |
Ref document number: 18747952 Country of ref document: EP Kind code of ref document: A1 |
|
| NENP | Non-entry into the national phase |
Ref country code: DE |
|
| ENP | Entry into the national phase |
Ref document number: 2018747952 Country of ref document: EP Effective date: 20190906 |