WO2018083952A1 - 磁気共鳴イメージング装置および酸素摂取率算出方法 - Google Patents
磁気共鳴イメージング装置および酸素摂取率算出方法 Download PDFInfo
- Publication number
- WO2018083952A1 WO2018083952A1 PCT/JP2017/036826 JP2017036826W WO2018083952A1 WO 2018083952 A1 WO2018083952 A1 WO 2018083952A1 JP 2017036826 W JP2017036826 W JP 2017036826W WO 2018083952 A1 WO2018083952 A1 WO 2018083952A1
- Authority
- WO
- WIPO (PCT)
- Prior art keywords
- distribution
- image
- oxygen
- uptake rate
- oxygen uptake
- Prior art date
- Legal status (The legal status is an assumption and is not a legal conclusion. Google has not performed a legal analysis and makes no representation as to the accuracy of the status listed.)
- Ceased
Links
Images


Classifications
-
- A—HUMAN NECESSITIES
- A61—MEDICAL OR VETERINARY SCIENCE; HYGIENE
- A61B—DIAGNOSIS; SURGERY; IDENTIFICATION
- A61B5/00—Measuring for diagnostic purposes; Identification of persons
- A61B5/145—Measuring characteristics of blood in vivo, e.g. gas concentration or pH-value ; Measuring characteristics of body fluids or tissues, e.g. interstitial fluid or cerebral tissue
- A61B5/14542—Measuring characteristics of blood in vivo, e.g. gas concentration or pH-value ; Measuring characteristics of body fluids or tissues, e.g. interstitial fluid or cerebral tissue for measuring blood gases
-
- A—HUMAN NECESSITIES
- A61—MEDICAL OR VETERINARY SCIENCE; HYGIENE
- A61B—DIAGNOSIS; SURGERY; IDENTIFICATION
- A61B5/00—Measuring for diagnostic purposes; Identification of persons
- A61B5/0033—Features or image-related aspects of imaging apparatus, e.g. for MRI, optical tomography or impedance tomography apparatus; Arrangements of imaging apparatus in a room
- A61B5/004—Features or image-related aspects of imaging apparatus, e.g. for MRI, optical tomography or impedance tomography apparatus; Arrangements of imaging apparatus in a room adapted for image acquisition of a particular organ or body part
- A61B5/0042—Features or image-related aspects of imaging apparatus, e.g. for MRI, optical tomography or impedance tomography apparatus; Arrangements of imaging apparatus in a room adapted for image acquisition of a particular organ or body part for the brain
-
- A—HUMAN NECESSITIES
- A61—MEDICAL OR VETERINARY SCIENCE; HYGIENE
- A61B—DIAGNOSIS; SURGERY; IDENTIFICATION
- A61B5/00—Measuring for diagnostic purposes; Identification of persons
- A61B5/05—Detecting, measuring or recording for diagnosis by means of electric currents or magnetic fields; Measuring using microwaves or radio waves
- A61B5/055—Detecting, measuring or recording for diagnosis by means of electric currents or magnetic fields; Measuring using microwaves or radio waves involving electronic [EMR] or nuclear [NMR] magnetic resonance, e.g. magnetic resonance imaging
-
- A—HUMAN NECESSITIES
- A61—MEDICAL OR VETERINARY SCIENCE; HYGIENE
- A61B—DIAGNOSIS; SURGERY; IDENTIFICATION
- A61B5/00—Measuring for diagnostic purposes; Identification of persons
- A61B5/145—Measuring characteristics of blood in vivo, e.g. gas concentration or pH-value ; Measuring characteristics of body fluids or tissues, e.g. interstitial fluid or cerebral tissue
- A61B5/1455—Measuring characteristics of blood in vivo, e.g. gas concentration or pH-value ; Measuring characteristics of body fluids or tissues, e.g. interstitial fluid or cerebral tissue using optical sensors, e.g. spectral photometrical oximeters
- A61B5/14551—Measuring characteristics of blood in vivo, e.g. gas concentration or pH-value ; Measuring characteristics of body fluids or tissues, e.g. interstitial fluid or cerebral tissue using optical sensors, e.g. spectral photometrical oximeters for measuring blood gases
-
- G—PHYSICS
- G01—MEASURING; TESTING
- G01R—MEASURING ELECTRIC VARIABLES; MEASURING MAGNETIC VARIABLES
- G01R33/00—Arrangements or instruments for measuring magnetic variables
- G01R33/20—Arrangements or instruments for measuring magnetic variables involving magnetic resonance
- G01R33/44—Arrangements or instruments for measuring magnetic variables involving magnetic resonance using nuclear magnetic resonance [NMR]
- G01R33/443—Assessment of an electric or a magnetic field, e.g. spatial mapping, determination of a B0 drift or dosimetry
-
- G—PHYSICS
- G01—MEASURING; TESTING
- G01R—MEASURING ELECTRIC VARIABLES; MEASURING MAGNETIC VARIABLES
- G01R33/00—Arrangements or instruments for measuring magnetic variables
- G01R33/20—Arrangements or instruments for measuring magnetic variables involving magnetic resonance
- G01R33/44—Arrangements or instruments for measuring magnetic variables involving magnetic resonance using nuclear magnetic resonance [NMR]
- G01R33/48—NMR imaging systems
- G01R33/54—Signal processing systems, e.g. using pulse sequences ; Generation or control of pulse sequences; Operator console
- G01R33/543—Control of the operation of the MR system, e.g. setting of acquisition parameters prior to or during MR data acquisition, dynamic shimming, use of one or more scout images for scan plane prescription
-
- G—PHYSICS
- G01—MEASURING; TESTING
- G01R—MEASURING ELECTRIC VARIABLES; MEASURING MAGNETIC VARIABLES
- G01R33/00—Arrangements or instruments for measuring magnetic variables
- G01R33/20—Arrangements or instruments for measuring magnetic variables involving magnetic resonance
- G01R33/44—Arrangements or instruments for measuring magnetic variables involving magnetic resonance using nuclear magnetic resonance [NMR]
- G01R33/48—NMR imaging systems
- G01R33/54—Signal processing systems, e.g. using pulse sequences ; Generation or control of pulse sequences; Operator console
- G01R33/56—Image enhancement or correction, e.g. subtraction or averaging techniques, e.g. improvement of signal-to-noise ratio and resolution
- G01R33/5602—Image enhancement or correction, e.g. subtraction or averaging techniques, e.g. improvement of signal-to-noise ratio and resolution by filtering or weighting based on different relaxation times within the sample, e.g. T1 weighting using an inversion pulse
-
- G—PHYSICS
- G01—MEASURING; TESTING
- G01R—MEASURING ELECTRIC VARIABLES; MEASURING MAGNETIC VARIABLES
- G01R33/00—Arrangements or instruments for measuring magnetic variables
- G01R33/20—Arrangements or instruments for measuring magnetic variables involving magnetic resonance
- G01R33/44—Arrangements or instruments for measuring magnetic variables involving magnetic resonance using nuclear magnetic resonance [NMR]
- G01R33/48—NMR imaging systems
- G01R33/54—Signal processing systems, e.g. using pulse sequences ; Generation or control of pulse sequences; Operator console
- G01R33/56—Image enhancement or correction, e.g. subtraction or averaging techniques, e.g. improvement of signal-to-noise ratio and resolution
- G01R33/5608—Data processing and visualization specially adapted for MR, e.g. for feature analysis and pattern recognition on the basis of measured MR data, segmentation of measured MR data, edge contour detection on the basis of measured MR data, for enhancing measured MR data in terms of signal-to-noise ratio by means of noise filtering or apodization, for enhancing measured MR data in terms of resolution by means for deblurring, windowing, zero filling, or generation of gray-scaled images, colour-coded images or images displaying vectors instead of pixels
-
- G—PHYSICS
- G06—COMPUTING OR CALCULATING; COUNTING
- G06T—IMAGE DATA PROCESSING OR GENERATION, IN GENERAL
- G06T1/00—General purpose image data processing
-
- G—PHYSICS
- G01—MEASURING; TESTING
- G01N—INVESTIGATING OR ANALYSING MATERIALS BY DETERMINING THEIR CHEMICAL OR PHYSICAL PROPERTIES
- G01N24/00—Investigating or analyzing materials by the use of nuclear magnetic resonance, electron paramagnetic resonance or other spin effects
- G01N24/08—Investigating or analyzing materials by the use of nuclear magnetic resonance, electron paramagnetic resonance or other spin effects by using nuclear magnetic resonance
-
- G—PHYSICS
- G01—MEASURING; TESTING
- G01R—MEASURING ELECTRIC VARIABLES; MEASURING MAGNETIC VARIABLES
- G01R33/00—Arrangements or instruments for measuring magnetic variables
- G01R33/20—Arrangements or instruments for measuring magnetic variables involving magnetic resonance
- G01R33/44—Arrangements or instruments for measuring magnetic variables involving magnetic resonance using nuclear magnetic resonance [NMR]
- G01R33/48—NMR imaging systems
- G01R33/4818—MR characterised by data acquisition along a specific k-space trajectory or by the temporal order of k-space coverage, e.g. centric or segmented coverage of k-space
- G01R33/4824—MR characterised by data acquisition along a specific k-space trajectory or by the temporal order of k-space coverage, e.g. centric or segmented coverage of k-space using a non-Cartesian trajectory
-
- G—PHYSICS
- G01—MEASURING; TESTING
- G01R—MEASURING ELECTRIC VARIABLES; MEASURING MAGNETIC VARIABLES
- G01R33/00—Arrangements or instruments for measuring magnetic variables
- G01R33/20—Arrangements or instruments for measuring magnetic variables involving magnetic resonance
- G01R33/44—Arrangements or instruments for measuring magnetic variables involving magnetic resonance using nuclear magnetic resonance [NMR]
- G01R33/48—NMR imaging systems
- G01R33/50—NMR imaging systems based on the determination of relaxation times, e.g. T1 measurement by IR sequences; T2 measurement by multiple-echo sequences
-
- G—PHYSICS
- G01—MEASURING; TESTING
- G01R—MEASURING ELECTRIC VARIABLES; MEASURING MAGNETIC VARIABLES
- G01R33/00—Arrangements or instruments for measuring magnetic variables
- G01R33/20—Arrangements or instruments for measuring magnetic variables involving magnetic resonance
- G01R33/44—Arrangements or instruments for measuring magnetic variables involving magnetic resonance using nuclear magnetic resonance [NMR]
- G01R33/48—NMR imaging systems
- G01R33/54—Signal processing systems, e.g. using pulse sequences ; Generation or control of pulse sequences; Operator console
- G01R33/56—Image enhancement or correction, e.g. subtraction or averaging techniques, e.g. improvement of signal-to-noise ratio and resolution
- G01R33/561—Image enhancement or correction, e.g. subtraction or averaging techniques, e.g. improvement of signal-to-noise ratio and resolution by reduction of the scanning time, i.e. fast acquiring systems, e.g. using echo-planar pulse sequences
- G01R33/5615—Echo train techniques involving acquiring plural, differently encoded, echo signals after one RF excitation, e.g. using gradient refocusing in echo planar imaging [EPI], RF refocusing in rapid acquisition with relaxation enhancement [RARE] or using both RF and gradient refocusing in gradient and spin echo imaging [GRASE]
- G01R33/5616—Echo train techniques involving acquiring plural, differently encoded, echo signals after one RF excitation, e.g. using gradient refocusing in echo planar imaging [EPI], RF refocusing in rapid acquisition with relaxation enhancement [RARE] or using both RF and gradient refocusing in gradient and spin echo imaging [GRASE] using gradient refocusing, e.g. EPI
-
- G—PHYSICS
- G01—MEASURING; TESTING
- G01R—MEASURING ELECTRIC VARIABLES; MEASURING MAGNETIC VARIABLES
- G01R33/00—Arrangements or instruments for measuring magnetic variables
- G01R33/20—Arrangements or instruments for measuring magnetic variables involving magnetic resonance
- G01R33/44—Arrangements or instruments for measuring magnetic variables involving magnetic resonance using nuclear magnetic resonance [NMR]
- G01R33/48—NMR imaging systems
- G01R33/54—Signal processing systems, e.g. using pulse sequences ; Generation or control of pulse sequences; Operator console
- G01R33/56—Image enhancement or correction, e.g. subtraction or averaging techniques, e.g. improvement of signal-to-noise ratio and resolution
- G01R33/561—Image enhancement or correction, e.g. subtraction or averaging techniques, e.g. improvement of signal-to-noise ratio and resolution by reduction of the scanning time, i.e. fast acquiring systems, e.g. using echo-planar pulse sequences
- G01R33/5615—Echo train techniques involving acquiring plural, differently encoded, echo signals after one RF excitation, e.g. using gradient refocusing in echo planar imaging [EPI], RF refocusing in rapid acquisition with relaxation enhancement [RARE] or using both RF and gradient refocusing in gradient and spin echo imaging [GRASE]
- G01R33/5617—Echo train techniques involving acquiring plural, differently encoded, echo signals after one RF excitation, e.g. using gradient refocusing in echo planar imaging [EPI], RF refocusing in rapid acquisition with relaxation enhancement [RARE] or using both RF and gradient refocusing in gradient and spin echo imaging [GRASE] using RF refocusing, e.g. RARE
Definitions
- the present invention relates to a magnetic resonance imaging (MRI) technology.
- the present invention relates to an image processing technique for calculating in-vivo oxygen amount characteristics using acquired images.
- the magnetic resonance imaging apparatus is a noninvasive medical diagnostic imaging apparatus using a nuclear magnetic resonance phenomenon in which hydrogen nuclei (protons) placed in a static magnetic field resonate with a high frequency magnetic field having a specific frequency. Since the nuclear magnetic resonance signal changes depending on various physical properties such as proton density and relaxation time, it is possible to evaluate not only the morphology and material evaluation of the lesion, but also the metabolism and blood perfusion of living tissues. At present, it is attempted to predict the therapeutic effect and prognosis by applying this to the evaluation of cerebral ischemic disease and tumor.
- Diagnosis and severity diagnosis of cerebral ischemic disease and tumors can be performed in the tissue by oxygen imaging such as Oxygen Extraction Fraction (OEF) and oxygen saturation within the tumor (StO 2 : Tissue Oxygen Saturation). It is clinically important to assess oxygen metabolism.
- OEF Oxygen Extraction Fraction
- StO 2 Tissue Oxygen Saturation
- PTT Positron Emission Tomography
- FMISO F-labeled fluoroisonidazole
- the PET inspection has a problem in that the inspection time is long and there is radiation exposure.
- the MRI examination has a feature that the burden on the patient can be reduced because the imaging time is short and there is no radiation exposure.
- Several methods have been proposed for calculating the oxygen uptake rate using MRI.
- blood signals in capillaries of living tissue are measured by a plurality of TEs using a speed selective pre-pulse sequence and a spin echo sequence.
- the T2 value of the blood signal is calculated by signal fitting from the measured signal intensities of a plurality of TEs.
- the oxygen uptake rate of the living tissue is calculated using the relationship between the oxygen saturation of the blood acquired separately and the T2 value of the blood signal (see, for example, Patent Document 1).
- Another method is to calculate the oxygen uptake rate from the change in magnetic susceptibility in the living body.
- a method for capturing a change in magnetic susceptibility reflecting the oxygen uptake rate there is a method using a quantitative magnetic susceptibility mapping (QSM) method.
- QSM is a technique for calculating a local magnetic field change caused by a magnetic susceptibility difference between tissues from a phase distribution of MR images and estimating a magnetic susceptibility distribution based on a relational expression between the magnetic field and the magnetic susceptibility.
- a method of calculating the oxygen uptake rate using QSM for example, there is a method of paying attention to only the vein of the magnetic susceptibility distribution calculated by the QSM method and calculating the oxygen saturation in the vein from the magnetic susceptibility (for example, Non-patent document 1).
- caffeine is administered to the subject, and before and after that, the cerebral blood flow (CBF) and the magnetic susceptibility distribution are calculated using an ASL (Arterial Spin Labeling) method and a QSM method, respectively.
- ASL Arterial Spin Labeling
- OEF oxygen metabolism rate
- Patent Document 1 has an advantage that the oxygen uptake rate in the brain parenchyma can be calculated because the T2 value of the blood signal in the capillary of the living tissue is calculated.
- the T2 value of blood changes nonlinearly with the blood composition such as the hematocrit value, there is a problem that it is difficult to calculate the oxygen uptake rate from the T2 value of blood.
- Non-Patent Document 1 has an advantage of high accuracy since the oxygen uptake rate is calculated from the magnetic susceptibility of the vein using the QSM method. However, since only the oxygen uptake rate of venous blood is calculated, there is a problem that the oxygen uptake rate in the brain parenchyma cannot be calculated.
- Non-Patent Document 2 has the advantage that the oxygen uptake rate in the brain parenchyma can be calculated using the QSM method, there is a problem that a load of administering caffeine to the subject has to be given. In addition, there is a problem that the accuracy of the oxygen uptake rate to be calculated is reduced in diseases in which CMRO 2 changes before and after caffeine administration.
- the present invention has been made in view of the above circumstances.
- OEF oxygen uptake rate
- the brain parenchyma can be obtained by simple processing without giving a load such as caffeine administration.
- An object of the present invention is to provide a technique for calculating the OEF in the brain.
- the present invention calculates a physical property value image having a physical property value reflecting an oxygen amount characteristic such as an oxygen uptake rate as a pixel value from a complex image generated from a nuclear magnetic resonance signal. Then, after the calculated physical property value image is separated into at least two types of tissues and any one of the tissue separated images is converted into oxygen amount characteristics, the pixel value of an arbitrary pixel and the average value of surrounding pixels are substantially equal. Based on the above condition, the oxygen amount characteristic distribution for the target region is estimated.
- the MRI apparatus of the present invention includes a transmitter that transmits a high-frequency magnetic field pulse to a subject arranged in a static magnetic field, a receiver that receives a nuclear magnetic resonance signal generated by the subject, and a gradient magnetic field in the static magnetic field.
- a measurement unit having a gradient magnetic field generation unit for providing, a measurement control unit for controlling the operation of the measurement unit according to a preset imaging sequence, and a calculator for performing an operation on the received nuclear magnetic resonance signal,
- An image reconstruction unit that generates a complex image from a nuclear magnetic resonance signal acquired at least one echo time, and a physical property value distribution that calculates a physical property value image having a physical property value reflecting an oxygen amount characteristic as a pixel value
- the tissue separation unit that separates the physical property value image of the target region into at least two types of tissues and generates a plurality of tissue separation images, and each of the plurality of tissue separation images.
- the oxygen amount characteristic conversion unit that converts the physical property value into the oxygen amount characteristic and the tissue separation image after the pixel value is converted into the oxygen amount characteristic
- the pixel value of an arbitrary pixel and the average value of surrounding pixels are substantially
- an oxygen amount characteristic distribution estimating unit that estimates an oxygen amount characteristic distribution of the target region based on a condition of being equal.
- the oxygen content characteristic includes either oxygen uptake rate or oxygen saturation.
- the oxygen amount characteristic distribution in the brain including the brain parenchyma can be calculated by simple processing without giving a load such as caffeine administration to the subject, and diagnostic accuracy is improved.
- FIG. 3B is an external view of a magnetic resonance imaging apparatus with enhanced openness according to an embodiment of the present invention. It is a block diagram which shows schematic structure of the MRI apparatus in embodiment of this invention.
- (A), (b) is a functional block diagram of a computer common to each embodiment, respectively. The figure which shows the flow of processing by the computer of FIG. The figure which shows an example of the pulse sequence used for acquiring the data for complex images The figure which shows the flow of the oxygen uptake rate distribution calculation process in 1st embodiment.
- the figure explaining the tissue separation process in 1st embodiment (A)-(c) is a figure which shows the distribution calculated by each process of 1st embodiment, respectively.
- adopted by 2nd embodiment The figure which shows the flow of the oxygen uptake rate distribution calculation process in 3rd embodiment.
- FIG. 1A to FIG. 1C are external views of an MRI apparatus.
- FIG. 1A shows a horizontal magnetic field type MRI apparatus 100 using a tunnel magnet that generates a static magnetic field with a solenoid coil.
- FIG. 1B shows a hamburger type (open type) vertical magnetic field type MRI apparatus 120 in which magnets are separated into upper and lower sides in order to enhance the feeling of opening.
- FIG. 1C shows an MRI apparatus 130 that uses the same tunnel-type magnet as that in FIG. 1A, shortens the depth of the magnet, and tilts it obliquely to enhance the feeling of opening.
- any of these MRI apparatuses having the appearance can be used.
- various known MRI apparatuses can be used regardless of the form and type of the apparatus.
- the MRI apparatus 100 is representative.
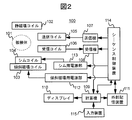
- FIG. 2 is a functional configuration diagram of the MRI apparatus 100 of the present embodiment.
- the MRI apparatus 100 includes a static magnetic field generation apparatus including a static magnetic field coil 102 that generates a static magnetic field in a space where a subject 101 is placed, and a shim coil 104 that adjusts a static magnetic field distribution.
- a transmission high-frequency coil 105 that transmits a high-frequency magnetic field to the measurement region of the subject 101 (hereinafter simply referred to as a transmission coil), and a reception high-frequency coil 106 that receives a nuclear magnetic resonance signal generated from the subject 101 (hereinafter referred to as a transmission coil).
- a gradient magnetic field coil 103 that applies a gradient magnetic field in each of the x direction, the y direction, and the z direction, and a transmitter 107 , A receiver 108, a computer 109, a gradient magnetic field power supply unit 112, a shim power supply unit 113, and a sequence control device 114.
- the elements other than the computer 109 (and the sequence control device 114) are collectively referred to as a measurement unit.
- the static magnetic field generator includes a normal conducting or superconducting static magnetic field coil 102, a static magnetic field generating magnet, and the like, and each MRI shown in FIGS. 1 (a), 1 (b), and 1 (c).
- a normal conducting or superconducting static magnetic field coil 102 a static magnetic field generating magnet, and the like, and each MRI shown in FIGS. 1 (a), 1 (b), and 1 (c).
- various forms are adopted.
- the transmission coil 105 and the transmitter 107 function as a transmission unit, and a high-frequency magnetic field is emitted from the transmission coil by transmitting a high-frequency signal generated by the transmitter 107 to the transmission coil 105.
- the receiving coil 106 and the receiver 18 function as a receiving unit, and the nuclear magnetic resonance signal detected by the receiving coil 106 is sent to the computer 109 through the receiver 108.
- FIG. 2 shows a case where separate transmission coils 105 and reception coils 106 are used, the transmission coil 105 and the reception coil 106 may be configured as a single coil.
- the gradient magnetic field coil 103 and the shim coil 104 are driven by a gradient magnetic field power source 112 and a shim power source 113, respectively.
- the gradient magnetic field coil 103 and the gradient magnetic field power supply unit 112 function as a gradient magnetic field generation unit.
- the sequence controller 114 controls the operations of the gradient magnetic field power supply unit 112 that is a drive power supply for the gradient coil 103, the shim power supply unit 113 that is the drive power supply for the shim coil 104, the transmitter 107, and the receiver 108. Controls the application of a gradient magnetic field, a high-frequency magnetic field, and the reception of a nuclear magnetic resonance signal.
- the control time chart is called a pulse sequence, is preset according to measurement, and is stored in a storage device or the like included in the computer 109 described later.
- a pulse sequence for generating a nuclear magnetic resonance signal including the influence of a predetermined physical property value of a subject is stored.
- the predetermined physical property value is a physical property value reflecting the oxygen amount characteristic of the subject, and is, for example, magnetic susceptibility, R 2 *, or “difference R ′ between R 2 * and R 2 ”.
- R 2 and R 2 * are the reciprocal of the true lateral relaxation time T 2 and the reciprocal of the apparent lateral relaxation time T 2 * , respectively, and can be calculated using a plurality of echo signals having different TEs.
- R 2 * (T 2 * ) is calculated using a gradient echo
- R 2 (T 2 ) is calculated using a spin echo.
- the computer 109 controls the overall operation of the MRI apparatus 100 and performs various arithmetic processes on the received nuclear magnetic resonance signal. In the present embodiment, a complex image, a physical property value distribution, an oxygen uptake rate distribution, and the like of an arbitrary echo time are generated.
- the computer 109 is an information processing apparatus including a CPU, a memory, a storage device, and the like, and a display 110, an external storage device 111, an input device 115, and the like are connected to the computer 109.
- the display 110 is an interface for displaying the results obtained by the arithmetic processing to the operator.
- the input device 115 is an interface for an operator to input conditions, parameters, and the like necessary for measurement and arithmetic processing performed in the present embodiment. For example, the user can input measurement parameters such as the number of echoes to be measured, echo time, and echo interval via the input device 115.
- the external storage device 111 together with the storage device inside the computer 109, holds data used for various types of arithmetic processing executed by the computer 109, data obtained by the arithmetic processing, input conditions, parameters, and the like.
- the computer 109 includes a measurement control unit 310 that measures a nuclear magnetic resonance signal (echo signal) generated from a subject in response to irradiation with a high-frequency magnetic field pulse as a complex signal, and a measurement control unit.
- An image reconstruction unit 320 that reconstructs a complex image having pixel values of complex numbers from complex signals measured by 310, and an oxygen uptake rate distribution calculation that calculates an oxygen uptake rate distribution from the complex image reconstructed by the image reconstruction unit 320.
- Part 330 Details of the oxygen uptake rate distribution calculation unit 330 will be described later.
- the functions of the respective units of the computer 109 described above are realized by the CPU loading and executing a program (software) held by the storage device.
- Various data used for the processing of each function and various data generated during the processing are stored in the storage device or the external storage device 111.
- at least one of the various functions realized by the computer 109 is an information processing apparatus independent of the MRI apparatus 100 and is realized by an information processing apparatus capable of transmitting and receiving data to and from the MRI apparatus 100. It may be.
- all or some of the functions may be realized by hardware such as ASIC (Application Specific Integrated Circuit) or FPGA (Field-programmable gate array).
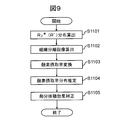
- FIG. 4 shows the flow of operation.
- the measurement control unit 310 controls the sequence control device 114 in accordance with a predetermined pulse sequence, and measures an echo signal having a predetermined echo time (step S1001).
- the image reconstruction unit 320 reconstructs the complex image I by arranging the obtained echo signal in the k space and performing Fourier transform (step S1002).
- the oxygen uptake rate distribution calculation unit 330 calculates a physical property value distribution reflecting the oxygen uptake rate from the complex image, and performs an oxygen uptake rate distribution calculation process for calculating the oxygen uptake rate distribution from the physical property value distribution (step S1003).
- the physical property value image (also referred to as physical property distribution) is separated into a plurality of tissues (tissue separation process). That is, the complex image that is the basis of the physical property value image is an image that targets a desired subject region, for example, the head (brain), and the physical property value image also represents the physical property value of this region.
- the subject region includes a plurality of different tissues, for example, brain parenchyma and blood vessels in the case of the brain.
- the physical property value image is separated into physical property value images for different tissues using the pixel values.
- the separated physical property value image is a tissue separation image.
- the tissue separation process includes a case where a desired single tissue is separated from other tissues, and a plurality of tissue separation images may not necessarily be obtained. Thereafter, a process of converting the pixel value from the physical property value to the oxygen amount characteristic is performed on one of the tissue separation images (conversion process). As a result, oxygen content characteristics can be obtained for the separated tissue.
- conversion process that is, the value of the oxygen amount characteristic
- the oxygen amount characteristic of the subject region of interest is estimated, and an oxygen amount characteristic distribution is obtained. Correction for improving accuracy, for example, partial volume effect correction is performed as necessary.
- step S1004 the calculated oxygen uptake rate distribution is displayed on the display 110 (step S1004).
- an image calculated in the course of the oxygen uptake rate distribution calculation process is displayed on the display 110 as needed in addition to the oxygen uptake rate distribution calculated in step S1003. May be.
- the oxygen uptake rate distribution calculation unit 330 includes a physical property value distribution calculation unit 331 that calculates a physical property value distribution reflecting the oxygen uptake rate from the complex image I, and the calculated physical property value distribution.
- a tissue separation unit 332 that calculates a tissue separation image separated into at least two types of biological tissues, and an oxygen uptake rate conversion unit 333 that converts any of the tissue separation images into pixel values corresponding to the oxygen uptake rate;
- the tissue separation image includes an oxygen uptake rate distribution estimation unit 334 that estimates an oxygen uptake rate distribution based on a condition that a pixel value of an arbitrary pixel and an average value of surrounding pixels are substantially equal.
- the oxygen uptake rate distribution calculation unit 330 may include a correction unit that corrects the estimated oxygen uptake rate distribution calculated by the oxygen uptake rate distribution estimation unit 334.
- the oxygen uptake rate distribution calculation unit 330 corrects the oxygen uptake rate reduced by the partial volume based on the condition that the average value of the oxygen uptake rate of any vein and the oxygen uptake rate of the entire brain is substantially equal.
- a partial volume effect correction unit 335 for obtaining a final oxygen uptake rate distribution.
- the target site (region) is the brain and the oxygen uptake rate distribution of the brain (substantial) is obtained as the oxygen amount characteristic distribution.
- the configuration of the computer 109 in this embodiment is the same as that shown in FIG. 3, but in this embodiment, the physical property value distribution calculation unit 331 in FIG. 3 is replaced with a magnetic susceptibility distribution calculation unit.
- a magnetic susceptibility distribution is calculated as a physical property value, and an oxygen uptake rate distribution is calculated from the magnetic susceptibility distribution.
- tissue separation process veins are separated into other tissues and the vein distribution is calculated.
- the measurement control unit 310 operates the sequence control device 114 in accordance with a pulse sequence set based on a parameter input by the user via the input device 115, and a nuclear magnetic resonance signal (echo) of a predetermined echo time (TE). Signal).
- the sequence control device 114 performs measurement by controlling the measurement unit in accordance with an instruction from the measurement control unit 310. In this embodiment, an echo signal having an arbitrary echo time is obtained.
- a pulse sequence used for measurement by the measurement control unit 310 will be described.
- a GrE (Gradient Echo) pulse sequence is used.
- the image obtained by this GrE-based pulse sequence reflects the oxygen uptake rate of the living tissue sensitively.
- FIG. 5 shows an RSSG (RF-soiled-Steady-state Acquisition with Ground Gradient-Echo) -Multicho sequence 550 as an example of a GrE pulse sequence.
- RF, Gs, Gp, and Gr represent a high-frequency magnetic field, a slice gradient magnetic field, a phase encoding gradient magnetic field, and a readout gradient magnetic field, respectively.
- the slice gradient magnetic field pulse 501 is applied and a high frequency magnetic field (RF) pulse 502 is irradiated to excite magnetization of a predetermined slice in the subject 101.
- RF magnetic field
- a slice encode gradient magnetic field pulse 503 and a phase encode gradient magnetic field pulse 504 for adding position information in the slice direction and the phase encode direction to the magnetization phase are applied.
- readout gradient magnetic field pulse 505 After applying a readout gradient magnetic field pulse 505 for dephasing that disperses the phase of nuclear magnetization in the pixel, readout gradient magnetic field pulses 506, 507, 508, and 509 for adding position information in the readout direction are applied. While measuring nuclear magnetic resonance signals (echo) 510, 511, 512 and 513, respectively. Finally, a re-phase slice encode gradient magnetic field pulse 514 and a phase encode gradient magnetic field pulse 515 for converging the phase of the nuclear magnetization dephased by the slice encode gradient magnetic field pulse 503 and the phase encode gradient magnetic field pulse 504 are applied.
- the measurement control unit 310 performs the above procedure on the intensity of the slice encode gradient magnetic field pulses 503 and 514 (slice encode number ks) and the phase encode gradient magnetic field pulses 504 and 515 (phase encode number kp) and the phase of the RF pulse 502. Is repeatedly executed at a repetition time TR, and an echo necessary for obtaining one image is measured for each echo time. At this time, in order to eliminate the influence of the transverse magnetization remaining after the previous excitation, the phase of the RF pulse 502 is increased by a predetermined amount, for example, 117 degrees. In FIG. 5, the numbers below the hyphen indicate the number of repetitions.
- a Flow Compensation gradient magnetic field pulse that compensates for the influence of a flow such as a blood flow may be applied to each axis.
- Each measured echo is arranged in a three-dimensional k space (memory space) with kr, kp, and ks as coordinate axes. At this time, one echo occupies one line parallel to the kr axis in the k space.
- the absolute value image obtained by the RSSG sequence 550 is a T1 (longitudinal relaxation time) weighted image when the TE is short, and a T2 * weighted image reflecting the phase dispersion in the pixel when the TE is long.
- the RSSG sequence 550 illustrated in FIG. 5 is one of Cartesian imaging that acquires data parallel to the coordinate axis of the k space.
- the k space data acquisition method is arbitrary, for example, a rotational shape in the k space.
- non-Cartesian imaging such as a radial scan for acquiring data may be used.
- an image is obtained for each echo of the multi-echoes 510 to 513 having different TEs, but an echo planer type k-space scanning method (multi-echo echo planar imaging method) that gives different encoding to each echo may be used.
- one complex image may be measured using a sequence for measuring one TE echo.
- the image reconstruction unit 320 calculates a complex image I by performing Fourier transform on the echo signal of the echo time TE arranged in the k-space in step S1001.
- the oxygen uptake rate distribution calculation unit 330 calculates the oxygen uptake rate distribution from the complex image I reconstructed by the image reconstruction unit 320.
- the oxygen uptake rate distribution is an image of the amount of oxygen consumed by the living tissue.
- the physical property value distribution calculation unit 331 first calculates a magnetic susceptibility distribution from the complex image I (S1101).
- the tissue separation unit 332 separates the calculated magnetic susceptibility distribution for at least two types of biological tissues, and calculates a tissue separation image (magnetic susceptibility distribution for each tissue) (S1102).
- the oxygen uptake rate conversion unit 333 converts the pixel value (susceptibility) of any of the tissue separation images into a pixel value corresponding to the oxygen uptake rate (S1103).
- the oxygen uptake rate distribution of the entire target region is estimated based on the condition that the pixel value of an arbitrary pixel and the average value of surrounding pixels are substantially equal (S1104). Correction is performed to increase the accuracy of the estimated oxygen uptake rate distribution as necessary, and a final oxygen uptake rate distribution is obtained (S1105). For example, partial volume effect correction processing is performed. This correction is a process for correcting an error based on the difference between the size of the pixel of the image to be processed and the size of the tissue that contributes to the magnetic susceptibility for each pixel used for estimating the oxygen uptake rate. The oxygen uptake rate decreased by the partial volume is corrected based on the condition that the oxygen uptake rate of an arbitrary vein and the average value of the oxygen uptake rate of the entire brain are substantially equal to the uptake rate distribution.
- the magnetic susceptibility distribution calculator 331 calculates the magnetic susceptibility distribution from the measured phase information (phase image) of the complex image I using the QSM method.
- a method for calculating the magnetic susceptibility distribution using the QSM method is known, and an outline thereof will be described here.
- a local magnetic field change caused by a magnetic susceptibility difference between living tissues is calculated from a phase image captured by the Gradient Echo (GrE) method.
- GrE Gradient Echo
- ⁇ (r) a relative magnetic field change (magnetic field distribution) caused by a magnetic susceptibility difference between tissues
- equation (1) ⁇ (r) represents a phase image
- ⁇ represents a nuclear nuclear magnetic rotation ratio
- B 0 represents a static magnetic field strength
- TE represents an echo time.
- the magnetic field distribution ⁇ (r) is expressed by the following formula (2) using the in-vivo magnetic susceptibility distribution ⁇ (r) from the Maxwell equation regarding the static magnetic field.
- ⁇ represents an angle formed by the vector (r′ ⁇ r) and the static magnetic field direction
- d (r) represents a point dipole magnetic field.
- the magnetic field distribution ⁇ (r) is represented by a convolution integral of the magnetic susceptibility distribution ⁇ (r) and the point dipole magnetic field d (r). Therefore, the formula (2) is converted into the following formula (3) by performing Fourier transform on both sides of the formula (2).
- k (k x , k y , k z ) is a position vector in k space
- ⁇ (k) X (k)
- D (k) are magnetic field distributions ⁇ (r)
- the Fourier component X (k) of the magnetic susceptibility distribution can be calculated by dividing the Fourier component ⁇ (k) of the magnetic field distribution by the Fourier component D (k) of the point dipole magnetic field.
- X (k) cannot be directly calculated.
- the QSM method for estimating the magnetic susceptibility distribution from the magnetic field distribution due to the presence of the magic angle has been reduced to an ill-conditioned inverse problem, and several solutions have been proposed.
- a smoothing process is repeatedly performed on the magnetic susceptibility distribution calculated from the magnetic field distribution under a constraint condition based on the relational expression between the magnetic field and the magnetic susceptibility (Japanese Patent Application by the present inventors).
- the magnetic susceptibility distribution calculated by the TKD (Truncated-based K-space Division) method which calculates the magnetic susceptibility distribution by calculating the magnetic field distribution and the point dipole magnetic field in k space, and the TKD method.
- the magnetic susceptibility distribution calculation unit 331 of this embodiment calculates a quantitative magnetic susceptibility (QSM) distribution using these methods.
- the quantitative magnetic susceptibility distribution may be calculated using any method.
- tissue separation image calculation S1102
- the tissue separation unit 332 calculates a tissue separation image separated into at least two types of biological tissues from the calculated magnetic susceptibility distribution.
- the vein portion is extracted from the magnetic susceptibility distribution calculated by the physical property value distribution calculation unit 331, and the susceptibility distribution of the vein and the susceptibility distribution of other tissues are calculated.
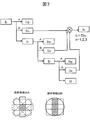
- the morphological filter bank is a processing based on a morphological operation for extracting features from a given image by using an opening process or a top hat transform (for details, see IEICE Technical Report MI 2010-101 (2011-1)). The process is repeated by changing the size of the structural element used for the calculation. That is, as shown in FIG.
- the granular component is first separated from the calculated magnetic susceptibility distribution by top-hat transform using multiple linear structural elements in which the angles of the linear structural elements are three-dimensionally changed, and spherical structural elements are obtained.
- the venous component is separated by top-hat conversion by.
- the original image I 0 is separated into a granular component image I 1P , a blood vessel component image I 1v , and a smoothed image I 1 .
- the top-hat transform is performed again on the separated smoothed image I 1 using a plurality of structural elements whose sizes are increased, and is separated into a granular component image I 2P , a blood vessel component image I 2v , and a smoothed image I 2 .
- FIG. 7 illustrates the case where the number of repetitions is 3, the number of repetitions is arbitrary.
- the venous component is separated, so that the iron protein (ferritin) deposited tissues such as the pneumosphere, the red nucleus, and the substantia nigra which have a high magnetic susceptibility in the magnetic susceptibility distribution are removed.
- the susceptibility distribution of the vein can be calculated.
- the separation process is not limited to this method.
- a small region composed of a plurality of pixels is set in the magnetic susceptibility distribution (image), and the average value and standard deviation of the magnetic susceptibility in this small region are calculated, and the pixel value exceeding the range of average value + N ⁇ standard deviation is obtained.
- You may extract as a vein (N is arbitrary real numbers).
- filters such as a differential filter may be combined. Also, using the absolute value of the image acquired in step S1002 in FIG.
- a vein tissue may be separated to create a mask with the vein region set to 1 and the rest set to 0, and this mask may be applied to the magnetic susceptibility distribution.
- a method using the susceptibility distribution is preferable.
- the oxygen uptake rate conversion unit 333 converts any of the tissue separation images separated into at least two living tissues into an oxygen uptake rate.
- the susceptibility distribution of the vein is converted into an oxygen uptake rate. It is known that the magnetic susceptibility of a vein is proportional to the concentration of deoxyhemoglobin, that is, the oxygen uptake rate.
- oxygen uptake rate can be calculated using equation 4 (Jan Sedlacik other, "Validation of Quantitative Estimation of Tissue oxygen Extraction Fraction and Deoxygenated Blood Volume Fraction in Phantom and in Vivo Experiments by using MRI", Magnetic Resonance in Medicine, 2010, 63, pp. 910-921, see formula 6).
- the hematocrit value is said to be about 0.42 for normal men and 0.38 for normal women.
- magnetic susceptibility difference between the arteriovenous per unit hematocrit Derutakai do is known to be 0.18 ppm (CGS unit system). Therefore, if the magnetic susceptibility difference ⁇ v between the vein and the living tissue can be calculated, it can be converted into vein OEF.
- a value obtained for the subject from a blood test performed separately from the MRI test may be substituted.
- the oxygen uptake rate distribution estimation unit 334 is based on the constraint condition (first condition) that the pixel value of an arbitrary pixel and the average value of surrounding pixels are substantially equal in the vein susceptibility distribution converted into the oxygen uptake rate.
- first condition the constraint condition
- M is a mask (binary mask) in which the target area is 1 and the other areas (for example, areas such as the brain surface) are 0, and r is the radius of the local area that can be estimated to satisfy the first condition. If the spherical kernel of r is ⁇ and the delta function is ⁇ , it can be assumed that the oxygen uptake rate OEF t of the biological tissue (target region) does not change significantly within the radius r.
- the relational expression holds.
- the binary mask M can be created in advance from an absolute value image, and may be the same as the mask used for calculating the magnetic susceptibility distribution or may have a smaller range.
- Equation (5) can be rewritten as Equation (6) using the Fourier transform operator F and the inverse Fourier transform operator F ⁇ 1 .
- a constraint condition (second condition) that the local average value of the oxygen uptake rate OEF v of the vein and the local average value of the oxygen uptake rate OEF t of the living tissue are equal is added, and the formula (6) An oxygen uptake rate OEF t that satisfies the above is calculated. That is, “OEF t ” that minimizes the expression (7) is obtained.
- the first term represents the first condition and the second term represents the second condition.
- ⁇ represents a regularization parameter and is a parameter that controls the degree of influence of the constraint condition.
- the value of ⁇ is typically in the range of 0.1 to 10.0.
- the oxygen uptake rate OEF t of the living tissue is estimated by the minimization process shown in Expression (7), but the present invention is not limited to this method.
- the local average value and the oxygen uptake rate OEF v vein may be used smoothing processing by a Gaussian filter of oxygen uptake rate OEF v vein.
- the partial volume effect correction unit 335 performs partial volume effect correction on the oxygen uptake rate OEF t of the living tissue calculated in S1104.
- the vein oxygen uptake rate OEF v used to calculate the oxygen uptake rate OEF t of the living tissue in S1103 is a small value due to the partial volume effect due to other living tissues included in the pixel for veins smaller than the pixel size. (Partial volume effect). Therefore, it is necessary to correct the decrease in the oxygen uptake rate due to the partial volume effect. For this reason, the partial volume effect correction unit 335 first corrects the oxygen intake rate reduced by the partial volume effect based on the condition that the average value of the oxygen intake rate of any vein and the oxygen intake rate of the entire brain is equal. Correction coefficient (partial volume effect correction coefficient) is calculated.
- the arbitrary vein is preferably a vein that can be regarded as representing the oxygen uptake rate of the entire brain, and is a thick vein such as a sinus.
- the oxygen uptake rate OEF SSS of an arbitrary vein is selected, for example, by selecting one or a plurality of pixels corresponding to an arbitrary vein from an image (magnetic susceptibility distribution image) separated as a vein in the tissue separation process, and the conversion process S1103 Later oxygen uptake rates can be used.
- the partial volume effect correction unit 335 corrects the oxygen uptake rate of each pixel according to the equation (9) using the partial volume effect correction coefficient PVC that satisfies the equation (8). Thereby, the final oxygen uptake rate distribution OEF (i) corrected can be calculated.
- the above-described processes S1101 to S1105 complete the oxygen uptake rate distribution calculation process S1003 in FIG.
- the flow shown in FIG. 6 is an example, and part of the processing is omitted or the order is changed.
- the partial volume effect correction of FIG. 6 may be omitted, or the partial volume effect correction may be performed after calculating the tissue separation image or after converting the oxygen uptake rate.
- smoothing processing using a filter or the like may be performed as appropriate.
- FIG. 8 shows an example of an image obtained at each stage of the above processing S1101 to S1105.
- 8A and 8B are diagrams showing a brain oxygen uptake rate distribution calculated using the QSM method.
- FIG. 8A shows the magnetic susceptibility distribution calculated by the physical property value distribution calculation unit 331, and
- FIG. 8B shows the tissue.
- the vein susceptibility distribution calculated by the separation unit 332 and FIG. 8C are the finally calculated oxygen uptake rate distributions.
- the oxygen uptake rate distribution and the magnetic susceptibility distribution calculated by the oxygen uptake rate distribution calculation unit 330 can be displayed on the display 110 (FIG. 1). Alternatively, it may be stored as image data in the external storage device 111 and displayed on a desired display device.
- the display form is not particularly limited.
- the oxygen uptake rate distribution can be displayed as a contour line or a color map as shown in FIG.
- the oxygen uptake rate distribution in the brain including the brain parenchyma can be calculated by a simple process without applying a load such as caffeine administration, and the diagnostic accuracy Can be improved.
- a tissue separation image is created by separating a tissue, for example, a vein, using a magnetic susceptibility distribution that is linearly related to the oxygen uptake rate and capable of calculating the magnetic susceptibility with high accuracy. Since the rate is estimated, the oxygen uptake rate distribution can be calculated with high accuracy.
- the magnetic susceptibility distribution is used as a physical property value that reflects the oxygen uptake rate, but in this embodiment, in this embodiment, the apparent lateral relaxation as the physical property value distribution that reflects the oxygen uptake rate. Calculate the velocity (R 2 * ) distribution.
- the configurations of the computer 109 and the oxygen uptake rate calculation unit 330 are the same as those in the first embodiment, but the measurement control unit 310 measures echoes of two or more echo times, Control to acquire a plurality of different complex images. Further, processing contents of the physical property value distribution calculating unit 331 and the oxygen uptake rate converting unit 332 are different. Specifically, the physical property value distribution calculation unit 331 calculates an R 2 * distribution from complex images of a plurality of echo times, and the oxygen uptake rate conversion unit 332 calculates each pixel value of the R 2 * distribution as an oxygen uptake. Convert to rate. In the present embodiment, the property value distribution calculation unit 331 in FIG. 3 is read as an R 2 * distribution calculation unit.
- the measurement control unit 310 controls the measurement unit based on a GrE pulse sequence as shown in FIG. 5 and measures a plurality of echoes having different echo times (TE).
- FIG. 5 shows a multi-echo sequence for measuring a plurality of echoes having different TEs after one excitation, but imaging using a sequence for measuring one echo may be executed a plurality of times while changing the TE.
- the image reconstruction unit 320 reconstructs a complex image for each different TE from each echo.
- R 2 * distribution calculating unit 331 the echo time complex image I measured in (TE) (TE), to calculate the R 2 * distribution.
- TE complex image I
- the complex image I is an image including intensity information and phase information.
- an image having intensity information absolute value image
- R 2 * the signal intensity I (TE) at the echo time TE is expressed by Expression (10).
- the proton density distribution M 0 and the apparent lateral relaxation rate distribution R 2 * are obtained by performing the least square fitting of the pixel values of the pixels of the plurality of images having different TEs measured by the GrE method to the signal model of Expression (10). Each can be calculated. Since there are two unknowns in equation (10), the number of images with different TEs may be two or more, but the accuracy of fitting can be increased by increasing the number of images (number of echoes).
- the tissue separation unit 332 calculates a tissue separation image separated into at least two types of biological tissues from the calculated R 2 * distribution. Here extracts the vein from R 2 * distribution, separating and R 2 * Distribution of intravenously, R 2 * distribution otherwise.
- the method for extracting the R 2 * distribution of veins is the same as in the first embodiment. For example, a process using a morphological filter bank (FIG. 7) or a process for discriminating veins from local average values and standard deviations is adopted. can do.
- the oxygen uptake rate conversion unit 333 converts each pixel value (R 2 * value) of the vein R 2 * distribution separated in S1102 into an oxygen uptake rate.
- the R 2 * value of the vein is known to be proportional to the concentration of deoxyhemoglobin, that is, the rate of oxygen uptake (Xiang He et al. , Magnetic Resonance in Medicine, 2007, Vol. 57, pages 115-126).
- the oxygen uptake rate OEF is represented by Formula (11).
- ⁇ represents the nuclear magnetic rotation ratio
- B 0 represents the magnetic field strength.
- ⁇ represents the nuclear magnetic rotation ratio
- B 0 represents the magnetic field strength.
- R 2 is negligibly small compared to the R 2 * value.
- the approximate expression (12) is substituted for the expression (11), and the oxygen uptake rate OEF is calculated from the R 2 * value of the vein. Convert.
- the processing after the oxygen uptake rate conversion that is, the oxygen uptake rate distribution estimation (S1104) and the partial volume effect correction (S1105) are performed in the same manner as in the first embodiment.
- the transverse relaxation rate R 2 * from the brain parenchyma oxygen uptake rate of the apparent can be calculated. Also in this case, the oxygen uptake rate distribution as shown in FIG. 8C can be obtained, and can be appropriately displayed on the display 110 in any display form.
- the oxygen uptake rate is calculated by separating the tissue that can calculate the oxygen uptake rate with high accuracy, and thus the oxygen uptake rate distribution is obtained noninvasively and with high accuracy. be able to. Further, according to the present embodiment, by using the apparent transverse relaxation rate R 2 * as the characteristic value, it is possible to obtain information on a micro structure rather than the magnetic susceptibility distribution, and it is possible to improve the accuracy of tissue separation. As a result, the accuracy of oxygen uptake rate distribution calculation can be improved.
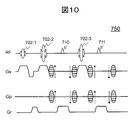
- the measurement control unit 310 acquires a plurality of spin echo (SE) images having different TEs using a pulse sequence for which R 2 is obtained in addition to the pulse sequence of FIG. Get the distribution.
- SE spin echo
- a Multi-echo SE sequence 750 to which inversion pulses 702-2 and 702-3 are added can be used. Although a detailed description of this sequence is omitted, in this sequence, a plurality of echoes 710 and 711 having different TEs are obtained as in the GrE sequence of FIG. These echoes are spin echoes that do not include the influence of static magnetic field inhomogeneity, and the sequence shown in FIG. 10 is repeated with different encoding amounts in the slice direction and the phase encoding direction, thereby generating a plurality of SE image data (k Spatial data) is obtained. The image reconstruction unit 320 reconstructs these image data and obtains a plurality of SE images having different TEs.
- the oxygen uptake rate calculation unit 330 calculates R 2 (physical property value distribution calculation) from a plurality of SE images using a signal attenuation equation similar to Equation (10), and calculates R 2 * and SE calculated from the GrE image. with R 2 calculated from the image can be calculated oxygen uptake rate OEF by equation (11) (oxygen uptake rate conversion). According to this modification, the time of the measurement step (FIG. 3: S1001) becomes long, but more accurate OEF can be calculated. Note that R 2 * and R 2 may be calculated using other pulse sequences, respectively.
- R 2 * is calculated from a plurality of images measured by changing the TE of the 2D GrE-EPI sequence a plurality of times
- R 2 is calculated from a plurality of images measured by changing the TE of the 2D SE-EPI sequence a plurality of times. May be.
- the physical property value distribution calculation unit 331 calculates the apparent lateral relaxation rate R 2 * as a characteristic reflecting the oxygen uptake rate.
- the transverse relaxation rate R 2 * apparent R 2 * and other tissues of the brain parenchyma R 2 * To separate.
- FIG. 11 shows a processing flow of the present embodiment.
- steps having the same contents as those in FIG. 9 are denoted by the same reference numerals, and detailed description thereof is omitted.
- the physical property value calculation unit (R 2 * distribution calculation unit) 331 uses the intensity information of a plurality of images having different TEs to calculate each pixel.
- the apparent lateral relaxation rate R 2 * is calculated to obtain an R 2 * distribution.
- R ′ R 2 * distribution
- the R 2 * distribution and the R ′ distribution will be representatively described as being obtained as the R 2 * distribution.
- Tissue separation image calculation S1102
- Tissue separating unit 332 extracts a vein from R 2 * distribution, to calculate the R 2 * distribution veins.
- the method for extracting the R 2 * distribution of the vein is the same as in the first embodiment. For example, a method of extracting a linear structure using a morphological filter bank for the R 2 * distribution or an absolute value image is used. Use techniques. Then, the difference between the original R 2 * Distribution and veins of R 2 * distribution, calculates R 2 * distribution in the brain parenchyma (called difference R 2 * distribution).
- This process may be performed only on a subject suspected of having ferritin deposition, or may be omitted.
- tissue separation image calculation S1102 when extracting the R 2 * distribution of the vein, as in the first embodiment, granularity is obtained by top-hat conversion using multiple linear structural elements in which the angles of the linear structural elements are three-dimensionally changed.
- the ferritin deposited tissue can be removed by subtracting the R 2 * distribution of the granular component from the original R 2 * distribution. .
- Subsequent oxygen uptake rate conversion (S1103), oxygen uptake rate distribution estimation (S1104), and partial volume effect correction (S1105) are performed in the same manner as in the second embodiment.
- the R 2 * distribution of the brain parenchyma for which the oxygen uptake rate is to be obtained is tissue-separated, and the oxygen uptake rate is calculated from the tissue separation image. Well, you can find the oxygen uptake rate.
- a binary mask is created in which R 2 * of ferritin deposited tissue is zero and the others are one.
- the oxygen uptake rate conversion is performed only for a region that is not masked (a region where the mask value is 1). Only in this unmasked region, the oxygen uptake rate distribution estimation (S1104) using the tissue separation image (oxygen uptake rate image) after the oxygen uptake rate conversion, and the partial volume effect correction may be performed. It is the same as the form.
- the embodiment of the function of the computer 109 of the MRI apparatus has been mainly described.
- the function of the computer 109 can capture image data acquired by the MRI apparatus via a wireless, wired, or portable medium.
- Any image processing apparatus that can be used can be realized by an image processing apparatus independent of the MRI apparatus, and such an image processing apparatus is also included in the present invention.
- SYMBOLS 100 MRI apparatus, 101: Subject, 102: Static magnetic field coil, 103: Gradient magnetic field coil, 104: Shim coil, 105: Transmission coil, 106: Reception coil, 107: Transmitter, 108: Receiver, 109: Calculator, 110: Display, 111: External storage device, 112: Power supply unit for gradient magnetic field, 113: Power supply unit for shim, 114: Sequence control device, 115: Input device, 120: MRI device, 130: MRI device, 310: Measurement control , 320: Image reconstruction unit, 330: Oxygen uptake rate distribution calculation unit, 331: Physical property value distribution calculation unit (magnetic susceptibility distribution calculation unit, R 2 * distribution calculation unit), 332: Tissue separation unit, 333: Oxygen uptake Rate conversion unit, 334: Oxygen uptake rate distribution estimation unit, 335: Partial volume effect correction unit
Landscapes
- Health & Medical Sciences (AREA)
- Physics & Mathematics (AREA)
- Life Sciences & Earth Sciences (AREA)
- Engineering & Computer Science (AREA)
- Nuclear Medicine, Radiotherapy & Molecular Imaging (AREA)
- General Health & Medical Sciences (AREA)
- Radiology & Medical Imaging (AREA)
- High Energy & Nuclear Physics (AREA)
- General Physics & Mathematics (AREA)
- Animal Behavior & Ethology (AREA)
- Surgery (AREA)
- Veterinary Medicine (AREA)
- Public Health (AREA)
- Molecular Biology (AREA)
- Biophysics (AREA)
- Pathology (AREA)
- Biomedical Technology (AREA)
- Heart & Thoracic Surgery (AREA)
- Medical Informatics (AREA)
- Condensed Matter Physics & Semiconductors (AREA)
- Signal Processing (AREA)
- Computer Vision & Pattern Recognition (AREA)
- Artificial Intelligence (AREA)
- Neurology (AREA)
- Optics & Photonics (AREA)
- Theoretical Computer Science (AREA)
- Spectroscopy & Molecular Physics (AREA)
- Magnetic Resonance Imaging Apparatus (AREA)
- Image Analysis (AREA)
- Image Processing (AREA)
Priority Applications (1)
| Application Number | Priority Date | Filing Date | Title |
|---|---|---|---|
| US16/342,612 US10765349B2 (en) | 2016-11-07 | 2017-10-11 | Magnetic resonance imaging device and method for calculating oxygen extraction fractions |
Applications Claiming Priority (2)
| Application Number | Priority Date | Filing Date | Title |
|---|---|---|---|
| JP2016-217307 | 2016-11-07 | ||
| JP2016217307A JP6679467B2 (ja) | 2016-11-07 | 2016-11-07 | 磁気共鳴イメージング装置および酸素摂取率算出方法 |
Publications (1)
| Publication Number | Publication Date |
|---|---|
| WO2018083952A1 true WO2018083952A1 (ja) | 2018-05-11 |
Family
ID=62076118
Family Applications (1)
| Application Number | Title | Priority Date | Filing Date |
|---|---|---|---|
| PCT/JP2017/036826 Ceased WO2018083952A1 (ja) | 2016-11-07 | 2017-10-11 | 磁気共鳴イメージング装置および酸素摂取率算出方法 |
Country Status (3)
| Country | Link |
|---|---|
| US (1) | US10765349B2 (https=) |
| JP (1) | JP6679467B2 (https=) |
| WO (1) | WO2018083952A1 (https=) |
Cited By (1)
| Publication number | Priority date | Publication date | Assignee | Title |
|---|---|---|---|---|
| US11013452B1 (en) * | 2020-03-03 | 2021-05-25 | Heuron Co., Ltd. | Artificial intelligence (AI) based parkinson's disease diagnosing apparatus and method |
Families Citing this family (11)
| Publication number | Priority date | Publication date | Assignee | Title |
|---|---|---|---|---|
| CN108693491B (zh) * | 2017-04-07 | 2022-03-25 | 康奈尔大学 | 稳健的定量磁化率成像系统和方法 |
| EP3301649B1 (en) * | 2017-09-07 | 2019-10-30 | Siemens Healthcare GmbH | Method for processing medical image data and image processing system for medical image data |
| KR102675266B1 (ko) * | 2017-12-04 | 2024-06-14 | 신에쓰 가가꾸 고교 가부시끼가이샤 | 탄화탄탈 피복 탄소 재료 및 그 제조 방법, 반도체 단결정 제조 장치용 부재 |
| US11510584B2 (en) * | 2018-06-15 | 2022-11-29 | Covidien Lp | Systems and methods for video-based patient monitoring during surgery |
| CN108829639B (zh) * | 2018-07-06 | 2023-10-27 | 上海联影医疗科技股份有限公司 | 一种磁共振成像方法和设备 |
| JP7140606B2 (ja) * | 2018-08-29 | 2022-09-21 | 富士フイルムヘルスケア株式会社 | 画像処理装置、画像処理方法、画像処理プログラム及び磁気共鳴イメージング装置 |
| JP7280997B2 (ja) * | 2018-08-29 | 2023-05-24 | 富士フイルムヘルスケア株式会社 | 画像処理装置及び磁気共鳴イメージング装置 |
| CN111096748B (zh) * | 2019-12-19 | 2023-06-02 | 首都医科大学宣武医院 | 一种动态测量脑氧代谢率的方法 |
| CN113009398B (zh) * | 2021-04-08 | 2021-12-17 | 浙江大学 | 结合k空间和图像空间重建的成像方法和装置 |
| CN113571188A (zh) * | 2021-08-02 | 2021-10-29 | 首都医科大学宣武医院 | 一种氧摄取分数的计算方法 |
| CN115530820B (zh) * | 2022-11-30 | 2023-01-31 | 脑玺(苏州)智能科技有限公司 | 一种氧摄取分数测量方法、装置、设备及存储介质 |
Citations (1)
| Publication number | Priority date | Publication date | Assignee | Title |
|---|---|---|---|---|
| JP2015062637A (ja) * | 2013-09-26 | 2015-04-09 | 株式会社日立メディコ | 磁気共鳴イメージング装置、画像処理装置および磁化率画像算出方法 |
Family Cites Families (4)
| Publication number | Priority date | Publication date | Assignee | Title |
|---|---|---|---|---|
| US10010277B2 (en) * | 2006-06-22 | 2018-07-03 | The General Hospital Corporation | Cancer detection by optical measurement of compression-induced transients |
| US8958866B2 (en) * | 2008-03-31 | 2015-02-17 | The General Hospital Corporation | System and method to analyze blood parameters using magnetic resonance imaging |
| JP5843876B2 (ja) * | 2011-10-12 | 2016-01-13 | 株式会社日立製作所 | 磁気共鳴イメージング装置および磁化率強調画像生成方法 |
| WO2016167047A1 (ja) * | 2015-04-15 | 2016-10-20 | 学校法人岩手医科大学 | 磁気共鳴イメージング装置及び画像作成方法 |
-
2016
- 2016-11-07 JP JP2016217307A patent/JP6679467B2/ja active Active
-
2017
- 2017-10-11 US US16/342,612 patent/US10765349B2/en active Active
- 2017-10-11 WO PCT/JP2017/036826 patent/WO2018083952A1/ja not_active Ceased
Patent Citations (1)
| Publication number | Priority date | Publication date | Assignee | Title |
|---|---|---|---|---|
| JP2015062637A (ja) * | 2013-09-26 | 2015-04-09 | 株式会社日立メディコ | 磁気共鳴イメージング装置、画像処理装置および磁化率画像算出方法 |
Non-Patent Citations (4)
| Title |
|---|
| BOLAR, D. S. ET AL.: "Imagine of Oxygenation", PROC. INTL. SOC. MAG. RESON. MED. 23 (ISMRM15), 2015, pages 1 - 11, XP055503301, Retrieved from the Internet <URL:https://www.mr.ethz.ch/intern/ISMRM/ISMRM15/PDFfiles/ISMRM2015-008327.pdf> * |
| DIMOV, A. ET AL.: "Estimation of Blood Oxygenation using Quantitative Susceptibility Mapping, ISMRM, 23", INSTITUTE OF NAVIGATION, 2015 * |
| MCDANIEL, P. ET AL.: "Improved Accuracy in Susceptibility-based OEF Measurements by Mitigation of Partial-Volume Effects via Combined Magnitude and Phase Reconstruction", PROC. INTL. SOC. MAG. RESON. MED. 23 (ISMRM 23RD), 2015 * |
| ZHANG, J. ET AL.: "High Resolution Cerebral Metabolic Rate of Oxygen [CMRO2] using Quantitative Susceptibility Mapping (QSM) and an Oxygen Extractioi Fraction (OEF) Constraint", PROC. INTL. SOC. MAG. RESON. MED. 23 (ISMRM15), 2015 * |
Cited By (1)
| Publication number | Priority date | Publication date | Assignee | Title |
|---|---|---|---|---|
| US11013452B1 (en) * | 2020-03-03 | 2021-05-25 | Heuron Co., Ltd. | Artificial intelligence (AI) based parkinson's disease diagnosing apparatus and method |
Also Published As
| Publication number | Publication date |
|---|---|
| JP6679467B2 (ja) | 2020-04-15 |
| US10765349B2 (en) | 2020-09-08 |
| JP2018075075A (ja) | 2018-05-17 |
| US20190261906A1 (en) | 2019-08-29 |
Similar Documents
| Publication | Publication Date | Title |
|---|---|---|
| JP6679467B2 (ja) | 磁気共鳴イメージング装置および酸素摂取率算出方法 | |
| EP2145200B1 (en) | Diffusion tensor imaging of moving objects | |
| US8958866B2 (en) | System and method to analyze blood parameters using magnetic resonance imaging | |
| JP6289664B2 (ja) | 磁気共鳴イメージング装置、定量的磁化率マッピング方法、計算機、磁化率分布計算方法、及び、磁化率分布計算プログラム | |
| US10379189B2 (en) | Simultaneous magnetic resonance angiography and perfusion with nuclear magnetic resonance fingerprinting | |
| Haneder et al. | Quantitative and qualitative 23Na MR imaging of the human kidneys at 3 T: before and after a water load | |
| US20160313428A1 (en) | Methods and devices for optimization of contrast inhomogeneity correction in magnetic resonance imaging | |
| JP6533571B2 (ja) | 磁気共鳴イメージング装置及び画像作成方法 | |
| WO2017175570A1 (ja) | 磁気共鳴イメージング装置、及び、画像処理方法 | |
| JP2018075075A5 (https=) | ||
| EP3956674A1 (en) | System and method for free-breathing quantitative multiparametric mri | |
| Seemann et al. | Imaging gravity-induced lung water redistribution with automated inline processing at 0.55 T cardiovascular magnetic resonance | |
| Canales-Rodríguez et al. | Deconvolution in diffusion spectrum imaging | |
| CN116888489B (zh) | 分析医学图像的方法 | |
| Kathiravan et al. | A review of magnetic resonance imaging techniques | |
| Gui et al. | A tractography comparison between turboprop and spin-echo echo-planar diffusion tensor imaging | |
| US12262982B2 (en) | Systems and methods for detecting small physiological or pathological changes using high resolution magnetic resonance imaging | |
| US11406277B2 (en) | Methods for determining contrast agent concentration using magnetic resonance imaging | |
| EP4575541A1 (en) | Magnetic resonance imaging with multiple contrasts | |
| US20250283963A1 (en) | Multi-Spectral Susceptibility-Weighted Magnetic Resonance Imaging | |
| Adlung | Efficient Quantification of In-Vivo 23Na Magnetic Resonance Imaging | |
| WO2019049443A1 (ja) | 磁気共鳴イメージング装置 | |
| Huang et al. | Instantaneous Abdominal T2* Mapping via Single‐Shot MOLED Under Free‐Breathing: A Preliminary Study of Hepatic Glycometabolism Imaging | |
| Ruppel | Advancements in Hyperpolarized Xenon MRI: Methodological Exploration and Image Reconstruction for Enhanced Assessment of Pulmonary Disease | |
| Dai et al. | Instantaneous T 2 Mapping via Reduced Field of View Multiple Overlapping-Echo Detachment Imaging: Application in Free-Breathing Abdominal and Myocardial Imaging |
Legal Events
| Date | Code | Title | Description |
|---|---|---|---|
| 121 | Ep: the epo has been informed by wipo that ep was designated in this application |
Ref document number: 17866626 Country of ref document: EP Kind code of ref document: A1 |
|
| NENP | Non-entry into the national phase |
Ref country code: DE |
|
| 122 | Ep: pct application non-entry in european phase |
Ref document number: 17866626 Country of ref document: EP Kind code of ref document: A1 |