WO2017217325A1 - データ復元装置、顕微鏡システム、およびデータ復元方法 - Google Patents
データ復元装置、顕微鏡システム、およびデータ復元方法 Download PDFInfo
- Publication number
- WO2017217325A1 WO2017217325A1 PCT/JP2017/021420 JP2017021420W WO2017217325A1 WO 2017217325 A1 WO2017217325 A1 WO 2017217325A1 JP 2017021420 W JP2017021420 W JP 2017021420W WO 2017217325 A1 WO2017217325 A1 WO 2017217325A1
- Authority
- WO
- WIPO (PCT)
- Prior art keywords
- image
- evaluation value
- photon detection
- estimated
- photon
- Prior art date
Links
- 238000000034 method Methods 0.000 title claims description 52
- 238000011084 recovery Methods 0.000 title abstract 3
- 238000011156 evaluation Methods 0.000 claims abstract description 47
- 238000001514 detection method Methods 0.000 claims abstract description 29
- 230000003287 optical effect Effects 0.000 claims abstract description 9
- 238000012545 processing Methods 0.000 claims description 19
- 238000004364 calculation method Methods 0.000 claims description 12
- 238000003384 imaging method Methods 0.000 claims description 11
- 238000013213 extrapolation Methods 0.000 claims description 6
- 238000007476 Maximum Likelihood Methods 0.000 description 21
- 238000005259 measurement Methods 0.000 description 20
- 230000006870 function Effects 0.000 description 17
- 238000004458 analytical method Methods 0.000 description 16
- 239000000523 sample Substances 0.000 description 14
- 238000010586 diagram Methods 0.000 description 11
- 230000005540 biological transmission Effects 0.000 description 9
- 239000005090 green fluorescent protein Substances 0.000 description 6
- 101100282455 Arabidopsis thaliana AMP1 gene Proteins 0.000 description 3
- 108010043121 Green Fluorescent Proteins Proteins 0.000 description 3
- 102000004144 Green Fluorescent Proteins Human genes 0.000 description 3
- 101100218464 Haloarcula sp. (strain arg-2 / Andes heights) cop2 gene Proteins 0.000 description 3
- 240000004808 Saccharomyces cerevisiae Species 0.000 description 3
- 230000000875 corresponding effect Effects 0.000 description 3
- 239000012472 biological sample Substances 0.000 description 2
- 238000004590 computer program Methods 0.000 description 2
- 238000007796 conventional method Methods 0.000 description 2
- 230000000694 effects Effects 0.000 description 2
- 230000005284 excitation Effects 0.000 description 2
- 238000001914 filtration Methods 0.000 description 2
- 238000001000 micrograph Methods 0.000 description 2
- 239000002096 quantum dot Substances 0.000 description 2
- 230000003595 spectral effect Effects 0.000 description 2
- 241000961787 Josa Species 0.000 description 1
- 230000003321 amplification Effects 0.000 description 1
- 238000004891 communication Methods 0.000 description 1
- 238000001816 cooling Methods 0.000 description 1
- 230000002596 correlated effect Effects 0.000 description 1
- 238000005286 illumination Methods 0.000 description 1
- 230000004807 localization Effects 0.000 description 1
- 239000000463 material Substances 0.000 description 1
- 238000000691 measurement method Methods 0.000 description 1
- QSHDDOUJBYECFT-UHFFFAOYSA-N mercury Chemical compound [Hg] QSHDDOUJBYECFT-UHFFFAOYSA-N 0.000 description 1
- 229910052753 mercury Inorganic materials 0.000 description 1
- 238000002493 microarray Methods 0.000 description 1
- 238000000386 microscopy Methods 0.000 description 1
- 238000012986 modification Methods 0.000 description 1
- 230000004048 modification Effects 0.000 description 1
- 238000003199 nucleic acid amplification method Methods 0.000 description 1
- 101150015999 sec24 gene Proteins 0.000 description 1
- 239000000126 substance Substances 0.000 description 1
- 239000000758 substrate Substances 0.000 description 1
- 239000013076 target substance Substances 0.000 description 1
- 230000004304 visual acuity Effects 0.000 description 1
- 229910052724 xenon Inorganic materials 0.000 description 1
- FHNFHKCVQCLJFQ-UHFFFAOYSA-N xenon atom Chemical compound [Xe] FHNFHKCVQCLJFQ-UHFFFAOYSA-N 0.000 description 1
Images


Classifications
-
- G06T5/73—
-
- G—PHYSICS
- G02—OPTICS
- G02B—OPTICAL ELEMENTS, SYSTEMS OR APPARATUS
- G02B21/00—Microscopes
- G02B21/36—Microscopes arranged for photographic purposes or projection purposes or digital imaging or video purposes including associated control and data processing arrangements
- G02B21/365—Control or image processing arrangements for digital or video microscopes
-
- G—PHYSICS
- G01—MEASURING; TESTING
- G01N—INVESTIGATING OR ANALYSING MATERIALS BY DETERMINING THEIR CHEMICAL OR PHYSICAL PROPERTIES
- G01N21/00—Investigating or analysing materials by the use of optical means, i.e. using sub-millimetre waves, infrared, visible or ultraviolet light
- G01N21/62—Systems in which the material investigated is excited whereby it emits light or causes a change in wavelength of the incident light
- G01N21/63—Systems in which the material investigated is excited whereby it emits light or causes a change in wavelength of the incident light optically excited
- G01N21/64—Fluorescence; Phosphorescence
- G01N21/645—Specially adapted constructive features of fluorimeters
- G01N21/6456—Spatial resolved fluorescence measurements; Imaging
- G01N21/6458—Fluorescence microscopy
-
- G—PHYSICS
- G02—OPTICS
- G02B—OPTICAL ELEMENTS, SYSTEMS OR APPARATUS
- G02B21/00—Microscopes
-
- G—PHYSICS
- G02—OPTICS
- G02B—OPTICAL ELEMENTS, SYSTEMS OR APPARATUS
- G02B21/00—Microscopes
- G02B21/16—Microscopes adapted for ultraviolet illumination ; Fluorescence microscopes
-
- G—PHYSICS
- G06—COMPUTING; CALCULATING OR COUNTING
- G06T—IMAGE DATA PROCESSING OR GENERATION, IN GENERAL
- G06T1/00—General purpose image data processing
-
- G—PHYSICS
- G06—COMPUTING; CALCULATING OR COUNTING
- G06T—IMAGE DATA PROCESSING OR GENERATION, IN GENERAL
- G06T3/00—Geometric image transformation in the plane of the image
- G06T3/40—Scaling the whole image or part thereof
-
- G—PHYSICS
- G06—COMPUTING; CALCULATING OR COUNTING
- G06T—IMAGE DATA PROCESSING OR GENERATION, IN GENERAL
- G06T5/00—Image enhancement or restoration
- G06T5/20—Image enhancement or restoration by the use of local operators
-
- G—PHYSICS
- G06—COMPUTING; CALCULATING OR COUNTING
- G06T—IMAGE DATA PROCESSING OR GENERATION, IN GENERAL
- G06T7/00—Image analysis
- G06T7/0002—Inspection of images, e.g. flaw detection
-
- G—PHYSICS
- G06—COMPUTING; CALCULATING OR COUNTING
- G06T—IMAGE DATA PROCESSING OR GENERATION, IN GENERAL
- G06T7/00—Image analysis
- G06T7/70—Determining position or orientation of objects or cameras
- G06T7/73—Determining position or orientation of objects or cameras using feature-based methods
- G06T7/74—Determining position or orientation of objects or cameras using feature-based methods involving reference images or patches
-
- H—ELECTRICITY
- H04—ELECTRIC COMMUNICATION TECHNIQUE
- H04N—PICTORIAL COMMUNICATION, e.g. TELEVISION
- H04N23/00—Cameras or camera modules comprising electronic image sensors; Control thereof
- H04N23/60—Control of cameras or camera modules
-
- G—PHYSICS
- G01—MEASURING; TESTING
- G01N—INVESTIGATING OR ANALYSING MATERIALS BY DETERMINING THEIR CHEMICAL OR PHYSICAL PROPERTIES
- G01N21/00—Investigating or analysing materials by the use of optical means, i.e. using sub-millimetre waves, infrared, visible or ultraviolet light
- G01N21/62—Systems in which the material investigated is excited whereby it emits light or causes a change in wavelength of the incident light
- G01N21/63—Systems in which the material investigated is excited whereby it emits light or causes a change in wavelength of the incident light optically excited
- G01N21/64—Fluorescence; Phosphorescence
-
- G—PHYSICS
- G06—COMPUTING; CALCULATING OR COUNTING
- G06T—IMAGE DATA PROCESSING OR GENERATION, IN GENERAL
- G06T2207/00—Indexing scheme for image analysis or image enhancement
- G06T2207/10—Image acquisition modality
- G06T2207/10056—Microscopic image
-
- G—PHYSICS
- G06—COMPUTING; CALCULATING OR COUNTING
- G06T—IMAGE DATA PROCESSING OR GENERATION, IN GENERAL
- G06T2207/00—Indexing scheme for image analysis or image enhancement
- G06T2207/10—Image acquisition modality
- G06T2207/10064—Fluorescence image
-
- G—PHYSICS
- G06—COMPUTING; CALCULATING OR COUNTING
- G06T—IMAGE DATA PROCESSING OR GENERATION, IN GENERAL
- G06T2207/00—Indexing scheme for image analysis or image enhancement
- G06T2207/30—Subject of image; Context of image processing
- G06T2207/30168—Image quality inspection
Definitions
- the present invention relates to a data restoration technique by deconvolution.
- An image (including a still image and a moving image) measured with a microscope or the like is an image in which diffraction blur occurs in the spatial structure of the observation target object.
- the measurement image (IM) and true object (OBJ) are obtained using the point spread function (PSF) of the photographic optical system.
- Measurement image (IM) Point spread function (PSF) * Object (OBJ) It can be expressed.
- “*” represents convolution.
- Non-Patent Document 1 In the deconvolution method for a microscope image as shown in Non-Patent Document 1, a large SN ratio is required to restore information outside the transmission band of the microscope objective lens. For this reason, the conventional deconvolution software obtains a restored image by removing out-of-band information with a filter or using an asymptotic method for noise countermeasures.
- Non-Patent Document 1 since information outside the band is removed by a filter, there is a limit to the fine structure that can be restored. In addition, since the estimation method is point estimation, the reliability is ambiguous.
- Non-Patent Document 2-4 and Patent Document 1-2 Although spatial resolution is improved, it is difficult to achieve both time resolution and time resolution.
- the present invention aims to realize super-resolution with which the reliability can be quantitatively evaluated by an index and the spatial resolution is further improved as compared with the conventional technique.
- the first aspect of the present invention is: Acquisition means for acquiring a photon detection number distribution of an image obtained from the imaging optical system; Restoring means for obtaining an estimated image from the photon detection distribution using an IPSF (inverse function of the point spread function PSF) obtained in advance; Evaluation value calculation means for calculating an evaluation value representing the probability that the image is a correct image for the estimated image and a plurality of images similar to the estimated image; Output means for generating and outputting physical parameters such that the evaluation value is equal to or greater than the significance level;
- a data restoration device comprising:
- the PSF is generated from an image obtained by photographing a point light source
- the IPSF is generated from the image obtained by photographing the PSF and the point light source using band extrapolation.
- the captured image does not include a frequency component outside the transmission band of the optical system, a frequency component outside the transmission band can be obtained by extrapolation from information within the transmission band.
- the above-mentioned photon detection number distribution is preferably obtained by photon counting. That is, it is preferable that the acquisition unit obtains the photon detection number distribution by obtaining the number of detected photons from each of a plurality of images photographed so as to be capable of counting photons. In particular, it is preferable to obtain the photon detection number distribution from a plurality of images taken under a single photon condition, assuming that one photon is detected at the center of the luminance distribution. In order to obtain such a photon detection number distribution, the obtaining unit may obtain an image photographed by a microscope including an image intensifier and an imaging device, and obtain a photon detection number distribution based on the obtained image.
- the luminance obtained by the imaging device also represents the distribution of the number of detected photons
- the luminance value of the photographed image may be used as the distribution of the number of detected photons.
- the evaluation value in the present invention can be a value representing the probability that the photon detection number distribution is obtained when the estimated image is assumed to be a correct image.
- the error evaluation may be performed by, for example, a maximum likelihood estimation method, a Bayes estimation method, a least square method, or the like, and the evaluation value may be a value corresponding to the error evaluation method.
- Examples of physical parameters in the present invention include an image representing an observation object, a shape and position, and an edge.
- the output means When outputting an image of the observation object as the physical parameter, the output means performs binning processing based on the estimated image and a plurality of images similar to the estimated image, and generates an image having an evaluation value equal to or higher than a significant level. Output.
- the output includes not only displaying on a display device but also storing in a storage device and transmitting by a communication device.
- the present invention can be regarded as a microscope system including a microscope including an image intensifier and an imaging device, and the data restoration device.
- a microscope including an image intensifier and an imaging device
- the data restoration device it is desirable that the microscope can be photographed at high speed and with high resolution so that photons can be counted.
- the present invention can also be understood as a data restoration device (image restoration device) or a microscope system including at least a part of the above means.
- the present invention can also be understood as a data restoration method (image restoration method) including at least a part of the above processing or a measurement method in a microscope system.
- the present invention can also be understood as a computer program for causing a computer to execute this method, or a computer-readable storage medium in which this computer program is stored non-temporarily.
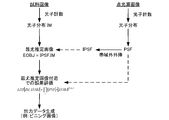
- FIG. 1 is a diagram for explaining an overview of image restoration processing according to the present technique.
- FIG. 2 is a diagram for explaining photon detection.
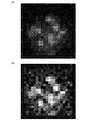
- 3A is a diagram showing the detected photon distribution IM of the captured image
- FIG. 3B is a diagram showing the restoration result IPSF.IM.
- FIG. 4 is a diagram for explaining the relationship between the binning process and the variation in the number of photons.
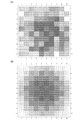
- 5A and 5B are diagrams for explaining section estimation.
- 6A is a diagram showing the restoration result IPSF.IM
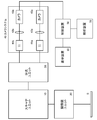
- FIG. 7 is a diagram illustrating a configuration of the microscope system according to the present embodiment.
- FIG. 8 is a flowchart showing the flow of PSF and IPSF determination processing.
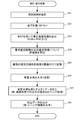
- FIG. 9 is a flowchart showing the flow of measurement and image restoration processing.
- Deconvolution can be said to be processing for returning a high-frequency component damaged by diffraction blur, and noise is enhanced when deconvolution is performed on an image mixed with high-frequency noise. Therefore, in the prior art, out-of-band information is removed by a filter or an asymptotic method is used for noise countermeasures. In such a method, information is discarded, and sufficient high resolution cannot be achieved. Therefore, in the present invention, super-resolution is performed without discarding out-of-band information.
- a measurement image is obtained using a highly accurate measurement system.
- a highly accurate measurement system refers to a system capable of counting photons.
- FIG. 1 is a diagram showing the overall flow of an image restoration method according to the present invention.
- a sample for observation biological sample or the like
- a sample for optical characteristic evaluation a minute point light source such as Q-Dot (quantum dot)
- Q-Dot quantum dot
- FIG. 2 shows an enlarged portion of a part (one photon) of the photographed image. Since the photographed image is a result of amplifying one photon by the image intensifier, it can be counted that one photon is detected at the center position. By performing this process on time-series images taken at high speed, the frequency of photon detection in a three-dimensional space + four-dimensional space can be obtained.
- the photon detection number distribution obtained from the captured image is also simply referred to as a captured image.
- PSF Point Spread Function
- IPSF Inverse PSF
- the point light source image does not include components outside the transmission band of the imaging system, but information outside the transmission band is extrapolated from information within the transmission band based on the condition that the size of the field of view is finite. Can be obtained (Non-patent Document 5). In this method, the IPSF is determined by extrapolating the band in this way.
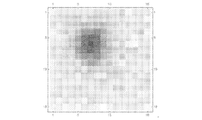
- FIG. 3A shows an example of the sample image IM (photon detection distribution)
- FIG. 3B shows the restoration result (IPSF * IM).
- the restoration result is filled with amplified high frequency noise.
- 3A and 3B show an enlarged view of one of the yeast SEC24s on COP2 vesicles labeled with green fluorescent protein GFP.
- the evaluation function (likelihood function) LHF can be defined as follows.
- PSF [r] .OBJ represents a probability that a photon is detected at the position r when the estimated image EOBJ is assumed to be a correct image.
- the likelihood function LHF represents a probability that the measurement image IM is obtained when the estimated image EOBJ is assumed to be a correct image.
- the evaluation function LHF is an upward convex function
- the error can be evaluated by calculating the likelihood for the estimated image around the maximum likelihood estimated value.
- 5A and 5B show evaluation values of the estimated image near the maximum likelihood estimated value.
- FIG. 5A shows a case where the estimated image EOBJ is 2 pixels
- the amount of calculation and the amount of data increase. However, the amount of calculation and the amount of data can be reduced by obtaining the evaluation values only near the maximum likelihood estimation value.
- a reliable image can be obtained by binning to a reliable level (adding adjacent pixels to enlarge the pixels). For example, even when the restored image composed of 3 pixels is not more than the significance level (FIG. 5B), it is possible to obtain a restored image of the significance level or more (FIG. 5A) by using 2 pixels by binning. it can.
- FIG. 6A shows an estimated image EOBJ
- FIG. 6B is an image obtained as a result of binning to a reliable level by giving an appropriate significance level.
- the final output is an image format here, how the restoration information is output is arbitrary.
- the microscope in this embodiment needs to perform imaging at high speed and high resolution under a single photon condition.
- the single photon condition is a condition that the number of photons detected for one irradiation is 1 or less.
- An example of such a measuring apparatus is a confocal scanner microscope system (see Patent Document 3) capable of high-speed imaging.
- the configuration will be briefly described.
- FIG. 7 is a diagram showing a schematic configuration of the confocal scanner microscope system according to the present embodiment.
- the confocal scanner microscope system generally includes a Nipo disk type scanner unit 10 with a microlens disk, a microscope unit 20, a spectroscopic unit 30, a camera system 40, a control device 50, a display device 60, and an analysis device 70.
- the scanner unit 10 mainly includes a light source unit, a microlens disk, and a pinhole disk.
- the light source unit is an apparatus that irradiates the fluorescent material marking the substance to be observed with excitation light having an excitation wavelength.
- the light source unit one or more light sources such as a laser light source, an ultra-high pressure mercury lamp, a xenon lamp, and an ultraviolet LED are used depending on the type of fluorescence emitted from the observation target.
- the microlens disk and the pinhole disk are opposed to each other, and each microlens on the microlens disk focuses incident laser light on the corresponding pinhole on the pinhole disk.
- the amount of light passing through the pinhole disk is greatly improved by the light collection by the microlens array. Further, the reflected light (noise light) on the disk surface other than the pinhole is reduced, and the SN ratio is also improved.
- the laser light emitted from the pinhole of the pinhole disk excites the sample S through the microscope unit 20.
- the fluorescence emitted from the sample S passes through the pinhole disk of the scanner unit 10 through the microscope unit 20 again, is reflected by the dichroic mirror, and is guided to the observation optical path system.
- the spectroscopic unit 30 branches the two lights included in the fluorescence by a dichroic mirror or the like. Although the light is branched into two here, it may be branched into three or more, or only one wavelength of light may be photographed without branching.
- the camera system 40 includes a number of image intensifiers 41, relay lenses 42, and cameras 43 corresponding to the number of branches.
- the image intensifier 41 amplifies the photon detection signal by about 100 to 10,000 times, and outputs the input weak optical image as an enhanced output image.
- the output light of the image intensifier 41 is collected by the relay lens 42 and enters the camera 43.
- the camera 43 is a high-speed and high-sensitivity camera using, for example, sCMOS.
- the camera 43 outputs image data representing the captured image to the control device 50. It is desirable for both the image intensifier 41 and the camera 43 to suppress noise by cooling.
- the control device 50 is a normal computer including a microprocessor and a storage device, and controls the entire microscope system.
- the control device 50 stores the image data obtained from the camera 43 in the storage device so that the analysis device 70 can perform reconstruction processing later.
- On the display device 60 an image acquired from the camera 43, a screen representing an operating state during measurement, and the like are displayed.
- FIG. 8 is a flowchart of the process of determining the point spread function PSF and its inverse function IPSF.
- a minute point light source evaluation sample
- Q-Dot quantum dot
- step S12 the analysis device 70 obtains a photon detection position from each captured image.
- a photographed image is obtained by amplifying one photon by an image intensifier and photographing a region having a spread. Therefore, the analysis device 70 counts that one photon is detected at the center of this region. By detecting photons for each captured image, a three-dimensional distribution of photon detection frequencies can be obtained.
- step S13 the analysis device 70 determines a PSF using a captured image (photon distribution) of a point light source.
- the analysis device 70 obtains the IPSF from the PSF and the captured image of the point light source by extrapolation of the band.
- spectral information outside the transmission band can be obtained using spectral information within the transmission band.
- the PSF can be obtained by an algebraic method.
- the analysis device 70 stores the PSF and IPSF obtained as described above in the memory.
- FIG. 8 is a flowchart showing the flow of measurement processing and analysis processing of the measurement object.
- step S21 a sample to be observed (biological sample or the like) is measured under a single photon condition. At this time, a three-dimensional image is obtained by continuously capturing images while changing the Z position at high speed.
- step S22 the analysis device 70 obtains a photon detection position from each captured image. Since this process is the same as step S12, detailed description thereof is omitted.
- the captured image at time t k is I k (x, y)
- the detected photon distribution I ′ k (x, y) has a value 1 at the detection position and a value 0 at other positions.
- an image obtained by integrating images taken during a certain time range t ⁇ a to t + a is treated as a snapshot of a three-dimensional image at time t.
- the time a is a short time in which the movement of the sample can be ignored. However, it may be handled as a four-dimensional image taking time changes into account, or may be handled as a two-dimensional image of only a specific plane.
- the estimated image OBJ EST restored in this manner is a maximum likelihood estimated image (maximum likelihood estimated value) that maximizes the evaluation value (likelihood), that is, an image with the highest probability of being a correct image. .
- step S24 the analysis device 70 calculates an evaluation value for error evaluation for the estimated image near the maximum likelihood estimated value.
- an error evaluation method a maximum likelihood method, a Bayes method, a least square method, or the like can be used. It is also preferable that the user can specify which evaluation method is used.
- the maximum likelihood method is used will be described as an example.
- the evaluation function LHF is defined as follows.
- the analysis device 70 calculates the likelihood (evaluation value) for the estimated image OBJ ′ EST near the maximum likelihood estimated value OBJ EST .
- “near” the maximum likelihood estimated value may be defined as appropriate.
- an image (five pixels ) obtained by adding a variation of ⁇ 2 to +2 to each pixel value of the maximum likelihood estimated value OBJ EST can be defined as “near” the maximum likelihood estimated value.
- the width of the variation value may be different for each pixel, or the variation values given to a plurality of pixels may be correlated.
- the likelihood function in consideration of the probability distribution of the noise characteristics. Thereby, the likelihood can be made more appropriate.
- step S25 the analysis device 70 stores a plurality of estimated images OBJ ′ EST near the maximum likelihood estimated value OBJ EST obtained in steps S24 and S25 in association with the likelihood in the memory as intermediate data. Based on this data, section estimation and data output in various display formats are possible.
- step S26 the analysis device 70 determines a significance level for section estimation. For example, a significant level input is received from the user.
- step S27 the analysis device 70 performs data processing so as to satisfy the significance level.
- a binning process is performed. Binning that satisfies the significance level may be determined in any way. Simply, the number of pixels to be combined into one pixel is gradually increased, and the time point at which an image with a likelihood (evaluation value) equal to or higher than the significance level is obtained for the first time may be determined.
- step S28 the analysis device 70 outputs (displays) processed data (that is, an image after binning processing in this example) having a likelihood (evaluation value) equal to or higher than a significance level to the display device 60 or stores it in a memory. Or store.
- restoration by extrapolation of the band can be realized based on an image obtained by a high-speed and highly accurate measurement system. Since there is no loss of information due to the filtering process, the original data and the restored data are converted one-to-one, and the ambiguity as in the prior art is eliminated. Furthermore, since the number of photons is obtained by photon counting, strict error evaluation can be performed based on the number. By performing error evaluation in the vicinity of the estimated value, the reliability of the estimation can be quantitatively evaluated. By this error evaluation, a reliable restoration result can be obtained without performing noise removal by filter processing.
- This method can be suitably applied to measurement using a sequencer or a microarray.
- observation target substances such as DNA samples are arranged in a lattice pattern
- the bright spot positions are always the same. Since the bright spot positions are discrete and determined, the number of dimensions of the estimated image can be reduced by using it as a constraint condition in the calculation process in this method, so that the calculation amount can be reduced and the restoration accuracy can be improved.
- the lattice density can be increased, and effects such as an increase in parallel processing capability, substrate miniaturization, and sample miniaturization can be obtained, thereby improving measurement throughput.
- photon counting is performed using an image intensifier under single photon conditions.
- the present technique can be used, and it is not always necessary to obtain a detection photon distribution by photon counting.
- the distribution of the number of photons may be obtained from the brightness value of the camera without performing counting using an image intensifier.
- Scanner unit 20 Microscope unit 30: Spectroscopic unit 40: Camera system 50: Control device 60: Display device 70: Analysis device
Abstract
データ復元装置は、撮像光学系から得られる像の光子検出数分布を取得する取得手段と、あらかじめ求められているIPSF(点像分布関数PSFの逆関数)を用いて前記光子検出分布から推定画像を取得する復元手段と、前記推定画像および当該推定画像と類似する複数の画像について、当該画像が正解画像である確からしさを表す評価値を算出する評価値算出手段と、評価値が有意水準以上となるような物理パラメータを生成し出力する出力手段と、を備える。
Description
本発明は、デコンボリューションによるデータ復元技術に関する。
顕微鏡などにおいて測定される画像(静止画像と動画像を含む)は、観察対象物体の空間構造に回折ボケが生じた画像となる。測定画像(IM)と真の物体(OBJ)は、撮影光学系の点像分布関数(PSF)を用いて、
測定画像(IM) = 点像分布関数(PSF)*物体(OBJ)
と表せる。ここで「*」は畳み込みを表す。
測定画像(IM) = 点像分布関数(PSF)*物体(OBJ)
と表せる。ここで「*」は畳み込みを表す。
したがって、測定画像(IM)にPSFの逆畳み込み核(IPSF)を畳み込むことにより、元の超解像画像を得ることができる(IPSF*IM = IPSF*PSF*OBJ = OBJ)。これがデコンボリューション法の原理である。
非特許文献1に示すような顕微鏡画像に対するデコンボリューション法において、顕微鏡の対物レンズの透過帯域外の情報を復元するためには、大きなSN比が要求される。このため、従来のデコンボリューションソフトでは、ノイズ対策のために、帯域外の情報をフィルタにより除去したり漸近法を用いたりすることで復元画像を得ている。
また、超解像画像を得る方法として、デコンボリューション法以外に、SIM(structured illumination microscopy),Localization法,エアリースキャン法(非特許文献2-4,特許文献1-2参照)などがある。
Agard D A and Sedat J W 1983 Nature 302 676-81
Heintzmann R and Cremer C 1999 Proc. SPIE 3568 185-96
Gustafsson M G L 2000 J. Microsc. 198 82-7
Rust M J et al 2006 Nat. Methods 3 793-5
Harris, James L. "Diffraction and Resolving Power." JOSA 54.7 (1964): 931-936.
しかしながら、非特許文献1のデコンボリューション法では、帯域外の情報をフィルタにより除去しているため、復元可能な微細構造には限界がある。また、推定法も点推定のため、信頼性が曖昧である。
非特許文献2-4や特許文献1-2に記載の方法によると、空間的分解能は改善するものの時間分解能との両立が困難である。
このような問題を考慮して、本発明は、信頼性を指標によって定量的に評価可能であり空間分解能を従来よりもさらに向上させた超解像化を実現することを目的とする。
本発明の第一の態様は、
撮像光学系から得られる像の光子検出数分布を取得する取得手段と、
あらかじめ求められているIPSF(点像分布関数PSFの逆関数)を用いて前記光子検出分布から推定画像を取得する復元手段と、
前記推定画像および当該推定画像と類似する複数の画像について、当該画像が正解画像である確からしさを表す評価値を算出する評価値算出手段と、
評価値が有意水準以上となるような物理パラメータを生成し出力する出力手段と、
を備えることを特徴とするデータ復元装置である。
撮像光学系から得られる像の光子検出数分布を取得する取得手段と、
あらかじめ求められているIPSF(点像分布関数PSFの逆関数)を用いて前記光子検出分布から推定画像を取得する復元手段と、
前記推定画像および当該推定画像と類似する複数の画像について、当該画像が正解画像である確からしさを表す評価値を算出する評価値算出手段と、
評価値が有意水準以上となるような物理パラメータを生成し出力する出力手段と、
を備えることを特徴とするデータ復元装置である。
ここで、前記PSFは点光源を撮影した画像から生成され、前記IPSFは、前記PSFおよび前記点光源を撮影した画像から帯域外外挿を用いて生成される、ことが好ましい。撮影画像には光学系の透過帯域外の周波成分は含まれないが、透過帯域内の情報から外挿によって透過帯域外の周波成分を得ることができる。
上述の光子検出数分布は、光子計数によって取得することが好ましい。すなわち、前記取得手段は、光子計数可能に撮影された複数の画像のそれぞれから光子の検出数を求めて前記光子検出数分布を得ることが好ましい。特に、単一光子条件で撮影された複数の画像のそれぞれから、輝度分布の中心に1つの光子が検出されたものとして前記光子検出数分布を得ることが好ましい。このような光子検出数分布を得るために、前記取得手段は、イメージインテンシファイアと撮像装置を含む顕微鏡によって撮影された画像を取得し、それに基づいて光子検出数分布を得るとよい。
なお、撮像装置によって得られる輝度も光子検出数の分布を表すといえるので、撮影画像の輝度値を光子検出数分布として用いても構わない。
本発明における前記評価値は、推定画像が正解画像であると仮定したときに、前記光子検出数分布が得られる確率を表す値とすることできる。誤差評価は、たとえば、最尤推定法、ベイズ推定法、最小二乗法などにより行うことが考えられ、評価値は誤差評価方法に応じた値を用いればよい。
本発明における物理パラメータの例として、観察対象物を表す画像、形状および位置、エッジが挙げられる。観察対象物の画像を上記物理パラメータとして出力する場合には、前記出力手段は、前記推定画像およびそれに類似する複数の画像に基づいてビニング処理を行い評価値が有意水準以上となる画像を生成して出力するとよい。なお、出力とは表示装置に表示することだけでなく、記憶装置に記憶することや、通信装置によって送信することを含む。
本発明は、イメージインテンシファイアと撮像装置を含む顕微鏡と、上記のデータ復元装置とを含む顕微鏡システムと捉えることができる。ここで、顕微鏡は、光子計数可能なように高速かつ高分解能で撮影できるものであることが望ましい。
なお、本発明は、上記手段の少なくとも一部を備えるデータ復元装置(画像復元装置)または顕微鏡システムとして捉えることもできる。また、本発明は上記の処理の少なくとも一部を含むデータ復元方法(画像復元方法)または顕微鏡システムにおける測定方法として捉えることもできる。また、本発明は、この方法をコンピュータに実行させるためのコンピュータプログラム、あるいはこのコンピュータプログラムを非一時的に記憶したコンピュータ可読記憶媒体として捉えることもできる。上記手段および処理の各々は可能な限り互いに組み合わせて本発明を構成することができる。
本発明によれば、信頼性を指標によって定量的に評価可能であり、かつ空間分解能を従来よりもさらに向上させた超解像化が可能になる。
以下、図面を参照しながら、本発明に係る顕微鏡画像の超解像化手法について説明する。
<概要>
デコンボリューションは回折ボケによって損なわれた高周波数成分を戻す処理といえるので、高周波ノイズが混じった画像にデコンボリューションを施すとノイズが強調される。そこで、従来技術では、ノイズ対策のために帯域外の情報をフィルタにより除去したり漸近法を用いたりしている。このような手法では情報が棄てられてしまうので、十分な高解像化が行えない。そこで、本発明では、帯域外の情報を棄てずに超解像化を行う。
デコンボリューションは回折ボケによって損なわれた高周波数成分を戻す処理といえるので、高周波ノイズが混じった画像にデコンボリューションを施すとノイズが強調される。そこで、従来技術では、ノイズ対策のために帯域外の情報をフィルタにより除去したり漸近法を用いたりしている。このような手法では情報が棄てられてしまうので、十分な高解像化が行えない。そこで、本発明では、帯域外の情報を棄てずに超解像化を行う。
本手法では、高精度な測定システムを用いて測定画像を得る。ここでいう高精度な測定システムとは、光子計数が可能なシステムを指す。特に、単一光子条件、すなわち光子の像が重ならずに各光子を観察できる条件での測定を行うことが好ましい。
図1は、本発明にかかる画像復元手法の全体の流れを示す図である。まず、上述のような高精度な測定システムを用いて、観察目的の試料(生体試料等)と光学特性評価用試料(Q-Dot(量子ドット)などの微小点光源)をそれぞれ撮影する。ここでは、それぞれの画像を、試料画像および点光源画像と称する。
図2は撮影画像の一部分(1光子)を拡大した部分を示す。撮影画像は、イメージインテンシファイアによって1光子が増幅された結果であるので、その中心位置に1つの光子が検出されたとカウントできる。高速で撮影した時系列画像についてこの処理を行うことで、3次元空間+時間の4次元の空間上での光子の検出頻度が得られる。なお、以下では撮影画像から得られる光子検出数分布のことも単に撮影画像と称する。
この過程でイメージインテンシファイアの増幅の揺らぎとカメラのノイズが除去されるため、通常のカメラの撮影画像よりもSN比が向上する。さらに検出光子数の絶対値が得られる。
まず、PSF(Point Spread Function)を、点光源画像の光子分布を用いて求める。次に、IPSF(Inverse PSF)を、PSFと点光源画像の光子分布を用いて求める。ここで、点光源画像には撮像系の透過帯域外の成分が含まれないが、視野の大きさが有限であるという条件に基づいて、透過帯域内の情報から外挿によって透過帯域外の情報を得ることができる(非特許文献5)。本手法では、このように帯域外外挿を行ってIPSFを決定する。
試料画像の光子分布に対してIPSFを畳み込むことにより、試料の正解画像を復元できる。図3(A)は試料画像IM(光子検出分布)の例を示し、図3(B)はその復元結果(IPSF*IM)を示す。復元結果は、増幅された高周波のノイズで満たされている。なお、図3(A)(B)はいずれも、緑色蛍光タンパク質GFPで標識したCOP2小胞上の酵母SEC24の1つを拡大して示している。
図4に示すように、検出光子数が有限の場合には、検出光子数には確率的なばらつきが生じ、これが高周波ノイズの主要な成分である。また、同じ光子数でもばらつき(揺らぎ)はピクセルサイズに依存して変化する。この揺らぎがデコンボリューションにより増幅され、図3(B)のような結果となる。
本手法においては、光子数を求めているので、それに基づく厳密な誤差評価を行う。誤差評価のための具体的な評価関数は目的に応じて決定すればよいが、ここでは尤度を評価関数として用いる例を説明する。この場合、評価関数(尤度関数)LHFは次のように定義できる。

ここで、f(r)は、画像IMにおいて位置rで検出された光子数を全光子数Nで割った値(すなわちIM={f(r)})、EOBJは推定画像である。PSF[r].OBJは、推定画像EOBJが正解画像であると仮定したときに位置rにおいて光子が検出される確率を表す。尤度関数LHFは、推定画像EOBJが正解画像であると仮定したときに測定画像IMが得られる確率を表す。
評価値(尤度)を最大とする推定画像EOBJ(最尤推定値)はIPSF*{f(r)}(図3(B))である。PSF[r].EOBJは総和が1なので、イェンゼンの不等式から、f(r)=PSF[r].EOBJの時のみ尤度関数LHFが最大値を取ることを示せる。
さらに、評価関数LHFは上に凸な関数なので、最尤推定値の周りの推定画像について尤度を計算すると誤差を評価できる。図5(A)(B)は、最尤推定値付近での推定画像の評価値を表す。簡単のために、図5(A)は推定画像EOBJが2画素の場合、図5(B)は推定画像EOBJが3画素の場合を示すが、推定画像EOBJは実際にはより多数の画素(たとえば、1003~10003=106~109画素)からなる。想定される推定画像の全てに対して評価値を求めると計算量・データ量が多くなるが、最尤推定値付近のみの評価値を求めることで計算量およびデータ量を削減できる。
図5(A)に示すように有意水準を決めれば区間推定が可能であり、その区間を表現する画像を直感的に理解しやすい形で出力する。具体的な一例として、信頼できる水準までビニング(隣り合う画素を加算して画素を大きくする)すれば、信頼できる画像が得られる。たとえば、3画素からなる復元画像がいずれも有意水準以上でない場合(図5(B))でも、ビニングによって2画素にすることで有意水準以上の復元画像(図5(A))を得ることができる。図6(A)は推定画像EOBJを示し、図6(B)は適当な有意水準を与えて信頼できる水準までビニングした結果の画像である。ビニングによってピクセルあたりの光子数を十分大きくすることで、高信頼で高分解能な画像が得られる。
最尤推定値(最尤推定元画像)の周りにおける推定画像とその評価値を関連付けたデータを保存しておけば、有意水準を変更した場合の画像を容易に生成できる。また、ここでは最終的な出力を画像形式としているが、復元情報をどのように出力するかは任意である。
本手法によれば、従来のデコンボリューションでは諦められていた帯域外外挿による復元を実現している。フィルタ処理による情報の欠落が無くなるため、元データと復元後のデータが1対1変換となり、従来のような曖昧さが無くなる。さらに最尤推定値の近傍において誤差評価を行うことで、推定の信頼性を定量的に議論できる。
なお、本手法においては、実際の数値計算においては計算精度も厳密に決めて、近似計算は行わない。これは誤差評価を精密に行うためである。そのため、計算量が従来よりも大きくなるため、並列計算や対称性を利用した計算量低減を行う。
<装置構成>
本実施形態における顕微鏡は単一光子条件で高速かつ高分解能に撮影を行う必要がある。単一光子条件とは、1回の照射に対して検出される光子が1個以下であるという条件である。このような測定装置として、高速撮影可能な共焦点スキャナ顕微鏡システム(特許文献3参照)が挙げられる。ここでは、その構成を簡単に説明する。
本実施形態における顕微鏡は単一光子条件で高速かつ高分解能に撮影を行う必要がある。単一光子条件とは、1回の照射に対して検出される光子が1個以下であるという条件である。このような測定装置として、高速撮影可能な共焦点スキャナ顕微鏡システム(特許文献3参照)が挙げられる。ここでは、その構成を簡単に説明する。
図7は、本実施形態に係る共焦点スキャナ顕微鏡システムの概要構成を示す図である。共焦点スキャナ顕微鏡システムは、大略、マイクロレンズディスク付きのニポウディスク型スキャナユニット10、顕微鏡ユニット20、分光ユニット30、カメラシステム40、制御装置50、表示装置60、解析装置70からなる。
スキャナユニット10は、主に、光源部、マイクロレンズディスク、ピンホールディスクを備える。光源部は、観察対象である物質をマーキングしている蛍光物質に対して励起波長を有する励起光を照射する装置である。光源部として、レーザ光源、超高圧水銀灯、キセノンランプ、紫外線LEDなど、観察対象から発せられる蛍光の種類に応じて単数または複数の光源が用いられる。
マイクロレンズディスクとピンホールディスクは対抗配置され、マイクロレンズディスク上の各マイクロレンズは、入射するレーザ光を対応するピンホールディスク上のピンホール上に集光する。マイクロレンズアレイによる集光によってピンホールディスクを通過する光量は大幅に向上する。また、ピンホール以外のディスク表面での反射光(ノイズ光)が減少し、SN比も向上する。ピンホールディスクのピンホールから出射されたレーザ光は、顕微鏡ユニット20を介して、試料Sを励起する。試料Sから出た蛍光は再び顕微鏡ユニット20を介してスキャナユニット10のピンホールディスクを通過し、ダイクロイックミラーで反射して観察光路系に導かれる。
分光ユニット30は、ダイクロイックミラー等によって、蛍光に含まれる2つの光を分岐する。ここでは2つに分岐しているが、3つ以上に分岐してもよいし、分岐せずに1つの波長の光のみを撮影するようにしてもよい。なお、カメラシステム40は、分岐数に応じた数のイメージインテンシファイア41、リレーレンズ42、カメラ43で構成される。
イメージインテンシファイア41は、フォトンの検出信号を100倍から10000倍程度増幅することで、入力された微弱な光学像を増強された出力像として出力する。イメージインテンシファイア41の出力光は、リレーレンズ42により集光されてカメラ43に入射する。カメラ43は、例えばsCMOSを用いた高速・高感度のカメラである。カメラ43は、撮影画像を表す画像データを、制御装置50に出力する。イメージインテンシファイア41およびカメラ43はいずれも冷却によりノイズを抑制することが望ましい。
制御装置50は、マイクロプロセッサや記憶装置などを含む通常のコンピュータであり、顕微鏡システム全体の制御を司る。制御装置50は、カメラ43から得られる画像データを解析装置70によって後から再構成処理するために記憶装置に蓄積する。表示装置60には、カメラ43から取得された画像や、測定中の動作状態を表す画面などが表示される。
<処理内容>
[PSFおよびIPSFの決定]
図8は、点像分布関数PSFおよびその逆関数IPSFの決定処理のフローチャートである。ステップS11において、Q-Dot(量子ドット)のような微小点光源(評価用試料)を単一光子条件下で測定する。この際、たとえば、高速にZ位置を変えて撮影することによって3次元画像を得る。この際、システムのノイズ特性の確率分布も測っておく。
[PSFおよびIPSFの決定]
図8は、点像分布関数PSFおよびその逆関数IPSFの決定処理のフローチャートである。ステップS11において、Q-Dot(量子ドット)のような微小点光源(評価用試料)を単一光子条件下で測定する。この際、たとえば、高速にZ位置を変えて撮影することによって3次元画像を得る。この際、システムのノイズ特性の確率分布も測っておく。
解析装置70は、ステップS12において、それぞれの撮影画像から光子の検出位置を求める。撮影画像には図2に示すように、イメージインテンシファイアによって1光子が増幅されて拡がりを有する領域が撮影される。そこで、解析装置70は、この領域の中心に1つの光子が検出されたものとして計数する。それぞれの撮影画像について光子を検出することで、光子の検出頻度の3次元分布が得られる。
解析装置70は、ステップS13において、点光源の撮影画像(光子分布)を用いてPSFを決定する。解析装置70は、ステップS13において、PSFと点光源の撮影画像から、帯域外外挿によってIPSFを求める。上述したように、観測視野が有限の大きさしか持たないときは、透過帯域内のスペクトル情報を用いて、透過帯域外のスペクトル情報を得ることができる。PSFは代数的手法によって求めることができる。
解析装置70は、以上のようにして求められたPSFおよびIPSFをメモリに記憶する。
[測定・復元処理]
図8は、測定対象物の測定処理および解析処理の流れを示すフローチャートである。
図8は、測定対象物の測定処理および解析処理の流れを示すフローチャートである。
ステップS21において、観察目的の試料(生体試料等)を単一光子条件下で測定する。この際、高速にZ位置を変えて連続的に撮影することによって3次元画像を得る。
解析装置70は、ステップS22において、それぞれの撮影画像から光子の検出位置を求める。この処理は、ステップS12と同様であるため詳しい説明は省略する。時刻tkにおける撮影画像をIk(x, y)としたときに、検出光子分布I'k(x, y)は検出位置で値1、それ以外の位置で値0とする。
以下では、ある時間範囲t-aからt+aのあいだに撮影された画像を統合したものを、時刻tにおける3次元画像のスナップショットとして取り扱う。具体的には、次のようにして時刻tにおける光子の3次元分布IM= f(x, y, z)を得る。

ここで時間aは試料の移動を無視できる短い時間とする。ただし、時間変化も考慮した4次元画像として扱ってもよいし、特定の平面のみの2次元画像として扱ってもよい。
次にステップS23において、解析装置70は、3次元光子分布f(x, y, z)に対してIPSFを掛けることによって、推定画像OBJEST = IPSF.{f(x,y,z)}を得る。後述するようにこのようにして復元される推定画像OBJESTは、評価値(尤度)を最大にする最尤推定画像(最尤推定値)すなわち正解画像である確からしさが最も高い画像である。
ステップS24において、解析装置70は最尤推定値付近の推定画像について、誤差評価のための評価値を算出する。誤差評価手法として、最尤法、ベイズ法、最小二乗法などを用いることができる。どの評価手法を用いるかをユーザが指定可能とすることも好ましい。以下では、最尤法を用いる場合を例に説明する。
最尤法では、評価関数LHFを次のように定義する。

PSF.EOBJは総和が1なので、イェンゼンの不等式からf(x,y,z)=PSF.EOBJの時のみLHFが最大値を取る。すなわち、EOBJ=IPSF.{f(x,y,z)}=OBJESTが最尤推定値である。
解析装置70は、最尤推定値OBJEST付近の推定画像OBJ'ESTについて尤度(評価値)を算出する。ここで、最尤推定値の「付近」は適宜定義すればよい。たとえば、最尤推定値OBJESTの各画素値に-2から+2の変動を加えた画像(5画素数個)を、最尤推定値の「付近」と定義することができる。もっとも、変動値の幅は画素ごとに異なっていてもよいし、複数の画素に与える変動値に相関を持たせてもよい。
なお、PSFの測定処理においてシステムのノイズ特性の確率分布も測っている場合には、ノイズ特性の確率分布も考慮して尤度関数を定義することが好ましい。これにより、尤度をより適正なものすることができる。
ステップS25において、解析装置70は、ステップS24,S25において求めた最尤推定値付近OBJESTの複数の推定画像OBJ'ESTをその尤度と関連付けて中間データとしてメモリに記憶する。このデータをもとに、区間推定や種々の表示形式でのデータ出力が可能となる。
ここでは、測定試料を画像形式で表示する場合を例に説明する。ステップS26において、解析装置70は、区間推定のための有意水準を決定する。たとえば、ユーザから有意水準の入力を受け付ける。
ステップS27において、解析装置70は、有意水準を満たすようにデータ加工を行う。測定試料を画像形式で表示する場合には、ビニング処理を施す。有意水準を満たすようなビニングは、どのように決定してもよい。単純には、1つの画素にまとめる画素数を徐々に増やしていき、尤度(評価値)が有意水準以上となる画像が初めて得られる時点を決定すればよい。解析装置70は、ステップS28において、有意水準以上の尤度(評価値)を有する加工後のデータ(すなわち今の例ではビニング処理後の画像)を表示装置60に出力(表示)したりメモリに格納したりする。
<本実施形態の有利な効果>
本実施形態では、高速かつ高精度な測定系により得られた画像に基づき、帯域外外挿による復元が実現できる。フィルタ処理による情報の欠落が無くなるため、元データと復元後のデータは1対1変換となり従来のような曖昧さが無くなる。さらに、光子計数により光子数を求めているので、それに基づいて厳密な誤差評価が可能である。推定値の近傍において誤差評価を行うことで、推定の信頼性を定量的に評価できる。この誤差評価によって、フィルタ処理によるノイズ除去を行わなくても信頼できる復元結果を得ることができる。
本実施形態では、高速かつ高精度な測定系により得られた画像に基づき、帯域外外挿による復元が実現できる。フィルタ処理による情報の欠落が無くなるため、元データと復元後のデータは1対1変換となり従来のような曖昧さが無くなる。さらに、光子計数により光子数を求めているので、それに基づいて厳密な誤差評価が可能である。推定値の近傍において誤差評価を行うことで、推定の信頼性を定量的に評価できる。この誤差評価によって、フィルタ処理によるノイズ除去を行わなくても信頼できる復元結果を得ることができる。
最尤推定値付近の元画像候補と評価値(尤度)を中間データとして記憶しているので、有意水準を変更する場合にはデータ加工処理(S27)のみを再度行えばよい。また、表示形式を変更する場合も、中間データを用いて処理を行えばよい。すなわち、有意水準や表示形式を簡単に変更できる。
<変形例>
本手法は、シーケンサーやマイクロアレイを用いた測定に好適に適用できる。DNAサンプルなどの観察対象物質が格子状に配置されている場合、輝点位置が常に同一である。輝点位置が離散的で定まっているので、本手法における計算処理の際の制約条件として用いることで、推定画像の次元数が減るので計算量が減るととともに復元精度を向上させることができる。また、本手法によって高分解能化が達成できれば、格子密度を上げることができ、並列処理能力の増大、基板の微小化、試料の微量化などの効果を得られ、測定のスループットが向上する。
本手法は、シーケンサーやマイクロアレイを用いた測定に好適に適用できる。DNAサンプルなどの観察対象物質が格子状に配置されている場合、輝点位置が常に同一である。輝点位置が離散的で定まっているので、本手法における計算処理の際の制約条件として用いることで、推定画像の次元数が減るので計算量が減るととともに復元精度を向上させることができる。また、本手法によって高分解能化が達成できれば、格子密度を上げることができ、並列処理能力の増大、基板の微小化、試料の微量化などの効果を得られ、測定のスループットが向上する。
上記の実施形態では、単一光子条件下でイメージインテンシファイアを用いて光子計数を行っている。しかしながら、光子の検出分布が得られれば本手法は利用可能であり、必ずしも光子計数によって検出光子分布を得る必要はない。たとえば、イメージインテンシファイアを用いた計数を行わずに、カメラの輝度値から光子数の分布を得ればよい。
10:スキャナユニット
20:顕微鏡ユニット
30:分光ユニット
40:カメラシステム
50:制御装置
60:表示装置
70:解析装置
20:顕微鏡ユニット
30:分光ユニット
40:カメラシステム
50:制御装置
60:表示装置
70:解析装置
Claims (10)
- 撮像光学系から得られる像の光子検出数分布を取得する取得手段と、
あらかじめ求められているIPSF(点像分布関数PSFの逆関数)を用いて前記光子検出分布から推定画像を取得する復元手段と、
前記推定画像および当該推定画像と類似する複数の画像について、当該画像が正解画像である確からしさを表す評価値を算出する評価値算出手段と、
評価値が有意水準以上となるような物理パラメータを生成し出力する出力手段と、
を備える、データ復元装置。 - 前記PSFは点光源を撮影した画像から生成され、
前記IPSFは、前記PSFおよび前記点光源を撮影した画像から帯域外外挿を用いて生成される、
請求項1に記載のデータ復元装置。 - 前記取得手段は、光子計数可能に撮影された複数の画像のそれぞれから光子の検出数を求めて前記光子検出数分布を得る、
請求項1又は2に記載のデータ復元装置。 - 前記取得手段は、単一光子条件で撮影された複数の画像のそれぞれから、輝度分布の中心に1つの光子が検出されたものとして前記光子検出数分布を得る、
請求項3に記載のデータ復元装置。 - 前記取得手段は、イメージインテンシファイアと撮像装置を含む顕微鏡によって撮影された画像から、前記光子検出数分布を得る、
請求項1から4のいずれか1項に記載のデータ復元装置。 - 前記評価値は、推定画像が正解画像であると仮定したときに、前記光子検出数分布が得られる確率を表す値である、
請求項1から5のいずれか1項に記載のデータ復元装置。 - 前記物理パラメータは画像であり、
前記出力手段は、前記推定画像およびそれに類似する複数の画像に基づいてビニング処理を行い評価値が有意水準以上となる画像を生成して出力する、
請求項1から6のいずれか1項に記載のデータ復元装置。 - イメージインテンシファイアと撮像装置を含む顕微鏡と、
請求項1から7のいずれか1項に記載のデータ復元装置と、
を備える、顕微鏡システム。 - 撮像光学系から得られる像の光子検出数分布を取得する取得ステップと、
あらかじめ求められているIPSF(点像分布関数PSFの逆関数)を用いて前記光子検出分布から推定画像を取得する復元ステップと、
前記推定画像および当該推定画像と類似する複数の画像について、当該画像が正解画像である確からしさを表す評価値を算出する評価値算出ステップと、
評価値が有意水準以上となるような物理パラメータを生成し出力する出力ステップと、
を含む、データ復元方法。 - 請求項9に記載の方法の各ステップをコンピュータに実行させるためのプログラム。
Priority Applications (2)
| Application Number | Priority Date | Filing Date | Title |
|---|---|---|---|
| US16/309,781 US10866400B2 (en) | 2016-06-14 | 2017-06-09 | Data recovery device, microscope system, and data recovery method |
| EP17813222.1A EP3471393B1 (en) | 2016-06-14 | 2017-06-09 | Data recovery device, microscope system, and data recovery method |
Applications Claiming Priority (2)
| Application Number | Priority Date | Filing Date | Title |
|---|---|---|---|
| JP2016-118225 | 2016-06-14 | ||
| JP2016118225A JP6681068B2 (ja) | 2016-06-14 | 2016-06-14 | データ復元装置、顕微鏡システム、およびデータ復元方法 |
Publications (1)
| Publication Number | Publication Date |
|---|---|
| WO2017217325A1 true WO2017217325A1 (ja) | 2017-12-21 |
Family
ID=60663552
Family Applications (1)
| Application Number | Title | Priority Date | Filing Date |
|---|---|---|---|
| PCT/JP2017/021420 WO2017217325A1 (ja) | 2016-06-14 | 2017-06-09 | データ復元装置、顕微鏡システム、およびデータ復元方法 |
Country Status (4)
| Country | Link |
|---|---|
| US (1) | US10866400B2 (ja) |
| EP (1) | EP3471393B1 (ja) |
| JP (1) | JP6681068B2 (ja) |
| WO (1) | WO2017217325A1 (ja) |
Families Citing this family (3)
| Publication number | Priority date | Publication date | Assignee | Title |
|---|---|---|---|---|
| US11727540B2 (en) * | 2020-12-31 | 2023-08-15 | Samsung Electronics Co., Ltd. | Image sharpening |
| US11792535B2 (en) | 2021-08-10 | 2023-10-17 | Samsung Electronics Co., Ltd. | System and method to improve quality in under-display camera system with radially increasing distortion |
| CN116612051B (zh) * | 2023-05-05 | 2024-03-19 | 之江实验室 | 一种基于频谱域滤波的干涉散射图像弱信号的实时恢复方法和系统 |
Citations (3)
| Publication number | Priority date | Publication date | Assignee | Title |
|---|---|---|---|---|
| JP2003255231A (ja) * | 2002-02-28 | 2003-09-10 | National Institute Of Advanced Industrial & Technology | 光イメージングシステム及び光イメージのデータ処理方法 |
| JP2009188891A (ja) * | 2008-02-08 | 2009-08-20 | Victor Co Of Japan Ltd | 画像処理装置、画像処理方法、および画像処理プログラム |
| JP2012078408A (ja) * | 2010-09-30 | 2012-04-19 | Olympus Corp | 標本観察装置 |
Family Cites Families (7)
| Publication number | Priority date | Publication date | Assignee | Title |
|---|---|---|---|---|
| US4922092A (en) * | 1986-11-26 | 1990-05-01 | Image Research Limited | High sensitivity optical imaging apparatus |
| JP3952499B2 (ja) | 2002-08-30 | 2007-08-01 | 横河電機株式会社 | 共焦点スキャナ顕微鏡 |
| DE60202374T2 (de) * | 2002-10-25 | 2005-12-08 | Evotec Technologies Gmbh | Methode und Vorrichtung zur Aufnahme dreidimensionaler Abbildungen von schwebend gehaltenen Mikroobjekten unter Verwendung hochauflösender Mikroskopie |
| EP1971968A2 (en) * | 2006-01-13 | 2008-09-24 | Micronic Laser Systems Ab | Apparatuses, methods and computer programs for artificial resolution enhancement in optical systems |
| US20090148065A1 (en) * | 2007-12-06 | 2009-06-11 | Halsted Mark J | Real-time summation of images from a plurality of sources |
| EP2403234A1 (en) * | 2010-06-29 | 2012-01-04 | Koninklijke Philips Electronics N.V. | Method and system for constructing a compound image from data obtained by an array of image capturing devices |
| EP2503364A1 (en) * | 2011-03-22 | 2012-09-26 | Koninklijke Philips Electronics N.V. | Camera system comprising a camera, camera, method of operating a camera and method for deconvoluting a recorded image |
-
2016
- 2016-06-14 JP JP2016118225A patent/JP6681068B2/ja active Active
-
2017
- 2017-06-09 WO PCT/JP2017/021420 patent/WO2017217325A1/ja unknown
- 2017-06-09 EP EP17813222.1A patent/EP3471393B1/en active Active
- 2017-06-09 US US16/309,781 patent/US10866400B2/en active Active
Patent Citations (3)
| Publication number | Priority date | Publication date | Assignee | Title |
|---|---|---|---|---|
| JP2003255231A (ja) * | 2002-02-28 | 2003-09-10 | National Institute Of Advanced Industrial & Technology | 光イメージングシステム及び光イメージのデータ処理方法 |
| JP2009188891A (ja) * | 2008-02-08 | 2009-08-20 | Victor Co Of Japan Ltd | 画像処理装置、画像処理方法、および画像処理プログラム |
| JP2012078408A (ja) * | 2010-09-30 | 2012-04-19 | Olympus Corp | 標本観察装置 |
Non-Patent Citations (1)
| Title |
|---|
| See also references of EP3471393A4 * |
Also Published As
| Publication number | Publication date |
|---|---|
| EP3471393A4 (en) | 2019-06-12 |
| US10866400B2 (en) | 2020-12-15 |
| EP3471393A1 (en) | 2019-04-17 |
| US20190113733A1 (en) | 2019-04-18 |
| EP3471393B1 (en) | 2020-01-22 |
| JP6681068B2 (ja) | 2020-04-15 |
| JP2017224108A (ja) | 2017-12-21 |
Similar Documents
| Publication | Publication Date | Title |
|---|---|---|
| JP4826586B2 (ja) | スペクトル画像処理方法、コンピュータ実行可能なスペクトル画像処理プログラム、スペクトルイメージングシステム | |
| KR101106852B1 (ko) | 광학식 3차원 계측 장치 및 필터 처리 방법 | |
| Hagen et al. | Quantitative sectioning and noise analysis for structured illumination microscopy | |
| WO2008002765A2 (en) | Method and system for compensating for spatial cross-talk | |
| EP3259553A1 (en) | Methods, systems and devices for automatically focusing a microscope on a substrate | |
| US10718715B2 (en) | Microscopy system, microscopy method, and computer-readable storage medium | |
| WO2017217325A1 (ja) | データ復元装置、顕微鏡システム、およびデータ復元方法 | |
| US20180157022A1 (en) | Systems and methods for calibrating a structured illumination imaging system and for capturing a structured illumination image | |
| US20170322408A1 (en) | Illumination setting method, light sheet microscope apparatus, and recording medium | |
| JP2018530823A (ja) | 病理学的明視野画像における自動染色検出 | |
| JP4883936B2 (ja) | 走査型サイトメータの画像処理方法及び装置 | |
| WO2019076192A1 (zh) | 图像重建方法、装置及显微成像装置 | |
| Jiang et al. | Blind deblurring for microscopic pathology images using deep learning networks | |
| JP6813316B2 (ja) | 劣化情報取得装置、劣化情報取得システム、劣化情報取得方法及び劣化情報取得プログラム | |
| EP4332878A1 (en) | Optical image processing method, machine learning method, trained model, machine learning preprocessing method, optical image processing module, optical image processing program, and optical image processing system | |
| KR102561360B1 (ko) | 보정을 사용하지 않고 파이버스코프 이미지를 처리하는 방법 및 이를 수행하는 파이버스코프 시스템 | |
| JP2011247656A (ja) | 蛍光検出装置および蛍光顕微鏡 | |
| JPWO2017195794A1 (ja) | 細胞観察装置及びプログラム | |
| JP2023539435A (ja) | 蛍光顕微鏡における照明調整方法および対応する蛍光顕微鏡 | |
| WO2023189393A1 (ja) | 生体試料観察システム、情報処理装置及び画像生成方法 | |
| US11238566B2 (en) | Image processing device, system, and method for improving signal-to-noise of microscopy images | |
| US20240037755A1 (en) | Imaging device and method | |
| Jerome | Confocal Digital Image Capture | |
| CN111656246B (zh) | 用于定位显微的方法和系统、计算机可读存储介质 | |
| US11415505B2 (en) | Method and system for observing a sample under ambient lighting |
Legal Events
| Date | Code | Title | Description |
|---|---|---|---|
| 121 | Ep: the epo has been informed by wipo that ep was designated in this application |
Ref document number: 17813222 Country of ref document: EP Kind code of ref document: A1 |
|
| NENP | Non-entry into the national phase |
Ref country code: DE |
|
| ENP | Entry into the national phase |
Ref document number: 2017813222 Country of ref document: EP Effective date: 20190114 |