WO2017168865A1 - Information processing device and information processing method - Google Patents
Information processing device and information processing method Download PDFInfo
- Publication number
- WO2017168865A1 WO2017168865A1 PCT/JP2016/087186 JP2016087186W WO2017168865A1 WO 2017168865 A1 WO2017168865 A1 WO 2017168865A1 JP 2016087186 W JP2016087186 W JP 2016087186W WO 2017168865 A1 WO2017168865 A1 WO 2017168865A1
- Authority
- WO
- WIPO (PCT)
- Prior art keywords
- data set
- data
- input
- value
- information processing
- Prior art date
Links
Images


Classifications
-
- G—PHYSICS
- G06—COMPUTING; CALCULATING OR COUNTING
- G06N—COMPUTING ARRANGEMENTS BASED ON SPECIFIC COMPUTATIONAL MODELS
- G06N3/00—Computing arrangements based on biological models
- G06N3/02—Neural networks
- G06N3/08—Learning methods
-
- G—PHYSICS
- G06—COMPUTING; CALCULATING OR COUNTING
- G06N—COMPUTING ARRANGEMENTS BASED ON SPECIFIC COMPUTATIONAL MODELS
- G06N3/00—Computing arrangements based on biological models
- G06N3/02—Neural networks
- G06N3/08—Learning methods
- G06N3/082—Learning methods modifying the architecture, e.g. adding, deleting or silencing nodes or connections
-
- G—PHYSICS
- G06—COMPUTING; CALCULATING OR COUNTING
- G06F—ELECTRIC DIGITAL DATA PROCESSING
- G06F16/00—Information retrieval; Database structures therefor; File system structures therefor
-
- G—PHYSICS
- G06—COMPUTING; CALCULATING OR COUNTING
- G06N—COMPUTING ARRANGEMENTS BASED ON SPECIFIC COMPUTATIONAL MODELS
- G06N3/00—Computing arrangements based on biological models
- G06N3/02—Neural networks
- G06N3/04—Architecture, e.g. interconnection topology
- G06N3/048—Activation functions
-
- G—PHYSICS
- G06—COMPUTING; CALCULATING OR COUNTING
- G06N—COMPUTING ARRANGEMENTS BASED ON SPECIFIC COMPUTATIONAL MODELS
- G06N3/00—Computing arrangements based on biological models
- G06N3/02—Neural networks
- G06N3/08—Learning methods
- G06N3/084—Backpropagation, e.g. using gradient descent
Definitions
- the present disclosure relates to an information processing apparatus and an information processing method.
- Patent Document 1 discloses a technique for improving a classification model by machine learning while confirming the degree of influence on past data to some extent while continuing an actual service.
- a first acquisition unit that acquires a first data set composed of a combination of input data and output data obtained by inputting the input data to a neural network, the first data set, A second acquisition unit that acquires one or more second data sets having the same item, and a generation unit that generates information indicating the positioning of the first data set in relation to the second data set;
- An information processing apparatus includes an acquisition unit that acquires information indicating the positioning of the first data set in relation to a second data set having the second data set from the other apparatus.
- obtaining a first data set composed of a combination of input data and output data obtained by inputting the input data to a neural network is the same as the first data set.
- An information processing method comprising: obtaining one or more second data sets having items; and generating information indicating a positioning of the first data set in relation to the second data set by a processor. Is provided.
- the same item as the first data set including a combination of notifying input data to another device and output data obtained by inputting the input data to a neural network is included.
- An information processing method is provided that includes obtaining information indicating the positioning of the first data set in relation to a second data set from the other device by a processor.
- a mechanism capable of providing information indicating the validity of a calculation result based on a model constructed by machine learning.
- the above effects are not necessarily limited, and any of the effects shown in the present specification, or other effects that can be grasped from the present specification, together with or in place of the above effects. May be played.
- FIG. 1 is a diagram illustrating an example of a schematic configuration of a system according to an embodiment of the present disclosure. It is a block diagram which shows an example of a logical structure of the processing apparatus which concerns on the same embodiment. It is a block diagram which shows an example of the logical structure of the terminal device which concerns on the same embodiment. It is a figure showing an example of UI concerning the embodiment. It is a figure showing an example of UI concerning the embodiment. It is a figure showing an example of UI concerning the embodiment. It is a figure showing an example of UI concerning the embodiment. It is a figure showing an example of UI concerning the embodiment. It is a figure showing an example of UI concerning the embodiment. It is a figure showing an example of UI concerning the embodiment. It is a figure showing an example of UI concerning the embodiment. It is a figure showing an example of UI concerning the embodiment. It is a figure showing an example of UI concerning the embodiment. It is a figure showing an example of UI concerning the embodiment. It is a figure showing an
- UI concerning the embodiment It is a figure showing an example of UI concerning the embodiment. It is a figure showing an example of UI concerning the embodiment. It is a figure showing an example of UI concerning the embodiment. It is a figure showing an example of UI concerning the embodiment. It is a figure showing an example of UI concerning the embodiment. It is a figure which shows an example of the flow of the visualization process of the response of the neural network performed in the system which concerns on the embodiment. It is a figure showing an example of UI concerning the embodiment. It is a figure showing an example of UI concerning the embodiment. It is a figure for demonstrating the evaluation process of the artwork based on the embodiment. It is a block diagram which shows an example of the hardware constitutions of the information processing apparatus which concerns on this embodiment.
- Deep learning has also been freed from the limitation of expressive ability to design within a range that can be understood by humans regarding conversion processing to feature values and computation processing such as recognition or prediction. Due to such dramatic improvement in expression ability, deep learning has made it possible to automatically construct features that cannot be analyzed, analyzed or found by human experience or knowledge.
- mapping function a process until an operation result is obtained from input data is learned as a mapping function, but this mapping function may not be easily understood by humans. Therefore, there are cases where it is difficult to give a sense of satisfaction that the calculation result is correct.
- the real estate price of a second-hand property of an apartment (Apartment) using deep learning.
- multi-dimensional vectors such as “floor area”, “number of floors”, “time required to walk from the station”, “age of building”, “close contract price of the room in the same building” are input data
- the “assessment price” is the output data.
- the learned neural network can calculate output data corresponding to new input data. For example, in the real estate price calculation example described above, the neural network can calculate the corresponding “assessment price” when input data having the same items (for example, “floor area” etc.) as at the time of learning is input. is there.
- a technique capable of providing information for directly knowing how a calculation result by a neural network is derived is provided.
- Neural network> Overview Not limited to neural networks, in general, in recognition or prediction (ie, regression) technology, a function that maps a data variable x to an objective variable y (for example, a label, a regression value, or a predicted value) is expressed by the following equation:
- each of x and y may be a multidimensional vector (for example, x is D dimension and y is K dimension).
- F is a function defined for each dimension of y. In the recognition or regression problem, obtaining this function f is not limited to a neural network or deep learning, but is common in the field of machine learning.
- a and b are matrices or vectors that do not depend on the input x.
- Each component of A and b can also be regarded as a parameter of the model shown in the mathematical formula (2).
- mapping function is simply weighted addition, it is easy to explain the contents of the mapping function so that a person can understand it. This also applies to the classification problem, although a detailed description is omitted.
- nonlinear transformation (however, a linear transformation may be included in the nonlinear transformation) is applied to the input.
- a vector obtained by this nonlinear transformation is called a feature vector. If this nonlinear transformation is known, the regression equation is expressed as follows using a function of the nonlinear transformation (hereinafter also referred to as a nonlinear function).
- ⁇ (x) is a non-linear function for obtaining a feature vector, for example, a function for outputting an M-dimensional vector.
- K 1 and y is a scalar value y 1
- y 1 is obtained by adding weighted feature amount of each dimension. Since this mapping function is also a weighted addition of known feature quantities, it can be said that it is easy to explain the contents of the mapping function so that a person can understand it.
- the model parameters A and b are obtained by learning. Specifically, the model parameters A and b are learned so that the above formula (1) is established in a predetermined data set.
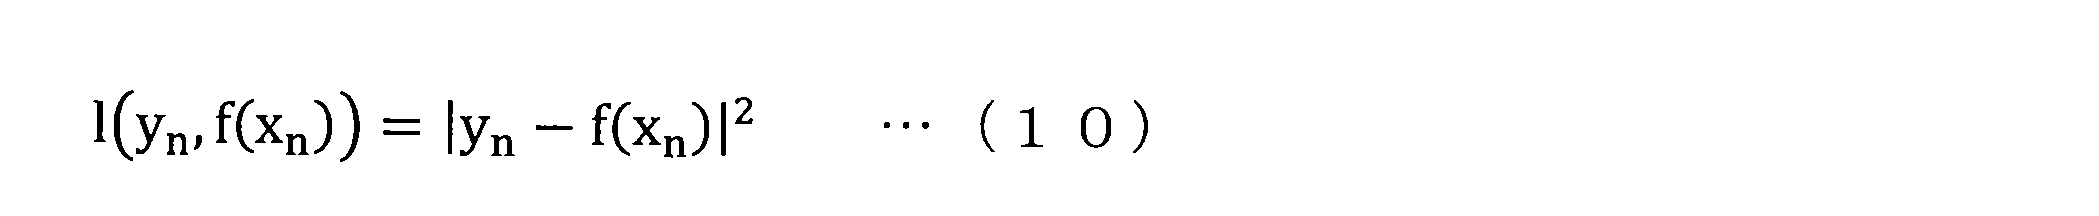
- This difference may be, for example, the sum of square errors expressed by the following equation.
- the function L representing the difference may be a simple sum of square errors, a weighted sum of square errors with weights according to dimensions, or a constraint term (for example, L1) expressing a function constraint as a parameter. A square error sum including a constraint or an L2 constraint).
- the function L which represents the difference, binary cross-entropy, categorical entropy, log-likelihood, or such as variational lower bound, the predicted value f (x n) how much the actual value y n correctly output Any function may be used as long as it is an index indicating whether it is predicted.
- the model parameters A and b may be designed by a person.
- the model parameters A and b obtained by learning may not be sharp values as compared with the case where they are designed by a person. However, since it is easy to know which weight (that is, contribution) is set in which dimension, it can be said that this model is also in a range that can be understood by humans.
- a neural network is a suitable model for representing a composite function. Therefore, let us consider representing a feature amount conversion portion and a composite function of subsequent processing by a neural network. Then, the feature amount conversion by known nonlinear conversion can be left to learning, and the lack of expressive power due to design constraints can be avoided.
- a neural network is composed of a composite function in which the linear combination of inputs and the output of a nonlinear function (Activation) of nonlinear coupling values are connected in layers.
- a (l) and vector b (l) are the weight and bias of the l-th layer linear combination, respectively.
- f (l + 1) is a vector obtained by combining the nonlinear (Activation) functions of the (l + 1) th layer. The reason why it is a vector or matrix is that the input / output of each layer is multidimensional.
- learning and are, in all of the data sets given refer to ask for parameters such as the difference between the actual value y n and the predicted value f (x n) is reduced. This difference is expressed by the following equation, for example.
- l (y n, f ( x n)) is a function representing a distance between the actual value y n and the predicted value f (x n).
- L ( ⁇ ) is also referred to as an objective function. If the following equation holds, the objective function L ( ⁇ ) is a square error function.
- the objective function may be other than the sum of square errors, and may be, for example, a weighted square error, regularized square error, binary cross entropy, categorical cross entropy, or the like. Which objective function is appropriate depends on a data format, a task (for example, whether y is a discrete value (classification problem) or a continuous value (regression problem)), and the like.
- -Learning Learning is performed by minimizing the objective function L ( ⁇ ).
- a method using a gradient related to the parameter ⁇ can be used.
- the parameter ⁇ that minimizes the objective function L ( ⁇ ) is repeatedly searched while the parameter is sequentially updated according to the following equation.
- the process of adding the gradient in the range from N b to N b + 1 is also referred to as a mini-batch.
- a method such as AdaGrad, RMProp, or AdaM, which is an extension of this method, is often used for learning. In these methods, an excessive response is avoided by eliminating the scale dependence or using the second moment or the moving average of the gradient ⁇ l / ⁇ by using the dispersion of the gradient.
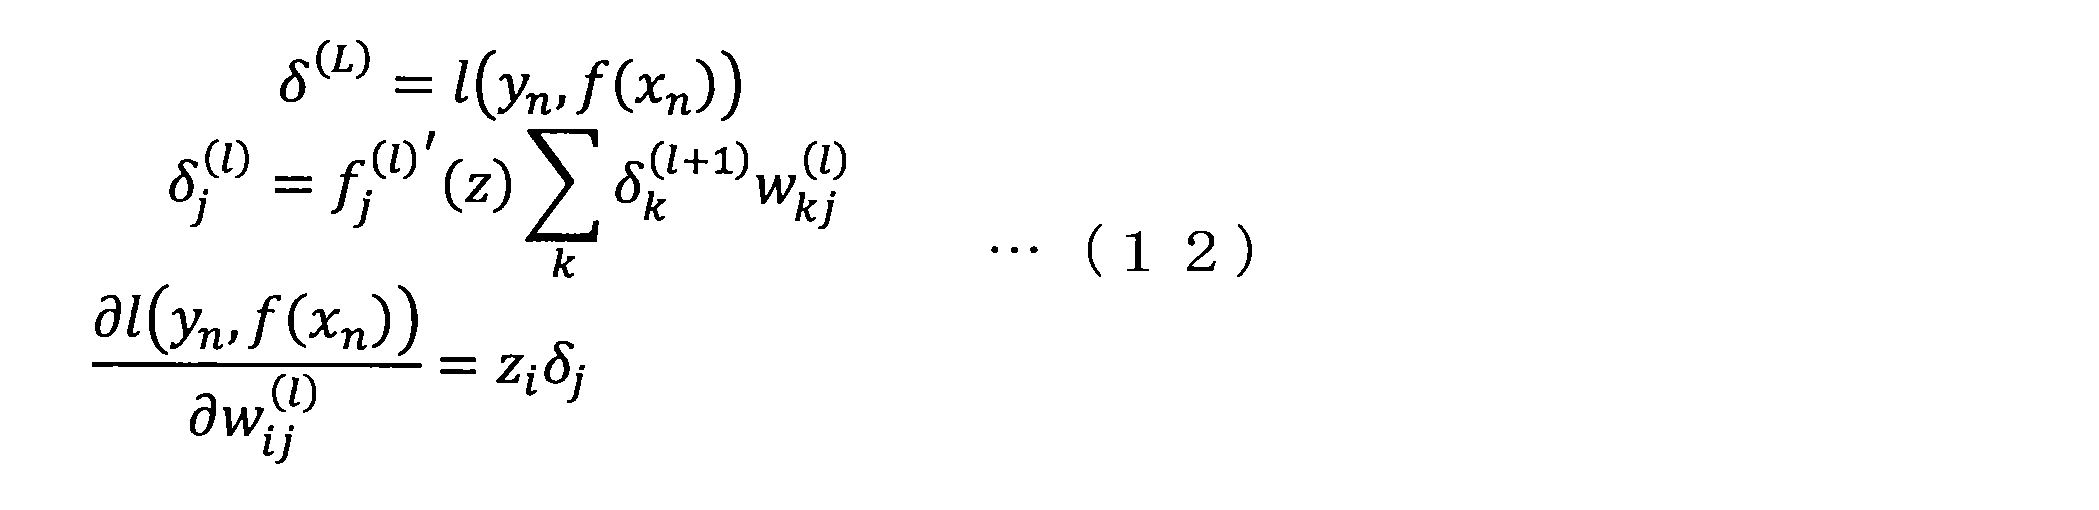
- the gradient of the objective function is obtained as a recurrence formula as shown below by using the rules of the synthesis function.
- the process of finding the gradient using a recurrence formula is also called backpropagation. Since the gradients can be easily obtained by the recurrence formula, the parameters can be sequentially estimated by using these gradients and using the gradient method of Equation (11) or a derivative version thereof.
- Each layer of the neural network can have various configurations.
- the main configuration of each layer of the neural network is determined by the configuration of the linear combination and the type of nonlinear function.
- the configuration of the linear combination mainly includes a total connection network or a convolutional network.
- new functions are proposed one after another for nonlinear coupling functions.
- One example is a sigmoid represented by the following equation.
- Relu (Rectified, LinearUnit) shown in the following equation is an active function that is often used in recent years.
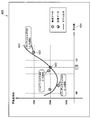
- FIG. 1 is a diagram illustrating an example of a schematic configuration of a system according to an embodiment of the present disclosure. As shown in FIG. 1, the system 1 includes a processing device 100 and a terminal device 200.
- the processing device 100 and the terminal device 200 are connected by a network 300.
- the network 300 is a wired or wireless transmission path for information transmitted from devices connected by the network 300.
- the network 300 may include, for example, a cellular network, a wired LAN (Local Area Network), or a wireless LAN.
- the processing apparatus 100 is an information processing apparatus that performs various processes.
- the terminal device 200 is an information processing device that functions as an interface with a user. Typically, the system 1 interacts with the user through the cooperation of the processing device 100 and the terminal device 200.
- FIG. 2 is a block diagram illustrating an example of a logical configuration of the processing apparatus 100 according to the present embodiment.
- the processing device 100 includes a communication unit 110, a storage unit 120, and a control unit 130.
- the communication unit 110 has a function of transmitting / receiving information.
- the communication unit 110 receives information from the terminal device 200 and transmits information to the terminal device 200.
- Storage unit 120 The storage unit 120 temporarily or permanently stores a program for operating the processing apparatus 100 and various data.
- Control unit 130 provides various functions of the processing apparatus 100.
- the control unit 130 includes a first acquisition unit 131, a second acquisition unit 132, a calculation unit 133, a generation unit 134, and a notification unit 135.
- Control unit 130 may further include other components other than these components. That is, the control unit 130 can perform operations other than the operations of these components.
- the first acquisition unit 131 and the second acquisition unit 132 acquire information.
- the calculation unit 133 performs various calculations and learning of a neural network described later.
- the generation unit 134 generates information indicating the calculation or learning result by the calculation unit 133.
- the notification unit 135 notifies the information generated by the generation unit 134 to the terminal device 200. Other detailed operations will be described in detail later.
- FIG. 3 is a block diagram illustrating an example of a logical configuration of the terminal device 200 according to the present embodiment.
- the terminal device 200 includes an input unit 210, an output unit 220, a communication unit 230, a storage unit 240, and a control unit 250.
- the input unit 210 has a function of accepting input of information.
- the input unit 210 receives input of information from the user.
- the input unit 210 may accept a character input using a keyboard or a touch panel, a voice input, or a gesture input.
- the input unit 210 may accept data input from a storage medium such as a flash memory.
- the output unit 220 has a function of outputting information.
- the output unit 220 outputs information by image, sound, vibration, light emission, or the like.
- the communication unit 230 has a function of transmitting and receiving information.
- the communication unit 230 receives information from the processing device 100 and transmits information to the processing device 100.
- Storage unit 240 The storage unit 240 temporarily or permanently stores a program for operating the terminal device 200 and various data.
- Control unit 250 provides various functions of the terminal device 200.
- the control unit 250 includes a notification unit 251 and an acquisition unit 253.
- the control unit 250 may further include other components other than these components. That is, the control unit 250 can perform operations other than the operations of these components.
- the notification unit 251 notifies the processing device 100 of information indicating the user input input to the input unit 210.
- the acquisition unit 253 acquires information indicating the calculation result by the processing device 100 and causes the output unit 220 to output the information. Other detailed operations will be described in detail later.
- the system 1 (for example, the calculation unit 133) performs various calculations related to the neural network.
- the calculation unit 133 learns the parameters of the neural network, performs input by inputting input data into the neural network, and outputs output data.
- the input data includes each value of one or more input items (hereinafter also referred to as input value), and each input value is input to a corresponding unit in the input layer of the neural network.
- the output data includes each value of one or more output items (hereinafter also referred to as an output value), and each output value is output from a corresponding unit in the output layer of the neural network.
- the system 1 visualizes and provides information indicating the input / output response relationship of the neural network.
- the visualization of the information indicating the input / output response relationship shows the basis of the operation result of the neural network. Therefore, the user can directly convince the validity of the calculation result against the prior knowledge of the user.
- the system 1 performs the following two types of neural network calculations and provides calculation results.
- the system 1 applies a disturbance to the input value and visualizes and provides information indicating how the output value changes as a result. Specifically, the system 1 fixed the input value of a part of the multidimensional input data and changed the other input values of the output value for the multidimensional input data (that is, added disturbance). Provides information indicating the position in the distribution of output values in the case. Thereby, the user can grasp the positioning of the output value.
- the system 1 back-propagates the error of the output value and visualizes and provides information indicating the distribution of the input value. Specifically, the system 1 provides information indicating the degree of contribution of the input value to the output value. Thereby, the user can grasp the positioning of the input value.
- the system 1 visualizes and provides a calculation formula indicating a neural network response relationship or a statistical processing result (for example, a graph or the like). Thereby, the user can understand the validity of the calculation result in more detail.
- the system 1 visualizes the response of the output value y when the disturbance r is added to the input value x in Equation (1). This response is expressed as:
- r is a disturbance value on the k-axis.
- Ek is a k-axis unit vector.
- the system 1 visualizes the contribution of the inverse response of the input value x when the disturbance ⁇ is added to the output value y in Equation (11) or Equation (12).
- the system 1 calculates the error to each layer by back propagation using the following equation.
- the system 1 can also calculate a back-propagation error to the input value itself by using the following equation in the above equation (12).
- the visualization of the response is not limited to the input to the neural network and the output from the neural network.
- responses may be visualized for inputs to units near the input in the middle layer and outputs from units near the output.
- a feature amount close to a concept created by a person such as a category is calculated.
- feature quantities related to concepts closer to data are calculated. The response between them may be visualized.
- First data set The system 1 (for example, the first acquisition unit 131) acquires a first data set composed of a combination of input data and output data obtained by inputting the input data into a neural network.
- real estate attribute information corresponds to input data
- output data corresponds to real estate prices.
- the system 1 acquires one or more second data sets having items having the same values as the first data set.
- the second data set has items of the same value as the first data set, and has items corresponding to the output data.
- the second data set includes a combination of real estate attribute information and real estate prices, as in the first data set.
- a part of the attribute information is the same as the first data set.
- the second data set is different from the first data set in the values of the first item among the items included in the input data, and the values of the other second items are the first.
- the same data set may be used.
- the first item corresponds to an input item that is a response visualization target
- the second item corresponds to an input item that is not a response visualization target.
- the response visualization target is the building age
- a second data set is acquired in which only the building age is different among the input items and the others are the same.
- the second data set corresponds to the data set in the case where disturbance is added to the value of the input item that is the target of the response visualization, which is expressed by the mathematical formula (17).
- the second data set becomes an appropriate data set for providing the user with the response relationship.
- the second data set includes a data set generated by a neural network learned based on a data set actually observed in the past.
- the system 1 calculates the output data when the disturbance is applied to the input item to be visualized on the input unit side using the above formula (17), A second data set is generated.
- a sufficient number of actual data satisfying the above-described condition that the value of the input item that is the target of response visualization is different from the first data set and the value of the other input item is the same as the first data set. It may be difficult to obtain. In such a case, the deficiency in the number of data can be compensated by generating a data set using a neural network.
- the second data set may include a data set actually observed in the past.
- the system 1 acquires the second data set from a database (for example, the storage unit 120) that accumulates attribute information and real price data of real estate that has been bought and sold in the past.
- the second data set may be learning data used for learning of the neural network.
- the system 1 (for example, the generation unit 134) generates information indicating the positioning of the first data set in relation to the second data set.
- the information indicating the generated positioning is provided to the user by the terminal device 200, for example. This makes it possible to provide the user with the basis for the calculation result of the neural network.
- the information indicating the positioning of the input item (corresponding to the first item) of the first data set and the second data set that is the target of response visualization The relationship between the value and the value of the item corresponding to the output data is shown. This makes it possible to clearly provide the user with a response relationship, for example, how the building age affects the real estate price.
- a UI User Interface
- the UI is displayed by the terminal device 200, for example, and accepts input of information. The same applies to other UIs.
- FIG. 4 is a diagram illustrating an example of a UI according to the present embodiment.
- the UI 410 provides a list of input real estate attribute information and a real estate price output from the neural network.
- the system 1 provides the user with information indicating the rationale for the validity of the output real estate price through the UI described below.
- FIG. 5 is a diagram illustrating an example of a UI according to the present embodiment.
- the UI 420 shown in FIG. 5 allows the user to set conditions for visualizing the response. For example, the user can select an input item to be visualized by pressing the button 421. Each of “input 1” to “input 3” corresponds to each piece of real estate attribute information. In addition, the user can set an input value change range in the input form 422. This range corresponds to the width of the disturbance described above. The user can select an output item to be visualized by pressing the button 423. In this example, since the output item included in the output data is one property price, a plurality of options are not provided, but when there are a plurality of output items, a plurality of options may be provided.
- the input value of the input item to be visualized in the first data set is also referred to as a target input value.
- the output value of the output item to be visualized in the first data set is also referred to as a target output value.
- FIG. 5 illustrates an example in which the input item is selected by pressing the button 421
- the present technology is not limited to such an example.
- the input item may be selected by selection from a list or by selection from a radio button.
- FIG. 6 is a diagram illustrating an example of a UI according to the present embodiment.
- the UI 430 shown in FIG. 6 visualizes the response of the output value when a disturbance is added to the input value by a graph.
- the X axis of this graph corresponds to an input value
- the Y axis corresponds to an output value.
- a model output curve 431 shows a curve of an output value from the neural network when the input value of the response visualization target is virtually changed within the designated change range. That is, the model output curve 431 corresponds to the second data set generated by the neural network represented by the above mathematical formula (17).
- the actual measurement data 432 is a plot of past data. That is, the actual measurement data 432 corresponds to a second data set actually observed in the past.
- the trial calculation data 433 indicates the target input value input to the user and the target output value output from the neural network shown in the UI 410. That is, the trial calculation data 433 corresponds to the first data set.
- the model output curve 431 the user can view not only the target input value and target output value that are actually input, but also the surroundings (specifically, within the specified change range) regarding the input items to be visualized. It is possible to confirm. As a result, the user can directly convince the validity of the calculation result against the prior knowledge of the user.
- the number of actually measured data 432 to be plotted may be a predetermined number, or only data close to the model output curve 431 may be plotted.
- “close” means that the distance in the input space (for example, the Eugrid distance) is short, and when one of the intermediate layers is input, the distance in the intermediate layer is close.
- the distance for example, the square distance
- the actually measured data 432 to be plotted includes at least both a value that is larger and smaller than an input value of the trial calculation data 433.
- the system 1 (for example, the generation unit) is information indicating a response relationship between the input value to the unit of the input layer selected from the intermediate layer of the neural network and the output value from the unit of the selected output layer. May be generated.
- the user can understand the response relationship in the intermediate layer, and as a result, can understand the validity of the operation result of the neural network in more detail.
- the user can know the concept by visualizing the response relationship in the intermediate layer.
- the information indicating the response relationship may be a graph.
- An example of a UI in this case will be described with reference to FIG.
- FIG. 7 is a diagram illustrating an example of a UI according to the present embodiment.
- the UI 440 includes UI blocks 441, 444 and 447.
- the UI block 441 is a UI for selecting an intermediate layer that is a target of visualization of response relationships.
- a unit of each layer of the neural network represented by a rectangle and corresponding to a multidimensional vector
- an operation part connected thereto corresponding to an arrow indicating a projection function from layer to layer
- the user selects the intermediate layer 442 as the input layer and selects the intermediate layer 443 as the output layer.
- the UI block 444 is a UI for selecting a unit (that is, a dimension) that is a target of visualization of the response relationship from the intermediate layer 442 and the intermediate layer 443 selected in the UI block 441.
- a unit that is, a dimension
- input / output of each unit is illustrated by arrows, and the arrows may be a selection target.
- the UI block 444 may accept, for example, a slide input or a unit identification number input. As an example, it is assumed that the user selects the unit 445 from the intermediate layer 442 and selects the unit 446 from the intermediate layer 443.
- the UI block 447 is a UI that visualizes the response relationship between the input unit and the output unit selected in the UI block 444 by a graph.
- the X axis of this graph corresponds to the input value to the unit 445
- the Y axis corresponds to the output value from the unit 446.
- the curve included in the graph of the UI block 447 is generated by the same method as the model output curve 431 shown in FIG. That is, the graph included in the UI block 447 graphs the response of the unit 446 by fixing the input value to the input unit other than the selected unit 445 and changing the input value to the selected unit 445. It is a thing.
- the fixed input value to the input unit other than the selected unit 445 refers to a value input to each input unit as a result of calculation when the input value to the neural network itself is fixed, for example. Also in this graph, as shown in the UI 420, the change width of the input value may be input. Also in this graph, similarly to the UI 430, actual measurement data used during learning may be plotted. The conditions of the actually measured data to be plotted and the provision of the contents of the actually measured data may be the same as the UI 430.
- UI blocks 441, 444, and 447 may be provided within the same screen, or may be provided by transitioning in order. The same applies to other UIs having a plurality of UI blocks.
- the information indicating the response relationship may be a function.
- An example of a UI in this case will be described with reference to FIGS.
- FIG. 8 is a diagram illustrating an example of a UI according to the present embodiment.
- the UI 450 has a configuration in which the UI block 447 of the UI 440 including UI blocks 441, 444 and 451 is replaced with a UI block 451.
- a plurality of units 445A and 445B may be selected from the intermediate layer 442.
- the UI block 451 is a UI that visualizes the response relationship between the units 445A and 445B selected in the UI block 444 and the output unit by a function.
- Equation (8) is a synthesis function of the linear combination of the model parameters A and b obtained by learning and the nonlinear activation function f.
- this function is written with a huge number of parameters, and it is usually difficult to understand its meaning. Therefore, the system 1 (for example, the generation unit 134) uses the selected units 445A and 445B as variables, generates a function that reduces the number of variables by fixing input values to input units other than the units 445A and 445B. .
- the fixed input values to the input units other than the selected units 445A and 445B are, for example, values input to each input unit as a result of calculation when the input value to the neural network itself is fixed.
- the generated function is provided in the UI block 451.
- the system 1 provides a projection function having the selected input unit as a variable in an easily understandable form with a reduced number of variables. Thereby, the user can easily understand the partial response of the neural network.
- FIG. 9 is a diagram illustrating an example of a UI according to the present embodiment.
- the UI 460 illustrated in FIG. 9 has a configuration in which the UI block 451 of the UI 450 is replaced with a UI block 461.
- the UI block 461 an approximate function obtained by linearly approximating the projection function with a differential coefficient is provided. As a result, the user can more easily understand the partial response of the neural network.
- the function may be provided in a text format.
- the function may be provided as a description in any programming language.
- the function may be described in a programming language selected by the user from the listed programming languages.
- the function provided to the UI block 451 or 461 may be capable of being copied and pasted to any other application.
- the system 1 may generate and provide a UI for neural network design assistance.
- the system 1 may generate information that suggests removal of an input layer unit that does not contribute to an output value from an output layer unit.
- the UI 460 if the input / output response coefficients of the function provided in the UI block 461 are all 0 and the bias is also 0, the unit 446 may not be contributed to the subsequent network and may be removed. . In that case, the system 1 may generate information that proposes the removal of the output unit.
- FIG. 10 is a diagram illustrating an example of a UI according to the present embodiment.
- the UI 470 illustrated in FIG. 10 has a configuration in which a UI block 471 is added to the UI 460.
- the UI block 471 includes a message proposing removal of an output unit that does not contribute to the subsequent stage.
- the output unit is removed when the user selects the YES button 472, and is not removed when the NO button 473 is selected. It should be noted that the removal of the output unit that does not contribute to the subsequent stage may be performed automatically.
- the system 1 may generate information about units that react to specific input data. For example, the system 1 may detect a unit that reacts to input data of a certain category (or class) and may provide a message to the user, eg, “This unit reacts to data of this category”. . Further, the system 1 may recursively trace input units that contribute to the unit and extract a sub-network that generates the unit. Then, the system 1 may reuse the subnetwork as a detector for detecting input data of a specific category.
- a unit is a unit that reacts to a “dog”.
- the unit can be handled as a “dog detector”.
- the system 1 may provide a classification system chart by classifying concepts under the concept in which “dog” is detected.
- a UI for associating the unit with a name such as “dog” or “dog detector” may be provided.
- a UI corresponding to the distribution characteristic of the unit may be provided.
- FIG. 11 shows an example of a UI in which a name is associated with each unit.
- FIG. 11 is a diagram illustrating an example of a UI according to the present embodiment. In the UI 472 illustrated in FIG.
- “dog” is associated with a unit having high responsiveness to “dog”.
- “rolling tail” is associated with a unit with high responsiveness to “rolling tail”
- “ear” is associated with a unit with high responsiveness to “ear”
- response to “four legs” “Four feet” is associated with a unit having high characteristics.
- Second method -1st data set
- the system 1 (for example, 1st acquisition part 131) consists of the combination of the output data obtained by inputting input data and the said input data into a neural network similarly to the 1st method. Obtain a first data set.
- Second data set The system 1 (for example, the second acquisition unit 132) acquires one or more second data sets having items having the same values as the first data set, as in the first method. To do. Similar to the first method, the second data set has items having the same value as the first data set, and has items corresponding to the output data.
- the second data set is different from the first data set in the values of the first item among the items included in the input data, and the values and output data of the other second items.
- the value of the item corresponding to may be the same as that of the first data set.
- the first item corresponds to an input item that is a response visualization target
- the second item corresponds to an input item that is not a response visualization target.
- the target of response visualization is the building age
- a second data set in which only the building age is different among the input items and the other input items and the property price are the same is acquired.
- the second data set corresponds to the back-propagation error of the input item that is the target of the response visualization, expressed by the mathematical formula (18).
- the second data set becomes an appropriate data set for providing the user with the response relationship.
- the second data set includes a data set generated by back propagation in a neural network learned based on a data set actually observed in the past.
- the system 1 (for example, the computing unit 133) computes the response of the input unit that is the object of visualization when an error is added to the output unit side using the mathematical formula (18).
- the input / output unit may be a unit of an input layer and an output layer of a neural network, or may be a unit of a selected intermediate layer.
- the error on the output unit side is repeatedly calculated using a random number (for example, a Gaussian random number) centered on the value in the first data set. It is assumed that the standard deviation of the random number can be set by the user.
- a distribution according to the random numbers on the output unit side is obtained.
- the system 1 (for example, the generation unit 134) generates information indicating the positioning of the first data set in relation to the second data set.
- the information indicating the positioning may be information indicating the position of the input data in the distribution of the second data set in which the value of the item corresponding to the output data is the same as the output data.
- the system 1 provides information indicating the position of the input data of the first data set in the distribution of input values generated on the input unit side, for example, according to an error applied to the output unit side. An example of a UI in this case will be described with reference to FIGS.
- the information indicating the positioning may be information indicating the deviation value of the input data in the distribution of the second data set in which the value of the item corresponding to the output data is the same as the output data.
- the system 1 provides information indicating the deviation value of the input data of the first data set in the distribution of input values generated on the input unit side in accordance with, for example, an error applied to the output unit side. An example of a UI in this case will be described with reference to FIG.
- FIG. 12 is a diagram illustrating an example of a UI according to the present embodiment.
- the UI 510 shown in FIG. 12 allows the user to set conditions for visualizing the response. For example, the user can select an input item to be visualized by pressing a button 511.
- FIG. 13 is a diagram illustrating an example of a UI according to the present embodiment.
- a probability density distribution curve 521 of an input value response when an error is added to an output value is visualized.
- the X axis of this graph corresponds to the input value, and the Y axis indicates the probability density.
- the position of the target input value in the probability distribution is visualized.
- FIG. 14 is a diagram illustrating an example of a UI according to the present embodiment.
- a deviation value obtained from the center and distribution width of the response of the input value is visualized.
- a graph 531 indicates a position where the deviation value is 50.
- a graph 532 shows the position of the deviation value of each input value of the first data set.
- the UI 530 allows the user to compare the first data set with the second data set.
- the deviation value may simply be calculated higher as the value of the input value is higher. For example, regarding the walking time, the deviation value in the UI 530 may be calculated higher as the walking time is higher. On the other hand, the deviation value may be calculated so high that the value of the input value gives the desired response to the output value.
- the deviation value in the UI 530 may be calculated higher as the time required for walking is lower.
- the necessity of such switching can be set by a user, for example.
- the deviation value may be calculated by a method other than the method using the random number described above.
- the deviation value of the first data set in the distribution of the accumulated measured data may be calculated.
- the user can know the absolute positioning of the first data set in the entire actual measurement data.
- the method using the random number described above which can know the position of the target input value in the input value for obtaining a similar output value, is effective.
- the input value is a continuous amount
- the present technology is not limited to such an example.
- the input value may be a discrete quantity.
- the calculation of the deviation value may be difficult in the case of the discrete quantity, the appearance distribution of the discrete quantity may be calculated, and the appearance probability may be used instead of the deviation value.
- a UI for assisting the design of the neural network described with respect to the first method may be provided.
- FIG. 15 is a diagram illustrating an example of the flow of a neural network response visualization process executed in the system 1 according to the present embodiment.
- the processing apparatus 100 and the terminal apparatus 200 are involved in this sequence.
- the terminal device 200 receives input of input data (step S102).
- the terminal device 200 (for example, the notification unit 251) transmits the input data to the processing device 100 (step S104).
- the processing device 100 (for example, the first acquisition unit 131 and the calculation unit 133) acquires the first data set by inputting the input data to the neural network and obtaining the output data (step S106).
- the terminal device 200 receives an input of visualization conditions (step S108).
- the terminal device 200 transmits information indicating the input visualization condition to the processing device 100 (step S110).
- the processing device 100 (for example, the second acquisition unit 132 and the calculation unit 133) performs a backpropagation in which an error is added to the calculation or output value of the neural network in which the disturbance is added to the input value based on the visualization condition. By doing so, a second data set is acquired (step S112). Then, the processing device 100 (for example, the generation unit 134) generates information indicating the positioning (Step S114).
- the processing device 100 transmits information indicating the generated positioning to the terminal device 200, and the terminal device 200 (for example, the acquisition unit 253) acquires the information (Step S116).
- the terminal device 200 (for example, the output unit 220) outputs information indicating the positioning (step S118).
- the present technology can be used in any application of a classification problem for determining a category to which input data belongs and a regression problem for predicting output data obtained from input data.
- a regression problem for predicting output data obtained from input data.
- this technology can take various input data and output data.
- the input data is attribute information to be evaluated, and the output data is the evaluation value to be evaluated.
- the evaluation target may be a real estate, and the evaluation value may be the price of the real estate.
- (1) Real estate price assessment application For example, assume that a user assesses a real estate price on an Internet site.
- the processing device 100 corresponds to a user terminal operated by a user, and the processing device 100 may exist in a back end of an Internet site.
- the user wishes to sell or purchase “Tokiwaso Room 109”.
- the user inputs attribute information of the real estate on the Internet site, and receives the estimated price estimation result.
- An example of a UI at that time is shown in FIG.
- FIG. 16 is a diagram illustrating an example of a UI according to the present embodiment.
- the estimated price estimation result is provided as “system estimated price” in the display column 611, for example.
- the system 1 estimates the appraisal price by inputting attribute information as input data to the neural network and calculating it. For attribute information that has not been input, an average value or the like may be used.
- the price range of the assessed price may be estimated.
- the estimation result of the price range of the appraisal price is provided as “system estimated price range” in the display field 611, for example.
- system 1 can provide a basis for the operation result of the neural network.
- system 1 provides information indicating the basis for the assessment, ie, the basis for the price indicated in the system estimated price or system estimated price range.
- An example of the UI is shown in FIG.
- FIG. 17 is a diagram illustrating an example of a UI according to the present embodiment.
- a UI 620 illustrated in FIG. 17 is a UI corresponding to the UI 430 described above.
- the X axis is the number of square meters and the Y axis is a system estimated price. Further, it is assumed that the input square meter number is 116 square meters.
- a model output curve 621 shows a curve of output values from the neural network when the number of square meters is virtually changed.
- the actual measurement data 622 indicates the number of square meters and the real estate price in the past data.
- the trial calculation data 623 indicates the number of square meters actually input by the user and the calculated system estimated price.
- the user can confirm that the trial calculation data 623 is on the model output curve 621.
- the user can also check the contents of the actual measurement data 622 linked to the plot of the actual measurement data 622 (for example, attribute information other than the square meter number).
- the user can also switch the X axis from the square meter to another input item. For example, when the user selects the X-axis label 624, input item candidates such as building age may be displayed in a list, and the input item corresponding to the X-axis may be switched according to the selection from the list.
- the user can confirm that the appraisal price is appropriate from these pieces of information.
- the present technology is applied to the property price assessment application, so that the user can confirm the basis of the assessment price.
- the justification of the basis is unknown.
- a less reliable basis including the intention of the agent may be provided. It was.
- a more reliable basis is provided.
- the object of evaluation in this application is a work of art.
- the evaluation value may be a score of a work of art.
- the following assumes a piano performance as an example of a work of art.
- scores are given by the judges.
- the judges will evaluate performances on multiple axes.
- the evaluation axis for example, music selection, musical expression, performer's assertion, performance technique, tempo feeling, rhythmic feeling, overall song balance, pedaling, touch, timbre, etc. can be considered. Evaluation in each of these evaluation axes can be performed based on the experience of the judges. And a judge calculates a score by weighting each evaluation result. This weighting can also be done based on the experience of the judges.
- System 1 may perform the evaluation according to the screening method by such a judge.
- the arithmetic processing in that case will be described with reference to FIG.
- FIG. 18 is a diagram for explaining an evaluation process for a work of art according to this embodiment.
- the system 1 inputs performance data obtained by recording a piano performance to a feature amount calculation function 141 to calculate a feature amount.
- the feature amount calculation function 141 samples and digitizes the sound generated by the performance, and calculates the feature amount from the digitized sound.
- the system 1 inputs the calculated feature amount into the item-by-item evaluation function 142 and calculates an item-by-item evaluation value that is an evaluation value for each evaluation axis.
- the item-specific evaluation function 142 calculates an evaluation value for each evaluation axis such as a sense of tempo, for example.
- the system 1 inputs the feature amount and the evaluation value for each item to the comprehensive evaluation function 143, and calculates the comprehensive evaluation value.
- the comprehensive evaluation function 143 calculates the comprehensive evaluation value by weighting the evaluation value for each item and taking the evaluation value according to the feature amount into consideration.
- Each of the feature quantity calculation function 141, the item-specific evaluation function 142, and the comprehensive evaluation function 143 may be configured by a neural network, or may be an approximate function of the neural network.
- the system 1 provides a response when the performance data fluctuates or a contribution of the evaluation value for each item when the comprehensive evaluation value is changed. It is possible to provide a basis for the validity of the evaluation.
- the artwork to be evaluated may be a song, a painting, a literary work, or the like.
- the evaluation target in this application is sports.
- the evaluation value may be a sports score.
- the score of sports refers to things that are difficult to quantify such as scores of performance of figure skating, not easy things such as soccer scores and track and field times. In the following, figure skating is assumed as an example of sports.
- a figure skating performance will be scored by a judge.
- the judges will evaluate performance on multiple axes.
- the evaluation axis includes, for example, skating technique, element connection, movement, bodywork, choreography, composition, and song interpretation. Evaluation in each of these evaluation axes can be performed based on the experience of the judges. And a judge calculates a score by weighting each evaluation result. This weighting can also be done based on the experience of the judges.
- a comprehensive evaluation is made except for an evaluation of a judge with a high or low score. In the future, this assessment may be performed by a machine.
- the system 1 may perform sports evaluation by the same processing as the artwork evaluation processing described above with reference to FIG.
- the input data can be a moving picture of the performer.
- the system 1 can provide a basis for the validity of the evaluation by providing a response when the moving image fluctuates or a contribution of the item-specific evaluation value when the comprehensive evaluation value is changed. Become.
- FIG. 19 is a block diagram illustrating an example of a hardware configuration of the information processing apparatus according to the present embodiment.
- the information processing apparatus 900 illustrated in FIG. 19 can realize, for example, the processing apparatus 100 or the terminal apparatus 200 illustrated in FIGS. 2 and 3, respectively.
- Information processing by the processing device 100 or the terminal device 200 according to the present embodiment is realized by cooperation between software and hardware described below.
- the information processing apparatus 900 includes a CPU (Central Processing Unit) 901, a ROM (Read Only Memory) 902, a RAM (Random Access Memory) 903, and a host bus 904a.
- the information processing apparatus 900 includes a bridge 904, an external bus 904b, an interface 905, an input device 906, an output device 907, a storage device 908, a drive 909, a connection port 911, and a communication device 913.
- the information processing apparatus 900 may include a processing circuit such as a DSP or an ASIC in place of or in addition to the CPU 901.
- the CPU 901 functions as an arithmetic processing unit and a control unit, and controls the overall operation in the information processing apparatus 900 according to various programs. Further, the CPU 901 may be a microprocessor.
- the ROM 902 stores programs used by the CPU 901, calculation parameters, and the like.
- the RAM 903 temporarily stores programs used in the execution of the CPU 901, parameters that change as appropriate during the execution, and the like.
- the CPU 901 can form, for example, the control unit 130 shown in FIG. 2 or the control unit 250 shown in FIG.
- the CPU 901, ROM 902, and RAM 903 are connected to each other by a host bus 904a including a CPU bus.
- the host bus 904 a is connected to an external bus 904 b such as a PCI (Peripheral Component Interconnect / Interface) bus via a bridge 904.
- an external bus 904 b such as a PCI (Peripheral Component Interconnect / Interface) bus
- PCI Peripheral Component Interconnect / Interface
- the host bus 904a, the bridge 904, and the external bus 904b do not necessarily have to be configured separately, and these functions may be mounted on one bus.
- the input device 906 is realized by a device in which information is input by the user, such as a mouse, a keyboard, a touch panel, a button, a microphone, a switch, and a lever.
- the input device 906 may be, for example, a remote control device using infrared rays or other radio waves, or may be an external connection device such as a mobile phone or a PDA that supports the operation of the information processing device 900.
- the input device 906 may include, for example, an input control circuit that generates an input signal based on information input by the user using the above-described input means and outputs the input signal to the CPU 901.
- a user of the information processing apparatus 900 can input various data and instruct a processing operation to the information processing apparatus 900 by operating the input device 906.
- the input device 906 can be formed by a device that detects information about the user.
- the input device 906 includes various sensors such as an image sensor (for example, a camera), a depth sensor (for example, a stereo camera), an acceleration sensor, a gyro sensor, a geomagnetic sensor, an optical sensor, a sound sensor, a distance sensor, and a force sensor. Can be included.
- the input device 906 includes information related to the information processing device 900 state, such as the posture and movement speed of the information processing device 900, and information related to the surrounding environment of the information processing device 900, such as brightness and noise around the information processing device 900. May be obtained.
- the input device 906 receives a GNSS signal from a GNSS (Global Navigation Satellite System) satellite (for example, a GPS signal from a GPS (Global Positioning System) satellite) and receives position information including the latitude, longitude, and altitude of the device.
- GNSS Global Navigation Satellite System
- a GNSS module to measure may be included.
- the input device 906 may detect the position by transmission / reception with Wi-Fi (registered trademark), a mobile phone / PHS / smartphone, or the like, or near field communication.
- Wi-Fi registered trademark
- the input device 906 can form, for example, the input unit 210 shown in FIG.
- the output device 907 is formed of a device that can notify the user of the acquired information visually or audibly.
- Examples of such devices include CRT display devices, liquid crystal display devices, plasma display devices, EL display devices, display devices such as laser projectors, LED projectors and lamps, audio output devices such as speakers and headphones, printer devices, and the like.
- the output device 907 outputs results obtained by various processes performed by the information processing device 900.
- the display device visually displays results obtained by various processes performed by the information processing device 900 in various formats such as text, images, tables, and graphs.
- the audio output device converts an audio signal composed of reproduced audio data, acoustic data, and the like into an analog signal and outputs it aurally.
- the display device or the audio output device can form, for example, the output unit 220 shown in FIG.
- the storage device 908 is a data storage device formed as an example of a storage unit of the information processing device 900.
- the storage apparatus 908 is realized by, for example, a magnetic storage device such as an HDD, a semiconductor storage device, an optical storage device, a magneto-optical storage device, or the like.
- the storage device 908 may include a storage medium, a recording device that records data on the storage medium, a reading device that reads data from the storage medium, a deletion device that deletes data recorded on the storage medium, and the like.
- the storage device 908 stores programs executed by the CPU 901, various data, various data acquired from the outside, and the like.
- the storage device 908 can form, for example, the storage unit 120 shown in FIG. 2 or the storage unit 240 shown in FIG.
- the drive 909 is a storage medium reader / writer, and is built in or externally attached to the information processing apparatus 900.
- the drive 909 reads information recorded on a removable storage medium such as a magnetic disk, an optical disk, a magneto-optical disk, or a semiconductor memory, and outputs the information to the RAM 903.
- the drive 909 can also write information to a removable storage medium.
- connection port 911 is an interface connected to an external device, and is a connection port with an external device capable of transmitting data by USB (Universal Serial Bus), for example.
- USB Universal Serial Bus
- the communication device 913 is a communication interface formed by a communication device or the like for connecting to the network 920, for example.
- the communication device 913 is, for example, a communication card for wired or wireless LAN (Local Area Network), LTE (Long Term Evolution), Bluetooth (registered trademark), or WUSB (Wireless USB).
- the communication device 913 may be a router for optical communication, a router for ADSL (Asymmetric Digital Subscriber Line), a modem for various communication, or the like.
- the communication device 913 can transmit and receive signals and the like according to a predetermined protocol such as TCP / IP, for example, with the Internet and other communication devices.
- the communication device 913 can form, for example, the communication unit 110 illustrated in FIG. 2 or the communication unit 230 illustrated in FIG.
- the network 920 is a wired or wireless transmission path for information transmitted from a device connected to the network 920.
- the network 920 may include a public line network such as the Internet, a telephone line network, and a satellite communication network, various LANs including the Ethernet (registered trademark), a wide area network (WAN), and the like.
- the network 920 may include a dedicated line network such as an IP-VPN (Internet Protocol-Virtual Private Network).
- IP-VPN Internet Protocol-Virtual Private Network
- each of the above components may be realized using a general-purpose member, or may be realized by hardware specialized for the function of each component. Therefore, it is possible to change the hardware configuration to be used as appropriate according to the technical level at the time of carrying out this embodiment.
- a computer program for realizing each function of the information processing apparatus 900 according to the present embodiment as described above can be produced and mounted on a PC or the like.
- a computer-readable recording medium storing such a computer program can be provided.
- the recording medium is, for example, a magnetic disk, an optical disk, a magneto-optical disk, a flash memory, or the like.
- the above computer program may be distributed via a network, for example, without using a recording medium.
- the system 1 acquires a first data set composed of a combination of input data and output data obtained by inputting the input data to the neural network, and the first data set One or more second data sets having the same items are acquired, and information indicating the positioning of the first data set in relation to the second data set is generated. With this information indicating the positioning, it is possible to provide the user with a basis for indicating the validity of the calculation result of the neural network. Thereby, the user can be easily convinced with the calculation result.
- the processing device 100 and the terminal device 200 are described as separate devices, but the present technology is not limited to such an example.
- the processing device 100 and the terminal device 200 may be realized as one device.
- a second acquisition unit that acquires one or more second data sets having the same items as the first data set;
- a generator that generates information indicating the positioning of the first data set in relation to the second data set;
- An information processing apparatus comprising: (2) The information processing apparatus according to (1), wherein the second data set includes an item having the same value as the first data set.
- the second data set is different from the first data set in the value of the first item among the items included in the input data, and the values of the other second items are the same as the first data set.
- the information processing apparatus wherein (4) The information indicating the positioning includes information indicating a relationship between the value of the first item and the value of the item corresponding to the output data in the first data set and the second data set.
- the information processing apparatus according to 3).
- the information processing apparatus wherein the second data set includes a data set generated by the neural network learned based on a data set actually observed in the past.
- the information processing apparatus wherein the second data set includes a data set actually observed in the past.
- the second data set is different from the first data set in the value of the first item among the items included in the input data, and the second data set includes items corresponding to the values of the other second items and the output data.
- the information processing apparatus wherein a value is the same as that of the first data set.
- the information indicating the positioning is information indicating a position of the input data in a distribution of the second data set in which a value of an item corresponding to the output data is the same as the output data.
- Information processing device. (9)
- the information indicating the positioning is information indicating a deviation value of the input data in the distribution of the second data set in which the value of the item corresponding to the output data is the same as the output data.
- the information processing apparatus described. (10)
- the generation unit generates information indicating a response relationship between an input value to an input layer unit selected from an intermediate layer of the neural network and an output value from a selected output layer unit (1)
- the information processing apparatus wherein the information indicating the response relationship is a graph.
- the information processing apparatus wherein the information indicating the response relationship is a function.
- the generation unit generates information that proposes removal of the input layer unit that does not contribute to an output value from the output layer unit.
- the input data is attribute information to be evaluated, The information processing apparatus according to (1), wherein the output data is an evaluation value of the evaluation target.
- the evaluation object is real estate, The information processing apparatus according to (14), wherein the evaluation value is a price. (16) The information processing apparatus according to (14), wherein the evaluation target is a work of art.
- An acquisition unit for acquiring information from the other device An information processing apparatus comprising: (19) Obtaining a first data set comprising input data and a combination of output data obtained by inputting the input data into a neural network; Obtaining one or more second data sets having the same items as the first data set; Generating information indicating a positioning of the first data set in relation to the second data set by a processor; An information processing method including: (20) Notifying other devices of input data; The positioning of the first data set in relation to a second data set having the same items as a first data set composed of a combination of output data obtained by inputting the input data to a neural network. Obtaining information from the other device by a processor; An information processing method including:
- System 100 Processing Device 110 Communication Unit 120 Storage Unit 130 Control Unit 131 First Acquisition Unit 131 132 Second acquisition unit 132 133 arithmetic unit 133 134 generator 134 135 Notification unit 135 200 terminal device 210 input unit 220 output unit 230 communication unit 240 storage unit 250 control unit 251 notification unit 253 acquisition unit
Abstract
Description
1.はじめに
1.1.技術的課題
1.2.ニューラルネット
2.構成例
2.1.システムの構成例
2.2.処理装置の構成例
2.3.端末装置の構成例
3.技術的特徴
3.1.概要
3.2.第1の方法
3.3.第2の方法
3.4.処理の流れ
4.アプリケーション例
5.ハードウェア構成例
6.まとめ The description will be made in the following order.
1. 1. Introduction 1.1. Technical issues 1.2. Neural network Configuration example 2.1. System configuration example 2.2. Configuration example of processing apparatus 2.3. 2. Configuration example of terminal device Technical features 3.1. Overview 3.2. First method 3.3. Second method 3.4. Flow of processing Application example 5. 5. Hardware configuration example Summary
<1.1.技術的課題>
従来の機械学習の枠組みでは、特徴量の設計、即ち認識又は予測(即ち、回帰)等の演算に必要となる値の計算方法の設計が、人によるデータの分析、考察、経験則の取り込みなどを用いてなされていた。これに対し、ディープラーニングでは、特徴量の設計をニューラルネットの関数に任せる。この違いにより、近年、ディープラーニングを用いた技術は、他の機械学習を用いた技術を圧倒するようになってきている。 << 1. Introduction >>
<1.1. Technical issues>
In the conventional machine learning framework, the design of the feature value, that is, the design of the calculation method of the value necessary for the calculation such as recognition or prediction (ie, regression), etc. It was made using. In contrast, in deep learning, the design of feature values is left to the function of the neural network. Due to this difference, in recent years, technologies using deep learning have come to overwhelm other technologies using machine learning.
・概要
ニューラルネットに限らず、一般に、認識又は予測(即ち、回帰)技術では、データ変数xを目的変数y(例えば、ラベル、回帰値又は予測値)に写像する関数は、次式で表される。 <1.2. Neural network>
Overview Not limited to neural networks, in general, in recognition or prediction (ie, regression) technology, a function that maps a data variable x to an objective variable y (for example, a label, a regression value, or a predicted value) is expressed by the following equation: The


ニューラルネットにおいては、予め与えられたデータセットにおいて、上記数式(8)が成り立つようにパラメータが学習される。データセットを、ここでは一例として(xn,yn)とし、n=1,…,Nとする。この場合、学習とは、与えられた全てのデータセットにおける、予測値f(xn)と実際の値ynとの差が小さくなるようなパラメータを求めることを指す。この差は、例えば次式で表される。 Objective Function In the neural network, parameters are learned so that the above formula (8) is established in a predetermined data set. Here, the data set is (x n , y n ) as an example, and n = 1,. In this case, learning and are, in all of the data sets given refer to ask for parameters such as the difference between the actual value y n and the predicted value f (x n) is reduced. This difference is expressed by the following equation, for example.

学習は、目的関数L(θ)を最小化することにより行われる。そのためには、例えばパラメータθに関する勾配を用いる方法が用いられ得る。その一例である確率的勾配方法では、次式に従ってパラメータが逐次更新されながら、目的関数L(θ)を最小化するパラメータθが繰り返し探索される。 -Learning Learning is performed by minimizing the objective function L (θ). For this purpose, for example, a method using a gradient related to the parameter θ can be used. In the probabilistic gradient method as an example, the parameter θ that minimizes the objective function L (θ) is repeatedly searched while the parameter is sequentially updated according to the following equation.

ニューラルネットの各層は、様々な構成がとられ得る。ニューラルネットの各層の主要な構成は、線形結合の構成と非線形関数の種類により定まる。線形結合の構成には、主として、全結合ネットワーク、又はコンボリューショナル(畳込み)ネットワーク等がある。一方で、非線形結合関数には、新しい関数が次々と提唱されている。その一例として、次式に示すシグモイドがある。 -Configuration of each layer of the neural network Each layer of the neural network can have various configurations. The main configuration of each layer of the neural network is determined by the configuration of the linear combination and the type of nonlinear function. The configuration of the linear combination mainly includes a total connection network or a convolutional network. On the other hand, new functions are proposed one after another for nonlinear coupling functions. One example is a sigmoid represented by the following equation.


<2.1.システムの構成例>
図1は、本開示の一実施形態に係るシステムの概略的な構成の一例を示す図である。図1に示すように、システム1は、処理装置100及び端末装置200を含む。 << 2. Configuration example >>
<2.1. System configuration example>
FIG. 1 is a diagram illustrating an example of a schematic configuration of a system according to an embodiment of the present disclosure. As shown in FIG. 1, the
図2は、本実施形態に係る処理装置100の論理的な構成の一例を示すブロック図である。図2に示すように、処理装置100は、通信部110、記憶部120及び制御部130を含む。 <2.2. Configuration example of processing apparatus>
FIG. 2 is a block diagram illustrating an example of a logical configuration of the
通信部110は、情報を送受信する機能を有する。例えば、通信部110は、端末装置200からの情報を受信し、端末装置200への情報を送信する。 (1)
The
記憶部120は、処理装置100の動作のためのプログラム及び様々なデータを一時的に又は恒久的に記憶する。 (2)
The
制御部130は、処理装置100の様々な機能を提供する。制御部130は、第1の取得部131、第2の取得部132、演算部133、生成部134及び通知部135を含む。なお、制御部130は、これらの構成要素以外の他の構成要素をさらに含み得る。即ち、制御部130は、これらの構成要素の動作以外の動作も行い得る。 (3)
The
図3は、本実施形態に係る端末装置200の論理的な構成の一例を示すブロック図である。図3に示すように、端末装置200は、入力部210、出力部220、通信部230、記憶部240及び制御部250を含む。 <2.3. Configuration example of terminal device>
FIG. 3 is a block diagram illustrating an example of a logical configuration of the
入力部210は、情報の入力を受け付ける機能を有する。例えば、入力部210は、ユーザからの情報の入力を受け付ける。入力部210は、例えばキーボード又はタッチパネル等による文字入力を受け付けてもよいし、音声入力を受け付けてもよいし、ジェスチャ入力を受け付けてもよい。その他、入力部210は、フラッシュメモリ等の記憶媒体からのデータ入力を受け付けてもよい。 (1)
The
出力部220は、情報の出力を行う機能を有する。例えば、出力部220は、画像、音声、振動、又は発光等により情報を出力する。 (2)
The
通信部230は、情報を送受信する機能を有する。例えば、通信部230は、処理装置100からの情報を受信し、処理装置100への情報を送信する。 (3)
The
記憶部240は、端末装置200の動作のためのプログラム及び様々なデータを一時的に又は恒久的に記憶する。 (4)
The
制御部250は、端末装置200の様々な機能を提供する。制御部250は、通知部251及び取得部253を含む。なお、制御部250は、これらの構成要素以外の他の構成要素をさらに含み得る。即ち、制御部250は、これらの構成要素の動作以外の動作も行い得る。 (5)
The
続いて、本実施形態に係るシステム1の技術的特徴を説明する。 << 3. Technical features >>
Next, technical features of the
システム1(例えば、演算部133)は、ニューラルネットに関する各種演算を行う。例えば、演算部133は、ニューラルネットのパラメータの学習、及びニューラルネットに入力データを入力して演算を行い、出力データを出力する。入力データにはひとつ以上の入力項目の各々の値(以下、入力値とも称する)が含まれ、入力値の各々はニューラルネットの入力層の対応するユニットに入力される。同様に、出力データにはひとつ以上の出力項目の各々の値(以下、出力値とも称する)が含まれ、出力値の各々はニューラルネットの出力層の対応するユニットから出力される。 <3.1. Overview>
The system 1 (for example, the calculation unit 133) performs various calculations related to the neural network. For example, the


・第1のデータセット
システム1(例えば、第1の取得部131)は、入力データ及び当該入力データをニューラルネットに入力して得られた出力データの組み合わせから成る第1のデータセットを取得する。例えば、不動産の属性情報が入力データに相当し、出力データが不動産価格に相当する。 <3.2. First Method>
First data set The system 1 (for example, the first acquisition unit 131) acquires a first data set composed of a combination of input data and output data obtained by inputting the input data into a neural network. . For example, real estate attribute information corresponds to input data, and output data corresponds to real estate prices.
システム1(例えば、第2の取得部132)は、第1のデータセットと値が同一の項目を有する第2のデータセットをひとつ以上取得する。第2のデータセットは、第1のデータセットと同一の値の項目を有し、出力データに対応する項目を有する。例えば、第2のデータセットは、第1のデータセットと同様に、不動産の属性情報と不動産価格との組み合わせから成る。そして、例えば属性情報のうち一部が、第1のデータセットと同一である。 Second Data Set The system 1 (for example, the second acquisition unit 132) acquires one or more second data sets having items having the same values as the first data set. The second data set has items of the same value as the first data set, and has items corresponding to the output data. For example, the second data set includes a combination of real estate attribute information and real estate prices, as in the first data set. For example, a part of the attribute information is the same as the first data set.
システム1(例えば、生成部134)は、第2のデータセットとの関係における第1のデータセットの位置付けを示す情報を生成する。生成された位置付けを示す情報は、例えば端末装置200によりユーザに提供される。これにより、ニューラルネットの演算結果の根拠をユーザに提供することが可能となる。 Generation of information indicating positioning The system 1 (for example, the generation unit 134) generates information indicating the positioning of the first data set in relation to the second data set. The information indicating the generated positioning is provided to the user by the
第1の方法においては、位置付けを示す情報は、第1のデータセット及び第2のデータセットの、応答の可視化の対象である入力項目(第1の項目に相当)の値と出力データに対応する項目の値との関係を示す。これにより、例えば築年数が不動産価格にどのような影響を与えるか、という応答関係を明確にユーザに提供することが可能となる。以下、図4~図6を参照して、第1の方法に係るUI(User Interface)の一例を説明する。なお、UIは、例えば端末装置200により表示され、情報の入力を受け付ける。他のUIに関しても同様である。 Basic UI example In the first method, the information indicating the positioning of the input item (corresponding to the first item) of the first data set and the second data set that is the target of response visualization The relationship between the value and the value of the item corresponding to the output data is shown. This makes it possible to clearly provide the user with a response relationship, for example, how the building age affects the real estate price. Hereinafter, an example of a UI (User Interface) according to the first method will be described with reference to FIGS. The UI is displayed by the
システム1(例えば、生成部)は、ニューラルネットの中間層から選択された入力層のユニットへの入力値と選択された出力層のユニットからの出力値との応答関係を示す情報を生成してもよい。このことは、上記UI例において行った入力層と出力層との応答関係の可視化を、中間層において行うことを指す。これにより、ユーザは、中間層における応答関係を理解することが可能となり、その結果、ニューラルネットの演算結果の妥当性をより詳細に理解することが可能となる。また、例えば、特定の中間層において抽象的な概念が表現されていることが期待できる場合に、中間層における応答関係の可視化により、ユーザは当該概念を知得することが可能となる。 Application UI Example The system 1 (for example, the generation unit) is information indicating a response relationship between the input value to the unit of the input layer selected from the intermediate layer of the neural network and the output value from the unit of the selected output layer. May be generated. This means that the visualization of the response relationship between the input layer and the output layer performed in the UI example is performed in the intermediate layer. As a result, the user can understand the response relationship in the intermediate layer, and as a result, can understand the validity of the operation result of the neural network in more detail. Further, for example, when an abstract concept can be expected to be expressed in a specific intermediate layer, the user can know the concept by visualizing the response relationship in the intermediate layer.
応答関係を示す情報は、グラフであってもよい。この場合のUI例を、図7を参照して説明する。 -Graph The information indicating the response relationship may be a graph. An example of a UI in this case will be described with reference to FIG.
応答関係を示す情報は、関数であってもよい。この場合のUI例を、図8及び図9を参照して説明する。 -Function The information indicating the response relationship may be a function. An example of a UI in this case will be described with reference to FIGS.
システム1(例えば、生成部)は、ニューラルネットの設計補助のためのUIを生成し、提供してもよい。 -Neural network design assistance The system 1 (for example, the generating unit) may generate and provide a UI for neural network design assistance.
・第1のデータセット
システム1(例えば、第1の取得部131)は、第1の方法と同様に、入力データ及び当該入力データをニューラルネットに入力して得られた出力データの組み合わせから成る第1のデータセットを取得する。 <3.3. Second method>
-1st data set The system 1 (for example, 1st acquisition part 131) consists of the combination of the output data obtained by inputting input data and the said input data into a neural network similarly to the 1st method. Obtain a first data set.
システム1(例えば、第2の取得部132)は、第1の方法と同様に、第1のデータセットと値が同一の項目を有する第2のデータセットをひとつ以上取得する。第2のデータセットは、第1の方法と同様に、第1のデータセットと同一の値の項目を有し、出力データに対応する項目を有する。 Second data set The system 1 (for example, the second acquisition unit 132) acquires one or more second data sets having items having the same values as the first data set, as in the first method. To do. Similar to the first method, the second data set has items having the same value as the first data set, and has items corresponding to the output data.
システム1(例えば、生成部134)は、第2のデータセットとの関係における第1のデータセットの位置付けを示す情報を生成する。 Generation of information indicating positioning The system 1 (for example, the generation unit 134) generates information indicating the positioning of the first data set in relation to the second data set.
続いて、図15を参照して、上記説明したニューラルネットの応答の可視化を行うための処理の流れの一例を説明する。 <3.4. Flow of processing>
Next, an example of the flow of processing for visualizing the response of the neural network described above will be described with reference to FIG.
本技術は、入力データが属するカテゴリを判定する分類問題、及び入力データにより得られる出力データを予測する回帰問題の、いずれのアプリケーションにおいても利用可能である。以下では、その一例として、回帰問題のアプリケーション例を説明する。 << 4. Application example >>
The present technology can be used in any application of a classification problem for determining a category to which input data belongs and a regression problem for predicting output data obtained from input data. Hereinafter, as an example, an application example of a regression problem will be described.
例えば、ユーザは、インターネットサイトにおいて不動産価格を査定する例を想定する。その場合、処理装置100はユーザが操作するユーザ端末に相当し、処理装置100は、インターネットサイトのバックエンドに存在し得る。 (1) Real estate price assessment application For example, assume that a user assesses a real estate price on an Internet site. In that case, the
本アプリケーションにおける評価対象は芸術作品である。評価値は芸術作品の得点であってもよい。以下では芸術作品の一例として、ピアノの演奏を想定する。 (2) Art Work Evaluation Application The object of evaluation in this application is a work of art. The evaluation value may be a score of a work of art. The following assumes a piano performance as an example of a work of art.
本アプリケーションにおける評価対象はスポーツである。評価値はスポーツの得点であってもよい。ここで、スポーツの得点とは、サッカーにおける得点及び陸上競技のタイムのような数値化容易なものではなく、フィギュアスケートの演技の点数のような数値化困難なものを指す。以下ではスポーツの一例として、フィギュアスケートを想定する。 (3) Sports evaluation application The evaluation target in this application is sports. The evaluation value may be a sports score. Here, the score of sports refers to things that are difficult to quantify such as scores of performance of figure skating, not easy things such as soccer scores and track and field times. In the following, figure skating is assumed as an example of sports.
最後に、図19を参照して、本実施形態に係る情報処理装置のハードウェア構成について説明する。図19は、本実施形態に係る情報処理装置のハードウェア構成の一例を示すブロック図である。なお、図19に示す情報処理装置900は、例えば、図2及び図3にそれぞれ示した処理装置100又は端末装置200を実現し得る。本実施形態に係る処理装置100又は端末装置200による情報処理は、ソフトウェアと、以下に説明するハードウェアとの協働により実現される。 << 5. Hardware configuration example >>
Finally, with reference to FIG. 19, a hardware configuration of the information processing apparatus according to the present embodiment will be described. FIG. 19 is a block diagram illustrating an example of a hardware configuration of the information processing apparatus according to the present embodiment. Note that the
以上、図1~図19を参照して、本開示の一実施形態について詳細に説明した。上記説明したように、本実施形態に係るシステム1は、入力データ及び入力データをニューラルネットに入力して得られた出力データの組み合わせから成る第1のデータセットを取得し、第1のデータセットと同一の項目を有する第2のデータセットをひとつ以上取得し、第2のデータセットとの関係における第1のデータセットの位置付けを示す情報を生成する。この位置付けを示す情報により、ニューラルネットの演算結果の妥当性を示す根拠をユーザに提供することが可能となる。これにより、ユーザは、演算結果に容易に納得することが可能となる。 << 6. Summary >>
The embodiment of the present disclosure has been described in detail above with reference to FIGS. As described above, the
(1)
入力データ及び前記入力データをニューラルネットに入力して得られた出力データの組み合わせから成る第1のデータセットを取得する第1の取得部と、
前記第1のデータセットと同一の項目を有する第2のデータセットをひとつ以上取得する第2の取得部と、
前記第2のデータセットとの関係における前記第1のデータセットの位置付けを示す情報を生成する生成部と、
を備える情報処理装置。
(2)
前記第2のデータセットは、前記第1のデータセットと同一の値の項目を有する、前記(1)に記載の情報処理装置。
(3)
前記第2のデータセットは、前記入力データに含まれる項目のうち第1の項目の値が前記第1のデータセットと異なり、他の第2の項目の値が前記第1のデータセットと同一である、前記(2)に記載の情報処理装置。
(4)
前記位置付けを示す情報は、前記第1のデータセット及び前記第2のデータセットの、前記第1の項目の値と前記出力データに対応する項目の値との関係を示す情報を含む、前記(3)に記載の情報処理装置。
(5)
前記第2のデータセットは、過去に実際に観測されたデータセットに基づいて学習された前記ニューラルネットにより生成されたデータセットを含む、前記(2)に記載の情報処理装置。
(6)
前記第2のデータセットは、過去に実際に観測されたデータセットを含む、前記(2)に記載の情報処理装置。
(7)
前記第2のデータセットは、前記入力データに含まれる項目のうち第1の項目の値が前記第1のデータセットと異なり、他の第2の項目の値及び前記出力データに対応する項目の値が前記第1のデータセットと同一である、前記(2)に記載の情報処理装置。
(8)
前記位置付けを示す情報は、前記出力データに対応する項目の値が前記出力データと同一である前記第2のデータセットの分布における前記入力データの位置を示す情報である、前記(7)に記載の情報処理装置。
(9)
前記位置付けを示す情報は、前記出力データに対応する項目の値が前記出力データと同一である前記第2のデータセットの分布における前記入力データの偏差値を示す情報である、前記(7)に記載の情報処理装置。
(10)
前記生成部は、前記ニューラルネットの中間層から選択された入力層のユニットへの入力値と選択された出力層のユニットからの出力値との応答関係を示す情報を生成する、前記(1)に記載の情報処理装置。
(11)
前記応答関係を示す情報は、グラフである、前記(10)に記載の情報処理装置。
(12)
前記応答関係を示す情報は、関数である、前記(10)に記載の情報処理装置。
(13)
前記生成部は、前記出力層のユニットからの出力値に寄与しない前記入力層のユニットの除去を提案する情報を生成する、前記(10)に記載の情報処理装置。
(14)
前記入力データは、評価対象の属性情報であり、
前記出力データは、前記評価対象の評価値である、前記(1)に記載の情報処理装置。
(15)
前記評価対象は、不動産であり、
前記評価値は、価格である、前記(14)に記載の情報処理装置。
(16)
前記評価対象は、芸術作品である、前記(14)に記載の情報処理装置。
(17)
前記評価対象は、スポーツである、前記(14)に記載の情報処理装置。
(18)
入力データを他の装置へ通知する通知部と、
前記入力データをニューラルネットに入力して得られた出力データの組み合わせから成る第1のデータセットと同一の項目を有する第2のデータセットとの関係における、前記第1のデータセットの位置付けを示す情報を前記他の装置から取得する取得部と、
を備える情報処理装置。
(19)
入力データ及び前記入力データをニューラルネットに入力して得られた出力データの組み合わせから成る第1のデータセットを取得することと、
前記第1のデータセットと同一の項目を有する第2のデータセットをひとつ以上取得することと、
前記第2のデータセットとの関係における前記第1のデータセットの位置付けを示す情報をプロセッサにより生成することと、
を含む情報処理方法。
(20)
入力データを他の装置へ通知することと、
前記入力データをニューラルネットに入力して得られた出力データの組み合わせから成る第1のデータセットと同一の項目を有する第2のデータセットとの関係における、前記第1のデータセットの位置付けを示す情報を前記他の装置からプロセッサにより取得することと、
を含む情報処理方法。 The following configurations also belong to the technical scope of the present disclosure.
(1)
A first acquisition unit for acquiring a first data set comprising a combination of input data and output data obtained by inputting the input data into a neural network;
A second acquisition unit that acquires one or more second data sets having the same items as the first data set;
A generator that generates information indicating the positioning of the first data set in relation to the second data set;
An information processing apparatus comprising:
(2)
The information processing apparatus according to (1), wherein the second data set includes an item having the same value as the first data set.
(3)
The second data set is different from the first data set in the value of the first item among the items included in the input data, and the values of the other second items are the same as the first data set. The information processing apparatus according to (2), wherein
(4)
The information indicating the positioning includes information indicating a relationship between the value of the first item and the value of the item corresponding to the output data in the first data set and the second data set. The information processing apparatus according to 3).
(5)
The information processing apparatus according to (2), wherein the second data set includes a data set generated by the neural network learned based on a data set actually observed in the past.
(6)
The information processing apparatus according to (2), wherein the second data set includes a data set actually observed in the past.
(7)
The second data set is different from the first data set in the value of the first item among the items included in the input data, and the second data set includes items corresponding to the values of the other second items and the output data. The information processing apparatus according to (2), wherein a value is the same as that of the first data set.
(8)
The information indicating the positioning is information indicating a position of the input data in a distribution of the second data set in which a value of an item corresponding to the output data is the same as the output data. Information processing device.
(9)
The information indicating the positioning is information indicating a deviation value of the input data in the distribution of the second data set in which the value of the item corresponding to the output data is the same as the output data. The information processing apparatus described.
(10)
The generation unit generates information indicating a response relationship between an input value to an input layer unit selected from an intermediate layer of the neural network and an output value from a selected output layer unit (1) The information processing apparatus described in 1.
(11)
The information processing apparatus according to (10), wherein the information indicating the response relationship is a graph.
(12)
The information processing apparatus according to (10), wherein the information indicating the response relationship is a function.
(13)
The information processing apparatus according to (10), wherein the generation unit generates information that proposes removal of the input layer unit that does not contribute to an output value from the output layer unit.
(14)
The input data is attribute information to be evaluated,
The information processing apparatus according to (1), wherein the output data is an evaluation value of the evaluation target.
(15)
The evaluation object is real estate,
The information processing apparatus according to (14), wherein the evaluation value is a price.
(16)
The information processing apparatus according to (14), wherein the evaluation target is a work of art.
(17)
The information processing apparatus according to (14), wherein the evaluation target is sports.
(18)
A notification unit for notifying other devices of input data;
The positioning of the first data set in relation to a second data set having the same items as a first data set composed of a combination of output data obtained by inputting the input data to a neural network. An acquisition unit for acquiring information from the other device;
An information processing apparatus comprising:
(19)
Obtaining a first data set comprising input data and a combination of output data obtained by inputting the input data into a neural network;
Obtaining one or more second data sets having the same items as the first data set;
Generating information indicating a positioning of the first data set in relation to the second data set by a processor;
An information processing method including:
(20)
Notifying other devices of input data;
The positioning of the first data set in relation to a second data set having the same items as a first data set composed of a combination of output data obtained by inputting the input data to a neural network. Obtaining information from the other device by a processor;
An information processing method including:
100 処理装置
110 通信部
120 記憶部
130 制御部
131 第1の取得部131
132 第2の取得部132
133 演算部133
134 生成部134
135 通知部135
200 端末装置
210 入力部
220 出力部
230 通信部
240 記憶部
250 制御部
251 通知部
253 取得部 1
132
133
134
135
200
Claims (20)
- 入力データ及び前記入力データをニューラルネットに入力して得られた出力データの組み合わせから成る第1のデータセットを取得する第1の取得部と、
前記第1のデータセットと同一の項目を有する第2のデータセットをひとつ以上取得する第2の取得部と、
前記第2のデータセットとの関係における前記第1のデータセットの位置付けを示す情報を生成する生成部と、
を備える情報処理装置。 A first acquisition unit for acquiring a first data set comprising a combination of input data and output data obtained by inputting the input data into a neural network;
A second acquisition unit that acquires one or more second data sets having the same items as the first data set;
A generator that generates information indicating the positioning of the first data set in relation to the second data set;
An information processing apparatus comprising: - 前記第2のデータセットは、前記第1のデータセットと同一の値の項目を有する、請求項1に記載の情報処理装置。 The information processing apparatus according to claim 1, wherein the second data set includes items having the same value as the first data set.
- 前記第2のデータセットは、前記入力データに含まれる項目のうち第1の項目の値が前記第1のデータセットと異なり、他の第2の項目の値が前記第1のデータセットと同一である、請求項2に記載の情報処理装置。 The second data set is different from the first data set in the value of the first item among the items included in the input data, and the values of the other second items are the same as the first data set. The information processing apparatus according to claim 2, wherein
- 前記位置付けを示す情報は、前記第1のデータセット及び前記第2のデータセットの、前記第1の項目の値と前記出力データに対応する項目の値との関係を示す情報を含む、請求項3に記載の情報処理装置。 The information indicating the positioning includes information indicating a relationship between a value of the first item and a value of an item corresponding to the output data in the first data set and the second data set. 3. The information processing apparatus according to 3.
- 前記第2のデータセットは、過去に実際に観測されたデータセットに基づいて学習された前記ニューラルネットにより生成されたデータセットを含む、請求項2に記載の情報処理装置。 The information processing apparatus according to claim 2, wherein the second data set includes a data set generated by the neural network learned based on a data set actually observed in the past.
- 前記第2のデータセットは、過去に実際に観測されたデータセットを含む、請求項2に記載の情報処理装置。 The information processing apparatus according to claim 2, wherein the second data set includes a data set actually observed in the past.
- 前記第2のデータセットは、前記入力データに含まれる項目のうち第1の項目の値が前記第1のデータセットと異なり、他の第2の項目の値及び前記出力データに対応する項目の値が前記第1のデータセットと同一である、請求項2に記載の情報処理装置。 In the second data set, the value of the first item among the items included in the input data is different from the first data set, and the values of the other second items and the items corresponding to the output data The information processing apparatus according to claim 2, wherein a value is the same as that of the first data set.
- 前記位置付けを示す情報は、前記出力データに対応する項目の値が前記出力データと同一である前記第2のデータセットの分布における前記入力データの位置を示す情報である、請求項7に記載の情報処理装置。 The information indicating the positioning is information indicating a position of the input data in a distribution of the second data set in which a value of an item corresponding to the output data is the same as the output data. Information processing device.
- 前記位置付けを示す情報は、前記出力データに対応する項目の値が前記出力データと同一である前記第2のデータセットの分布における前記入力データの偏差値を示す情報である、請求項7に記載の情報処理装置。 The information indicating the positioning is information indicating a deviation value of the input data in the distribution of the second data set in which a value of an item corresponding to the output data is the same as the output data. Information processing device.
- 前記生成部は、前記ニューラルネットの中間層から選択された入力層のユニットへの入力値と選択された出力層のユニットからの出力値との応答関係を示す情報を生成する、請求項1に記載の情報処理装置。 The generation unit generates information indicating a response relationship between an input value to an input layer unit selected from an intermediate layer of the neural network and an output value from a selected output layer unit. The information processing apparatus described.
- 前記応答関係を示す情報は、グラフである、請求項10に記載の情報処理装置。 The information processing apparatus according to claim 10, wherein the information indicating the response relationship is a graph.
- 前記応答関係を示す情報は、関数である、請求項10に記載の情報処理装置。 The information processing apparatus according to claim 10, wherein the information indicating the response relationship is a function.
- 前記生成部は、前記出力層のユニットからの出力値に寄与しない前記入力層のユニットの除去を提案する情報を生成する、請求項10に記載の情報処理装置。 The information processing apparatus according to claim 10, wherein the generation unit generates information for proposing removal of the input layer unit that does not contribute to an output value from the output layer unit.
- 前記入力データは、評価対象の属性情報であり、
前記出力データは、前記評価対象の評価値である、請求項1に記載の情報処理装置。 The input data is attribute information to be evaluated,
The information processing apparatus according to claim 1, wherein the output data is an evaluation value of the evaluation target. - 前記評価対象は、不動産であり、
前記評価値は、価格である、請求項14に記載の情報処理装置。 The evaluation object is real estate,
The information processing apparatus according to claim 14, wherein the evaluation value is a price. - 前記評価対象は、芸術作品である、請求項14に記載の情報処理装置。 15. The information processing apparatus according to claim 14, wherein the evaluation object is a work of art.
- 前記評価対象は、スポーツである、請求項14に記載の情報処理装置。 The information processing apparatus according to claim 14, wherein the evaluation object is a sport.
- 入力データを他の装置へ通知する通知部と、
前記入力データをニューラルネットに入力して得られた出力データの組み合わせから成る第1のデータセットと同一の項目を有する第2のデータセットとの関係における、前記第1のデータセットの位置付けを示す情報を前記他の装置から取得する取得部と、
を備える情報処理装置。 A notification unit for notifying other devices of input data;
The positioning of the first data set in relation to a second data set having the same items as a first data set composed of a combination of output data obtained by inputting the input data to a neural network. An acquisition unit for acquiring information from the other device;
An information processing apparatus comprising: - 入力データ及び前記入力データをニューラルネットに入力して得られた出力データの組み合わせから成る第1のデータセットを取得することと、
前記第1のデータセットと同一の項目を有する第2のデータセットをひとつ以上取得することと、
前記第2のデータセットとの関係における前記第1のデータセットの位置付けを示す情報をプロセッサにより生成することと、
を含む情報処理方法。 Obtaining a first data set comprising input data and a combination of output data obtained by inputting the input data into a neural network;
Obtaining one or more second data sets having the same items as the first data set;
Generating information indicating a positioning of the first data set in relation to the second data set by a processor;
An information processing method including: - 入力データを他の装置へ通知することと、
前記入力データをニューラルネットに入力して得られた出力データの組み合わせから成る第1のデータセットと同一の項目を有する第2のデータセットとの関係における、前記第1のデータセットの位置付けを示す情報を前記他の装置からプロセッサにより取得することと、
を含む情報処理方法。 Notifying other devices of input data;
The positioning of the first data set in relation to a second data set having the same items as a first data set composed of a combination of output data obtained by inputting the input data to a neural network. Obtaining information from the other device by a processor;
An information processing method including:
Priority Applications (3)
| Application Number | Priority Date | Filing Date | Title |
|---|---|---|---|
| JP2018508386A JP7006585B2 (en) | 2016-03-28 | 2016-12-14 | Information processing equipment and information processing method |
| EP16897081.2A EP3438887A4 (en) | 2016-03-28 | 2016-12-14 | Information processing device and information processing method |
| US16/068,721 US20190026630A1 (en) | 2016-03-28 | 2016-12-14 | Information processing apparatus and information processing method |
Applications Claiming Priority (2)
| Application Number | Priority Date | Filing Date | Title |
|---|---|---|---|
| JP2016063785 | 2016-03-28 | ||
| JP2016-063785 | 2016-03-28 |
Publications (1)
| Publication Number | Publication Date |
|---|---|
| WO2017168865A1 true WO2017168865A1 (en) | 2017-10-05 |
Family
ID=59962884
Family Applications (1)
| Application Number | Title | Priority Date | Filing Date |
|---|---|---|---|
| PCT/JP2016/087186 WO2017168865A1 (en) | 2016-03-28 | 2016-12-14 | Information processing device and information processing method |
Country Status (4)
| Country | Link |
|---|---|
| US (1) | US20190026630A1 (en) |
| EP (1) | EP3438887A4 (en) |
| JP (1) | JP7006585B2 (en) |
| WO (1) | WO2017168865A1 (en) |
Cited By (10)
| Publication number | Priority date | Publication date | Assignee | Title |
|---|---|---|---|---|
| JP2020129209A (en) * | 2019-02-07 | 2020-08-27 | 国立研究開発法人情報通信研究機構 | Optimization method, optimization program, inference method, and inference program |
| JP2020168233A (en) * | 2019-04-04 | 2020-10-15 | 株式会社日立製作所 | Ultrasonic imaging device, and image processor |
| JP2021504836A (en) * | 2017-12-01 | 2021-02-15 | 1キュービー インフォメーション テクノロジーズ インコーポレイテッド1Qb Information Technologies Inc. | Systems and methods for stochastic optimization of robust estimation problems |
| JP2022035010A (en) * | 2020-08-20 | 2022-03-04 | 株式会社医療情報技術研究所 | Classification system |
| US11494659B2 (en) | 2019-06-26 | 2022-11-08 | Kioxia Corporation | Information processing method and information processing apparatus |
| WO2022249927A1 (en) | 2021-05-28 | 2022-12-01 | 株式会社医療情報技術研究所 | Classification system |
| JP7329127B2 (en) | 2019-07-08 | 2023-08-17 | ヴィアナイ システムズ, インコーポレイテッド | A technique for visualizing the behavior of neural networks |
| US11797641B2 (en) | 2015-02-03 | 2023-10-24 | 1Qb Information Technologies Inc. | Method and system for solving the lagrangian dual of a constrained binary quadratic programming problem using a quantum annealer |
| JP7439470B2 (en) | 2019-04-11 | 2024-02-28 | 富士電機株式会社 | Information processing device, information processing method, and program |
| US11947506B2 (en) | 2019-06-19 | 2024-04-02 | 1Qb Information Technologies, Inc. | Method and system for mapping a dataset from a Hilbert space of a given dimension to a Hilbert space of a different dimension |
Families Citing this family (7)
| Publication number | Priority date | Publication date | Assignee | Title |
|---|---|---|---|---|
| KR101335278B1 (en) * | 2012-07-19 | 2013-11-29 | 에스에이비(주) | Dual cycle heat pump system |
| JP6523379B2 (en) * | 2017-07-25 | 2019-05-29 | ファナック株式会社 | Information processing device |
| JP2019080232A (en) * | 2017-10-26 | 2019-05-23 | 株式会社Preferred Networks | Gradient compression device, gradient compression method and program |
| JP6857332B2 (en) * | 2018-03-13 | 2021-04-14 | オムロン株式会社 | Arithmetic logic unit, arithmetic method, and its program |
| JP7139996B2 (en) * | 2019-02-25 | 2022-09-21 | 日本電信電話株式会社 | Evaluation device and evaluation method |
| US11112783B2 (en) * | 2019-10-25 | 2021-09-07 | Computational Systems, Inc. | Method and apparatus for machine monitoring with continuous improvement of a predictive maintenance database |
| CN111078725B (en) * | 2019-12-13 | 2022-07-12 | 浙江大学 | Visual query method and device for multi-data-source combined data |
Citations (6)
| Publication number | Priority date | Publication date | Assignee | Title |
|---|---|---|---|---|
| JPH0535707A (en) * | 1991-07-25 | 1993-02-12 | Hitachi Ltd | Pattern sorting method/device using neural network |
| JPH0561849A (en) * | 1991-08-29 | 1993-03-12 | Toyoda Mach Works Ltd | Input/output characteristic detection device for neutral network |
| JPH05225163A (en) * | 1992-02-13 | 1993-09-03 | Hitachi Ltd | Neural network system and learning method for neural network |
| JPH11282823A (en) * | 1998-03-31 | 1999-10-15 | Ricchi Hyoka Kenkyusho:Kk | Land evaluation system and method, and medium storing land evaluation program |
| JP2001344590A (en) * | 2000-05-31 | 2001-12-14 | Fuji Electric Co Ltd | Neural network and method for learning the same and method for analyzing the same and method for judging abnormality |
| JP2007094631A (en) * | 2005-09-28 | 2007-04-12 | Hitachi Electronics Service Co Ltd | Application operation monitoring system, client application operation monitoring service providing system, and method, and client application operation monitoring service providing method |
Family Cites Families (10)
| Publication number | Priority date | Publication date | Assignee | Title |
|---|---|---|---|---|
| US7617163B2 (en) * | 1998-05-01 | 2009-11-10 | Health Discovery Corporation | Kernels and kernel methods for spectral data |
| US6941287B1 (en) * | 1999-04-30 | 2005-09-06 | E. I. Du Pont De Nemours And Company | Distributed hierarchical evolutionary modeling and visualization of empirical data |
| US8463718B2 (en) * | 2000-08-07 | 2013-06-11 | Health Discovery Corporation | Support vector machine-based method for analysis of spectral data |
| EP1393196A4 (en) * | 2001-05-07 | 2007-02-28 | Health Discovery Corp | Kernels and methods for selecting kernels for use in learning machines |
| US20070118487A1 (en) * | 2005-11-18 | 2007-05-24 | Caterpillar Inc. | Product cost modeling method and system |
| US9015083B1 (en) * | 2012-03-23 | 2015-04-21 | Google Inc. | Distribution of parameter calculation for iterative optimization methods |
| US20130346150A1 (en) * | 2012-06-21 | 2013-12-26 | Data Ventures, Inc. | System, method, and computer program product for forecasting sales |
| US20150025918A1 (en) * | 2013-07-16 | 2015-01-22 | Broker Genius LLC | Forecasting and management system and method concerning ticket transactions in multiple markets |
| US9741081B2 (en) * | 2014-12-23 | 2017-08-22 | Invent.ly LLC | Perturbing a subject's contextualization of a proposition about an item considered in a quantum representation by altering the item |
| US11093982B1 (en) * | 2014-10-02 | 2021-08-17 | Zillow, Inc. | Determine regional rate of return on home improvements |
-
2016
- 2016-12-14 JP JP2018508386A patent/JP7006585B2/en active Active
- 2016-12-14 WO PCT/JP2016/087186 patent/WO2017168865A1/en active Application Filing
- 2016-12-14 EP EP16897081.2A patent/EP3438887A4/en not_active Ceased
- 2016-12-14 US US16/068,721 patent/US20190026630A1/en not_active Abandoned
Patent Citations (6)
| Publication number | Priority date | Publication date | Assignee | Title |
|---|---|---|---|---|
| JPH0535707A (en) * | 1991-07-25 | 1993-02-12 | Hitachi Ltd | Pattern sorting method/device using neural network |
| JPH0561849A (en) * | 1991-08-29 | 1993-03-12 | Toyoda Mach Works Ltd | Input/output characteristic detection device for neutral network |
| JPH05225163A (en) * | 1992-02-13 | 1993-09-03 | Hitachi Ltd | Neural network system and learning method for neural network |
| JPH11282823A (en) * | 1998-03-31 | 1999-10-15 | Ricchi Hyoka Kenkyusho:Kk | Land evaluation system and method, and medium storing land evaluation program |
| JP2001344590A (en) * | 2000-05-31 | 2001-12-14 | Fuji Electric Co Ltd | Neural network and method for learning the same and method for analyzing the same and method for judging abnormality |
| JP2007094631A (en) * | 2005-09-28 | 2007-04-12 | Hitachi Electronics Service Co Ltd | Application operation monitoring system, client application operation monitoring service providing system, and method, and client application operation monitoring service providing method |
Non-Patent Citations (1)
| Title |
|---|
| See also references of EP3438887A4 * |
Cited By (13)
| Publication number | Priority date | Publication date | Assignee | Title |
|---|---|---|---|---|
| US11797641B2 (en) | 2015-02-03 | 2023-10-24 | 1Qb Information Technologies Inc. | Method and system for solving the lagrangian dual of a constrained binary quadratic programming problem using a quantum annealer |
| JP2021504836A (en) * | 2017-12-01 | 2021-02-15 | 1キュービー インフォメーション テクノロジーズ インコーポレイテッド1Qb Information Technologies Inc. | Systems and methods for stochastic optimization of robust estimation problems |
| JP7288905B2 (en) | 2017-12-01 | 2023-06-08 | 1キュービー インフォメーション テクノロジーズ インコーポレイテッド | Systems and methods for stochastic optimization of robust estimation problems |
| JP7297286B2 (en) | 2019-02-07 | 2023-06-26 | 国立研究開発法人情報通信研究機構 | Optimization method, optimization program, reasoning method, and reasoning program |
| JP2020129209A (en) * | 2019-02-07 | 2020-08-27 | 国立研究開発法人情報通信研究機構 | Optimization method, optimization program, inference method, and inference program |
| JP2020168233A (en) * | 2019-04-04 | 2020-10-15 | 株式会社日立製作所 | Ultrasonic imaging device, and image processor |
| JP7269778B2 (en) | 2019-04-04 | 2023-05-09 | 富士フイルムヘルスケア株式会社 | Ultrasonic imaging device and image processing device |
| JP7439470B2 (en) | 2019-04-11 | 2024-02-28 | 富士電機株式会社 | Information processing device, information processing method, and program |
| US11947506B2 (en) | 2019-06-19 | 2024-04-02 | 1Qb Information Technologies, Inc. | Method and system for mapping a dataset from a Hilbert space of a given dimension to a Hilbert space of a different dimension |
| US11494659B2 (en) | 2019-06-26 | 2022-11-08 | Kioxia Corporation | Information processing method and information processing apparatus |
| JP7329127B2 (en) | 2019-07-08 | 2023-08-17 | ヴィアナイ システムズ, インコーポレイテッド | A technique for visualizing the behavior of neural networks |
| JP2022035010A (en) * | 2020-08-20 | 2022-03-04 | 株式会社医療情報技術研究所 | Classification system |
| WO2022249927A1 (en) | 2021-05-28 | 2022-12-01 | 株式会社医療情報技術研究所 | Classification system |
Also Published As
| Publication number | Publication date |
|---|---|
| JPWO2017168865A1 (en) | 2019-02-07 |
| EP3438887A4 (en) | 2019-03-27 |
| EP3438887A1 (en) | 2019-02-06 |
| JP7006585B2 (en) | 2022-01-24 |
| US20190026630A1 (en) | 2019-01-24 |
Similar Documents
| Publication | Publication Date | Title |
|---|---|---|
| WO2017168865A1 (en) | Information processing device and information processing method | |
| Yeh et al. | A machine learning approach to predict the success of crowdfunding fintech project | |
| CN112966712B (en) | Language model training method and device, electronic equipment and computer readable medium | |
| Bobadilla et al. | Collaborative filtering adapted to recommender systems of e-learning | |
| AU2013251195B2 (en) | Program, apparatus, and method for information processing | |
| TWI465691B (en) | System,computer-readable,and method for location-to-landmark | |
| JP2012058972A (en) | Evaluation prediction device, evaluation prediction method, and program | |
| JP2023514465A (en) | machine learning platform | |
| CN107710192A (en) | Measurement for the automatic Evaluation of conversational response | |
| JP2011248829A (en) | Evaluation prediction device, evaluation prediction method and program | |
| US20210325343A1 (en) | Information processing apparatus, information processing method, learned model generation method, and program | |
| US20210117792A1 (en) | Methods and apparatus to facilitate continuous learning | |
| EP3432228A1 (en) | Expandability retention device | |
| WO2006120724A1 (en) | Geographic information system using neural networks | |
| JP6093791B2 (en) | POSITIONING DEVICE, POSITIONING METHOD, POSITIONING PROGRAM, AND POSITIONING SYSTEM | |
| JPWO2020065806A1 (en) | Processing equipment, processing methods, and programs | |
| JP2012094056A (en) | User state estimation system, user state estimation method and user state estimation program | |
| CN111368195B (en) | Model training method, device, equipment and storage medium | |
| D’Ignazio et al. | Are We Citizen Scientists, Citizen Sensors or Something Else Entirely?: Popular Sensing and Citizenship for the Internet of Things | |
| CN111898753A (en) | Music transcription model training method, music transcription method and corresponding device | |
| CN115543638B (en) | Uncertainty-based edge calculation data collection and analysis method, system and equipment | |
| WO2020004049A1 (en) | Information processing device, information processing method, and program | |
| JP2023088136A (en) | Learning device, learning method, learning program, and learning system | |
| CN113822435A (en) | User conversion rate prediction method and related equipment | |
| TWI453452B (en) | Mobile device, meteorology counting system, and meteorology counting method |
Legal Events
| Date | Code | Title | Description |
|---|---|---|---|
| ENP | Entry into the national phase |
Ref document number: 2018508386 Country of ref document: JP Kind code of ref document: A |
|
| NENP | Non-entry into the national phase |
Ref country code: DE |
|
| WWE | Wipo information: entry into national phase |
Ref document number: 2016897081 Country of ref document: EP |
|
| ENP | Entry into the national phase |
Ref document number: 2016897081 Country of ref document: EP Effective date: 20181029 |
|
| 121 | Ep: the epo has been informed by wipo that ep was designated in this application |
Ref document number: 16897081 Country of ref document: EP Kind code of ref document: A1 |