WO2017138314A1 - Displacement measurement device, displacement measurement method, and program for same - Google Patents
Displacement measurement device, displacement measurement method, and program for same Download PDFInfo
- Publication number
- WO2017138314A1 WO2017138314A1 PCT/JP2017/001503 JP2017001503W WO2017138314A1 WO 2017138314 A1 WO2017138314 A1 WO 2017138314A1 JP 2017001503 W JP2017001503 W JP 2017001503W WO 2017138314 A1 WO2017138314 A1 WO 2017138314A1
- Authority
- WO
- WIPO (PCT)
- Prior art keywords
- pitch
- displacement
- phase
- displacement amount
- pattern
- Prior art date
Links
Images


Classifications
-
- G—PHYSICS
- G01—MEASURING; TESTING
- G01B—MEASURING LENGTH, THICKNESS OR SIMILAR LINEAR DIMENSIONS; MEASURING ANGLES; MEASURING AREAS; MEASURING IRREGULARITIES OF SURFACES OR CONTOURS
- G01B11/00—Measuring arrangements characterised by the use of optical techniques
- G01B11/16—Measuring arrangements characterised by the use of optical techniques for measuring the deformation in a solid, e.g. optical strain gauge
- G01B11/165—Measuring arrangements characterised by the use of optical techniques for measuring the deformation in a solid, e.g. optical strain gauge by means of a grating deformed by the object
-
- G—PHYSICS
- G01—MEASURING; TESTING
- G01M—TESTING STATIC OR DYNAMIC BALANCE OF MACHINES OR STRUCTURES; TESTING OF STRUCTURES OR APPARATUS, NOT OTHERWISE PROVIDED FOR
- G01M5/00—Investigating the elasticity of structures, e.g. deflection of bridges or air-craft wings
- G01M5/0008—Investigating the elasticity of structures, e.g. deflection of bridges or air-craft wings of bridges
-
- G—PHYSICS
- G01—MEASURING; TESTING
- G01M—TESTING STATIC OR DYNAMIC BALANCE OF MACHINES OR STRUCTURES; TESTING OF STRUCTURES OR APPARATUS, NOT OTHERWISE PROVIDED FOR
- G01M5/00—Investigating the elasticity of structures, e.g. deflection of bridges or air-craft wings
- G01M5/0091—Investigating the elasticity of structures, e.g. deflection of bridges or air-craft wings by using electromagnetic excitation or detection
Definitions
- the present invention relates to a displacement measuring device, a displacement measuring method, and a program thereof.
- This application claims priority based on Japanese Patent Application No. 2016-024187 filed in Japan on February 10, 2016, the contents of which are incorporated herein by reference.
- Embodiments of the present invention provide a measuring apparatus and a measuring method for measuring displacement and vibration of an object from a repeated pattern regularly repeated on the object imaged or recorded by an optical digital camera, a video camera, or other imaging means. And program. Embodiments of the present invention can be used to analyze displacement and vibration of infrastructure structures and other objects such as bridges, tunnels, buildings, and plant piping.
- a displacement meter such as a contact displacement meter, a non-contact laser displacement meter, or an ultrasonic displacement meter may be used.
- highly reliable measurement results can be obtained.
- sufficient time resolution may be obtained.
- only one direction of displacement can be measured at one measurement point in one measurement.
- displacement meters In order to grasp the displacement and vibration of the entire structure, displacement meters must be installed at each of a plurality of measurement points.
- setting of a transmission path such as wiring from a displacement meter for collecting the measurement results becomes complicated. This increases the cost and analysis time. In particular, when the measurement object is a large-scale infrastructure structure, the amount of work and the cost for installing the displacement meter are significant.
- a full-field measurement method using a captured image As a technique for measuring displacement at a plurality of measurement points at a time, a full-field measurement method using a captured image has been proposed.
- the full-field measurement method includes, for example, speckle interferometry using a laser light source (Speckle Interferometry), digital holography method, digital image correlation method using a random pattern (Digital Image Correlation Method), and sampling moire method using a repeating pattern. (Sampling Moire Method).
- speckle interferometry using a laser light source
- digital holography method digital image correlation method using a random pattern
- sampling moire method using a repeating pattern Digital Image Correlation Method
- sampling Moire Method sampling Moire Method
- a plurality of markers Mk11 to Mk15 are installed at observation points on the side surface of the bridge Br1. Then, the displacement amount at each observation point is obtained based on the phase of the moire image generated from each of the markers Mk11 to Mk15 represented in the image captured by the imaging unit 20. Since the imaging unit 20 is installed in a direction perpendicular to the side surface of the bridge Br1, the distance in the depth direction to each marker is constant, so that common conditions are used in the displacement analysis based on each marker.
- an imaging unit that captures an image of the measurement object can be installed.
- the imaging unit may not be installed in a direction perpendicular to the side surface.
- the imaging unit 20 is installed on the riverbank that intersects the bridge axis of the bridge Br5 and the normal direction thereof, and the side surface of the bridge Br5 is imaged.
- the distance from the imaging unit 20 varies depending on the positions of the markers Mk51 to Mk55 installed on the side surface of the bridge Br5.
- the size of the marker represented in the captured image and the spatial period of the repetitive pattern, that is, the pitch are different. Since the analysis conditions for displacement differ depending on the marker, the analysis becomes complicated. In addition, the measurement accuracy is reduced due to the shake generated in the image due to the vibration applied to the imaging unit 20.
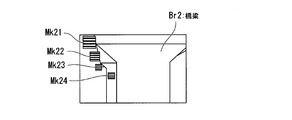
- the imaging unit 20 is installed on the abutment part of the bridge Br2, and an image of a marker representing a repetitive pattern is captured from the bridge axis direction that is the front of the structure, and a sampling moire method or the like is performed on the captured image.
- the plurality of markers Mk21 to Mk24 are installed at positions where distances in the depth direction from the imaging unit 20 are different from each other in the bridge axis direction.
- the influence of the displacement amount related to the displacement of the image pickup unit 20 becomes more remarkable as the distance in the depth direction increases. Become. This also causes a measurement error based on the displacement of the imaging unit 20 for each marker.
- the present invention has been made in view of the above points, and an object of the present invention is to provide a displacement measuring apparatus, a displacement measuring method, and a program thereof that can maintain measurement accuracy regardless of the installation conditions of the imaging unit.
- the present invention has been made to solve the above-described problems, and one aspect of the present invention acquires two or more repeated pattern images in which patterns having a certain pitch are spatially repeated.
- a phase calculation unit that calculates a phase of a moire image obtained by interpolating a thinned image generated by thinning out at a predetermined thinning interval for the repetitive pattern, and the phase at another time point from the phase at a temporary point
- a displacement amount calculation unit that calculates a displacement amount of the repetitive pattern based on a difference between the above, and the displacement amount of one repetitive pattern multiplied by the pitch ratio of the pitch of the other repetitive pattern to the pitch of the one repetitive pattern
- a correction calculation processing unit that subtracts a displacement amount of another repetitive pattern as a correction amount.
- Another aspect of the present invention is the displacement measurement device according to (1), further including a pitch calculation unit that calculates the pitch of the repetitive pattern based on the phase gradient.
- the pitch ratio of the pitch of the other repetitive pattern based on the phase to the pitch of the one repetitive pattern based on the phase is set to the pitch of the other repetitive pattern expressed in the subject.
- the correction amount is calculated by multiplying the displacement amount of the other repetitive pattern by a normalized pitch ratio normalized by the pitch ratio of the pitch to the pitch of the one repetitive pattern represented on the subject (1) or (2 ).
- an image representing two or more repetitive patterns in which a pattern having a certain pitch is spatially repeated is obtained, and a projective transformation unit that performs projective transformation on the image, and the repetitive patterns
- a phase calculation unit that calculates a phase of a moire image obtained by interpolating a thinned image generated by thinning out at a predetermined thinning interval, and based on a difference between the phase at a temporary point and the phase at another time point
- a displacement amount calculating unit that calculates a displacement amount in the repetitive pattern, and a correction operation processing unit that subtracts the displacement amount of another repetitive pattern from the displacement amount in one repetitive pattern.
- Another aspect of the present invention is a displacement measuring method in a displacement measuring apparatus, and an image obtaining step for obtaining images of two or more repeated patterns in which a pattern having a constant pitch is spatially repeated;
- a displacement amount calculating step for calculating a displacement amount of the repetitive pattern based on the difference, and the other of multiplying a pitch ratio of another repetitive pattern to a pitch of the one repetitive pattern from a displacement amount of one repetitive pattern
- an image acquisition procedure for acquiring an image of two or more repeated patterns in which a pattern having a constant pitch is spatially repeated in the computer of the displacement measuring apparatus
- a phase calculation procedure for calculating the phase of a moire image obtained by interpolating a thinned image generated by thinning out at a predetermined thinning interval, based on the difference between the phase at one time point and the phase at another time point
- Displacement amount calculation procedure for calculating the displacement amount of the repeated pattern, the displacement amount of the other repeated pattern multiplied by the pitch ratio of the pitch of the other repeated pattern to the pitch of the one repeated pattern from the displacement amount of the one repeated pattern
- measurement accuracy can be maintained regardless of the installation conditions of the imaging unit.
- FIG. 3 is a diagram illustrating an arrangement example of the measurement object and the imaging unit 20 in the displacement measurement system 1 according to the present embodiment.
- the displacement measurement system 1 measures the displacement of a plurality of measurement points of the bridge Br2 that is a measurement object.
- Markers Mk21 to Mk24 are installed at each measurement point.
- the markers Mk21 to Mk24 each represent a horizontal stripe pattern repeated at a predetermined pitch in the vertical direction.
- the markers Mk21 to Mk24 are all oriented in a direction parallel to the bridge axis direction, the normal direction of which is the longitudinal direction of the bridge Br2.
- the imaging unit 20 is installed on a pier that supports one end of the bridge Br2, and markers Mk21 to Mk24 are represented in the field of view.
- the direction in which the pattern represented by the markers Mk21 to Mk24 is repeated in the captured image is the vertical direction. These patterns are used to measure the amount of displacement in the vertical direction at the measurement points where the markers Mk21 to Mk24 are installed.
- the position of the imaging unit 20 is in a direction inclined downward from the bridge axis direction starting from the center of the bridge Br2. Since the bridge Br2 is provided so as to cross the river Rv, the imaging unit 20 cannot be installed in a direction perpendicular to the side surface of the bridge Br2.
- the captured image captured by the imaging unit 20 includes partial images representing the four markers Mk21 to Mk24.
- the area and the pitch decrease in the order of the markers Mk21, Mk22, Mk24, and Mk23.
- the marker Mk24 is installed at a measurement point lower than the markers Mk21, Mk22, and Mk23 on the side surface of the pier. The vibration due to the traveling of the inspection vehicle Vc on the bridge Br2 is not directly transmitted to this measurement point. Therefore, this measurement point is used as a reference measurement point that is a reference point for displacement.
- FIG. 5 is a block diagram showing a functional configuration of the displacement measurement system 1 according to the present embodiment.
- the displacement measurement system 1 includes a displacement measurement device 10 and an imaging unit 20.
- the imaging unit 20 includes a storage unit that captures an image of the measurement target and stores image data indicating the captured image.
- the imaging unit 20 includes a data interface that outputs image data to the displacement measuring apparatus 10.
- the imaging unit 20 is, for example, a digital video camera that sequentially captures images every predetermined time.
- the imaging unit 20 may be a digital still camera that captures an image at a time point instructed by a user operation.
- the displacement measuring device 10 includes a parameter input unit 11, an arithmetic processing unit 12, and a display unit 13. Various parameters used for calculating the displacement are input to the parameter input unit 11.
- the parameter input unit 11 may include a data interface, or may include an input device such as a mouse, a touch sensor, or a keyboard that inputs various types of information according to user operations. The parameters used for calculating the displacement will be described together with the function of the arithmetic processing unit 12.
- the arithmetic processing unit 12 calculates the displacement amount for each measurement point on the measurement object based on the image data input from the imaging unit 20 by wire or wirelessly.
- the arithmetic processing unit 12 includes, for example, a control device such as a CPU (Central Processing Unit). The control device may realize its function by executing processing instructed by a predetermined control program.
- the calculation processing unit 12 includes a phase calculation unit 121, a displacement calculation unit 122, a pitch calculation unit 123, and a correction calculation processing unit 124.
- the phase calculation unit 121 extracts a partial image having a repetitive pattern provided for each measurement point from the image indicated by the input image data. This partial image corresponds to an image of a portion representing each marker described above.
- the phase calculation unit 121 generates a thinned image by thinning out the luminance value of each pixel having a predetermined resolution forming each partial image at a predetermined thinning interval.
- the phase calculation unit 121 interpolates the generated thinned image and calculates the phase of the moire image having a predetermined resolution.
- the phase calculation unit 121 outputs the calculated phase of the moire image to the displacement amount calculation unit 122 and the pitch calculation unit 123. The calculation of the phase of the moire image will be described later.
- the displacement amount calculation unit 122 calculates the phase difference of the phase of the moire image at a predetermined reference time for each measurement point from the phase of the moire image at that time input from the phase calculation unit 121.
- the displacement amount calculation unit 122 calculates a displacement amount for each measurement point based on the calculated phase difference.
- the displacement amount calculation unit 122 outputs the calculated displacement amount to the correction calculation processing unit 124.
- the pitch calculation unit 123 calculates the pitch of the repetitive pattern for each measurement point based on the phase gradient of the moire image input from the phase calculation unit 121 and the above-described thinning interval.
- the pitch calculation unit 123 outputs the calculated pitch to the correction calculation processing unit 124.
- the correction calculation processing unit 124 calculates a pitch ratio that is a ratio of a pitch of a predetermined reference measurement point to a pitch for each measurement point input from the pitch calculation unit 123, and calculates the calculated pitch ratio from the displacement amount calculation unit 122.
- a correction amount is calculated by multiplying the input displacement amount of the reference measurement point.
- the correction calculation processing unit 124 subtracts the calculated correction amount from the displacement amount for each measurement point input from the displacement amount calculation unit 122 to calculate the corrected displacement amount of the measurement point.
- the correction calculation processing unit 124 outputs the calculated corrected displacement amount to the display unit 13.
- the display unit 13 displays information indicating the displacement amount for each measurement point input from the correction calculation processing unit 124.
- the displacement amount by the display unit 13 may be expressed in any manner.
- the display unit 13 may represent the displacement amount for each measurement point by a numerical value, or may represent the displacement amount by a figure having a length corresponding to the displacement amount at coordinates on the image corresponding to the measurement point. Good.
- the phase calculation unit 121 can use a sampling moire method as a method of calculating the phase of the moire image.
- the sampling moire method includes a displacement distribution analysis method using an arbitrary analysis pitch using a single frequency component and a displacement distribution analysis method using an arbitrary regular pattern using a plurality of frequency components.
- the displacement distribution analysis method using an arbitrary analysis pitch using a single frequency component is equivalent to the conventional sampling moire method, and is regarded as a special case of the displacement distribution analysis method using an arbitrary regular pattern using multiple frequency components. Can do.
- the displacement distribution analysis method using an arbitrary analysis pitch using a single frequency component can be applied to a regular pattern that is repeated at equal intervals in a predetermined direction on the surface of a measurement object.
- a regular pattern for example, a sine wave or a rectangular wave fringe grid in which luminance values are repeated in a horizontal direction or a vertical direction at a constant pitch can be used.
- the pattern represented by the markers Mk21-Mk24 shown in FIGS. 3 and 4 is a striped lattice of rectangular waves.
- the analysis pitch corresponds to a thinning interval when a thinned image is generated.
- an image representing a fringe grid may be referred to as a fringe grid image.
- the displacement distribution analysis method using an arbitrary regular pattern using a plurality of frequency components can be applied to a regular pattern having two or more cycles at regular intervals on the surface of the measurement object in a predetermined direction.
- This regular pattern is used for measuring the amount of displacement in the predetermined direction.
- the regular pattern is not limited to a sine wave or rectangular wave striped lattice, but can be applied to a pattern of any shape, for example, a character, as a pattern repeated every period.
- f (i, j) represents the luminance value at the coordinates (i, j).
- i and j indicate coordinate values in the horizontal and vertical directions, respectively.
- a, b, ⁇ 0 , and ⁇ are the amplitude of the stripe grating, the background luminance, the initial phase of the stripe grating, and the phase of the stripe grating, respectively.
- P is a pitch interval on the image.
- a predetermined thinning interval T is set as a parameter. T is an integer of 2 or more.
- the unit of T is Pixel (number of pixels). T may be equal to or different from P.
- the phase calculation unit 121 generates T thinned images for each of 0 to T ⁇ 1 as the thinning start point k. For each of the T thinned images, the phase calculation unit 121 interpolates the luminance values of the pixels after thinning adjacent to each other, and obtains a moire image having luminance values for each pixel arranged at the same interval as before thinning. Generate.
- a method for generating a thinned image and a method for generating a moire image for example, a method described in Japanese Patent No. 4817033 can be used.
- the brightness value f M (i, j; k) of the generated moire image is expressed by Expression (2).
- the phase calculation unit 121 performs discrete Fourier transform on each of the M moiré images to obtain a phase distribution ⁇ M (i, j; ⁇ ) and an amplitude distribution aM (i, j; ⁇ ) at a component of an arbitrary frequency ⁇ . calculate.
- the phase distribution ⁇ M (i, j; ⁇ ) is expressed by Expression (3).
- the phase calculation unit 121 performs the same processing on image data captured at other times, so that the phase distribution ⁇ M (i, j; ⁇ ) and the amplitude distribution a M (i, j; ⁇ ) of the moire image are obtained. Is calculated.
- the displacement amount calculation unit 122 has a phase difference ⁇ M (i, i, j) that is a difference between the phase distribution ⁇ ′ M (i, j; ⁇ ) at a certain time and the phase distribution ⁇ M (i, j; ⁇ ) at a predetermined reference time. j; ⁇ ) is calculated. Then, the displacement amount calculation unit 122 calculates the displacement distribution ⁇ x (i, j; ⁇ ) based on the phase difference ⁇ M (i, j; ⁇ ) and the pattern pitch p as shown in Expression (5).
- p represents the actual length of the pitch of the pattern represented on the measurement object.
- the unit of p is mm, m or the like.
- the displacement amount calculation unit 122 is set in advance as a part of parameters used for calculating the displacement.
- the pitch interval P described above is a parameter different from p in that it is the pitch of the pattern on the image (unit: number of pixels).
- the displacement amount calculation unit 122 multiplies the obtained displacement distribution ⁇ x (i, j; ⁇ ) by the amplitude distribution a M (i, j; ⁇ ) or a weighting factor proportional to the power.
- the values are synthesized between the frequencies, and a displacement distribution ⁇ x (i, j) averaged between the frequencies is calculated.
- g (i, j) represents the luminance value at the coordinates (i, j).
- w, a w , ⁇ w, 0 are the order of the frequency component, the amplitude of the w-order frequency component, and the initial phase of the w-order frequency component, respectively.
- w is an integer of 1 or more and W or less.
- W represents the maximum order of the frequency component. W may be smaller than P / 2 by the sampling theorem and may be an integer of 2 or more.
- P indicates the pitch (unit: number of pixels) of the regular pattern represented in the image.
- a maximum order W is set in the phase calculation unit 121 in advance.
- the phase calculation unit 121 generates a thinned image by thinning the acquired regular pattern image in the horizontal direction at a thinning interval T.
- the phase calculation unit 121 generates T thinned images for each of 0 to T ⁇ 1 as the thinning start point k.
- the phase calculation unit 121 interpolates the luminance values of the pixels after thinning adjacent to each other for each of the M thinned images, and the phase having the luminance value for each pixel arranged at the same interval as before the thinning is shifted.
- Generated moire image The luminance value g M (i, j; m) of each moire image is expressed by Expression (7).
- Equation (7) indicates that the moire image is represented by the Fourier series of each frequency component from the lower order to the higher order.
- Generating a moire image from the original image is a kind of enlargement phenomenon with respect to the pattern represented by the original image.
- a component having a low spatial frequency in the moiré image appears mainly as a regular pattern component.
- a component having a high frequency component appears mainly as a component having an irregular pattern.
- the frequency component g w, M (i, j; m) of the luminance value g M (i, j; m) of each order is expressed by Expression (8). Accordingly, frequency components g w, M (i, j; m) of W luminance values are calculated.
- the phase calculation unit 121 performs a discrete Fourier transform on each of the M moire images to calculate a phase distribution ⁇ M (i, j; ⁇ ) at a component of an arbitrary frequency ⁇ .
- the phase calculation unit 121 substitutes the frequency components g w, M (i, j; m) of the luminance values of the respective orders instead of the luminance values f M (i, j; m) represented by the equation (2).
- the phase distribution ⁇ w, M (i, j; w, ⁇ ) of each order is calculated.
- Phase distribution phi w, M at a certain time (i, j; w, ⁇ ) phase distribution phi 'M and at the reference time (i, j; w, ⁇ ) is the displacement calculating unit 122, displacement distribution [Delta] x (i , J; w, ⁇ ).
- the displacement amount calculation unit 122 adds an amplitude distribution a M (i, j; w, ⁇ ) for each order and frequency to the calculated displacement distribution ⁇ x (i, j; w, ⁇ ) or a weighting factor proportional to the power.
- the multiplication values obtained by multiplication may be combined between the order and the frequency, and the displacement distribution ⁇ x (i, j) averaged between the order and the frequency may be calculated.
- the displacement amount calculation unit 122 sets the average value of the displacement at the representative point (for example, the center point) of each marker or the displacement in each marker in the calculated displacement distribution ⁇ x (i, j). The amount of displacement at the measured measurement point may be determined.
- processing in the horizontal direction is taken as an example.
- the phase calculation unit 121 and the displacement amount calculation unit 122 may perform vertical processing by applying the horizontal processing described above to the vertical direction. The horizontal processing and the vertical processing may be used in combination.
- the pitch calculation unit 123 calculates the horizontal phase gradient g x ( ⁇ M (i, j; ⁇ )) of the moire image for each frequency component calculated by the phase calculation unit 121 using, for example, Expression (9). To do.
- Equation (9) is obtained by dividing the phase difference in the pixels adjacent in the negative direction from the phase in the pixels adjacent in the positive direction in the horizontal direction by 2 to obtain the horizontal phase gradient g x ( ⁇ M (i, j; ⁇ )) is calculated.
- the pitch calculation unit 123 uses the calculated phase gradient g x ( ⁇ M (i, j; ⁇ )) and the thinning interval T to represent the horizontal pitch distribution P x (i, j; ⁇ ) represented on the measurement object. ) Is calculated using, for example, Equation (10).
- the pitch calculation unit 123 is obtained by multiplying the pitch distribution P x (i, j; ⁇ ) for each frequency by the amplitude distribution a M (i, j; ⁇ ) or a weighting factor proportional to the power.
- the multiplication values are synthesized between the frequencies, and a pitch distribution P x (i, j) averaged between the frequencies is calculated.
- the pitch calculator 123 replaces the phase distribution ⁇ M (i, j; ⁇ ) with the phase distribution ⁇ .
- the pitch distribution P x (i, j; w, ⁇ ) is calculated using M (i, j; w, ⁇ ).
- the pitch calculation unit 123 assigns a weight coefficient proportional to the order and frequency amplitude distribution a M (i, j; w, ⁇ ) or its power to the pitch distribution P x (i, j; w, ⁇ ).
- the multiplication values obtained by multiplication may be combined between the order and the frequency to calculate the pitch distribution P x (i, j) averaged between the order and the frequency.
- the pitch calculation unit 123 calculates the vertical phase gradient g y ( ⁇ M (i, j; ⁇ )) of the moiré image for each frequency component, for example, 11).
- Pitch calculation unit 123 the phase gradient g x ( ⁇ M (i, j; ⁇ )); into Equation (10) the phase gradient g y calculated instead of (omega) phi M (i, j) A pitch interval P y (i, j; ⁇ ) for each frequency is calculated. Then, the pitch calculation unit 123 calculates the pitch distribution P y (i, j) averaged between the frequencies based on the amplitude distribution for each frequency, the pitch interval P y (i, j; ⁇ ) for each frequency.
- the pitch calculation unit 123 applies the processing in the horizontal direction to the processing in the vertical direction, and the order and It is possible to calculate a pitch distribution P y (i, j) averaged between the frequencies.
- the displacement amount calculation part 122 is the pitch in the representative point (for example, center point) of each marker among the calculated pitch distribution Px (i, j), Py (i, j), or the pitch in each marker. May be defined as the pitches P x and P y at the measurement points where the respective markers are installed.
- Correction processing unit 124 calculates a pitch P x, 0 pitch ratio which is the ratio of P x, 0 / P x in a predetermined reference measurement point with respect to the pitch P x at each measurement point.
- the correction calculation processing unit 124 is obtained by multiplying the pitch ratio P x, 0 / P x by the displacement ⁇ x 0 at the reference measurement point from the horizontal displacement ⁇ x at each measurement point, as shown in Expression (12).
- the corrected horizontal displacement ⁇ x ′ is calculated by subtracting the correction amount.
- the correction calculation processing unit 124 can correct the vertical displacement ⁇ y at each measurement point by a similar method. In that case, the correction calculation processing unit 124 subtracts the correction amount obtained by multiplying the pitch ratio P y, 0 / P y by the displacement ⁇ y 0 at the reference measurement point from the vertical displacement ⁇ y, thereby correcting the vertical direction for each correction.
- the displacement ⁇ y ′ is calculated.
- FIG. 6 is a flowchart showing a displacement measurement process according to the present embodiment.
- the imaging unit 20 captures an image of a measurement object in which a marker representing a repetitive pattern repeated at a predetermined pitch is installed at each measurement point, and records image data indicating the captured image. Thereafter, the process proceeds to step S102.
- Step S102 Various parameters used for displacement analysis are input to the parameter input unit 11, and the arithmetic processing unit 12 sets the input parameters. Thereafter, the process proceeds to step S103.
- Step S103 The phase calculation unit 121 generates a thinned image by thinning out the luminance value for each pixel representing the repeated pattern of each marker indicated by the recorded image data at a predetermined thinning interval.
- the phase calculation unit 121 calculates the phase of the moire image obtained by interpolating the generated thinned images.
- the displacement amount calculation unit 122 calculates the displacement amount for each marker based on the phase difference of the phase at a predetermined reference time from the phase at that time.
- the pitch calculation unit 123 calculates the pitch of the repetitive pattern for each marker based on the phase gradient of the moire image and the thinning interval. Thereafter, the process proceeds to step S104.
- Step S104 The correction calculation processing unit 124 subtracts the correction amount obtained by multiplying the displacement amount at the measurement reference point by the ratio of the pitch at the measurement reference point to the pitch at each marker from the displacement amount calculated for each marker. The corrected displacement amount is calculated. Thereafter, the process proceeds to step S105.
- Step S105 The display unit 13 displays the corrected displacement calculated for each marker as a displacement measurement result. Thereafter, the process shown in FIG.
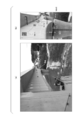
- FIG. 7 is a diagram illustrating an example of a captured image according to the present embodiment.
- the bridge Br3 includes a PRC (Prestressed Reinforced Concrete) box girder bridge and a PRC3 span continuous 2 main version girder bridge.
- PRC Prestressed Reinforced Concrete
- horizontal stripes are represented as a repeated pattern repeated at a predetermined pitch in the vertical direction.
- the principal surfaces of the markers Mk31 to Mk36 are directed in the bridge axis direction.
- the center point of each of the markers Mk31 to Mk36 is used as a measurement point, and the captured image before passing through the water truck shown in FIG. 7 (a) and the two water trucks Vc1 and Vc2 shown in FIG. 7 (b).
- the amount of displacement was measured using the captured image during the passage.
- the imaging unit 20 was installed at a height almost the same as that of the markers Mk31 to Mk36 and closer to the bridge axis than the side surface of the pier so that all of the markers Mk31 to Mk36 appeared.
- FIG. 8 is a diagram illustrating a measurement example of the displacement amount according to the present embodiment.
- FIGS. 8A and 8B show examples of the displacement amount at the measurement point installed at the center of the bridge Br3 measured using the conventional sampling moire method and the displacement measurement method according to the present embodiment, respectively.
- the vertical axis and the horizontal axis indicate the amount of displacement and time.
- FIGS. 8A and 8B show that the displacement amount ⁇ y in the vertical direction increases because the bridge Br3 bends as the water trucks Vc1 and Vc2 pass. In the vicinity of the times 13s and 16s, a peak of the displacement ⁇ y accompanying the passage of the water trucks Vc1 and Vc2 appears.
- FIG. 8A and 8B show examples of the displacement amount at the measurement point installed at the center of the bridge Br3 measured using the conventional sampling moire method and the displacement measurement method according to the present embodiment, respectively.
- the vertical axis and the horizontal axis indicate the amount of displacement and time.
- the displacement amount ⁇ y is suddenly displaced upward after passing through the water truck Vc2. This means that the bridge Br3 is lifted more than before the water truck Vc2 passes.
- the valley of the displacement amount ⁇ y appears in the vicinity of the times 18 s and 21 s, and the displacement amount ⁇ y does not converge to 0 unless it is after the time 22 s.
- Such behavior of the displacement amount ⁇ y is considered to be mainly due to the change (position) of the position and orientation of the imaging unit 20 due to the wind pressure generated immediately after passing through the water sprayer Vc1.
- FIG. 8B there is no sudden change in the displacement amount ⁇ y after passing through the water truck Vc2, and the displacement amount ⁇ y immediately converges to almost zero. This result indicates that the error due to the change in the position and orientation of the imaging unit 20 is eliminated based on the difference in pitch observed depending on the distance from the imaging unit 20.
- FIG. 9 is a diagram showing another measurement example of the displacement amount according to the present embodiment.
- the amount of displacement at the center of the bridge Br3 is shown before and after the passage of one water truck.
- FIGS. 9A and 9B show examples of the amount of displacement at one measurement point measured using a ring displacement meter and the displacement measurement method according to the present embodiment, respectively.
- peak values of 0.8 mm and 0.75 mm are obtained in the vicinity of time 8 s, and the displacement amount converges to almost 0 after time 9 s.
- the displacement measurement method according to the present embodiment is more practical than the ring displacement meter in that the displacement amounts at a plurality of measurement points can be measured at once using the captured image.
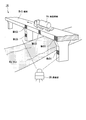
- FIG. 10 is a diagram illustrating an installation example of the imaging unit 20 and each marker according to Example 2 of the present embodiment.
- FIG. 10A shows the arrangement of the imaging unit 20.
- the imaging unit 20 is installed at the top of the abutment.
- the imaging direction of the imaging unit 20 is a direction upward from the horizontal direction, and the direction in plan view of the imaging direction is parallel to the direction of the bridge axis.
- FIG. 10B shows the arrangement of the five markers Mk41 to Mk45 installed on the bridge Br4.
- the markers Mk41 to Mk44 have the same height and are installed at different positions in the direction of the bridge axis.
- the positions of the markers Mk41 to Mk44 are 1/4 point, 1/2 point (center), 3/4 point, and 1 point (other end) from one end of one bridge span.
- the marker Mk45 is installed as a fixed point at the apex of the pier adjacent to the abutment where the imaging unit 20 is installed.
- the height of the marker Mk45 is set at a position lower than the heights of the other markers Mk41 to Mk44.
- the center point of the marker Mk45 is used as a reference measurement point. Since the vibration of the bridge Br4 is not directly transmitted to the pier provided with the marker Mk45, this reference measurement point is used as a fixed point. With this arrangement, all the images representing the markers Mk41 to Mk45 are included in the image captured by the imaging unit 20.
- FIG. 11 shows the displacement amount at the marker Mk42 measured before and after a vehicle passes through the bridge Br4 at the driving speed of 60 km / h in the arrangement shown in FIG.
- the bridge Br4 is a PC (Pressed Concrete) 3 span continuous corrugated steel sheet web box girder bridge.
- the thick line indicates the amount of displacement at the center of the bridge Br4
- the thin line indicates the amount of displacement at the fixed point. Since the vibration of the vehicle is not transmitted to the fixed point, the change in the displacement amount is mainly caused by the change in the position of the imaging unit 20 or the shooting direction due to the vibration generated during the measurement.
- FIG. 11B shows the corrected displacement amount at the center of the bridge Br4 obtained based on the conventional correction method.
- This displacement amount is obtained by simply subtracting the displacement amount indicated by the thin line from the displacement amount indicated by the thick line in FIG.
- the displacement amount is minimized at time 23s, and the displacement amount is maximized at time 27s.
- the amount of displacement at time 23s is minimized mainly due to the rise of the bridge that occurs when the vehicle passes through the adjacent pier span.
- the maximum displacement at time 27s indicates that the deflection becomes the largest when the vehicle passes through the center of the bridge Br4.
- FIG.11 (c) shows the displacement amount after correction
- the correction amount a value obtained by multiplying the displacement amount at the fixed point by the pitch ratio of the pitch at the fixed point to the pitch at the measurement point is used.
- the displacement shown in FIG. 11 (c) converges to almost 0 before time 18s before passing the vehicle and after time 29s after passing.
- the displacement measuring apparatus 10 acquires images of two or more repetitive patterns in which a pattern having a constant pitch is spatially repeated, and the predetermined thinning interval for the repetitive patterns.
- a phase calculation unit 121 that calculates the phase of a moire image obtained by interpolating a thinned image generated by thinning out at.
- the displacement measuring apparatus 10 includes a displacement amount calculation unit 122 that calculates the displacement amount of the repetitive pattern based on the difference between the phase at the temporary point and the phase at another time point.
- the displacement measuring apparatus 10 includes a correction calculation processing unit 124 that subtracts a displacement amount of another repeating pattern obtained by multiplying a displacement amount of one repeating pattern by a ratio of a pitch of another repeating pattern to a pitch of one repeating pattern. Prepare. With this configuration, even when the distance from the imaging unit 20 to each measurement point is different, the amount of displacement at the measurement point where another repeating pattern is installed based on the pitch of the repeating pattern installed at each measurement point As a reference, the displacement amount in which one repeating pattern is installed is corrected.
- the displacement measuring apparatus 10 further includes a pitch calculation unit 123 that calculates the pitch of the repetitive pattern based on the phase gradient of the moire image.
- FIG. 12 is a diagram illustrating an arrangement example of the measurement object and the imaging unit 20 in the displacement measurement system 1A according to the present embodiment.
- the displacement measurement system 1A measures the displacement of a plurality of measurement points of the bridge Br5 that is a measurement object.
- Markers Mk51 to Mk55 are installed at each measurement point. Each marker represents a horizontal stripe pattern that is repeated at a predetermined pitch in the vertical direction.
- the markers Mk51 to Mk53 are all displayed or pasted on the side surface of the bridge Br5.
- the markers Mk54 and Mk55 are displayed or pasted on the side surface of the pier.
- the imaging unit 20 is installed in one of the river banks of the river Rv that crosses the side surface of the bridge Br5 and that the bridge Br5 crosses.
- the captured image captured by the imaging unit 20 includes partial images representing the five markers Mk51 to Mk55.
- the distance from the imaging unit 20 increases in the order of the markers Mk51, Mk54, Mk52, Mk53, and Mk55.
- the side surface of the bridge Br5 is an oblique direction that is not orthogonal to the imaging direction of the imaging unit 20, the vertical widths of the markers Mk51 to Mk55 appearing in the captured image are not constant. In the example shown in FIG. 13, the width increases toward the right. Therefore, the shape of the markers Mk51 to Mk55 shown in the captured image is a trapezoid.
- the markers Mk54 and Mk55 are installed on the side surface of the pier and at measurement points lower than the markers Mk51 to Mk53. Vibrations caused by the traveling of the inspection vehicle Vc on the bridge Br5 are not directly transmitted to the markers Mk54 and Mk55. Therefore, one or both representative points of the markers Mk54 and Mk55 are used as reference measurement points.
- FIG. 14 is a block diagram showing a functional configuration of the displacement measurement system 1A according to the present embodiment.
- the displacement measurement system 1A includes a displacement measurement device 10A and an imaging unit 20.
- the displacement measuring apparatus 10 ⁇ / b> A includes a parameter input unit 11, an arithmetic processing unit 12 ⁇ / b> A, and a display unit 13.
- the arithmetic processing unit 12A calculates the displacement amount for each measurement point on the measurement object based on the image data input from the imaging unit 20 in a wired or wireless manner.
- the arithmetic processing unit 12A includes, for example, a control device such as a CPU (Central Processing Unit). The control device may realize its function by executing processing instructed by a predetermined control program.
- the calculation processing unit 12A includes a phase calculation unit 121, a displacement calculation unit 122, a projective conversion unit 125, an interpolation processing unit 126, and a correction calculation processing unit 127.
- the projective conversion unit 125 performs projective conversion on the image indicated by the image data input from the imaging unit 20.
- the projective conversion unit 125 outputs the converted coordinates obtained by the projective conversion for each predetermined coordinate constituting the image and the converted image data indicating the luminance value for each converted coordinate to the interpolation processing unit 126.
- Each coordinate before conversion is arranged on a two-dimensional plane at a predetermined interval (pixel pitch) in each of the horizontal direction and the vertical direction.
- the projective transformation is a conversion from a coordinate (i, j) of a captured image obtained by viewing from an oblique direction to a corresponding point that is a coordinate (I, J) of the captured image obtained by viewing from the front. Details of the projective transformation will be described later.
- the interpolation processing unit 126 linearly interpolates the luminance value for each coordinate after conversion indicated by the converted image data input from the projection conversion unit 125, and calculates the luminance value for each predetermined coordinate.
- the arrangement of the predetermined coordinates may be the same as the arrangement of the coordinates before conversion.
- a linear interpolation method a known interpolation method such as a bilinear method or a bicubic method can be used. According to the projective transformation, the pixel density is biased, but the luminance value for each pixel that is uniformly distributed can be obtained by interpolation.
- the interpolation processing unit 126 outputs interpolation image data indicating the calculated luminance value of each coordinate to the phase calculation unit 121.
- the phase calculation unit 121 calculates the phase distribution of the moire image based on the image indicated by the interpolation image data instead of the image indicated by the image data input from the imaging unit 20.
- the correction calculation processing unit 127 subtracts the displacement amount ⁇ x 0 at a predetermined measurement reference point from the displacement amount ⁇ x for each measurement point input from the displacement amount calculation unit 122 to obtain the corrected displacement amount ⁇ x ′ of the measurement point. calculate.
- the correction calculation processing unit 127 outputs the calculated displacement amount after correction to the display unit 13. That is, in the present embodiment, the amount of displacement at a predetermined measurement reference point in the correction calculation processing unit 127 is different from that of the first embodiment in that the pitch ratio is not multiplied.
- the displacement measuring apparatus 10A according to the present embodiment may also perform horizontal processing and vertical processing instead of horizontal processing.
- FIG. 15 is a diagram illustrating an example of projective transformation.
- Expression (13) shows the relationship between the coordinates (i, j) before conversion and the coordinates (I, J) of corresponding points given by the projection conversion before performing the projective conversion.
- a 1 , a 2 ,..., A 8 are projective transformation parameters.
- the projective transformation parameters a 1 , a 2 ,..., A 8 can be calculated if there is a relationship between the coordinates (i, j) of four or more points before conversion and the coordinates (I, J) of the corresponding points. Further, as the number of sets of coordinates and corresponding points before conversion increases, a projective transformation matrix capable of realizing more stable and accurate projective transformation can be obtained. Therefore, the projection conversion unit 125 is set with a set of four or more coordinates before conversion and the coordinates of corresponding points corresponding to each as parameters.
- FIG. 15A shows an example of coordinates before conversion.
- the coordinates before conversion are the coordinates of the intersections of the joints respectively surrounded by the ⁇ marks in the captured image.
- the seam is represented by a linear portion where the luminance value rapidly decreases.
- the projective transformation unit 125 can determine the coordinates of the part where the gradient of the luminance values in the directions intersecting each other is greater than the predetermined gradient as the coordinates before conversion of the conversion target.
- the coordinates of 60 intersections in total, 20 in the horizontal direction and 3 in the vertical direction are selected as the coordinates before conversion on the side surface of the bridge Br6.
- 15B shows an example of arrangement of coordinates of corresponding points after conversion.
- Corresponding points after conversion are arranged on each lattice point of an orthogonal lattice composed of straight lines orthogonal to each other.
- the coordinates of each lattice point correspond to the coordinates of corresponding points distributed at equal intervals in the horizontal direction and the vertical direction.
- the shape of an infrastructure structure such as a bridge or building that is a subject is a rectangular solid, or feature points that appear on the surface of the subject are repeated at a constant spatial period. ing. That is, in the general projective transformation, two images before and after the conversion are required, whereas this embodiment is characterized in that the projective transformation is performed using only one image before the transformation. .
- the projective transformation unit 125 uses the set of coordinates before transformation and the coordinates of corresponding points as parameters, thereby using the least squares method as shown in Expression (14), so that the projective transformation parameters a 1 , a 2 ,. 8 is calculated.
- the vector ⁇ a ⁇ is [a 1 , a 2 , a 3 , a 4 , a 5 , a 6 , a 7 , a 8 ] T.
- T indicates transposition of a vector or matrix.
- [A] T [A]) ⁇ 1 is represented by Expression (15).
- [A] T ⁇ X ⁇ is represented by Formula (16).
- ⁇ represents the sum between sets of coordinates (i, j) before conversion and coordinates (I, J) of corresponding points.
- Expressions (14) to (16) are obtained based on Expression (17) obtained by expanding Expression (13).
- the vector ⁇ X ⁇ shown in Expression (18) is obtained by parallelizing [I, J,...] T and I and J, which are the left side of Expression (17), between sets.
- the matrix [A] is obtained by parallelly multiplying the coefficient multiplied by the projective transformation parameter on the right side of Expression (18) as shown in Expression (19).
- the projective transformation unit 125 assigns the calculated projective transformation parameters a 1 -a 8 to Equation (13), and uses the relationship shown in Equation (13) to determine the coordinates (i, j) of each coordinate constituting the image data.
- the coordinates (I, J) after conversion are calculated.
- the image used for calculating the projective transformation parameters a 1 , a 2 ,..., A 8 is taken at a different time from the image to be subject to the projective transformation. If the positional relationship between the imaging unit 20 and the measurement object does not change, the projective transformation unit 125 calculates the projective transformation parameters a 1 , a 2 ,..., A 8 and coordinates (i, j) constituting the image data.
- the projective transformation unit 125 refers to the conversion table and determines the coordinates (I, J) of the corresponding point with reference to the conversion table corresponding to each coordinate (i, j) constituting the image data.
- FIG. 15C illustrates an example of a captured image that is a target of projective transformation.
- FIG. 15D shows an image after conversion obtained by performing projective conversion on the captured image shown in FIG.
- the side surface of the bridge Br6 is represented in an oblique direction intersecting both the horizontal direction and the vertical direction, and the width of the side surface becomes thinner toward the right side.
- the left end is enlarged and the right end is reduced in the image after conversion than the image before conversion.
- the side surface of the bridge Br6 is reduced.
- the longitudinal direction is arranged in the horizontal direction, and the width of the side surface is substantially constant. As a result, the displacement can be measured with high accuracy with the same analysis parameter at each measurement point.
- FIG. 16 is a diagram showing another example of projective transformation.
- FIG. 16A shows another example of a captured image that is a target of projective transformation.
- FIG. 16B shows a converted image obtained by performing projective conversion on the captured image shown in FIG.
- the rail height portion of the bridge Br7 is represented in an oblique direction, and the width becomes thicker toward the right.
- the longitudinal direction of the rail height portion of the bridge Br7 is arranged in the horizontal direction, and the width of the rail height portion is almost constant.
- FIG.16 (c) shows the enlarged view of the right end part of the balustrade part which Fig.16 (a) represents.
- FIG. 16C shows that markers Mk71, Mk72, and the like representing a lattice pattern having regularity with a constant pitch in the horizontal direction and the vertical direction are shown in the field height portion.
- markers Mk71 and Mk72 that are originally rectangular are shown obliquely in the enlarged view.
- FIG.16 (d) shows the enlarged view of the right end part of the railing part which FIG.16 (b) represents.
- the shapes of the markers Mk71 and Mk72 are corrected to rectangles, and the patterns represented by the markers Mk71 and Mk72 are orthogonal lattices.
- an image representing a plurality of measurement points having the same distance in the depth direction from the imaging unit 20 can be obtained by projective transformation.
- the periods of the marker patterns respectively set at the plurality of measurement points shown in the obtained image are equal to each other.
- FIG. 17 is a flowchart showing the displacement measurement process according to the present embodiment.
- the process illustrated in FIG. 17 includes steps S101, S106, S102, S103, and S105.
- the process shown in FIG. 17 the process proceeds to step S106 after step S101.
- the projective conversion unit 125 performs projective conversion on the image indicated by the recorded image data.
- the interpolation processing unit 126 linearly interpolates the luminance value for each coordinate after conversion obtained by projective transformation, and calculates the luminance value for each predetermined coordinate. Then, the process of step S102, S103, and S105 is performed.
- step S103 the phase calculation unit 121 generates a thinned image based on the luminance value for each coordinate obtained by the interpolation processing unit 126. Further, as shown in FIG. 14, the displacement measuring apparatus 10A does not have the pitch calculation unit 123, and thus the process of calculating the pitch of the repeated pattern is omitted in step S103. Further, after the process of step S103, the correction calculation processing unit 127 calculates a corrected displacement amount by subtracting the displacement amount at a predetermined measurement reference point from the displacement amount for each measurement point. Thereafter, the process proceeds to step S105.
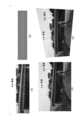
- FIG. 18 is a diagram illustrating a measurement example of a displacement point at each measurement point.
- 11 measurement points are set on the side surface of the bridge Br8. Measurement points are represented by crosses. Each measurement point is provided with a marker representing a lattice pattern. Nine measurement points out of eleven are set at regular intervals in the longitudinal direction of Br9 of the bridge.
- measurement points are set on the side of the abutment and the side of the pier. The measurement point set on the side surface of the abutment is used as a reference measurement point.
- the length of the arrow starting from each measurement point indicates the amount of displacement in the vertical direction.
- FIGS. 18A and 18C are images captured when the vehicle Vc8 passes.
- FIG. 18A shows an image that has not undergone projective transformation and the amount of displacement measured based on the image.
- FIG. 18C shows a converted image obtained by performing the projective transformation and a displacement amount measured based on the image.
- 18 (a) and 18 (c) both show a tendency that the amount of displacement in the central portion is larger than both ends of the bridge Br8. However, the portion with the largest displacement is located closer to the center of the bridge Br8 in FIG. 18C than in FIG. 18A, and closer to the pier in FIG. 18A than in the center. Is biased.
- FIG. 18B and 18D are images captured when the vehicle Vc8 is not passing through.
- FIG. 18B shows an image that has not undergone projective transformation and the amount of displacement measured based on that image.
- FIG. 18D shows a converted image obtained by performing the projective transformation and a displacement amount measured based on the image.
- the displacement amount approximates to 0, but the displacement amount shown in FIG. 18D as a whole measurement point is smaller than the displacement amount in FIG. 18B.
- the amount of displacement at the third measurement point arranged to the left from directly above the pier shown in FIG. 18B is the largest, but the amount of displacement at that measurement point shown in FIG. / 4.
- the measurement result shown in FIG. 18 indicates that the measurement error of the displacement amount due to the difference in pitch depending on the distance from the imaging unit 20 to each measurement point is eliminated.
- the displacement measuring apparatus 10A acquires an image representing two or more repetitive patterns in which a pattern having a certain pitch is spatially repeated, and performs projection conversion on the acquired image.
- a conversion unit 125 is provided.
- the displacement measuring apparatus 10A includes a phase calculation unit 121 that calculates the phase of a moiré image obtained by interpolating a thinned image generated by thinning a repeated pattern at a predetermined thinning interval. Further, the displacement measuring apparatus 10A includes a displacement amount calculation unit 122 that calculates the displacement amount in the repetitive pattern based on the difference between the phase at the temporary point and the phase at another time point.
- the displacement measuring apparatus 10A includes a correction calculation processing unit 127 that subtracts the displacement amount of another repeating pattern from the displacement amount of one repeating pattern.
- the imaging unit 20 it is not necessary to install the imaging unit 20 at a position that can be approximated when the distances to the respective measurement points are equal, in order to measure the displacement amounts of a plurality of measurement points at a high accuracy at a time based on the captured images.
- the restrictions on the installation conditions of the imaging unit 20 are relaxed.
- the displacement is analyzed with a different analysis parameter for each marker installed at each measurement point, but in this embodiment, the displacement can be analyzed with one analysis parameter. Therefore, the analysis time is greatly shortened, and the work related to the setting of analysis parameters is reduced.
- the displacement measurement systems 1 and 1A may be modified and implemented as follows.
- the imaging unit 20 and the displacement measuring devices 10 and 10A may be connected by a wired or wireless network.
- the image data to be processed may be input to the displacement measuring apparatuses 10 and 10A via a device other than the imaging unit 20.
- the displacement measuring devices 10 and 10A may be configured as a single device integrated with the imaging unit 20.
- the displacement measuring devices 10 and 10A do not necessarily have to be integrated with the parameter input unit 11 and the display unit 13. In the displacement measuring devices 10 and 10A, one or both of the parameter input unit 11 and the display unit 13 may be omitted.
- the displacement measuring device 10 may acquire image data acquired by the plurality of imaging units 20 as image data representing partial images representing a plurality of repetitive patterns at each time point.
- image data representing partial images representing a plurality of repetitive patterns at each time point.
- two image capturing units 20 are used, and one image capturing unit 20 captures an image representing the markers Mk21 and Mk22 illustrated in FIG. Images representing the markers Mk23 and Mk24 may be taken as other partial markers.
- the phase calculation unit 121 may calculate the phase of the moire image related to all the markers Mk21 to Mk24 imaged at the same time point.
- the phase calculation unit 121 and the interpolation processing unit 126 have exemplified the case where the luminance value is used as the signal value for each pixel, but is not limited thereto.
- the phase calculation unit 121 and the interpolation processing unit 126 may use a color signal value as a signal value for each pixel, for example, a signal value of each color such as red, green, and blue, or a set of these signal values.
- a color signal value as a signal value for each pixel, for example, a signal value of each color such as red, green, and blue, or a set of these signal values.
- the pitch calculation part 123 calculates the pitch of a repeating pattern based on the phase gradient of a moire image was made into an example, it is not restricted to this.
- the pitch calculation unit 123 calculates the autocorrelation based on the luminance value for each pixel of the moire image and the luminance value for each pixel of the moire image displaced in a predetermined direction, and the amount of displacement that maximizes the autocorrelation. May be defined as a pitch.
- the pitch calculation unit 123 may determine a wavelength corresponding to a spatial frequency at which the power for each spatial frequency obtained by Fourier transforming the luminance value for each pixel of the moiré image between the pixels as a pitch.
- the pitch of the pattern represented by the marker installed at each measurement point is common between the markers, but may be different for each marker.
- the pitch may be larger as the measurement point is farther from the imaging unit 20. In that case, even if the distance from the imaging unit 20 increases, the period of the pattern shown on the image does not become small, so that deterioration in measurement accuracy due to the distance from the imaging unit 20 can be prevented or alleviated.
- the correction processing unit 124 the horizontal displacement [Delta] x at each measurement point, the normalized pitch ratio P x, 0 ⁇ P x displacement [Delta] x 0 at the reference measurement point '/ P x ⁇ P x, 0'
- the corrected horizontal displacement ⁇ x ′ is calculated by subtracting the correction amount obtained by multiplying.
- the normalized pitch ratio is the pitch ratio P x, 0 / P x shown in equation (12), and further at each measurement point on the subject with respect to the pitch P x, 0 ′ of the pattern shown on the reference observation point on the subject. It is calculated by dividing by the ratio P x, 0 '/ P x ' of the pitch P x 'of the represented pattern.
- the displacement amount for each measurement point output from the correction calculation processing units 124 and 127 may be only the displacement amount at that time point based on the image captured at a certain time point, or based on the sequentially imaged images, respectively. It may be a time series consisting of the displacement amount at the time of. The time series of the displacement amount represents vibration at each observation point.
- the arithmetic processing part 12 and the arithmetic processing part 12A may be recorded on a computer-readable recording medium, and the program recorded on the recording medium may be read by the computer system and executed.
- the “computer system” is a computer system built in the displacement measuring apparatuses 10 and 10A and includes hardware such as an OS and peripheral devices.
- the “computer-readable recording medium” refers to a storage device such as a flexible medium, a magneto-optical disk, a portable medium such as a ROM or a CD-ROM, and a hard disk incorporated in a computer system. Furthermore, the “computer-readable recording medium” is a medium that dynamically holds a program for a short time, such as a communication line when transmitting a program via a network such as the Internet or a communication line such as a telephone line, In this case, a volatile memory inside a computer system that serves as a server or a client may be included that holds a program for a certain period of time.
- the program may be a program for realizing a part of the functions described above, and may be a program capable of realizing the functions described above in combination with a program already recorded in a computer system.
- LSI Large Scale Integration
- Each functional block of the displacement measuring apparatus 10 or the displacement measuring apparatus 10A may be individually made into a processor, or a part or all of them may be integrated into a processor.
- the method of circuit integration is not limited to LSI, and may be realized by a dedicated circuit or a general-purpose processor.
- an integrated circuit based on the technology may be used.
Landscapes
- Physics & Mathematics (AREA)
- General Physics & Mathematics (AREA)
- Engineering & Computer Science (AREA)
- Aviation & Aerospace Engineering (AREA)
- Electromagnetism (AREA)
- Length Measuring Devices By Optical Means (AREA)
- Image Analysis (AREA)
Abstract
An image having two or more repeating patterns is acquired in which a pattern having a fixed pitch is spatially repeated, and a phase computation unit calculates the phase of a moire image obtained by interpolating a thinning image generated by thinning the repeating patterns at a prescribed thinning interval. A displacement amount computation unit calculates the displacement amount of the repeating patterns on the basis of the difference between the phase at one point in time and the phase at another point in time. A correction computation processing unit subtracts, from the displacement amount of one repeating pattern, the displacement amount of another repeating pattern as calculated by multiplying by the pitch ratio of the pitch of the other repeating pattern with respect to the pitch of the one repeating pattern, the displacement amount of the other repeating pattern being subtracted as a correction amount.
Description
本発明は、変位測定装置、変位測定方法およびそのプログラムに関する。
本願は、2016年2月10日に、日本に出願された特願2016-024187号に基づき優先権を主張し、その内容をここに援用する。 The present invention relates to a displacement measuring device, a displacement measuring method, and a program thereof.
This application claims priority based on Japanese Patent Application No. 2016-024187 filed in Japan on February 10, 2016, the contents of which are incorporated herein by reference.
本発明の実施形態は、光学デジタルカメラ、ビデオカメラ、その他の撮像手段で撮像もしくは録画された物体上で規則的に繰り返される繰り返し模様から、その物体の変位や振動を測定する測定装置、測定方法およびプログラムに関する。本発明の実施形態は、橋梁、トンネル、ビルディング、プラント配管などのインフラ構造物その他の物体の変位ならびに振動の解析に利用できる。
Embodiments of the present invention provide a measuring apparatus and a measuring method for measuring displacement and vibration of an object from a repeated pattern regularly repeated on the object imaged or recorded by an optical digital camera, a video camera, or other imaging means. And program. Embodiments of the present invention can be used to analyze displacement and vibration of infrastructure structures and other objects such as bridges, tunnels, buildings, and plant piping.
物体の変位を測定するために、接触式変位計、非接触式レーザ変位計、超音波変位計などの変位計が用いられることがある。これらの変位計を用いることで信頼性が高い測定結果を得ることできる。また、十分な時間分解能が得られることもある。しかし、一度の測定において、1つの計測点について、1方向の変位しか測定できない。構造物全体の変位や振動を把握するためには、複数の測定点において、それぞれ変位計を設置しなければならない。また、測定結果を集約するための変位計からの配線などの伝送路の設定が複雑になる。このことは、コストや解析時間を増加させる要因になる。特に、測定対象物が規模の大きいインフラ構造物である場合には、変位計の設置にかかる作業量とそのコストが著しい。
In order to measure the displacement of an object, a displacement meter such as a contact displacement meter, a non-contact laser displacement meter, or an ultrasonic displacement meter may be used. By using these displacement meters, highly reliable measurement results can be obtained. In addition, sufficient time resolution may be obtained. However, only one direction of displacement can be measured at one measurement point in one measurement. In order to grasp the displacement and vibration of the entire structure, displacement meters must be installed at each of a plurality of measurement points. In addition, setting of a transmission path such as wiring from a displacement meter for collecting the measurement results becomes complicated. This increases the cost and analysis time. In particular, when the measurement object is a large-scale infrastructure structure, the amount of work and the cost for installing the displacement meter are significant.
他方、一度に複数の測定点において変位を測定する手法として、撮像された画像を用いる全視野計測法が提案されている。全視野計測法によれば、撮像された画像に表れる物体全体の変位分布情報を取得することができる。全視野計測法には、例えば、レーザ光源を用いるスペックル干渉法(Speckle Interferometry)、デジタルホログラフィ法、ランダムパターンを利用するデジタル画像相関法(Digital Image Correlation Method)、繰り返し模様を利用するサンプリングモアレ法(Sampling Moire Method)がある。昨今では、特許文献1に記載のデジタル画像相関法、特許文献2に記載のサンプリングモアレ法によるインフラ構造物の変位測定が提案されている。例えば、サンプリングモアレ法では、図1に示すように橋梁Br1の側面の観測点に複数のマーカMk11~Mk15を設置しておく。そして、撮像部20が撮像した画像に表されるマーカMk11~Mk15それぞれから生成したモアレ画像の位相に基づいて各観測点での変位量を求める。撮像部20を、橋梁Br1の側面から垂直な方向に設置することで、各マーカまでの奥行方向の距離が一定となるため、各マーカに基づく変位解析において共通の条件が用いられる。
On the other hand, as a technique for measuring displacement at a plurality of measurement points at a time, a full-field measurement method using a captured image has been proposed. According to the full-field measurement method, displacement distribution information of the entire object appearing in the captured image can be acquired. The full-field measurement method includes, for example, speckle interferometry using a laser light source (Speckle Interferometry), digital holography method, digital image correlation method using a random pattern (Digital Image Correlation Method), and sampling moire method using a repeating pattern. (Sampling Moire Method). In recent years, the displacement measurement of an infrastructure structure by the digital image correlation method described in Patent Document 1 and the sampling moire method described in Patent Document 2 has been proposed. For example, in the sampling moire method, as shown in FIG. 1, a plurality of markers Mk11 to Mk15 are installed at observation points on the side surface of the bridge Br1. Then, the displacement amount at each observation point is obtained based on the phase of the moire image generated from each of the markers Mk11 to Mk15 represented in the image captured by the imaging unit 20. Since the imaging unit 20 is installed in a direction perpendicular to the side surface of the bridge Br1, the distance in the depth direction to each marker is constant, so that common conditions are used in the displacement analysis based on each marker.
しかしながら、測定対象物の画像を撮像する撮像部を設置できる位置には制約がある。
例えば、河川、山間部、渓谷などを通過する橋梁などの構造物では、その側面に垂直な方向に撮像部を設置できないことがある。そのような場合には、構造物の側面に対して斜めの方向に撮像部を設置することが考えられる。図12に示す例では、橋梁Br5の橋軸とその法線方向のそれぞれに対して交差する方向である河岸上に撮像部20を設置し、橋梁Br5の側面を撮像する。そのような場合、橋梁Br5の側面に設置されたマーカMk51~Mk55の位置に応じて撮像部20からの距離が異なる。図13に示すように、撮像された画像に表されるマーカの大きさや繰り返し模様の空間周期、つまりピッチが異なる。マーカによって変位の解析条件が異なるので解析が煩雑となる。また、撮像部20に対して与えられる振動に起因する画像に生じたぶれによって測定精度が低下する。図3に示すように、橋梁Br2の橋台部に撮像部20を設置し、構造物の正面である橋軸方向から繰り返し模様を表すマーカの画像を撮像し、撮像画像に対してサンプリングモアレ法などの計測方法を用いて構造物の変位を測定することも考えられる。複数のマーカMk21-Mk24は、それぞれ橋軸方向に向けて撮像部20からの奥行き方向への距離が異なる位置に設置される。図4に示す橋軸方向からの撮像画像では、図2に示す橋梁Br1の側面からの撮像画像とは異なり、撮像部20の変位に係る変位量の影響が奥行き方向への距離が大きいほど著しくなる。このことも、マーカ毎の撮像部20の変位に基づく測定誤差の要因となる。 However, there is a restriction on the position where an imaging unit that captures an image of the measurement object can be installed.
For example, in a structure such as a bridge passing through a river, a mountainous area, a valley, or the like, the imaging unit may not be installed in a direction perpendicular to the side surface. In such a case, it is conceivable to install the imaging unit in a direction oblique to the side surface of the structure. In the example illustrated in FIG. 12, theimaging unit 20 is installed on the riverbank that intersects the bridge axis of the bridge Br5 and the normal direction thereof, and the side surface of the bridge Br5 is imaged. In such a case, the distance from the imaging unit 20 varies depending on the positions of the markers Mk51 to Mk55 installed on the side surface of the bridge Br5. As shown in FIG. 13, the size of the marker represented in the captured image and the spatial period of the repetitive pattern, that is, the pitch are different. Since the analysis conditions for displacement differ depending on the marker, the analysis becomes complicated. In addition, the measurement accuracy is reduced due to the shake generated in the image due to the vibration applied to the imaging unit 20. As shown in FIG. 3, the imaging unit 20 is installed on the abutment part of the bridge Br2, and an image of a marker representing a repetitive pattern is captured from the bridge axis direction that is the front of the structure, and a sampling moire method or the like is performed on the captured image. It is also conceivable to measure the displacement of the structure using the above measurement method. The plurality of markers Mk21 to Mk24 are installed at positions where distances in the depth direction from the imaging unit 20 are different from each other in the bridge axis direction. In the picked-up image from the bridge axis direction shown in FIG. 4, unlike the picked-up image from the side surface of the bridge Br1 shown in FIG. 2, the influence of the displacement amount related to the displacement of the image pickup unit 20 becomes more remarkable as the distance in the depth direction increases. Become. This also causes a measurement error based on the displacement of the imaging unit 20 for each marker.
例えば、河川、山間部、渓谷などを通過する橋梁などの構造物では、その側面に垂直な方向に撮像部を設置できないことがある。そのような場合には、構造物の側面に対して斜めの方向に撮像部を設置することが考えられる。図12に示す例では、橋梁Br5の橋軸とその法線方向のそれぞれに対して交差する方向である河岸上に撮像部20を設置し、橋梁Br5の側面を撮像する。そのような場合、橋梁Br5の側面に設置されたマーカMk51~Mk55の位置に応じて撮像部20からの距離が異なる。図13に示すように、撮像された画像に表されるマーカの大きさや繰り返し模様の空間周期、つまりピッチが異なる。マーカによって変位の解析条件が異なるので解析が煩雑となる。また、撮像部20に対して与えられる振動に起因する画像に生じたぶれによって測定精度が低下する。図3に示すように、橋梁Br2の橋台部に撮像部20を設置し、構造物の正面である橋軸方向から繰り返し模様を表すマーカの画像を撮像し、撮像画像に対してサンプリングモアレ法などの計測方法を用いて構造物の変位を測定することも考えられる。複数のマーカMk21-Mk24は、それぞれ橋軸方向に向けて撮像部20からの奥行き方向への距離が異なる位置に設置される。図4に示す橋軸方向からの撮像画像では、図2に示す橋梁Br1の側面からの撮像画像とは異なり、撮像部20の変位に係る変位量の影響が奥行き方向への距離が大きいほど著しくなる。このことも、マーカ毎の撮像部20の変位に基づく測定誤差の要因となる。 However, there is a restriction on the position where an imaging unit that captures an image of the measurement object can be installed.
For example, in a structure such as a bridge passing through a river, a mountainous area, a valley, or the like, the imaging unit may not be installed in a direction perpendicular to the side surface. In such a case, it is conceivable to install the imaging unit in a direction oblique to the side surface of the structure. In the example illustrated in FIG. 12, the
本発明は上記の点に鑑みてなされたものであり、撮像部の設置条件によらず測定精度を維持することができる変位測定装置、変位測定方法およびそのプログラムを提供することを課題とする。
The present invention has been made in view of the above points, and an object of the present invention is to provide a displacement measuring apparatus, a displacement measuring method, and a program thereof that can maintain measurement accuracy regardless of the installation conditions of the imaging unit.
(1)本発明は上記の課題を解決するためになされたものであり、本発明の一態様は、一定のピッチを有する模様が空間的に繰り返される2つ以上の繰り返し模様の画像を取得し、前記繰り返し模様について、所定の間引き間隔で間引きして生成される間引き画像を補間して得られるモアレ画像の位相を算出する位相演算部と、一時点における前記位相から他の時点における前記位相との差に基づいて前記繰り返し模様の変位量を算出する変位量演算部と、一つの繰り返し模様の変位量から、他の繰り返し模様のピッチの前記一つの繰り返し模様のピッチに対するピッチ比を乗じた前記他の繰り返し模様の変位量を補正量として差し引く補正演算処理部と、を備える変位測定装置である。
(1) The present invention has been made to solve the above-described problems, and one aspect of the present invention acquires two or more repeated pattern images in which patterns having a certain pitch are spatially repeated. A phase calculation unit that calculates a phase of a moire image obtained by interpolating a thinned image generated by thinning out at a predetermined thinning interval for the repetitive pattern, and the phase at another time point from the phase at a temporary point A displacement amount calculation unit that calculates a displacement amount of the repetitive pattern based on a difference between the above, and the displacement amount of one repetitive pattern multiplied by the pitch ratio of the pitch of the other repetitive pattern to the pitch of the one repetitive pattern And a correction calculation processing unit that subtracts a displacement amount of another repetitive pattern as a correction amount.
(2)本発明の他の態様は、前記位相の勾配に基づいて前記繰り返し模様のピッチを算出するピッチ演算部、をさらに備える(1)の変位測定装置である。
(2) Another aspect of the present invention is the displacement measurement device according to (1), further including a pitch calculation unit that calculates the pitch of the repetitive pattern based on the phase gradient.
(3)本発明の他の態様は、前記位相に基づく前記他の繰り返し模様のピッチの前記位相に基づく前記一つの繰り返し模様のピッチに対するピッチ比を、被写体に表された前記他の繰り返し模様のピッチの前記被写体に表された前記一つの繰り返し模様のピッチに対するピッチ比で正規化した正規化ピッチ比を前記他の繰り返し模様の変位量に乗じて前記補正量を算出する(1)または(2)に記載の変位測定装置である。
(3) In another aspect of the present invention, the pitch ratio of the pitch of the other repetitive pattern based on the phase to the pitch of the one repetitive pattern based on the phase is set to the pitch of the other repetitive pattern expressed in the subject. The correction amount is calculated by multiplying the displacement amount of the other repetitive pattern by a normalized pitch ratio normalized by the pitch ratio of the pitch to the pitch of the one repetitive pattern represented on the subject (1) or (2 ).
(4)本発明の他の態様は、一定のピッチを有する模様が空間的に繰り返される2つ以上の繰り返し模様を表す画像を取得し、前記画像を射影変換する射影変換部と、前記繰り返し模様について、所定の間引き間隔で間引きして生成される間引き画像を補間して得られるモアレ画像の位相を算出する位相演算部と、一時点における前記位相から他の時点における前記位相との差に基づいて前記繰り返し模様における変位量を算出する変位量演算部と、一つの繰り返し模様における変位量から、他の繰り返し模様の変位量を差し引く補正演算処理部と、を備える変位測定装置である。
(4) According to another aspect of the present invention, an image representing two or more repetitive patterns in which a pattern having a certain pitch is spatially repeated is obtained, and a projective transformation unit that performs projective transformation on the image, and the repetitive patterns A phase calculation unit that calculates a phase of a moire image obtained by interpolating a thinned image generated by thinning out at a predetermined thinning interval, and based on a difference between the phase at a temporary point and the phase at another time point A displacement amount calculating unit that calculates a displacement amount in the repetitive pattern, and a correction operation processing unit that subtracts the displacement amount of another repetitive pattern from the displacement amount in one repetitive pattern.
(5)本発明の他の態様は、変位測定装置における変位測定方法であって、一定のピッチを有する模様が空間的に繰り返される2つ以上の繰り返し模様の画像を取得する画像取得ステップと、前記繰り返し模様について、所定の間引き間隔で間引きして生成される間引き画像を補間して得られるモアレ画像の位相を算出する位相演算ステップと、一時点における前記位相から他の時点における前記位相との差に基づいて前記繰り返し模様の変位量を算出する変位量演算ステップと、一つの繰り返し模様の変位量から、他の繰り返し模様のピッチの前記一つの繰り返し模様のピッチに対するピッチ比を乗じた前記他の繰り返し模様の変位量を補正量として差し引く補正演算処理ステップと、を有する変位測定方法である。
(5) Another aspect of the present invention is a displacement measuring method in a displacement measuring apparatus, and an image obtaining step for obtaining images of two or more repeated patterns in which a pattern having a constant pitch is spatially repeated; A phase calculation step of calculating a phase of a moire image obtained by interpolating a thinned image generated by thinning out at a predetermined thinning interval for the repetitive pattern, and the phase at another time point from the phase at a temporary point A displacement amount calculating step for calculating a displacement amount of the repetitive pattern based on the difference, and the other of multiplying a pitch ratio of another repetitive pattern to a pitch of the one repetitive pattern from a displacement amount of one repetitive pattern And a correction calculation processing step of subtracting the amount of displacement of the repetitive pattern as a correction amount.
(6)本発明の他の態様は、変位測定装置のコンピュータに、一定のピッチを有する模様が空間的に繰り返される2つ以上の繰り返し模様の画像を取得する画像取得手順、前記繰り返し模様について、所定の間引き間隔で間引きして生成される間引き画像を補間して得られるモアレ画像の位相を算出する位相演算手順、一つの時点における前記位相から他の時点における前記位相との差に基づいて前記繰り返し模様の変位量を算出する変位量演算手順、一つの繰り返し模様の変位量から、他の繰り返し模様のピッチの前記一つの繰り返し模様のピッチに対するピッチ比を乗じた前記他の繰り返し模様の変位量を補正量として差し引く補正演算処理手順、を実行させるためのプログラムである。
(6) According to another aspect of the present invention, an image acquisition procedure for acquiring an image of two or more repeated patterns in which a pattern having a constant pitch is spatially repeated in the computer of the displacement measuring apparatus, A phase calculation procedure for calculating the phase of a moire image obtained by interpolating a thinned image generated by thinning out at a predetermined thinning interval, based on the difference between the phase at one time point and the phase at another time point Displacement amount calculation procedure for calculating the displacement amount of the repeated pattern, the displacement amount of the other repeated pattern multiplied by the pitch ratio of the pitch of the other repeated pattern to the pitch of the one repeated pattern from the displacement amount of the one repeated pattern Is a program for executing a correction calculation processing procedure for subtracting as a correction amount.
本発明によれば、撮像部の設置条件によらず測定精度を維持することができる。
According to the present invention, measurement accuracy can be maintained regardless of the installation conditions of the imaging unit.
(第1の実施形態)
以下、図面を参照しながら本発明の第1の実施形態について説明する。
図3は、本実施形態に係る変位測定システム1における測定対象物と撮像部20の配置例を示す図である。図3に示す例では、変位測定システム1は、測定対象物である橋梁Br2の複数の測定点の変位を測定する。各測定点には、マーカMk21~Mk24が設置される。マーカMk21~Mk24は、それぞれ鉛直方向に所定のピッチで繰り返される横縞の模様を表す。また、マーカMk21~Mk24は、いずれもその法線方向が橋梁Br2の長手方向である橋軸方向に平行な方向に向けられている。撮像部20は、橋梁Br2の一端を支持する橋脚上に設置され、その視野内にマーカMk21~Mk24が表される。撮像される画像においてマーカMk21~Mk24に表される模様が繰り返される方向は垂直方向となる。これらの模様が、マーカMk21~Mk24が設置された測定点における鉛直方向への変位量の測定に用いられる。撮像部20の位置は、橋梁Br2の中央部を起点として橋軸方向よりも下方に傾いた方向にある。橋梁Br2は、河川Rvを横切るように設けられているので、橋梁Br2の側面に垂直な方向に撮像部20を設置できない。 (First embodiment)
Hereinafter, a first embodiment of the present invention will be described with reference to the drawings.
FIG. 3 is a diagram illustrating an arrangement example of the measurement object and theimaging unit 20 in the displacement measurement system 1 according to the present embodiment. In the example illustrated in FIG. 3, the displacement measurement system 1 measures the displacement of a plurality of measurement points of the bridge Br2 that is a measurement object. Markers Mk21 to Mk24 are installed at each measurement point. The markers Mk21 to Mk24 each represent a horizontal stripe pattern repeated at a predetermined pitch in the vertical direction. The markers Mk21 to Mk24 are all oriented in a direction parallel to the bridge axis direction, the normal direction of which is the longitudinal direction of the bridge Br2. The imaging unit 20 is installed on a pier that supports one end of the bridge Br2, and markers Mk21 to Mk24 are represented in the field of view. The direction in which the pattern represented by the markers Mk21 to Mk24 is repeated in the captured image is the vertical direction. These patterns are used to measure the amount of displacement in the vertical direction at the measurement points where the markers Mk21 to Mk24 are installed. The position of the imaging unit 20 is in a direction inclined downward from the bridge axis direction starting from the center of the bridge Br2. Since the bridge Br2 is provided so as to cross the river Rv, the imaging unit 20 cannot be installed in a direction perpendicular to the side surface of the bridge Br2.
以下、図面を参照しながら本発明の第1の実施形態について説明する。
図3は、本実施形態に係る変位測定システム1における測定対象物と撮像部20の配置例を示す図である。図3に示す例では、変位測定システム1は、測定対象物である橋梁Br2の複数の測定点の変位を測定する。各測定点には、マーカMk21~Mk24が設置される。マーカMk21~Mk24は、それぞれ鉛直方向に所定のピッチで繰り返される横縞の模様を表す。また、マーカMk21~Mk24は、いずれもその法線方向が橋梁Br2の長手方向である橋軸方向に平行な方向に向けられている。撮像部20は、橋梁Br2の一端を支持する橋脚上に設置され、その視野内にマーカMk21~Mk24が表される。撮像される画像においてマーカMk21~Mk24に表される模様が繰り返される方向は垂直方向となる。これらの模様が、マーカMk21~Mk24が設置された測定点における鉛直方向への変位量の測定に用いられる。撮像部20の位置は、橋梁Br2の中央部を起点として橋軸方向よりも下方に傾いた方向にある。橋梁Br2は、河川Rvを横切るように設けられているので、橋梁Br2の側面に垂直な方向に撮像部20を設置できない。 (First embodiment)
Hereinafter, a first embodiment of the present invention will be described with reference to the drawings.
FIG. 3 is a diagram illustrating an arrangement example of the measurement object and the
図3に示す配置において撮像部20が撮像した撮像画像には、4つのマーカMk21-Mk24を表す部分画像が含まれる。図4に示すように撮像部20からの距離は、マーカMk21、Mk22、Mk24、Mk23の順に大きくなるため、マーカMk21、Mk22、Mk24、Mk23の順にその領域やピッチが小さくなる。また、マーカMk24は、橋脚の側面においてマーカMk21、Mk22、Mk23よりも低い測定点に設置される。この測定点には、橋梁Br2上における検査車両Vcの走行による振動が直接伝達しない。そのため、この測定点は、変位の基準点である基準測定点として用いられる。
In the arrangement shown in FIG. 3, the captured image captured by the imaging unit 20 includes partial images representing the four markers Mk21 to Mk24. As shown in FIG. 4, since the distance from the imaging unit 20 increases in the order of the markers Mk21, Mk22, Mk24, and Mk23, the area and the pitch decrease in the order of the markers Mk21, Mk22, Mk24, and Mk23. The marker Mk24 is installed at a measurement point lower than the markers Mk21, Mk22, and Mk23 on the side surface of the pier. The vibration due to the traveling of the inspection vehicle Vc on the bridge Br2 is not directly transmitted to this measurement point. Therefore, this measurement point is used as a reference measurement point that is a reference point for displacement.
(変位測定装置)
次に、本実施形態に係る変位測定システム1の構成について説明する。
図5は、本実施形態に係る変位測定システム1の機能構成を示すブロック図である。変位測定システム1は、変位測定装置10と撮像部20を含んで構成される。 (Displacement measuring device)
Next, the configuration of thedisplacement measurement system 1 according to the present embodiment will be described.
FIG. 5 is a block diagram showing a functional configuration of thedisplacement measurement system 1 according to the present embodiment. The displacement measurement system 1 includes a displacement measurement device 10 and an imaging unit 20.
次に、本実施形態に係る変位測定システム1の構成について説明する。
図5は、本実施形態に係る変位測定システム1の機能構成を示すブロック図である。変位測定システム1は、変位測定装置10と撮像部20を含んで構成される。 (Displacement measuring device)
Next, the configuration of the
FIG. 5 is a block diagram showing a functional configuration of the
撮像部20は、測定対象物の画像を撮像し、撮像した画像を示す画像データを記憶する記憶部を備える。撮像部20は、画像データを変位測定装置10に出力するデータインタフェースを備える。撮像部20は、例えば、所定時間毎に画像を順次撮像するデジタルビデオカメラである。撮像部20は、ユーザの操作によって指示された時点の画像を撮像するデジタルスチルカメラであってもよい。
The imaging unit 20 includes a storage unit that captures an image of the measurement target and stores image data indicating the captured image. The imaging unit 20 includes a data interface that outputs image data to the displacement measuring apparatus 10. The imaging unit 20 is, for example, a digital video camera that sequentially captures images every predetermined time. The imaging unit 20 may be a digital still camera that captures an image at a time point instructed by a user operation.
変位測定装置10は、パラメータ入力部11、演算処理部12、および表示部13を含んで構成される。
パラメータ入力部11には、変位の算出に用いられる各種のパラメータが入力される。パラメータ入力部11は、データインタフェースを含んで構成されてもよいし、ユーザの操作に応じて各種の情報を入力するマウス、タッチセンサ、キーボードなどの入力デバイスを含んで構成されてもよい。変位の算出に用いられるパラメータについては、演算処理部12の機能とともに説明する。 Thedisplacement measuring device 10 includes a parameter input unit 11, an arithmetic processing unit 12, and a display unit 13.
Various parameters used for calculating the displacement are input to theparameter input unit 11. The parameter input unit 11 may include a data interface, or may include an input device such as a mouse, a touch sensor, or a keyboard that inputs various types of information according to user operations. The parameters used for calculating the displacement will be described together with the function of the arithmetic processing unit 12.
パラメータ入力部11には、変位の算出に用いられる各種のパラメータが入力される。パラメータ入力部11は、データインタフェースを含んで構成されてもよいし、ユーザの操作に応じて各種の情報を入力するマウス、タッチセンサ、キーボードなどの入力デバイスを含んで構成されてもよい。変位の算出に用いられるパラメータについては、演算処理部12の機能とともに説明する。 The
Various parameters used for calculating the displacement are input to the
演算処理部12は、撮像部20から有線または無線で入力される画像データに基づいて測定対象物上の測定点毎の変位量を算出する。演算処理部12は、例えば、CPU(Central Processing Unit)などの制御デバイスを含んで構成される。制御デバイスは、所定の制御プログラムで指示される処理を実行することによって、その機能を実現してもよい。
演算処理部12は、位相演算部121、変位量演算部122、ピッチ演算部123および補正演算処理部124を含んで構成される。 Thearithmetic processing unit 12 calculates the displacement amount for each measurement point on the measurement object based on the image data input from the imaging unit 20 by wire or wirelessly. The arithmetic processing unit 12 includes, for example, a control device such as a CPU (Central Processing Unit). The control device may realize its function by executing processing instructed by a predetermined control program.
Thecalculation processing unit 12 includes a phase calculation unit 121, a displacement calculation unit 122, a pitch calculation unit 123, and a correction calculation processing unit 124.
演算処理部12は、位相演算部121、変位量演算部122、ピッチ演算部123および補正演算処理部124を含んで構成される。 The
The
位相演算部121は、入力される画像データが示す画像から測定点毎に設けられた繰り返し模様の部分画像を抽出する。この部分画像は、前述の各マーカを表す部分の画像に相当する。位相演算部121は、各部分画像を形成する所定の解像度の画素毎の輝度値を所定の間引き間隔で間引いて間引き画像を生成する。位相演算部121は、生成した間引き画像を補間して所定の解像度のモアレ画像の位相を算出する。位相演算部121は、算出したモアレ画像の位相を変位量演算部122とピッチ演算部123に出力する。モアレ画像の位相の算出については後述する。
The phase calculation unit 121 extracts a partial image having a repetitive pattern provided for each measurement point from the image indicated by the input image data. This partial image corresponds to an image of a portion representing each marker described above. The phase calculation unit 121 generates a thinned image by thinning out the luminance value of each pixel having a predetermined resolution forming each partial image at a predetermined thinning interval. The phase calculation unit 121 interpolates the generated thinned image and calculates the phase of the moire image having a predetermined resolution. The phase calculation unit 121 outputs the calculated phase of the moire image to the displacement amount calculation unit 122 and the pitch calculation unit 123. The calculation of the phase of the moire image will be described later.
変位量演算部122は、位相演算部121から入力されたその時点のモアレ画像の位相から、所定の基準時刻におけるモアレ画像の位相の位相差を測定点毎に算出する。変位量演算部122は、算出した位相差に基づいて測定点毎に変位量を算出する。変位量演算部122は、算出した変位量を補正演算処理部124に出力する。
The displacement amount calculation unit 122 calculates the phase difference of the phase of the moire image at a predetermined reference time for each measurement point from the phase of the moire image at that time input from the phase calculation unit 121. The displacement amount calculation unit 122 calculates a displacement amount for each measurement point based on the calculated phase difference. The displacement amount calculation unit 122 outputs the calculated displacement amount to the correction calculation processing unit 124.
ピッチ演算部123は、位相演算部121から入力されたモアレ画像の位相の勾配と、上述の間引き間隔に基づいて繰り返し模様のピッチを測定点毎に算出する。ピッチ演算部123は、算出したピッチを補正演算処理部124に出力する。
The pitch calculation unit 123 calculates the pitch of the repetitive pattern for each measurement point based on the phase gradient of the moire image input from the phase calculation unit 121 and the above-described thinning interval. The pitch calculation unit 123 outputs the calculated pitch to the correction calculation processing unit 124.
補正演算処理部124は、ピッチ演算部123から入力される測定点毎のピッチに対する、所定の基準測定点のピッチの比であるピッチ比を算出し、算出したピッチ比を変位量演算部122から入力される当該基準測定点の変位量に乗算して補正量を算出する。補正演算処理部124は、変位量演算部122から入力された測定点毎の変位量から、算出した補正量を差し引いて当該測定点の補正後の変位量を算出する。補正演算処理部124は、算出した補正後の変位量を表示部13に出力する。
The correction calculation processing unit 124 calculates a pitch ratio that is a ratio of a pitch of a predetermined reference measurement point to a pitch for each measurement point input from the pitch calculation unit 123, and calculates the calculated pitch ratio from the displacement amount calculation unit 122. A correction amount is calculated by multiplying the input displacement amount of the reference measurement point. The correction calculation processing unit 124 subtracts the calculated correction amount from the displacement amount for each measurement point input from the displacement amount calculation unit 122 to calculate the corrected displacement amount of the measurement point. The correction calculation processing unit 124 outputs the calculated corrected displacement amount to the display unit 13.
表示部13は、補正演算処理部124から入力される測定点毎の変位量を表す情報を表示する。表示部13による変位量は、いかなる態様で表現されてもよい。表示部13は、例えば、測定点毎の変位量を数値で表してもよいし、測定点に対応する画像上の座標に、変位量に相当する長さを有する図形で変位量を表してもよい。
The display unit 13 displays information indicating the displacement amount for each measurement point input from the correction calculation processing unit 124. The displacement amount by the display unit 13 may be expressed in any manner. For example, the display unit 13 may represent the displacement amount for each measurement point by a numerical value, or may represent the displacement amount by a figure having a length corresponding to the displacement amount at coordinates on the image corresponding to the measurement point. Good.
(モアレ画像の位相の算出)
次に、モアレ画像の位相の算出方法の例について説明する。
位相演算部121は、モアレ画像の位相を算出する手法としてサンプリングモアレ法を用いることができる。サンプリングモアレ法には、単一周波数成分を用いた任意の解析ピッチによる変位分布解析方法と、複数周波数成分を用いた任意の規則性模様による変位分布解析方法とがある。単一周波数成分を用いた任意の解析ピッチによる変位分布解析方法は、従来のサンプリングモアレ法に相当し、複数周波数成分を用いた任意の規則性模様による変位分布解析方法の特殊なケースとみなすことができる。単一周波数成分を用いた任意の解析ピッチによる変位分布解析方法は、測定対象物の表面に所定の方向に等間隔で繰り返される規則性模様に適用可能である。規則性模様として、例えば、輝度値が一定のピッチで水平方向または垂直方向に繰り返される正弦波または矩形波の縞格子が利用可能である。図3、4に示すマーカMk21-Mk24に表される模様は矩形波の縞格子である。解析ピッチは、間引き画像を生成する際の間引き間隔に相当する。以下の説明では、縞格子を表す画像を縞格子画像と呼ぶことがある。複数周波数成分を用いた任意の規則性模様による変位分布解析方法は、測定対象物の表面に所定の方向に、等間隔で2周期以上の繰り返しを有する規則性模様に適用可能である。この規則性模様は、その所定の方向への変位量の測定に用いられる。規則性模様として、正弦波または矩形波の縞格子に限らず、周期毎に繰り返される模様として任意の形状の模様、例えば、文字であっても適用可能である。 (Calculation of phase of moire image)
Next, an example of a method for calculating the phase of a moire image will be described.
Thephase calculation unit 121 can use a sampling moire method as a method of calculating the phase of the moire image. The sampling moire method includes a displacement distribution analysis method using an arbitrary analysis pitch using a single frequency component and a displacement distribution analysis method using an arbitrary regular pattern using a plurality of frequency components. The displacement distribution analysis method using an arbitrary analysis pitch using a single frequency component is equivalent to the conventional sampling moire method, and is regarded as a special case of the displacement distribution analysis method using an arbitrary regular pattern using multiple frequency components. Can do. The displacement distribution analysis method using an arbitrary analysis pitch using a single frequency component can be applied to a regular pattern that is repeated at equal intervals in a predetermined direction on the surface of a measurement object. As the regular pattern, for example, a sine wave or a rectangular wave fringe grid in which luminance values are repeated in a horizontal direction or a vertical direction at a constant pitch can be used. The pattern represented by the markers Mk21-Mk24 shown in FIGS. 3 and 4 is a striped lattice of rectangular waves. The analysis pitch corresponds to a thinning interval when a thinned image is generated. In the following description, an image representing a fringe grid may be referred to as a fringe grid image. The displacement distribution analysis method using an arbitrary regular pattern using a plurality of frequency components can be applied to a regular pattern having two or more cycles at regular intervals on the surface of the measurement object in a predetermined direction. This regular pattern is used for measuring the amount of displacement in the predetermined direction. The regular pattern is not limited to a sine wave or rectangular wave striped lattice, but can be applied to a pattern of any shape, for example, a character, as a pattern repeated every period.
次に、モアレ画像の位相の算出方法の例について説明する。
位相演算部121は、モアレ画像の位相を算出する手法としてサンプリングモアレ法を用いることができる。サンプリングモアレ法には、単一周波数成分を用いた任意の解析ピッチによる変位分布解析方法と、複数周波数成分を用いた任意の規則性模様による変位分布解析方法とがある。単一周波数成分を用いた任意の解析ピッチによる変位分布解析方法は、従来のサンプリングモアレ法に相当し、複数周波数成分を用いた任意の規則性模様による変位分布解析方法の特殊なケースとみなすことができる。単一周波数成分を用いた任意の解析ピッチによる変位分布解析方法は、測定対象物の表面に所定の方向に等間隔で繰り返される規則性模様に適用可能である。規則性模様として、例えば、輝度値が一定のピッチで水平方向または垂直方向に繰り返される正弦波または矩形波の縞格子が利用可能である。図3、4に示すマーカMk21-Mk24に表される模様は矩形波の縞格子である。解析ピッチは、間引き画像を生成する際の間引き間隔に相当する。以下の説明では、縞格子を表す画像を縞格子画像と呼ぶことがある。複数周波数成分を用いた任意の規則性模様による変位分布解析方法は、測定対象物の表面に所定の方向に、等間隔で2周期以上の繰り返しを有する規則性模様に適用可能である。この規則性模様は、その所定の方向への変位量の測定に用いられる。規則性模様として、正弦波または矩形波の縞格子に限らず、周期毎に繰り返される模様として任意の形状の模様、例えば、文字であっても適用可能である。 (Calculation of phase of moire image)
Next, an example of a method for calculating the phase of a moire image will be described.
The
次に、単一周波数成分を用いた任意の解析ピッチによる変位分布解析方法について説明する。次に説明する例では、繰り返しの方向が水平方向である場合を例にする。位相演算部121が取得した画像データが示す縞格子画像の輝度分布f(i,j)は、式(1)で表される。
Next, a displacement distribution analysis method using an arbitrary analysis pitch using a single frequency component will be described. In the example described below, a case where the repetition direction is the horizontal direction is taken as an example. The luminance distribution f (i, j) of the fringe grid image indicated by the image data acquired by the phase calculation unit 121 is expressed by Expression (1).

式(1)において、f(i,j)は、座標(i,j)における輝度値を示す。i、jは、それぞれ水平方向、垂直方向の座標値を示す。a、b、φ0、φは、それぞれ縞格子の振幅、背景輝度、縞格子の初期位相、縞格子の位相である。Pは、画像上のピッチ間隔である。
位相演算部121には、パラメータとして所定の間引き間隔Tを設定しておく。Tは、2以上の整数である。Tの単位はPixel(画素数)である。Tは、Pと等しくてもよいし、異なっていてもよい。ここで、位相演算部121は、間引きの開始点kとして0からT-1までのそれぞれについて、T個の間引き画像を生成する。位相演算部121は、T個の間引き画像のそれぞれについて、互いに隣接する間引き後の画素の輝度値を補間して、間引き前と同様の間隔で配置された画素毎の輝度値を有するモアレ画像を生成する。間引き画像を生成する手法、モアレ画像を生成する手法として、例えば、特許4831703号公報に記載の手法が利用可能である。生成されたモアレ画像の輝度値fM(i,j;k)は、式(2)で表される。 In equation (1), f (i, j) represents the luminance value at the coordinates (i, j). i and j indicate coordinate values in the horizontal and vertical directions, respectively. a, b, φ 0 , and φ are the amplitude of the stripe grating, the background luminance, the initial phase of the stripe grating, and the phase of the stripe grating, respectively. P is a pitch interval on the image.
In thephase calculation unit 121, a predetermined thinning interval T is set as a parameter. T is an integer of 2 or more. The unit of T is Pixel (number of pixels). T may be equal to or different from P. Here, the phase calculation unit 121 generates T thinned images for each of 0 to T−1 as the thinning start point k. For each of the T thinned images, the phase calculation unit 121 interpolates the luminance values of the pixels after thinning adjacent to each other, and obtains a moire image having luminance values for each pixel arranged at the same interval as before thinning. Generate. As a method for generating a thinned image and a method for generating a moire image, for example, a method described in Japanese Patent No. 4817033 can be used. The brightness value f M (i, j; k) of the generated moire image is expressed by Expression (2).
位相演算部121には、パラメータとして所定の間引き間隔Tを設定しておく。Tは、2以上の整数である。Tの単位はPixel(画素数)である。Tは、Pと等しくてもよいし、異なっていてもよい。ここで、位相演算部121は、間引きの開始点kとして0からT-1までのそれぞれについて、T個の間引き画像を生成する。位相演算部121は、T個の間引き画像のそれぞれについて、互いに隣接する間引き後の画素の輝度値を補間して、間引き前と同様の間隔で配置された画素毎の輝度値を有するモアレ画像を生成する。間引き画像を生成する手法、モアレ画像を生成する手法として、例えば、特許4831703号公報に記載の手法が利用可能である。生成されたモアレ画像の輝度値fM(i,j;k)は、式(2)で表される。 In equation (1), f (i, j) represents the luminance value at the coordinates (i, j). i and j indicate coordinate values in the horizontal and vertical directions, respectively. a, b, φ 0 , and φ are the amplitude of the stripe grating, the background luminance, the initial phase of the stripe grating, and the phase of the stripe grating, respectively. P is a pitch interval on the image.
In the

位相演算部121は、M個のモアレ画像のそれぞれについて、離散フーリエ変換を行い任意の周波数ωの成分における位相分布φM(i,j;ω)と振幅分布aM(i,j;ω)を算出する。位相分布φM(i,j;ω)は、式(3)で表される。
The phase calculation unit 121 performs discrete Fourier transform on each of the M moiré images to obtain a phase distribution φ M (i, j; ω) and an amplitude distribution aM (i, j; ω) at a component of an arbitrary frequency ω. calculate. The phase distribution φ M (i, j; ω) is expressed by Expression (3).

振幅分布aM(i,j;ω)は、式(4)で表される。
The amplitude distribution a M (i, j; ω) is expressed by Expression (4).

位相演算部121は、他の時刻で撮像された画像データについても同様な処理を行って、モアレ画像の位相分布φM(i,j;ω)と振幅分布aM(i,j;ω)を算出する。
The phase calculation unit 121 performs the same processing on image data captured at other times, so that the phase distribution φ M (i, j; ω) and the amplitude distribution a M (i, j; ω) of the moire image are obtained. Is calculated.
変位量演算部122は、ある時刻における位相分布φ’M(i,j;ω)から所定の基準時刻における位相分布φM(i,j;ω)の差である位相差ΔφM(i,j;ω)を算出する。そして、変位量演算部122は、式(5)に示すように位相差ΔφM(i,j;ω)と模様のピッチpに基づいて変位分布Δx(i,j;ω)を算出する。
The displacement amount calculation unit 122 has a phase difference Δφ M (i, i, j) that is a difference between the phase distribution φ ′ M (i, j; ω) at a certain time and the phase distribution φ M (i, j; ω) at a predetermined reference time. j; ω) is calculated. Then, the displacement amount calculation unit 122 calculates the displacement distribution Δx (i, j; ω) based on the phase difference Δφ M (i, j; ω) and the pattern pitch p as shown in Expression (5).

式(5)において、pは測定対象物に表された模様のピッチの現実の長さを表す。pの単位は、mm、m等である。変位量演算部122には、変位の算出に用いられるパラメータの一部として予め設定しておく。なお、上述のピッチ間隔Pは、画像上における模様のピッチ(単位:画素数)である点でpとは別個のパラメータである。
そして、変位量演算部122は、算出した変位分布Δx(i,j;ω)に振幅分布aM(i,j;ω)もしくは、そのパワーに比例する重み係数を乗算して得られた乗算値を周波数間で合成して、周波数間で平均された変位分布Δx(i,j)を算出する。 In Expression (5), p represents the actual length of the pitch of the pattern represented on the measurement object. The unit of p is mm, m or the like. The displacementamount calculation unit 122 is set in advance as a part of parameters used for calculating the displacement. The pitch interval P described above is a parameter different from p in that it is the pitch of the pattern on the image (unit: number of pixels).
Then, the displacementamount calculation unit 122 multiplies the obtained displacement distribution Δx (i, j; ω) by the amplitude distribution a M (i, j; ω) or a weighting factor proportional to the power. The values are synthesized between the frequencies, and a displacement distribution Δx (i, j) averaged between the frequencies is calculated.
そして、変位量演算部122は、算出した変位分布Δx(i,j;ω)に振幅分布aM(i,j;ω)もしくは、そのパワーに比例する重み係数を乗算して得られた乗算値を周波数間で合成して、周波数間で平均された変位分布Δx(i,j)を算出する。 In Expression (5), p represents the actual length of the pitch of the pattern represented on the measurement object. The unit of p is mm, m or the like. The displacement
Then, the displacement
次に、複数周波数成分を用いた任意の規則性模様による変位分布解析方法について説明する。この変位分布解析方法は、特許文献3において詳しく説明されている。位相演算部121が取得した画像データが示す規則性模様の画像の輝度値g(i,j)は、式(6)で表される。
Next, a displacement distribution analysis method using an arbitrary regular pattern using a plurality of frequency components will be described. This displacement distribution analysis method is described in detail in Patent Document 3. The luminance value g (i, j) of the regular pattern image indicated by the image data acquired by the phase calculation unit 121 is expressed by Expression (6).

式(6)において、g(i,j)は、座標(i,j)における輝度値を示す。w、aw、φw,0は、それぞれ周波数成分の次数、w次の周波数成分の振幅、w次の周波数成分の初期位相である。wは、1以上であってW以下の整数である。Wは、周波数成分の最大次数を示す。Wは、サンプリング定理によりP/2よりも小さく、かつ2以上の整数であればよい。Pは、画像に表された規則性模様のピッチ(単位:画素数)を示す。位相演算部121には、最大次数Wを予め設定しておく。
位相演算部121は、取得した規則性模様の画像を間引き間隔Tで水平方向に対して間引いて間引き画像を生成する。位相演算部121は、間引きの開始点kとして0からT-1までのそれぞれについて、T個の間引き画像を生成する。位相演算部121は、M個の間引き画像のそれぞれについて、互いに隣接する間引き後の画素の輝度値を補間して、間引き前と同様の間隔で配置された画素毎の輝度値を有する位相がシフトしたモアレ画像を生成する。それぞれのモアレ画像の輝度値gM(i,j;m)は、式(7)で表される。 In equation (6), g (i, j) represents the luminance value at the coordinates (i, j). w, a w , φ w, 0 are the order of the frequency component, the amplitude of the w-order frequency component, and the initial phase of the w-order frequency component, respectively. w is an integer of 1 or more and W or less. W represents the maximum order of the frequency component. W may be smaller than P / 2 by the sampling theorem and may be an integer of 2 or more. P indicates the pitch (unit: number of pixels) of the regular pattern represented in the image. A maximum order W is set in thephase calculation unit 121 in advance.
Thephase calculation unit 121 generates a thinned image by thinning the acquired regular pattern image in the horizontal direction at a thinning interval T. The phase calculation unit 121 generates T thinned images for each of 0 to T−1 as the thinning start point k. The phase calculation unit 121 interpolates the luminance values of the pixels after thinning adjacent to each other for each of the M thinned images, and the phase having the luminance value for each pixel arranged at the same interval as before the thinning is shifted. Generated moire image. The luminance value g M (i, j; m) of each moire image is expressed by Expression (7).
位相演算部121は、取得した規則性模様の画像を間引き間隔Tで水平方向に対して間引いて間引き画像を生成する。位相演算部121は、間引きの開始点kとして0からT-1までのそれぞれについて、T個の間引き画像を生成する。位相演算部121は、M個の間引き画像のそれぞれについて、互いに隣接する間引き後の画素の輝度値を補間して、間引き前と同様の間隔で配置された画素毎の輝度値を有する位相がシフトしたモアレ画像を生成する。それぞれのモアレ画像の輝度値gM(i,j;m)は、式(7)で表される。 In equation (6), g (i, j) represents the luminance value at the coordinates (i, j). w, a w , φ w, 0 are the order of the frequency component, the amplitude of the w-order frequency component, and the initial phase of the w-order frequency component, respectively. w is an integer of 1 or more and W or less. W represents the maximum order of the frequency component. W may be smaller than P / 2 by the sampling theorem and may be an integer of 2 or more. P indicates the pitch (unit: number of pixels) of the regular pattern represented in the image. A maximum order W is set in the
The

式(7)は、モアレ画像が低次から高次までの各周波数成分のフーリエ級数で表されることを示す。もとの画像からモアレ画像を生成することは、もとの画像が表す模様に対する一種の拡大現象である。モアレ画像のうち空間周波数が低い成分は、主に規則的な模様成分として表れる。周波数成分が高い成分は、主に不規則な模様の成分として表れる。各次数の輝度値gM(i,j;m)の周波数成分gw,M(i,j;m)は、式(8)で表される。従って、W個の輝度値の周波数成分gw,M(i,j;m)が算出される。
Equation (7) indicates that the moire image is represented by the Fourier series of each frequency component from the lower order to the higher order. Generating a moire image from the original image is a kind of enlargement phenomenon with respect to the pattern represented by the original image. A component having a low spatial frequency in the moiré image appears mainly as a regular pattern component. A component having a high frequency component appears mainly as a component having an irregular pattern. The frequency component g w, M (i, j; m) of the luminance value g M (i, j; m) of each order is expressed by Expression (8). Accordingly, frequency components g w, M (i, j; m) of W luminance values are calculated.

位相演算部121は、M個のモアレ画像のそれぞれについて、離散フーリエ変換を行い任意の周波数ωの成分における位相分布φM(i,j;ω)を算出する。位相演算部121は、式(2)が示す輝度値fM(i,j;m)に代えて、各次数の輝度値の周波数成分gw,M(i,j;m)を代入して各次数の位相分布φw,M(i,j;w,ω)を算出する。ある時刻における位相分布φw,M(i,j;w,ω)と基準時刻における位相分布φ’M(i,j;w,ω)は、変位量演算部122において、変位分布Δx(i,j;w,ω)を算出するために用いられる。変位量演算部122は、算出した変位分布Δx(i,j;w,ω)に次数ならびに周波数毎の振幅分布aM(i,j;w,ω)もしくは、そのパワーに比例する重み係数を乗算して得られた乗算値を次数ならびに周波数間で合成して、次数ならびに周波数間で平均された変位分布Δx(i,j)を算出してもよい。
The phase calculation unit 121 performs a discrete Fourier transform on each of the M moire images to calculate a phase distribution φ M (i, j; ω) at a component of an arbitrary frequency ω. The phase calculation unit 121 substitutes the frequency components g w, M (i, j; m) of the luminance values of the respective orders instead of the luminance values f M (i, j; m) represented by the equation (2). The phase distribution φ w, M (i, j; w, ω) of each order is calculated. Phase distribution phi w, M at a certain time (i, j; w, ω ) phase distribution phi 'M and at the reference time (i, j; w, ω ) is the displacement calculating unit 122, displacement distribution [Delta] x (i , J; w, ω). The displacement amount calculation unit 122 adds an amplitude distribution a M (i, j; w, ω) for each order and frequency to the calculated displacement distribution Δx (i, j; w, ω) or a weighting factor proportional to the power. The multiplication values obtained by multiplication may be combined between the order and the frequency, and the displacement distribution Δx (i, j) averaged between the order and the frequency may be calculated.
従って、複数周波数成分を用いた任意の規則性模様による変位分布解析方法では、基本周波数である一次(w=1)の周波数成分の他、高次の周波数成分を考慮してモアレ画像の位相分布が算出される。そのため、変位の測定において任意の規則性模様を利用することができ、かつ測定誤差が少ない高精度の測定が可能になる。
なお、変位量演算部122は、算出した変位分布Δx(i,j)のうち、各マーカの代表点(例えば、中心点)における変位もしくは各マーカ内の変位の平均値を、各マーカが設置された測定点における変位量として定めてもよい。
また、上記の説明では水平方向の処理を例にしたが、位相演算部121、変位量演算部122は、上述した水平方向の処理を垂直方向に適用した垂直方向の処理を行ってもよいし、水平方向の処理と垂直方向の処理を併用してもよい。 Therefore, in the displacement distribution analysis method using an arbitrary regular pattern using a plurality of frequency components, the phase distribution of the moire image is considered in consideration of the higher-order frequency components in addition to the primary (w = 1) frequency component that is the fundamental frequency. Is calculated. Therefore, an arbitrary regular pattern can be used for measuring the displacement, and high-precision measurement with little measurement error is possible.
In addition, the displacementamount calculation unit 122 sets the average value of the displacement at the representative point (for example, the center point) of each marker or the displacement in each marker in the calculated displacement distribution Δx (i, j). The amount of displacement at the measured measurement point may be determined.
In the above description, processing in the horizontal direction is taken as an example. However, thephase calculation unit 121 and the displacement amount calculation unit 122 may perform vertical processing by applying the horizontal processing described above to the vertical direction. The horizontal processing and the vertical processing may be used in combination.
なお、変位量演算部122は、算出した変位分布Δx(i,j)のうち、各マーカの代表点(例えば、中心点)における変位もしくは各マーカ内の変位の平均値を、各マーカが設置された測定点における変位量として定めてもよい。
また、上記の説明では水平方向の処理を例にしたが、位相演算部121、変位量演算部122は、上述した水平方向の処理を垂直方向に適用した垂直方向の処理を行ってもよいし、水平方向の処理と垂直方向の処理を併用してもよい。 Therefore, in the displacement distribution analysis method using an arbitrary regular pattern using a plurality of frequency components, the phase distribution of the moire image is considered in consideration of the higher-order frequency components in addition to the primary (w = 1) frequency component that is the fundamental frequency. Is calculated. Therefore, an arbitrary regular pattern can be used for measuring the displacement, and high-precision measurement with little measurement error is possible.
In addition, the displacement
In the above description, processing in the horizontal direction is taken as an example. However, the
(ピッチの算出)
次に、ピッチ演算部123がピッチを算出する手法について説明する。
ピッチ演算部123は、位相演算部121が算出した周波数成分毎のモアレ画像の水平方向の位相勾配gx(φM(i,j;ω))を、例えば、式(9)を用いて算出する。 (Pitch calculation)
Next, a method in which thepitch calculation unit 123 calculates the pitch will be described.
Thepitch calculation unit 123 calculates the horizontal phase gradient g x (φ M (i, j; ω)) of the moire image for each frequency component calculated by the phase calculation unit 121 using, for example, Expression (9). To do.
次に、ピッチ演算部123がピッチを算出する手法について説明する。
ピッチ演算部123は、位相演算部121が算出した周波数成分毎のモアレ画像の水平方向の位相勾配gx(φM(i,j;ω))を、例えば、式(9)を用いて算出する。 (Pitch calculation)
Next, a method in which the
The

式(9)は、水平方向の正方向に隣接する画素における位相から負方向に隣接する画素における位相の差を2で除算して、水平方向の位相勾配gx(φM(i,j;ω))を算出することを示す。
ピッチ演算部123は、算出した位相勾配gx(φM(i,j;ω))と間引き間隔Tに基づいて測定対象物に表された水平方向のピッチ分布Px(i,j;ω)を、例えば、式(10)を用いて算出する。 Equation (9) is obtained by dividing the phase difference in the pixels adjacent in the negative direction from the phase in the pixels adjacent in the positive direction in the horizontal direction by 2 to obtain the horizontal phase gradient g x (φ M (i, j; ω)) is calculated.
Thepitch calculation unit 123 uses the calculated phase gradient g x (φ M (i, j; ω)) and the thinning interval T to represent the horizontal pitch distribution P x (i, j; ω) represented on the measurement object. ) Is calculated using, for example, Equation (10).
ピッチ演算部123は、算出した位相勾配gx(φM(i,j;ω))と間引き間隔Tに基づいて測定対象物に表された水平方向のピッチ分布Px(i,j;ω)を、例えば、式(10)を用いて算出する。 Equation (9) is obtained by dividing the phase difference in the pixels adjacent in the negative direction from the phase in the pixels adjacent in the positive direction in the horizontal direction by 2 to obtain the horizontal phase gradient g x (φ M (i, j; ω)) is calculated.
The

そして、ピッチ演算部123は、周波数毎のピッチ分布Px(i,j;ω)に振幅分布aM(i,j;ω)もしくは、そのパワーに比例する重み係数を乗算して得られた乗算値を周波数間で合成して、周波数間で平均されたピッチ分布Px(i,j)を算出する。なお、次数wに依存する位相分布φM(i,j;w,ω)を取得した場合には、ピッチ演算部123は、位相分布φM(i,j;ω)に代えて位相分布φM(i,j;w,ω)を用いてピッチ分布Px(i,j;w,ω)を算出する。そして、ピッチ演算部123は、ピッチ分布Px(i,j;w,ω)に次数ならびに周波数毎の振幅分布aM(i,j;w,ω)もしくは、そのパワーに比例する重み係数を乗算して得られた乗算値を次数ならびに周波数間で合成して、次数ならびに周波数間で平均されたピッチ分布Px(i,j)を算出してもよい。
The pitch calculation unit 123 is obtained by multiplying the pitch distribution P x (i, j; ω) for each frequency by the amplitude distribution a M (i, j; ω) or a weighting factor proportional to the power. The multiplication values are synthesized between the frequencies, and a pitch distribution P x (i, j) averaged between the frequencies is calculated. When the phase distribution φ M (i, j; w, ω) depending on the order w is acquired, the pitch calculator 123 replaces the phase distribution φ M (i, j; ω) with the phase distribution φ. The pitch distribution P x (i, j; w, ω) is calculated using M (i, j; w, ω). Then, the pitch calculation unit 123 assigns a weight coefficient proportional to the order and frequency amplitude distribution a M (i, j; w, ω) or its power to the pitch distribution P x (i, j; w, ω). The multiplication values obtained by multiplication may be combined between the order and the frequency to calculate the pitch distribution P x (i, j) averaged between the order and the frequency.
垂直方向のモアレ画像が生成される場合には、ピッチ演算部123は、周波数成分毎のモアレ画像の垂直方向の位相勾配gy(φM(i,j;ω))を、例えば、式(11)を用いて算出する。
When a moiré image in the vertical direction is generated, the pitch calculation unit 123 calculates the vertical phase gradient g y (φ M (i, j; ω)) of the moiré image for each frequency component, for example, 11).

ピッチ演算部123は、位相勾配gx(φM(i,j;ω))に代えて算出した位相勾配gy(φM(i,j;ω))を式(10)に代入して周波数毎のピッチ間隔Py(i,j;ω)を算出する。そして、ピッチ演算部123は、周波数毎のピッチ間隔Py(i,j;ω)周波数毎の振幅分布に基づいて周波数間で平均されたピッチ分布Py(i,j)を算出する。また、次数wに依存する位相分布φw,M(i,j;w,ω)を取得した場合についても、ピッチ演算部123は、水平方向の処理を垂直方向の処理に適用して次数ならびに周波数間で平均されたピッチ分布Py(i,j)を算出することができる。
なお、変位量演算部122は、算出したピッチ分布Px(i,j)、Py(i,j)のうち、各マーカの代表点(例えば、中心点)におけるピッチもしくは各マーカ内のピッチの平均値を、各マーカが設置された測定点におけるピッチPx、Pyとして定めてもよい。Pitch calculation unit 123, the phase gradient g x (φ M (i, j; ω)); into Equation (10) the phase gradient g y calculated instead of (omega) phi M (i, j) A pitch interval P y (i, j; ω) for each frequency is calculated. Then, the pitch calculation unit 123 calculates the pitch distribution P y (i, j) averaged between the frequencies based on the amplitude distribution for each frequency, the pitch interval P y (i, j; ω) for each frequency. Also, in the case where the phase distribution φ w, M (i, j; w, ω) depending on the order w is acquired, the pitch calculation unit 123 applies the processing in the horizontal direction to the processing in the vertical direction, and the order and It is possible to calculate a pitch distribution P y (i, j) averaged between the frequencies.
In addition, the displacementamount calculation part 122 is the pitch in the representative point (for example, center point) of each marker among the calculated pitch distribution Px (i, j), Py (i, j), or the pitch in each marker. May be defined as the pitches P x and P y at the measurement points where the respective markers are installed.
なお、変位量演算部122は、算出したピッチ分布Px(i,j)、Py(i,j)のうち、各マーカの代表点(例えば、中心点)におけるピッチもしくは各マーカ内のピッチの平均値を、各マーカが設置された測定点におけるピッチPx、Pyとして定めてもよい。
In addition, the displacement
(変位量の補正)
次に、補正演算処理部124が測定点毎のピッチに基づいて、変位量を補正する手法について説明する。補正演算処理部124は、各測定点におけるピッチPxに対する所定の基準測定点におけるピッチPx,0の比であるピッチ比Px,0/Pxを算出する。補正演算処理部124は、式(12)に示すように、各測定点における水平方向の変位Δxから、ピッチ比Px,0/Pxに基準測定点における変位Δx0を乗算して得られる補正量を差し引くことによって補正後の水平方向の変位Δx’を算出する。 (Displacement correction)
Next, a method in which the correctioncalculation processing unit 124 corrects the displacement amount based on the pitch for each measurement point will be described. Correction processing unit 124 calculates a pitch P x, 0 pitch ratio which is the ratio of P x, 0 / P x in a predetermined reference measurement point with respect to the pitch P x at each measurement point. The correction calculation processing unit 124 is obtained by multiplying the pitch ratio P x, 0 / P x by the displacement Δx 0 at the reference measurement point from the horizontal displacement Δx at each measurement point, as shown in Expression (12). The corrected horizontal displacement Δx ′ is calculated by subtracting the correction amount.
次に、補正演算処理部124が測定点毎のピッチに基づいて、変位量を補正する手法について説明する。補正演算処理部124は、各測定点におけるピッチPxに対する所定の基準測定点におけるピッチPx,0の比であるピッチ比Px,0/Pxを算出する。補正演算処理部124は、式(12)に示すように、各測定点における水平方向の変位Δxから、ピッチ比Px,0/Pxに基準測定点における変位Δx0を乗算して得られる補正量を差し引くことによって補正後の水平方向の変位Δx’を算出する。 (Displacement correction)
Next, a method in which the correction

基準測定点における変位Δx0にピッチ比Px,0/Pxを乗じて補正量を算出することにより、撮像部20から各測定点までの距離に応じて異なる画像上での縮尺の差異が補償される。
なお、補正演算処理部124は、各測定点における垂直方向の変位Δyについても、同様な手法によって補正することができる。その場合、補正演算処理部124は、垂直方向の変位Δyからピッチ比Py,0/Pyに基準測定点における変位Δy0を乗算して得られる補正量を差し引いて補正毎の垂直方向の変位Δy’を算出する。 By calculating the correction amount by multiplying the displacement Δx 0 at the reference measurement point by the pitch ratio P x, 0 / P x , the difference in scale on different images according to the distance from theimaging unit 20 to each measurement point can be obtained. Compensated.
The correctioncalculation processing unit 124 can correct the vertical displacement Δy at each measurement point by a similar method. In that case, the correction calculation processing unit 124 subtracts the correction amount obtained by multiplying the pitch ratio P y, 0 / P y by the displacement Δy 0 at the reference measurement point from the vertical displacement Δy, thereby correcting the vertical direction for each correction. The displacement Δy ′ is calculated.
なお、補正演算処理部124は、各測定点における垂直方向の変位Δyについても、同様な手法によって補正することができる。その場合、補正演算処理部124は、垂直方向の変位Δyからピッチ比Py,0/Pyに基準測定点における変位Δy0を乗算して得られる補正量を差し引いて補正毎の垂直方向の変位Δy’を算出する。 By calculating the correction amount by multiplying the displacement Δx 0 at the reference measurement point by the pitch ratio P x, 0 / P x , the difference in scale on different images according to the distance from the
The correction
(変位測定処理)
次に、本実施形態に係る変位測定処理について説明する。図6は、本実施形態に係る変位測定処理を示すフローチャートである。
(ステップS101)撮像部20は、所定のピッチで繰り返される繰り返し模様を表すマーカが測定点毎に設置された測定対象物の画像を撮像し、撮像した画像を示す画像データを記録する。その後、ステップS102に進む。
(ステップS102)パラメータ入力部11には、変位の解析に用いられる各種のパラメータが入力され、演算処理部12は、入力されたパラメータを設定する。その後、ステップS103に進む。 (Displacement measurement process)
Next, the displacement measurement process according to the present embodiment will be described. FIG. 6 is a flowchart showing a displacement measurement process according to the present embodiment.
(Step S101) Theimaging unit 20 captures an image of a measurement object in which a marker representing a repetitive pattern repeated at a predetermined pitch is installed at each measurement point, and records image data indicating the captured image. Thereafter, the process proceeds to step S102.
(Step S102) Various parameters used for displacement analysis are input to theparameter input unit 11, and the arithmetic processing unit 12 sets the input parameters. Thereafter, the process proceeds to step S103.
次に、本実施形態に係る変位測定処理について説明する。図6は、本実施形態に係る変位測定処理を示すフローチャートである。
(ステップS101)撮像部20は、所定のピッチで繰り返される繰り返し模様を表すマーカが測定点毎に設置された測定対象物の画像を撮像し、撮像した画像を示す画像データを記録する。その後、ステップS102に進む。
(ステップS102)パラメータ入力部11には、変位の解析に用いられる各種のパラメータが入力され、演算処理部12は、入力されたパラメータを設定する。その後、ステップS103に進む。 (Displacement measurement process)
Next, the displacement measurement process according to the present embodiment will be described. FIG. 6 is a flowchart showing a displacement measurement process according to the present embodiment.
(Step S101) The
(Step S102) Various parameters used for displacement analysis are input to the
(ステップS103)位相演算部121は、記録した画像データが示す各マーカの繰り返し模様を表す画素毎の輝度値を所定の間引き間隔で間引いて間引き画像を生成する。位相演算部121は、生成した間引き画像をそれぞれ補間して得られるモアレ画像の位相を算出する。変位量演算部122は、その時点における位相から所定の基準時刻における位相の位相差に基づいて、マーカ毎に変位量を算出する。ピッチ演算部123は、モアレ画像の位相勾配と間引き間隔に基づいて繰り返し模様のピッチをマーカ毎に算出する。その後、ステップS104に進む。
(Step S103) The phase calculation unit 121 generates a thinned image by thinning out the luminance value for each pixel representing the repeated pattern of each marker indicated by the recorded image data at a predetermined thinning interval. The phase calculation unit 121 calculates the phase of the moire image obtained by interpolating the generated thinned images. The displacement amount calculation unit 122 calculates the displacement amount for each marker based on the phase difference of the phase at a predetermined reference time from the phase at that time. The pitch calculation unit 123 calculates the pitch of the repetitive pattern for each marker based on the phase gradient of the moire image and the thinning interval. Thereafter, the process proceeds to step S104.
(ステップS104)補正演算処理部124は、各マーカについて算出した変位量から、測定基準点における変位量に各マーカにおけるピッチに対する当該測定基準点におけるピッチの比を乗じて得られる補正量を差し引いて補正後の変位量を算出する。その後、ステップS105に進む。
(ステップS105)表示部13は、各マーカについて算出された補正後の変位量を変位計測結果として表示する。その後、図6に示す処理を終了する。 (Step S104) The correctioncalculation processing unit 124 subtracts the correction amount obtained by multiplying the displacement amount at the measurement reference point by the ratio of the pitch at the measurement reference point to the pitch at each marker from the displacement amount calculated for each marker. The corrected displacement amount is calculated. Thereafter, the process proceeds to step S105.
(Step S105) Thedisplay unit 13 displays the corrected displacement calculated for each marker as a displacement measurement result. Thereafter, the process shown in FIG.
(ステップS105)表示部13は、各マーカについて算出された補正後の変位量を変位計測結果として表示する。その後、図6に示す処理を終了する。 (Step S104) The correction
(Step S105) The
(実施例1)
次に、本実施形態の実施例1として、橋梁の変位量の一測定例について説明する。図7は、本実施例に係る撮像画像の例を示す図である。
図7に示す例では、橋梁Br3の壁高欄に6個のマーカMk31~Mk36を橋軸方向に一定間隔に設置しておく。橋梁Br3は、PRC(Prestressed Reinforced Concrete)箱桁橋とPRC3径間連続2主版桁橋とから構成される。各マーカMk31~Mk36には、いずれも鉛直方向に所定のピッチで繰り返される繰り返し模様として横縞が表されている。各マーカMk31~Mk36の主面は、橋軸方向に向けられている。本実施例では、マーカMk31~Mk36それぞれの中心点を測定点として、図7(a)に示す散水車の通過前の撮像画像と、図7(b)に示す2台の散水車Vc1、Vc2の通過中の撮像画像とを用いて変位量を測定した。撮像部20は、マーカMk31~Mk36の全てが表れるように、マーカMk31~Mk36とほぼ同じ高さであって、橋脚の側面よりも橋軸に近い方向に設置させた。 Example 1
Next, a measurement example of the amount of displacement of the bridge will be described as Example 1 of the present embodiment. FIG. 7 is a diagram illustrating an example of a captured image according to the present embodiment.
In the example shown in FIG. 7, six markers Mk31 to Mk36 are installed at a constant interval in the bridge axis direction on the wall height column of the bridge Br3. The bridge Br3 includes a PRC (Prestressed Reinforced Concrete) box girder bridge and a PRC3 span continuous 2 main version girder bridge. In each of the markers Mk31 to Mk36, horizontal stripes are represented as a repeated pattern repeated at a predetermined pitch in the vertical direction. The principal surfaces of the markers Mk31 to Mk36 are directed in the bridge axis direction. In the present embodiment, the center point of each of the markers Mk31 to Mk36 is used as a measurement point, and the captured image before passing through the water truck shown in FIG. 7 (a) and the two water trucks Vc1 and Vc2 shown in FIG. 7 (b). The amount of displacement was measured using the captured image during the passage. Theimaging unit 20 was installed at a height almost the same as that of the markers Mk31 to Mk36 and closer to the bridge axis than the side surface of the pier so that all of the markers Mk31 to Mk36 appeared.
次に、本実施形態の実施例1として、橋梁の変位量の一測定例について説明する。図7は、本実施例に係る撮像画像の例を示す図である。
図7に示す例では、橋梁Br3の壁高欄に6個のマーカMk31~Mk36を橋軸方向に一定間隔に設置しておく。橋梁Br3は、PRC(Prestressed Reinforced Concrete)箱桁橋とPRC3径間連続2主版桁橋とから構成される。各マーカMk31~Mk36には、いずれも鉛直方向に所定のピッチで繰り返される繰り返し模様として横縞が表されている。各マーカMk31~Mk36の主面は、橋軸方向に向けられている。本実施例では、マーカMk31~Mk36それぞれの中心点を測定点として、図7(a)に示す散水車の通過前の撮像画像と、図7(b)に示す2台の散水車Vc1、Vc2の通過中の撮像画像とを用いて変位量を測定した。撮像部20は、マーカMk31~Mk36の全てが表れるように、マーカMk31~Mk36とほぼ同じ高さであって、橋脚の側面よりも橋軸に近い方向に設置させた。 Example 1
Next, a measurement example of the amount of displacement of the bridge will be described as Example 1 of the present embodiment. FIG. 7 is a diagram illustrating an example of a captured image according to the present embodiment.
In the example shown in FIG. 7, six markers Mk31 to Mk36 are installed at a constant interval in the bridge axis direction on the wall height column of the bridge Br3. The bridge Br3 includes a PRC (Prestressed Reinforced Concrete) box girder bridge and a PRC3 span continuous 2 main version girder bridge. In each of the markers Mk31 to Mk36, horizontal stripes are represented as a repeated pattern repeated at a predetermined pitch in the vertical direction. The principal surfaces of the markers Mk31 to Mk36 are directed in the bridge axis direction. In the present embodiment, the center point of each of the markers Mk31 to Mk36 is used as a measurement point, and the captured image before passing through the water truck shown in FIG. 7 (a) and the two water trucks Vc1 and Vc2 shown in FIG. 7 (b). The amount of displacement was measured using the captured image during the passage. The
図8は、本実施例に係る変位量の測定例を示す図である。図8(a)、(b)はそれぞれ従来のサンプリングモアレ法、本実施形態に係る変位測定方法、を用いて測定された橋梁Br3の中央部に設置した測定点における変位量の例を示す。いずれも、縦軸、横軸は、変位量、時刻を示す。
図8(a)、(b)ともに散水車Vc1、Vc2の通過に伴い、橋梁Br3がたわむために鉛直方向の変位量Δyが大きくなることを表す。時刻13s、16s付近において、散水車Vc1、Vc2の通過に伴う変位量Δyのピークが表れる。但し、図8(a)に示す例では、散水車Vc2の通過後において変位量Δyが急激に上向きに変位する。このことは、散水車Vc2の通過前よりも橋梁Br3が浮き上がることを意味する。変位量Δyの谷は、時刻18s、21s付近に表れ、時刻22s以降にならないと変位量Δyが0に収束しない。このような変位量Δyの挙動は、主に散水車Vc1の通過直後に生じる風の風圧を受けることによって撮像部20の位置や向きが変化すること(ぶれ)が主因と考えられる。これに対し、図8(b)に示す例では、散水車Vc2の通過後における変位量Δyの急激な変化は現れず、変位量Δyは直ちにほぼ0に収束する。この結果は、撮像部20からの距離によって観測されるピッチの差異に基づいて、撮像部20の位置や向きの変化による誤差が解消されることを示す。 FIG. 8 is a diagram illustrating a measurement example of the displacement amount according to the present embodiment. FIGS. 8A and 8B show examples of the displacement amount at the measurement point installed at the center of the bridge Br3 measured using the conventional sampling moire method and the displacement measurement method according to the present embodiment, respectively. In both cases, the vertical axis and the horizontal axis indicate the amount of displacement and time.
FIGS. 8A and 8B show that the displacement amount Δy in the vertical direction increases because the bridge Br3 bends as the water trucks Vc1 and Vc2 pass. In the vicinity of the times 13s and 16s, a peak of the displacement Δy accompanying the passage of the water trucks Vc1 and Vc2 appears. However, in the example shown in FIG. 8A, the displacement amount Δy is suddenly displaced upward after passing through the water truck Vc2. This means that the bridge Br3 is lifted more than before the water truck Vc2 passes. The valley of the displacement amount Δy appears in the vicinity of the times 18 s and 21 s, and the displacement amount Δy does not converge to 0 unless it is after the time 22 s. Such behavior of the displacement amount Δy is considered to be mainly due to the change (position) of the position and orientation of theimaging unit 20 due to the wind pressure generated immediately after passing through the water sprayer Vc1. On the other hand, in the example shown in FIG. 8B, there is no sudden change in the displacement amount Δy after passing through the water truck Vc2, and the displacement amount Δy immediately converges to almost zero. This result indicates that the error due to the change in the position and orientation of the imaging unit 20 is eliminated based on the difference in pitch observed depending on the distance from the imaging unit 20.
図8(a)、(b)ともに散水車Vc1、Vc2の通過に伴い、橋梁Br3がたわむために鉛直方向の変位量Δyが大きくなることを表す。時刻13s、16s付近において、散水車Vc1、Vc2の通過に伴う変位量Δyのピークが表れる。但し、図8(a)に示す例では、散水車Vc2の通過後において変位量Δyが急激に上向きに変位する。このことは、散水車Vc2の通過前よりも橋梁Br3が浮き上がることを意味する。変位量Δyの谷は、時刻18s、21s付近に表れ、時刻22s以降にならないと変位量Δyが0に収束しない。このような変位量Δyの挙動は、主に散水車Vc1の通過直後に生じる風の風圧を受けることによって撮像部20の位置や向きが変化すること(ぶれ)が主因と考えられる。これに対し、図8(b)に示す例では、散水車Vc2の通過後における変位量Δyの急激な変化は現れず、変位量Δyは直ちにほぼ0に収束する。この結果は、撮像部20からの距離によって観測されるピッチの差異に基づいて、撮像部20の位置や向きの変化による誤差が解消されることを示す。 FIG. 8 is a diagram illustrating a measurement example of the displacement amount according to the present embodiment. FIGS. 8A and 8B show examples of the displacement amount at the measurement point installed at the center of the bridge Br3 measured using the conventional sampling moire method and the displacement measurement method according to the present embodiment, respectively. In both cases, the vertical axis and the horizontal axis indicate the amount of displacement and time.
FIGS. 8A and 8B show that the displacement amount Δy in the vertical direction increases because the bridge Br3 bends as the water trucks Vc1 and Vc2 pass. In the vicinity of the times 13s and 16s, a peak of the displacement Δy accompanying the passage of the water trucks Vc1 and Vc2 appears. However, in the example shown in FIG. 8A, the displacement amount Δy is suddenly displaced upward after passing through the water truck Vc2. This means that the bridge Br3 is lifted more than before the water truck Vc2 passes. The valley of the displacement amount Δy appears in the vicinity of the times 18 s and 21 s, and the displacement amount Δy does not converge to 0 unless it is after the time 22 s. Such behavior of the displacement amount Δy is considered to be mainly due to the change (position) of the position and orientation of the
図9は、本実施例に係る変位量の他の測定例を示す図である。図9に示す例では、1台の散水車の通過前後にわたる橋梁Br3の中央部における変位量を示す。図9(a)、(b)は、それぞれリング式変位計、本実施形態に係る変位測定方法、を用いて測定された1つの測定点における変位量の例を示す。いずれも、時刻8s付近においてピーク値として0.8mm、0.75mmが得られ、時刻9s以降において変位量がほぼ0に収束することを示す。この結果は、本実施形態に係る変位測定方法によってもリング式変位計と同等の測定精度が得られることを示す。また、本実施形態に係る変位測定方法では、撮像画像を用いて一度に複数の測定点の変位量を測定することができる点でリング式変位計よりも実用性が向上する。
FIG. 9 is a diagram showing another measurement example of the displacement amount according to the present embodiment. In the example shown in FIG. 9, the amount of displacement at the center of the bridge Br3 is shown before and after the passage of one water truck. FIGS. 9A and 9B show examples of the amount of displacement at one measurement point measured using a ring displacement meter and the displacement measurement method according to the present embodiment, respectively. In both cases, peak values of 0.8 mm and 0.75 mm are obtained in the vicinity of time 8 s, and the displacement amount converges to almost 0 after time 9 s. This result shows that the measurement accuracy equivalent to that of the ring displacement meter can be obtained even by the displacement measuring method according to the present embodiment. Further, the displacement measurement method according to the present embodiment is more practical than the ring displacement meter in that the displacement amounts at a plurality of measurement points can be measured at once using the captured image.
(実施例2)
次に、本実施形態の実施例2として、橋梁の変位量の他の測定例について説明する。
図10は、本実施形態の実施例2に係る撮像部20と各マーカの設置例を示す図である。図10(a)は、撮像部20の配置を示す。撮像部20は橋台の頭頂部に設置される。
また、撮像部20の撮像方向は、水平方向よりも上向きの方向であって、その撮像方向を平面視した方向は橋軸の方向に平行である。図10(b)は、橋梁Br4に設置された5個のマーカMk41~Mk45の配置を示す。マーカMk41~Mk44は、互いに同じ高さであって、橋軸の方向に異なる位置に設置される。マーカMk41~Mk44それぞれの位置は、1つの橋スパンの一端から1/4点、1/2点(中央)、3/4点、1点(他端)である。マーカMk45は、撮像部20が設置された橋台に隣接する橋脚の頂点に固定点として設置されている。マーカMk45の高さは、他のマーカMk41~Mk44の高さよりも低い位置に設置されている。マーカMk45の中心点は、基準測定点として用いられる。マーカMk45が設けられる橋脚には、橋梁Br4の振動が直に伝達しないので、この基準測定点は固定点として用いられる。この配置により、マーカMk41~Mk45を表す画像は、いずれも撮像部20が撮像した画像に含まれる。 (Example 2)
Next, another example of measurement of the displacement amount of the bridge will be described as Example 2 of the present embodiment.
FIG. 10 is a diagram illustrating an installation example of theimaging unit 20 and each marker according to Example 2 of the present embodiment. FIG. 10A shows the arrangement of the imaging unit 20. The imaging unit 20 is installed at the top of the abutment.
In addition, the imaging direction of theimaging unit 20 is a direction upward from the horizontal direction, and the direction in plan view of the imaging direction is parallel to the direction of the bridge axis. FIG. 10B shows the arrangement of the five markers Mk41 to Mk45 installed on the bridge Br4. The markers Mk41 to Mk44 have the same height and are installed at different positions in the direction of the bridge axis. The positions of the markers Mk41 to Mk44 are 1/4 point, 1/2 point (center), 3/4 point, and 1 point (other end) from one end of one bridge span. The marker Mk45 is installed as a fixed point at the apex of the pier adjacent to the abutment where the imaging unit 20 is installed. The height of the marker Mk45 is set at a position lower than the heights of the other markers Mk41 to Mk44. The center point of the marker Mk45 is used as a reference measurement point. Since the vibration of the bridge Br4 is not directly transmitted to the pier provided with the marker Mk45, this reference measurement point is used as a fixed point. With this arrangement, all the images representing the markers Mk41 to Mk45 are included in the image captured by the imaging unit 20.
次に、本実施形態の実施例2として、橋梁の変位量の他の測定例について説明する。
図10は、本実施形態の実施例2に係る撮像部20と各マーカの設置例を示す図である。図10(a)は、撮像部20の配置を示す。撮像部20は橋台の頭頂部に設置される。
また、撮像部20の撮像方向は、水平方向よりも上向きの方向であって、その撮像方向を平面視した方向は橋軸の方向に平行である。図10(b)は、橋梁Br4に設置された5個のマーカMk41~Mk45の配置を示す。マーカMk41~Mk44は、互いに同じ高さであって、橋軸の方向に異なる位置に設置される。マーカMk41~Mk44それぞれの位置は、1つの橋スパンの一端から1/4点、1/2点(中央)、3/4点、1点(他端)である。マーカMk45は、撮像部20が設置された橋台に隣接する橋脚の頂点に固定点として設置されている。マーカMk45の高さは、他のマーカMk41~Mk44の高さよりも低い位置に設置されている。マーカMk45の中心点は、基準測定点として用いられる。マーカMk45が設けられる橋脚には、橋梁Br4の振動が直に伝達しないので、この基準測定点は固定点として用いられる。この配置により、マーカMk41~Mk45を表す画像は、いずれも撮像部20が撮像した画像に含まれる。 (Example 2)
Next, another example of measurement of the displacement amount of the bridge will be described as Example 2 of the present embodiment.
FIG. 10 is a diagram illustrating an installation example of the
In addition, the imaging direction of the
図11は、図10に示す配置において橋梁Br4を1台の車両が時速60kmの運転速度で通過する前後に測定されたマーカMk42での変位量を示す。橋梁Br4は、PC(Prestressed Concrete)3径間連続波形鋼板ウェブ箱桁橋である。
図11(a)において、太線は橋梁Br4の中央部における変位量、細線は固定点における変位量を示す。固定点には車両の振動が伝わらないため、この変位量の変化は、主に計測最中に発生する振動による撮像部20の位置や撮影方向の変化に起因する。車両は、太線が示す変位量が最小となる時刻23sの後である時刻25sから最大となる時刻である27sの後である時刻28sまでの時間を含む時間帯において橋梁Br4を通過する。図11(b)は、従来の補正方法に基づいて得られた橋梁Br4の中央部における補正後の変位量を示す。この変位量は、図11(a)において太線が示す変位量から細線が示す変位量を単純に差し引いて得られる。時刻23sにおいて変位量は最小となり、時刻27sにおいて変位量は最大となる。時刻23sで変位量が最小となるのは、主に車両が隣の橋脚スパンを通過した際に発生する橋梁の浮き上がりに起因する。時刻27sにおいて変位量が最大となるのは、車両が橋梁Br4の中央を通過する時にたわみが最も大きくなることを示している。したがって、車両通過後である時刻30s以降において本来であれば、橋梁Br4は元の位置に戻って変位量が0に収束するはずである。しかしながら、時刻30sを経過しても変位量は0に収束しない。図11(c)は、本実施形態に係る補正方法に基づいて得られた橋梁Br4の中央部における補正後の変位量を示す。補正量として、固定点における変位量に固定点におけるピッチの測定点におけるピッチに対するピッチ比を乗じて得られる値が用いられる。図11(c)に示す変位量は、車両の通過前の時刻18s以前、通過後の時刻29s以降においてほぼ0に収束する。これらの結果は、撮像部20から各測定点までの距離が異なる場合であっても、撮像部20の位置や撮影方向の変化による影響を解消することができることを示す。 FIG. 11 shows the displacement amount at the marker Mk42 measured before and after a vehicle passes through the bridge Br4 at the driving speed of 60 km / h in the arrangement shown in FIG. The bridge Br4 is a PC (Pressed Concrete) 3 span continuous corrugated steel sheet web box girder bridge.
In FIG. 11A, the thick line indicates the amount of displacement at the center of the bridge Br4, and the thin line indicates the amount of displacement at the fixed point. Since the vibration of the vehicle is not transmitted to the fixed point, the change in the displacement amount is mainly caused by the change in the position of theimaging unit 20 or the shooting direction due to the vibration generated during the measurement. The vehicle passes through the bridge Br4 in a time zone including a time from a time 25s after the time 23s at which the displacement indicated by the bold line is minimum to a time 28s after 27s which is the maximum. FIG. 11B shows the corrected displacement amount at the center of the bridge Br4 obtained based on the conventional correction method. This displacement amount is obtained by simply subtracting the displacement amount indicated by the thin line from the displacement amount indicated by the thick line in FIG. The displacement amount is minimized at time 23s, and the displacement amount is maximized at time 27s. The amount of displacement at time 23s is minimized mainly due to the rise of the bridge that occurs when the vehicle passes through the adjacent pier span. The maximum displacement at time 27s indicates that the deflection becomes the largest when the vehicle passes through the center of the bridge Br4. Therefore, if it is original after time 30s after passing through the vehicle, the bridge Br4 should return to the original position and the displacement amount should converge to zero. However, the displacement amount does not converge to 0 even after the time 30s has elapsed. FIG.11 (c) shows the displacement amount after correction | amendment in the center part of bridge Br4 obtained based on the correction method which concerns on this embodiment. As the correction amount, a value obtained by multiplying the displacement amount at the fixed point by the pitch ratio of the pitch at the fixed point to the pitch at the measurement point is used. The displacement shown in FIG. 11 (c) converges to almost 0 before time 18s before passing the vehicle and after time 29s after passing. These results indicate that even if the distance from the imaging unit 20 to each measurement point is different, the influence due to the change in the position of the imaging unit 20 and the imaging direction can be eliminated.
図11(a)において、太線は橋梁Br4の中央部における変位量、細線は固定点における変位量を示す。固定点には車両の振動が伝わらないため、この変位量の変化は、主に計測最中に発生する振動による撮像部20の位置や撮影方向の変化に起因する。車両は、太線が示す変位量が最小となる時刻23sの後である時刻25sから最大となる時刻である27sの後である時刻28sまでの時間を含む時間帯において橋梁Br4を通過する。図11(b)は、従来の補正方法に基づいて得られた橋梁Br4の中央部における補正後の変位量を示す。この変位量は、図11(a)において太線が示す変位量から細線が示す変位量を単純に差し引いて得られる。時刻23sにおいて変位量は最小となり、時刻27sにおいて変位量は最大となる。時刻23sで変位量が最小となるのは、主に車両が隣の橋脚スパンを通過した際に発生する橋梁の浮き上がりに起因する。時刻27sにおいて変位量が最大となるのは、車両が橋梁Br4の中央を通過する時にたわみが最も大きくなることを示している。したがって、車両通過後である時刻30s以降において本来であれば、橋梁Br4は元の位置に戻って変位量が0に収束するはずである。しかしながら、時刻30sを経過しても変位量は0に収束しない。図11(c)は、本実施形態に係る補正方法に基づいて得られた橋梁Br4の中央部における補正後の変位量を示す。補正量として、固定点における変位量に固定点におけるピッチの測定点におけるピッチに対するピッチ比を乗じて得られる値が用いられる。図11(c)に示す変位量は、車両の通過前の時刻18s以前、通過後の時刻29s以降においてほぼ0に収束する。これらの結果は、撮像部20から各測定点までの距離が異なる場合であっても、撮像部20の位置や撮影方向の変化による影響を解消することができることを示す。 FIG. 11 shows the displacement amount at the marker Mk42 measured before and after a vehicle passes through the bridge Br4 at the driving speed of 60 km / h in the arrangement shown in FIG. The bridge Br4 is a PC (Pressed Concrete) 3 span continuous corrugated steel sheet web box girder bridge.
In FIG. 11A, the thick line indicates the amount of displacement at the center of the bridge Br4, and the thin line indicates the amount of displacement at the fixed point. Since the vibration of the vehicle is not transmitted to the fixed point, the change in the displacement amount is mainly caused by the change in the position of the
以上に説明したように、本実施形態に係る変位測定装置10は、一定のピッチを有する模様が空間的に繰り返される2つ以上の繰り返し模様の画像を取得し、繰り返し模様について、所定の間引き間隔で間引きして生成される間引き画像を補間して得られるモアレ画像の位相を算出する位相演算部121を備える。変位測定装置10は、一時点における位相から他の時点における位相との差に基づいて繰り返し模様の変位量を算出する変位量演算部122を備える。また、変位測定装置10は、一つの繰り返し模様の変位量から、他の繰り返し模様のピッチの一つの繰り返し模様のピッチに対する比を乗じた他の繰り返し模様の変位量を差し引く補正演算処理部124を備える。
この構成により、撮像部20から各測定点までの距離が異なる場合であっても、各測定点に設置された繰り返し模様のピッチに基づいて、他の繰り返し模様が設置された測定点における変位量を基準として、一つの繰り返し模様が設置された変位量が補正される。撮像された画像に基づいて一度に複数の測定点の変位量を高い精度で測定するために、各測定点までの距離が等しいと近似できる位置に撮像部20を設置する必要がなくなる点で設置条件の制約が緩和される。 As described above, thedisplacement measuring apparatus 10 according to the present embodiment acquires images of two or more repetitive patterns in which a pattern having a constant pitch is spatially repeated, and the predetermined thinning interval for the repetitive patterns. A phase calculation unit 121 that calculates the phase of a moire image obtained by interpolating a thinned image generated by thinning out at. The displacement measuring apparatus 10 includes a displacement amount calculation unit 122 that calculates the displacement amount of the repetitive pattern based on the difference between the phase at the temporary point and the phase at another time point. Further, the displacement measuring apparatus 10 includes a correction calculation processing unit 124 that subtracts a displacement amount of another repeating pattern obtained by multiplying a displacement amount of one repeating pattern by a ratio of a pitch of another repeating pattern to a pitch of one repeating pattern. Prepare.
With this configuration, even when the distance from theimaging unit 20 to each measurement point is different, the amount of displacement at the measurement point where another repeating pattern is installed based on the pitch of the repeating pattern installed at each measurement point As a reference, the displacement amount in which one repeating pattern is installed is corrected. In order to measure the amount of displacement of a plurality of measurement points at a high accuracy at once based on the captured image, it is installed at a point where it is not necessary to install the imaging unit 20 at a position that can be approximated when the distance to each measurement point is equal. Conditional constraints are relaxed.
この構成により、撮像部20から各測定点までの距離が異なる場合であっても、各測定点に設置された繰り返し模様のピッチに基づいて、他の繰り返し模様が設置された測定点における変位量を基準として、一つの繰り返し模様が設置された変位量が補正される。撮像された画像に基づいて一度に複数の測定点の変位量を高い精度で測定するために、各測定点までの距離が等しいと近似できる位置に撮像部20を設置する必要がなくなる点で設置条件の制約が緩和される。 As described above, the
With this configuration, even when the distance from the
また、変位測定装置10は、モアレ画像の位相の勾配に基づいて繰り返し模様のピッチを算出するピッチ演算部123、をさらに備える。
この構成により、撮像部20と各測定点に設置された繰り返し模様との位置関係に応じて異なる繰り返し模様のピッチを、撮像された画像から取得することができる。そのため、測定点毎のピッチを予め別個の手段で取得ならびに設定する必要がなくなる。 Thedisplacement measuring apparatus 10 further includes a pitch calculation unit 123 that calculates the pitch of the repetitive pattern based on the phase gradient of the moire image.
With this configuration, the pitch of the repetitive pattern that differs depending on the positional relationship between theimaging unit 20 and the repetitive pattern installed at each measurement point can be acquired from the captured image. Therefore, it is not necessary to obtain and set the pitch for each measurement point by a separate means in advance.
この構成により、撮像部20と各測定点に設置された繰り返し模様との位置関係に応じて異なる繰り返し模様のピッチを、撮像された画像から取得することができる。そのため、測定点毎のピッチを予め別個の手段で取得ならびに設定する必要がなくなる。 The
With this configuration, the pitch of the repetitive pattern that differs depending on the positional relationship between the
(第2の実施形態)
以下、図面を参照しながら本発明の第2の実施形態について説明する。上述した実施形態と同一の構成については、同一の符号を付してその説明を援用する。
図12は、本実施形態に係る変位測定システム1Aにおける測定対象物と撮像部20の配置例を示す図である。図12に示す例では、変位測定システム1Aは、測定対象物である橋梁Br5の複数の測定点の変位を測定する。各測定点には、マーカMk51~Mk55が設置される。マーカは、それぞれ鉛直方向に所定のピッチで繰り返される横縞の模様を表す。また、マーカMk51~Mk53は、いずれも橋梁Br5の側面に表示または貼付されている。マーカMk54、Mk55は、橋脚の側面に表示または貼付されている。
撮像部20は、橋梁Br5の側面に対して交差する方向であって、橋梁Br5が横切る河川Rvの河岸の一方に設置される。 (Second Embodiment)
The second embodiment of the present invention will be described below with reference to the drawings. About the same structure as embodiment mentioned above, the same code | symbol is attached | subjected and the description is used.
FIG. 12 is a diagram illustrating an arrangement example of the measurement object and theimaging unit 20 in the displacement measurement system 1A according to the present embodiment. In the example shown in FIG. 12, the displacement measurement system 1A measures the displacement of a plurality of measurement points of the bridge Br5 that is a measurement object. Markers Mk51 to Mk55 are installed at each measurement point. Each marker represents a horizontal stripe pattern that is repeated at a predetermined pitch in the vertical direction. The markers Mk51 to Mk53 are all displayed or pasted on the side surface of the bridge Br5. The markers Mk54 and Mk55 are displayed or pasted on the side surface of the pier.
Theimaging unit 20 is installed in one of the river banks of the river Rv that crosses the side surface of the bridge Br5 and that the bridge Br5 crosses.
以下、図面を参照しながら本発明の第2の実施形態について説明する。上述した実施形態と同一の構成については、同一の符号を付してその説明を援用する。
図12は、本実施形態に係る変位測定システム1Aにおける測定対象物と撮像部20の配置例を示す図である。図12に示す例では、変位測定システム1Aは、測定対象物である橋梁Br5の複数の測定点の変位を測定する。各測定点には、マーカMk51~Mk55が設置される。マーカは、それぞれ鉛直方向に所定のピッチで繰り返される横縞の模様を表す。また、マーカMk51~Mk53は、いずれも橋梁Br5の側面に表示または貼付されている。マーカMk54、Mk55は、橋脚の側面に表示または貼付されている。
撮像部20は、橋梁Br5の側面に対して交差する方向であって、橋梁Br5が横切る河川Rvの河岸の一方に設置される。 (Second Embodiment)
The second embodiment of the present invention will be described below with reference to the drawings. About the same structure as embodiment mentioned above, the same code | symbol is attached | subjected and the description is used.
FIG. 12 is a diagram illustrating an arrangement example of the measurement object and the
The
図12に示す配置において撮像部20が撮像した撮像画像には、5つのマーカMk51~Mk55を表す部分画像が含まれる。図13に示すように撮像部20からの距離は、マーカMk51、Mk54、Mk52、Mk53、Mk55の順に大きくなるため、マーカMk51、Mk54、Mk52、Mk53、Mk55の順にその領域やピッチが小さくなる。また、橋梁Br5の側面が、撮像部20の撮影方向に対して直交していない斜め方向であるため、撮像される画像に表れるマーカMk51~Mk55の垂直方向の幅は、一定にならない。図13に示す例では、幅は右方ほど広がる。そのため、撮像画像に表されたマーカMk51-Mk55の形状は、台形となる。特に広角レンズを用いて被写体の表面に対して斜め方向から画像を撮影する場合には、その影響がより顕著である。また、マーカMk54、Mk55は、橋脚の側面であって、マーカMk51~Mk53よりも低い測定点に設置される。マーカMk54、Mk55には、橋梁Br5における検査車両Vcの走行による振動が直接伝達しない。そのため、マーカMk54、Mk55の一方または両方の代表点は、基準測定点として用いられる。
In the arrangement shown in FIG. 12, the captured image captured by the imaging unit 20 includes partial images representing the five markers Mk51 to Mk55. As shown in FIG. 13, the distance from the imaging unit 20 increases in the order of the markers Mk51, Mk54, Mk52, Mk53, and Mk55. Further, since the side surface of the bridge Br5 is an oblique direction that is not orthogonal to the imaging direction of the imaging unit 20, the vertical widths of the markers Mk51 to Mk55 appearing in the captured image are not constant. In the example shown in FIG. 13, the width increases toward the right. Therefore, the shape of the markers Mk51 to Mk55 shown in the captured image is a trapezoid. In particular, when an image is taken from an oblique direction with respect to the surface of a subject using a wide-angle lens, the influence is more remarkable. Further, the markers Mk54 and Mk55 are installed on the side surface of the pier and at measurement points lower than the markers Mk51 to Mk53. Vibrations caused by the traveling of the inspection vehicle Vc on the bridge Br5 are not directly transmitted to the markers Mk54 and Mk55. Therefore, one or both representative points of the markers Mk54 and Mk55 are used as reference measurement points.
(変位測定装置)
次に、本実施形態に係る変位測定システム1Aの構成について説明する。
図14は、本実施形態に係る変位測定システム1Aの機能構成を示すブロック図である。変位測定システム1Aは、変位測定装置10Aと撮像部20を含んで構成される。 (Displacement measuring device)
Next, the configuration of thedisplacement measurement system 1A according to this embodiment will be described.
FIG. 14 is a block diagram showing a functional configuration of thedisplacement measurement system 1A according to the present embodiment. The displacement measurement system 1A includes a displacement measurement device 10A and an imaging unit 20.
次に、本実施形態に係る変位測定システム1Aの構成について説明する。
図14は、本実施形態に係る変位測定システム1Aの機能構成を示すブロック図である。変位測定システム1Aは、変位測定装置10Aと撮像部20を含んで構成される。 (Displacement measuring device)
Next, the configuration of the
FIG. 14 is a block diagram showing a functional configuration of the
変位測定装置10Aは、パラメータ入力部11、演算処理部12A、および表示部13を含んで構成される。
演算処理部12Aは、撮像部20から有線または無線で入力される画像データに基づいて測定対象物上の測定点毎の変位量を算出する。演算処理部12Aは、例えば、CPU(Central Processing Unit)などの制御デバイスを含んで構成される。制御デバイスは、所定の制御プログラムで指示される処理を実行することによって、その機能を実現してもよい。演算処理部12Aは、位相演算部121、変位量演算部122、射影変換部125、補間処理部126、および補正演算処理部127を含んで構成される。 Thedisplacement measuring apparatus 10 </ b> A includes a parameter input unit 11, an arithmetic processing unit 12 </ b> A, and a display unit 13.
Thearithmetic processing unit 12A calculates the displacement amount for each measurement point on the measurement object based on the image data input from the imaging unit 20 in a wired or wireless manner. The arithmetic processing unit 12A includes, for example, a control device such as a CPU (Central Processing Unit). The control device may realize its function by executing processing instructed by a predetermined control program. The calculation processing unit 12A includes a phase calculation unit 121, a displacement calculation unit 122, a projective conversion unit 125, an interpolation processing unit 126, and a correction calculation processing unit 127.
演算処理部12Aは、撮像部20から有線または無線で入力される画像データに基づいて測定対象物上の測定点毎の変位量を算出する。演算処理部12Aは、例えば、CPU(Central Processing Unit)などの制御デバイスを含んで構成される。制御デバイスは、所定の制御プログラムで指示される処理を実行することによって、その機能を実現してもよい。演算処理部12Aは、位相演算部121、変位量演算部122、射影変換部125、補間処理部126、および補正演算処理部127を含んで構成される。 The
The
射影変換部125は、撮像部20から入力される画像データが示す画像を射影変換する。射影変換部125は、画像を構成する所定の座標毎に射影変換により得られた変換後の座標と、変換後の座標毎の輝度値を示す変換画像データを補間処理部126に出力する。
変換前の各座標は、水平方向ならびに垂直方向のそれぞれについて、所定の間隔(画素ピッチ)で2次元平面上に配列されている。射影変換は、斜め方向視して得られる撮像画像の座標(i,j)から正面方向視して得られる撮像画像の座標(I,J)である対応点への変換である。射影変換の詳細については後述する。 Theprojective conversion unit 125 performs projective conversion on the image indicated by the image data input from the imaging unit 20. The projective conversion unit 125 outputs the converted coordinates obtained by the projective conversion for each predetermined coordinate constituting the image and the converted image data indicating the luminance value for each converted coordinate to the interpolation processing unit 126.
Each coordinate before conversion is arranged on a two-dimensional plane at a predetermined interval (pixel pitch) in each of the horizontal direction and the vertical direction. The projective transformation is a conversion from a coordinate (i, j) of a captured image obtained by viewing from an oblique direction to a corresponding point that is a coordinate (I, J) of the captured image obtained by viewing from the front. Details of the projective transformation will be described later.
変換前の各座標は、水平方向ならびに垂直方向のそれぞれについて、所定の間隔(画素ピッチ)で2次元平面上に配列されている。射影変換は、斜め方向視して得られる撮像画像の座標(i,j)から正面方向視して得られる撮像画像の座標(I,J)である対応点への変換である。射影変換の詳細については後述する。 The
Each coordinate before conversion is arranged on a two-dimensional plane at a predetermined interval (pixel pitch) in each of the horizontal direction and the vertical direction. The projective transformation is a conversion from a coordinate (i, j) of a captured image obtained by viewing from an oblique direction to a corresponding point that is a coordinate (I, J) of the captured image obtained by viewing from the front. Details of the projective transformation will be described later.
補間処理部126は、射影変換部125から入力される変換画像データが示す変換後の座標毎の輝度値を線形補間して、所定の座標毎の輝度値を算出する。この所定の座標の配置は、変換前の座標の配置と同一であってもよい。線形補間の手法として、バイリニア法、バイキュービック法など、公知の補間方法を利用することができる。射影変換によれば画素の密度に偏りが生じるが、補間により均一に分布した画素毎の輝度値が得られる。補間処理部126は、算出した各座標の輝度値を示す補間画像データを位相演算部121に出力する。位相演算部121は、撮像部20から入力される画像データが示す画像に代えて、補間画像データが示す画像に基づいてモアレ画像の位相分布を算出する。
The interpolation processing unit 126 linearly interpolates the luminance value for each coordinate after conversion indicated by the converted image data input from the projection conversion unit 125, and calculates the luminance value for each predetermined coordinate. The arrangement of the predetermined coordinates may be the same as the arrangement of the coordinates before conversion. As a linear interpolation method, a known interpolation method such as a bilinear method or a bicubic method can be used. According to the projective transformation, the pixel density is biased, but the luminance value for each pixel that is uniformly distributed can be obtained by interpolation. The interpolation processing unit 126 outputs interpolation image data indicating the calculated luminance value of each coordinate to the phase calculation unit 121. The phase calculation unit 121 calculates the phase distribution of the moire image based on the image indicated by the interpolation image data instead of the image indicated by the image data input from the imaging unit 20.
補正演算処理部127は、変位量演算部122から入力された測定点毎の変位量Δxから、所定の測定基準点における変位量Δx0を差し引いて当該測定点の補正後の変位量Δx’を算出する。補正演算処理部127は、算出した補正後の変位量を表示部13に出力する。即ち、本実施形態では、補正演算処理部127において所定の測定基準点における変位量は、ピッチ比を乗算しない点で第1の実施形態とは異なる。本実施形態に係る変位測定装置10Aも、水平方向の処理に代えて、もしくは水平方向の処理と垂直方向の処理を行ってもよい。
The correction calculation processing unit 127 subtracts the displacement amount Δx 0 at a predetermined measurement reference point from the displacement amount Δx for each measurement point input from the displacement amount calculation unit 122 to obtain the corrected displacement amount Δx ′ of the measurement point. calculate. The correction calculation processing unit 127 outputs the calculated displacement amount after correction to the display unit 13. That is, in the present embodiment, the amount of displacement at a predetermined measurement reference point in the correction calculation processing unit 127 is different from that of the first embodiment in that the pitch ratio is not multiplied. The displacement measuring apparatus 10A according to the present embodiment may also perform horizontal processing and vertical processing instead of horizontal processing.
(射影変換)
次に、射影変換部125が行う射影変換の処理について説明する。図15は、射影変換の一例を示す図である。射影変換を行う前における、変換前の座標(i,j)と射影変換によって与えられる対応点の座標(I,J)との関係を式(13)に示す。 (Projective transformation)
Next, the projection conversion process performed by theprojection conversion unit 125 will be described. FIG. 15 is a diagram illustrating an example of projective transformation. Expression (13) shows the relationship between the coordinates (i, j) before conversion and the coordinates (I, J) of corresponding points given by the projection conversion before performing the projective conversion.
次に、射影変換部125が行う射影変換の処理について説明する。図15は、射影変換の一例を示す図である。射影変換を行う前における、変換前の座標(i,j)と射影変換によって与えられる対応点の座標(I,J)との関係を式(13)に示す。 (Projective transformation)
Next, the projection conversion process performed by the

式(13)において、a1,a2,…,a8は、射影変換パラメータである。射影変換パラメータa1,a2,…,a8は、4点以上の変換前の座標(i,j)と対応点の座標(I,J)との関係があれば算出可能である。また、変換前の座標と対応点のセットの数が多いほど、より安定した精度の高い射影変換を実現できる射影変換行列を求めることができる。そこで、射影変換部125には、パラメータとして4点以上の変換前の座標と、それぞれに対応する対応点の座標とのセットを設定しておく。図15(a)は変換前の座標の例を示す。変換前の座標は、撮像画像のうち□印でそれぞれ囲まれる継ぎ目の交点の座標である。継ぎ目は、それぞれ輝度値が急激に低下する線形の部分により表される。射影変換部125は、互いに交差する方向への輝度値の勾配が、所定の勾配よりも大きい部分の座標を変換対象の変換前の座標として定めることができる。橋梁Br6の側面において、継ぎ目は格子状に配置されているため、変換後に与えられる対応点の座標を定める際に好都合である。図15(a)に示す例では、橋梁Br6の側面において水平方向に20個、垂直方向に3個、計60個の交点の座標が変換前の座標として選択されている。
図15(b)は、変換後の対応点の座標の配置例を示す。変換後の対応点は、互いに直交する直線からなる直交格子の各格子点上に配置される。各格子点の座標は、水平方向ならびに垂直方向に等間隔に分布する対応点の座標に相当する。この例では、被写体である橋梁やビルディングなどのインフラ構造物の形状が長方体であること、または、被写体の表面に表れている特徴点が一定の空間周期で繰り返されていることを利用している。すなわち、一般的な射影変換では、変換前後の2枚の画像を必要とするのに対して、本実施形態は、変換前の1枚の画像のみを用いて射影変換を行う点に特徴がある。 In equation (13), a 1 , a 2 ,..., A 8 are projective transformation parameters. The projective transformation parameters a 1 , a 2 ,..., A 8 can be calculated if there is a relationship between the coordinates (i, j) of four or more points before conversion and the coordinates (I, J) of the corresponding points. Further, as the number of sets of coordinates and corresponding points before conversion increases, a projective transformation matrix capable of realizing more stable and accurate projective transformation can be obtained. Therefore, theprojection conversion unit 125 is set with a set of four or more coordinates before conversion and the coordinates of corresponding points corresponding to each as parameters. FIG. 15A shows an example of coordinates before conversion. The coordinates before conversion are the coordinates of the intersections of the joints respectively surrounded by the □ marks in the captured image. The seam is represented by a linear portion where the luminance value rapidly decreases. The projective transformation unit 125 can determine the coordinates of the part where the gradient of the luminance values in the directions intersecting each other is greater than the predetermined gradient as the coordinates before conversion of the conversion target. On the side surface of the bridge Br6, since the joints are arranged in a lattice pattern, it is convenient when determining the coordinates of the corresponding points given after the conversion. In the example shown in FIG. 15A, the coordinates of 60 intersections in total, 20 in the horizontal direction and 3 in the vertical direction, are selected as the coordinates before conversion on the side surface of the bridge Br6.
FIG. 15B shows an example of arrangement of coordinates of corresponding points after conversion. Corresponding points after conversion are arranged on each lattice point of an orthogonal lattice composed of straight lines orthogonal to each other. The coordinates of each lattice point correspond to the coordinates of corresponding points distributed at equal intervals in the horizontal direction and the vertical direction. In this example, the shape of an infrastructure structure such as a bridge or building that is a subject is a rectangular solid, or feature points that appear on the surface of the subject are repeated at a constant spatial period. ing. That is, in the general projective transformation, two images before and after the conversion are required, whereas this embodiment is characterized in that the projective transformation is performed using only one image before the transformation. .
図15(b)は、変換後の対応点の座標の配置例を示す。変換後の対応点は、互いに直交する直線からなる直交格子の各格子点上に配置される。各格子点の座標は、水平方向ならびに垂直方向に等間隔に分布する対応点の座標に相当する。この例では、被写体である橋梁やビルディングなどのインフラ構造物の形状が長方体であること、または、被写体の表面に表れている特徴点が一定の空間周期で繰り返されていることを利用している。すなわち、一般的な射影変換では、変換前後の2枚の画像を必要とするのに対して、本実施形態は、変換前の1枚の画像のみを用いて射影変換を行う点に特徴がある。 In equation (13), a 1 , a 2 ,..., A 8 are projective transformation parameters. The projective transformation parameters a 1 , a 2 ,..., A 8 can be calculated if there is a relationship between the coordinates (i, j) of four or more points before conversion and the coordinates (I, J) of the corresponding points. Further, as the number of sets of coordinates and corresponding points before conversion increases, a projective transformation matrix capable of realizing more stable and accurate projective transformation can be obtained. Therefore, the
FIG. 15B shows an example of arrangement of coordinates of corresponding points after conversion. Corresponding points after conversion are arranged on each lattice point of an orthogonal lattice composed of straight lines orthogonal to each other. The coordinates of each lattice point correspond to the coordinates of corresponding points distributed at equal intervals in the horizontal direction and the vertical direction. In this example, the shape of an infrastructure structure such as a bridge or building that is a subject is a rectangular solid, or feature points that appear on the surface of the subject are repeated at a constant spatial period. ing. That is, in the general projective transformation, two images before and after the conversion are required, whereas this embodiment is characterized in that the projective transformation is performed using only one image before the transformation. .
射影変換部125は、変換前の座標と対応点の座標のセットをパラメータとして用いることにより、式(14)に示すように最小二乗法を用いて射影変換パラメータa1,a2,…,a8を算出する。
The projective transformation unit 125 uses the set of coordinates before transformation and the coordinates of corresponding points as parameters, thereby using the least squares method as shown in Expression (14), so that the projective transformation parameters a 1 , a 2 ,. 8 is calculated.

式(14)において、ベクトル{a}は、[a1,a2,a3,a4,a5,a6,a7,a8]Tである。Tは、ベクトルまたは行列の転置を示す。([A]T[A])-1は、式(15)で表される。また、[A]T{X}は、式(16)で表される。
In the equation (14), the vector {a} is [a 1 , a 2 , a 3 , a 4 , a 5 , a 6 , a 7 , a 8 ] T. T indicates transposition of a vector or matrix. ([A] T [A]) −1 is represented by Expression (15). Moreover, [A] T {X} is represented by Formula (16).
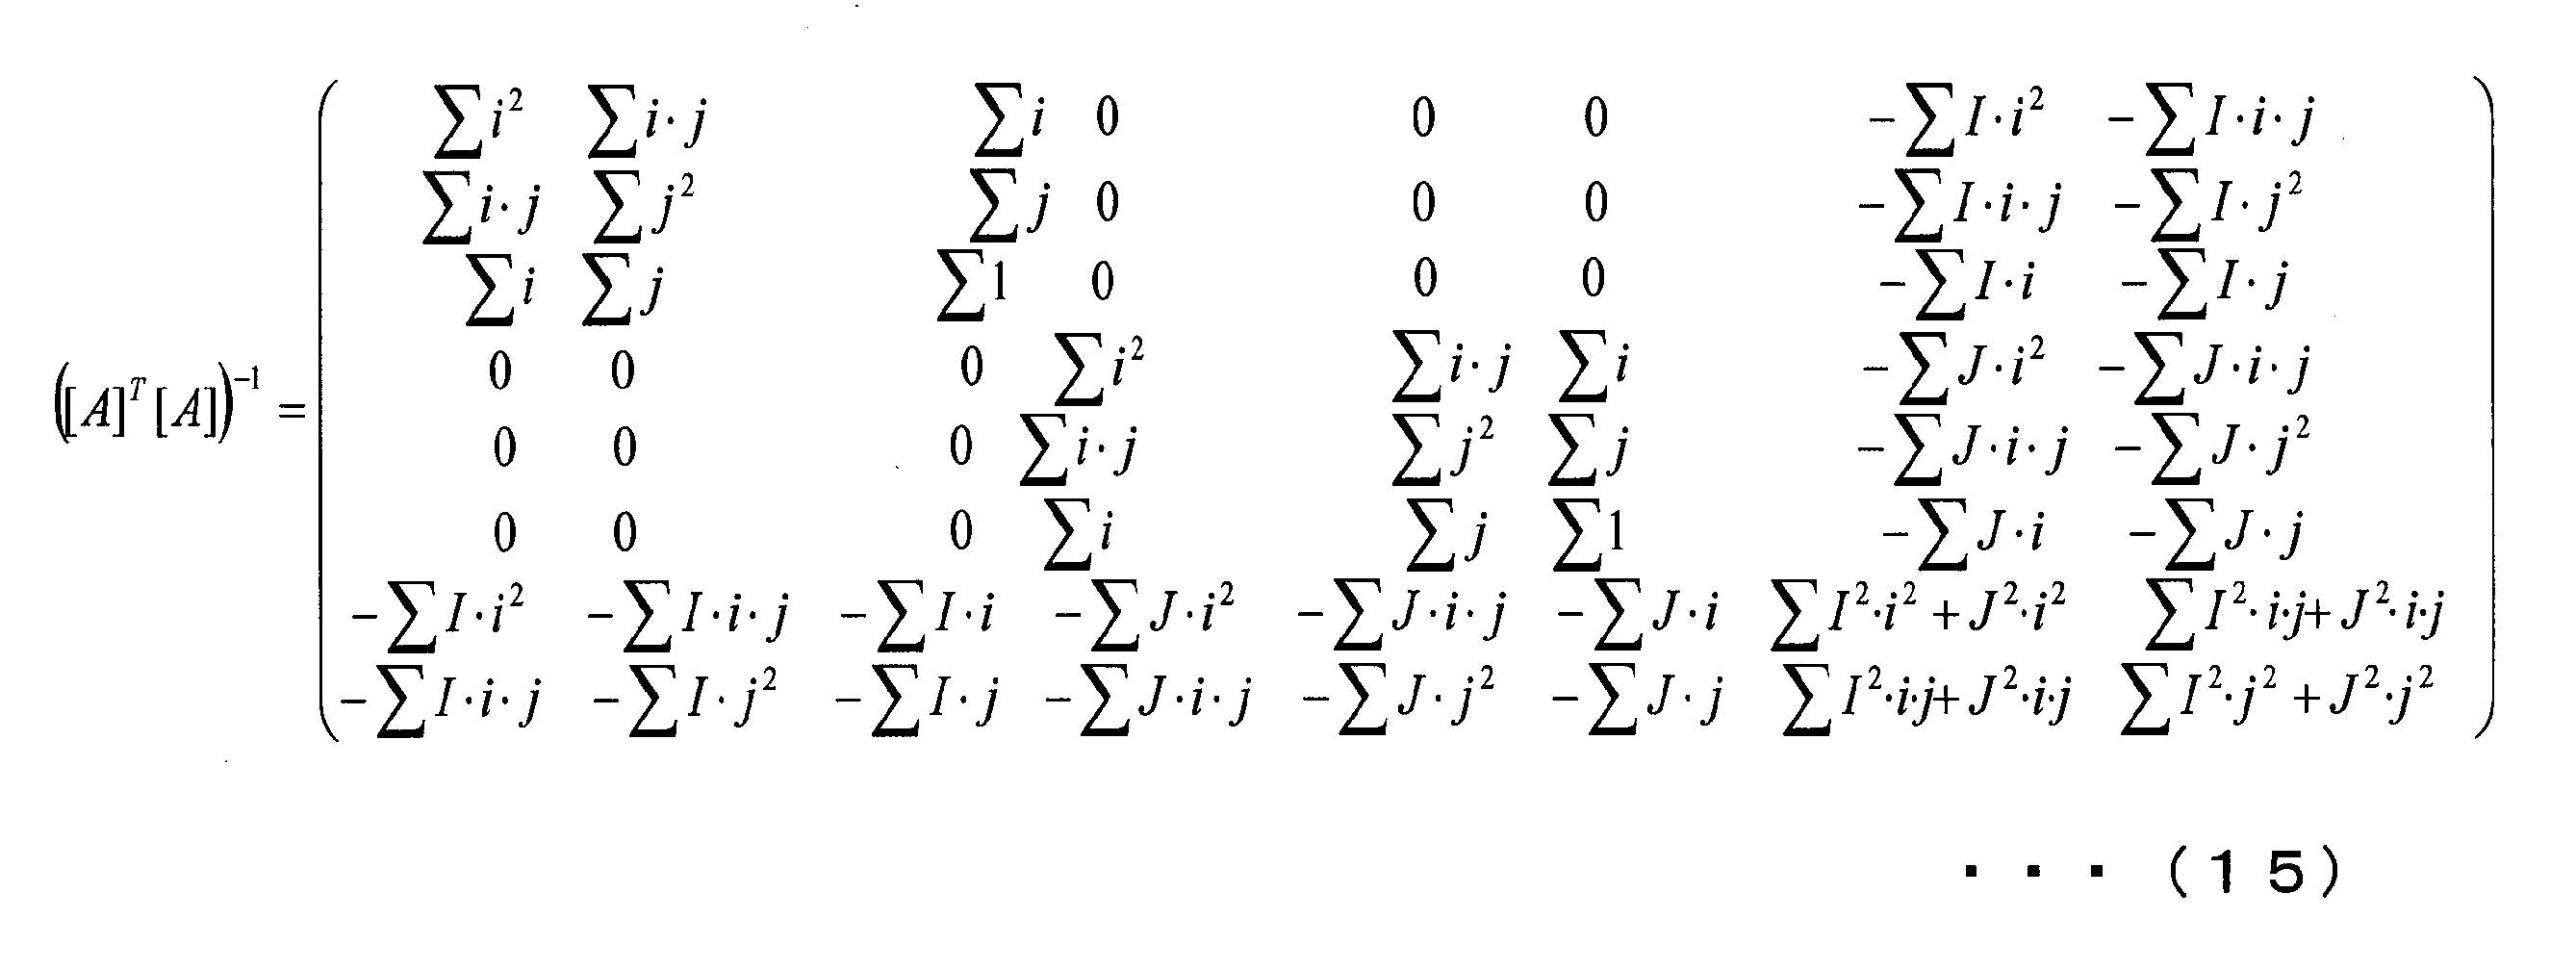
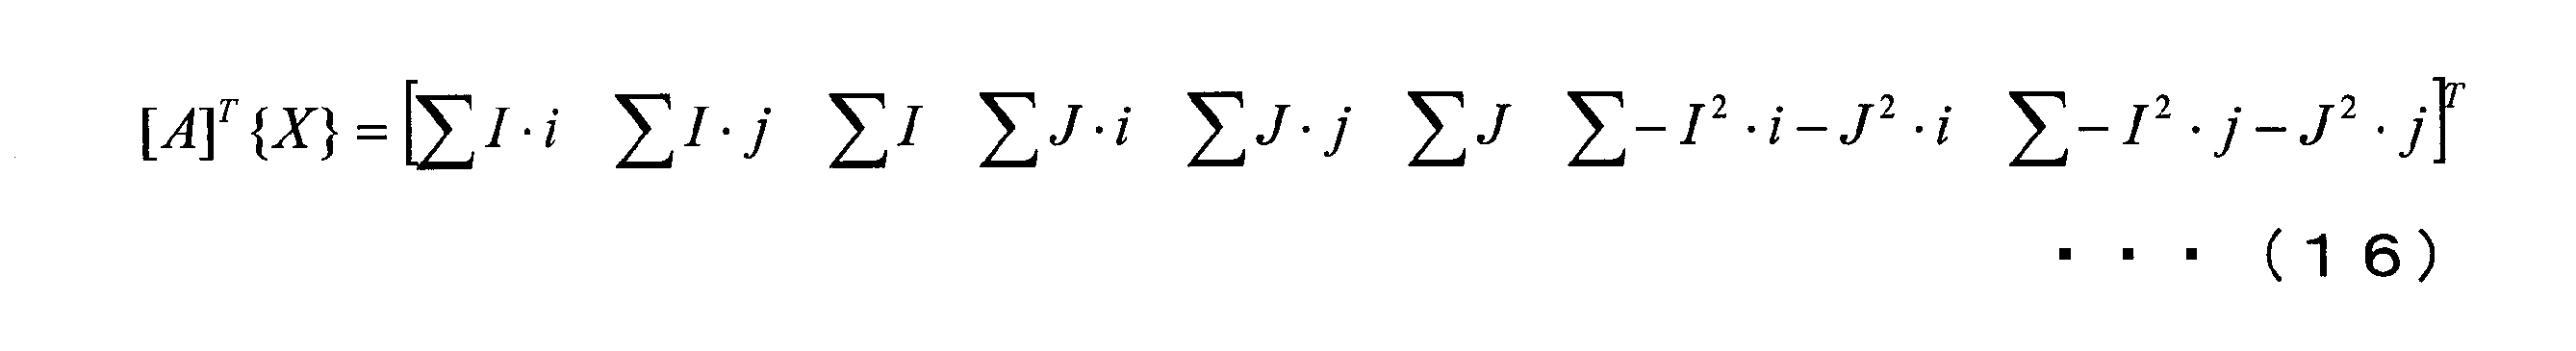
式(15)、(16)において、Σは、変換前の座標(i,j)と対応点の座標(I,J)とのセット間の和を示す。
式(14)-(16)は、式(13)を展開して得られる式(17)に基づいて得られる。 In equations (15) and (16), Σ represents the sum between sets of coordinates (i, j) before conversion and coordinates (I, J) of corresponding points.
Expressions (14) to (16) are obtained based on Expression (17) obtained by expanding Expression (13).
式(14)-(16)は、式(13)を展開して得られる式(17)に基づいて得られる。 In equations (15) and (16), Σ represents the sum between sets of coordinates (i, j) before conversion and coordinates (I, J) of corresponding points.
Expressions (14) to (16) are obtained based on Expression (17) obtained by expanding Expression (13).

式(17)をセット間で並列することによりマトリックスで表現すると式(18)が得られる。
When Expression (17) is expressed in a matrix by parallelizing between sets, Expression (18) is obtained.

式(18)に示すベクトル{X}は、[I,J,…]Tと、式(17)の左辺であるI、Jをセット間で並列して得られる。行列[A]は、式(19)に示すように、式(18)の右辺の射影変換パラメータに乗じられる係数をセット間で並列して得られる。
The vector {X} shown in Expression (18) is obtained by parallelizing [I, J,...] T and I and J, which are the left side of Expression (17), between sets. The matrix [A] is obtained by parallelly multiplying the coefficient multiplied by the projective transformation parameter on the right side of Expression (18) as shown in Expression (19).

射影変換部125は、算出した射影変換パラメータa1-a8を式(13)に代入し、式(13)に示す関係を用いて画像データを構成する各座標の座標(i,j)について変換後の座標(I,J)を算出する。
通例、射影変換パラメータa1,a2,…,a8の算出に用いられる画像は、射影変換の対象となる画像とは異なる時刻において撮像される。撮像部20と測定対象物の位置関係が変化しなければ、射影変換部125は、射影変換パラメータa1,a2,…,a8を算出し、画像データを構成する各座標(i,j)と変換後の対応点の座標(I,J)との関係を示す変換テーブルを予め生成しておいてもよい。その場合、射影変換部125は、変換テーブルを参照して、画像データを構成する各座標(i,j)に対応する変換テーブルを参照して対応点の座標(I,J)を定める。 Theprojective transformation unit 125 assigns the calculated projective transformation parameters a 1 -a 8 to Equation (13), and uses the relationship shown in Equation (13) to determine the coordinates (i, j) of each coordinate constituting the image data. The coordinates (I, J) after conversion are calculated.
Usually, the image used for calculating the projective transformation parameters a 1 , a 2 ,..., A 8 is taken at a different time from the image to be subject to the projective transformation. If the positional relationship between theimaging unit 20 and the measurement object does not change, the projective transformation unit 125 calculates the projective transformation parameters a 1 , a 2 ,..., A 8 and coordinates (i, j) constituting the image data. ) And the coordinates (I, J) of the corresponding points after conversion may be generated in advance. In that case, the projective transformation unit 125 refers to the conversion table and determines the coordinates (I, J) of the corresponding point with reference to the conversion table corresponding to each coordinate (i, j) constituting the image data.
通例、射影変換パラメータa1,a2,…,a8の算出に用いられる画像は、射影変換の対象となる画像とは異なる時刻において撮像される。撮像部20と測定対象物の位置関係が変化しなければ、射影変換部125は、射影変換パラメータa1,a2,…,a8を算出し、画像データを構成する各座標(i,j)と変換後の対応点の座標(I,J)との関係を示す変換テーブルを予め生成しておいてもよい。その場合、射影変換部125は、変換テーブルを参照して、画像データを構成する各座標(i,j)に対応する変換テーブルを参照して対応点の座標(I,J)を定める。 The
Usually, the image used for calculating the projective transformation parameters a 1 , a 2 ,..., A 8 is taken at a different time from the image to be subject to the projective transformation. If the positional relationship between the
図15(c)は、射影変換の対象である撮像画像の一例を示す。図15(d)は、図15(c)に示す撮像画像について射影変換を行って得られた変換後の画像を示す。図15(c)に示す例では、橋梁Br6の側面が水平方向と垂直方向のいずれにも交差する斜め方向に表され、側面の幅が右方に向かうほど細くなっている。これに対し、図15(d)に示す例では、適切な射影変換を施すことで変換前の画像よりも変換後の画像において左端が拡大され、右端が縮小された結果、橋梁Br6の側面の長手方向が水平方向に配置され、側面の幅がほぼ一定となる。これにより、各測定点において同じ解析パラメータで高い精度で変位を計測できるようになる。
FIG. 15C illustrates an example of a captured image that is a target of projective transformation. FIG. 15D shows an image after conversion obtained by performing projective conversion on the captured image shown in FIG. In the example shown in FIG. 15C, the side surface of the bridge Br6 is represented in an oblique direction intersecting both the horizontal direction and the vertical direction, and the width of the side surface becomes thinner toward the right side. On the other hand, in the example shown in FIG. 15D, by performing appropriate projective transformation, the left end is enlarged and the right end is reduced in the image after conversion than the image before conversion. As a result, the side surface of the bridge Br6 is reduced. The longitudinal direction is arranged in the horizontal direction, and the width of the side surface is substantially constant. As a result, the displacement can be measured with high accuracy with the same analysis parameter at each measurement point.
図16は、射影変換の他の例を示す図である。図16(a)は、射影変換の対象である撮像画像の他の例を示す。図16(b)は、図16(a)に示す撮像画像について射影変換を行って得られた変換後の画像を示す。図16(a)に示す例では、橋梁Br7の欄高部が斜め方向に表され、幅が右方に向かうほど太くなっている。これに対し、図16(b)に示す例では、橋梁Br7の欄高部の長手方向が水平方向に配置され、欄高部の幅はほぼ一定である。図16(c)は、図16(a)が表す欄高部の右端部の拡大図を示す。この拡大図には、欄高部において水平方向ならびに垂直方向に一定のピッチの規則性を有する格子模様を表すマーカMk71、Mk72等が表されていることを示す。図16(c)に示す例では、本来長方形であるマーカMk71、Mk72が拡大図において斜めに表される。図16(d)は、図16(b)が表す欄高部の右端部の拡大図を示す。図16(d)に示す例では、マーカMk71、Mk72の形状が長方形に補正され、マーカMk71、Mk72に表されている模様が直交格子となる。このようにして、射影変換により撮像部20からの奥行き方向の距離が等しい複数の測定点を表す画像を得ることができる。得られた画像に表された複数の測定点にそれぞれ設置されたマーカの模様の周期は互いに等しくなる。
FIG. 16 is a diagram showing another example of projective transformation. FIG. 16A shows another example of a captured image that is a target of projective transformation. FIG. 16B shows a converted image obtained by performing projective conversion on the captured image shown in FIG. In the example shown in FIG. 16 (a), the rail height portion of the bridge Br7 is represented in an oblique direction, and the width becomes thicker toward the right. On the other hand, in the example shown in FIG. 16B, the longitudinal direction of the rail height portion of the bridge Br7 is arranged in the horizontal direction, and the width of the rail height portion is almost constant. FIG.16 (c) shows the enlarged view of the right end part of the balustrade part which Fig.16 (a) represents. This enlarged view shows that markers Mk71, Mk72, and the like representing a lattice pattern having regularity with a constant pitch in the horizontal direction and the vertical direction are shown in the field height portion. In the example shown in FIG. 16C, markers Mk71 and Mk72 that are originally rectangular are shown obliquely in the enlarged view. FIG.16 (d) shows the enlarged view of the right end part of the railing part which FIG.16 (b) represents. In the example shown in FIG. 16D, the shapes of the markers Mk71 and Mk72 are corrected to rectangles, and the patterns represented by the markers Mk71 and Mk72 are orthogonal lattices. In this manner, an image representing a plurality of measurement points having the same distance in the depth direction from the imaging unit 20 can be obtained by projective transformation. The periods of the marker patterns respectively set at the plurality of measurement points shown in the obtained image are equal to each other.
(変位測定処理)
次に、本実施形態に係る変位測定処理について説明する。図17は、本実施形態に係る変位測定処理を示すフローチャートである。図17に示す処理は、ステップS101、S106、S102、S103およびS105を有する。図17に示す処理では、ステップS101の後、ステップS106の処理に進む。
(ステップS106)射影変換部125は、記録した画像データが示す画像を射影変換する。補間処理部126は、射影変換により得られた変換後の座標毎の輝度値を線形補間して、所定の座標毎の輝度値を算出する。その後、ステップS102、S103およびS105の処理を行う。 (Displacement measurement process)
Next, the displacement measurement process according to the present embodiment will be described. FIG. 17 is a flowchart showing the displacement measurement process according to the present embodiment. The process illustrated in FIG. 17 includes steps S101, S106, S102, S103, and S105. In the process shown in FIG. 17, the process proceeds to step S106 after step S101.
(Step S106) Theprojective conversion unit 125 performs projective conversion on the image indicated by the recorded image data. The interpolation processing unit 126 linearly interpolates the luminance value for each coordinate after conversion obtained by projective transformation, and calculates the luminance value for each predetermined coordinate. Then, the process of step S102, S103, and S105 is performed.
次に、本実施形態に係る変位測定処理について説明する。図17は、本実施形態に係る変位測定処理を示すフローチャートである。図17に示す処理は、ステップS101、S106、S102、S103およびS105を有する。図17に示す処理では、ステップS101の後、ステップS106の処理に進む。
(ステップS106)射影変換部125は、記録した画像データが示す画像を射影変換する。補間処理部126は、射影変換により得られた変換後の座標毎の輝度値を線形補間して、所定の座標毎の輝度値を算出する。その後、ステップS102、S103およびS105の処理を行う。 (Displacement measurement process)
Next, the displacement measurement process according to the present embodiment will be described. FIG. 17 is a flowchart showing the displacement measurement process according to the present embodiment. The process illustrated in FIG. 17 includes steps S101, S106, S102, S103, and S105. In the process shown in FIG. 17, the process proceeds to step S106 after step S101.
(Step S106) The
但し、本実施形態では、ステップS103において、位相演算部121は、補間処理部126において得られた座標毎の輝度値に基づいて間引き画像を生成する。また、図14に示すように、変位測定装置10Aはピッチ演算部123を有しないため、ステップS103において、繰り返し模様のピッチを算出する処理は省略される。また、ステップS103の処理の後、補正演算処理部127は、測定点毎の変位量から所定の測定基準点における変位量を差し引いて補正後の変位量を算出する。その後、ステップS105の処理に進む。
However, in this embodiment, in step S103, the phase calculation unit 121 generates a thinned image based on the luminance value for each coordinate obtained by the interpolation processing unit 126. Further, as shown in FIG. 14, the displacement measuring apparatus 10A does not have the pitch calculation unit 123, and thus the process of calculating the pitch of the repeated pattern is omitted in step S103. Further, after the process of step S103, the correction calculation processing unit 127 calculates a corrected displacement amount by subtracting the displacement amount at a predetermined measurement reference point from the displacement amount for each measurement point. Thereafter, the process proceeds to step S105.
図18は、各測定点における変位点の測定例を示す図である。図18に示す例では、11個の測定点が橋梁Br8の側面に設定されている。測定点は、×印で表されている。各測定点には、格子模様を表すマーカが設置されている。11個のうち9個の測定点が橋梁のBr9の長手方向に一定間隔に設置されている。その他、橋台の側面と橋脚の側面に測定点が設定されている。橋台の側面に設定されている測定点は、基準測定点として用いられる。各測定点を起点とする矢印の長さは、垂直方向の変位量を示す。
FIG. 18 is a diagram illustrating a measurement example of a displacement point at each measurement point. In the example shown in FIG. 18, 11 measurement points are set on the side surface of the bridge Br8. Measurement points are represented by crosses. Each measurement point is provided with a marker representing a lattice pattern. Nine measurement points out of eleven are set at regular intervals in the longitudinal direction of Br9 of the bridge. In addition, measurement points are set on the side of the abutment and the side of the pier. The measurement point set on the side surface of the abutment is used as a reference measurement point. The length of the arrow starting from each measurement point indicates the amount of displacement in the vertical direction.
図18(a)、(c)は、それぞれ車両Vc8の通過時に撮像された画像である。図18(a)は、射影変換を行っていない画像とその画像に基づいて測定された変位量を示す。図18(c)は、射影変換を行った変換後の画像とその画像に基づいて測定された変位量を示す。図18(a)、(c)ともに、橋梁Br8の両端よりも中央部の変位量が大きい傾向を表す。但し、変位量が最も大きい部位は、図18(a)よりも図18(c)の方が橋梁Br8の中央部に近く、図18(a)の方が中央部よりも橋脚に近い位置に偏っている。
FIGS. 18A and 18C are images captured when the vehicle Vc8 passes. FIG. 18A shows an image that has not undergone projective transformation and the amount of displacement measured based on the image. FIG. 18C shows a converted image obtained by performing the projective transformation and a displacement amount measured based on the image. 18 (a) and 18 (c) both show a tendency that the amount of displacement in the central portion is larger than both ends of the bridge Br8. However, the portion with the largest displacement is located closer to the center of the bridge Br8 in FIG. 18C than in FIG. 18A, and closer to the pier in FIG. 18A than in the center. Is biased.
図18(b)、(d)は、それぞれ車両Vc8が通過していないときに撮像された画像である。図18(b)は、射影変換を行っていない画像とその画像に基づいて測定された変位量を示す。図18(d)は、射影変換を行った変換後の画像とその画像に基づいて測定された変位量を示す。図18(b)、(d)ともに、変位量が0に近似するが、測定点全体として図18(d)に示す変位量の方が図18(b)に変位量よりも小さい。特に、図18(b)に示す橋脚の真上から左方に3番目に配置されている測定点における変位量が最も大きいが、図18(d)に示すその測定点における変位量は約1/4となる。射影変換により変換後の各測定点の座標までの、撮像部20からの奥行方向の距離が等しくなるので、各測定点に表されたマーカ上の模様のピッチが等しくなる。図18に示す測定結果は、撮像部20から各測定点までの距離に応じてピッチが異なることによる変位量の測定誤差が解消されることを示す。
18B and 18D are images captured when the vehicle Vc8 is not passing through. FIG. 18B shows an image that has not undergone projective transformation and the amount of displacement measured based on that image. FIG. 18D shows a converted image obtained by performing the projective transformation and a displacement amount measured based on the image. 18B and 18D, the displacement amount approximates to 0, but the displacement amount shown in FIG. 18D as a whole measurement point is smaller than the displacement amount in FIG. 18B. In particular, the amount of displacement at the third measurement point arranged to the left from directly above the pier shown in FIG. 18B is the largest, but the amount of displacement at that measurement point shown in FIG. / 4. Since the distance in the depth direction from the imaging unit 20 to the coordinates of each measurement point after conversion by projection conversion is equal, the pitches of the patterns on the markers represented by the measurement points are equal. The measurement result shown in FIG. 18 indicates that the measurement error of the displacement amount due to the difference in pitch depending on the distance from the imaging unit 20 to each measurement point is eliminated.
以上に説明したように、本実施形態による変位測定装置10Aは、一定のピッチを有する模様が空間的に繰り返される2つ以上の繰り返し模様を表す画像を取得し、取得した画像を射影変換する射影変換部125を備える。変位測定装置10Aは、繰り返し模様について、所定の間引き間隔で間引きして生成される間引き画像を補間して得られるモアレ画像の位相を算出する位相演算部121を備える。また、変位測定装置10Aは、一時点における位相から他の時点における位相との差に基づいて繰り返し模様における変位量を算出する変位量演算部122を備える。また、変位測定装置10Aは、一つの繰り返し模様における変位量から、他の繰り返し模様の変位量を差し引く補正演算処理部127を備える。
この構成により、撮像部20から各測定点までの距離が異なる場合であっても、撮像された画像に表される各測定点に設置された繰り返し模様のピッチが等しくなる。従来、画像に表されたピッチの差異によって、他の繰り返し模様が設置された測定点における変位量を基準として補正された一つの繰り返し模様が設置された変位量の誤差が生じていたが、この誤差が解消される。そのため、撮像された画像に基づいて一度に複数の測定点の変位量を高い精度で測定するために、各測定点までの距離が等しいと近似できる位置に撮像部20を設置する必要がなくなる点で撮像部20の設置条件の制約が緩和される。加えて、従来法では、各測定点に設置されたマーカ毎に異なる解析パラメータで変位を解析していたが、本実施形態では1つの解析パラメータで変位を解析することができる。そのため、解析時間が大幅に短縮し、解析パラメータの設定に係る作業が軽減される。 As described above, thedisplacement measuring apparatus 10A according to the present embodiment acquires an image representing two or more repetitive patterns in which a pattern having a certain pitch is spatially repeated, and performs projection conversion on the acquired image. A conversion unit 125 is provided. The displacement measuring apparatus 10A includes a phase calculation unit 121 that calculates the phase of a moiré image obtained by interpolating a thinned image generated by thinning a repeated pattern at a predetermined thinning interval. Further, the displacement measuring apparatus 10A includes a displacement amount calculation unit 122 that calculates the displacement amount in the repetitive pattern based on the difference between the phase at the temporary point and the phase at another time point. In addition, the displacement measuring apparatus 10A includes a correction calculation processing unit 127 that subtracts the displacement amount of another repeating pattern from the displacement amount of one repeating pattern.
With this configuration, even when the distance from theimaging unit 20 to each measurement point is different, the pitches of the repetitive patterns installed at each measurement point represented in the captured image are equal. Conventionally, due to the difference in pitch shown in the image, there was an error in the amount of displacement in which one repetitive pattern was corrected based on the amount of displacement at the measurement point where another repetitive pattern was installed. The error is eliminated. Therefore, it is not necessary to install the imaging unit 20 at a position that can be approximated when the distances to the respective measurement points are equal, in order to measure the displacement amounts of a plurality of measurement points at a high accuracy at a time based on the captured images. Thus, the restrictions on the installation conditions of the imaging unit 20 are relaxed. In addition, in the conventional method, the displacement is analyzed with a different analysis parameter for each marker installed at each measurement point, but in this embodiment, the displacement can be analyzed with one analysis parameter. Therefore, the analysis time is greatly shortened, and the work related to the setting of analysis parameters is reduced.
この構成により、撮像部20から各測定点までの距離が異なる場合であっても、撮像された画像に表される各測定点に設置された繰り返し模様のピッチが等しくなる。従来、画像に表されたピッチの差異によって、他の繰り返し模様が設置された測定点における変位量を基準として補正された一つの繰り返し模様が設置された変位量の誤差が生じていたが、この誤差が解消される。そのため、撮像された画像に基づいて一度に複数の測定点の変位量を高い精度で測定するために、各測定点までの距離が等しいと近似できる位置に撮像部20を設置する必要がなくなる点で撮像部20の設置条件の制約が緩和される。加えて、従来法では、各測定点に設置されたマーカ毎に異なる解析パラメータで変位を解析していたが、本実施形態では1つの解析パラメータで変位を解析することができる。そのため、解析時間が大幅に短縮し、解析パラメータの設定に係る作業が軽減される。 As described above, the
With this configuration, even when the distance from the
上述した実施形態に係る変位測定システム1、1Aは、次のように変形して実施されてもよい。撮像部20と変位測定装置10、10Aとは有線または無線のネットワークで接続されてもよい。また、変位測定装置10、10Aには、処理対象の画像データを撮像部20以外の他の機器を介して入力されてもよい。変位測定装置10、10Aは、撮像部20と一体化した単一の装置として構成されてもよい。
変位測定装置10、10Aは、必ずしもパラメータ入力部11と表示部13と一体化されていなくてもよい。変位測定装置10、10Aにおいて、パラメータ入力部11と表示部13の一方または両方は省略されてもよい。 The displacement measurement systems 1 and 1A according to the above-described embodiment may be modified and implemented as follows. The imaging unit 20 and the displacement measuring devices 10 and 10A may be connected by a wired or wireless network. In addition, the image data to be processed may be input to the displacement measuring apparatuses 10 and 10A via a device other than the imaging unit 20. The displacement measuring devices 10 and 10A may be configured as a single device integrated with the imaging unit 20.
The displacement measuring devices 10 and 10A do not necessarily have to be integrated with the parameter input unit 11 and the display unit 13. In the displacement measuring devices 10 and 10A, one or both of the parameter input unit 11 and the display unit 13 may be omitted.
変位測定装置10、10Aは、必ずしもパラメータ入力部11と表示部13と一体化されていなくてもよい。変位測定装置10、10Aにおいて、パラメータ入力部11と表示部13の一方または両方は省略されてもよい。 The
The
また、第1の実施形態に係る変位測定装置10には、それぞれの時点において複数の繰り返し模様を表す部分画像を表す画像データとして、複数の撮像部20がそれぞれ取得した画像データを取得してもよい。例えば、変位測定システム1において、2台の撮像部20が用いられ、一方の撮像部20が一部のマーカとして図3に示すマーカMk21、Mk22を表す画像を撮像し、他の撮像部20が他の一部のマーカとしてマーカMk23、Mk24を表す画像を撮像してもよい。その場合、位相演算部121は、同じ時点に撮像された全てのマーカMk21~Mk24に係るモアレ画像の位相を算出すればよい。
Further, the displacement measuring device 10 according to the first embodiment may acquire image data acquired by the plurality of imaging units 20 as image data representing partial images representing a plurality of repetitive patterns at each time point. Good. For example, in the displacement measurement system 1, two image capturing units 20 are used, and one image capturing unit 20 captures an image representing the markers Mk21 and Mk22 illustrated in FIG. Images representing the markers Mk23 and Mk24 may be taken as other partial markers. In that case, the phase calculation unit 121 may calculate the phase of the moire image related to all the markers Mk21 to Mk24 imaged at the same time point.
上述した実施形態において、位相演算部121、補間処理部126は、画素毎の信号値として輝度値を用いる場合を例にしたが、これには限られない。位相演算部121、補間処理部126は、画素毎の信号値として色信号値、例えば、赤、緑、青など各色の信号値もしくは、それらの信号値の組を用いてもよい。
また、ピッチ演算部123がモアレ画像の位相勾配に基づいて繰り返し模様のピッチを算出する場合を例にしたが、これには限られない。ピッチ演算部123は、例えば、モアレ画像の画素毎の輝度値と、所定の方向に変位させたモアレ画像の画素毎の輝度値に基づいて自己相関を算出し、自己相関が最大となる変位量を、ピッチとして定めてもよい。また、ピッチ演算部123は、モアレ画像の画素毎の輝度値を画素間でフーリエ変換して得られる空間周波数毎のパワーが最大となる空間周波数に対応する波長をピッチとして定めてもよい。 In the above-described embodiment, thephase calculation unit 121 and the interpolation processing unit 126 have exemplified the case where the luminance value is used as the signal value for each pixel, but is not limited thereto. The phase calculation unit 121 and the interpolation processing unit 126 may use a color signal value as a signal value for each pixel, for example, a signal value of each color such as red, green, and blue, or a set of these signal values.
Moreover, although the case where thepitch calculation part 123 calculates the pitch of a repeating pattern based on the phase gradient of a moire image was made into an example, it is not restricted to this. For example, the pitch calculation unit 123 calculates the autocorrelation based on the luminance value for each pixel of the moire image and the luminance value for each pixel of the moire image displaced in a predetermined direction, and the amount of displacement that maximizes the autocorrelation. May be defined as a pitch. In addition, the pitch calculation unit 123 may determine a wavelength corresponding to a spatial frequency at which the power for each spatial frequency obtained by Fourier transforming the luminance value for each pixel of the moiré image between the pixels as a pitch.
また、ピッチ演算部123がモアレ画像の位相勾配に基づいて繰り返し模様のピッチを算出する場合を例にしたが、これには限られない。ピッチ演算部123は、例えば、モアレ画像の画素毎の輝度値と、所定の方向に変位させたモアレ画像の画素毎の輝度値に基づいて自己相関を算出し、自己相関が最大となる変位量を、ピッチとして定めてもよい。また、ピッチ演算部123は、モアレ画像の画素毎の輝度値を画素間でフーリエ変換して得られる空間周波数毎のパワーが最大となる空間周波数に対応する波長をピッチとして定めてもよい。 In the above-described embodiment, the
Moreover, although the case where the
また、上述した実施形態では、各測定点に設置されたマーカに表された模様のピッチがマーカ間で共通である場合を前提にしていたが、マーカ毎に異なっていてもよい。例えば、撮像部20からの距離が遠い測定点ほど、ピッチが大きくてもよい。その場合には、撮像部20からの距離が遠くなっても画像上に表される模様の周期が小さくならないので、撮像部20からの距離による測定精度の劣化を防止または緩和することができる。
その場合、補正演算処理部124は、各測定点における水平方向の変位Δxから、正規化ピッチ比Px,0・Px’/Px・Px,0’に基準測定点における変位Δx0を乗算して得られる補正量を差し引くことによって補正後の水平方向の変位Δx’を算出する。正規化ピッチ比は、式(12)に示すピッチ比Px,0/Pxに、さらに被写体上の基準観測点に表された模様のピッチPx,0’に対する被写体上の各測定点に表された模様のピッチPx’の比Px,0’/Px’で除算して算出される。基準観測点に表された模様のピッチPx,0’と各測定点に表された模様のピッチPx’は、予め補正演算処理部124に設定しておけばよい。これにより、被写体上に表された模様の測定間におけるピッチの差異が補償される。
また、補正演算処理部124、127から出力される測定点毎の変位量は、ある時点で撮像された画像に基づくその時点の変位量だけでもよいし、逐次に撮像された画像に基づく、それぞれの時点の変位量からなる時系列であってもよい。変位量の時系列は、各観測点における振動を表す。 In the above-described embodiment, it is assumed that the pitch of the pattern represented by the marker installed at each measurement point is common between the markers, but may be different for each marker. For example, the pitch may be larger as the measurement point is farther from theimaging unit 20. In that case, even if the distance from the imaging unit 20 increases, the period of the pattern shown on the image does not become small, so that deterioration in measurement accuracy due to the distance from the imaging unit 20 can be prevented or alleviated.
In that case, thecorrection processing unit 124, the horizontal displacement [Delta] x at each measurement point, the normalized pitch ratio P x, 0 · P x displacement [Delta] x 0 at the reference measurement point '/ P x · P x, 0' The corrected horizontal displacement Δx ′ is calculated by subtracting the correction amount obtained by multiplying. The normalized pitch ratio is the pitch ratio P x, 0 / P x shown in equation (12), and further at each measurement point on the subject with respect to the pitch P x, 0 ′ of the pattern shown on the reference observation point on the subject. It is calculated by dividing by the ratio P x, 0 '/ P x ' of the pitch P x 'of the represented pattern. Reference 'pitch P x of the pattern represented in each measurement point' pitch P x, 0 of the observation point in the represented pattern, it is sufficient to set in advance the correction processing unit 124. This compensates for the pitch difference between measurements of the pattern represented on the subject.
Further, the displacement amount for each measurement point output from the correction calculation processing units 124 and 127 may be only the displacement amount at that time point based on the image captured at a certain time point, or based on the sequentially imaged images, respectively. It may be a time series consisting of the displacement amount at the time of. The time series of the displacement amount represents vibration at each observation point.
その場合、補正演算処理部124は、各測定点における水平方向の変位Δxから、正規化ピッチ比Px,0・Px’/Px・Px,0’に基準測定点における変位Δx0を乗算して得られる補正量を差し引くことによって補正後の水平方向の変位Δx’を算出する。正規化ピッチ比は、式(12)に示すピッチ比Px,0/Pxに、さらに被写体上の基準観測点に表された模様のピッチPx,0’に対する被写体上の各測定点に表された模様のピッチPx’の比Px,0’/Px’で除算して算出される。基準観測点に表された模様のピッチPx,0’と各測定点に表された模様のピッチPx’は、予め補正演算処理部124に設定しておけばよい。これにより、被写体上に表された模様の測定間におけるピッチの差異が補償される。
また、補正演算処理部124、127から出力される測定点毎の変位量は、ある時点で撮像された画像に基づくその時点の変位量だけでもよいし、逐次に撮像された画像に基づく、それぞれの時点の変位量からなる時系列であってもよい。変位量の時系列は、各観測点における振動を表す。 In the above-described embodiment, it is assumed that the pitch of the pattern represented by the marker installed at each measurement point is common between the markers, but may be different for each marker. For example, the pitch may be larger as the measurement point is farther from the
In that case, the
Further, the displacement amount for each measurement point output from the correction
なお、上述した実施形態における変位測定装置10、10Aの一部、例えば、演算処理部12および演算処理部12Aをコンピュータで実現するようにしてもよい。その場合、この制御機能を実現するためのプログラムをコンピュータ読み取り可能な記録媒体に記録して、この記録媒体に記録されたプログラムをコンピュータシステムに読み込ませ、実行することによって実現してもよい。なお、ここでいう「コンピュータシステム」とは、変位測定装置10、10Aに内蔵されたコンピュータシステムであって、OSや周辺機器等のハードウェアを含むものとする。また、「コンピュータ読み取り可能な記録媒体」とは、フレキシブルディスク、光磁気ディスク、ROM、CD-ROM等の可搬媒体、コンピュータシステムに内蔵されるハードディスク等の記憶装置のことをいう。さらに「コンピュータ読み取り可能な記録媒体」とは、インターネット等のネットワークや電話回線等の通信回線を介してプログラムを送信する場合の通信線のように、短時間、動的にプログラムを保持するもの、その場合のサーバやクライアントとなるコンピュータシステム内部の揮発性メモリのように、一定時間プログラムを保持しているものも含んでもよい。また上記プログラムは、前述した機能の一部を実現するためのものであってもよく、さらに前述した機能をコンピュータシステムにすでに記録されているプログラムとの組み合わせで実現できるものであってもよい。
また、上述した実施形態における変位測定装置10、10Aの一部、または全部を、LSI(Large Scale Integration)等の集積回路として実現してもよい。変位測定装置10または変位測定装置10Aの各機能ブロックは個別にプロセッサ化してもよいし、一部、または全部を集積してプロセッサ化してもよい。また、集積回路化の手法はLSIに限らず専用回路、または汎用プロセッサで実現してもよい。また、半導体技術の進歩によりLSIに代替する集積回路化の技術が出現した場合、当該技術による集積回路を用いてもよい。 In addition, you may make it implement | achieve a part of displacement measuring apparatuses 10 and 10A in embodiment mentioned above, for example, the arithmetic processing part 12 and the arithmetic processing part 12A, with a computer. In that case, the program for realizing the control function may be recorded on a computer-readable recording medium, and the program recorded on the recording medium may be read by the computer system and executed. Here, the “computer system” is a computer system built in the displacement measuring apparatuses 10 and 10A and includes hardware such as an OS and peripheral devices. The “computer-readable recording medium” refers to a storage device such as a flexible medium, a magneto-optical disk, a portable medium such as a ROM or a CD-ROM, and a hard disk incorporated in a computer system. Furthermore, the “computer-readable recording medium” is a medium that dynamically holds a program for a short time, such as a communication line when transmitting a program via a network such as the Internet or a communication line such as a telephone line, In this case, a volatile memory inside a computer system that serves as a server or a client may be included that holds a program for a certain period of time. The program may be a program for realizing a part of the functions described above, and may be a program capable of realizing the functions described above in combination with a program already recorded in a computer system.
Moreover, you may implement | achieve part or all of the displacement measuring devices 10 and 10A in embodiment mentioned above as integrated circuits, such as LSI (Large Scale Integration). Each functional block of the displacement measuring apparatus 10 or the displacement measuring apparatus 10A may be individually made into a processor, or a part or all of them may be integrated into a processor. Further, the method of circuit integration is not limited to LSI, and may be realized by a dedicated circuit or a general-purpose processor. In addition, when an integrated circuit technology that replaces LSI appears due to the advancement of semiconductor technology, an integrated circuit based on the technology may be used.
また、上述した実施形態における変位測定装置10、10Aの一部、または全部を、LSI(Large Scale Integration)等の集積回路として実現してもよい。変位測定装置10または変位測定装置10Aの各機能ブロックは個別にプロセッサ化してもよいし、一部、または全部を集積してプロセッサ化してもよい。また、集積回路化の手法はLSIに限らず専用回路、または汎用プロセッサで実現してもよい。また、半導体技術の進歩によりLSIに代替する集積回路化の技術が出現した場合、当該技術による集積回路を用いてもよい。 In addition, you may make it implement | achieve a part of
Moreover, you may implement | achieve part or all of the
以上、図面を参照してこの発明の実施形態について詳しく説明してきたが、具体的な構成は上述のものに限られることはなく、この発明の要旨を逸脱しない範囲内において様々な設計変更等をすることが可能である。
The embodiments of the present invention have been described in detail above with reference to the drawings. However, the specific configuration is not limited to the above-described one, and various design changes and the like can be made without departing from the scope of the present invention. Is possible.
1、1A…変位測定システム、10、10A…変位測定装置、11…パラメータ入力部、12、12A…演算処理部、121…位相演算部、122…変位量演算部、123…ピッチ演算部、124、127…補正演算処理部、125…射影変換部、126…補間処理部、13…表示部、20…撮像部
DESCRIPTION OF SYMBOLS 1, 1A ... Displacement measuring system 10, 10A ... Displacement measuring apparatus, 11 ... Parameter input part, 12, 12A ... Arithmetic processing part, 121 ... Phase calculating part, 122 ... Displacement amount calculating part, 123 ... Pitch calculating part, 124 DESCRIPTION OF SYMBOLS 127 ... Correction calculation process part, 125 ... Projection conversion part, 126 ... Interpolation process part, 13 ... Display part, 20 ... Imaging part
Claims (6)
- 一定のピッチを有する模様が空間的に繰り返される2つ以上の繰り返し模様の画像を取得し、
前記繰り返し模様について、所定の間引き間隔で間引きして生成される間引き画像を補間して得られるモアレ画像の位相を算出する位相演算部と、
一時点における前記位相から他の時点における前記位相との差に基づいて前記繰り返し模様の変位量を算出する変位量演算部と、
一つの繰り返し模様の変位量から、他の繰り返し模様のピッチの前記一つの繰り返し模様のピッチに対するピッチ比を乗じた前記他の繰り返し模様の変位量を補正量として差し引く補正演算処理部と、
を備える変位測定装置。 Acquire images of two or more repeating patterns in which patterns with a certain pitch are spatially repeated,
For the repetitive pattern, a phase calculation unit that calculates the phase of a moire image obtained by interpolating a thinned image generated by thinning at a predetermined thinning interval;
A displacement amount calculation unit for calculating a displacement amount of the repetitive pattern based on a difference between the phase at one time point and the phase at another time point;
A correction calculation processing unit that subtracts, as a correction amount, a displacement amount of the other repetitive pattern obtained by multiplying a displacement amount of one repetitive pattern by a pitch ratio of the pitch of the other repetitive pattern to the pitch of the one repetitive pattern;
A displacement measuring device comprising: - 前記位相の勾配に基づいて前記繰り返し模様のピッチを算出するピッチ演算部、をさらに備える請求項1に記載の変位測定装置。 The displacement measuring device according to claim 1, further comprising a pitch calculation unit that calculates a pitch of the repetitive pattern based on the gradient of the phase.
- 前記位相に基づく前記他の繰り返し模様のピッチの前記位相に基づく前記一つの繰り返し模様のピッチに対するピッチ比を、被写体に表された前記他の繰り返し模様のピッチの前記被写体に表された前記一つの繰り返し模様のピッチに対するピッチ比で正規化した正規化ピッチ比を前記他の繰り返し模様の変位量に乗じて前記補正量を算出する請求項1または請求項2に記載の変位測定装置。 The pitch ratio of the pitch of the other repetitive pattern based on the phase to the pitch of the one repetitive pattern based on the phase is the one represented by the subject of the pitch of the other repetitive pattern represented on the subject. The displacement measuring device according to claim 1, wherein the correction amount is calculated by multiplying a displacement amount of the other repetitive pattern by a normalized pitch ratio normalized by a pitch ratio with respect to the pitch of the repetitive pattern.
- 一定のピッチを有する模様が空間的に繰り返される2つ以上の繰り返し模様を表す画像を取得し、
前記画像を射影変換する射影変換部と、
前記繰り返し模様について、所定の間引き間隔で間引きして生成される間引き画像を補間して得られるモアレ画像の位相を算出する位相演算部と、
一時点における前記位相から他の時点における前記位相との差に基づいて前記繰り返し模様における変位量を算出する変位量演算部と、
一つの繰り返し模様における変位量から、他の繰り返し模様の変位量を補正量として差し引く補正演算処理部と、
を備える変位測定装置。 Obtaining an image representing two or more repeating patterns in which a pattern having a certain pitch is spatially repeated;
A projective transformation unit for projective transformation of the image;
For the repetitive pattern, a phase calculation unit that calculates the phase of a moire image obtained by interpolating a thinned image generated by thinning at a predetermined thinning interval;
A displacement amount calculation unit for calculating a displacement amount in the repetitive pattern based on a difference between the phase at one time point and the phase at another time point;
A correction calculation processing unit that subtracts the displacement amount of another repeating pattern as a correction amount from the displacement amount of one repeating pattern;
A displacement measuring device comprising: - 変位測定装置における変位測定方法であって、
一定のピッチを有する模様が空間的に繰り返される2つ以上の繰り返し模様の画像を取得する画像取得ステップと、
前記繰り返し模様について、所定の間引き間隔で間引きして生成される間引き画像を補間して得られるモアレ画像の位相を算出する位相演算ステップと、
一時点における前記位相から他の時点における前記位相との差に基づいて前記繰り返し模様の変位量を算出する変位量演算ステップと、
一つの繰り返し模様の変位量から、他の繰り返し模様のピッチの前記一つの繰り返し模様のピッチに対するピッチ比を乗じた前記他の繰り返し模様の変位量を補正量として差し引く補正演算処理ステップと、
を有する変位測定方法。 A displacement measuring method in a displacement measuring device,
An image acquisition step of acquiring images of two or more repeated patterns in which patterns having a constant pitch are spatially repeated;
For the repetitive pattern, a phase calculation step for calculating a phase of a moire image obtained by interpolating a thinned image generated by thinning at a predetermined thinning interval;
A displacement amount calculating step for calculating a displacement amount of the repetitive pattern based on a difference between the phase at one time point and the phase at another time point;
A correction calculation processing step of subtracting, as a correction amount, a displacement amount of the other repetitive pattern obtained by multiplying a displacement amount of one repetitive pattern by a pitch ratio of the pitch of the other repetitive pattern to the pitch of the one repetitive pattern;
A displacement measuring method. - 変位測定装置のコンピュータに、
一定のピッチを有する模様が空間的に繰り返される2つ以上の繰り返し模様の画像を取得する画像取得手順、
前記繰り返し模様について、所定の間引き間隔で間引きして生成される間引き画像を補間して得られるモアレ画像の位相を算出する位相演算手順、
一つの時点における前記位相から他の時点における前記位相との差に基づいて前記繰り返し模様の変位量を算出する変位量演算手順、
一つの繰り返し模様の変位量から、他の繰り返し模様のピッチの前記一つの繰り返し模様のピッチに対するピッチ比を乗じた前記他の繰り返し模様の変位量を補正量として差し引く補正演算処理手順、
を実行させるためのプログラム。 In the computer of the displacement measuring device,
An image acquisition procedure for acquiring images of two or more repeated patterns in which a pattern having a certain pitch is spatially repeated;
A phase calculation procedure for calculating the phase of a moire image obtained by interpolating a thinned image generated by thinning at a predetermined thinning interval for the repetitive pattern,
A displacement amount calculation procedure for calculating a displacement amount of the repetitive pattern based on a difference between the phase at one time point and the phase at another time point;
A correction calculation processing procedure for subtracting, as a correction amount, the displacement amount of the other repeated pattern obtained by multiplying the displacement amount of one repeated pattern by the pitch ratio of the pitch of the other repeated pattern to the pitch of the one repeated pattern,
A program for running
Priority Applications (1)
| Application Number | Priority Date | Filing Date | Title |
|---|---|---|---|
| EP17750039.4A EP3425325B1 (en) | 2016-02-10 | 2017-01-18 | Displacement measurement device, displacement measurement method, and program for same |
Applications Claiming Priority (2)
| Application Number | Priority Date | Filing Date | Title |
|---|---|---|---|
| JP2016-024187 | 2016-02-10 | ||
| JP2016024187A JP6565037B2 (en) | 2016-02-10 | 2016-02-10 | Displacement measuring device, displacement measuring method and program thereof |
Publications (1)
| Publication Number | Publication Date |
|---|---|
| WO2017138314A1 true WO2017138314A1 (en) | 2017-08-17 |
Family
ID=59563144
Family Applications (1)
| Application Number | Title | Priority Date | Filing Date |
|---|---|---|---|
| PCT/JP2017/001503 WO2017138314A1 (en) | 2016-02-10 | 2017-01-18 | Displacement measurement device, displacement measurement method, and program for same |
Country Status (3)
| Country | Link |
|---|---|
| EP (1) | EP3425325B1 (en) |
| JP (1) | JP6565037B2 (en) |
| WO (1) | WO2017138314A1 (en) |
Cited By (2)
| Publication number | Priority date | Publication date | Assignee | Title |
|---|---|---|---|---|
| WO2019198534A1 (en) * | 2018-04-10 | 2019-10-17 | シャープ株式会社 | Vibration analysis device, control method for vibration analysis device, vibration analysis program, and recording medium |
| CN115808324A (en) * | 2023-01-30 | 2023-03-17 | 湖南东数交通科技有限公司 | Lightweight safety management monitoring method and system for small and medium-span bridges |
Families Citing this family (11)
| Publication number | Priority date | Publication date | Assignee | Title |
|---|---|---|---|---|
| JP6942341B2 (en) * | 2017-08-22 | 2021-09-29 | 国立研究開発法人産業技術総合研究所 | Wide measurement range deformation measurement method and its program |
| CN107860538B (en) * | 2017-12-25 | 2023-10-03 | 交通运输部公路科学研究所 | Detachable system widely applicable to multipoint dynamic deflection calibration and application thereof |
| US11178333B2 (en) | 2018-03-29 | 2021-11-16 | Nec Corporation | Vibration measurement system, vibration measurement apparatus, vibration measurement method, and computer-readable recording medium |
| JP6954451B2 (en) * | 2018-03-29 | 2021-10-27 | 日本電気株式会社 | Vibration measurement system, vibration measurement device, vibration measurement method, and program |
| JP7009346B2 (en) * | 2018-11-07 | 2022-01-25 | 鹿島建設株式会社 | Displacement measurement method and displacement measurement system |
| JP6762577B2 (en) * | 2019-01-09 | 2020-09-30 | ジェイアール西日本コンサルタンツ株式会社 | Displacement measurement system |
| JP7177441B2 (en) * | 2019-02-25 | 2022-11-24 | 国立研究開発法人産業技術総合研究所 | Weight measuring device, weight measuring system, weight measuring method and its program |
| WO2020183549A1 (en) | 2019-03-08 | 2020-09-17 | 日本電気株式会社 | Structure bending measurement device |
| JPWO2020194539A1 (en) * | 2019-03-26 | 2020-10-01 | ||
| JP7276239B2 (en) * | 2020-04-24 | 2023-05-18 | 株式会社島津製作所 | Strain distribution measuring device and strain distribution measuring method |
| JP7315936B2 (en) * | 2021-04-09 | 2023-07-27 | 株式会社共和電業 | Displacement measurement method, displacement measurement device, displacement measurement system, and displacement measurement program |
Citations (4)
| Publication number | Priority date | Publication date | Assignee | Title |
|---|---|---|---|---|
| JP2006061222A (en) * | 2004-08-24 | 2006-03-09 | Sumitomo Osaka Cement Co Ltd | Motion detector |
| JP2006329628A (en) * | 2005-05-23 | 2006-12-07 | Hitachi Zosen Corp | Measuring method of deformation amount in structure |
| WO2015008404A1 (en) * | 2013-07-18 | 2015-01-22 | 独立行政法人産業技術総合研究所 | Method and device for measuring displacement distribution using regular pattern, and program for such method and device |
| JP2015141151A (en) * | 2014-01-30 | 2015-08-03 | 国立大学法人 和歌山大学 | Measurement apparatus and bridge inspection method |
Family Cites Families (2)
| Publication number | Priority date | Publication date | Assignee | Title |
|---|---|---|---|---|
| JP4831703B2 (en) * | 2008-04-23 | 2011-12-07 | 国立大学法人 和歌山大学 | Object displacement measurement method |
| JP6072425B2 (en) * | 2012-04-13 | 2017-02-01 | 藤垣 元治 | Three-dimensional displacement measuring device |
-
2016
- 2016-02-10 JP JP2016024187A patent/JP6565037B2/en active Active
-
2017
- 2017-01-18 WO PCT/JP2017/001503 patent/WO2017138314A1/en active Application Filing
- 2017-01-18 EP EP17750039.4A patent/EP3425325B1/en active Active
Patent Citations (4)
| Publication number | Priority date | Publication date | Assignee | Title |
|---|---|---|---|---|
| JP2006061222A (en) * | 2004-08-24 | 2006-03-09 | Sumitomo Osaka Cement Co Ltd | Motion detector |
| JP2006329628A (en) * | 2005-05-23 | 2006-12-07 | Hitachi Zosen Corp | Measuring method of deformation amount in structure |
| WO2015008404A1 (en) * | 2013-07-18 | 2015-01-22 | 独立行政法人産業技術総合研究所 | Method and device for measuring displacement distribution using regular pattern, and program for such method and device |
| JP2015141151A (en) * | 2014-01-30 | 2015-08-03 | 国立大学法人 和歌山大学 | Measurement apparatus and bridge inspection method |
Non-Patent Citations (1)
| Title |
|---|
| See also references of EP3425325A4 * |
Cited By (3)
| Publication number | Priority date | Publication date | Assignee | Title |
|---|---|---|---|---|
| WO2019198534A1 (en) * | 2018-04-10 | 2019-10-17 | シャープ株式会社 | Vibration analysis device, control method for vibration analysis device, vibration analysis program, and recording medium |
| JPWO2019198534A1 (en) * | 2018-04-10 | 2021-04-08 | シャープ株式会社 | Vibration analysis device, control method of vibration analysis device, vibration analysis program and recording medium |
| CN115808324A (en) * | 2023-01-30 | 2023-03-17 | 湖南东数交通科技有限公司 | Lightweight safety management monitoring method and system for small and medium-span bridges |
Also Published As
| Publication number | Publication date |
|---|---|
| EP3425325A1 (en) | 2019-01-09 |
| JP6565037B2 (en) | 2019-08-28 |
| JP2017142185A (en) | 2017-08-17 |
| EP3425325A4 (en) | 2020-01-08 |
| EP3425325B1 (en) | 2022-09-07 |
Similar Documents
| Publication | Publication Date | Title |
|---|---|---|
| JP6565037B2 (en) | Displacement measuring device, displacement measuring method and program thereof | |
| JP4917351B2 (en) | Calibration method in three-dimensional shape measuring apparatus | |
| JP6323929B2 (en) | Measuring device and bridge inspection method | |
| JP4831703B2 (en) | Object displacement measurement method | |
| US10551177B2 (en) | Apparatus and method for measuring 3D form or deformation of an object surface using a grid pattern and reference plane | |
| JP2008185375A (en) | 3d shape calculation device of sar image, and distortion correction device of sar image | |
| JP4872836B2 (en) | Information processing system | |
| JP2011133341A (en) | Displacement measuring device, displacement measuring method, and displacement measuring program | |
| JPWO2021044628A1 (en) | Deformity detection system and deformation detection method | |
| JP5466325B1 (en) | Method to measure physical quantity of object from image of grid attached to object | |
| JP2006343160A (en) | Displacement amount measuring method and stress measuring method in structure using picked up image | |
| JP6533914B2 (en) | Computer readable recording medium recording measurement method, measurement device, measurement program and measurement program | |
| JP2015152535A (en) | Phase analysis method of lattice image using weighting | |
| JP6666670B2 (en) | 3D shape measurement method using curved surface as reference surface | |
| JP6923915B2 (en) | A computer-readable recording medium that records measurement methods, measuring devices, and measurement programs that can simultaneously acquire the three-dimensional shape of a color object and color information. | |
| JP2022536614A (en) | Method and system for optically measuring objects with specular and/or partially specular reflective surfaces and corresponding measurement apparatus | |
| JP5206499B2 (en) | Measuring method, measuring device, measurement control program | |
| JP7177441B2 (en) | Weight measuring device, weight measuring system, weight measuring method and its program | |
| JP6982336B2 (en) | Measurement method, computer program and measurement system | |
| JP2020165893A (en) | Displacement measurement device, displacement measurement method, and program | |
| JP7011093B1 (en) | Displacement measuring device and displacement measuring method | |
| WO2024023935A1 (en) | Estimation device, estimation system, estimation method, and program | |
| JPH03222102A (en) | Method for measuring displacement of track and device for measuring displacement | |
| JP2004361151A (en) | Support curve measuring method and support curve measuring system | |
| JP2022038917A (en) | Vehicle weight measuring device and vehicle weight measuring method |
Legal Events
| Date | Code | Title | Description |
|---|---|---|---|
| 121 | Ep: the epo has been informed by wipo that ep was designated in this application |
Ref document number: 17750039 Country of ref document: EP Kind code of ref document: A1 |
|
| NENP | Non-entry into the national phase |
Ref country code: DE |
|
| WWE | Wipo information: entry into national phase |
Ref document number: 2017750039 Country of ref document: EP |
|
| ENP | Entry into the national phase |
Ref document number: 2017750039 Country of ref document: EP Effective date: 20180910 |