WO2017104264A1 - 事業性分析装置 - Google Patents
事業性分析装置 Download PDFInfo
- Publication number
- WO2017104264A1 WO2017104264A1 PCT/JP2016/081354 JP2016081354W WO2017104264A1 WO 2017104264 A1 WO2017104264 A1 WO 2017104264A1 JP 2016081354 W JP2016081354 W JP 2016081354W WO 2017104264 A1 WO2017104264 A1 WO 2017104264A1
- Authority
- WO
- WIPO (PCT)
- Prior art keywords
- variable
- value
- variables
- designated
- description file
- Prior art date
- Legal status (The legal status is an assumption and is not a legal conclusion. Google has not performed a legal analysis and makes no representation as to the accuracy of the status listed.)
- Ceased
Links
Images


Classifications
-
- G—PHYSICS
- G06—COMPUTING OR CALCULATING; COUNTING
- G06Q—INFORMATION AND COMMUNICATION TECHNOLOGY [ICT] SPECIALLY ADAPTED FOR ADMINISTRATIVE, COMMERCIAL, FINANCIAL, MANAGERIAL OR SUPERVISORY PURPOSES; SYSTEMS OR METHODS SPECIALLY ADAPTED FOR ADMINISTRATIVE, COMMERCIAL, FINANCIAL, MANAGERIAL OR SUPERVISORY PURPOSES, NOT OTHERWISE PROVIDED FOR
- G06Q10/00—Administration; Management
- G06Q10/06—Resources, workflows, human or project management; Enterprise or organisation planning; Enterprise or organisation modelling
Definitions
- the present invention relates to a business analysis device.
- ⁇ Prior to executing a business, the company naturally anticipates and evaluates the profitability of the business.
- As a general evaluation method there is a method of setting a plurality of preconditions such as income, expenditure, depreciation, interest expense, tax, etc. and calculating a management index such as a cumulative profit for each precondition.
- a typical example of a business is a project. In the project, the investment is made in the first period, and the investment amount is recovered by the profits continuously recorded over the subsequent periods.
- the cash flow prediction apparatus of Patent Document 1 calculates a predicted value such as a future tax rate, a borrowing interest rate, and a rent fluctuation rate from past values such as a tax rate, a borrowing interest rate, and a rent fluctuation rate. Then, a predicted value is obtained at random from each of the tax rate, the borrowing interest rate, the rent fluctuation rate, and the like. Furthermore, the predicted value acquired with respect to the calculation formula of the scenario component selected by the user is input, and the predicted cash flow of each future period is calculated. At this time, the cash flow prediction apparatus outputs the predicted cash flow as a probability distribution.
- the business evaluation device of Patent Document 2 stores a balance structure description file.
- the balance structure description file stores a calculation formula indicating the balance structure of the project and a premise value input to the calculation formula.
- the premise value is defined by, for example, a discrete probability distribution type.
- the business feasibility evaluation apparatus of Patent Document 2 reads a balance structure description file and displays, for example, future income and balance in a probability distribution format.
- JP 2004-38804 A Japanese Patent Laying-Open No. 2015-32023
- variable costs For example, sales, variable costs, and fixed costs are assumed as items that affect profits. Companies attach importance to sensitivity analysis of how much profit increases or decreases as a result of increasing or decreasing each item. For example, if variable costs have the greatest impact on profits, an entity will first consider reducing variable costs in preference to increasing sales and decreasing fixed costs. Spider and tornado charts are often used for such sensitivity analysis. Furthermore, a goal seek method is often used in which a target value for profit is set first and a combination of sales, variable costs, and fixed costs for realizing the target value is calculated backward.
- the cash flow prediction apparatus of Patent Document 1 and the business feasibility evaluation apparatus of Patent Document 2 can simulate values such as profits after changing the premise, but perform sensitivity analysis and goal seeking. Requires a separate policy.
- a balance structure description file for example, when trying to analyze the sensitivity to profits, or to seek a goal that targets a certain profit level, first create the input conditions on a spreadsheet and then input the input conditions to the sensitivity analysis application. Will be passed. Creating input conditions on this spreadsheet software requires experience and effort. Therefore, an object of the business analysis device of the present invention is to perform sensitivity analysis and goal seeking without taking time and effort based on a balance structure description file.
- the business analysis device of the present invention stores a balance structure description file.
- the business analysis device accepts that the user designates a cause variable and a result variable from among variables included in the balance structure description file. Then, the business feasibility analysis apparatus regards other variables as fixed variables and displays a graphic indicating the relationship between the cause variable and the result variable.
- the business analysis device accepts that the user designates a target variable, a searched variable, and a constraint variable from among variables included in the balance structure description file. Then, the business feasibility analysis apparatus regards other variables as fixed variables, and calculates a search target variable for the target variable to take a target value.
- Other means will be described in the embodiment for carrying out the invention.
- (A), (b) and (c) is a figure explaining the sensitivity analysis by a comparative example. It is a figure explaining the goal seek by a comparative example. It is a block diagram of business property analyzer. It is a figure which shows the balance structure description file. It is a figure which shows a part of balance structure description file. It is a figure which shows the spider chart (table type
- the slope of the line graph shows the effect of sales, fixed costs and variable costs on profits.
- the point with the largest profit value on the vertical axis corresponds to the case where the variable cost is reduced by 20% compared to the standard case.
- the point with the smallest profit value on the vertical axis corresponds to the case where the variable cost increased by 20% compared to the standard case. In other words, variable costs have the largest impact on profits.
- the horizontal axis of FIG.1 (b) has shown the fluctuation rate.
- the horizontal width of the band graph shows the effect of sales, fixed costs and variable costs on profits.
- the profit fluctuates in the range of 2.6 million yen to 7,400,000 yen.
- the horizontal width of the variable cost band graph is the largest. In other words, variable costs have the largest impact on profits.
- the minimum value of variable costs of 9.6 million yen corresponds to the maximum value of profit of 7.4 million yen.
- the maximum variable cost of 14.4 million yen corresponds to the minimum profit of 2.6 million yen.
- the profit may take a minimum value or a maximum value.
- the maximum value of profit is larger than 7,400,000 yen, or when the minimum value of profit is smaller than 2.6 million yen, the value that can be read as the maximum value or the minimum value of profit in FIG.
- the process of determining the fluctuation range of profit and the process of arranging items such as sales in the order of the large fluctuation range are not easy, and need to be defined and set by the user.
- FIG. 2 is an example in which the physique index application of the comparative example calculates the physique index (BMI, Body Mass Index).
- BMI is a value obtained by dividing weight (kg) by the square of height (m).
- m height
- a common ideal BMI is given to all employees in a certain workplace.
- Employee heights vary from person to person and do not change easily.
- employee weight can vary considerably depending on individual efforts. Therefore, the weight that achieves the ideal value of BMI is calculated for each employee while maintaining the current height.
- FIG. 2 The operation of FIG. 2 for the user (physician etc.) of the physique index application is as follows. (1) “23.07” is input to the cell B6 as an ideal value. (2) The height “153” of an employee is entered into cell B3. (3) The physique index application reversely calculates the weight, visually recognizes that the reverse calculation result “54” is displayed in the cell B4, and stores the reverse calculation result as necessary. (4) The processes (2) and (3) are repeated for all employees.
- the business analysis device 1 is a general computer.
- the business analysis device 1 includes a central control device 11, an input device 12 such as a keyboard and a mouse, an output device 13 such as a display, a main storage device 14, and an auxiliary storage device 15. These are connected to each other by a bus.
- the designation receiving unit 21, the calculation unit 22, and the display control unit 23 in the main storage device 14 are programs. Thereafter, when the subject is described as “XX section”, the central control device 11 reads out each program from the auxiliary storage device 15 and loads it into the main storage device 14, and then the function of each program (detailed later). Shall be realized.
- the auxiliary storage device 15 stores a balance structure description file 31.
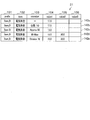
- the balance structure description file 31 will be described with reference to FIG.
- items are stored in the item column 102
- the operator column 103 is an operator
- the value 1 column 104 is a value 1
- the value 2 column 105 is associated with the category stored in the prefix column 101.
- Stores the value 2 and the value3 column 106 stores the value 3.
- the division of the prefix column 101 is “Item B” in any line.
- the name of the project is stored in the item column 102 of the line whose classification is “ProjectName”. What is important in the present embodiment is a line whose category is “Item B”, and “Item B” means “definition”. Definitions include defining formulas for calculating item values, specifying item values themselves, specifying probability distributions of item values by parameters, defining annual rate of change of item values, etc. (Details below). Each line in FIG. 4 will be described by dividing it into the following types 1 to 6.
- Rows 131, 133, 137, 140, 141, 144, 148 and 152 in FIG. 4 define calculation formulas related to four arithmetic operations.
- Lines 132 and 156 define calculation formulas related to operations other than the four arithmetic operations.
- Line 132 defines that an IRR (Internal Rate of Return) is calculated in a predetermined manner based on the investment amount and the profit (before depreciation).
- IRR Internal Rate of Return
- the project period is “m years”
- Formula 1 showing the relationship of cash flow in each period is defined as follows.
- the IRR is calculated by solving an equation with “r” in Equation 1 as an unknown.
- r (0 ⁇ r) is a discount rate.
- C 0 + C 1 / (1 + r) + C 2 / (1 + r) 2 + ⁇ + C m / (1 + r) m 0 ( Equation 1)
- C 0 corresponds to the initial investment amount. Since the investment amount is an amount that flows out of the company as cash, C0 is always a negative value.
- Equation 1 means the current monetary value of the cash flow generated over all periods of the project period, and is appropriate as the project evaluation value at the present time. This value is called the net present value.
- IRR is a discount rate r that satisfies Equation 1, that is, the net present value is “0”. The greater the IRR, the greater the value as an investment.
- Line 156 defines that depreciation expenses are calculated by a predetermined method based on the investment amount and the depreciation period.
- a result obtained by subtracting a predetermined remaining book value from an investment amount is a depreciable amount
- a value obtained by dividing the depreciable amount by the number of years of depreciation is a depreciation expense for each period (straight line method).
- the amount of depreciation or the book value at the end of the previous period multiplied by a predetermined depreciation rate determined for each period can be used as the depreciation expense for each period (declining balance method).
- the remaining book value may be “0”. “Depreciation1” indicates that the depreciation expense for each period is calculated by the straight-line method, and “Depreciation2” indicates that the depreciation expense for each period is calculated by the declining balance method.
- Type 4 Method to define item values with continuous probability distribution
- a probability distribution of the input value is generally used. For example, assuming that an input value has a normal distribution, it is often performed to specify a specific shape of the distribution with two parameters of an average value and a variance.
- sales price may be described in the item column 102
- distributed 10 may be described in the operator column 103
- 100 may be described in the value1 column 104.
- the row indicates that the selling price is a continuous probability distribution specified by two parameters of an average value “100” and a variance “10”.
- Type 5 Method for defining item values with a discrete probability distribution
- the row 134 indicates that the sales price is a discrete probability distribution specified by two parameters of an average value “10,000” and an accuracy “90%”.
- the value of the sales price “9,000” occurs with a probability of “5%”
- “10,000” occurs with a probability of “90%”
- “11” , 000 will occur with a probability of" 5% ".
- a row 136 in FIG. 4 indicates that the sales price value in a certain period is a value obtained by multiplying the sales price value in the immediately preceding period by the rate of change “1.05”.
- the above description of the selling price applies to the rows 143, 151 and 155 as well.
- the balance structure description file 31 is a mathematical model as an n-ary simultaneous equation that defines the quantitative correlation between n types of variables. This mathematical model can be simplified and expressed as Equation 2. The variable is synonymous with the item in the balance structure description file 31.
- F (x 1 , x 2 , x 3 ,..., X n ) 0 (Formula 2)
- x 1 profit
- x 2 sales
- x 3 fixed cost.
- the variables in Equation 2 are classified into three categories.
- the variable of the first category is a variable to which a specific value significant for the user is substituted among variables to be analyzed for the user.
- the variable of the second category is a variable that is not subject to analysis for the user, and is a variable into which a standard value is temporarily assigned.
- the variable of the third category is a variable other than the variable of the first category among the variables to be analyzed for the user. As a result, the value of the variable is calculated.
- business analysis apparatus 1 detects that the x 3 and x 4 is not specified, without being aware of the particular user, provisionally assigning the appropriate values to x 3 and x 4. That is x 1 variable of the first category, x 2 is the variable of the third category, x 3 and x 4 is a variable of the second category.
- x 1 variable of the first category x 2 is the variable of the third category
- x 3 and x 4 is a variable of the second category.
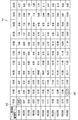
- the row 142 for electricity charges in FIG. 4 is an aggregate of the rows 142a to 142e in FIG.
- items other than 142c are not displayed.
- the rows 142a, 142b, and 142c are also described in Patent Document 2 and will not be described in detail here, but they correspond to the above-described # 1, # 2, and # 3, respectively.
- the row 142d indicates that the electricity charge as a variable is composed of a minimum value “15.0” and a maximum value “20.0”.
- the row 142e shows a total of 11 discrete values generated as a result of dividing the variable electricity rate by dividing the range from the minimum value “15.0” to the maximum value “20.0” 10 times by an equal length. It shows that it is composed. That is, when the user designates the row 142d, the business analysis device 1 generates “15.0” and “20.0” as the value of the electricity bill. When the user designates row 142e, business feasibility analysis apparatus 1 generates eleven discrete values of “15.0, 15.5, 16.0,. To do.
- the value assigned to the electricity charge is “17.5” (one fixed value) defined in the row 142a.
- the business feasibility analysis apparatus 1 generates two values based on, for example, the row 142d, substitutes each value into the electricity bill, and calculates two values of the variable of the third category as each result. Also good. Further, the business feasibility analysis apparatus 1 generates 11 values based on, for example, the row 142e, substitutes each value into the electricity bill, and calculates 11 values of variables of the third category as the respective results. May be.
- the user can specify a variable (for example, x 1 ) as the variable of the first category, and separately specify a variable (for example, x 2 ) whose value changes within a certain range.
- business analysis apparatus 1 under the constraint that varies the extent to which there is x 2, may be the value of the third category of variables calculated plurality of ways. In this case, operations of the analyzer 1, it is desirable to produce in accordance with the value of x 2 in the definition of # 4 or # 5.
- the user may designate two variables (for example, x 1 and x 2 ) whose values change within a certain range as variables of the first category.
- operations of the analyzer 1 it is desirable to produce in accordance with the values of x 1 and x 2 in the definition of # 4 or # 5.
- the value of x 1 is 11 produced as defined in # 5
- the value of x 2 is 11 produced as defined in # 5
- the combination of the first category of variable, 11 ⁇ 11 121 kinds Generated.
- business feasibility analysis apparatus 1 can calculate 121 values of variables of the third category.
- the diagrams used for sensitivity analysis of this embodiment are spider charts 41 (FIG. 6) and 45 (FIG. 7), and tornado charts 51 (FIG. 8) and 55 (FIG. 9).
- the spider chart (table type) 41 will be described with reference to FIG.
- the spider chart 41 is, for example, a matrix of 11 rows and 11 columns as a whole.
- the balance structure description file 31 can define five values of electricity charges (lines 142a to 142e in FIG. 5).
- the business analysis device 1 creates a scale on the vertical axis in FIG.
- the business analysis device 1 regards all the variables in the balance structure description file 31 other than the electricity bill, the selling price, and the IRR as variables of the second category.
- the business feasibility analysis apparatus 1 stores 121 IRR values in the cell at the intersection of the horizontal axis and the vertical axis in FIG. 6, and displays FIG.
- “9.62” of the cell 42 indicates that the business feasibility analysis apparatus 1 substitutes “15.00” for the electricity bill, substitutes “95,000” for the sales price, and sets other variables other than IRR. It is the value of IRR calculated by substituting the representative value.
- FIG. 7 displays essentially the same information as FIG.
- Electricity charges on the horizontal axis are variables specified in the first category.
- the scale on the horizontal axis is eleven discrete values.
- the IRR on the vertical axis is a variable designated in the third category.
- the scale on the vertical axis looks like a discrete value at first glance, but it is a scale at an arbitrary interval.
- the line graphs 46a, 46b, 46c,..., 46k on the coordinate plane respectively correspond to 11 discrete values of the sales price (the line graph 46a corresponds to the largest sales price). For example, point 47 in FIG.
- FIG. 7 corresponds to the case where the electricity rate is “15.5” and the selling price is “105,000” (cell 43 in FIG. 6).
- FIG. 7 shows a total of 121 dots. All these points have any of the eleven discrete values of the electricity bill as the horizontal coordinate values and are on any of the eleven line graphs.
- FIG. 7 The user who visually recognizes FIG. 7 can easily understand the following. -When other conditions are constant, the IRR decreases monotonously if the electricity bill increases. ⁇ If other conditions are constant, the IRR increases monotonically if the selling price increases. -Regardless of the level of sales price, the sensitivity of electricity charges to IRR (the slope of the line graph) is almost the same. -Regardless of the level of electricity charges, the sensitivity of selling price to IRR (interval on the vertical axis of the line graph) is almost the same.
- the line graph has a vertex on “17.00” on the horizontal axis. A shape like a convex quadratic curve is shown. As another example, if the IRR has a maximum value when the sales price is “100,000”, a line graph corresponding to the sales price “100,000” is displayed at the top position.
- the variable column 111 of the first category and the variable column 112 of the third category are displayed in association with each other.
- the variable column 111 of the first category includes an item column 111a, a minimum value column 111b, a maximum value column 111c, and a flag column 111d as small columns.
- the variable column 112 of the third category has an item column 112a, a minimum value column 112b, a maximum value column 112c, and a difference column 112d as small columns.
- variables designated by the user as the first category are displayed. This variable varies from line to line.
- the item column 112a stores a variable designated by the user as the third category. This variable is the same for all rows (“IRR” in FIG. 8).
- the user designates the sales volume as a variable of the first category.
- the balance structure description file 31 defines that the minimum value of sales volume is “21,000” and the maximum value of sales volume is “39,000” (definition method of # 4).
- the user has specified IRR as a third category variable.
- the business analysis device 1 calculates the IRR by substituting the minimum value “21,000” for the sales volume and substituting the representative values for variables other than the IRR and the sales volume. As a result, the IRR became the minimum value “ ⁇ 0.49”.
- the business analysis device 1 calculates the IRR by substituting the maximum value “39,000” for the sales volume and substituting the representative values for variables other than the IRR and the sales volume. As a result, the IRR was the maximum value “18.88”. The difference obtained by subtracting the minimum value from the maximum value of IRR is “19.37”. The minimum value of the sales volume corresponds to the minimum value of the IRR, and the maximum value of the sales volume corresponds to the maximum value of the IRR (“ ⁇ ” in the flag column 111d indicates this large / small correspondence).
- the user designates the electricity price as a variable of the first category.
- the balance structure description file 31 defines that the minimum value of electricity charges is “15.0” and the maximum value of electricity charges is “20.0” (definition method of # 4).
- the user has specified IRR as a third category variable.
- the business analysis device 1 calculates the IRR by substituting the minimum value “15.0” into the electricity bill and substituting the respective representative values into variables other than the IRR and electricity bill. As a result, the IRR was the maximum value “11.37”.
- the business feasibility analysis apparatus 1 calculates the IRR by substituting the maximum value “20.0” into the electricity bill and substituting the representative values into variables other than the IRR and electricity bill. As a result, the IRR became the minimum value “8.11”. The difference obtained by subtracting the minimum value from the maximum value of IRR is “3.26”. The minimum value of the electricity charge corresponds to the maximum value of the IRR, and the maximum value of the electricity charge corresponds to the minimum value of the IRR (“ ⁇ ” in the flag column 111d indicates this large / small correspondence).
- the tornado chart (graph type) 55 of the present embodiment will be described.
- the horizontal axis of the tornado chart 55 is the IRR specified in the third category.
- the vertical axis of the tornado chart 55 does not correspond to any variable.
- the band graph of the variable is displayed at a position above the vertical axis as the difference is large. In other words, it looks like a tornado.
- FIG. 8 illustrates an example in which the business feasibility analysis apparatus 1 specifies # 4 from the user as the definition of the variable of the first category.
- the business analysis device 1 calculates the value of the third category variable for each discrete value of the first category variable. Then, it can be seen whether or not the variable of the third category has a maximum value and / or a minimum value between the maximum value and the minimum value.
- the business analysis device 1 may add “ ⁇ ” and / or “ ⁇ ” to the band graph (FIG. 9) indicating the variable of the first category, respectively. .
- IRR a specific target value (for example, “10.0%”) is required by, for example, a funder. Therefore, IRR is designated as a variable of the first category.
- target variable the variable specified here.
- electricity charges and parts prices are also important variables.
- the variable specified here is called a “constraint variable”.
- the sales price is designated as a variable of the third category.
- the variable designated here is called “searched variable”.
- Other variables are not important for the time being (not subject to analysis). Therefore, other variables may be regarded as variables in the second category. This variable is called “fixed variable”.
- the goal seek chart (graph / table type) 61 of this embodiment will be described with reference to FIG. Pay attention to the input field 62.
- IRR is specified in the variable column 63a of the row 64a for the target variable.
- the sales price is specified in the variable column 63a of the row 64b for the search target variable.
- Electricity charges are specified in the variable column 63a of the row 64c for the constraint variable 1.
- the part price is specified.
- the definition method column 63b and the variable value column 63c in the row 64b are blank. This indicates that the user is waiting for the output of the “sales price” value as a result of calculation by the business analysis device 1.
- “# 5” is displayed in the definition method column 63b of the row 64c, and “from 15.0 to 20.0 (10)” is displayed in the variable value column 63c.
- “Electricity” is displayed in the item column 102
- “Division 10” is displayed in the operator column 103
- “15.0” is displayed in the value1 column 104
- the output column 66 in FIG. 10 shows the result of the business analysis device 1 executing the processes (1) to (7).
- the output column 66 includes a variable column 67a and a variable value combination column 67b, and the variable value combination column 67b includes eleven columns. “10.0%” is displayed in all the columns of the row 68a. In each column of the row 68c, a discrete value of the electricity rate is displayed. Similarly, a discrete value of the part price is displayed in each column of the row 68d.
- the value of the sales price displayed in the row 68b is a calculation result of the business analysis device 1.
- variable value combination column 67b should display a total of 121 columns. In FIG. 10, eleven columns are displayed for simplicity.
- Graph 70 shows the electricity charge on the horizontal axis and the sales price on the vertical axis. 11 line graphs 71 are displayed for each part price. That is, the graph 70 two-dimensionally displays the values (ternary combinations) of the lines 68b, 68c, and 68d of the output column 66.
- the goal seek chart (graph / table type) 75 of this embodiment will be described with reference to FIG. 11 differs from FIG. 10 as follows.
- the row 64d of the input field 62 is blank. That is, the user does not designate “part price” as any of the target variable, the searched variable, and the constraint variable. Accordingly, the business analysis device 1 regards “part price” as a fixed variable like many other variables, and substitutes a representative value.
- the output column 66 does not have a line corresponding to the line 68d in FIG.
- the number of line graphs displayed in the graph column 70 is only one. This one corresponds to a predetermined representative value of the part price.
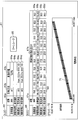
- the goal seek chart (table type) 81 will be described with reference to FIG.
- “all” is displayed in the variable column 63a of the row 64b of the input column 62, and the rows 64c and 64d are blank. That is, the user designates all variables other than IRR as search target variables.
- the business feasibility analysis apparatus 1 acquires values one by one from the created group and sets them as combinations of search target variables. Further, the business analysis device 1 calculates the IRR value by substituting the combination value into the search target variable of the balance structure description file 31, and arranges the combinations in the order close to “10.0%” (output) Column 82). Note that “10.0%” is arranged in the row 83 of the output column 82 in FIG. 12, but even if the value is not “10.0%”, it is rounded off and displayed in this way.
- a balance structure description file 31 (FIG. 4) is stored in the auxiliary storage device 15 in a completed state.
- the designation receiving unit 21 of the business analysis device 1 reads the balance structure description file 31. Specifically, the designation receiving unit 21 reads the balance structure description file 31 from the auxiliary storage device 15 and loads it into the main storage device 14.
- the designation receiving unit 21 of the business feasibility analyzer 1 receives a chart type. Specifically, the designation accepting unit 21 accepts that the user inputs one of “spider chart”, “tornado chart”, and “goal seek chart” via the input device 12.
- step S203 the designation receiving unit 21 determines whether or not the received chart is a spider chart. Specifically, the designation receiving unit 21 proceeds to step S204 if the type of the chart received in step S202 is “spider chart” (step S203 “Yes”), and otherwise (step S203 “No”). ), The process proceeds to step S213.
- the designation receiving unit 21 of the business feasibility analyzer 1 accepts designation of a cause variable and a result variable. Specifically, the designation accepting unit 21 accepts that the user designates a plurality of cause variables and designates a result variable via the input device 12.
- the causal variable is a variable that can take a value within a certain range among the variables (items) in the balance structure description file 31, and corresponds to a variable of the first category.
- the result variable is a variable whose value changes when the value of the cause variable changes among the variables (items) in the balance structure description file 31 and corresponds to a variable of the third category.
- the designation receiving unit 21 displays the balance structure description file 31 (FIGS. 4 and 5) on the output device 13, and accepts the user selecting an arbitrary line, thereby specifying the cause variable and the result variable. It may be accepted.
- the user designates “electricity charge” and “sales price” as cause variables and designates “IRR” as a result variable.
- the user wants to examine how much the IRR changes as the value of the electricity price and the value of the selling price change (sensitivity analysis).
- step S205 the designation receiving unit 21 receives the range of the cause variable. Specifically, first, the designation receiving unit 21 highlights a line in which “electricity rate” is stored in the item column 102 among the lines of the balance structure description file 31. The rows highlighted here include, for example, the rows 142a to 142e in FIG. Secondly, the designation receiving unit 21 receives that the user designates a certain line among the highlighted lines. Now, assume that the user designates row 142e in FIG. The user often desires to use a plurality of discrete values as the value of the electricity bill. Therefore, the designation receiving unit 21 may display the line 142e (“Division” is stored in the operator column 103) by default in a form that is distinguished from other lines.
- the designation receiving unit 21 generates a discrete value of the variable of the row designated in “second” in step S205. In the above example, the designation receiving unit 21 generates eleven discrete values “15.0, 15.5, 16.0,. Fourth, the designation receiving unit 21 executes the “first” to “third” processing in step S205 for “sales price”.
- the designation receiving unit 21 specifies a fixed variable. Specifically, the designation receiving unit 21 regards all variables other than “electricity charges” and “sales prices” designated as cause variables and “IRR” designated as result variables as fixed variables.
- step S208 the calculation unit 22 calculates the value of the result variable. Specifically, first, the calculation unit 22 substitutes the representative value acquired in step S207 for the fixed variable of the balance structure description file 31. Second, the calculation unit 22 acquires one from the eleven discrete values of “electricity price” generated in “third” in step S205 and acquires one from the eleven discrete values of “sales price”. By doing so, a total of 121 combinations are created.
- the calculation unit 22 substitutes the value of the combination created in “second” of step S208 for “electricity charge” and “sales price” of the balance structure description file 31.
- the calculation unit 22 calculates “IRR” by solving the interrelationship described in the balance structure description file 31 as a mathematical model.
- the calculation unit 22 repeats the “third” and “fourth” processes in step S208 for all combinations created in “second” in step S208.
- the calculation unit 22 holds 121 combinations of values of “(electricity rate, sales price, IRR)” as line graph data.
- step S209 the display control unit 23 displays a spider chart. Specifically, first, the display control unit 23 displays the coordinate plane of the spider chart 45 (FIG. 7) on the output device 13. The horizontal axis of the coordinate plane is “electricity charge”. “Electricity charge” is one of the cause variables specified in step S204. The vertical axis of the coordinate plane is “IRR”. “IRR” is the result variable specified in step S204. Second, the display control unit 23 displays eleven line graphs on the coordinate plane for each “sales price” based on the data for the line graph. “Sales price” is the remaining one of the causal variables specified in step S204. Thereafter, the display control unit 23 proceeds to step S230.
- step S213 the designation receiving unit 21 determines whether or not the received chart is a tornado chart. Specifically, the designation receiving unit 21 proceeds to step S214 if the type of the chart received in step S202 is “tornado chart” (step S213 “Yes”), and otherwise (step S213 “No”). ), The process proceeds to step S223.
- step S214 the designation receiving unit 21 receives designation of a cause variable and a result variable. Specifically, the designation accepting unit 21 accepts that the user designates a cause variable and designates a result variable via the input device 12. At this time, the designation receiving unit 21 displays the balance structure description file 31 (FIGS. 4 and 5) on the output device 13, and accepts the user selecting an arbitrary line, thereby specifying the cause variable and the result variable. It may be accepted. Now, assuming that “sales amount” is designated as a cause variable and “IRR” is designated as a result variable, the user continues the following description. That is, the user wants to examine how much the IRR changes as the sales volume value changes (sensitivity analysis). The cause variable designated at this time is called “analysis target cause variable”. Although details will be described later, the designation receiving unit 21 performs sensitivity analysis after variously changing the “analysis target cause variable”.
- step S215 the designation receiving unit 21 receives the range of the cause variable. Specifically, first, the designation receiving unit 21 highlights a line in which “sales amount” is stored in the item column 102 among the lines of the balance structure description file 31. The highlighted rows include, for example, rows for “sales amount” corresponding to the rows 142a to 142e in FIG.
- the designation receiving unit 21 receives that the user designates a certain line among the highlighted lines. Now, assume that the user designates a line for “sales volume” corresponding to the line 142e in FIG. The user often desires to use a plurality of discrete values as sales volume values. Therefore, the designation receiving unit 21 may display the “sales amount” row (“Division” is stored in the operator column 103) corresponding to the row 142e by default in a form distinguished from other rows. Thirdly, the designation receiving unit 21 generates a discrete value of the variable of the row designated in “second” in step S215. In the above example, the designation receiving unit 21 generates, for example, 11 discrete values “21,000,..., 39,000” of sales volume.
- the designation receiving unit 21 identifies a fixed variable. Specifically, the designation receiving unit 21 regards all variables other than “sales amount” designated as the cause variable and “IRR” designated as the result variable as fixed variables.
- step S218 the calculation unit 22 calculates the value of the result variable. Specifically, first, the calculation unit 22 substitutes the representative value acquired in step S217 for the fixed variable of the balance structure description file 31. Secondly, the calculation unit 22 acquires one from 11 discrete values of “sales amount” generated in “third” in step S215.
- the calculation unit 22 substitutes the value acquired in “second” in step S218 for “sales amount” in the balance structure description file 31.
- the calculation unit 22 calculates “IRR” by solving the mutual relationship described in the balance structure description file 31 as a mathematical model.
- the calculation unit 22 repeats the “second” to “fourth” processes in step S218 for the eleven discrete values of “sales amount” generated in “third” in step S215 (inner loop). Then, at the stage where the iterative process of the inner loop is completed, the calculation unit 22 holds 11 IRR values.
- the calculation unit 22 holds the result of subtracting the minimum value from the maximum value as a difference.
- the designation receiving unit 21 and the calculation unit 22 change the “analysis target cause variable” to a variable other than “sales amount” and “IRR”, and then perform steps until there is no unprocessed “analysis target cause variable”.
- the processes of S215 to S218 are repeated (outer loop).
- the calculation unit 22 holds the combinations of the values of “(cause variable, difference)” by the number of analysis target cause variables.
- the combination held here is called “pre-order difference information”.
- the pre-order difference information As an example of the pre-order difference information, for example, the following can be considered.
- (Cause variable, difference) (Sales price, 3.53), (Power consumption, 1.14), (Depreciable years, 0.08), (Sales volume, 19.37), (Parts price, 0. 42), (Electricity charges, 3.26)
- the display control unit 23 displays the tornado chart 55 (FIG. 9) on the output device 13.
- the horizontal axis of the coordinate plane is “IRR”.
- “IRR” is the result variable specified in step S214.
- the display control unit 23 displays a band graph indicating the cause variable from the top of the tornado chart 55 in descending order of the difference in post-ordering difference information. Of course, you may display from the top in order with small difference.
- the coordinate value on the horizontal axis at the left end of each band graph is the minimum value of IRR when the causal variable changes while taking various discrete values.
- the coordinate value on the horizontal axis at the right end of each band graph is the maximum value of IRR when the causal variable changes while taking various discrete values.
- the display control unit 23 proceeds to step S230.
- the designation receiving unit 21 receives designation of target variables, searched variables, and constraint variables. Specifically, the designation accepting unit 21 accepts that the user designates a target variable, a search target variable, and a constraint variable via the input device 12.
- the target variable is a variable in which a target value is designated among variables (items) in the balance structure description file 31 and corresponds to a variable of the first category.
- the search target variable is a variable in which a value for the target variable to take the target value among the variables (items) in the balance structure description file 31 is calculated, and corresponds to a third category variable.
- the constraint variable is a variable that can take a value within a certain range, and corresponds to a variable of the first category.
- the designation receiving unit 21 displays the balance structure description file 31 (FIGS. 4 and 5) on the output device 13, and accepts that the user selects an arbitrary line, whereby the target variable, the searched variable, and the restriction are received. You may accept specification of variables. Now, it is assumed that the user designates “IRR” as the target variable, designates “sales price” as the search target variable, and designates “electricity charge” and “part price” as the constraint variables. In other words, if there is a constraint that the electricity price value and the part price value change within a certain range, the user must select what value the searched variable will take in order for the target variable to take a given target value. I want to find out if I have to.
- step S224 the designation receiving unit 21 receives the target value. Specifically, the designation accepting unit 21 accepts that the user designates a target value (for example, “10.0%”) of the IRR via the input device 12.
- a target value for example, “10.0%”
- the designation receiving unit 21 receives the range of the constraint variable. Specifically, first, the designation receiving unit 21 highlights a line in which “electricity rate” is stored in the item column 102 among the lines of the balance structure description file 31. The rows highlighted here include, for example, the rows 142a to 142e in FIG. Secondly, the designation receiving unit 21 receives that the user designates a certain line among the highlighted lines. Now, assume that the user designates row 142e in FIG. The user often desires to use a plurality of discrete values as the value of the electricity bill. Therefore, the designation receiving unit 21 may display the line 142e (“Division” is stored in the operator column 103) by default in a form that is distinguished from other lines.
- the designation receiving unit 21 generates a discrete value of the variable in the row designated in “second” in step S225. In the above example, the designation receiving unit 21 generates eleven discrete values “15.0, 15.5, 16.0,. Fourth, the designation receiving unit 21 executes the “first” to “third” processing in step S225 for “part price”.
- the designation receiving unit 21 specifies a fixed variable. Specifically, the designation receiving unit 21 is other than “IRR” designated as a target variable, “electricity charge” and “part price” designated as constraint variables, and “sales price” designated as a searched variable. Consider all variables as fixed variables.
- step S228, the calculation unit 22 calculates the value of the search target variable. Specifically, first, the calculation unit 22 substitutes the representative value acquired in step S227 for the fixed variable of the balance structure description file 31. Second, the calculation unit 22 acquires one from the eleven discrete values of “electricity price” generated in “third” in step S225 and acquires one from the eleven discrete values of “part price”. By doing so, a total of 121 combinations are created.
- the calculation unit 22 substitutes the value of the combination created in “second” in step S228 for “electricity charge” and “part price” in the balance structure description file 31.
- the calculation unit 22 calculates “IRR” by solving the interrelationship described in the balance structure description file 31 as a mathematical model.
- the calculation unit 22 repeats the “third” and “fourth” processes in step S228 for all combinations created in “second” in step S228.
- the calculation unit 22 holds 121 combinations of values of “(electricity charge, parts price, sales price)” as line graph data.
- step S229 the display control unit 23 displays a goal seek chart. Specifically, the display control unit 23 displays the goal seek chart 61 (FIG. 10) on the output device 13. The details of the goal seek chart 61 are as described above. The display control unit 23 displays the goal seek chart 75 (FIG. 11) when only one variable is designated as the constraint variable, and all variables other than the target variable are designated as search target variables. In this case, the goal seek chart 81 (FIG. 12) is displayed. Thereafter, the display control unit 23 proceeds to step S230.
- the display control unit 23 proceeds to step S230.
- step S230 the designation receiving unit 21 determines whether to end the process. Specifically, the designation receiving unit 21 returns to step S202 when receiving a user input of an instruction to continue processing via the input device 12 (step S230 “No”). When the user receives an instruction to end the processing (step S230 “Yes”), the entire processing procedure is ended.
- the business analysis device of this embodiment has the following effects.
- the business analysis device can display a spider chart, a tornado chart, and a goal seek chart without making the user troublesome by using the balance structure description file.
- the business analysis apparatus can store the variable range and the representative value in the balance structure description file. Thus, the user does not have to worry about selecting a value of a variable that is not of interest.
- the business analysis device can generate discrete values of variables. Therefore, the user can easily visually recognize the minimum value or the maximum value of the variable.
- this invention is not limited to an above-described Example, Various modifications are included.
- the above-described embodiments have been described in detail for easy understanding of the present invention, and are not necessarily limited to those having all the configurations described.
- a part of the configuration of one embodiment can be replaced with the configuration of another embodiment, and the configuration of another embodiment can be added to the configuration of one embodiment.
- Each of the above-described configurations, functions, processing units, processing means, and the like may be realized by hardware by designing a part or all of them with, for example, an integrated circuit.
- Each of the above-described configurations, functions, and the like may be realized by software by interpreting and executing a program that realizes each function by the processor.
- Information such as programs, tables, and files that realize each function can be stored in a recording device such as a memory, a hard disk, or an SSD (Solid State Drive), or a recording medium such as an IC card, an SD card, or a DVD.
- the control lines and information lines are those that are considered necessary for the explanation, and not all the control lines and information lines on the product are necessarily shown. In practice, it may be considered that almost all the components are connected to each other.
Landscapes
- Business, Economics & Management (AREA)
- Engineering & Computer Science (AREA)
- Strategic Management (AREA)
- Economics (AREA)
- Human Resources & Organizations (AREA)
- Entrepreneurship & Innovation (AREA)
- Tourism & Hospitality (AREA)
- Quality & Reliability (AREA)
- Operations Research (AREA)
- Marketing (AREA)
- Physics & Mathematics (AREA)
- General Business, Economics & Management (AREA)
- General Physics & Mathematics (AREA)
- Theoretical Computer Science (AREA)
- Development Economics (AREA)
- Educational Administration (AREA)
- Game Theory and Decision Science (AREA)
- Management, Administration, Business Operations System, And Electronic Commerce (AREA)
Priority Applications (1)
| Application Number | Priority Date | Filing Date | Title |
|---|---|---|---|
| CN201680054140.4A CN108027913A (zh) | 2015-12-18 | 2016-10-21 | 可行性分析装置 |
Applications Claiming Priority (2)
| Application Number | Priority Date | Filing Date | Title |
|---|---|---|---|
| JP2015246901A JP6457926B2 (ja) | 2015-12-18 | 2015-12-18 | 事業性分析装置 |
| JP2015-246901 | 2015-12-18 |
Publications (1)
| Publication Number | Publication Date |
|---|---|
| WO2017104264A1 true WO2017104264A1 (ja) | 2017-06-22 |
Family
ID=59056059
Family Applications (1)
| Application Number | Title | Priority Date | Filing Date |
|---|---|---|---|
| PCT/JP2016/081354 Ceased WO2017104264A1 (ja) | 2015-12-18 | 2016-10-21 | 事業性分析装置 |
Country Status (3)
| Country | Link |
|---|---|
| JP (1) | JP6457926B2 (https=) |
| CN (1) | CN108027913A (https=) |
| WO (1) | WO2017104264A1 (https=) |
Families Citing this family (1)
| Publication number | Priority date | Publication date | Assignee | Title |
|---|---|---|---|---|
| WO2023113420A1 (ko) * | 2021-12-15 | 2023-06-22 | 고려대학교 산학협력단 | 사업자 활동 데이터 분석 방법 |
Citations (4)
| Publication number | Priority date | Publication date | Assignee | Title |
|---|---|---|---|---|
| JP2002015108A (ja) * | 2000-06-30 | 2002-01-18 | Nomura Holding Inc | 企業価値分析装置及び企業価値分析方法 |
| JP2003067550A (ja) * | 2001-08-27 | 2003-03-07 | Toshiba Corp | 経営シミュレーションシステム、経営シミュレーション方法及び経営シミュレーションプログラム |
| JP2005316738A (ja) * | 2004-04-28 | 2005-11-10 | Toshiba Corp | プラントワイド最適プロセス制御装置 |
| JP2015032023A (ja) * | 2013-07-31 | 2015-02-16 | 株式会社日立製作所 | 事業性評価装置、事業性評価方法及び事業性評価プログラム |
Family Cites Families (4)
| Publication number | Priority date | Publication date | Assignee | Title |
|---|---|---|---|---|
| US8255353B2 (en) * | 2006-05-16 | 2012-08-28 | Zhan Zhang | Method for constructing an intelligent system processing uncertain causal relationship information |
| CN101127100A (zh) * | 2006-08-18 | 2008-02-20 | 张湛 | 一种处理不确定因果关系类信息的智能系统的构造方法 |
| US8589327B2 (en) * | 2011-04-22 | 2013-11-19 | International Business Machines Corporation | Efficiently determining boolean satisfiability with lazy constraints |
| CN104915535B (zh) * | 2015-02-04 | 2019-04-30 | 湖南农业大学 | 生物种群动态预测分析全球通用关键因子预设数组平台 |
-
2015
- 2015-12-18 JP JP2015246901A patent/JP6457926B2/ja active Active
-
2016
- 2016-10-21 CN CN201680054140.4A patent/CN108027913A/zh active Pending
- 2016-10-21 WO PCT/JP2016/081354 patent/WO2017104264A1/ja not_active Ceased
Patent Citations (4)
| Publication number | Priority date | Publication date | Assignee | Title |
|---|---|---|---|---|
| JP2002015108A (ja) * | 2000-06-30 | 2002-01-18 | Nomura Holding Inc | 企業価値分析装置及び企業価値分析方法 |
| JP2003067550A (ja) * | 2001-08-27 | 2003-03-07 | Toshiba Corp | 経営シミュレーションシステム、経営シミュレーション方法及び経営シミュレーションプログラム |
| JP2005316738A (ja) * | 2004-04-28 | 2005-11-10 | Toshiba Corp | プラントワイド最適プロセス制御装置 |
| JP2015032023A (ja) * | 2013-07-31 | 2015-02-16 | 株式会社日立製作所 | 事業性評価装置、事業性評価方法及び事業性評価プログラム |
Also Published As
| Publication number | Publication date |
|---|---|
| JP6457926B2 (ja) | 2019-01-23 |
| JP2017111695A (ja) | 2017-06-22 |
| CN108027913A (zh) | 2018-05-11 |
Similar Documents
| Publication | Publication Date | Title |
|---|---|---|
| Singh et al. | Artificial intelligence in customer retention: a bibliometric analysis and future research framework | |
| Zieliński et al. | Period estimation and rhythm detection in timeseries data using BioDare2, the free, online, community resource | |
| WO2018209081A1 (en) | Attributing meanings to data concepts used in producing outputs | |
| Chib et al. | Change-points in affine arbitrage-free term structure models | |
| CN106251174A (zh) | 信息推荐方法及装置 | |
| CN110489481A (zh) | 行业数据的数据分析方法、装置及数据分析服务器 | |
| US20240202205A1 (en) | Library information management system | |
| Verdenhofs et al. | Evolution of customer segmentation in the era of big data | |
| JP4443619B2 (ja) | ポートフォリオの信用リスクの計算方法および装置 | |
| Uddin et al. | Customer satisfaction and intention to use mobile financial services: A systematic literature review | |
| US9928516B2 (en) | System and method for automated analysis of data to populate natural language description of data relationships | |
| Amrouk et al. | Forecasting international sugar prices: a Bayesian model average analysis | |
| Mukhtar et al. | A proposed framework for assessing BNPL (Buy Now, Pay Later) adoption and its impact on consumers' buying behavior | |
| Pareek et al. | The impact of big data technology on the advancement of the insurance industry | |
| Christy et al. | Customer continuance usage of digital banking: a systematic review of influencing factors | |
| Pinçe et al. | The role of contract expirations in service parts management | |
| JP6457926B2 (ja) | 事業性分析装置 | |
| Shukla et al. | Methods and lessons from costing a large mHealth intervention at scale in India | |
| US7974903B2 (en) | System and method for analyzing distributions for taxation analysis | |
| Oancea et al. | Web scraping techniques for price statistics–the Romanian experience | |
| Jeswani et al. | Predicting Walmart sales, exploratory data analysis, and Walmart sales dashboard | |
| TWM565365U (zh) | 保險商品推薦系統 | |
| El-Mashaleh et al. | A multi-attribute decision-making model for construction enterprise resource planning system selection | |
| Zhang | Data-driven development of entrepreneurial ecosystem based on the Apriori algorithm | |
| Aghabazaz et al. | A time-varying GARCH mixed-effects model for isolating high-and low-frequency volatility and co-volatility |
Legal Events
| Date | Code | Title | Description |
|---|---|---|---|
| 121 | Ep: the epo has been informed by wipo that ep was designated in this application |
Ref document number: 16875249 Country of ref document: EP Kind code of ref document: A1 |
|
| NENP | Non-entry into the national phase |
Ref country code: DE |
|
| 122 | Ep: pct application non-entry in european phase |
Ref document number: 16875249 Country of ref document: EP Kind code of ref document: A1 |