WO2017078085A1 - Endoscope system and analyzing device - Google Patents
Endoscope system and analyzing device Download PDFInfo
- Publication number
- WO2017078085A1 WO2017078085A1 PCT/JP2016/082641 JP2016082641W WO2017078085A1 WO 2017078085 A1 WO2017078085 A1 WO 2017078085A1 JP 2016082641 W JP2016082641 W JP 2016082641W WO 2017078085 A1 WO2017078085 A1 WO 2017078085A1
- Authority
- WO
- WIPO (PCT)
- Prior art keywords
- image data
- light
- parameter
- living tissue
- special
- Prior art date
Links
Images


Classifications
-
- A—HUMAN NECESSITIES
- A61—MEDICAL OR VETERINARY SCIENCE; HYGIENE
- A61B—DIAGNOSIS; SURGERY; IDENTIFICATION
- A61B1/00—Instruments for performing medical examinations of the interior of cavities or tubes of the body by visual or photographical inspection, e.g. endoscopes; Illuminating arrangements therefor
- A61B1/00002—Operational features of endoscopes
- A61B1/00004—Operational features of endoscopes characterised by electronic signal processing
- A61B1/00009—Operational features of endoscopes characterised by electronic signal processing of image signals during a use of endoscope
- A61B1/000094—Operational features of endoscopes characterised by electronic signal processing of image signals during a use of endoscope extracting biological structures
-
- A—HUMAN NECESSITIES
- A61—MEDICAL OR VETERINARY SCIENCE; HYGIENE
- A61B—DIAGNOSIS; SURGERY; IDENTIFICATION
- A61B1/00—Instruments for performing medical examinations of the interior of cavities or tubes of the body by visual or photographical inspection, e.g. endoscopes; Illuminating arrangements therefor
- A61B1/00064—Constructional details of the endoscope body
- A61B1/00071—Insertion part of the endoscope body
- A61B1/0008—Insertion part of the endoscope body characterised by distal tip features
- A61B1/00096—Optical elements
-
- A—HUMAN NECESSITIES
- A61—MEDICAL OR VETERINARY SCIENCE; HYGIENE
- A61B—DIAGNOSIS; SURGERY; IDENTIFICATION
- A61B1/00—Instruments for performing medical examinations of the interior of cavities or tubes of the body by visual or photographical inspection, e.g. endoscopes; Illuminating arrangements therefor
- A61B1/04—Instruments for performing medical examinations of the interior of cavities or tubes of the body by visual or photographical inspection, e.g. endoscopes; Illuminating arrangements therefor combined with photographic or television appliances
- A61B1/043—Instruments for performing medical examinations of the interior of cavities or tubes of the body by visual or photographical inspection, e.g. endoscopes; Illuminating arrangements therefor combined with photographic or television appliances for fluorescence imaging
-
- A—HUMAN NECESSITIES
- A61—MEDICAL OR VETERINARY SCIENCE; HYGIENE
- A61B—DIAGNOSIS; SURGERY; IDENTIFICATION
- A61B1/00—Instruments for performing medical examinations of the interior of cavities or tubes of the body by visual or photographical inspection, e.g. endoscopes; Illuminating arrangements therefor
- A61B1/04—Instruments for performing medical examinations of the interior of cavities or tubes of the body by visual or photographical inspection, e.g. endoscopes; Illuminating arrangements therefor combined with photographic or television appliances
- A61B1/045—Control thereof
-
- A—HUMAN NECESSITIES
- A61—MEDICAL OR VETERINARY SCIENCE; HYGIENE
- A61B—DIAGNOSIS; SURGERY; IDENTIFICATION
- A61B1/00—Instruments for performing medical examinations of the interior of cavities or tubes of the body by visual or photographical inspection, e.g. endoscopes; Illuminating arrangements therefor
- A61B1/04—Instruments for performing medical examinations of the interior of cavities or tubes of the body by visual or photographical inspection, e.g. endoscopes; Illuminating arrangements therefor combined with photographic or television appliances
- A61B1/05—Instruments for performing medical examinations of the interior of cavities or tubes of the body by visual or photographical inspection, e.g. endoscopes; Illuminating arrangements therefor combined with photographic or television appliances characterised by the image sensor, e.g. camera, being in the distal end portion
-
- A—HUMAN NECESSITIES
- A61—MEDICAL OR VETERINARY SCIENCE; HYGIENE
- A61B—DIAGNOSIS; SURGERY; IDENTIFICATION
- A61B1/00—Instruments for performing medical examinations of the interior of cavities or tubes of the body by visual or photographical inspection, e.g. endoscopes; Illuminating arrangements therefor
- A61B1/06—Instruments for performing medical examinations of the interior of cavities or tubes of the body by visual or photographical inspection, e.g. endoscopes; Illuminating arrangements therefor with illuminating arrangements
- A61B1/0638—Instruments for performing medical examinations of the interior of cavities or tubes of the body by visual or photographical inspection, e.g. endoscopes; Illuminating arrangements therefor with illuminating arrangements providing two or more wavelengths
-
- A—HUMAN NECESSITIES
- A61—MEDICAL OR VETERINARY SCIENCE; HYGIENE
- A61B—DIAGNOSIS; SURGERY; IDENTIFICATION
- A61B1/00—Instruments for performing medical examinations of the interior of cavities or tubes of the body by visual or photographical inspection, e.g. endoscopes; Illuminating arrangements therefor
- A61B1/06—Instruments for performing medical examinations of the interior of cavities or tubes of the body by visual or photographical inspection, e.g. endoscopes; Illuminating arrangements therefor with illuminating arrangements
- A61B1/0646—Instruments for performing medical examinations of the interior of cavities or tubes of the body by visual or photographical inspection, e.g. endoscopes; Illuminating arrangements therefor with illuminating arrangements with illumination filters
-
- A—HUMAN NECESSITIES
- A61—MEDICAL OR VETERINARY SCIENCE; HYGIENE
- A61B—DIAGNOSIS; SURGERY; IDENTIFICATION
- A61B1/00—Instruments for performing medical examinations of the interior of cavities or tubes of the body by visual or photographical inspection, e.g. endoscopes; Illuminating arrangements therefor
- A61B1/06—Instruments for performing medical examinations of the interior of cavities or tubes of the body by visual or photographical inspection, e.g. endoscopes; Illuminating arrangements therefor with illuminating arrangements
- A61B1/0661—Endoscope light sources
- A61B1/0669—Endoscope light sources at proximal end of an endoscope
-
- A—HUMAN NECESSITIES
- A61—MEDICAL OR VETERINARY SCIENCE; HYGIENE
- A61B—DIAGNOSIS; SURGERY; IDENTIFICATION
- A61B1/00—Instruments for performing medical examinations of the interior of cavities or tubes of the body by visual or photographical inspection, e.g. endoscopes; Illuminating arrangements therefor
- A61B1/06—Instruments for performing medical examinations of the interior of cavities or tubes of the body by visual or photographical inspection, e.g. endoscopes; Illuminating arrangements therefor with illuminating arrangements
- A61B1/0661—Endoscope light sources
- A61B1/0676—Endoscope light sources at distal tip of an endoscope
-
- A—HUMAN NECESSITIES
- A61—MEDICAL OR VETERINARY SCIENCE; HYGIENE
- A61B—DIAGNOSIS; SURGERY; IDENTIFICATION
- A61B1/00—Instruments for performing medical examinations of the interior of cavities or tubes of the body by visual or photographical inspection, e.g. endoscopes; Illuminating arrangements therefor
- A61B1/06—Instruments for performing medical examinations of the interior of cavities or tubes of the body by visual or photographical inspection, e.g. endoscopes; Illuminating arrangements therefor with illuminating arrangements
- A61B1/07—Instruments for performing medical examinations of the interior of cavities or tubes of the body by visual or photographical inspection, e.g. endoscopes; Illuminating arrangements therefor with illuminating arrangements using light-conductive means, e.g. optical fibres
-
- A—HUMAN NECESSITIES
- A61—MEDICAL OR VETERINARY SCIENCE; HYGIENE
- A61B—DIAGNOSIS; SURGERY; IDENTIFICATION
- A61B5/00—Measuring for diagnostic purposes; Identification of persons
- A61B5/145—Measuring characteristics of blood in vivo, e.g. gas concentration, pH value; Measuring characteristics of body fluids or tissues, e.g. interstitial fluid, cerebral tissue
- A61B5/14546—Measuring characteristics of blood in vivo, e.g. gas concentration, pH value; Measuring characteristics of body fluids or tissues, e.g. interstitial fluid, cerebral tissue for measuring analytes not otherwise provided for, e.g. ions, cytochromes
-
- A—HUMAN NECESSITIES
- A61—MEDICAL OR VETERINARY SCIENCE; HYGIENE
- A61B—DIAGNOSIS; SURGERY; IDENTIFICATION
- A61B5/00—Measuring for diagnostic purposes; Identification of persons
- A61B5/145—Measuring characteristics of blood in vivo, e.g. gas concentration, pH value; Measuring characteristics of body fluids or tissues, e.g. interstitial fluid, cerebral tissue
- A61B5/1455—Measuring characteristics of blood in vivo, e.g. gas concentration, pH value; Measuring characteristics of body fluids or tissues, e.g. interstitial fluid, cerebral tissue using optical sensors, e.g. spectral photometrical oximeters
- A61B5/14551—Measuring characteristics of blood in vivo, e.g. gas concentration, pH value; Measuring characteristics of body fluids or tissues, e.g. interstitial fluid, cerebral tissue using optical sensors, e.g. spectral photometrical oximeters for measuring blood gases
-
- A—HUMAN NECESSITIES
- A61—MEDICAL OR VETERINARY SCIENCE; HYGIENE
- A61B—DIAGNOSIS; SURGERY; IDENTIFICATION
- A61B1/00—Instruments for performing medical examinations of the interior of cavities or tubes of the body by visual or photographical inspection, e.g. endoscopes; Illuminating arrangements therefor
- A61B1/00112—Connection or coupling means
- A61B1/00117—Optical cables in or with an endoscope
-
- A—HUMAN NECESSITIES
- A61—MEDICAL OR VETERINARY SCIENCE; HYGIENE
- A61B—DIAGNOSIS; SURGERY; IDENTIFICATION
- A61B5/00—Measuring for diagnostic purposes; Identification of persons
- A61B5/145—Measuring characteristics of blood in vivo, e.g. gas concentration, pH value; Measuring characteristics of body fluids or tissues, e.g. interstitial fluid, cerebral tissue
- A61B5/1455—Measuring characteristics of blood in vivo, e.g. gas concentration, pH value; Measuring characteristics of body fluids or tissues, e.g. interstitial fluid, cerebral tissue using optical sensors, e.g. spectral photometrical oximeters
- A61B5/1459—Measuring characteristics of blood in vivo, e.g. gas concentration, pH value; Measuring characteristics of body fluids or tissues, e.g. interstitial fluid, cerebral tissue using optical sensors, e.g. spectral photometrical oximeters invasive, e.g. introduced into the body by a catheter
Definitions
- the present invention relates to an endoscope system and an analysis apparatus that acquire biological information such as a concentration of a biological substance in a biological tissue based on an image obtained by photographing the biological tissue.
- the endoscope apparatus described in Patent Document 1 is based on color information of two endoscopic images photographed using illumination light in two types of wavelength regions within the absorption band (Q band) of hemoglobin, An index indicating the total amount of hemoglobin and an index indicating oxygen saturation are calculated.
- the color of the living tissue on the captured image is affected by light scattering of illumination light by the living tissue (hereinafter also simply referred to as “scattering”).
- scattering changes in spectral characteristics due to the scattering are not taken into account in the calculation of each index. Therefore, there has been a problem that the calculation result of the index varies depending on the intensity of scattering, that is, the calculated index value includes an error due to scattering.
- the present invention has been made in view of the above circumstances, and an object thereof is to provide an endoscope system and an analysis apparatus capable of correcting an error caused by scattering and performing a more accurate spectroscopic analysis. .
- One aspect of the present invention is an endoscope system including the following aspects.
- a light source device An endoscope having an image pickup unit including an image pickup device configured to pick up an image of a living tissue illuminated by light emitted from the light source device and generate color image data;
- a first parameter configured to generate a first parameter that is sensitive to the first feature amount of the biological tissue and not sensitive to light scattering by the biological tissue from the color image data.
- a processor comprising: a parameter generation unit; and a first feature quantity acquisition unit configured to acquire the first feature quantity based on the first parameter;
- An endoscope system comprising:
- the first parameter generation unit is sensitive to the first feature amount of the biological tissue and has color component X in an image having a wavelength region component sensitive to light scattering by the biological tissue. And color image data Y of an image that has no sensitivity to the first feature amount of the living tissue and has a component in a wavelength region that has sensitivity to light scattering by the living tissue.
- the light source device is configured to emit first special light having a wavelength range different from that of white light, and having a different absorbance by the living tissue according to the degree of the first feature amount
- the color image data X is first special observation image data W obtained by imaging the living tissue under illumination of the first special light
- the color image data Y is first normal observation image data R that is an R component of normal observation image data in the RGB color space obtained by imaging the living tissue under illumination of the white light
- the first parameter is a ratio W / R between the first special observation image data W and the first normal observation image data R.
- the light source device is configured to emit first special light having a wavelength range different from that of white light, and having a different absorbance by the living tissue according to the degree of the first feature amount
- the color image data X is first special observation image data W obtained by imaging the living tissue under illumination of the first special light
- the color image data Y is preset to first normal observation image data R that is an R component of normal observation image data in the RGB color space obtained by imaging the living tissue under illumination of the white light.
- the first parameter is a ratio W / ( ⁇ R) between the first special observation image data W and the data ⁇ R.
- the coefficient is preferably obtained in advance by a preliminary test using a sample whose first feature value is known. That is, it is preferable that the processor performs a preliminary test using the known sample and determines and stores the coefficient ⁇ before starting to use the endoscope system.
- the light source device is configured to emit first special light having a wavelength range different from that of white light, and having a different absorbance by the living tissue according to the degree of the first feature amount
- the color image data X is first special observation image data W obtained by imaging the living tissue under illumination of the first special light
- the color image data Y is first normal observation image data R and G components which are R components of normal observation image data in the RGB color space obtained by imaging the living tissue under illumination of the white light. 2 is the sum R + G with the normal observation image data G
- the endoscope system according to aspect 2, wherein the first parameter is a ratio W / (R + G) of the first special observation image data W and the sum R + G.
- the light source device is configured to emit first special light having a wavelength range different from that of white light, and having a different absorbance by the living tissue according to the degree of the first feature amount
- the color image data X is first special observation image data W obtained by imaging the living tissue under illumination of the first special light
- the color image data Y is first normal observation image data R and G components which are R components of normal observation image data in the RGB color space obtained by imaging the living tissue under illumination of the white light.
- the endoscope system is a sum ⁇ R + ⁇ G obtained by weighting and adding the normal observation image data G using a preset coefficient ⁇ and coefficient ⁇ ,
- the first parameter is a ratio W / ( ⁇ R + ⁇ G) between the first special observation image data W and the sum ⁇ R + ⁇ G.
- the coefficient ⁇ and the coefficient ⁇ are obtained in advance by a preliminary test using a sample whose first feature amount is known. That is, it is preferable that the processor performs a preliminary test using the known sample and determines and stores the coefficient ⁇ and the coefficient ⁇ before starting to use the endoscope system.
- the imaging unit includes an R color filter configured to filter light before being received by the imaging element into an R wavelength range on an RGB color space,
- the endoscope system according to any one of aspects 3 to 6, wherein the first normal observation image data R is data of an image captured through an R color filter of the image sensor.
- the light source device is A white light source that emits white light; A first optical filter configured to extract the first special light from the white light; With Switching and emitting the white light and the first special light, The endoscope system according to any one of aspects 3 to 7.
- the processor includes a storage unit that stores data representing a quantitative relationship between the first parameter and the first feature amount,
- the first feature quantity acquisition unit is configured to obtain the first feature quantity with reference to data representing the quantitative relationship.
- the first characteristic amount is a total hemoglobin amount;
- the endoscope system according to any one of aspects 1 to 9.
- the first feature amount is a total hemoglobin amount;
- the imaging unit includes a G color filter configured to filter light before receiving light of the imaging element into a G wavelength range on an RGB color space,
- the first special observation image data W is image data captured by the image sensor through the G color filter.
- the processor is A second parameter generation unit configured to generate, from the color image data, a second parameter having sensitivity to the second feature amount of the living tissue and not having sensitivity to the light scattering.
- a second feature quantity acquisition unit configured to acquire the second feature quantity based on the first feature quantity and the second parameter, The endoscope system according to any one of aspects 1 to 12.
- the feature quantity acquisition unit A second parameter generation unit configured to generate, from the color image data, a second parameter having sensitivity to the second feature amount of the living tissue and not having sensitivity to the light scattering.
- a second feature quantity acquisition unit configured to acquire the second feature quantity based on the first feature quantity and the second parameter;
- the light source device is configured to emit a second special light having a wavelength range different from that of white light, and having a different absorbance by the living tissue according to the degree of the second feature amount
- the second parameter is Second special observation image data N obtained by imaging the living tissue under illumination of the second special light, and first special observation image obtained by imaging the living tissue under illumination of the first special light.
- the endoscope system according to any one of aspects 3 to 8.
- the wavelength range of the said 1st special light is set so that the light absorbency of the said 1st special light by the said biological tissue may depend on the said 1st feature-value, and may not depend on the said 2nd feature-value. Endoscope system.
- the second feature amount is oxygen saturation;
- the endoscope system according to any one of aspects 13 to 16.
- the second special observation image data N is image data in the same wavelength range as the G wavelength range in the RGB color space.
- the imaging unit includes a G color filter configured to filter light before receiving light of the imaging element into a G wavelength range on an RGB color space,
- the second special observation image data N is data of an image captured through the G color filter.
- a feature quantity distribution image generation unit configured to generate a feature quantity distribution image representing a distribution of the first feature quantity in the living tissue based on the first feature quantity;
- a feature quantity distribution image generation unit configured to generate a feature quantity distribution image representing a distribution of the second feature quantity in the living tissue based on the second feature quantity;
- a light source device An imaging unit including an imaging element configured to image a living tissue illuminated by light emitted from the light source device and generate color image data; A first parameter configured to generate a first parameter that is sensitive to the first feature amount of the biological tissue and has no sensitivity to light scattering by the biological tissue from the color image data.
- a processor having a one-parameter generation unit, and a first feature amount acquisition unit configured to acquire the first feature amount based on the first parameter;
- An analysis apparatus comprising:
- the endoscope system (hereinafter also referred to as an endoscope apparatus) of this embodiment described below is based on image data of an image of an imaging target having light components having different wavelength ranges (for example, total biological information)
- This is a system for quantitatively analyzing a biological tissue feature amount such as hemoglobin amount and oxygen saturation, and displaying the analysis result as an image.
- an image of a biological tissue may be received and imaged by dividing it into a predetermined wavelength range so that biological information can be calculated.
- the property that the spectral characteristics of blood that is, the spectral characteristics of hemoglobin
- oxygen saturation the property that the spectral characteristics of blood (that is, the spectral characteristics of hemoglobin) continuously change according to the total hemoglobin amount and oxygen saturation is used.
- R in an R component, R pixel in an image or image data, or an R color filter in a color filter is R (red) in the RGB color space, and is in the visible wavelength range of light. In the range of 360 to 830 nm, it means a wavelength region in a wavelength region of 570 nm or more, for example, a wavelength region of 580 to 700 nm.
- G in the G component, G pixel in the image or image data, or G color filter in the color filter, etc. is G (green) in the RGB color space, and is in the visible wavelength range of light. Of 360 to 830 nm, for example, it means a wavelength region in a wavelength region of 470 to 620 nm.
- “B” in the B component in the image or the image data, the B pixel, or the B color filter in the color filter is B (blue) in the RGB color space, and is in the visible wavelength range of light 360 ⁇ Of 830 nm, it means a wavelength region in a wavelength region of 530 nm or less, for example, a wavelength region of 420-520 nm.
- “R”, “G”, and “B” may independently represent the pixel values of the R pixel, the G pixel, and the B pixel of the image.
- the white light is not limited to one that strictly includes all the wavelength components of visible light, and may be any light that includes components in the above-described wavelength regions in R, G, and B, for example.
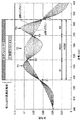
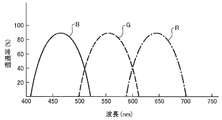
- FIG. 1 shows an absorption spectrum of hemoglobin near 550 nm.
- Hemoglobin has a strong absorption band called a Q band derived from porphyrin near 550 nm.
- the absorption spectrum of hemoglobin varies depending on the oxygen saturation.
- the oxygen saturation is a ratio of oxygenated hemoglobin HbO in the total hemoglobin.
- the solid line waveform in FIG. 1 is an absorption spectrum of oxidized hemoglobin HbO having an oxygen saturation of 100%, and the long broken line waveform is an absorption spectrum when the oxygen saturation is 0%, that is, the absorption of reduced hemoglobin Hb. It is a spectrum.
- the short dashed line is an absorption spectrum of hemoglobin (a mixture of oxygenated hemoglobin HbO and reduced hemoglobin Hb) at an intermediate oxygen saturation of 10, 20, 30,... 90%.
- oxygenated hemoglobin HbO and reduced hemoglobin Hb have different peak wavelengths. Specifically, oxygenated hemoglobin HbO has an absorption peak P1 near a wavelength of 542 nm and an absorption peak P3 near a wavelength of 576 nm. On the other hand, reduced hemoglobin Hb has an absorption peak P2 near 556 nm.
- FIG. 1 shows a two-component absorption spectrum in which the sum of the concentrations of each component (oxygenated hemoglobin HbO, reduced hemoglobin Hb) is constant. Therefore, the absorption is independent of the concentration of each component (ie, oxygen saturation). Iso-absorption points E1, E2, E3, E4 that become constant appear.
- the wavelength region sandwiched between the isosbestic points E1 and E2 is sandwiched between the wavelength region R1 and the wavelength region sandwiched between the isosbestic points E2 and E3 is sandwiched between the wavelength region R2 and the isosbestic points E3 and E4.
- This wavelength region is called a wavelength region R3.
- a wavelength region sandwiched between the isosbestic points E1 and E4 (that is, a combination of the wavelength regions R1, R2, and R3) is referred to as a wavelength region R0.
- the wavelength band R2 is also referred to as an N band (Narrow-band)
- the wavelength band R0 is also referred to as a W band (Wide-band).
- the wavelength range R0 and the wavelength range R2 are determined based on a wavelength range having a point where absorption is constant regardless of oxygen saturation and a region where absorption changes depending on oxygen saturation.
- the ranges of the wavelength region R0 and the wavelength region R2 are not particularly limited, but are preferably determined based on a region where the change due to the oxygen saturation is large.
- the W band is preferably in the range of 500 nm to 600 nm, and more preferably in the range of 520 nm to 590 nm.
- the N band is, for example, within the W band, narrower than the W band, and preferably within the range of 520 nm to 590 nm, and more preferably within the range of 540 nm to 580 nm. .
- the hemoglobin absorbance increases or decreases linearly with respect to oxygen saturation.
- the integrated values AR1 and AR3 of the absorbance of hemoglobin in the wavelength regions R1 and R3 increase linearly with respect to the oxygenated hemoglobin concentration.
- the integrated value AR2 of the hemoglobin absorbance in the wavelength region R2 increases linearly with respect to the concentration of reduced hemoglobin.
- oxygen saturation is defined by the following formula 1.
- Equation 1 Equations 2 and 3 representing the concentrations of oxygenated hemoglobin HbO and reduced hemoglobin Hb are obtained.
- the integrated values AR1, AR2, and AR3 of the hemoglobin absorbance are characteristic quantities that depend on both the oxygen saturation Sat and the total hemoglobin amount tHb.
- the integrated value AR0 of the hemoglobin absorbance in the wavelength region R0 composed of the wavelength regions R1, R2 and R3 does not depend on the oxygen saturation Sat, and depends on the total hemoglobin amount tHb. It has been found that the value changes.
- the total hemoglobin amount tHb can be determined from the integrated value AR0 of the absorbance.
- the oxygen saturation Sat can be determined from the integrated value AR1, AR2 or AR3 of the absorbance and the total hemoglobin amount tHb determined from the absorption AR0.
- the amount of change in the integrated value of the absorbance due to the oxygen saturation Sat that is, the solid line waveform and the long broken line waveform in FIG.
- the area of the enclosed region is the largest in the wavelength region R2 among the wavelength regions R0 to R3, and the integral value AR2 of the absorbance in the wavelength region R2 is the characteristic quantity having the highest sensitivity with respect to the oxygen saturation Sat.
- the oxygen saturation Sat is quantified using light in the wavelength region R2 (N band).
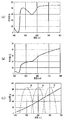
- FIG. 2 is an example of a reflection spectrum, which is a spectral characteristic in the visible region of a living tissue obtained by simulation calculation, and shows the influence of light scattering on the spectral characteristic.
- the horizontal axis of each graph in FIG. 2 represents the wavelength, and the vertical axis represents the reflectance.
- the reflection spectrum of biological tissue such as the inner wall of the digestive tract is the absorption characteristic of components constituting the biological tissue, specifically, the absorption spectral characteristic of oxygenated hemoglobin and reduced hemoglobin, and the wavelength characteristic of light scattering by biological tissue. to be influenced.
- 2A is a reflection spectrum when there is no light scattering, FIG.
- FIG. 2C is a reflection spectrum when there is no absorption by hemoglobin and there is light scattering
- FIG. 2B is a reflection spectrum. This is a reflection spectrum when the contribution of light scattering (attenuation of light due to scattering) and the contribution of hemoglobin absorption (attenuation of light due to absorption) are approximately the same.
- the value of the biological information can vary depending on the intensity of light scattering. That is, if the biological information is calculated using the spectral characteristics of the biological tissue (for example, the reflectance in the wavelength region R2) as it is, a calculation result including an error due to light scattering can be obtained. In order to obtain a highly accurate analysis result, it is necessary to correct an error caused by light scattering.
- a method of correcting an error caused by light scattering a method of correcting an error after calculating biological information such as oxygen saturation Sat from the spectral characteristic of biological tissue, or an intermediate method that does not depend on light scattering from the spectral characteristic of biological tissue.
- biological information such as oxygen saturation Sat from the spectral characteristic of biological tissue, or an intermediate method that does not depend on light scattering from the spectral characteristic of biological tissue.
- biological information that does not include errors due to light scattering is acquired by the latter method.
- the present inventor has strong sensitivity (correlation) with respect to biological information to be acquired, for example, the total hemoglobin amount tHb or the oxygen saturation Sat that is a characteristic amount of biological tissue, A search was made for parameters with little sensitivity to scattering.
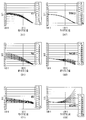
- FIG. 3-5 is a graph showing an example of correlation between various parameters that can be acquired from endoscopic image data, total hemoglobin amount tHb, and oxygen saturation Sat, and is a graph in which simulation results of various parameters are plotted. .
- the horizontal axis of each graph represents the total hemoglobin amount tHb, and the vertical axis represents the value of each parameter.
- Table 1 summarizes the specifications of each graph in FIGS. 3-5.
- “Sensitivity” in Table 1 is the sensitivity of each parameter with respect to changes in total hemoglobin amount tHb, light scattering intensity and oxygen saturation Sat, which can be read from each graph in FIGS. Is indicated by three-stage stars. The more stars, the higher the sensitivity of the parameter, that is, the larger the fluctuation range.
- FIG. 3 (A1) and (A2) are graphs in which the simulation results of the parameter “G / R” are plotted.
- G is a pixel value of a G pixel (color pixel to which a green G color filter is attached) obtained by normal observation using white light as illumination light for living tissue.
- R is a pixel value of the R pixel (color pixel to which a red R color filter is attached) obtained by the normal observation.
- the parameter “G / R” is obtained by dividing the pixel value G obtained by normal observation by the pixel value R. Normal observation refers to capturing an image of a living tissue with white light WL, which will be described later, and acquiring R, G, and B component images in the RGB color space.
- the pixel value is not limited to the pixel value of the imaging signal (so-called RAW data) of the image sensor provided with the RGB primary color filter, but the demosaic processing (interpolation processing) or linear matrix processing is performed from the imaging signal.
- the pixel value of the image data obtained through various image processing such as the above is also included.
- RAW data the imaging signal
- G component, and B component image data in the RGB color space obtained by demosaicing and color space conversion processing of an imaging signal of an image sensor including a complementary color filter.
- Each process described later can also be performed using the values as the R pixel value, the G pixel value, and the B pixel value, respectively.
- B1 and (B2) are graphs in which the simulation results of the parameter “B / R” are plotted.
- “B” is a pixel value of a B pixel (color pixel to which a blue B color filter is attached) obtained by normal observation using white light WL.
- the parameter “B / R” is obtained by dividing the pixel value B obtained by normal observation by the pixel value R.
- (C1) and (C2) are graphs in which simulation results of the parameter “B / G” are plotted.
- the parameter “B / G” is obtained by dividing the pixel value B obtained by normal observation by the pixel value G.
- (D1) and (D2) are graphs in which the simulation result of the parameter “W / R” is plotted.
- “W” is the pixel value of the G pixel obtained by special observation using illumination light in the wavelength range R0 (W band) shown in FIG. As will be described later, the wavelength range R0 is included in the wavelength range in which the G pixel of the image sensor has sensitivity.
- the parameter “W / R” is obtained by dividing the pixel value W of the G pixel obtained by special observation using illumination light in the W band by the pixel value R obtained by normal observation.
- the graphs (E1) and (E2) in FIG. 4 are graphs plotting simulation results of the parameter “N / R”.
- “N” is the pixel value of the G pixel obtained by special observation using illumination light in the wavelength region R2 (N band) shown in FIG.
- the parameter “N / R” is obtained by dividing the pixel value N of the G pixel obtained by special observation using N-band illumination light by the pixel value R obtained by normal observation.
- (F1) and (F2) are graphs in which simulation results of the parameter “N / W” are plotted.
- the parameter “N / W” indicates the pixel value N of the G pixel obtained by special observation using the N-band illumination light, and the pixel value W of G pixel obtained by special observation using the W-band illumination light. Divided by.
- the graphs (G1) and (G2) in FIG. 5 are graphs plotting simulation results of the parameter “W / (R + G)”.
- the parameter “W / (R + G)” is a pixel value of the R pixel obtained by the normal observation using the white light WL as the illumination light and the pixel value W of the G pixel obtained by the special observation using the W band illumination light.
- the value R is divided by the sum “R + G” of the pixel value G of the G pixel.
- FIG. 5 is a plot in which light scattering contributions (parameters representing the intensity of light scattering) are varied by 10 units from 0 to 100 units and are superimposed. From these graphs, the magnitude of sensitivity of each parameter to light scattering can be known.
- the graphs (A2), (B2), (C2), (D2), (E2), (F2), and (G2) on the right side in FIGS. 3 to 5 fix the contribution of scattering to 0 units.
- the oxygen saturation Sat is changed by 10% from 0 to 100% and is plotted. From these graphs, the magnitude of sensitivity of each parameter to the oxygen saturation Sat can be known.
- the parameter “W / R” has a large sensitivity to the total hemoglobin amount tHb, while the light scattering and the oxygen saturation Sat. Has little sensitivity. Therefore, the value of the total hemoglobin amount tHb is uniquely determined by the value of the parameter “W / R”. That is, from the quantitative relationship between the value of the parameter “W / R” obtained from the image data and the total hemoglobin amount tHb represented by the graphs (D1) and (D2) and the parameter “W / R”, light scattering and oxygen An accurate total hemoglobin amount tHb that does not depend on the degree of saturation Sat can be obtained.
- the parameter “N / W” has a high sensitivity to the oxygen saturation Sat, but is not sensitive to light scattering. Almost no sensitivity. Therefore, if the total hemoglobin amount tHb is known, the value of the oxygen saturation Sat is uniquely determined from the value of the parameter “N / W” by the graph (F2). Specifically, selecting a plot on the graph (F2) that best matches a numerical value pair consisting of the value of the total hemoglobin amount tHb obtained from each pixel value and the value of the parameter “N / W” corresponds to that plot. As the value of the oxygen saturation Sat to be obtained, the oxygen saturation Sat of the biological tissue copied to the pixel is obtained.
- the value of the total hemoglobin amount tHb is the value of the parameter “W / R” obtained from the image data, the total hemoglobin amount tHb and the parameter “W / R” represented in the graphs (D1) and (D2). Derived from the relationship.
- the parameter “W / (R + G)”, that is, the ratio W / (R + G) is the same as the parameter “W / R” described above. Furthermore, since it has sensitivity to the total hemoglobin amount tHb, but has little sensitivity to light scattering and oxygen saturation Sat, the total hemoglobin amount tHb shown in the graphs (G1) and (G2) From the quantitative relationship with the parameter “W / (R + G)”, an accurate value of the total hemoglobin amount tHb independent of light scattering and oxygen saturation Sat is obtained.
- the relationship represented by the graph (D1), (D2) or the graph (G1), (G2) and the relationship represented by the graph (F2) or (C2) can be used to simplify the process.
- these parameter W / R, parameter W / (R + G), parameter N / W, and the like are also referred to as ratio W / R, ratio W / (R + G), ratio N / W, and the like.
- the molecule “W” of “W / R” or “W / (R + G)” in the graph (D1) of FIG. 4 or the graph (G1) of FIG. 5 depends on the oxygen saturation Sat as described above. Since the pixel value of the image using the illumination light in the wavelength region R0 (W band) that reflects the integrated value AR0 of the hemoglobin absorbance that changes according to the total hemoglobin amount tHb, “W” is The value varies depending on the total hemoglobin amount tHb without depending on the oxygen saturation Sat. This “W” is affected by light scattering as shown in FIG.
- image data of an image having a component in the wavelength range and the denominator “R” or “(R + G)” has no sensitivity to the total hemoglobin amount tHb of the living tissue and is free from light scattering by the living tissue.
- image data of an image having a component in a wavelength region that is sensitive.
- Image data of an image having a component in a predetermined wavelength region means image data of an image formed with light having a component in a predetermined wavelength region. Therefore, based on the image data “W” and the image data “R” or “(R + G)”, there is sensitivity to the total amount of hemoglobin tHb and sensitivity to light scattering by the living tissue. Can be generated.
- the total hemoglobin amount tHb and the oxygen saturation Sat are calculated from a plurality of image data.
- a numerical table T1 (or function) representing the quantitative relationship between the total hemoglobin amount tHb and the parameter W / R is used, and the ratio W / R in the living tissue is referred to with reference to the numerical table T1. From this, the total hemoglobin amount tHb can be calculated.
- a numerical table T1 (or function) representing the quantitative relationship between the total hemoglobin amount tHb and the parameter W / (R + G) is used.
- the total hemoglobin amount tHb can also be calculated from the ratio W / (R + G).
- a numerical table T2 (or function) representing the quantitative relationship between the total hemoglobin amount tHb, the parameter N / W, and the oxygen saturation Sat is used.
- the oxygen saturation Sat can be calculated from the ratio N / W.
- the parameter N / W has sensitivity to the oxygen saturation Sat (second feature amount) of the living tissue, and also to the total hemoglobin amount tHb (first feature amount) and light scattering. This parameter has no sensitivity.
- FIG. 6 is a block diagram illustrating an example of the configuration of the endoscope apparatus 1 according to the present embodiment.
- FIG. 7 is a block diagram illustrating an example of the configuration of the controller of the endoscope apparatus 1.
- the endoscope apparatus 1 of this embodiment includes an electronic endoscope 100, a processor 200, and a monitor 300.
- the electronic endoscope 100 and the monitor 300 are detachably connected to the processor 200.
- the processor 200 includes a light source unit 400 and an image processing unit 500.
- the electronic endoscope 100 has an insertion tube 110 that is inserted into the body of a subject. Inside the electronic endoscope 100, a light guide 131 that extends over substantially the entire length is provided. One end portion (tip portion 131a) of the light guide 131 is disposed at the tip portion (insertion tube tip portion 111) of the insertion tube 110, and the other end portion (base end portion 131b) of the light guide 131 is connected to the processor 200. It is connected.
- the processor 200 includes a light source unit 400 including a light source lamp 430 that generates white light WL having a large light amount, such as a xenon lamp, and the illumination light IL generated by the light source unit 400 is emitted from the light guide 131.
- the light enters the base end 131b.
- the light incident on the proximal end 131b of the light guide 131 is guided to the distal end portion 131a through the light guide 131 and is emitted from the distal end portion 131a.
- a light distribution lens 132 is provided at the distal end portion 111 of the insertion tube of the electronic endoscope 100 so as to face the distal end portion 131 a of the light guide 131, and illumination emitted from the distal end portion 131 a of the light guide 131.
- the light IL passes through the light distribution lens 132 and illuminates the living tissue T in the vicinity of the insertion tube distal end portion 111.
- an objective optical system 121 and an image sensor 141 are provided at the distal end portion 111 of the insertion tube.
- a part (return light) of the illumination light IL reflected or scattered on the surface of the living tissue T is incident on the objective optical system 121 and is condensed and imaged on the light receiving surface of the image sensor 141.
- the image sensor 141 of the present embodiment is a CCD (Charge Coupled Device) image sensor for color image capturing, which includes a color filter 141a on its light receiving surface.
- As the image sensor 141 another type of image sensor such as a CMOS (Complementary Metal Metal Oxide Semiconductor) image sensor may be used.
- the objective optical system 121, the color filter 141 a, and the image sensor 141 constitute an image capturing unit 122.
- the color filter 141 a includes an R color filter that transmits red light, a G color filter that transmits green light, and a B color filter that transmits blue light, and is arranged on each light receiving element of the image sensor 141. It is a so-called on-chip filter formed directly. That is, the color filter 141a is configured to filter the light before being received by the image sensor 141 into R, G, and B wavelength ranges in the RGB color space.
- the R, G, and B filters have spectral characteristics as shown in FIG.
- FIG. 8 is a diagram illustrating an example of a transmission spectrum of a color filter built in the image sensor 141.
- the R color filter of the present embodiment is a filter that passes light having a wavelength longer than about 570 nm
- the G color filter is a filter that passes light having a wavelength of about 470 nm to 620 nm
- the B color filter is about a wavelength of about 570 nm. It is a filter that allows light having a wavelength shorter than 530 nm to pass.
- the imaging element 141 is controlled to be driven in synchronization with an image processing unit 500 described later, and periodically (for example, 1/30 second) an imaging signal corresponding to an image of a living tissue imaged on the light receiving surface. Output at intervals.
- the imaging signal output from the imaging element 141 is sent to the image processing unit 500 of the processor 200 via the cable 142.
- the image processing unit 500 includes an A / D conversion circuit 510, a temporary storage memory 520, a controller 530, a video memory 540, and a signal processing circuit 550.
- the A / D conversion circuit 510 performs A / D conversion on an imaging signal input from the imaging device 141 of the electronic endoscope 100 via the cable 142 and outputs digital image data.
- Digital image data output from the A / D conversion circuit 510 is sent to and stored in the temporary storage memory 520.
- the digital image data includes R digital image data captured by a light receiving element to which an R color filter is mounted, G digital image data captured by a light receiving element to which a G color filter is mounted, and light reception to which a B color filter is mounted.
- B digital image data imaged by the element is included.
- the controller 530 processes one or more digital image data stored in the temporary storage memory 520, generates screen data to be displayed on the monitor 300, and sends this to the video memory 540.
- the controller 530 includes image data representing the distribution of the total hemoglobin amount tHb of the living tissue, screen data generated from the image data representing the distribution of the oxygen saturation Sat, screen data generated from a single digital image data, A reflection spectrum of the living tissue T is generated for each pixel (x, y) based on screen data in which images of a plurality of digital image data are arranged or a plurality of digital image data.
- Screen data including images classified by color, screen data including a graph display of the reflection spectrum of the biological tissue T corresponding to a specific pixel (x, y), and the like are generated and stored in the video memory 540.
- the controller 530 includes an internal memory 532, a first parameter generation unit 533, a first feature amount acquisition unit 534, a second parameter generation unit 535, a second feature amount acquisition unit 536, It mainly includes a feature amount distribution image generation unit 537 and a controller main body 538.
- the internal memory 532 stores digital image data picked up using each illumination light to be described later, and further, a numerical table T1 (or function) representing a quantitative relationship between the total hemoglobin amount tHb and the parameter W / R described above, and A numerical table T2 (or function) representing the quantitative relationship between the total hemoglobin amount tHb, the parameter N / W and the oxygen saturation Sat described above is held. These stored information are recalled as needed.
- the first parameter generation unit 533 generates a parameter (first parameter) W / R value for each pixel from the color image data stored in the internal memory 532.
- the value of the parameter W / R is the first special observation image data W obtained by imaging the biological tissue by light in the wavelength range R0 (W band) with the imaging element 141, and the biological tissue is imaged under illumination of the white light WL. It is the ratio of the pixel values at the same pixel position of the first normal observation image data R, which is the R component of the normal observation image data in the RGB color space.
- the wavelength range R0 is a wavelength range in which the absorbance due to the living tissue varies depending on the degree of the total hemoglobin amount tHb (first feature amount).
- the first normal observation image data R is data of an image captured through the R color filter of the image sensor 141.
- the parameter W / R is sensitive to the total amount of hemoglobin tHb of the living tissue and sensitive to light scattering by the living tissue. It is a parameter that does not.
- the first feature amount acquisition unit 534 acquires the total hemoglobin amount tHb based on the value of the parameter W / R.
- the first feature quantity acquisition unit 534 calls and refers to the numerical value table T1 (or function) representing the quantitative relationship between the total hemoglobin quantity tHb held in the internal memory 532 and the parameter W / R, thereby making the parameter W /
- the total hemoglobin amount tHb is obtained for each pixel from the R value. That is, the first feature amount acquisition unit 534 acquires the total hemoglobin amount tHb (first feature amount) based on the parameter W / R.
- the parameter W / R is obtained by imaging a living tissue under illumination of a first special light that has a wavelength range different from that of white light and has a different absorbance by the living tissue depending on the degree of the total hemoglobin amount tHb (first feature amount).
- the wavelength range of the image included in the first special observation image data W and the R component may be changed, and may also be caused by an inter-device error of the endoscope system 10.
- the wavelength range of the image including the 1 special observation image data W and the R component changes. For this reason, an appropriate coefficient ⁇ is determined, and the parameter W / ( ⁇ R) calculated by using the data ⁇ R obtained by multiplying the first normal observation image data R by the coefficient ⁇ instead of the first normal observation image data R It is also preferable to use it instead of the parameter W / R.
- This coefficient ⁇ can be obtained in advance by a preliminary test using a sample whose total hemoglobin amount tHb and oxygen saturation Sat are known. That is, it is preferable that the processor 200 performs a preliminary test using the known sample and determines and stores a suitable coefficient ⁇ before starting to use the endoscope system 10.
- the second parameter generation unit 535 generates a parameter (second parameter) N / W value for each pixel from the color image data stored in the internal memory 532.
- the value of the parameter N / W is the second special observation image data N obtained by imaging the biological tissue under illumination with light in the wavelength range R2 (N band) with the imaging element 141, and the wavelength range R0 (W band). It is a ratio of pixel values at the same pixel position of the first special observation image data W obtained by imaging the biological tissue under illumination with light by the image sensor 141.
- the wavelength region R2 (N band) is a wavelength region in which the wavelength region is different from that of the white light WL, and the absorbance by the living tissue is different depending on the degree of oxygen saturation Sat (second feature amount).
- the parameter N / W has sensitivity to the oxygen saturation Sat (second feature amount) of the living tissue and light scattering by the living tissue as shown in the graphs (F1) and (F2) of FIG. This parameter is not sensitive to.
- the second feature amount acquisition unit 536 acquires the oxygen saturation Sat based on the value of the parameter N / W.
- the second feature amount acquisition unit 536 is a numerical table T2 (representing a quantitative relationship between the total hemoglobin amount tHb acquired by the first feature amount acquisition unit 534, the parameter N / W held in the internal memory 532, and the oxygen saturation Sat).
- the oxygen saturation Sat is obtained for each pixel from the value of the parameter N / W.
- the feature amount distribution image generation unit 537 Based on the total hemoglobin amount tHb obtained by the first feature amount acquisition unit 534, the feature amount distribution image generation unit 537 generates a feature amount distribution image representing the distribution of the total hemoglobin amount tHb (first feature amount) in the living tissue. Generate. Alternatively, based on the oxygen saturation Sat obtained by the second feature quantity acquisition unit 536, a feature quantity distribution image representing the distribution of the oxygen saturation Sat (second feature quantity) in the living tissue is generated. Further, the feature amount distribution image generation unit 537 generates a feature amount distribution image representing a distribution of processing results obtained by performing a predetermined process on the total hemoglobin amount tHb or the oxygen saturation Sat.
- the screen data of the feature quantity distribution image created in this way is sent to the signal processing circuit 550.
- the controller main body 538 manages and controls operations of the processor 200 and components of the electronic endoscope 100.
- the signal processing circuit 550 generates and outputs a video signal in a predetermined format (for example, a format conforming to the NTSC standard or the DVI standard) based on the screen data sent to the signal processing circuit 550 and stored in the video memory 540. To do.
- the video signal output from the signal processing circuit 550 is input to the monitor 300. As a result, an endoscopic image captured by the electronic endoscope 100 is displayed on the monitor 300.
- the light source unit 400 includes a condensing lens 440, a rotation filter 410, a filter control unit 420, and a condensing lens 450 in addition to the light source 430 described above.
- the substantially parallel white light WL emitted from the light source 430 is collected by the condenser lens 440, passes through the rotary filter 410, and is collected again by the condenser lens 450, and is then proximal to 131 b of the light guide 131. Is incident on.
- the rotary filter 410 is movable between an application position on the optical path of the white light WL and a retracted position outside the optical path by a moving means (not shown) such as a linear guide way.
- the configuration of the light source unit 400 is not limited to that shown in FIG.
- a lamp that generates convergent light in the light source 430 may be employed.
- a configuration may be adopted in which the white light WL is condensed before the condenser lens 440 and is incident on the condenser lens 440 as diffused light.
- a configuration in which a collimator lens is used instead of the condenser lens 440 and the white light WL is incident on the rotary filter 410 in a substantially parallel light state may be employed.
- a collimator lens such as a dielectric multilayer filter
- the incident angle of the white light WL to the optical filter is caused by causing the substantially parallel white light WL to enter the rotary filter 410.
- a lamp that generates divergent light may be used for the light source 430.
- a collimator lens is used instead of the condensing lens 440 and the substantially parallel white light WL is incident on the rotary filter 410.
- the rotary filter 410 is a disc-shaped optical unit including a plurality of optical filters, and is configured such that the pass wavelength range is switched according to the rotation angle.
- the rotation angle of the rotary filter 410 is controlled by a filter control unit 420 connected to the controller 530.
- the controller 530 controls the rotation angle of the rotary filter 410 via the filter control unit 420, the spectrum of the illumination light IL that passes through the rotary filter 410 and is supplied to the light guide 131 is switched.
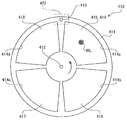
- FIG. 9 is an external view (front view) of the rotary filter 410.
- the rotary filter 410 includes a substantially disk-shaped frame 411 and four fan-shaped optical filters 415, 416, 417, and 418.
- Three fan-shaped windows 414a, 414b and 414c are formed at equal intervals around the central axis of the frame 411.
- the windows 414a, 414b, 4144c and 414d have optical filters 415, 416, 417, And 418 are fitted.
- the optical filters of the present embodiment are all dielectric multilayer filters, but other types of optical filters (for example, absorption optical filters and etalon filters using dielectric multilayer films as reflective films). May be used.
- the rotary filter 410 illustrated in FIG. 9 includes four optical filters, but may include three optical filters 415, 416, and 418.
- a boss hole 412 is formed on the central axis of the frame 411.
- An output shaft of a servo motor (not shown) provided in the filter control unit 420 is inserted into the boss hole 412 and fixed, and the rotary filter 410 rotates together with the output shaft of the servo motor.
- FIG. 9 shows a state where the white light WL is incident on the optical filter 415.
- the optical filters on which the white light WL is incident are 415, 416, In this order, the spectrum order of the illumination light IL passing through the rotation filter 410 is switched.
- Optical filters 415 and 416 are optical bandpass filters that selectively pass light in the 550 nm band. As shown in FIG. 1, the optical filter 415 allows light in the wavelength region from the equiabsorption points E1 to E4 (that is, the wavelength region R0 (W band)) to pass through with low loss, and the light in other wavelength regions. Is configured to shut off. Further, the optical filter 416 is configured to pass light in the wavelength region from the equiabsorption points E2 to E3 (that is, the wavelength region R2 (N band)) with low loss and block light in the other wavelength regions. Has been.
- the wavelength range R1 includes the peak wavelength of the absorption peak P1 derived from oxygenated hemoglobin
- the wavelength range R2 includes the peak wavelength of the absorption peak P2 derived from reduced hemoglobin
- the region R3 includes the peak wavelength of the absorption peak P3 derived from oxygenated hemoglobin.
- the wavelength range R0 includes the peak wavelengths of the three absorption peaks P1, P2, and P3.
- the W band and the N band (FIG. 1) which are the pass wavelength ranges of the optical filters 415 and 416, are included in the pass wavelength range (FIG. 8) of the G color filter of the color filter 141a. Therefore, the image data of the subject image formed by the light that has passed through the optical filter 415 or 416 is captured by the light receiving element to which the G color filter of the image sensor 141 is attached, and is obtained as G digital image data.
- the light that has passed through the optical filter 415 is the first special light that illuminates the living tissue to obtain the first special observation image data
- the light that has passed through the optical filter 416 is the second special observation image data. It is the second special light that illuminates the living tissue to obtain.
- the first special observation image data is used to obtain “W” of the parameter “W / R” described above, and the parameter “W / R” is used to obtain the total hemoglobin amount tHb.
- the second special observation image data is used to obtain “N” of the parameter “N / W” described above, and the parameter “N / W” is used to obtain the oxygen saturation Sat.
- the absorbance of the first special light by the living tissue depends on the total hemoglobin amount tHB (first feature amount) and does not depend on the oxygen saturation Sat (second feature amount), that is, R0. Wavelength range is set.
- the absorbance of the second special light by the biological tissue depends on both the total hemoglobin amount tHb (first feature amount) and the oxygen saturation Sat (second feature amount), That is, the wavelength range R2 is set.
- the optical filter 418 is an ultraviolet cut filter, and the illumination light IL (that is, white light) that has passed through the optical filter 418 is used for capturing a normal observation image. Therefore, the white light that has passed through the optical filter 418 is referred to as white light WL because there is little change in the white light WL emitted by the light source 430 and the visible light wavelength region.
- the white light WL is used to obtain “R” of the parameter “W / R” described above, and the parameter “W / R” is used to obtain the total hemoglobin amount tHb. Note that the optical filter 418 may not be used, and the window 414c of the frame 411 may be opened.
- the illumination light IL that has passed through the optical filter 415 or 416 is also referred to as special light (first special observation light, second special observation light), and white light (or broadband light) that has passed through the optical filter 418. Is also referred to as normal light (normal observation light).
- a neutral density filter (ND filter) 419 is attached to the window 414a so as to overlap the optical filter 415.
- the neutral density filter 419 has no wavelength dependence over the entire visible light range, and reduces only the amount of light without changing the spectrum of the illumination light IL.
- the neutral density filter 419 the amount of illumination light IL that has passed through the optical filter 415 and the neutral density filter 419 is adjusted to be approximately the same as the amount of illumination light IL that has passed through the optical filter 416. As a result, even when the illumination light IL that has passed through any of the optical filters 415 and 416 is used, it is possible to capture an image with appropriate exposure with the same exposure time.
- a fine metal mesh is used as the neutral density filter 419.
- a neutral density filter such as a slit or a half mirror may be used.
- the transmittance of the optical filters 415 and 416 themselves may be adjusted without using the neutral density filter.
- a neutral density filter may be attached to the windows 414b and 414c.
- the amount of light passing through may be adjusted by changing the central angle (that is, the opening area) of the windows 414a to 414c.
- a through hole 413 is formed at the peripheral edge of the frame 411.
- the through hole 413 is formed at the same position (phase) as the boundary between the window 414a and the window 414c in the rotation direction of the frame 411.
- a photo interrupter 422 for detecting the through hole 413 is arranged so as to surround a part of the peripheral edge of the frame 411.
- the photo interrupter 422 is connected to the filter control unit 420.
- the optical device 400 emits white light and special light by switching them using the rotating optical filter.
- the light source device 400 of the present embodiment is configured to emit a plurality of lights in different wavelength ranges by transmitting light emitted from one light source 430 through an optical filter, but instead of the light source lamp 430.
- a plurality of lights having different wavelength ranges for example, a semiconductor light source such as a light emitting diode or a laser element that outputs laser light can be used as a light source instead of the light source 400.
- the rotation filter 410 may not be used.
- the endoscope apparatus 1 of the present embodiment has two operation modes, a normal observation mode and a spectroscopic analysis mode.
- the normal observation mode is an operation mode for photographing a color image using the white light WL.
- spectroscopic analysis is performed based on digital image data captured using the first special light and the second special light, which are the illumination lights IL that have passed through the optical filters 415 and 416, respectively.
- a biomolecule distribution image for example, an oxygen saturation distribution image
- the operation mode of the endoscope apparatus 1 is switched by a user operation on an operation panel (not shown) of the processor 200 or an operation button (not shown) of the electronic endoscope 100, for example.
- the controller 530 controls the moving means to move the rotary filter 410 from the application position to the retracted position.
- the rotary filter 410 is disposed at the application position.
- the controller 530 controls the filter control unit 420 to stop the rotary filter 410 at a position where the white light WL enters the optical filter 418.
- the digital image data picked up by the image pickup device 141 is subjected to predetermined image processing such as demosaic, then converted to a video signal and displayed on the monitor 300.
- the controller 530 controls the filter control unit 420 to rotate the rotary filter 410 at a constant rotation speed, and while the biological filter illuminates by the illumination light IL that has passed through each of the optical filters 415, 416, and 418.
- the tissue T is imaged sequentially.
- the controller 530 includes image data of a special observation image acquired using the illumination light IL that has passed through each of the optical filters 415 and 416, and image data of a normal observation image that has been acquired using the illumination light IL that has passed through the optical filter 418.
- the screen data in which the feature amount distribution image created using and the normal observation image are arranged is generated. This screen data is further converted into a video signal and displayed on the monitor 300.
- the filter control unit 420 detects the phase of rotation of the rotary filter 410 based on the timing when the photo interrupter 422 detects the through hole 413, and uses this as the phase of the timing signal supplied from the controller 530. In comparison, the rotation phase of the rotary filter 410 is adjusted.
- the timing signal from the controller 530 is synchronized with the drive signal for the image sensor 141. Accordingly, the rotary filter 410 is rotationally driven at a substantially constant rotational speed in synchronization with the driving of the image sensor 141.
- the rotation of the rotation filter 410 is the optical filters 415, 416, and 418 on which the white light WL is incident every time one image (three frames of R, G, and B) is captured by the image sensor 141. Control is performed so that the windows 414a to 414c are switched.
- the processor 200 functions as a video processor for processing the imaging signal output from the imaging device 141 of the electronic endoscope 100 and the illumination light IL for illuminating the living tissue T as the subject. It also has a function as a light source device to be supplied to the light guide 131 of the endoscope 100.
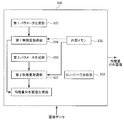
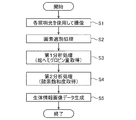
- FIG. 10 is a flowchart showing the procedure of the spectroscopic analysis process.
- the filter control unit 420 rotationally drives the rotary filter 410 at a constant rotational speed. Then, the illumination light IL that has passed through the optical filters 415, 416, and 418 is sequentially supplied from the light source unit 400, and imaging using each illumination light IL is sequentially performed (S1). Specifically, the G digital image data W (x, y) imaged using the illumination light IL, which is the first special light in the wavelength region R0 (W band) that has passed through the optical filter 415, has passed through the optical filter 416.
- Normal light that has passed through G digital image data N (x, y) and optical filter (ultraviolet ray cut filter) 418 captured using illumination light IL that is second special light in the wavelength region R2 (N band), and is white R digital image data R (x, y), G digital image data G (x, y), and B digital image data B (x, y) captured using the illumination light IL that is the light WL are stored in the internal memory of the controller 530. Stored at 532.
- the image processing unit 500 uses the R digital image data R (x, y), G digital image data G (x, y), and B digital image data B (x, y) acquired in step S1. Then, the pixel selection process S2 for selecting the pixels to be subjected to the following analysis process (processes S3-S8) is performed. This pixel selection process S2 is performed by the controller 530.
- pixels suitable for the analysis processing that is, pixels in which the spectroscopic characteristics of hemoglobin are recorded are selected, and the analysis processing is performed only on the selected pixels. It is configured.
- a1, a2, and a3 are positive constants.
- the above three conditional expressions are set based on the magnitude relationship of the values of G component ⁇ B component ⁇ R component in the blood transmission spectrum. Note that the pixel selection process S2 is performed using only one or two of the above three conditional expressions (for example, using only Formula 5 and Formula 6 focusing on the red color peculiar to blood). May be.
- the controller 530 of the image processing unit 500 performs the first analysis process S3.
- the internal memory 532 of the controller 530 holds a numerical table T1 (or function) representing the quantitative relationship between the total hemoglobin amount tHb and the parameter W / R represented by the graph (D1) or (D2) in FIG. Yes.
- the numerical table T1 is used to calculate the total hemoglobin amount tHb from the G digital image data W (x, y) and the R digital image data R (x, y) acquired in the process S1. Get the value.
- Equation 7 the parameter W / R (x, y) is calculated for each pixel (x, y) by Equation 7.
- the value of the total hemoglobin amount tHb (x, y) corresponding to the value of the parameter W / R (x, y) calculated by the mathematical formula 7 is read and acquired.
- the quantitative relationship of the numerical value table T1 (and numerical value table T2 described later) held in the internal memory 532 is obtained in advance by theoretical calculation or experiment.
- the value of the total hemoglobin amount tHb and the value of the parameter W / R do not have a one-to-one correspondence, but the numerical value table T1 A typical one-to-one quantitative relationship (for example, an average value or a median value) between the total hemoglobin amount tHb and the parameter W / R is held. Therefore, the total hemoglobin amount tHb is uniquely determined from the value of the parameter W / R by the numerical value table T1.
- the controller 530 of the image processing unit 500 performs the second analysis process S4.
- the internal memory 532 of the controller 530 holds a numerical table T2 (or function) representing the quantitative relationship between the total hemoglobin amount tHb, the parameter N / W, and the oxygen saturation Sat shown in the graph (F2) of FIG. Yes.
- the numerical value table T2 three numerical values (hereinafter referred to as “numerical value set”) of the total hemoglobin amount tHb, the parameter N / W, and the oxygen saturation Sat are held in association with each other.
- the second analysis process S4 using this numerical table T2, the G digital image data W (x, y) and N (x, y) acquired in the process S1 and the total acquired in the first analysis process S3 are used.
- the value of the oxygen saturation Sat (x, y) of each pixel is acquired from the value of the hemoglobin amount tHb (x, y).
- Equation 8 the parameter N / W (x, y) is calculated for each pixel (x, y) by Equation 8.
- a numerical table (or function) representing the relationship between the oxygen saturation Sat (x, y) and the display color (pixel value) is stored. Then, in the process S5 (FIG. 6), the controller 530 refers to this numerical table (or function), and the pixel value representing the display color corresponding to the oxygen saturation Sat (x, y) obtained in the process S4. Is generated as biometric information image data.
- the controller 530 also outputs R digital image data R (x, y) and G digital image data G (x, y) captured using the illumination light IL (white light) that has passed through the optical filter (ultraviolet cut filter) 418. ) And B digital image data B (x, y), normal observation image data is generated.
- FIG. 11 shows a display example of image data generated by the controller 530.
- FIG. 11A is a display example of oxygen saturation distribution image data (two-dimensional display) generated from the oxygen saturation Sat (x, y) acquired by the above-described process S5.
- FIG. 11B is a display example of oxygen saturation distribution image data (three-dimensional display) generated in the form of a three-dimensional graph with the oxygen saturation as a vertical axis. Note that FIG. 11 is an observation of the right hand in a state where the vicinity of the proximal interphalangeal joint of the middle finger is compressed with a rubber band. A state in which the oxygen saturation Sat is lowered due to the blood flow being blocked by the compression on the distal side of the compression portion of the right middle finger is shown.
- the controller 530 generates screen data for displaying the normal observation image and the oxygen saturation distribution image side by side on one screen from the generated oxygen saturation distribution image data and normal observation image data, and stores them in the video memory 540.
- the feature quantity distribution image generation unit 537 of the controller 530 displays a display screen that displays only the oxygen saturation distribution image, a display screen that displays only the normal observation image, the oxygen saturation distribution image, and / or the user's operation. Or a display screen in which incidental information such as patient ID information and observation conditions is superimposed on a normal observation image, a display screen of a new feature amount distribution image created by combining the total hemoglobin amount tHb and the oxygen saturation Sat, etc.
- Various display screens can be generated.
- the feature quantity distribution image generation unit 537 of the controller 530 has the total hemoglobin amount tHb acquired by the first analysis process S3 larger than a predetermined reference value (first reference value) and is acquired by the second analysis process S4.
- the lesion-enhanced image obtained by performing processing for extracting pixels whose oxygen saturation Sat is smaller than a predetermined reference value (second reference value) and performing, for example, highlighted display processing on the corresponding pixels of the normal observation image data Data may be generated, and the lesion-enhanced image may be displayed on the monitor 300 together with the normal observation image and / or the oxygen saturation distribution image (or alone).
- a process of increasing the pixel value of the corresponding pixel for example, a process of changing the hue (for example, a process of increasing the red component by increasing the R component, or a process of rotating the hue by a predetermined angle) ), A process of blinking the corresponding pixel (or changing the hue periodically).
- the controller 530 converts, for example, the deviation from the average value of the oxygen saturation Sat (x, y) and the deviation from the average value of the total hemoglobin amount tHb (x, y) instead of the lesion-emphasized image data. Based on this, an index Z (x, y) indicating the degree of suspicion of a malignant tumor may be calculated to generate image data (malignancy suspicion image data) having the index Z as a pixel value.
- the endoscope apparatus 1 has sensitivity to the total hemoglobin amount tHb (first feature amount) of the biological tissue from the color image data captured by the imaging element 141, and light scattering by the biological tissue. Since the parameter “W / R” (first parameter) is generated that has no sensitivity to the error, the error due to light scattering of the total hemoglobin amount tHb (first feature amount) is reduced. More spectroscopic analysis becomes possible.
- an image having a wavelength region component that is sensitive to the total hemoglobin amount tHb (first feature amount) of the living tissue and sensitive to light scattering by the living tissue In the endoscope apparatus 1, an image having a wavelength region component that is sensitive to the total hemoglobin amount tHb (first feature amount) of the living tissue and sensitive to light scattering by the living tissue.
- the operator who performs the procedure while operating the electronic endoscope 100 finds the position of interest from the feature amount distribution image of the biological tissue, identifies the lesioned portion of the biological tissue, and observes the feature amount in real time. Preferably an image is displayed. From this point, it is preferable to easily generate the ratio W / R (first parameter) from the two image data in a short time.
- the two image data are different from the white light WL in the wavelength range, and the first special light in the wavelength range R0 (W band) in which the absorbance by the living tissue differs depending on the degree of the total hemoglobin amount tHb (first feature amount).
- the first special observation image data W obtained by imaging the biological tissue under illumination and the R component of the normal observation image data in the RGB color space obtained by imaging the biological tissue under illumination of white light WL. 1 is normal observation image data R.
- the ratio is sensitive to changes in the absorbance in the wavelength region R0 (W band). W / R is obtained. Therefore, the total hemoglobin amount tHb (first feature amount) with high accuracy can be calculated based on the ratio W / R.
- the first normal observation image data R used for calculating the ratio W / R (first parameter) is image data captured through the R color filter of the image sensor 141. Therefore, the light is dispersed for each wavelength. There is no need to extract a component in a desired wavelength range, and the ratio W / R can be acquired in a short time. Therefore, the electronic endoscope 100 can display a feature amount distribution image in real time.
- the light source device 400 emits a white light source that uses the first special light used in the spectroscopic analysis mode for displaying the feature amount distribution image of the living tissue in the normal observation mode for displaying the image of the living tissue. Since the apparatus is configured to extract white light using an optical filter, the apparatus configuration can be simplified, the size of the processor 200 can be reduced, and the procedure can be performed while operating the electronic endoscope 100. Space for medical treatment can be secured.
- the controller 530 stores data representing a quantitative relationship between the ratio W / R (first parameter) and the total hemoglobin amount tHb (first feature amount), and the first feature amount acquisition unit 534 represents the quantitative relationship. Since the total hemoglobin amount tHb of the living tissue is obtained using the data, the present embodiment calculates the total hemoglobin amount tHb and the oxygen saturation Sat every time color image data is acquired without using data representing a quantitative relationship. The total hemoglobin amount tHb and the oxygen saturation Sat can be calculated more efficiently than in the case of performing the above. For this reason, the arithmetic circuit of the processor 200 can be reduced. Accordingly, even when a high-quality image is generated, the low-cost, low heat generation, and low power-saving processor 200 can be provided.
- the first special observation image data W for obtaining the ratio W / R is data in the same wavelength range as the G wavelength range in the RGB color space. Since it is data of an image captured by the image sensor 141, it is not necessary to separate light for each wavelength and extract a component in a desired wavelength range, and a ratio W / R can be acquired in a short time. In the electronic endoscope 100, the feature amount distribution image can be displayed in real time.
- the second parameter generation unit 535 of the processor 200 has sensitivity to the oxygen saturation Sat (second feature amount) of the biological tissue from the color image data and sensitivity to light scattering.
- the second feature quantity acquisition unit 537 is configured to generate a ratio N / W (second parameter) that is not performed, and the second feature quantity acquisition unit 537 is based on the total hemoglobin quantity tHb (first feature quantity) and the ratio N / W (second parameter).
- N / W second parameter
- the oxygen saturation Sat (second feature amount) is acquired, so that errors due to light scattering of the oxygen saturation Sat (second feature amount) are reduced, and more accurate spectroscopic analysis is performed. Analysis becomes possible.
- the light source device 400 is configured to emit second special light having a wavelength range different from that of white light and having different absorbance due to the living tissue in accordance with the degree of oxygen saturation Sat (second feature amount), and the ratio N / W is Since it is obtained using the illumination of the second special light, a ratio N / W that is sensitive to changes in the absorbance in the wavelength region R2 (N band) can be obtained. For this reason, it is possible to calculate the oxygen saturation Sat (second feature amount) with high accuracy based on the ratio N / W.
- the wavelength range of the first special light used for obtaining the ratio N / W is that the absorbance of the first special light by the living tissue is the total hemoglobin amount tHb (first feature amount). ) And is set so as not to depend on the oxygen saturation Sat (second feature amount). Specifically, since it is set in the wavelength region R0 (W band), the ratio N / W Based on this, it is possible to calculate the oxygen saturation Sat (second feature amount) with high accuracy.
- the wavelength range of the second special light used for obtaining the ratio N / W is that the absorbance of the second special light by the living tissue is the total hemoglobin amount tHb (first feature amount) and the oxygen saturation Sat ( Since it is set so as to depend on both of the second characteristic amount), the oxygen saturation Sat (second second) is highly accurate based on the total hemoglobin amount tHb and the ratio N / W obtained based on the ratio W / R. Feature amount) can be calculated.
- the second special observation image data N for obtaining the ratio N / W (second parameter) is data in the same wavelength range as the G wavelength range in the RGB color space, further, through the G color filter. Since it is data of an image captured by the image sensor 141, it is not necessary to separate light for each wavelength to extract a component in a desired wavelength region, and a ratio N / W can be acquired in a short time. In the electronic endoscope 100, the feature amount distribution image can be displayed in real time.
- the feature amount distribution image generation unit 537 of the controller 530 uses the total hemoglobin amount tHb (first feature amount) or the total hemoglobin amount tHb (first feature amount) in the living tissue based on the oxygen saturation Sat (second feature amount). ) Or oxygen saturation Sat (feature quantity distribution image representing the second feature quantity, and also the total hemoglobin quantity tHb (first feature quantity) and the oxygen saturation Sat (second feature quantity). Since the feature amount distribution image representing the result is generated, the endoscope apparatus 1 provides a support image useful for the operator who performs the procedure while operating the electronic endoscope 100 to identify the lesioned part of the living tissue. can do.
- the parameter W / R is calculated from the image data of the special observation and the normal observation, and the parameter W / R represented by the graphs (D1) and (D2) in FIG.
- the total hemoglobin amount tHb is determined based on the relationship between the total hemoglobin amount tHb and the present invention is not limited to this configuration.
- the parameter W / (R + G) is calculated from the image data of the special observation and the normal observation, and the total hemoglobin amount tHb represented by the graphs (G1) and (G2) in FIG.
- a configuration in which the total hemoglobin amount tHb is determined based on the relationship with / (R + G) may be employed.
- the wavelength range of the image including the R component and the G component changes, and the R component and the G component are also affected by the inter-device error of the endoscope system 10.
- the wavelength range of the included image varies.
- coefficients ⁇ and ⁇ are determined in advance, and using the coefficients ⁇ and ⁇ , the first normal observation image data R that is the R component of the normal observation image data and the second normal observation image data G that is the G component It is also preferable to use the parameter W / ( ⁇ R + ⁇ G) calculated by using the sum ⁇ R + ⁇ G obtained by weighting and adding instead of the sum (R + G) instead of the parameter W / (R + G).
- the coefficients ⁇ and ⁇ can be obtained in advance by a preliminary test using a sample whose total hemoglobin amount tHb and oxygen saturation are known. That is, it is preferable that the processor 200 performs a preliminary test using the known sample and determines and stores suitable coefficients ⁇ and ⁇ before starting to use the endoscope system 10.
- the parameter N / W is calculated from the image data of special observation, the parameter N / W represented by the graph (F2) in FIG. 4, the total hemoglobin amount tHb, and the oxygen
- the structure which determines oxygen saturation Sat based on the relationship with saturation Sat is employ
- this invention is not limited to this structure.
- the parameter B / G is calculated from the normal observation image data, and the parameter B / G, the total hemoglobin amount tHb, and the oxygen saturation Sat represented by the graph (C2) in FIG.
- a configuration in which the oxygen saturation Sat is determined based on the relationship can also be adopted.
- the optical filter 426 can be reduced, and the oxygen saturation Sat can be reduced with a smaller processing amount and time. It is possible to acquire biological information such as.
- the present invention is applied to the analysis of the concentration distribution of hemoglobin in the living tissue, but the concentration of another biological substance (for example, a secretion product such as a hormone) that changes the color of the living tissue.
- the present invention can also be applied to distribution analysis.
- the image sensor 141 of the present embodiment has been described as an image sensor for color image capturing provided with R, G, and B primary color filters on the front surface thereof, but is not limited to this configuration.
- an image sensor for capturing a color image including a Y, Cy, Mg, G complementary color filter may be used.
- the image sensor 141 of the present embodiment has been described as an image sensor for color image imaging including the on-chip color filter 141a.
- the image sensor 141 is not limited to this configuration. It is good also as a structure provided with the color filter of what is called a field sequential system using this image pick-up element.
- the color filter 141a is not limited to an on-chip configuration, and can be arranged in the optical path from the light source 430 to the image sensor 141.
- the rotary filter 410 is used.
- the present invention is not limited to this configuration, and other types of wavelength tunable filters whose pass wavelength band can be switched can be used.
- a configuration in which the rotary filter 410 is provided on the light source side and performs filtering on the white light WL is employed.
- the present invention is not limited to this configuration, and the rotary filter 410 is used.
- the present invention in the spectroscopic analysis mode, a configuration is adopted in which imaging is performed at a predetermined time interval while rotating the rotary filter 410 at a constant rotation speed, but the present invention is limited to this configuration.
- the rotation position of the rotary filter 410 may be changed stepwise at predetermined time intervals, and imaging may be performed while the rotary filter 410 is stationary.
- a white light source such as a xenon lamp is used as a light source that generates broadband light for illumination, but a non-white light having a sufficient amount of light over the entire pass wavelength range of each optical filter to be used. It is also possible to use a light source that generates broadband light.
- a transmission type optical filter is used, but a reflection type optical filter that reflects the pass wavelength band may be used.
- the present embodiment is an endoscope system (endoscope apparatus), but can also be applied to an analysis apparatus using a digital camera (for example, a digital single lens reflex camera or a digital video camera).
- a digital camera for example, a digital single lens reflex camera or a digital video camera
- the imaging unit is applied to a digital still camera, it is possible to observe body surface tissue and brain tissue during craniotomy (for example, rapid examination of cerebral blood flow).
- the analysis device includes a light source device, an imaging unit including an imaging device configured to capture an image of a biological tissue illuminated with light emitted from the light source device and generate color image data, and imaging of the imaging device.
- the first parameter is configured to generate a first parameter that is sensitive to the first feature amount of the biological tissue and not sensitive to light scattering by the biological tissue from the color image data obtained by the above.
- a processor having a one-parameter generation unit and a first feature amount acquisition unit configured to acquire a first feature amount based on the first parameter.
- Endoscope apparatus 100 Electronic endoscope 110 Insertion tube 111 Insertion tube front-end
Abstract
Description
光源装置と、
前記光源装置が発する光で照明された生体組織を撮像してカラー画像データを生成するように構成された撮像素子を備えた撮像部を有する内視鏡と、
前記カラー画像データから、前記生体組織の第1特徴量に対して感度を有し、且つ、前記生体組織による光散乱に対して感度を有しない第1パラメータを生成するように構成された第1パラメータ生成部と、前記第1パラメータに基づいて前記第1特徴量を取得するように構成された第1特徴量取得部と、を有するプロセッサと、
を備えることを特徴とする内視鏡システム。 (Aspect 1)
A light source device;
An endoscope having an image pickup unit including an image pickup device configured to pick up an image of a living tissue illuminated by light emitted from the light source device and generate color image data;
A first parameter configured to generate a first parameter that is sensitive to the first feature amount of the biological tissue and not sensitive to light scattering by the biological tissue from the color image data. A processor comprising: a parameter generation unit; and a first feature quantity acquisition unit configured to acquire the first feature quantity based on the first parameter;
An endoscope system comprising:
前記第1パラメータ生成部は、前記生体組織の第1特徴量に対して感度を有し、且つ、前記生体組織による光散乱に対して感度を有する波長域の成分を持つ像のカラー画像データXと、前記生体組織の第1特徴量に対して感度を有さず、且つ、前記生体組織による光散乱に対して感度を有する波長域の成分を持つ像のカラー画像データYと、に基づいて前記第1パラメータを生成するように構成される、態様1に記載の内視鏡システム。 (Aspect 2)
The first parameter generation unit is sensitive to the first feature amount of the biological tissue and has color component X in an image having a wavelength region component sensitive to light scattering by the biological tissue. And color image data Y of an image that has no sensitivity to the first feature amount of the living tissue and has a component in a wavelength region that has sensitivity to light scattering by the living tissue. The endoscope system according to
前記光源装置は、白色光と波長域が異なり、前記第1特徴量の程度に応じて前記生体組織による吸光度が異なる第1特殊光を発するように構成され、
前記カラー画像データXは、前記第1特殊光の照明下で前記生体組織を撮像して得た第1特殊観察画像データWであり、
前記カラー画像データYは、前記白色光の照明下で前記生体組織を撮像して得たRGB色空間上の通常観察画像データのR成分である第1通常観察画像データRであり、
前記第1パラメータは、前記第1特殊観察画像データWと前記第1通常観察画像データRとの比W/Rである、
態様2に記載の内視鏡システム。 (Aspect 3)
The light source device is configured to emit first special light having a wavelength range different from that of white light, and having a different absorbance by the living tissue according to the degree of the first feature amount,
The color image data X is first special observation image data W obtained by imaging the living tissue under illumination of the first special light,
The color image data Y is first normal observation image data R that is an R component of normal observation image data in the RGB color space obtained by imaging the living tissue under illumination of the white light,
The first parameter is a ratio W / R between the first special observation image data W and the first normal observation image data R.
The endoscope system according to aspect 2.
前記光源装置は、白色光と波長域が異なり、前記第1特徴量の程度に応じて前記生体組織による吸光度が異なる第1特殊光を発するように構成され、
前記カラー画像データXは、前記第1特殊光の照明下で前記生体組織を撮像して得た第1特殊観察画像データWであり、
前記カラー画像データYは、前記白色光の照明下で前記生体組織を撮像して得たRGB色空間上の通常観察画像データのR成分である第1通常観察画像データRに、予め設定された係数を乗算したデータαRであり、
前記第1パラメータは、前記第1特殊観察画像データWと前記データαRとの比W/(αR)である、
態様2に記載の内視鏡システム。
この場合、前記係数は、予め、前記第1特徴量が既知のサンプルを用いた予備試験によって求めることが好ましい。すなわち、前記プロセッサは、前記内視鏡システムの使用を始める前に、前記既知のサンプルを用いた予備試験を行って、前記係数αを定めて記憶しておくことが好ましい。 (Aspect 4)
The light source device is configured to emit first special light having a wavelength range different from that of white light, and having a different absorbance by the living tissue according to the degree of the first feature amount,
The color image data X is first special observation image data W obtained by imaging the living tissue under illumination of the first special light,
The color image data Y is preset to first normal observation image data R that is an R component of normal observation image data in the RGB color space obtained by imaging the living tissue under illumination of the white light. Data αR multiplied by a coefficient,
The first parameter is a ratio W / (αR) between the first special observation image data W and the data αR.
The endoscope system according to aspect 2.
In this case, the coefficient is preferably obtained in advance by a preliminary test using a sample whose first feature value is known. That is, it is preferable that the processor performs a preliminary test using the known sample and determines and stores the coefficient α before starting to use the endoscope system.
前記光源装置は、白色光と波長域が異なり、前記第1特徴量の程度に応じて前記生体組織による吸光度が異なる第1特殊光を発するように構成され、
前記カラー画像データXは、前記第1特殊光の照明下で前記生体組織を撮像して得た第1特殊観察画像データWであり、
前記カラー画像データYは、前記白色光の照明下で前記生体組織を撮像して得たRGB色空間上の通常観察画像データのR成分である第1通常観察画像データRとG成分である第2通常観察画像データGとの和R+Gであり、
前記第1パラメータは、前記第1特殊観察画像データWと前記和R+Gとの比W/(R+G)である、態様2に記載の内視鏡システム。 (Aspect 5)
The light source device is configured to emit first special light having a wavelength range different from that of white light, and having a different absorbance by the living tissue according to the degree of the first feature amount,
The color image data X is first special observation image data W obtained by imaging the living tissue under illumination of the first special light,
The color image data Y is first normal observation image data R and G components which are R components of normal observation image data in the RGB color space obtained by imaging the living tissue under illumination of the white light. 2 is the sum R + G with the normal observation image data G,
The endoscope system according to aspect 2, wherein the first parameter is a ratio W / (R + G) of the first special observation image data W and the sum R + G.
前記光源装置は、白色光と波長域が異なり、前記第1特徴量の程度に応じて前記生体組織による吸光度が異なる第1特殊光を発するように構成され、
前記カラー画像データXは、前記第1特殊光の照明下で前記生体組織を撮像して得た第1特殊観察画像データWであり、
前記カラー画像データYは、前記白色光の照明下で前記生体組織を撮像して得たRGB色空間上の通常観察画像データのR成分である第1通常観察画像データRとG成分である第2通常観察画像データGとを、予め設定された係数β及び係数γを用いて重み付け加算した和βR+γGであり、
前記第1パラメータは、前記第1特殊観察画像データWと前記和βR+γGとの比W/(βR+γG)である、態様2に記載の内視鏡システム。
この場合、前記係数α及び前記係数βは、予め、前記第1特徴量が既知のサンプルを用いた予備試験によって求めることが好ましい。すなわち、前記プロセッサは、前記内視鏡システムの使用を始める前に、前記既知のサンプルを用いた予備試験を行って、前記係数β及び前記係数γを定めて記憶しておくことが好ましい。 (Aspect 6)
The light source device is configured to emit first special light having a wavelength range different from that of white light, and having a different absorbance by the living tissue according to the degree of the first feature amount,
The color image data X is first special observation image data W obtained by imaging the living tissue under illumination of the first special light,
The color image data Y is first normal observation image data R and G components which are R components of normal observation image data in the RGB color space obtained by imaging the living tissue under illumination of the white light. 2 is a sum βR + γG obtained by weighting and adding the normal observation image data G using a preset coefficient β and coefficient γ,
The endoscope system according to aspect 2, wherein the first parameter is a ratio W / (βR + γG) between the first special observation image data W and the sum βR + γG.
In this case, it is preferable that the coefficient α and the coefficient β are obtained in advance by a preliminary test using a sample whose first feature amount is known. That is, it is preferable that the processor performs a preliminary test using the known sample and determines and stores the coefficient β and the coefficient γ before starting to use the endoscope system.
前記撮像部は、前記撮像素子による受光前の光を、RGB色空間上のRの波長域にフィルタリングするように構成されたRカラーフィルタを備え、
前記第1通常観察画像データRが、前記撮像素子のRカラーフィルタを介して撮像された画像のデータである、態様3~6のいずれか1つに記載の内視鏡システム。 (Aspect 7)
The imaging unit includes an R color filter configured to filter light before being received by the imaging element into an R wavelength range on an RGB color space,
The endoscope system according to any one of aspects 3 to 6, wherein the first normal observation image data R is data of an image captured through an R color filter of the image sensor.
前記光源装置が、
白色光を発する白色光源と、
前記白色光から前記第1特殊光を取り出すように構成された第1光学フィルタと、
を備え、
前記白色光と前記第1特殊光とを切り替えて発する、
態様3~7のいずれか1つに記載の内視鏡システム。 (Aspect 8)
The light source device is
A white light source that emits white light;
A first optical filter configured to extract the first special light from the white light;
With
Switching and emitting the white light and the first special light,
The endoscope system according to any one of aspects 3 to 7.
前記プロセッサは、前記第1パラメータと前記第1特徴量との量的関係を表すデータを記憶する記憶部を備え、
前記第1特徴量取得部が、前記量的関係を表すデータを参照して、前記第1特徴量を求めるように構成される、
態様1~8のいずれか1つに記載の内視鏡システム。 (Aspect 9)
The processor includes a storage unit that stores data representing a quantitative relationship between the first parameter and the first feature amount,
The first feature quantity acquisition unit is configured to obtain the first feature quantity with reference to data representing the quantitative relationship.
The endoscope system according to any one of
前記第1特徴量が総ヘモグロビン量である、
態様1~9のいずれか1つに記載の内視鏡システム。 (Aspect 10)
The first characteristic amount is a total hemoglobin amount;
The endoscope system according to any one of
前記第1特徴量が総ヘモグロビン量であり、
前記第1特殊観察画像データWが、前記RGB色空間上のGの波長域と同じ波長域のデータである、態様3~9のいずれか1つに記載の内視鏡システム。 (Aspect 11)
The first feature amount is a total hemoglobin amount;
The endoscope system according to any one of aspects 3 to 9, wherein the first special observation image data W is data in the same wavelength range as the G wavelength range in the RGB color space.
前記撮像部は、前記撮像素子の受光前の光を、RGB色空間上のGの波長域にフィルタリングするように構成されたGカラーフィルタを備え、
前記第1特殊観察画像データWが、前記Gカラーフィルタを介して前記撮像素子で撮像された画像データである、
態様11に記載の内視鏡システム。 (Aspect 12)
The imaging unit includes a G color filter configured to filter light before receiving light of the imaging element into a G wavelength range on an RGB color space,
The first special observation image data W is image data captured by the image sensor through the G color filter.
The endoscope system according to aspect 11.
前記プロセッサは、
前記カラー画像データから、前記生体組織の第2特徴量に対して感度を有し、且つ、前記光散乱に対して感度を有しない第2パラメータを生成するように構成された第2パラメータ生成部と、
前記第1特徴量及び前記第2パラメータに基づいて前記第2特徴量を取得するように構成された第2特徴量取得部と、を備えた、
態様1~12のいずれか1つに記載の内視鏡システム。 (Aspect 13)
The processor is
A second parameter generation unit configured to generate, from the color image data, a second parameter having sensitivity to the second feature amount of the living tissue and not having sensitivity to the light scattering. When,
A second feature quantity acquisition unit configured to acquire the second feature quantity based on the first feature quantity and the second parameter,
The endoscope system according to any one of
前記特徴量取得部が、
前記カラー画像データから、前記生体組織の第2特徴量に対して感度を有し、且つ、前記光散乱に対して感度を有しない第2パラメータを生成するように構成された第2パラメータ生成部と、
前記第1特徴量及び前記第2パラメータに基づいて前記第2特徴量を取得するように構成された第2特徴量取得部と、を備え、
前記光源装置は、白色光と波長域が異なり、前記第2特徴量の程度に応じて前記生体組織による吸光度が異なる第2特殊光を発するように構成され、
前記第2パラメータが、
前記第2特殊光の照明下で前記生体組織を撮像して得た第2特殊観察画像データNと、前記第1特殊光の照明下で前記生体組織を撮像して得た第1特殊観察画像データWと、の比N/Wである、
態様3~8のいずれか1つに記載の内視鏡システム。 (Aspect 14)
The feature quantity acquisition unit
A second parameter generation unit configured to generate, from the color image data, a second parameter having sensitivity to the second feature amount of the living tissue and not having sensitivity to the light scattering. When,
A second feature quantity acquisition unit configured to acquire the second feature quantity based on the first feature quantity and the second parameter;
The light source device is configured to emit a second special light having a wavelength range different from that of white light, and having a different absorbance by the living tissue according to the degree of the second feature amount,
The second parameter is
Second special observation image data N obtained by imaging the living tissue under illumination of the second special light, and first special observation image obtained by imaging the living tissue under illumination of the first special light. The ratio of data W to N / W.
The endoscope system according to any one of aspects 3 to 8.
前記生体組織による前記第1特殊光の吸光度が、前記第1特徴量に依存し、前記第2特徴量に依存しないように前記第1特殊光の波長域が設定されている、態様14に記載の内視鏡システム。 (Aspect 15)
The wavelength range of the said 1st special light is set so that the light absorbency of the said 1st special light by the said biological tissue may depend on the said 1st feature-value, and may not depend on the said 2nd feature-value. Endoscope system.
前記生体組織による前記第2特殊光の吸光度が、前記第1特徴量及び前記第2特徴量の両方に依存するように、前記第2特殊光の波長域が設定されている、態様15に記載の内視鏡システム。 (Aspect 16)
The mode of the aspect 15, wherein the wavelength range of the second special light is set so that the absorbance of the second special light by the biological tissue depends on both the first feature amount and the second feature amount. Endoscope system.
前記第2特徴量が酸素飽和度である、
態様13~16のいずれか1つに記載の内視鏡システム。 (Aspect 17)
The second feature amount is oxygen saturation;
The endoscope system according to any one of aspects 13 to 16.
前記第2特殊観察画像データNが、前記RGB色空間上のGの波長域と同じ波長域の画像データである、
態様17に記載の内視鏡システム。 (Aspect 18)
The second special observation image data N is image data in the same wavelength range as the G wavelength range in the RGB color space.
The endoscope system according to aspect 17.
前記撮像部は、前記撮像素子の受光前の光を、RGB色空間上のGの波長域にフィルタリングするように構成されたGカラーフィルタを備え、
前記第2特殊観察画像データNが、前記Gカラーフィルタを介して撮像された画像のデータである、
態様18に記載の内視鏡システム。 (Aspect 19)
The imaging unit includes a G color filter configured to filter light before receiving light of the imaging element into a G wavelength range on an RGB color space,
The second special observation image data N is data of an image captured through the G color filter.
The endoscope system according to aspect 18.
前記第1特徴量に基づき、前記生体組織における該第1特徴量の分布を表す特徴量分布画像を生成するように構成された特徴量分布画像生成部を備えた、
態様1~19のいずれか1つに記載の内視鏡システム。 (Aspect 20)
A feature quantity distribution image generation unit configured to generate a feature quantity distribution image representing a distribution of the first feature quantity in the living tissue based on the first feature quantity;
The endoscope system according to any one of
前記第2特徴量に基づき、前記生体組織における該第2特徴量の分布を表す特徴量分布画像を生成するように構成された特徴量分布画像生成部を備えた、
態様13~19のいずれか1つに記載の内視鏡システム。 (Aspect 21)
A feature quantity distribution image generation unit configured to generate a feature quantity distribution image representing a distribution of the second feature quantity in the living tissue based on the second feature quantity;
The endoscope system according to any one of aspects 13 to 19.
光源装置と、
前記光源装置が発する光で照明された生体組織を撮像してカラー画像データを生成するように構成された撮像素子を備えた撮像部と、
前記カラー画像データから、前記生体組織の第1特徴量に対して感度を有し、且つ、前記生体組織による光散乱に対して感度を有しない、第1パラメータを生成するように構成された第1パラメータ生成部と、前記第1パラメータに基づいて前記第1特徴量を取得するように構成された第1特徴量取得部と、を有するプロセッサと、
を備えることを特徴とする分析装置。 Another aspect of the present invention is an analyzer and includes the following aspects.
A light source device;
An imaging unit including an imaging element configured to image a living tissue illuminated by light emitted from the light source device and generate color image data;
A first parameter configured to generate a first parameter that is sensitive to the first feature amount of the biological tissue and has no sensitivity to light scattering by the biological tissue from the color image data. A processor having a one-parameter generation unit, and a first feature amount acquisition unit configured to acquire the first feature amount based on the first parameter;
An analysis apparatus comprising:
以下に説明する本実施形態の内視鏡システム(以降、内視鏡装置ともいう)は、波長域の異なる光成分を持つ撮像対象の像の画像データに基づいて被写体の生体情報(例えば、総ヘモグロビン量や酸素飽和度等の生体組織の特徴量)を定量的に分析して、分析結果を画像化して表示するシステムである。上記画像データを取得するには、生体組織の像を、生体情報が算出できるように所定の波長域に分けて受光して撮像してもよいが、ノイズが少なく精度のよい上記画像データを取得するには、互いに異なる所定の波長域の複数の光により照明された生体組織を撮像することにより、波長域の異なる成分を強調して取得することが好ましい。
以下に説明する総ヘモグロビン量及び酸素飽和度の定量分析では、血液の分光特性(すなわち、ヘモグロビンの分光特性)が総ヘモグロビン量や酸素飽和度に応じて連続的に変化する性質が利用される。 Hereinafter, the present embodiment will be described with reference to the drawings.
The endoscope system (hereinafter also referred to as an endoscope apparatus) of this embodiment described below is based on image data of an image of an imaging target having light components having different wavelength ranges (for example, total biological information) This is a system for quantitatively analyzing a biological tissue feature amount such as hemoglobin amount and oxygen saturation, and displaying the analysis result as an image. In order to acquire the image data, an image of a biological tissue may be received and imaged by dividing it into a predetermined wavelength range so that biological information can be calculated. For this purpose, it is preferable to acquire by emphasizing components having different wavelength ranges by imaging a living tissue illuminated with a plurality of lights having different predetermined wavelength ranges.
In the quantitative analysis of the total hemoglobin amount and oxygen saturation described below, the property that the spectral characteristics of blood (that is, the spectral characteristics of hemoglobin) continuously change according to the total hemoglobin amount and oxygen saturation is used.
白色光とは、厳密に可視光の全ての波長成分を含むものに限らず、例えば、上記R,G,Bにおける上記波長域の成分を含む光であればよい。 In this specification, “R” in an R component, R pixel in an image or image data, or an R color filter in a color filter is R (red) in the RGB color space, and is in the visible wavelength range of light. In the range of 360 to 830 nm, it means a wavelength region in a wavelength region of 570 nm or more, for example, a wavelength region of 580 to 700 nm. “G” in the G component, G pixel in the image or image data, or G color filter in the color filter, etc. is G (green) in the RGB color space, and is in the visible wavelength range of light. Of 360 to 830 nm, for example, it means a wavelength region in a wavelength region of 470 to 620 nm. “B” in the B component in the image or the image data, the B pixel, or the B color filter in the color filter is B (blue) in the RGB color space, and is in the visible wavelength range of light 360˜ Of 830 nm, it means a wavelength region in a wavelength region of 530 nm or less, for example, a wavelength region of 420-520 nm. In addition, “R”, “G”, and “B” may independently represent the pixel values of the R pixel, the G pixel, and the B pixel of the image.
The white light is not limited to one that strictly includes all the wavelength components of visible light, and may be any light that includes components in the above-described wavelength regions in R, G, and B, for example.
本実施形態の内視鏡装置の詳しい構成を説明する前に、ヘモグロビンの分光特性と、本実施形態に係る酸素飽和度等の生体組織の特徴量(生体情報)の計算原理について説明する。 <Spectral characteristics of biological tissue and calculation principle of biological information>
Before describing the detailed configuration of the endoscope apparatus of the present embodiment, the calculation principle of the spectral characteristics of hemoglobin and the feature amount (biological information) of biological tissue such as oxygen saturation according to the present embodiment will be described.
このように、上記波長域R0及び波長域R2は、酸素飽和度によらず吸収が一定になる点と、酸素飽和度によって吸収が変化する領域とを有する波長域に基づいて定められる。上記波長域R0及び波長域R2の範囲は、特に限定されないが、上記酸素飽和度による変化が大きい領域に基づいて定められることが好ましい。例えば、W帯については、500nm~600nmの範囲内とすることが好ましく、520nm~590nmの範囲内とすることがより好ましい。また、N帯については、例えば、W帯の範囲内で、W帯よりも範囲が狭く、且つ、520nm~590nmの範囲内とすることが好ましく、540nm~580nmの範囲内とすることがより好ましい。 As shown in FIG. 1, in the Q band, oxygenated hemoglobin HbO and reduced hemoglobin Hb have different peak wavelengths. Specifically, oxygenated hemoglobin HbO has an absorption peak P1 near a wavelength of 542 nm and an absorption peak P3 near a wavelength of 576 nm. On the other hand, reduced hemoglobin Hb has an absorption peak P2 near 556 nm. FIG. 1 shows a two-component absorption spectrum in which the sum of the concentrations of each component (oxygenated hemoglobin HbO, reduced hemoglobin Hb) is constant. Therefore, the absorption is independent of the concentration of each component (ie, oxygen saturation). Iso-absorption points E1, E2, E3, E4 that become constant appear. In the following description, the wavelength region sandwiched between the isosbestic points E1 and E2 is sandwiched between the wavelength region R1 and the wavelength region sandwiched between the isosbestic points E2 and E3 is sandwiched between the wavelength region R2 and the isosbestic points E3 and E4. This wavelength region is called a wavelength region R3. A wavelength region sandwiched between the isosbestic points E1 and E4 (that is, a combination of the wavelength regions R1, R2, and R3) is referred to as a wavelength region R0. In the following description, the wavelength band R2 is also referred to as an N band (Narrow-band), and the wavelength band R0 is also referred to as a W band (Wide-band).
Thus, the wavelength range R0 and the wavelength range R2 are determined based on a wavelength range having a point where absorption is constant regardless of oxygen saturation and a region where absorption changes depending on oxygen saturation. The ranges of the wavelength region R0 and the wavelength region R2 are not particularly limited, but are preferably determined based on a region where the change due to the oxygen saturation is large. For example, the W band is preferably in the range of 500 nm to 600 nm, and more preferably in the range of 520 nm to 590 nm. Further, the N band is, for example, within the W band, narrower than the W band, and preferably within the range of 520 nm to 590 nm, and more preferably within the range of 540 nm to 580 nm. .

Sat:酸素飽和度
[Hb]:還元ヘモグロビンの濃度
[HbO]:酸素化ヘモグロビンの濃度
[Hb]+[HbO]:総ヘモグロビン量(tHb)
Sat: oxygen saturation [Hb]: reduced hemoglobin concentration [HbO]: oxygenated hemoglobin concentration [Hb] + [HbO]: total hemoglobin amount (tHb)

図2は、シミュレーション計算によって得られた生体組織の可視域における分光特性である反射スペクトルの一例であり、分光特性に与える光散乱の影響を示したものである。図2の各グラフの横軸は波長を表し、縦軸は反射率を表す。消化管内壁等の生体組織の反射スペクトルは、生体組織を構成する成分による吸収特性、具体的には、酸素化ヘモグロビン及び還元ヘモグロビンの吸収スペクトル特性に加えて、生体組織による光散乱の波長特性の影響を受ける。図2(a)は光散乱が全く無い場合の反射スペクトルであり、図2(c)はヘモグロビンによる吸収が全くなく、光散乱がある場合の反射スペクトルであり、図2(b)は反射スペクトルにおける生体組織の光散乱の寄与(散乱による光の減衰)とヘモグロビンの吸収の寄与(吸収による光の減衰)が同程度である場合の反射スペクトルである。 Next, the influence of scattering on the spectral characteristics of biological tissue will be described.
FIG. 2 is an example of a reflection spectrum, which is a spectral characteristic in the visible region of a living tissue obtained by simulation calculation, and shows the influence of light scattering on the spectral characteristic. The horizontal axis of each graph in FIG. 2 represents the wavelength, and the vertical axis represents the reflectance. The reflection spectrum of biological tissue such as the inner wall of the digestive tract is the absorption characteristic of components constituting the biological tissue, specifically, the absorption spectral characteristic of oxygenated hemoglobin and reduced hemoglobin, and the wavelength characteristic of light scattering by biological tissue. to be influenced. 2A is a reflection spectrum when there is no light scattering, FIG. 2C is a reflection spectrum when there is no absorption by hemoglobin and there is light scattering, and FIG. 2B is a reflection spectrum. This is a reflection spectrum when the contribution of light scattering (attenuation of light due to scattering) and the contribution of hemoglobin absorption (attenuation of light due to absorption) are approximately the same.

したがって、「W/R」あるいは「W/(R+G)」の分子「W」は、生体組織の総ヘモグロビン量tHbに対して感度を有し、且つ、生体組織による光散乱に対して感度を有する波長域の成分を持つ像の画像データであり、分母「R」あるいは「(R+G)」は、生体組織の総ヘモグロビン量tHbに対して感度を有さず、且つ、生体組織による光散乱に対して感度する波長域の成分を持つ像の画像データである。所定の波長域の成分を持つ像の画像データとは、所定の波長域の成分を持った光で形成されれた像の画像データであることをいう。このため、「W」の画像データと、「R」あるいは「(R+G)」の画像データに基づいて、総ヘモグロビン量tHbに対して感度を有し、且つ、生体組織による光散乱に対して感度を有しないパラメータを生成することができる。 Note that the molecule “W” of “W / R” or “W / (R + G)” in the graph (D1) of FIG. 4 or the graph (G1) of FIG. 5 depends on the oxygen saturation Sat as described above. Since the pixel value of the image using the illumination light in the wavelength region R0 (W band) that reflects the integrated value AR0 of the hemoglobin absorbance that changes according to the total hemoglobin amount tHb, “W” is The value varies depending on the total hemoglobin amount tHb without depending on the oxygen saturation Sat. This “W” is affected by light scattering as shown in FIG. On the other hand, as shown in the graph (D1) or the graph (G1), “W / R” or “W / (R + G)” is not affected by light scattering, so “W / R” or “W / ( The denominator “R” or “(R + G)” in “R + G)” has information indicating the degree of light scattering.
Therefore, the molecule “W” of “W / R” or “W / (R + G)” is sensitive to the total amount of hemoglobin tHb of the living tissue and sensitive to light scattering by the living tissue. This is image data of an image having a component in the wavelength range, and the denominator “R” or “(R + G)” has no sensitivity to the total hemoglobin amount tHb of the living tissue and is free from light scattering by the living tissue. This is image data of an image having a component in a wavelength region that is sensitive. Image data of an image having a component in a predetermined wavelength region means image data of an image formed with light having a component in a predetermined wavelength region. Therefore, based on the image data “W” and the image data “R” or “(R + G)”, there is sensitivity to the total amount of hemoglobin tHb and sensitivity to light scattering by the living tissue. Can be generated.
図6は、本実施形態に係る内視鏡装置1の構成の一例を示すブロック図である。図7は、内視鏡装置1のコントローラの構成の一例を説明するブロック図である。本実施形態の内視鏡装置1は、電子内視鏡100、プロセッサ200、及びモニタ300を備えている。電子内視鏡100及びモニタ300は、プロセッサ200に着脱可能に接続されている。また、プロセッサ200には、光源部400及び画像処理部500が内蔵されている。 <Configuration of endoscope apparatus>
FIG. 6 is a block diagram illustrating an example of the configuration of the
なお、撮像素子141の種類及びカラーフィルタ141aのフィルタ特性によっては、第1特殊観察画像データWやR成分が含む像の波長域は変化する他、内視鏡システム10の装置間誤差によっても第1特殊観察画像データWやR成分の含む像の波長域は変化する。このため、適切な係数αを定め、この係数αを第1通常観察画像データRに乗算したデータαRを、第1通常観察画像データRの代わりに用いて算出されるパラメータW/(αR)を、パラメータW/Rの代わりに用いることも好ましい。この係数αは、予め、総ヘモグロビン量tHb及び酸素飽和度Satが既知のサンプルを用いた予備試験によって求めることができる。すなわち、プロセッサ200は、内視鏡システム10の使用を始める前に、上記既知のサンプルを用いた予備試験を行って、好適な係数αを定めて記憶しておくことが好ましい。 The first feature
Depending on the type of the
コントローラ本体部538は、プロセッサ200及び電子内視鏡100の構成部分の動作の管理及び制御を行う。 The screen data of the feature quantity distribution image created in this way is sent to the
The controller main body 538 manages and controls operations of the
ここで、光学フィルタ415を通過した光は、第1特殊観察画像データを得るために生体組織を照明する第1特殊光であり、光学フィルタ416を通過した光は、第2特殊観察画像データを得るために生体組織を照明する第2特殊光である。第1特殊観察画像データは、上述したパラメータ「W/R」の「W」を取得するために用いられ、パラメータ「W/R」は、総ヘモグロビン量tHbを求めるために用いられる。第2特殊観察画像データは、上述したパラメータ「N/W」の「N」を取得するために用いられ、パラメータ「N/W」は、酸素飽和度Satを求めるために用いられる。
生体組織による第1特殊光の吸光度は、総ヘモグロビン量tHB(第1特徴量)に依存し、酸素飽和度Sat(第2特徴量)に依存しないように第1特殊光の波長域、すなわちR0波長域が設定されている。また、生体組織による第2特殊光の吸光度は、総ヘモグロビン量tHb(第1特徴量)及び酸素飽和度Sat(第2特徴量)の両方に依存するように、第2特殊光の波長域、すなわち波長域R2が設定されている。 Further, the W band and the N band (FIG. 1), which are the pass wavelength ranges of the
Here, the light that has passed through the optical filter 415 is the first special light that illuminates the living tissue to obtain the first special observation image data, and the light that has passed through the
The absorbance of the first special light by the living tissue depends on the total hemoglobin amount tHB (first feature amount) and does not depend on the oxygen saturation Sat (second feature amount), that is, R0. Wavelength range is set. In addition, the absorbance of the second special light by the biological tissue depends on both the total hemoglobin amount tHb (first feature amount) and the oxygen saturation Sat (second feature amount), That is, the wavelength range R2 is set.
なお、光学フィルタ418を使用せず、フレーム411の窓414cを開放した構成としてもよい。また、本明細書において、光学フィルタ415又は416を通過した照明光ILを特殊光(第1特殊観察光、第2特殊観察光)とも称し、光学フィルタ418を通過した白色光(又は広帯域光)を通常光(通常観察光)とも称する。 The
Note that the
このように、光学装置400は、白色光と特殊光とを、回転する光学フィルタを用いて切り替えて発する。 A through
Thus, the


なお、撮像素子141の種類及びカラーフィルタ141aのフィルタ特性によっては、R成分やG成分の含む像の波長域は変化する他、内視鏡システム10の装置間誤差によってもR成分やG成分が含む像の波長域は変化する。このため、適切な係数β,γを予め定め、係数β,γを用いて、通常観察画像データのR成分である第1通常観察画像データRとG成分である第2通常観察画像データGとを重み付け加算した和βR+γGを、和(R+G)の代わりに用いて算出されるパラメータW/(βR+γG)を、パラメータW/(R+G)の代わりに用いることも好ましい。係数β,γは、予め、総ヘモグロビン量tHb及び酸素飽和度が既知のサンプルを用いた予備試験によって求めることができる。すなわち、プロセッサ200は、内視鏡システム10の使用を始める前に、上記既知のサンプルを用いた予備試験を行って、好適な係数β,γを定めて記憶しておくことが好ましい。 In the present embodiment, in the first analysis process S1, the parameter W / R is calculated from the image data of the special observation and the normal observation, and the parameter W / R represented by the graphs (D1) and (D2) in FIG. The total hemoglobin amount tHb is determined based on the relationship between the total hemoglobin amount tHb and the present invention is not limited to this configuration. For example, in the first analysis process S1, the parameter W / (R + G) is calculated from the image data of the special observation and the normal observation, and the total hemoglobin amount tHb represented by the graphs (G1) and (G2) in FIG. A configuration in which the total hemoglobin amount tHb is determined based on the relationship with / (R + G) may be employed. In this case, since the influence of scattering on the parameter W / (R + G) is very small, a smaller measurement of noise caused by scattering is possible.
Depending on the type of the
この場合、分析装置は、光源装置と、光源装置が発する光で照明された生体組織を撮像してカラー画像データを生成するように構成された撮像素子を備えた撮像部と、撮像素子の撮像により得られたカラー画像データから、生体組織の第1特徴量に対して感度を有し、且つ、生体組織による光散乱に対して感度を有しない第1パラメータを生成するように構成された第1パラメータ生成部と、この第1パラメータに基づいて第1特徴量を取得するように構成された第1特徴量取得部と、を有するプロセッサと、を備える。 The present embodiment is an endoscope system (endoscope apparatus), but can also be applied to an analysis apparatus using a digital camera (for example, a digital single lens reflex camera or a digital video camera). For example, when the imaging unit is applied to a digital still camera, it is possible to observe body surface tissue and brain tissue during craniotomy (for example, rapid examination of cerebral blood flow).
In this case, the analysis device includes a light source device, an imaging unit including an imaging device configured to capture an image of a biological tissue illuminated with light emitted from the light source device and generate color image data, and imaging of the imaging device. The first parameter is configured to generate a first parameter that is sensitive to the first feature amount of the biological tissue and not sensitive to light scattering by the biological tissue from the color image data obtained by the above. A processor having a one-parameter generation unit and a first feature amount acquisition unit configured to acquire a first feature amount based on the first parameter.
100 電子内視鏡
110 挿入管
111 挿入管先端部
121 対物光学系
122 撮像部
131 ライトガイド
131a 先端部
131b 基端部
132 レンズ
141 撮像素子
141a カラーフィルタ
142 ケーブル
200 プロセッサ
300 モニタ
400 光源部
410 回転フィルタ
420 フィルタ制御部
430 光源
440 集光レンズ
450 集光レンズ
500 画像処理部
510 A/D変換回路
520 一時記憶メモリ
530 コントローラ
532 内部メモリ
533 第1パラメータ生成部
534 第1特徴量取得部
535 第2パラメータ生成部
536 第2特徴量取得部
537 特徴量分布画像生成部
538 コントローラ本体部
540 ビデオメモリ
550 信号処理回路 DESCRIPTION OF
Claims (22)
- 光源装置と、
前記光源装置が発する光で照明された生体組織を撮像してカラー画像データを生成するように構成された撮像素子を備えた撮像部を有する内視鏡と、
前記カラー画像データから、前記生体組織の第1特徴量に対して感度を有し、且つ、前記生体組織による光散乱に対して感度を有しない第1パラメータを生成するように構成された第1パラメータ生成部と、前記第1パラメータに基づいて前記第1特徴量を取得するように構成された第1特徴量取得部と、を有するプロセッサと、
を備えることを特徴とする内視鏡システム。 A light source device;
An endoscope having an image pickup unit including an image pickup device configured to pick up an image of a living tissue illuminated by light emitted from the light source device and generate color image data;
A first parameter configured to generate a first parameter that is sensitive to the first feature amount of the biological tissue and not sensitive to light scattering by the biological tissue from the color image data. A processor comprising: a parameter generation unit; and a first feature quantity acquisition unit configured to acquire the first feature quantity based on the first parameter;
An endoscope system comprising: - 前記第1パラメータ生成部は、前記生体組織の第1特徴量に対して感度を有し、且つ、前記生体組織による光散乱に対して感度を有する波長域の成分を持つ像のカラー画像データXと、前記生体組織の第1特徴量に対して感度を有さず、且つ、前記生体組織による光散乱に対して感度を有する波長域の成分を持つ像のカラー画像データYと、に基づいて前記第1パラメータを生成するように構成される、請求項1に記載の内視鏡システム。 The first parameter generation unit is sensitive to the first feature amount of the biological tissue and has color component X in an image having a wavelength region component sensitive to light scattering by the biological tissue. And color image data Y of an image that has no sensitivity to the first feature amount of the living tissue and has a component in a wavelength region that has sensitivity to light scattering by the living tissue. The endoscope system according to claim 1, configured to generate the first parameter.
- 前記光源装置は、白色光と波長域が異なり、前記第1特徴量の程度に応じて前記生体組織による吸光度が異なる第1特殊光を発するように構成され、
前記カラー画像データXは、前記第1特殊光の照明下で前記生体組織を撮像して得た第1特殊観察画像データWであり、
前記カラー画像データYは、前記白色光の照明下で前記生体組織を撮像して得たRGB色空間上の通常観察画像データのR成分である第1通常観察画像データRであり、
前記第1パラメータは、前記第1特殊観察画像データWと前記第1通常観察画像データRとの比W/Rである、
請求項2に記載の内視鏡システム。 The light source device is configured to emit first special light having a wavelength range different from that of white light, and having a different absorbance by the living tissue according to the degree of the first feature amount,
The color image data X is first special observation image data W obtained by imaging the living tissue under illumination of the first special light,
The color image data Y is first normal observation image data R that is an R component of normal observation image data in the RGB color space obtained by imaging the living tissue under illumination of the white light,
The first parameter is a ratio W / R between the first special observation image data W and the first normal observation image data R.
The endoscope system according to claim 2. - 前記光源装置は、白色光と波長域が異なり、前記第1特徴量の程度に応じて前記生体組織による吸光度が異なる第1特殊光を発するように構成され、
前記カラー画像データXは、前記第1特殊光の照明下で前記生体組織を撮像して得た第1特殊観察画像データWであり、
前記カラー画像データYは、前記白色光の照明下で前記生体組織を撮像して得たRGB色空間上の通常観察画像データのR成分である第1通常観察画像データRに、予め設定された係数を乗算したデータαRであり、
前記第1パラメータは、前記第1特殊観察画像データWと前記データαRとの比W/(αR)である、
請求項2に記載の内視鏡システム。 The light source device is configured to emit first special light having a wavelength range different from that of white light, and having a different absorbance by the living tissue according to the degree of the first feature amount,
The color image data X is first special observation image data W obtained by imaging the living tissue under illumination of the first special light,
The color image data Y is preset to first normal observation image data R that is an R component of normal observation image data in the RGB color space obtained by imaging the living tissue under illumination of the white light. Data αR multiplied by a coefficient,
The first parameter is a ratio W / (αR) between the first special observation image data W and the data αR.
The endoscope system according to claim 2. - 前記光源装置は、白色光と波長域が異なり、前記第1特徴量の程度に応じて前記生体組織による吸光度が異なる第1特殊光を発するように構成され、
前記カラー画像データXは、前記第1特殊光の照明下で前記生体組織を撮像して得た第1特殊観察画像データWであり、
前記カラー画像データYは、前記白色光の照明下で前記生体組織を撮像して得たRGB色空間上の通常観察画像データのR成分である第1通常観察画像データRとG成分である第2通常観察画像データGとの和R+Gであり、
前記第1パラメータは、前記第1特殊観察画像データWと前記和R+Gとの比W/(R+G)である、請求項2に記載の内視鏡システム。 The light source device is configured to emit first special light having a wavelength range different from that of white light, and having a different absorbance by the living tissue according to the degree of the first feature amount,
The color image data X is first special observation image data W obtained by imaging the living tissue under illumination of the first special light,
The color image data Y is first normal observation image data R and G components which are R components of normal observation image data in the RGB color space obtained by imaging the living tissue under illumination of the white light. 2 is the sum R + G with the normal observation image data G,
The endoscope system according to claim 2, wherein the first parameter is a ratio W / (R + G) of the first special observation image data W and the sum R + G. - 前記光源装置は、白色光と波長域が異なり、前記第1特徴量の程度に応じて前記生体組織による吸光度が異なる第1特殊光を発するように構成され、
前記カラー画像データXは、前記第1特殊光の照明下で前記生体組織を撮像して得た第1特殊観察画像データWであり、
前記カラー画像データYは、前記白色光の照明下で前記生体組織を撮像して得たRGB色空間上の通常観察画像データのR成分である第1通常観察画像データRとG成分である第2通常観察画像データGとを、予め設定された係数β及び係数γを用いて重み付け加算した和βR+γGであり、
前記第1パラメータは、前記第1特殊観察画像データWと前記和βR+γGとの比W/(βR+γG)である、請求項2に記載の内視鏡システム。 The light source device is configured to emit first special light having a wavelength range different from that of white light, and having a different absorbance by the living tissue according to the degree of the first feature amount,
The color image data X is first special observation image data W obtained by imaging the living tissue under illumination of the first special light,
The color image data Y is first normal observation image data R and G components which are R components of normal observation image data in the RGB color space obtained by imaging the living tissue under illumination of the white light. 2 is a sum βR + γG obtained by weighting and adding the normal observation image data G using a preset coefficient β and coefficient γ,
The endoscope system according to claim 2, wherein the first parameter is a ratio W / (βR + γG) between the first special observation image data W and the sum βR + γG. - 前記撮像部は、前記撮像素子による受光前の光を、RGB色空間上のRの波長域にフィルタリングするように構成されたRカラーフィルタを備え、
前記第1通常観察画像データRが、前記撮像素子のRカラーフィルタを介して撮像された画像のデータである、請求項3~6のいずれか1項に記載の内視鏡システム。 The imaging unit includes an R color filter configured to filter light before being received by the imaging element into an R wavelength range on an RGB color space,
The endoscope system according to any one of claims 3 to 6, wherein the first normal observation image data R is data of an image captured through an R color filter of the image sensor. - 前記光源装置が、
白色光を発する白色光源と、
前記白色光から前記第1特殊光を取り出すように構成された第1光学フィルタと、
を備え、
前記白色光と前記第1特殊光とを切り替えて発する、
請求項3~7のいずれか1項に記載の内視鏡システム。 The light source device is
A white light source that emits white light;
A first optical filter configured to extract the first special light from the white light;
With
Switching and emitting the white light and the first special light,
The endoscope system according to any one of claims 3 to 7. - 前記プロセッサは、前記第1パラメータと前記第1特徴量との量的関係を表すデータを記憶する記憶部を備え、
前記第1特徴量取得部が、前記量的関係を表すデータを参照して、前記第1特徴量を求めるように構成される、
請求項1~8のいずれか1項に記載の内視鏡システム。 The processor includes a storage unit that stores data representing a quantitative relationship between the first parameter and the first feature amount,
The first feature quantity acquisition unit is configured to obtain the first feature quantity with reference to data representing the quantitative relationship.
The endoscope system according to any one of claims 1 to 8. - 前記第1特徴量が総ヘモグロビン量である、
請求項1~9のいずれか1項に記載の内視鏡システム。 The first characteristic amount is a total hemoglobin amount;
The endoscope system according to any one of claims 1 to 9. - 前記第1特徴量が総ヘモグロビン量であり、
前記第1特殊観察画像データWが、前記RGB色空間上のGの波長域と同じ波長域のデータである、請求項3~9のいずれか1項に記載の内視鏡システム。 The first feature amount is a total hemoglobin amount;
The endoscope system according to any one of claims 3 to 9, wherein the first special observation image data W is data in the same wavelength region as the G wavelength region in the RGB color space. - 前記撮像部は、前記撮像素子の受光前の光を、RGB色空間上のGの波長域にフィルタリングするように構成されたGカラーフィルタを備え、
前記第1特殊観察画像データWが、前記Gカラーフィルタを介して前記撮像素子で撮像された画像データである、
請求項11に記載の内視鏡システム。 The imaging unit includes a G color filter configured to filter light before receiving light of the imaging element into a G wavelength range on an RGB color space,
The first special observation image data W is image data captured by the image sensor through the G color filter.
The endoscope system according to claim 11. - 前記プロセッサは、
前記カラー画像データから、前記生体組織の第2特徴量に対して感度を有し、且つ、前記光散乱に対して感度を有しない第2パラメータを生成するように構成された第2パラメータ生成部と、
前記第1特徴量及び前記第2パラメータに基づいて前記第2特徴量を取得するように構成された第2特徴量取得部と、を備えた、
請求項1~12のいずれか1項に記載の内視鏡システム。 The processor is
A second parameter generation unit configured to generate, from the color image data, a second parameter having sensitivity to the second feature amount of the living tissue and not having sensitivity to the light scattering. When,
A second feature quantity acquisition unit configured to acquire the second feature quantity based on the first feature quantity and the second parameter,
The endoscope system according to any one of claims 1 to 12. - 前記特徴量取得部が、
前記カラー画像データから、前記生体組織の第2特徴量に対して感度を有し、且つ、前記光散乱に対して感度を有しない第2パラメータを生成するように構成された第2パラメータ生成部と、
前記第1特徴量及び前記第2パラメータに基づいて前記第2特徴量を取得するように構成された第2特徴量取得部と、を備え、
前記光源装置は、白色光と波長域が異なり、前記第2特徴量の程度に応じて前記生体組織による吸光度が異なる第2特殊光を発するように構成され、
前記第2パラメータが、
前記第2特殊光の照明下で前記生体組織を撮像して得た第2特殊観察画像データNと、前記第1特殊光の照明下で前記生体組織を撮像して得た第1特殊観察画像データWと、の比N/Wである、
請求項3~8のいずれか1項に記載の内視鏡システム。 The feature quantity acquisition unit
A second parameter generation unit configured to generate, from the color image data, a second parameter having sensitivity to the second feature amount of the living tissue and not having sensitivity to the light scattering. When,
A second feature quantity acquisition unit configured to acquire the second feature quantity based on the first feature quantity and the second parameter;
The light source device is configured to emit a second special light having a wavelength range different from that of white light, and having a different absorbance by the living tissue according to the degree of the second feature amount,
The second parameter is
Second special observation image data N obtained by imaging the living tissue under illumination of the second special light, and first special observation image obtained by imaging the living tissue under illumination of the first special light. The ratio of data W to N / W.
The endoscope system according to any one of claims 3 to 8. - 前記生体組織による前記第1特殊光の吸光度が、前記第1特徴量に依存し、前記第2特徴量に依存しないように前記第1特殊光の波長域が設定されている、請求項14に記載の内視鏡システム。 The wavelength range of the first special light is set so that the absorbance of the first special light by the living tissue depends on the first feature amount and does not depend on the second feature amount. The endoscope system described.
- 前記生体組織による前記第2特殊光の吸光度が、前記第1特徴量及び前記第2特徴量の両方に依存するように、前記第2特殊光の波長域が設定されている、請求項15に記載の内視鏡システム。 The wavelength range of the second special light is set so that the absorbance of the second special light by the biological tissue depends on both the first feature value and the second feature value. The endoscope system described.
- 前記第2特徴量が酸素飽和度である、
請求項13~16のいずれか1項に記載の内視鏡システム。 The second feature amount is oxygen saturation;
The endoscope system according to any one of claims 13 to 16. - 前記第2特殊観察画像データNが、前記RGB色空間上のGの波長域と同じ波長域の画像データである、
請求項17に記載の内視鏡システム。 The second special observation image data N is image data in the same wavelength range as the G wavelength range in the RGB color space.
The endoscope system according to claim 17. - 前記撮像部は、前記撮像素子の受光前の光を、RGB色空間上のGの波長域にフィルタリングするように構成されたGカラーフィルタを備え、
前記第2特殊観察画像データNが、前記Gカラーフィルタを介して撮像された画像のデータである、
請求項18に記載の内視鏡システム。 The imaging unit includes a G color filter configured to filter light before receiving light of the imaging element into a G wavelength range on an RGB color space,
The second special observation image data N is data of an image captured through the G color filter.
The endoscope system according to claim 18. - 前記第1特徴量に基づき、前記生体組織における該第1特徴量の分布を表す特徴量分布画像を生成するように構成された特徴量分布画像生成部を備えた、
請求項1~19のいずれか1項に記載の内視鏡システム。 A feature quantity distribution image generation unit configured to generate a feature quantity distribution image representing a distribution of the first feature quantity in the living tissue based on the first feature quantity;
The endoscope system according to any one of claims 1 to 19. - 前記第2特徴量に基づき、前記生体組織における該第2特徴量の分布を表す特徴量分布画像を生成するように構成された特徴量分布画像生成部を備えた、
請求項13~19のいずれか1項に記載の内視鏡システム。 A feature quantity distribution image generation unit configured to generate a feature quantity distribution image representing a distribution of the second feature quantity in the living tissue based on the second feature quantity;
The endoscope system according to any one of claims 13 to 19. - 光源装置と、
前記光源装置が発する光で照明された生体組織を撮像してカラー画像データを生成するように構成された撮像素子を備えた撮像部と、
前記カラー画像データから、前記生体組織の第1特徴量に対して感度を有し、且つ、前記生体組織による光散乱に対して感度を有しない、第1パラメータを生成するように構成された第1パラメータ生成部と、前記第1パラメータに基づいて前記第1特徴量を取得するように構成された第1特徴量取得部と、を有するプロセッサと、
を備えることを特徴とする分析装置。 A light source device;
An imaging unit including an imaging element configured to image a living tissue illuminated by light emitted from the light source device and generate color image data;
A first parameter configured to generate a first parameter that is sensitive to the first feature amount of the biological tissue and has no sensitivity to light scattering by the biological tissue from the color image data. A processor having a one-parameter generation unit, and a first feature amount acquisition unit configured to acquire the first feature amount based on the first parameter;
An analysis apparatus comprising:
Priority Applications (4)
| Application Number | Priority Date | Filing Date | Title |
|---|---|---|---|
| JP2017504445A JP6113943B1 (en) | 2015-11-02 | 2016-11-02 | Endoscope system and analyzer |
| CN201680002600.9A CN107072487B (en) | 2015-11-02 | 2016-11-02 | Endoscopic system and analytical equipment |
| DE112016005019.4T DE112016005019B4 (en) | 2015-11-02 | 2016-11-02 | Endoscope system |
| US15/765,773 US10441147B2 (en) | 2015-11-02 | 2016-11-02 | Endoscope system and analyzing apparatus |
Applications Claiming Priority (2)
| Application Number | Priority Date | Filing Date | Title |
|---|---|---|---|
| JP2015215520 | 2015-11-02 | ||
| JP2015-215520 | 2015-11-02 |
Publications (1)
| Publication Number | Publication Date |
|---|---|
| WO2017078085A1 true WO2017078085A1 (en) | 2017-05-11 |
Family
ID=58662063
Family Applications (1)
| Application Number | Title | Priority Date | Filing Date |
|---|---|---|---|
| PCT/JP2016/082641 WO2017078085A1 (en) | 2015-11-02 | 2016-11-02 | Endoscope system and analyzing device |
Country Status (5)
| Country | Link |
|---|---|
| US (1) | US10441147B2 (en) |
| JP (2) | JP6113943B1 (en) |
| CN (1) | CN107072487B (en) |
| DE (1) | DE112016005019B4 (en) |
| WO (1) | WO2017078085A1 (en) |
Cited By (1)
| Publication number | Priority date | Publication date | Assignee | Title |
|---|---|---|---|---|
| WO2018230130A1 (en) * | 2017-06-13 | 2018-12-20 | オリンパス株式会社 | Endoscope device and display image generation method |
Families Citing this family (2)
| Publication number | Priority date | Publication date | Assignee | Title |
|---|---|---|---|---|
| CN110381806B (en) | 2017-03-31 | 2021-12-10 | Hoya株式会社 | Electronic endoscope system |
| WO2019008942A1 (en) * | 2017-07-03 | 2019-01-10 | 富士フイルム株式会社 | Medical image processing device, endoscope device, diagnostic support device, medical service support device and report generation support device |
Citations (4)
| Publication number | Priority date | Publication date | Assignee | Title |
|---|---|---|---|---|
| JP2002085342A (en) * | 2000-09-11 | 2002-03-26 | Olympus Optical Co Ltd | Endoscope instrument |
| WO2013035532A1 (en) * | 2011-09-05 | 2013-03-14 | 富士フイルム株式会社 | Endoscope system, processor device thereof and image formation method |
| WO2013172156A1 (en) * | 2012-05-18 | 2013-11-21 | Hoya株式会社 | Electronic endoscope device |
| WO2014192781A1 (en) * | 2013-05-30 | 2014-12-04 | Hoya株式会社 | Method and device for generating image showing concentration distribution of biological substances in biological tissue |
Family Cites Families (12)
| Publication number | Priority date | Publication date | Assignee | Title |
|---|---|---|---|---|
| CN101779945B (en) * | 2009-01-14 | 2014-05-14 | 富士胶片株式会社 | Method and device for processing endoscope image and endoscope system using same |
| US9420153B2 (en) | 2010-02-10 | 2016-08-16 | Hoya Corporation | Electronic endoscope system |
| EP2544583B1 (en) * | 2010-03-08 | 2016-03-02 | Bruce Adams | System, method and article for normalization and enhancement of tissue images |
| JP5616304B2 (en) * | 2010-08-24 | 2014-10-29 | 富士フイルム株式会社 | Electronic endoscope system and method for operating electronic endoscope system |
| JP5405445B2 (en) * | 2010-12-17 | 2014-02-05 | 富士フイルム株式会社 | Endoscope device |
| JP2013198547A (en) * | 2012-03-23 | 2013-10-03 | Fujifilm Corp | Light source device and endoscopic system |
| JP2014036759A (en) | 2012-08-17 | 2014-02-27 | Hoya Corp | Electronic endoscope system and light source device for endoscope |
| JP6128888B2 (en) * | 2013-02-27 | 2017-05-17 | オリンパス株式会社 | Image processing apparatus, image processing method, and image processing program |
| JP5997676B2 (en) * | 2013-10-03 | 2016-09-28 | 富士フイルム株式会社 | Endoscope light source device and endoscope system using the same |
| CN107405056B (en) * | 2015-03-17 | 2020-06-30 | 奥林巴斯株式会社 | Living body observation system |
| DE112015006174T5 (en) * | 2015-03-20 | 2017-11-02 | Olympus Corporation | Device for biological observation |
| WO2017051455A1 (en) * | 2015-09-24 | 2017-03-30 | オリンパス株式会社 | Endoscope device |
-
2016
- 2016-11-02 WO PCT/JP2016/082641 patent/WO2017078085A1/en active Application Filing
- 2016-11-02 DE DE112016005019.4T patent/DE112016005019B4/en active Active
- 2016-11-02 US US15/765,773 patent/US10441147B2/en active Active
- 2016-11-02 JP JP2017504445A patent/JP6113943B1/en active Active
- 2016-11-02 CN CN201680002600.9A patent/CN107072487B/en active Active
-
2017
- 2017-03-15 JP JP2017049514A patent/JP6783168B2/en active Active
Patent Citations (4)
| Publication number | Priority date | Publication date | Assignee | Title |
|---|---|---|---|---|
| JP2002085342A (en) * | 2000-09-11 | 2002-03-26 | Olympus Optical Co Ltd | Endoscope instrument |
| WO2013035532A1 (en) * | 2011-09-05 | 2013-03-14 | 富士フイルム株式会社 | Endoscope system, processor device thereof and image formation method |
| WO2013172156A1 (en) * | 2012-05-18 | 2013-11-21 | Hoya株式会社 | Electronic endoscope device |
| WO2014192781A1 (en) * | 2013-05-30 | 2014-12-04 | Hoya株式会社 | Method and device for generating image showing concentration distribution of biological substances in biological tissue |
Cited By (3)
| Publication number | Priority date | Publication date | Assignee | Title |
|---|---|---|---|---|
| WO2018230130A1 (en) * | 2017-06-13 | 2018-12-20 | オリンパス株式会社 | Endoscope device and display image generation method |
| JPWO2018230130A1 (en) * | 2017-06-13 | 2019-06-27 | オリンパス株式会社 | Endoscope device |
| US11457796B2 (en) | 2017-06-13 | 2022-10-04 | Olympus Corporation | Endoscope system and object evaluation method |
Also Published As
| Publication number | Publication date |
|---|---|
| JP6113943B1 (en) | 2017-04-12 |
| DE112016005019B4 (en) | 2020-07-23 |
| JP6783168B2 (en) | 2020-11-11 |
| US10441147B2 (en) | 2019-10-15 |
| CN107072487B (en) | 2018-06-29 |
| DE112016005019T5 (en) | 2018-07-19 |
| JP2017104664A (en) | 2017-06-15 |
| CN107072487A (en) | 2017-08-18 |
| JPWO2017078085A1 (en) | 2017-11-02 |
| US20180279865A1 (en) | 2018-10-04 |
Similar Documents
| Publication | Publication Date | Title |
|---|---|---|
| JP6356051B2 (en) | Analytical apparatus and method of operating analytical apparatus | |
| JP6356122B2 (en) | Method and apparatus for operating apparatus for generating image showing concentration distribution of biological substance in biological tissue | |
| WO2017145529A1 (en) | Calculation system | |
| JP6204314B2 (en) | Electronic endoscope system | |
| US10925527B2 (en) | Endoscope apparatus | |
| JP6783721B2 (en) | Analysis equipment | |
| JP6467562B2 (en) | Endoscope system | |
| JP6284451B2 (en) | Endoscope device | |
| JP6615369B2 (en) | Endoscope system | |
| JP6113943B1 (en) | Endoscope system and analyzer | |
| WO2018043728A1 (en) | Endoscope system and feature amount calculation method | |
| JP2021035549A (en) | Endoscope system | |
| WO2018131631A1 (en) | Endoscope system and image display device | |
| JP6570484B2 (en) | Analysis equipment | |
| JP6584147B2 (en) | Imaging device | |
| JP6517441B2 (en) | Endoscope system | |
| WO2018037505A1 (en) | Endoscope system |
Legal Events
| Date | Code | Title | Description |
|---|---|---|---|
| ENP | Entry into the national phase |
Ref document number: 2017504445 Country of ref document: JP Kind code of ref document: A |
|
| 121 | Ep: the epo has been informed by wipo that ep was designated in this application |
Ref document number: 16862145 Country of ref document: EP Kind code of ref document: A1 |
|
| WWE | Wipo information: entry into national phase |
Ref document number: 15765773 Country of ref document: US |
|
| WWE | Wipo information: entry into national phase |
Ref document number: 112016005019 Country of ref document: DE |
|
| 122 | Ep: pct application non-entry in european phase |
Ref document number: 16862145 Country of ref document: EP Kind code of ref document: A1 |