WO2015152307A1 - Inspection system and inspection method - Google Patents
Inspection system and inspection method Download PDFInfo
- Publication number
- WO2015152307A1 WO2015152307A1 PCT/JP2015/060277 JP2015060277W WO2015152307A1 WO 2015152307 A1 WO2015152307 A1 WO 2015152307A1 JP 2015060277 W JP2015060277 W JP 2015060277W WO 2015152307 A1 WO2015152307 A1 WO 2015152307A1
- Authority
- WO
- WIPO (PCT)
- Prior art keywords
- image data
- inspected
- time correlation
- stripe
- inspection
- Prior art date
Links
Images


Classifications
-
- G—PHYSICS
- G01—MEASURING; TESTING
- G01N—INVESTIGATING OR ANALYSING MATERIALS BY DETERMINING THEIR CHEMICAL OR PHYSICAL PROPERTIES
- G01N21/00—Investigating or analysing materials by the use of optical means, i.e. using sub-millimetre waves, infrared, visible or ultraviolet light
- G01N21/84—Systems specially adapted for particular applications
- G01N21/88—Investigating the presence of flaws or contamination
- G01N21/8806—Specially adapted optical and illumination features
-
- G—PHYSICS
- G01—MEASURING; TESTING
- G01N—INVESTIGATING OR ANALYSING MATERIALS BY DETERMINING THEIR CHEMICAL OR PHYSICAL PROPERTIES
- G01N21/00—Investigating or analysing materials by the use of optical means, i.e. using sub-millimetre waves, infrared, visible or ultraviolet light
- G01N21/84—Systems specially adapted for particular applications
- G01N21/88—Investigating the presence of flaws or contamination
- G01N21/8851—Scan or image signal processing specially adapted therefor, e.g. for scan signal adjustment, for detecting different kinds of defects, for compensating for structures, markings, edges
-
- G—PHYSICS
- G01—MEASURING; TESTING
- G01N—INVESTIGATING OR ANALYSING MATERIALS BY DETERMINING THEIR CHEMICAL OR PHYSICAL PROPERTIES
- G01N21/00—Investigating or analysing materials by the use of optical means, i.e. using sub-millimetre waves, infrared, visible or ultraviolet light
- G01N21/84—Systems specially adapted for particular applications
- G01N21/88—Investigating the presence of flaws or contamination
- G01N21/8806—Specially adapted optical and illumination features
- G01N2021/8829—Shadow projection or structured background, e.g. for deflectometry
-
- G—PHYSICS
- G01—MEASURING; TESTING
- G01N—INVESTIGATING OR ANALYSING MATERIALS BY DETERMINING THEIR CHEMICAL OR PHYSICAL PROPERTIES
- G01N2201/00—Features of devices classified in G01N21/00
- G01N2201/06—Illumination; Optics
- G01N2201/062—LED's
- G01N2201/0625—Modulated LED
-
- G—PHYSICS
- G01—MEASURING; TESTING
- G01N—INVESTIGATING OR ANALYSING MATERIALS BY DETERMINING THEIR CHEMICAL OR PHYSICAL PROPERTIES
- G01N2201/00—Features of devices classified in G01N21/00
- G01N2201/06—Illumination; Optics
- G01N2201/063—Illuminating optical parts
- G01N2201/0634—Diffuse illumination
Definitions
- Embodiments described herein relate generally to an inspection system and an inspection method.
- the imaged image data does not include information regarding the time transition when the light intensity is changed. For this reason, when detecting an abnormality of the object to be inspected with the captured image data, the detection accuracy may be lowered.
- the inspection system includes a planar illumination unit that gives a periodic temporal change in light intensity by spatial movement of a stripe pattern of light intensity, and a time correlation camera or an imaging system that performs an equivalent operation.
- a time correlation image generating unit that generates a time correlation image, and a feature corresponding to the distribution of the normal vector of the inspection target surface from the time correlation image, depending on at least one of a difference from the surroundings and a difference from the reference surface
- an arithmetic processing unit for calculating a feature for detecting an abnormality.
- FIG. 1 is a diagram illustrating a configuration example of an inspection system according to the first embodiment.
- FIG. 2 is a block diagram showing the configuration of the time correlation camera of the first embodiment.
- FIG. 3 is a conceptual diagram showing frames accumulated in time series in the time correlation camera of the first embodiment.
- FIG. 4 is a diagram illustrating an example of a fringe pattern irradiated by the illumination device of the first embodiment.
- FIG. 5 is a diagram illustrating a first detection example of abnormality of an object to be inspected by the time correlation camera according to the first embodiment.
- FIG. 6 is a diagram showing an example of the amplitude of light that changes in accordance with the abnormality when the abnormality shown in FIG. FIG.
- FIG. 7 is a diagram illustrating a second example of detection of abnormality of the inspected object by the time correlation camera according to the first embodiment.
- FIG. 8 is a diagram illustrating a third example of detection of abnormality of an object to be inspected by the time correlation camera of the first embodiment.
- FIG. 9 is a diagram illustrating an example of a fringe pattern output from the illumination control unit according to the first embodiment to the illumination device.
- FIG. 10 is a diagram illustrating an example of a wave shape representing a stripe pattern after passing through the screen of the first embodiment.
- FIG. 11 is a flowchart illustrating a procedure of abnormality detection processing based on amplitude in the abnormality detection processing unit of the first embodiment.
- FIG. 12 is a flowchart illustrating a procedure of an abnormality detection process based on a phase in the abnormality detection processing unit of the first embodiment.
- FIG. 13 is a flowchart illustrating a procedure of abnormality detection processing based on amplitude and intensity in the abnormality detection processing unit of the first embodiment.
- FIG. 14 is a flowchart illustrating a procedure of an inspection process for an object to be inspected in the inspection system of the first embodiment.
- FIG. 15 is a diagram illustrating a switching example of a fringe pattern output from the illumination control unit according to the second modification.
- FIG. 16 is a diagram illustrating an example in which the illumination control unit of Modification 2 irradiates the surface including the abnormality (defect) with a stripe pattern.
- FIG. 17 is a diagram showing the relationship between the abnormality (defect) and the stripe pattern on the screen when the stripe pattern is changed in the y direction.
- FIG. 18 is a diagram illustrating an example of a fringe pattern output from the illumination control unit of Modification 3 to the illumination device.
- FIG. 19 is a diagram illustrating an example of a fringe pattern output from the illumination control unit according to the second embodiment to the illumination device.
- FIG. 20 is a diagram illustrating a correspondence relationship among the image sensor, the screen, and the surface shape of the object to be inspected in the inspection system of the second embodiment.
- FIG. 21 is a diagram illustrating an example of the surface shape of the object to be inspected when the second-order differential f xx ⁇ 0, which is an inspection target of the inspection system according to the second embodiment.
- FIG. 22 is a diagram illustrating an example of the surface shape of an object to be inspected when f xx > 0, which is an inspection target of the inspection system according to the second embodiment.
- FIG. 23 is a graph showing g / p when the stripe width in the stripe pattern is variously changed.
- FIG. 24 is a diagram illustrating an example of an amplitude ratio correspondence table used by the inspection system of the second embodiment.
- FIG. 25 is a diagram illustrating an example in which a fringe pattern according to the surface shape of the object to be inspected is irradiated from the screen by the inspection system of the third embodiment.
- FIG. 26 is a flowchart illustrating a procedure of an inspection process for an object to be inspected in the inspection system of the third embodiment.
- FIG. 27 is a diagram illustrating an example of a fringe pattern displayed on the screen by the illumination device of the third embodiment.
- FIG. 28 is a diagram showing an example in which the initial phase distribution (spatial phase distribution) on the surface of the object to be inspected or the screen for generating the stripe pattern of FIG.
- FIG. 29 shows an example of a fringe pattern projected on a spherical object to be inspected, and as shown in FIG. 25, the fringe pattern is a parallel fringe that moves in the line of sight from the time correlation camera.
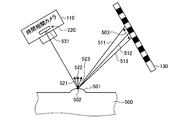
- FIG. 1 is a diagram illustrating a configuration example of an inspection system according to the present embodiment.
- the inspection system of this embodiment includes a PC 100, a time correlation camera 110, a lighting device 120, a screen 130, and an arm 140.
- the arm 140 is used to fix the object 150 to be inspected, and changes the position and orientation of the surface of the object 150 to be imaged by the time correlation camera 110 according to control from the PC 100.
- the illumination device 120 is a device that irradiates light to the object 150 to be inspected, and can control the intensity of irradiated light in units of regions in accordance with a stripe pattern from the PC 100. Furthermore, the illuminating device 120 can control the intensity
- the screen 130 diffuses the light output from the lighting device 120 and then irradiates the object 150 with light on a surface.
- the screen 130 according to the present embodiment irradiates the object 150 in a surface with the light input from the illumination device 120 and subjected to periodic time change and space change.
- An optical system component such as a condensing Fresnel lens may be provided between the illumination device 120 and the screen 130.
- the illumination unit may be configured by arranging LEDs in a plane.
- the time correlation camera 110 includes an optical system 210, an image sensor 220, a data buffer 230, a control unit 240, and a reference signal output unit 250.
- FIG. 2 is a block diagram showing the configuration of the time correlation camera 110 of the present embodiment.
- the optical system 210 includes a photographic lens and the like, transmits a light beam from a subject (including an object to be inspected) outside the time correlation camera 110, and forms an optical image of the subject formed by the light beam.
- the image sensor 220 is a sensor that can output the intensity of light incident through the optical system 210 as a light intensity signal at high speed for each pixel.
- the light intensity signal of the present embodiment is a signal obtained by the illumination device 120 of the inspection system irradiating light on the subject (including the object to be inspected) and the image sensor 220 receiving the reflected light from the subject.
- the image sensor 220 is, for example, a sensor that can be read out at a higher speed than a conventional sensor, and has a two-dimensional planar shape in which pixels are arranged in two kinds of directions: a row direction (x direction) and a column direction (y direction). It shall be configured.
- Each pixel of the image sensor 220 is defined as a pixel P (1,1),..., P (i, j),..., P (X, Y) (Note that the image size in this embodiment is X X Y). Note that the reading speed of the image sensor 220 is not limited and may be the same as the conventional one.
- the image sensor 220 receives a light beam from a subject (including an object to be inspected) transmitted by the optical system 210 and photoelectrically converts the light intensity signal (photographing) indicating the intensity of light reflected from the subject. Signal) is generated and output to the control unit 240.
- the image sensor 220 according to the present embodiment outputs the frame for each readable unit time.
- the control unit 240 includes, for example, a CPU, a ROM, a RAM, and the like. By executing an inspection program stored in the ROM, the transfer unit 241, the reading unit 242, and the intensity image superimposing unit 243. And a first multiplier 244, a first correlation image superimposing unit 245, a second multiplier 246, a second correlation image superimposing unit 247, and an image output unit 248. Note that the present invention is not limited to implementation with a CPU or the like, and may be implemented with an FPGA or an ASIC.
- the transfer unit 241 stores the frames composed of the light intensity signals output from the image sensor 220 in the data buffer 230 in chronological order.
- the data buffer 230 accumulates the frames composed of the light intensity signals output from the image sensor 220 in chronological order.
- FIG. 3 is a conceptual diagram showing frames accumulated in time series by the time correlation camera 110 of the present embodiment.
- Each pixel P (1,1),..., P (i, j),..., P (X, Y) constituting k 1, 2,.
- the frame output from the image sensor 220 includes only a light intensity signal, in other words, it can be considered as monochrome image data.
- a light intensity signal in other words, it can be considered as monochrome image data.
- the image sensor 220 generates monochrome image data in consideration of resolution, sensitivity, cost, and the like will be described.
- the image sensor 220 is not limited to a monochrome image sensor. Alternatively, a color image sensor may be used.
- the reading unit 242 of the present embodiment receives the light intensity signals G (1,1, t),..., G (i, j, t),. Y, t) are read out in frame-by-frame order and output to the first multiplier 244, the second multiplier 246, and the intensity image superimposing unit 243.
- the time correlation camera 110 of the present embodiment generates image data for each output destination of the reading unit 242. In other words, the time phase camera 110 creates three types of image data.
- the time correlation camera 110 of this embodiment generates intensity image data and two types of time correlation image data as three types of image data. Note that the present embodiment is not limited to generating three types of image data, and it may be possible to generate no intensity image data or to generate one or more types of time-correlated image data. .
- the image sensor 220 of the present embodiment outputs a frame composed of a light intensity signal for each unit time as described above.
- a light intensity signal corresponding to the exposure time necessary for photographing is required. Therefore, in the present embodiment, the intensity image superimposing unit 243 generates intensity image data by superimposing a plurality of frames for an exposure time necessary for photographing.
- each pixel value (value representing the intensity of light) G (x, y) of the intensity image data can be derived from the following equation (1).
- the exposure time is the time difference between t0 and tn.
- intensity image data in which a subject (including an object to be inspected) is photographed is generated in the same manner as with conventional camera photographing. Then, the intensity image superimposing unit 243 outputs the generated intensity image data to the image output unit 248.
- the time correlation image data is image data indicating changes in light intensity according to the time transition. That is, in the present embodiment, for each frame in time series order, the light intensity signal included in the frame is multiplied by the reference signal indicating the time transition, and the reference signal, the light intensity signal, and the time that is the multiplication result
- Temporal correlation image data is generated by generating a temporal correlation value frame composed of correlation values and superimposing a plurality of temporal correlation value frames.
- the illumination device 120 performs planar light irradiation that periodically gives temporal changes and spatial movement of the stripes via the screen 130.
- the reference signal may be a signal representing a time transition, but in the present embodiment, a complex sine wave e ⁇ j ⁇ t is used. It is assumed that the angular frequency is ⁇ and the time is t. The angular frequency ⁇ is such that the complex sine wave e ⁇ j ⁇ t representing the reference signal correlates with one period of the above-described exposure time (in other words, the time required to generate the intensity image data and the time correlation image). It shall be set.
- the planar and dynamic light formed by the illumination unit 120 and the illumination unit such as the screen 130 is in a first period (time period) at each position on the surface (reflection surface) of the inspection object 150.
- a distribution of increase or decrease in spatial irradiation intensity in a second period (spatial period) along at least one direction along the surface When this planar light is reflected by the surface, it is complex-modulated according to the specifications of the surface (normal vector distribution, etc.).
- the time correlation camera 110 receives the light complex-modulated on the surface and performs quadrature detection (orthogonal demodulation) using the reference signal of the first period, thereby obtaining time correlation image data as a complex signal.
- quadrature detection orthogonal demodulation
- each pixel value C (x, y) of the time correlation image data can be derived from the following equation (2).
- two types of time correlation image data are divided into a pixel value C1 (x, y) representing the real part and a pixel value C2 (x, y) representing the imaginary part.
- the reference signal output unit 250 generates and outputs different reference signals for the first multiplier 244 and the second multiplier 246, respectively.
- Reference signal output section 250 of this embodiment outputs the first reference signal cos ⁇ t corresponding to the real part of the complex sine wave e -Jeiomegati the first multiplier 244, the imaginary part of the complex sine wave e -Jeiomegati
- the corresponding second reference signal sin ⁇ t is output to the second multiplier 246.
- the reference signal output unit 250 according to the present embodiment describes an example in which two types of reference signals expressed as time functions of a sine wave and a cosine wave that form a Hilbert transform pair are described. Any reference signal that changes with time transition such as a function may be used.
- the first multiplier 244 calculates the real part cos ⁇ t of the complex sine wave e ⁇ j ⁇ t input from the reference signal output unit 250 for each light intensity signal of the frame in units of frames input from the reading unit 242. Multiply.
- the first correlation image superimposing unit 245 performs a process of superimposing the multiplication result of the first multiplier 244 on a pixel-by-pixel basis for a plurality of frames corresponding to the exposure time necessary for photographing.
- each pixel value C1 (x, y) of the first time correlation image data is derived from the following equation (3).
- the second multiplier 246 multiplies the light intensity signal of the frame input from the reading unit 242 by the imaginary part sin ⁇ t of the complex sine wave e ⁇ j ⁇ t input from the reference signal output unit 250.
- the second correlation image superimposing unit 247 performs a process of superimposing the multiplication result of the second multiplier 246 on a pixel-by-pixel basis for a plurality of frames corresponding to the exposure time necessary for photographing.
- each pixel value C2 (x, y) of the second time correlation image data is derived from the following equation (4).
- time correlation image data having two degrees of freedom can be generated.
- the present embodiment does not limit the type of reference signal.
- two types of time-correlated image data of the real part and the imaginary part of the complex sine wave e ⁇ j ⁇ t are created, but two types of image data based on the light amplitude and the light phase are generated. May be.
- the time correlation camera 110 of the present embodiment can create a plurality of systems as time correlation image data.
- the time correlation camera 110 includes a combination of two multipliers and two correlation image superimposing units for a plurality of systems, and the reference signal output unit 250 has an angular frequency suitable for each system.
- the reference signal by ⁇ can be output.
- the image output unit 248 outputs two types of time correlation image data and intensity image data to the PC 100.
- the PC 100 detects an abnormality of the object to be inspected using the two types of time correlation image data and the intensity image data. For that purpose, it is necessary to irradiate the subject with light.
- FIG. 4 is a diagram illustrating an example of a fringe pattern irradiated by the illumination device 120 of the present embodiment.
- the stripe pattern is scrolled (moved) in the x direction.
- a white area is a bright area corresponding to the stripe
- a black area is an interval area (dark area) corresponding to the stripe.
- the fringe pattern irradiated by the illumination device 120 is moved by one cycle with the exposure time when the time correlation camera 110 captures the intensity image data and the time correlation image data.
- the illuminating device 120 gives the time change of the light intensity periodically by the spatial movement of the stripe pattern of the light intensity.
- the time during which the fringe pattern in FIG. 4 moves by one period corresponds to the exposure time, so that each pixel of the time-correlated image data relates to at least the light intensity signal for one period of the fringe pattern. Information is embedded.
- the illumination device 120 irradiates a stripe pattern based on a rectangular wave
- the illumination device 120 is irradiated through the screen 130, so that the bright and dark boundary region of the rectangular wave can be blurred.
- the stripe pattern irradiated by the illumination device 120 is represented as A (1 + cos ( ⁇ t + kx), that is, the stripe pattern includes a plurality of stripes repeatedly (periodically).
- the intensity of the light applied to the light beam can be adjusted between 0 and 2 A, and is the light phase kx, where k is the wave number of the stripes, and x is the direction in which the phase changes.
- the fundamental frequency component of the light intensity signal f (x, y, t) of each pixel of the frame can be expressed as the following equation (5). As shown in Expression (5), the brightness of the stripe changes in the x direction.
- the intensity signal of the fringe pattern irradiated by the illumination device 120 can be considered as a complex number.
- the light from the illumination device 120 is reflected and input to the image sensor 220 from the subject (including the object to be inspected).
- the light intensity signal G (x, y, t) input to the image sensor 220 can be used as the light intensity signal f (x, y, t) of each pixel of the frame when the illumination device 120 is irradiated. Therefore, when Expression (5) is substituted into Expression (1) for deriving intensity image data, Expression (6) can be derived.
- the phase is kx.
- the time correlation image data represented by the complex number represented by the equation (7) can be replaced with the two types of time correlation image data described above. That is, the above-described time correlation image data composed of the real part and the imaginary part includes a phase change and an amplitude change due to a change in light intensity irradiated on the test object.
- the PC 100 according to the present embodiment can detect the phase change of the light emitted from the illumination device 120 and the light amplitude change based on the two types of time correlation image data. Therefore, the PC 100 according to the present embodiment, based on the time correlation image data and the intensity image data, amplitude image data representing the amplitude of light entering each pixel and phase image data representing the phase change of light entering each pixel. And generate.
- the PC 100 detects an abnormality of the object to be inspected based on the generated amplitude image data and phase image data.
- the distribution corresponding to the abnormality occurs in the distribution of normal vectors on the surface of the object to be inspected.
- the intensity of the reflected light changes.
- a change in the normal vector distribution is detected as at least one of a phase change and an amplitude change of light.
- FIG. 5 is a diagram illustrating a first detection example of an abnormality of the inspected object by the time correlation camera 110 according to the first embodiment.
- the inspected object 500 has a projecting shape abnormality 501.
- the normal vectors 521, 522, and 523 are in different directions in the region near the point 502 of the abnormality 501.
- the normal vectors 521, 522, 523 are directed in different directions, so that diffusion (for example, light 511, 512, 513) is generated in the light reflected from the abnormality 501, and the image sensor 220 of the time correlation camera 110.
- the width 503 of the fringe pattern entering the arbitrary pixel 531 is increased.
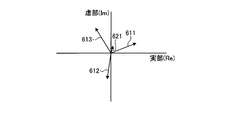
- FIG. 6 is a diagram showing an example of the amplitude of light that changes in accordance with the abnormality 501 shown in FIG.
- the amplitude of light is divided into a real part (Re) and an imaginary part (Im) and is represented on a two-dimensional plane.
- the light amplitudes 611, 612, and 613 corresponding to the lights 511, 512, and 513 in FIG.
- the light amplitudes 611, 612, and 613 cancel each other, and light having an amplitude 621 is incident on the arbitrary pixel 531 of the image sensor 220.
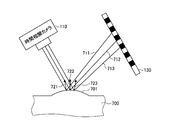
- FIG. 7 is a diagram illustrating a second example of detection of abnormality of an object to be inspected by the time correlation camera 110 according to the first embodiment.
- the surface of the object to be inspected is flat (in other words, the normal line is parallel) in the normal state, but a gentle gradient 701 is generated on the object 700 to be inspected.
- the normal vectors 721, 722, and 723 on the gradient 701 also change gently. Accordingly, the light beams 711, 712, and 713 input to the image sensor 220 are also shifted little by little.
- FIG. 7 is a diagram illustrating a second example of detection of abnormality of an object to be inspected by the time correlation camera 110 according to the first embodiment.
- the surface of the object to be inspected is flat (in other words, the normal line is parallel) in the normal state, but a gentle gradient 701 is generated on the object 700 to be inspected.
- the normal vectors 721, 722, and 723 on the gradient 701 also change gently. Accordingly, the light beams 711
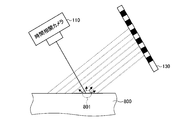
- FIG. 8 is a diagram illustrating a third example of detection of abnormality of an object to be inspected by the time correlation camera 110 according to the first embodiment.
- the dirt 801 since the dirt 801 is attached to the object 800, the light irradiated from the illumination device 120 is absorbed or diffusely reflected, and the dirt 801 of the time correlation camera 110 is photographed.
- the present embodiment it is possible to estimate that the inspected object is abnormal by detecting the change in the amplitude of the light and the change in the phase of the light based on the time correlation image data.
- the PC 100 controls the entire detection system.
- the PC 100 includes an arm control unit 101, an illumination control unit 102, and a control unit 103.
- the arm control unit 101 controls the arm 140 in order to change the surface of the object 150 to be imaged by the time correlation camera 110.
- the arm control unit 101 can photograph the surface on which the time correlation camera 110 is set according to the setting. Move 150.
- the present embodiment is not limited to repeating the movement of the arm each time shooting is completed and stopping the shooting before the shooting is started, and the arm 140 may be continuously driven.
- the arm 140 may also be referred to as a transport unit, a moving unit, a position changing unit, a posture changing unit, or the like.
- the illumination control unit 102 outputs a fringe pattern irradiated by the illumination device 120 in order to inspect the inspection object 150.
- the illumination control unit 102 of this embodiment transfers at least three or more stripe patterns to the illumination device 120 and instructs the illumination device 120 to switch and display the stripe patterns during the exposure time.
- FIG. 9 is a diagram illustrating an example of a fringe pattern output from the illumination control unit 102 to the illumination device 120.
- the illumination control unit 102 performs control so that the stripe pattern in which the black region and the white region shown in FIG. 9A are set is output.
- the stripe interval for each stripe pattern irradiated in the present embodiment is set according to the size of the abnormality (defect) to be detected, and a detailed description thereof is omitted here.
- the angular frequency ⁇ of the rectangular wave for outputting the stripe pattern is the same value as the angular frequency ⁇ of the reference signal.
- the fringe pattern output from the illumination control unit 102 can be shown as a rectangular wave, but the border area of the fringe pattern is blurred through the screen 130, that is, the bright area in the fringe pattern.
- the intensity change of light at the boundary between the (stripe region) and the dark region (interval region) gentle (dull) it can be approximated to a sine wave.
- FIG. 10 is a diagram illustrating an example of a wave shape representing a stripe pattern after passing through the screen 130. As shown in FIG. 10, the measurement accuracy can be improved by the wave shape approaching a sine wave. Further, a gray region in which the brightness changes in multiple steps may be added to the stripe, or a gradation may be given. Further, a stripe pattern including color stripes may be used.
- control unit 103 includes an amplitude-phase image generation unit 104 and an abnormality detection processing unit 105, and by intensity image data input from the time correlation camera 110 and time correlation image data, Processing is performed to calculate a feature corresponding to the distribution of the normal vector on the surface to be inspected of the inspected object 150 and detecting an abnormality based on the difference from the surroundings.
- two types of real number and imaginary part of complex number correlation image data are used instead of time correlation image data (referred to as complex time correlation image data) indicated by complex numbers. Are received from the time correlation camera 110.
- the amplitude-phase image generation unit 104 generates amplitude image data and phase image data based on the intensity image data input from the time correlation camera 110 and the time correlation image data.
- the amplitude image data is image data representing the amplitude of light entering each pixel.
- the phase image data is image data representing the phase of light entering each pixel.
- the amplitude-phase image generation unit 104 has pixel values C1 (x, y) and C2 (x, From y), each pixel value F (x, y) of the amplitude image data can be derived using Equation (8).
- an abnormality occurs in a region where the value obtained by dividing the pixel value (AT) of the intensity image data by 2 and the amplitude of the amplitude image data (which is AT / 2 when cancellation does not occur) to some extent I can guess that it is not.
- AT pixel value
- the amplitude cancellation occurs in the non-matching region. A specific method will be described later.
- the amplitude-phase image generation unit 104 uses the pixel values C1 (x, y) and C2 (x, y) to calculate each pixel value P (x, y) of the phase image data using Equation (9). Can be derived.
- the abnormality detection processing unit 105 is a feature corresponding to the distribution of normal vectors on the inspection symmetry plane based on the amplitude image data and the phase image data generated by the amplitude-phase image generation unit 104, and depending on the difference from the surroundings. Then, a feature related to the abnormality of the inspection object 150 is detected.
- the amplitude distribution of the complex time correlation image is used as the feature corresponding to the distribution of the normal vector.
- the amplitude distribution of the complex time correlation image is data indicating the amplitude distribution of each pixel of the complex time correlation image, and corresponds to amplitude image data.
- FIG. 11 is a flowchart showing a procedure of the processing in the abnormality detection processing unit 105 of the present embodiment.
- the abnormality detection processing unit 105 determines the average amplitude of the N ⁇ N region from the light amplitude value (representing pixel value) stored in each pixel of the amplitude image data, with the pixel as a reference (for example, the center). The value is subtracted (step S1101), and average difference image data of amplitude is generated. The average difference image data of the amplitude corresponds to the gradient of the amplitude.
- the integer N is set to an appropriate value depending on the embodiment.
- the abnormality detection processing unit 105 performs a mask process using a predetermined amplitude threshold value on the average difference image data of the amplitude generated by the subtraction (step S1102).
- the abnormality detection processing unit 105 calculates a standard deviation for each pixel within the mask area of the average difference image data (step S1103).
- a method based on the standard deviation will be described.
- the method is not limited to the case where the standard deviation is used. For example, an average value or the like may be used.
- the abnormality detection processing unit 105 detects a pixel having an average pixel value smaller than ⁇ 4.5 ⁇ ( ⁇ : standard deviation) as a region having an abnormality (defect) (step S1104).
- the present embodiment is not limited to detecting an abnormality from the amplitude distribution of the complex time correlation image.
- the gradient of the phase distribution may be used as a feature corresponding to the distribution of normal vectors on the inspection symmetry plane. An example using the gradient of the phase distribution will be described next.
- FIG. 12 is a flowchart showing a procedure of the processing in the abnormality detection processing unit 105 of the present embodiment.
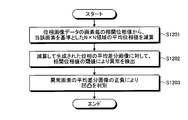
- the abnormality detection processing unit 105 subtracts the average phase value of the N ⁇ N region from the phase value of the light of each pixel of the phase image data (a pixel value representing the pixel value) using the pixel as a reference (for example, the center). (Step S1201), phase average difference image data is generated.
- the phase average difference image data corresponds to the phase gradient.
- the abnormality detection processing unit 105 compares the magnitude (absolute value) of the average difference image data of the phase generated by the subtraction with a threshold value, and determines pixels whose average difference image data size is equal to or greater than the threshold value. Then, it is detected as an abnormal (defect) pixel (step S1202).
- the abnormality detection processing unit 105 can determine the unevenness based on the sign of the average difference image data, that is, the magnitude relationship between the phase value of the pixel and the average phase value (Step S1203). Which of the pixel phase value and the average phase value is convex depends on the setting of each part, but the unevenness differs if the magnitude relationship is different.
- an abnormality can be detected from the gradient of the phase distribution obtained by another method.
- the abnormality detection processing unit 105 determines whether the difference between the average vector of the N ⁇ N region of the normalized time correlation image data and the normalized vector of each pixel is a threshold value. If it is larger than that, it can be detected as a pixel having an abnormality (defect). Further, the abnormality of the object to be inspected may be detected based on information corresponding to the phase distribution, not limited to the gradient of the phase distribution.
- FIG. 13 is a flowchart showing a procedure of the processing in the abnormality detection processing unit 105 of the present embodiment.
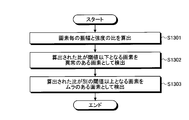
- the abnormality detection processing unit 105 uses the following equation (100) for each pixel from the time correlation image data and the intensity image data, and uses the following equation (100) to represent the amplitude (representing pixel value) C (x, y) (equation ( 7)) and intensity (a pixel value representing) G (x, y) (see equation (6)) R (x, y) is calculated (step S1301).
- R (x, y) C (x, y) / G (x, y) (100)
- the abnormality detection processing unit 105 compares the ratio R (x, y) with a threshold value, and sets a pixel having a ratio R (x, y) value equal to or less than the corresponding threshold value to a pixel having an abnormality (defect). (Step S1302). In addition, the abnormality detection processing unit 105 compares the ratio R (x, y) with a threshold value, and determines that a pixel whose ratio R (x, y) is equal to or greater than another corresponding threshold value is uneven (dirt or the like). A pixel is detected (step S1303). When the cancellation of the amplitude (attenuation) becomes significant due to an abnormality in the distribution of the normal vector, the amplitude decreases more than the strength.
- the abnormality detection processing unit 105 can detect the abnormality type in steps S1302 and S1303.
- FIG. 14 is a flowchart showing a procedure of the above-described processing in the inspection system of the present embodiment. It is assumed that the device under test 150 is already fixed to the arm 140 and arranged at the initial position of the inspection.
- the PC 100 of the present embodiment outputs a fringe pattern for inspecting the object to be inspected to the illumination device 120 (step S1401).
- the lighting device 120 stores the fringe pattern input from the PC 100 (step S1421). And the illuminating device 120 displays the stored fringe pattern so that it may change according to a time transition (step S1422).
- the conditions under which the illuminating device 120 starts display are not limited when the fringe pattern is stored, and may be, for example, when the inspector performs a start operation on the illuminating device 120.
- control part 103 of PC100 transmits the start instruction
- the time correlation camera 110 starts imaging in the area including the inspected object 150 in accordance with the transmitted imaging instruction (step S1411).
- the control unit 240 of the time correlation camera 110 generates intensity image data and time correlation image data (step S1412).
- the control unit 240 of the time correlation camera 110 outputs the intensity image data and the time correlation image data to the PC 100 (step S1413).
- the control unit 103 of the PC 100 receives the intensity image data and the time correlation image data (step S1403). Then, the amplitude-phase image generation unit 104 generates amplitude image data and phase image data from the received intensity image data and time correlation image data (step S1404).
- the abnormality detection processing unit 105 performs abnormality detection control of the inspected object based on the amplitude image data and the phase image data (step S1405). Then, the abnormality detection processing unit 105 outputs the abnormality detection result to a display device (not shown) included in the PC 100 (step S1406).
- the intensity image data is displayed, and an area of the intensity image data corresponding to the area where the abnormality is detected based on the amplitude image data and the phase image data is displayed.
- the output is not limited to visual output, and it may be output that an abnormality has been detected by voice or the like.
- the control unit 103 determines whether or not the inspection of the inspected object has been completed (step S1407). When it is determined that the inspection has not been completed (step S1407: No), the arm control unit 101 can photograph the surface of the inspection object to be inspected with the time correlation camera 110 according to a predetermined setting. In this manner, arm movement control is performed (step S1408). After the arm movement control is completed, the control unit 103 transmits an imaging start instruction to the time correlation camera 110 again (step S1402).
- step S1407 when it is determined that the inspection of the object to be inspected is completed (step S1407: Yes), the control unit 103 outputs an end instruction to the time correlation camera 110 (step S1409) and ends the process.
- step S1414 determines whether an end instruction has been received. If an end instruction has not been received (step S1414: NO), the processing is performed again from step S1411. On the other hand, if an end instruction has been received (step S1414: YES), the process ends.
- the termination process of the lighting device 120 may be performed by an inspector or may be terminated according to an instruction from another configuration.
- the present invention is not limited to the use of the time correlation camera 110 for generating the intensity image data and the time correlation image data, and a time correlation camera that can be realized by analog processing or an operation equivalent thereto.
- An imaging system may be used. For example, image data generated by a normal digital still camera is output, and the information processing apparatus superimposes a reference signal using the image data generated by the digital still camera as frame image data, thereby generating time-correlated image data.
- the time correlation image data may be generated by using a digital camera that superimposes a reference signal on a light intensity signal in the image sensor.
- Modification 1 In this embodiment, an example in which a feature related to an abnormality is detected based on a difference from the surroundings has been described, but the present invention is not limited to detecting the feature based on a difference from the surroundings.
- the feature may be detected based on a difference from data (reference data such as time correlation data, amplitude image data, phase image data, etc.). In this case, it is necessary to align and synchronize the spatial phase modulation illumination (stripe pattern) with the reference data.
- the abnormality detection processing unit 105 stores the amplitude image data and phase image data obtained from the reference surface and the amplitude image data and phase image of the inspected object 150, which are stored in advance in a storage unit (not shown). The data is compared, and it is determined whether or not there is a difference greater than a predetermined standard for any one or more of the light amplitude and the light phase between the surface of the inspected object 150 and the reference surface. To do.
- This modification is an example in which the inspection system having the same configuration as that of the first embodiment is used and the surface of a normal inspection object is used as the reference surface.
- the time correlation camera 110 images the surface of a normal object to be inspected and generates time correlation image data. Then, the PC 100 inputs the time correlation image data generated by the time correlation camera 110, generates amplitude image data and phase image data, and stores the amplitude image data and phase image data in a storage unit (not shown) of the PC 100. deep. Then, the time correlation camera 110 captures an object to be inspected for determining whether or not an abnormality has occurred, and generates time correlation image data.
- the PC 100 generates the amplitude image data and the phase image data from the time correlation image data, and then compares the amplitude image data and the phase image data with the amplitude image data and the phase image data of the normal inspection object stored in the storage unit.
- the comparison result of the amplitude image data and phase image data of a normal inspection object and the amplitude image data and phase image data of the inspection object to be inspected is data indicating characteristics for detecting an abnormality. Output.
- the feature for detecting an abnormality is equal to or greater than the predetermined reference, it can be estimated that the inspection object 150 is abnormal.
- Modification 2 In the first embodiment, the example in which the fringe pattern is moved in the x direction to detect an abnormality (defect) of the inspection object has been described. However, when an abnormality (defect) in which the normal distribution changes sharply in the y direction perpendicular to the x direction is generated in the inspection object, the fringe pattern is moved in the y direction rather than in the x direction. It may be easier to detect defects. Therefore, in the modification, an example will be described in which a fringe pattern moving in the x direction and a fringe pattern moving in the y direction are alternately switched.
- the illumination control unit 102 of this modification switches the fringe pattern output to the illumination device 120 at every predetermined time interval. Thereby, the illuminating device 120 outputs the some fringe pattern extended in the different direction with respect to one test object surface.
- FIG. 15 is a diagram illustrating a switching example of the fringe pattern output from the illumination control unit 102 of the present modification.
- the illumination control unit 102 changes the stripe pattern displayed by the illumination device 120 in the x direction.
- the illumination control unit 102 causes the stripe pattern displayed by the illumination device 120 to transition in the y direction.
- control part 103 of PC100 performed abnormality detection based on the time correlation image data obtained from the stripe pattern irradiation of FIG. 15 (A), and obtained from the stripe pattern irradiation of FIG. 15 (B). Abnormality detection is performed based on the time correlation image data.
- FIG. 16 is a diagram showing an example in which the illumination control unit 102 of the present modification irradiates the surface including the abnormality (defect) 1601 with a stripe pattern.
- an abnormality (defect) 1601 extends in the x direction.
- the illumination control unit 102 sets the fringe pattern to move in the y direction that intersects the x direction, in other words, in the direction that intersects the longitudinal direction of the abnormality (defect) 1601. With this setting, detection accuracy can be improved.
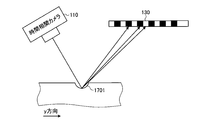
- FIG. 17 is a diagram showing the relationship between the abnormality (defect) 1701 and the stripe pattern on the screen 130 when the stripe pattern is changed in the y direction, in other words, in the direction orthogonal to the longitudinal direction of the defect 1601.
- the PC 100 can detect the abnormality (defect) from the amplitude image data corresponding to the stripe pattern moved in the y direction.
- the fringe pattern is displayed in a plurality of directions (for example, the x direction and the y direction crossing the x direction).
- the defect can be detected regardless of the shape of the defect, and the detection accuracy of the abnormality (defect) can be improved.
- the abnormality detection accuracy can be improved.
- Modification 3 the second modification described above is not limited to the method of switching the fringe pattern when performing abnormality detection in the x direction and abnormality detection in the y direction. Therefore, in Modification 3, an example in which the stripe pattern output from the illumination control unit 102 to the illumination device 120 is moved simultaneously in the x direction and the y direction will be described.
- FIG. 18 is a diagram illustrating an example of a fringe pattern output to the lighting device 120 by the lighting control unit 102 according to the present modification.
- the illumination control unit 102 moves the fringe pattern in the direction 1801.
- the stripe pattern shown in FIG. 18 includes a stripe pattern with one period 1802 in the x direction and a stripe pattern with one period 1803 in the y direction. That is, the stripe pattern shown in FIG. 18 has a plurality of stripes extending in crossing directions having different widths. It is necessary to make the width of the stripe pattern in the x direction different from the width of the stripe pattern in the y direction. Thereby, when generating the time correlation image data corresponding to the x direction and the time correlation image data corresponding to the y direction, the corresponding reference signals can be made different. In addition, since the period (frequency) of the light intensity change by the stripe pattern only needs to be changed, the moving speed of the stripe pattern (stripe) may be changed instead of changing the width of the stripe.
- the time correlation camera 110 generates time correlation image data corresponding to the stripe pattern in the x direction based on the reference signal corresponding to the stripe pattern in the x direction, and based on the reference signal corresponding to the stripe pattern in the y direction.
- time correlation image data corresponding to the stripe pattern in the y direction is generated.
- the control unit 103 of the PC 100 detects an abnormality based on the time correlation image data corresponding to the stripe pattern in the x direction, and then detects an abnormality based on the time correlation image data corresponding to the stripe pattern in the y direction. I do.
- this modification it becomes possible to detect regardless of the direction in which the defect occurs, and the detection accuracy of the abnormality (defect) can be improved.
- the illuminating device 120 demonstrated the example which displays the stripe pattern with the width
- the embodiment described above does not limit the width of the stripe in the x direction to one type, and the width of the stripe in the x direction may be a plurality of types. Therefore, in the present embodiment, an example in which a plurality of types of stripe widths in the x direction are used will be described.
- This embodiment uses a plurality of stripe widths in the x direction for one inspection target surface of the object to be inspected, in other words, using a plurality of stripe patterns having different stripes, An example of determining whether or not the shape is a protrusion is shown.
- the inspection system of the second embodiment has the same configuration as the inspection system of the first embodiment, the description thereof is omitted.
- the fringe pattern output by the illumination control unit 102 of the second embodiment will be described.
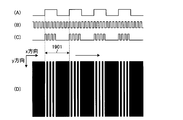
- FIG. 19 is a diagram illustrating an example of a fringe pattern output from the illumination control unit 102 of the second embodiment to the illumination device 120. As illustrated in FIG. 19, the illumination control unit 102 controls to output a stripe pattern having a plurality of stripes extending in the same direction and having different widths.
- a stripe pattern (D) corresponding to a rectangular wave (C) obtained by superimposing the rectangular wave (A) and the rectangular wave (B) in FIG. 19 is output by the illumination control unit 102.
- the rectangular wave (B) makes eight rounds while the rectangular wave (A) makes one round.
- the number of stripes represented by the rectangular wave (B) is set to be an even multiple of the number of stripes represented by the rectangular wave (A). This is based on the fact that the odd-numbered harmonic component is superimposed on the rectangular wave, and interference with the harmonic component can be suppressed by increasing the even-numbered factor.
- the width of the other stripe is set to be 8 times the width of the other stripe.
- the present invention is not limited to such an example.
- the frequency (cycle) of A) and the rectangular wave (B) may be different.
- the illuminating device 120 irradiates the to-be-inspected object 150 with the striped pattern as shown in FIG. 19 output from the illumination control unit 102 through the screen 130. Accordingly, the time correlation camera 110 captures the reflected light from the object to be inspected in the stripe pattern shown in FIG.
- the time correlation camera 110 of the present embodiment generates time correlation image data for two systems as a photographing result.
- the time correlation camera 110 generates time correlation image data corresponding to the fringe pattern of the rectangular wave (A) based on the reference signal corresponding to the fringe pattern of the rectangular wave (A). Based on the reference signal corresponding to the fringe pattern of B), time correlation image data corresponding to the fringe pattern of the rectangular wave (B) is generated.
- the two types (two systems) of output time correlation image data and intensity image data are output to the PC 100.
- Each type of time correlation image data includes time correlation image data of a real part and an imaginary part as shown in the first embodiment.
- control unit 103 of the PC 100 determines the object to be inspected based on the time correlation image data corresponding to the stripe pattern of the rectangular wave (A) and the time correlation image data corresponding to the stripe pattern of the rectangular wave (B). Anomaly detection is performed.
- the PC 100 of the present embodiment receives the time correlation image data corresponding to the stripe pattern of the rectangular wave (A) and the time correlation image data corresponding to the stripe pattern of the rectangular wave (B), thereby performing the first implementation.
- the abnormality based on the phase difference and the abnormality based on the amplitude difference as shown in the form it becomes easy to confirm the shape of the surface of the object to be inspected.
- the method of using a plurality of types of stripe widths is not limited to the method of superimposing, and one inspection object is used. Any method may be used as long as a plurality of fringe patterns having different widths can be output on the surface, and for example, control may be performed so as to switch and display a plurality of fringe patterns having different widths.
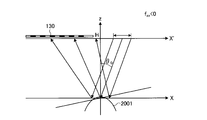
- FIG. 20 is a diagram illustrating a correspondence relationship among the image sensor 220, the screen 130, and the surface shape of the object to be inspected in the inspection system of the present embodiment.
- the fringe pattern irradiated through the screen 130 moves in the x direction, and the light irradiated from the screen 130 is reflected by the surface shape 2001 of the object to be inspected to the image sensor 220.
- the width p of the pixel 2011 of the image sensor 220 is assumed.
- x is a moving direction (phase change direction) of the spatial phase modulation illumination (stripe pattern), and x ′ is a direction parallel to x that is a distance H away from x. It is assumed that the screen 130 and the image sensor 220 are positioned along this x ′.
- the z direction is a direction orthogonal to the x direction and the x ′ direction.
- n is the normal vector
- ⁇ is the gradient (angle) of the measurement target position in the x direction
- ⁇ 0 is the angle formed by the screen 130 and the z direction. .
- the surface shape of the inspection object in the x direction is defined as f (x).
- f (x) the initial position of the surface shape of the object to be inspected, and the curvature of the surface shape of the object to be inspected.
- R the initial position of the surface shape of the object to be inspected
- f xx the second derivative of f (x). Note that the f x, f xxx etc., can be omitted because it considered only reflections from the screen position corresponding to the shift amount.
- f (x) f 0 + 1 / 2f xx x 2 (10)
- FIG. 21 is a diagram showing an example of the surface shape of the object to be inspected when the second order differential f xx ⁇ 0.
- the surface shape 2001 of the object to be inspected has a protruding shape.
- the width of the screen 130 that irradiates light entering the pixel is wider than the width of each pixel of the image sensor 220.
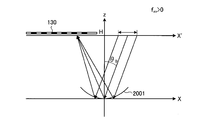
- FIG. 22 is a diagram showing an example of the surface shape of the object to be inspected when f xx > 0.
- the surface shape 2001 of the object to be inspected is a hollow shape.
- the width of the screen 130 that irradiates light entering the pixel is narrower than the width of each pixel of the image sensor 220. That is, from FIG. 21, if deriving the sign of the second derivative f xx, without viewing, it can be seen that recognize the surface shape of the inspection object.
- the reflection angle of the line of sight can be calculated from the following equation (12).
- ⁇ is tan ⁇ 0 .
- f xx x included in the right side of Expression (12) is tan ⁇ according to Expression (11). Therefore, although it can be said that it is clear from FIG. 20, this equation (12) shows that the angle ⁇ characterizing the normal vector n corresponds to the phase of the spatial phase modulation illumination (stripe pattern).
- the complex correlation pixel value g entering the pixel 2011 is obtained by integrating the phase ejkx ′ output from the screen 130 with the width p of the pixel 2011. That is, the complex correlation pixel value g can be derived from Expression (14).
- the wave number k of the stripe is set to 2 ⁇ / ⁇ , and ⁇ is the width of the stripe.
- the time correlation camera 110 has two types of time correlation images corresponding to two types of stripe widths. Data is generated by dividing it into a real part and an imaginary part. Then, the amplitude-phase image generation unit 104 of the PC 100 generates amplitude image data and phase image data for each stripe width from the input time correlation image data.
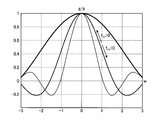
- FIG. 23 is a graph showing g / p when the stripe width in the stripe pattern is variously changed.
- the horizontal axis of FIG. 23 is w
- the vertical axis is g / p.
- the value of the variable w is a value corresponding to the inspection position if there is no change in the distribution of normal vectors on the surface of the inspection object 150 and the positional relationship of the inspection system (FIG. 20). Therefore, from FIG.
- equation (16) derived from equation (14) is used.
- Variable ⁇ is complex correlation pixel values of the width of the stripe is wide of the formula (14) and (amplitude value) g 1, complex correlation pixel values of the width of the stripe is narrow (amplitude) and g 2, the ratio of g equivalent to 2 / g 1.
- the wave numbers k 1 and k 2 are set to k 1 ⁇ k 2 .
- FIG. 24 is a diagram showing an example of an amplitude ratio correspondence table.
- the amplitude ratio correspondence table shown in FIG. 24 shows Expression (16).
- the horizontal axis in FIG. 24 is w, and the vertical axis is ⁇ .
- This amplitude ratio correspondence table is stored in advance in a storage unit (not shown) in the control unit 103.
- the stripe width (that is, the period length in the phase change direction of the spatial phase modulation illumination) may be set so as to satisfy the above.
- the shape of the inspection object to be inspected is not limited, various shapes can be considered as the surface shape of the inspection object.
- PC100 of the inspection system of this embodiment controls arm 140, and sets the position of a to-be-inspected object so that the surface of a to-be-inspected object can be inspected appropriately, when imaging a to-be-inspected object. At that time, the PC 100 delivers a fringe pattern suitable for the surface of the object to be inspected to the illumination device 120.
- FIG. 25 is a diagram showing an example in which a stripe pattern matching the surface shape of the inspection object 2501 is irradiated from the screen 130.
- the fringe patterns input to the time correlation camera 110 are equally spaced in order for the inspection system to detect an abnormality of the inspection object 2501.
- the illumination device 120 irradiates the screen 130 with the fringe pattern so that the fringe pattern after reflecting the object 2501 is equally spaced.
- the storage unit of the PC 100 stores a corresponding fringe pattern (equal intervals after reflection) for each surface to be imaged of the inspection object 2501.
- the stripe pattern is a stripe pattern set according to the inclination of the surface to be inspected of the inspection object 2501. For example, a stripe pattern is formed so that the widths of the stripes are substantially uniform when being input to the time correlation camera 110 after being reflected by the surface.
- the PC 100 outputs a fringe pattern set according to the inclination of the surface to the illumination device 120. And the illumination device 120 starts irradiation of the input fringe pattern. Thereby, the irradiation of the fringe pattern suitable for the surface shape of the inspection object 2501 can be realized.
- FIG. 26 is a flowchart showing a procedure of the above-described processing in the inspection system of the present embodiment. It is assumed that the device under test 150 is already fixed to the arm 140 and arranged at the initial position of the inspection.
- the PC 100 of the present embodiment outputs a fringe pattern corresponding to the position of the arm to the illumination device 120 (step S2601). That is, in the present embodiment, the stripe pattern associated with the position of the arm is a stripe pattern suitable for the surface shape to be imaged of the object to be inspected fixed to the arm.
- the lighting device 120 stores the fringe pattern input from the PC 100 (step S2621). And the illuminating device 120 displays the fringe pattern corresponding to the initial position of a test object so that it may change according to a time transition (step S2622).
- steps S1402 to S1406 and steps S1411 to S1413 shown in FIG. 14 the process from imaging to output of the abnormality detection result of the object to be inspected is performed (steps S2602 to S2606, steps S2611 to S2613).
- step S2607 determines whether or not the inspection of the object to be inspected is completed.
- step S2607: No the arm control unit 101 can capture the surface of the inspection object to be inspected next with the time correlation camera 110 according to a predetermined setting. In this manner, arm movement control is performed (step S2608).
- step S2608 After the arm movement control in step S2608 is completed, the control unit 103 again outputs a stripe pattern corresponding to the position of the arm to the illumination device 120 (step S2601). Thereby, whenever the surface used as imaging
- control unit 103 determines that the inspection of the object to be inspected has ended (step S2607: Yes)
- the control unit 103 outputs an end instruction to the time correlation camera 110 (step S2609), and ends the process.
- step S2614 determines whether or not an end instruction has been received. If an end instruction has not been received (step S2614: NO), the processing is performed again from step S2611. On the other hand, if an end instruction has been received (step S2614: YES), the process ends.
- the termination process of the lighting device 120 may be performed by an inspector or may be terminated according to an instruction from another configuration.
- FIG. 27 is a diagram showing an example of a stripe pattern displayed on the screen 130 by the illumination device 120 of the present embodiment.
- the fringe pattern generated at the occurrence points 2701 and 2702 (boiling points) is displayed so as to converge at the convergence point 2703 (suction point).
- an abnormality (defect) in the inspection object can be detected.
- a method for generating a fringe pattern will be described.
- FIG. 28 is an example in which the initial phase distribution ⁇ 0 (x, y) (spatial phase distribution) on the surface of the inspection object 150 or the screen 130 for generating the stripe pattern of FIG. FIG.
- the white point (light point) has a value of ⁇
- the black point (dark point) has a value of ⁇ .
- the value at the point 2701 is ⁇
- the value at the point 2702 is ⁇ / 2
- the initial value at the point 2703 (bottom point) is ⁇
- these points are set as constraints
- each point is a vertex.
- the initial phase distribution ⁇ 0 (x, y) is set so that, for example, a bell-shaped distribution corresponding to the distance from each point is generated as a bottom point.
- the fringe pattern in FIG. 27 is generated.
- the number of stripes between the top and bottom can be adjusted by the wave number k.
- the wave number k is the number of stripes between the vertex and the bottom point.
- binarization may be performed according to the value of ⁇ (x, y). Specifically, for example, a region where the phase ⁇ (x, y) is from ⁇ to 0 may be a dark region, and a region from 0 to ⁇ may be a bright region.
- a stationary stripe pattern as shown in FIG. 27 is obtained.
- a stationary stripe pattern can be expressed as R [e j ⁇ (x, y )].
- R [] is an operation that takes a real part of a complex number.
- the moving fringe pattern can be expressed as R [e j ⁇ t ⁇ e j ⁇ (x, y) ] by multiplying the modulation term e j ⁇ t .
- the moving fringe pattern can be generated based on e j ⁇ t ⁇ e j ⁇ (x, y) .
- the phase distribution ⁇ (x, y) and the fringe pattern exemplified here are examples.
- An arbitrary stripe pattern can be obtained by appropriately setting the initial phase distribution according to the shape of the inspection object 150. It is assumed that the wave number k is set to an appropriate value according to the size of the defect to be detected.
- arbitrary points on the surface of the object to be inspected are set as points 2801 and 2802 where the light intensity is high and a point 2803 where the light intensity is low.
- it may be set according to the point where the light intensity is strong, the point where the light intensity is weak, and the surface shape of the object to be inspected.
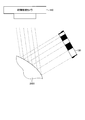
- FIG. 29 shows an example of a fringe pattern projected onto the spherical object 150, and as shown in FIG. 25, the fringe pattern is a parallel fringe that moves in the line of sight from the time correlation camera 110.
- the slope (gradient) is larger toward the left side in the left-right direction, and the slope (gradient) is greater toward the upper side and the lower side than the center in the vertical direction.
- the phase distribution ⁇ (x, y) can also be set based on CAD data.
- a screen is obtained by setting a fringe pattern on the surface of the object to be inspected 150 from the phase distribution ⁇ (x, y) in consideration of the three-dimensional shape of the object to be inspected 150, and performing coordinate conversion on the fringe pattern on the surface.
- the fringe pattern in the illumination unit such as 130 can be calculated.
- the inspection program executed by the PC 100 of the above-described embodiment is a file in an installable format or an executable format, and is a computer such as a CD-ROM, flexible disk (FD), CD-R, DVD (Digital Versatile Disk). It is recorded on a readable recording medium and provided.
- the inspection program executed by the PC 100 of the above-described embodiment may be provided by being stored on a computer connected to a network such as the Internet and downloaded via the network. Further, the inspection program executed on the PC 100 according to the above-described embodiment may be provided or distributed via a network such as the Internet.
Abstract
An inspection system in an embodiment is provided with the following: a planar illumination unit that temporally varies the intensity of light in a periodic manner by spatially moving a striped light-intensity pattern; a time-correlation-image generation unit that generates a time-correlation image using a time-correlation camera or an imaging system that operates in a manner equivalent to a time-correlation camera; and an arithmetic processing unit that uses the time-correlation image to compute a characteristic that corresponds to the distribution of normal vectors to a surface under inspection and detects aberrations by detecting differences from surroundings and/or differences from a reference surface.
Description
本発明の実施形態は、検査システムおよび検査方法に関する。
Embodiments described herein relate generally to an inspection system and an inspection method.
従来、被検査体に光を照射し、当該被検査体の表面からの反射光を画像データとして撮像し、当該画像データの輝度変化等に基づいて、被検査体の異常を検出する技術が提案されている。
Conventionally, there has been proposed a technique for irradiating an object to be inspected, imaging reflected light from the surface of the object to be inspected as image data, and detecting abnormality of the object to be inspected based on a change in luminance of the image data Has been.
その際に被検査体に照射する光の強度を周期的に変化させ、撮像された画像データの輝度変化に基づいて、異常を検出する技術が提案されている。
In this case, a technique has been proposed in which the intensity of light irradiated to the object to be inspected is periodically changed, and an abnormality is detected based on a change in luminance of the captured image data.
しかしながら、従来技術においては光の強度を変化させているが、撮像された画像データには光の強度を変化させた際の時間の遷移に関する情報が含まれていない。このため、撮影された画像データで被検査体の異常を検出する際に、検出精度が低くなる可能性がある。
However, in the prior art, the light intensity is changed, but the imaged image data does not include information regarding the time transition when the light intensity is changed. For this reason, when detecting an abnormality of the object to be inspected with the captured image data, the detection accuracy may be lowered.
実施形態の検査システムは、光の強度の縞パターンの空間的な移動により光の強度の周期的な時間変化を与える面的な照明部と、時間相関カメラまたはそれと等価な動作をする撮像システムによって時間相関画像を生成する時間相関画像生成部と、時間相関画像より、検査対象面の法線ベクトルの分布と対応した特徴であって、周囲との違いおよび参照表面との違いのうち少なくとも一方によって異常を検出する特徴を算出する、演算処理部と、を備えた。
The inspection system according to the embodiment includes a planar illumination unit that gives a periodic temporal change in light intensity by spatial movement of a stripe pattern of light intensity, and a time correlation camera or an imaging system that performs an equivalent operation. A time correlation image generating unit that generates a time correlation image, and a feature corresponding to the distribution of the normal vector of the inspection target surface from the time correlation image, depending on at least one of a difference from the surroundings and a difference from the reference surface And an arithmetic processing unit for calculating a feature for detecting an abnormality.
(第1の実施形態)
本実施形態の検査システムについて説明する。第1の実施形態の検査システムは、被検査体を検査するために様々な構成を備えている。図1は、本実施形態の検査システムの構成例を示した図である。図1に示されるように、本実施形態の検査システムは、PC100と、時間相関カメラ110と、照明装置120と、スクリーン130と、アーム140と、を備えている。 (First embodiment)
The inspection system of this embodiment will be described. The inspection system of the first embodiment has various configurations for inspecting an object to be inspected. FIG. 1 is a diagram illustrating a configuration example of an inspection system according to the present embodiment. As shown in FIG. 1, the inspection system of this embodiment includes a PC 100, atime correlation camera 110, a lighting device 120, a screen 130, and an arm 140.
本実施形態の検査システムについて説明する。第1の実施形態の検査システムは、被検査体を検査するために様々な構成を備えている。図1は、本実施形態の検査システムの構成例を示した図である。図1に示されるように、本実施形態の検査システムは、PC100と、時間相関カメラ110と、照明装置120と、スクリーン130と、アーム140と、を備えている。 (First embodiment)
The inspection system of this embodiment will be described. The inspection system of the first embodiment has various configurations for inspecting an object to be inspected. FIG. 1 is a diagram illustrating a configuration example of an inspection system according to the present embodiment. As shown in FIG. 1, the inspection system of this embodiment includes a PC 100, a
アーム140は、被検査体150を固定するために用いられ、PC100からの制御に応じて、時間相関カメラ110が撮影可能な被検査体150の表面の位置と向きを変化させる。
The arm 140 is used to fix the object 150 to be inspected, and changes the position and orientation of the surface of the object 150 to be imaged by the time correlation camera 110 according to control from the PC 100.
照明装置120は、被検査体150に光を照射する装置であって、PC100からの縞パターンに従って、照射する光の強度を領域単位で制御できる。さらに、照明装置120は、周期的な時間の遷移に従って当該領域単位の光の強度を制御できる。換言すれば、照明装置120は、光の強度の周期的な時間変化及び空間変化を与えることができる。なお、具体的な光の強度の制御手法については後述する。
The illumination device 120 is a device that irradiates light to the object 150 to be inspected, and can control the intensity of irradiated light in units of regions in accordance with a stripe pattern from the PC 100. Furthermore, the illuminating device 120 can control the intensity | strength of the light of the said area unit according to periodic time transition. In other words, the lighting device 120 can give a periodic temporal change and a spatial change of the light intensity. A specific light intensity control method will be described later.
スクリーン130は、照明装置120から出力された光を拡散させた上で、被検査体150に対して面的に光を照射する。本実施形態のスクリーン130は、照明装置120から入力された周期的な時間変化及び空間変化が与えられた光を、面的に被検査体150に照射する。なお、照明装置120とスクリーン130との間には、集光用のフレネルレンズ等の光学系部品(図示されず)が設けられてもよい。
The screen 130 diffuses the light output from the lighting device 120 and then irradiates the object 150 with light on a surface. The screen 130 according to the present embodiment irradiates the object 150 in a surface with the light input from the illumination device 120 and subjected to periodic time change and space change. An optical system component (not shown) such as a condensing Fresnel lens may be provided between the illumination device 120 and the screen 130.
なお、本実施形態は、照明装置120とスクリーン130とを組み合わせて、光強度の周期的な時間変化及び空間変化を与える面的な照射部を構成する例について説明するが、このような組み合わせに制限するものではなく、例えば、LEDを面的に配置して照明部を構成してもよい。
In addition, although this embodiment demonstrates the example which comprises the planar irradiation part which combines the illuminating device 120 and the screen 130, and gives the periodic time change and spatial change of light intensity, such a combination is demonstrated. For example, the illumination unit may be configured by arranging LEDs in a plane.
時間相関カメラ110は、光学系210と、イメージセンサ220と、データバッファ230と、制御部240と、参照信号出力部250と、を備えている。図2は、本実施形態の時間相関カメラ110の構成を示したブロック図である。
The time correlation camera 110 includes an optical system 210, an image sensor 220, a data buffer 230, a control unit 240, and a reference signal output unit 250. FIG. 2 is a block diagram showing the configuration of the time correlation camera 110 of the present embodiment.
光学系210は、撮影レンズ等を含み、時間相関カメラ110の外部の被写体(被検査体を含む)からの光束を透過し、その光束により形成される被写体の光学像を結像させる。
The optical system 210 includes a photographic lens and the like, transmits a light beam from a subject (including an object to be inspected) outside the time correlation camera 110, and forms an optical image of the subject formed by the light beam.
イメージセンサ220は、光学系210を介して入射された光の強弱を光強度信号として画素毎に高速に出力可能なセンサとする。
The image sensor 220 is a sensor that can output the intensity of light incident through the optical system 210 as a light intensity signal at high speed for each pixel.
本実施形態の光強度信号は、検査システムの照明装置120が被写体(被検査体を含む)に対して光を照射し、当該被写体からの反射光を、イメージセンサ220が受け取ったものである。
The light intensity signal of the present embodiment is a signal obtained by the illumination device 120 of the inspection system irradiating light on the subject (including the object to be inspected) and the image sensor 220 receiving the reflected light from the subject.
イメージセンサ220は、例えば従来のものと比べて高速に読み出し可能なセンサであり、行方向(x方向)、列方向(y方向)の2種類の方向に画素が配列された2次元平面状に構成されたものとする。そして、イメージセンサ220の各画素を、画素P(1,1),……,P(i,j),……,P(X,Y)とする(なお、本実施形態の画像サイズをX×Yとする。)。なお、イメージセンサ220の読み出し速度を制限するものではなく、従来と同様であってもよい。
The image sensor 220 is, for example, a sensor that can be read out at a higher speed than a conventional sensor, and has a two-dimensional planar shape in which pixels are arranged in two kinds of directions: a row direction (x direction) and a column direction (y direction). It shall be configured. Each pixel of the image sensor 220 is defined as a pixel P (1,1),..., P (i, j),..., P (X, Y) (Note that the image size in this embodiment is X X Y). Note that the reading speed of the image sensor 220 is not limited and may be the same as the conventional one.
イメージセンサ220は、光学系210によって透過された、被写体(被検査体を含む)からの光束を受光して光電変換することで、被写体から反射された光の強弱を示した光強度信号(撮影信号)で構成される、2次元平面状のフレームを生成し、制御部240に出力する。本実施形態のイメージセンサ220は、読み出し可能な単位時間毎に、当該フレームを出力する。
The image sensor 220 receives a light beam from a subject (including an object to be inspected) transmitted by the optical system 210 and photoelectrically converts the light intensity signal (photographing) indicating the intensity of light reflected from the subject. Signal) is generated and output to the control unit 240. The image sensor 220 according to the present embodiment outputs the frame for each readable unit time.
本実施形態の制御部240は、例えばCPU、ROM、及びRAM等で構成され、ROMに格納された検査プログラムを実行することで、転送部241と、読出部242と、強度画像用重畳部243と、第1の乗算器244と、第1の相関画像用重畳部245と、第2の乗算器246と、第2の相関画像用重畳部247と、画像出力部248と、を実現する。なお、CPU等で実現することに制限するものではなく、FPGA、またはASICで実現してもよい。
The control unit 240 according to the present embodiment includes, for example, a CPU, a ROM, a RAM, and the like. By executing an inspection program stored in the ROM, the transfer unit 241, the reading unit 242, and the intensity image superimposing unit 243. And a first multiplier 244, a first correlation image superimposing unit 245, a second multiplier 246, a second correlation image superimposing unit 247, and an image output unit 248. Note that the present invention is not limited to implementation with a CPU or the like, and may be implemented with an FPGA or an ASIC.
転送部241は、イメージセンサ220から出力された、光強度信号で構成されたフレームを、データバッファ230に、時系列順に蓄積する。
The transfer unit 241 stores the frames composed of the light intensity signals output from the image sensor 220 in the data buffer 230 in chronological order.
データバッファ230は、イメージセンサ220から出力された、光強度信号で構成されたフレームを、時系列順に蓄積する。
The data buffer 230 accumulates the frames composed of the light intensity signals output from the image sensor 220 in chronological order.
図3は、本実施形態の時間相関カメラ110で時系列順に蓄積されたフレームを表した概念図である。図3に示されるように、本実施形態のデータバッファ230には、時刻t(t=t0,t1,t2,……,tn)毎の複数の光強度信号G(1,1,t),……,G(i,j,t),……,G(X,Y,t)の組み合わせで構成された複数のフレームFk(k=1,2,……,n)が、時系列順に蓄積される。なお、時刻tで作成される一枚のフレームは、光強度信号G(1,1,t),……,G(i,j,t),……,G(X,Y,t)で構成される。
FIG. 3 is a conceptual diagram showing frames accumulated in time series by the time correlation camera 110 of the present embodiment. As shown in FIG. 3, the data buffer 230 of the present embodiment stores a plurality of light intensity signals G (1, 1, t), every time t (t = t0, t1, t2,..., Tn). .., G (i, j, t),..., G (X, Y, t) are combined into a plurality of frames Fk (k = 1, 2,..., N) in chronological order. Accumulated. Note that one frame created at time t is a light intensity signal G (1, 1, t),..., G (i, j, t), ..., G (X, Y, t). Composed.
本実施形態の光強度信号(撮像信号)G(1,1,t),……,G(i,j,t),……,G(X,Y,t)には、フレーム画像Fk(k=1,2,……,n)を構成する各画素P(1,1),……,P(i,j),……,P(X,Y)が対応づけられている。
A light intensity signal (imaging signal) G (1,1, t),..., G (i, j, t),. Each pixel P (1,1),..., P (i, j),..., P (X, Y) constituting k = 1, 2,.
イメージセンサ220から出力されるフレームは、光強度信号のみで構成されており、換言すればモノクロの画像データとも考えることができる。なお、本実施形態は、解像度、感度、及びコスト等を考慮して、イメージセンサ220がモノクロの画像データを生成する例について説明するが、イメージセンサ220としてモノクロ用のイメージセンサに制限するものではなく、カラー用のイメージセンサを用いてもよい。
The frame output from the image sensor 220 includes only a light intensity signal, in other words, it can be considered as monochrome image data. In this embodiment, an example in which the image sensor 220 generates monochrome image data in consideration of resolution, sensitivity, cost, and the like will be described. However, the image sensor 220 is not limited to a monochrome image sensor. Alternatively, a color image sensor may be used.
図2に戻り、本実施形態の読出部242は、データバッファ230から、光強度信号G(1,1,t),……,G(i,j,t),……,G(X,Y,t)をフレーム単位で、時系列順に読み出して、第1の乗算器244と、第2の乗算器246と、強度画像用重畳部243と、に出力する。
Returning to FIG. 2, the reading unit 242 of the present embodiment receives the light intensity signals G (1,1, t),..., G (i, j, t),. Y, t) are read out in frame-by-frame order and output to the first multiplier 244, the second multiplier 246, and the intensity image superimposing unit 243.
本実施形態の時間相関カメラ110は、読出部242の出力先毎に画像データを生成する。換言すれば、時間相間カメラ110は、3種類の画像データを作成する。
The time correlation camera 110 of the present embodiment generates image data for each output destination of the reading unit 242. In other words, the time phase camera 110 creates three types of image data.
本実施形態の時間相関カメラ110は、3種類の画像データとして、強度画像データと、2種類の時間相関画像データと、を生成する。なお、本実施形態は、3種類の画像データを生成することに制限するものではなく、強度画像データを生成しない場合や、1種類又は3種類以上の時間相関画像データを生成する場合も考えられる。
The time correlation camera 110 of this embodiment generates intensity image data and two types of time correlation image data as three types of image data. Note that the present embodiment is not limited to generating three types of image data, and it may be possible to generate no intensity image data or to generate one or more types of time-correlated image data. .
本実施形態のイメージセンサ220は、上述したように単位時間毎に、光強度信号で構成されたフレームを出力している。しかしながら、通常の画像データを生成するためには、撮影に必要な露光時間分の光強度信号が必要になる。そこで、本実施形態では、強度画像用重畳部243が、撮影に必要な露光時間分の複数のフレームを重畳して、強度画像データを生成する。なお、強度画像データの各画素値(光の強度を表す値)G(x,y)は、以下に示す式(1)から導き出すことができる。なお、露光時間は、t0とtnの時間差とする。
The image sensor 220 of the present embodiment outputs a frame composed of a light intensity signal for each unit time as described above. However, in order to generate normal image data, a light intensity signal corresponding to the exposure time necessary for photographing is required. Therefore, in the present embodiment, the intensity image superimposing unit 243 generates intensity image data by superimposing a plurality of frames for an exposure time necessary for photographing. In addition, each pixel value (value representing the intensity of light) G (x, y) of the intensity image data can be derived from the following equation (1). The exposure time is the time difference between t0 and tn.

これにより、従来のカメラの撮影と同様に、被写体(被検査体を含む)が撮影された強度画像データが生成される。そして、強度画像用重畳部243は、生成した強度画像データを、画像出力部248に出力する。
As a result, intensity image data in which a subject (including an object to be inspected) is photographed is generated in the same manner as with conventional camera photographing. Then, the intensity image superimposing unit 243 outputs the generated intensity image data to the image output unit 248.
時間相関画像データは、時間遷移に応じた光の強弱の変化を示す画像データである。つまり、本実施形態では、時系列順のフレーム毎に、当該フレームに含まれる光強度信号に対して、時間遷移を示した参照信号を乗算し、参照信号と光強度信号と乗算結果である時間相関値で構成された、時間相関値フレームを生成し、複数の時間相関値フレームを重畳することで、時間相関画像データを生成する。
The time correlation image data is image data indicating changes in light intensity according to the time transition. That is, in the present embodiment, for each frame in time series order, the light intensity signal included in the frame is multiplied by the reference signal indicating the time transition, and the reference signal, the light intensity signal, and the time that is the multiplication result Temporal correlation image data is generated by generating a temporal correlation value frame composed of correlation values and superimposing a plurality of temporal correlation value frames.
ところで、時間相関画像データを用いて、被検査体の異常を検出するためには、イメージセンサ220に入力される光強度信号を、参照信号に同期させて変化させる必要がある。このために、照明装置120が、上述したように、スクリーン130を介して周期的に時間変化および縞の空間的な移動を与えるような、面的な光の照射を行うこととした。
By the way, in order to detect an abnormality of the inspection object using the time correlation image data, it is necessary to change the light intensity signal input to the image sensor 220 in synchronization with the reference signal. For this purpose, as described above, the illumination device 120 performs planar light irradiation that periodically gives temporal changes and spatial movement of the stripes via the screen 130.
本実施形態では、2種類の時間相関画像データを生成する。参照信号は、時間遷移を表した信号であればよいが、本実施形態では、複素正弦波e-jωtを用いる。なお、角周波数ω、時刻tとする。参照信号を表す複素正弦波e-jωtが、上述した露光時間(換言すれば強度画像データ、時間相関画像を生成するために必要な時間)の一周期と相関をとるように、角周波数ωが設定されるものとする。換言すれば、照明装置120およびスクリーン130等の照明部によって形成された面的かつ動的な光は、被検査体150の表面(反射面)の各位置で第一の周期(時間周期)での時間的な照射強度の変化を与えるとともに、表面に沿った少なくとも一方向に沿った第二の周期(空間周期)での空間的な照射強度の増減分布を与える。この面的な光は、表面で反射される際に、当該表面のスペック(法線ベクトルの分布等)に応じて複素変調される。時間相関カメラ110は、表面で複素変調された光を受光し、第一の周期の参照信号を用いて直交検波(直交復調)することにより、複素信号としての時間相関画像データを得る。このような複素時間相関画像データに基づく変復調により、表面の法線ベクトルの分布に対応した特徴を検出することができる。
In this embodiment, two types of time correlation image data are generated. The reference signal may be a signal representing a time transition, but in the present embodiment, a complex sine wave e −jωt is used. It is assumed that the angular frequency is ω and the time is t. The angular frequency ω is such that the complex sine wave e −jωt representing the reference signal correlates with one period of the above-described exposure time (in other words, the time required to generate the intensity image data and the time correlation image). It shall be set. In other words, the planar and dynamic light formed by the illumination unit 120 and the illumination unit such as the screen 130 is in a first period (time period) at each position on the surface (reflection surface) of the inspection object 150. And a distribution of increase or decrease in spatial irradiation intensity in a second period (spatial period) along at least one direction along the surface. When this planar light is reflected by the surface, it is complex-modulated according to the specifications of the surface (normal vector distribution, etc.). The time correlation camera 110 receives the light complex-modulated on the surface and performs quadrature detection (orthogonal demodulation) using the reference signal of the first period, thereby obtaining time correlation image data as a complex signal. By modulation / demodulation based on such complex time correlation image data, it is possible to detect features corresponding to the surface normal vector distribution.
複素正弦波e-jωtは、e-jωt=cos(ωt)―j・sin(ωt)と表すこともできる。従って、時間相関画像データの各画素値C(x,y)は、以下に示す式(2)から導き出すことができる。
The complex sine wave e −jωt can also be expressed as e −jωt = cos (ωt) −j · sin (ωt). Accordingly, each pixel value C (x, y) of the time correlation image data can be derived from the following equation (2).

本実施形態では、式(2)において、実数部を表す画素値C1(x,y)と、虚数部を表す画素値C2(x,y)と、に分けて2種類の時間相関画像データを生成する。
In this embodiment, in the formula (2), two types of time correlation image data are divided into a pixel value C1 (x, y) representing the real part and a pixel value C2 (x, y) representing the imaginary part. Generate.
このため、参照信号出力部250は、第1の乗算器244と、第2の乗算器246と、に対してそれぞれ異なる参照信号を生成し、出力する。本実施形態の参照信号出力部250は、複素正弦波e-jωtの実数部に対応する第1の参照信号cosωtを第1の乗算器244に出力し、複素正弦波e-jωtの虚数部に対応する第2の参照信号sinωtを第2の乗算器246に出力する。このように本実施形態の参照信号出力部250は、互いにヒルベルト変換対をなす正弦波および余弦波の時間関数として表される2種類の参照信号を出力する例について説明するが、参照信号は時間関数のような時間遷移に応じて変化する参照信号であればよい。
For this reason, the reference signal output unit 250 generates and outputs different reference signals for the first multiplier 244 and the second multiplier 246, respectively. Reference signal output section 250 of this embodiment outputs the first reference signal cosωt corresponding to the real part of the complex sine wave e -Jeiomegati the first multiplier 244, the imaginary part of the complex sine wave e -Jeiomegati The corresponding second reference signal sin ωt is output to the second multiplier 246. As described above, the reference signal output unit 250 according to the present embodiment describes an example in which two types of reference signals expressed as time functions of a sine wave and a cosine wave that form a Hilbert transform pair are described. Any reference signal that changes with time transition such as a function may be used.
そして、第1の乗算器244は、読出部242から入力されたフレーム単位で、当該フレームの光強度信号毎に、参照信号出力部250から入力された複素正弦波e-jωtの実数部cosωtを乗算する。
Then, the first multiplier 244 calculates the real part cosωt of the complex sine wave e −jωt input from the reference signal output unit 250 for each light intensity signal of the frame in units of frames input from the reading unit 242. Multiply.
第1の相関画像用重畳部245は、撮影に必要な露光時間分の複数のフレームについて、第1の乗算器244の乗算結果を画素毎に重畳する処理を行う。これにより、第1の時間相関画像データの各画素値C1(x,y)が、以下の式(3)から導出される。
The first correlation image superimposing unit 245 performs a process of superimposing the multiplication result of the first multiplier 244 on a pixel-by-pixel basis for a plurality of frames corresponding to the exposure time necessary for photographing. Thereby, each pixel value C1 (x, y) of the first time correlation image data is derived from the following equation (3).

そして、第2の乗算器246は、読出部242から入力されたフレームの光強度信号に対して、参照信号出力部250から入力された複素正弦波e-jωtの虚数部sinωtを乗算する。
The second multiplier 246 multiplies the light intensity signal of the frame input from the reading unit 242 by the imaginary part sin ωt of the complex sine wave e −jωt input from the reference signal output unit 250.
第2の相関画像用重畳部247は、撮影に必要な露光時間分の複数のフレームについて、第2の乗算器246の乗算結果を画素毎に重畳する処理を行う。これにより、第2の時間相関画像データの各画素値C2(x、y)が、以下の式(4)から導出される。
The second correlation image superimposing unit 247 performs a process of superimposing the multiplication result of the second multiplier 246 on a pixel-by-pixel basis for a plurality of frames corresponding to the exposure time necessary for photographing. Thereby, each pixel value C2 (x, y) of the second time correlation image data is derived from the following equation (4).

上述した処理を行うことで、2種類の時間相関画像データ、換言すれば2自由度を有する時間相関画像データを生成できる。
By performing the processing described above, two types of time correlation image data, in other words, time correlation image data having two degrees of freedom can be generated.
また、本実施形態は、参照信号の種類を制限するものでない。例えば、本実施形態では、複素正弦波e-jωtの実部と虚部の2種類の時間相関画像データを作成するが、光の振幅と、光の位相と、による2種類の画像データを生成してもよい。
Further, the present embodiment does not limit the type of reference signal. For example, in this embodiment, two types of time-correlated image data of the real part and the imaginary part of the complex sine wave e −jωt are created, but two types of image data based on the light amplitude and the light phase are generated. May be.
なお、本実施形態の時間相関カメラ110は、時間相関画像データとして、複数系統分作成可能とする。これにより、例えば複数種類の幅の縞が組み合わされた光が照射された際に、上述した実部と虚部とによる2種類の時間相関画像データを、縞の幅毎に作成可能とする。このために、時間相関カメラ110は、2個の乗算器と2個の相関画像用重畳部とからなる組み合わせを、複数系統分備えるとともに、参照信号出力部250は、系統毎に適した角周波数ωによる参照信号を出力可能とする。
It should be noted that the time correlation camera 110 of the present embodiment can create a plurality of systems as time correlation image data. Thereby, for example, when light in which stripes having a plurality of types of widths are combined is irradiated, two types of time correlation image data based on the real part and the imaginary part described above can be created for each stripe width. For this purpose, the time correlation camera 110 includes a combination of two multipliers and two correlation image superimposing units for a plurality of systems, and the reference signal output unit 250 has an angular frequency suitable for each system. The reference signal by ω can be output.
そして、画像出力部248が、2種類の時間相関画像データと、強度画像データと、をPC100に出力する。これにより、PC100が、2種類の時間相関画像データと、強度画像データと、を用いて、被検査体の異常を検出する。そのためには、被写体に対して光を照射する必要がある。
Then, the image output unit 248 outputs two types of time correlation image data and intensity image data to the PC 100. As a result, the PC 100 detects an abnormality of the object to be inspected using the two types of time correlation image data and the intensity image data. For that purpose, it is necessary to irradiate the subject with light.
本実施形態の照明装置120は、高速に移動する縞パターンを照射する。図4は、本実施形態の照明装置120が照射する縞パターンの一例を示した図である。図4に示す例では、縞パターンをx方向にスクロール(移動)させている例とする。白い領域が縞に対応した明領域、黒い領域が縞と縞との間に対応した間隔領域(暗領域)である。
The illumination device 120 of this embodiment irradiates a fringe pattern that moves at high speed. FIG. 4 is a diagram illustrating an example of a fringe pattern irradiated by the illumination device 120 of the present embodiment. In the example shown in FIG. 4, the stripe pattern is scrolled (moved) in the x direction. A white area is a bright area corresponding to the stripe, and a black area is an interval area (dark area) corresponding to the stripe.
本実施形態では、時間相関カメラ110が強度画像データ及び時間相関画像データを撮影する露光時間で、照明装置120が照射する縞パターンが一周期分移動させる。これにより、照明装置120は、光の強度の縞パターンの空間的な移動により光の強度の周期的な時間変化を与える。本実施形態では、図4の縞パターンが一周期分移動する時間を、露光時間と対応させることで、時間相関画像データの各画素には、少なくとも、縞パターン一周期分の光の強度信号に関する情報が埋め込まれる。
In the present embodiment, the fringe pattern irradiated by the illumination device 120 is moved by one cycle with the exposure time when the time correlation camera 110 captures the intensity image data and the time correlation image data. Thereby, the illuminating device 120 gives the time change of the light intensity periodically by the spatial movement of the stripe pattern of the light intensity. In the present embodiment, the time during which the fringe pattern in FIG. 4 moves by one period corresponds to the exposure time, so that each pixel of the time-correlated image data relates to at least the light intensity signal for one period of the fringe pattern. Information is embedded.
図4に示されるように、本実施形態では、照明装置120が矩形波に基づく縞パターンを照射する例について説明するが、矩形波以外を用いてもよい。本実施形態では、照明装置120がスクリーン130を介して照射されることで、矩形波の明暗の境界領域をぼかすことができる。
As shown in FIG. 4, in the present embodiment, an example in which the illumination device 120 irradiates a stripe pattern based on a rectangular wave will be described, but other than a rectangular wave may be used. In the present embodiment, the illumination device 120 is irradiated through the screen 130, so that the bright and dark boundary region of the rectangular wave can be blurred.
本実施形態では、照明装置120が照射する縞パターンをA(1+cos(ωt+kx)と表す。すなわち、縞パターンには、複数の縞が反復的に(周期的に)含まれる。なお、被検査体に照射される光の強度は0~2Aの間で調整可能とし、光の位相kxとする。kは、縞の波数である。xは、位相が変化する方向である。
In this embodiment, the stripe pattern irradiated by the illumination device 120 is represented as A (1 + cos (ωt + kx), that is, the stripe pattern includes a plurality of stripes repeatedly (periodically). The intensity of the light applied to the light beam can be adjusted between 0 and 2 A, and is the light phase kx, where k is the wave number of the stripes, and x is the direction in which the phase changes.
そして、フレームの各画素の光強度信号f(x,y,t)の基本周波数成分は、以下の式(5)として表すことができる。式(5)で示されるように、x方向で縞の明暗が変化する。
The fundamental frequency component of the light intensity signal f (x, y, t) of each pixel of the frame can be expressed as the following equation (5). As shown in Expression (5), the brightness of the stripe changes in the x direction.
f(x,y,t)=A(1+cos(ωt+kx))
=A+A/2{ej(ωt+kx)+e-j(ωt+kx)}……(5) f (x, y, t) = A (1 + cos (ωt + kx))
= A + A / 2 {e j (ωt + kx) + e −j (ωt + kx) } (5)
=A+A/2{ej(ωt+kx)+e-j(ωt+kx)}……(5) f (x, y, t) = A (1 + cos (ωt + kx))
= A + A / 2 {e j (ωt + kx) + e −j (ωt + kx) } (5)
式(5)で示されるように、照明装置120が照射する縞パターンの強度信号は、複素数として考えることができる。
As shown in Equation (5), the intensity signal of the fringe pattern irradiated by the illumination device 120 can be considered as a complex number.
そして、イメージセンサ220には、当該照明装置120からの光が被写体(被検査体を含む)から反射して入力される。
Then, the light from the illumination device 120 is reflected and input to the image sensor 220 from the subject (including the object to be inspected).
したがって、イメージセンサ220に入力される光強度信号G(x,y,t)を、照明装置120が照射された際のフレームの各画素の光強度信号f(x,y,t)とできる。そこで、強度画像データを導出するための式(1)に式(5)を代入すると、式(6)を導出できる。なお、位相kxとする。
Therefore, the light intensity signal G (x, y, t) input to the image sensor 220 can be used as the light intensity signal f (x, y, t) of each pixel of the frame when the illumination device 120 is irradiated. Therefore, when Expression (5) is substituted into Expression (1) for deriving intensity image data, Expression (6) can be derived. The phase is kx.

式(6)から、強度画像データの各画素には、露光時間Tに、照明装置120が出力している光の強度の中間値Aを乗じた値が入力されていることが確認できる。さらに、時間相関画像データを導出するための式(2)に式(5)を代入すると、式(7)を導出できる。なお、AT/2を振幅とし、kxを位相とする。
From Expression (6), it can be confirmed that each pixel of the intensity image data is inputted with a value obtained by multiplying the exposure time T by the intermediate value A of the intensity of the light output from the illumination device 120. Further, when Expression (5) is substituted into Expression (2) for deriving time correlation image data, Expression (7) can be derived. Note that AT / 2 is the amplitude and kx is the phase.

これにより、式(7)で示された複素数で示された時間相関画像データは、上述した2種類の時間相関画像データと置き換えることができる。つまり、上述した実部と虚部とで構成される時間相関画像データには、検査体に照射された光強度変化における位相変化と振幅変化とが含まれている。換言すれば、本実施形態のPC100は、2種類の時間相関画像データに基づいて、照明装置120から照射された光の位相変化と、光の振幅変化と、を検出できる。そこで、本実施形態のPC100が、時間相関画像データ及び強度画像データに基づいて、画素毎に入る光の振幅を表した振幅画像データと、画素毎に入る光の位相変化を表した位相画像データと、を生成する。
Thus, the time correlation image data represented by the complex number represented by the equation (7) can be replaced with the two types of time correlation image data described above. That is, the above-described time correlation image data composed of the real part and the imaginary part includes a phase change and an amplitude change due to a change in light intensity irradiated on the test object. In other words, the PC 100 according to the present embodiment can detect the phase change of the light emitted from the illumination device 120 and the light amplitude change based on the two types of time correlation image data. Therefore, the PC 100 according to the present embodiment, based on the time correlation image data and the intensity image data, amplitude image data representing the amplitude of light entering each pixel and phase image data representing the phase change of light entering each pixel. And generate.
さらに、PC100は、生成した振幅画像データと位相画像データとに基づいて、被検査体の異常を検出する。
Further, the PC 100 detects an abnormality of the object to be inspected based on the generated amplitude image data and phase image data.
ところで、被検査体の表面形状に凹凸に基づく異常が生じている場合、被検査体の表面の法線ベクトルの分布には異常に対応した変化が生じている。また、被検査体の表面に光を吸収するような異常が生じている場合、反射した光の強度に変化が生じる。法線ベクトルの分布の変化は、光の位相変化及び振幅変化のうち少なくともいずれか一つとして検出される。そこで、本実施形態では、時間相関画像データ及び強度画像データを用いて、法線ベクトルの分布の変化に対応した、光の位相変化及び振幅変化のうち少なくともいずれか一つを検出する。これにより、表面形状の異常を検出可能となる。次に、被検査体の異常、法線ベクトル、及び光の位相変化又は振幅変化の関係について説明する。
By the way, when an abnormality based on unevenness occurs in the surface shape of the object to be inspected, the distribution corresponding to the abnormality occurs in the distribution of normal vectors on the surface of the object to be inspected. Further, when an abnormality that absorbs light occurs on the surface of the object to be inspected, the intensity of the reflected light changes. A change in the normal vector distribution is detected as at least one of a phase change and an amplitude change of light. Thus, in the present embodiment, using the time correlation image data and the intensity image data, at least one of the light phase change and the amplitude change corresponding to the change in the normal vector distribution is detected. Thereby, the abnormality of the surface shape can be detected. Next, the relationship between the abnormality of the inspected object, the normal vector, and the phase change or amplitude change of light will be described.
図5は、第1の実施形態の時間相関カメラ110による、被検査体の異常の第1の検出例を示した図である。図5に示される例では、被検査体500に突形状の異常501がある状況とする。当該状況においては、異常501の点502の近傍領域においては、法線ベクトル521、522、523が異なる方向を向いていることを確認できる。そして、当該法線ベクトル521、522、523が異なる方向を向いていることで、異常501から反射した光に拡散(例えば、光511、512、513)が生じ、時間相関カメラ110のイメージセンサ220の任意の画素531に入る縞パターンの幅503が広くなる。
FIG. 5 is a diagram illustrating a first detection example of an abnormality of the inspected object by the time correlation camera 110 according to the first embodiment. In the example shown in FIG. 5, it is assumed that the inspected object 500 has a projecting shape abnormality 501. In this situation, it can be confirmed that the normal vectors 521, 522, and 523 are in different directions in the region near the point 502 of the abnormality 501. The normal vectors 521, 522, 523 are directed in different directions, so that diffusion (for example, light 511, 512, 513) is generated in the light reflected from the abnormality 501, and the image sensor 220 of the time correlation camera 110. The width 503 of the fringe pattern entering the arbitrary pixel 531 is increased.
図6は、図5に示される異常501が被検査体500にある場合に、当該異常に応じて変化する、光の振幅の例を表した図である。図6に示される例では、光の振幅を実部(Re)と、虚部(Im)に分けて2次元平面上に表している。図6では、図5の光511、512、513に対応する光の振幅611、612、613として示している。そして、光の振幅611、612、613は互いに打ち消し合い、イメージセンサ220の当該任意の画素531には、振幅621の光が入射する。
FIG. 6 is a diagram showing an example of the amplitude of light that changes in accordance with the abnormality 501 shown in FIG. In the example shown in FIG. 6, the amplitude of light is divided into a real part (Re) and an imaginary part (Im) and is represented on a two-dimensional plane. In FIG. 6, the light amplitudes 611, 612, and 613 corresponding to the lights 511, 512, and 513 in FIG. The light amplitudes 611, 612, and 613 cancel each other, and light having an amplitude 621 is incident on the arbitrary pixel 531 of the image sensor 220.
したがって、図6に示される状況で、検査体500の異常501が撮像された領域で振幅が小さいことが確認できる。換言すれば、振幅変化を示した振幅画像データで、周囲と比べて暗くなっている領域がある場合に、当該領域で光同士の振幅の打ち消し合いが生じていると推測できるため、当該領域に対応する被検査体500の位置で異常501が生じていると判断できる。
Therefore, in the situation shown in FIG. 6, it can be confirmed that the amplitude is small in the region where the abnormality 501 of the specimen 500 is imaged. In other words, when there is a region that is darker than the surroundings in the amplitude image data showing the change in amplitude, it can be assumed that there is a cancellation of the amplitude of light in the region, It can be determined that an abnormality 501 has occurred at the position of the corresponding inspection object 500.
本実施形態の検査システムは、図5の異常501のように傾きが急峻に変化しているものに限らず、緩やかに変化する異常も検出できる。図7は、第1の実施形態の時間相関カメラ110による、被検査体の異常の第2の検出例を示した図である。図7に示される例では、正常な場合は被検査体の表面が平面(換言すれば法線が平行)となるが、被検査体700に緩やかな勾配701が生じた状況とする。このような状況においては、勾配701上の法線ベクトル721、722、723も同様に緩やかに変化する。したがって、イメージセンサ220に入力する光711、712、713も少しずつずれていく。図7に示される例では、緩やかな勾配701のために光の振幅の打ち消し合いは生じないため、図5、図6で表したような光の振幅はほとんど変化しない。しかしながら、本来スクリーン130から投影された光が、そのままイメージセンサに平行に入るはずが、緩やかな勾配701のために、スクリーン130から投影された光が平行の状態でイメージセンサに入らないために、光に位相変化が生じる。従って、光の位相変化について、周囲等との違いを検出することで、図7に示したような緩やかな勾配701による異常を検出できる。
The inspection system according to the present embodiment is not limited to the one in which the slope changes steeply as shown by the abnormality 501 in FIG. FIG. 7 is a diagram illustrating a second example of detection of abnormality of an object to be inspected by the time correlation camera 110 according to the first embodiment. In the example shown in FIG. 7, the surface of the object to be inspected is flat (in other words, the normal line is parallel) in the normal state, but a gentle gradient 701 is generated on the object 700 to be inspected. In such a situation, the normal vectors 721, 722, and 723 on the gradient 701 also change gently. Accordingly, the light beams 711, 712, and 713 input to the image sensor 220 are also shifted little by little. In the example shown in FIG. 7, since the light amplitudes do not cancel each other due to the gentle gradient 701, the light amplitudes shown in FIGS. 5 and 6 hardly change. However, although the light originally projected from the screen 130 should enter the image sensor as it is, the light projected from the screen 130 does not enter the image sensor in a parallel state because of the gentle gradient 701. A phase change occurs in the light. Accordingly, by detecting the difference between the light phase change and the surroundings, an abnormality due to the gentle gradient 701 as shown in FIG. 7 can be detected.
また、被検査体の表面形状(換言すれば、被検査体の法線ベクトルの分布)以外にも異常が生じる場合がある。図8は、第1の実施形態の時間相関カメラ110による、被検査体の異常の第3の検出例を示した図である。図8に示される例では、被検査体800に汚れ801が付着しているため、照明装置120から照射された光が吸収あるいは拡散反射し、時間相関カメラ110の、汚れ801を撮影している任意の画素領域では光がほとんど強度変化しない例を表している。換言すれば、汚れ801を撮影している任意の画素領域では、光強度は位相打ち消しを起こし振動成分がキャンセルされ、ほとんど直流的な明るさになる例を示している。
Also, there may be an abnormality other than the surface shape of the inspection object (in other words, the distribution of the normal vector of the inspection object). FIG. 8 is a diagram illustrating a third example of detection of abnormality of an object to be inspected by the time correlation camera 110 according to the first embodiment. In the example shown in FIG. 8, since the dirt 801 is attached to the object 800, the light irradiated from the illumination device 120 is absorbed or diffusely reflected, and the dirt 801 of the time correlation camera 110 is photographed. This shows an example in which light hardly changes in intensity in an arbitrary pixel region. In other words, in an arbitrary pixel area where the dirt 801 is photographed, the light intensity causes a phase cancellation, the vibration component is canceled, and an almost DC brightness is shown.
このような場合、汚れ801を撮影している画素領域においては、光の振幅がほとんどないため、振幅画像データを表示した際に、周囲と比べて暗くなる領域が生じる。したがって、当該領域に対応する被検査体800の位置に、汚れ等の異常801があることを推定できる。
In such a case, in the pixel area where the dirt 801 is photographed, there is almost no light amplitude, and therefore, when the amplitude image data is displayed, an area darker than the surrounding area is generated. Therefore, it can be estimated that there is an abnormality 801 such as dirt at the position of the inspection object 800 corresponding to the region.
このように、本実施形態では、時間相関画像データに基づいて、光の振幅の変化と、光の位相の変化と、を検出することで、被検査体に異常があることを推定できる。
As described above, in the present embodiment, it is possible to estimate that the inspected object is abnormal by detecting the change in the amplitude of the light and the change in the phase of the light based on the time correlation image data.
図1に戻り、PC100について説明する。PC100は、検出システム全体の制御を行う。PC100は、アーム制御部101と、照明制御部102と、制御部103と、を備える。
Referring back to FIG. 1, the PC 100 will be described. The PC 100 controls the entire detection system. The PC 100 includes an arm control unit 101, an illumination control unit 102, and a control unit 103.
アーム制御部101は、被検査体150の時間相関カメラ110による撮像対象となる表面を変更するために、アーム140を制御する。本実施形態では、PC100において、被検査体の撮影対象となる表面を複数設定しておく。そして、時間相関カメラ110が被検査体150の撮影が終了する毎に、アーム制御部101が、当該設定に従って、時間相関カメラ110が設定された表面を撮影できるように、アーム140が被検査体150を移動させる。なお、本実施形態は撮影が終了する毎にアームを移動させ、撮影が開始する前に停止させることを繰り返すことに制限するものではなく、継続的にアーム140を駆動させてもよい。なお、アーム140は、搬送部、移動部、位置変更部、姿勢変更部等とも称されうる。
The arm control unit 101 controls the arm 140 in order to change the surface of the object 150 to be imaged by the time correlation camera 110. In the present embodiment, in the PC 100, a plurality of surfaces to be imaged of the inspected object are set. Then, every time the time correlation camera 110 finishes photographing the object to be inspected 150, the arm control unit 101 can photograph the surface on which the time correlation camera 110 is set according to the setting. Move 150. The present embodiment is not limited to repeating the movement of the arm each time shooting is completed and stopping the shooting before the shooting is started, and the arm 140 may be continuously driven. The arm 140 may also be referred to as a transport unit, a moving unit, a position changing unit, a posture changing unit, or the like.
照明制御部102は、被検査体150を検査するために照明装置120が照射する縞パターンを出力する。本実施形態の照明制御部102は、少なくとも3枚以上の縞パターンを、照明装置120に受け渡し、当該縞パターンを露光時間中に切り替えて表示するように照明装置120に指示する。
The illumination control unit 102 outputs a fringe pattern irradiated by the illumination device 120 in order to inspect the inspection object 150. The illumination control unit 102 of this embodiment transfers at least three or more stripe patterns to the illumination device 120 and instructs the illumination device 120 to switch and display the stripe patterns during the exposure time.
図9は、照明制御部102が照明装置120に出力する縞パターンの例を示した図である。図9(B)に示す矩形波に従って、図9(A)に示す黒領域と白領域とが設定された縞パターンが出力されるように、照明制御部102が制御を行う。
FIG. 9 is a diagram illustrating an example of a fringe pattern output from the illumination control unit 102 to the illumination device 120. In accordance with the rectangular wave shown in FIG. 9B, the illumination control unit 102 performs control so that the stripe pattern in which the black region and the white region shown in FIG. 9A are set is output.
本実施形態で照射する縞パターン毎の縞の間隔は、検出対象となる異常(欠陥)の大きさに応じて設定されるものとしてここでは詳しい説明を省略する。
The stripe interval for each stripe pattern irradiated in the present embodiment is set according to the size of the abnormality (defect) to be detected, and a detailed description thereof is omitted here.
また、縞パターンを出力するための矩形波の角周波数ωは、参照信号の角周波数ωと同じ値とする。
Also, the angular frequency ω of the rectangular wave for outputting the stripe pattern is the same value as the angular frequency ω of the reference signal.
図9に示されるように、照明制御部102が出力する縞パターンは、矩形波として示すことができるが、スクリーン130を介することで、縞パターンの境界領域をぼかす、すなわち、縞パターンにおける明領域(縞の領域)と暗領域(間隔の領域)との境界での光の強度変化を緩やかにする(鈍らせる)ことで、正弦波に近似させることができる。図10は、スクリーン130を介した後の縞パターンを表した波の形状の例を示した図である。図10に示されるように波の形状が、正弦波に近づくことで、計測精度を向上させることができる。また、縞に明度が多段階に変化するグレー領域を追加したり、グラデーションを与えたりしてもよい。また、カラーの縞を含む縞パターンを用いてもよい。
As shown in FIG. 9, the fringe pattern output from the illumination control unit 102 can be shown as a rectangular wave, but the border area of the fringe pattern is blurred through the screen 130, that is, the bright area in the fringe pattern. By making the intensity change of light at the boundary between the (stripe region) and the dark region (interval region) gentle (dull), it can be approximated to a sine wave. FIG. 10 is a diagram illustrating an example of a wave shape representing a stripe pattern after passing through the screen 130. As shown in FIG. 10, the measurement accuracy can be improved by the wave shape approaching a sine wave. Further, a gray region in which the brightness changes in multiple steps may be added to the stripe, or a gradation may be given. Further, a stripe pattern including color stripes may be used.
図1に戻り、制御部103は、振幅-位相画像生成部104と、異常検出処理部105と、を備え、時間相関カメラ110から入力された強度画像データと、時間相関画像データと、により、被検査体150の検査対象面の法線ベクトルの分布と対応した特徴であって、周囲との違いによって異常を検出する特徴を算出するための処理を行う。なお、本実施形態は、検査を行うために、複素数で示した時間相関画像データ(複素時間相関画像データと称す)の代わりに、複素数相関画像データの実部と虚部とで分けた2種類の時間相関画像データを、時間相関カメラ110から受け取る。
Returning to FIG. 1, the control unit 103 includes an amplitude-phase image generation unit 104 and an abnormality detection processing unit 105, and by intensity image data input from the time correlation camera 110 and time correlation image data, Processing is performed to calculate a feature corresponding to the distribution of the normal vector on the surface to be inspected of the inspected object 150 and detecting an abnormality based on the difference from the surroundings. In the present embodiment, in order to perform the inspection, two types of real number and imaginary part of complex number correlation image data are used instead of time correlation image data (referred to as complex time correlation image data) indicated by complex numbers. Are received from the time correlation camera 110.
振幅-位相画像生成部104は、時間相関カメラ110から入力された強度画像データと、時間相関画像データと、に基づいて、振幅画像データと、位相画像データと、を生成する。
The amplitude-phase image generation unit 104 generates amplitude image data and phase image data based on the intensity image data input from the time correlation camera 110 and the time correlation image data.
振幅画像データは、画素毎に入る光の振幅を表した画像データとする。位相画像データは、画素毎に入る光の位相を表した画像データとする。
The amplitude image data is image data representing the amplitude of light entering each pixel. The phase image data is image data representing the phase of light entering each pixel.
本実施形態は振幅画像データの算出手法を制限するものではないが、例えば、振幅-位相画像生成部104は、2種類の時間相関画像データの画素値C1(x,y)及びC2(x,y)から、式(8)を用いて、振幅画像データの各画素値F(x,y)を導き出せる。
Although the present embodiment does not limit the calculation method of the amplitude image data, for example, the amplitude-phase image generation unit 104 has pixel values C1 (x, y) and C2 (x, From y), each pixel value F (x, y) of the amplitude image data can be derived using Equation (8).
そして、本実施形態では、振幅画像データの画素値(振幅)と、強度画像データの画素値と、に基づいて、異常が生じている領域があるか否かを判定できる。例えば、強度画像データの画素値(AT)を2で除算した値と、振幅画像データの振幅(打ち消し合いが生じない場合にはAT/2となる)と、がある程度一致する領域は異常が生じていないと推測できる。一方、一致していない領域については、振幅の打ち消しが生じていると推測できる。なお、具体的な手法については後述する。
In the present embodiment, it is possible to determine whether or not there is a region where an abnormality has occurred based on the pixel value (amplitude) of the amplitude image data and the pixel value of the intensity image data. For example, an abnormality occurs in a region where the value obtained by dividing the pixel value (AT) of the intensity image data by 2 and the amplitude of the amplitude image data (which is AT / 2 when cancellation does not occur) to some extent I can guess that it is not. On the other hand, it can be presumed that the amplitude cancellation occurs in the non-matching region. A specific method will be described later.
同様に、振幅-位相画像生成部104は、画素値C1(x,y)及びC2(x,y)から、式(9)を用いて、位相画像データの各画素値P(x,y)を導き出せる。
Similarly, the amplitude-phase image generation unit 104 uses the pixel values C1 (x, y) and C2 (x, y) to calculate each pixel value P (x, y) of the phase image data using Equation (9). Can be derived.

異常検出処理部105は、振幅-位相画像生成部104により生成された振幅画像データ、及び位相画像データにより、検査対称面の法線ベクトルの分布と対応した特徴であって、周囲との違いによって、被検査体150の異常に関連する特徴を検出する。本実施形態では、法線ベクトルの分布に対応した特徴として、複素時間相関画像の振幅の分布を用いた例について説明する。なお、複素時間相関画像の振幅の分布とは、複素時間相関画像の各画素の振幅の分布を示したデータであり、振幅画像データに相当する。
The abnormality detection processing unit 105 is a feature corresponding to the distribution of normal vectors on the inspection symmetry plane based on the amplitude image data and the phase image data generated by the amplitude-phase image generation unit 104, and depending on the difference from the surroundings. Then, a feature related to the abnormality of the inspection object 150 is detected. In the present embodiment, an example in which the amplitude distribution of the complex time correlation image is used as the feature corresponding to the distribution of the normal vector will be described. The amplitude distribution of the complex time correlation image is data indicating the amplitude distribution of each pixel of the complex time correlation image, and corresponds to amplitude image data.
次に、本実施形態の異常検出処理部105における振幅に基づく異常検出処理について説明する。図11は、本実施形態の異常検出処理部105における当該処理の手順を示すフローチャートである。
Next, the abnormality detection process based on the amplitude in the abnormality detection processing unit 105 of the present embodiment will be described. FIG. 11 is a flowchart showing a procedure of the processing in the abnormality detection processing unit 105 of the present embodiment.
まず、異常検出処理部105は、振幅画像データの各画素に格納された、光の振幅値(を表した画素値)から、当該画素を基準(例えば中心)として、N×N領域の平均振幅値を減算し(ステップS1101)、振幅の平均差分画像データを生成する。振幅の平均差分画像データは、振幅の勾配に対応する。なお、整数Nは実施の態様に応じて適切な値が設定されるものとする。
First, the abnormality detection processing unit 105 determines the average amplitude of the N × N region from the light amplitude value (representing pixel value) stored in each pixel of the amplitude image data, with the pixel as a reference (for example, the center). The value is subtracted (step S1101), and average difference image data of amplitude is generated. The average difference image data of the amplitude corresponds to the gradient of the amplitude. The integer N is set to an appropriate value depending on the embodiment.
次に、異常検出処理部105は、減算により生成された振幅の平均差分画像データに対して、予め定められた振幅の閾値を用いたマスク処理を行う(ステップS1102)。
Next, the abnormality detection processing unit 105 performs a mask process using a predetermined amplitude threshold value on the average difference image data of the amplitude generated by the subtraction (step S1102).
さらに、異常検出処理部105は、平均差分画像データのマスク領域内について画素毎に標準偏差を算出する(ステップS1103)。なお、本実施形態では、標準偏差に基づいた手法について説明するが、標準偏差を用いた場合に制限するものではなく、例えば平均値等を用いてもよい。
Further, the abnormality detection processing unit 105 calculates a standard deviation for each pixel within the mask area of the average difference image data (step S1103). In the present embodiment, a method based on the standard deviation will be described. However, the method is not limited to the case where the standard deviation is used. For example, an average value or the like may be used.
そして、異常検出処理部105は、平均を引いた振幅画素値が-4.5σ(σ:標準偏差)より小さい値の画素を、異常(欠陥)がある領域として検出する(ステップS1104)。
Then, the abnormality detection processing unit 105 detects a pixel having an average pixel value smaller than −4.5σ (σ: standard deviation) as a region having an abnormality (defect) (step S1104).
上述した処理手順により、各画素の振幅値(換言すれば、振幅の分布)から、被検査体の異常を検出できる。しかしながら、本実施形態は、複素時間相関画像の振幅の分布から異常を検出することに制限するものではない。検査対称面の法線ベクトルの分布と対応した特徴として、位相の分布の勾配を用いてもよい。そこで、次に位相の分布の勾配を用いた例について説明する。
By the processing procedure described above, it is possible to detect an abnormality of the inspected object from the amplitude value of each pixel (in other words, the amplitude distribution). However, the present embodiment is not limited to detecting an abnormality from the amplitude distribution of the complex time correlation image. The gradient of the phase distribution may be used as a feature corresponding to the distribution of normal vectors on the inspection symmetry plane. An example using the gradient of the phase distribution will be described next.
次に、本実施形態の異常検出処理部105における位相に基づく異常検出処理について説明する。図12は、本実施形態の異常検出処理部105における当該処理の手順を示すフローチャートである。
Next, the abnormality detection process based on the phase in the abnormality detection processing unit 105 of the present embodiment will be described. FIG. 12 is a flowchart showing a procedure of the processing in the abnormality detection processing unit 105 of the present embodiment.
まず、異常検出処理部105は、位相画像データの画素毎の光の位相値(を表した画素値)から、当該画素を基準(例えば中心)として、N×N領域の平均位相値を減算し(ステップS1201)、位相の平均差分画像データを生成する。位相の平均差分画像データは、位相の勾配に対応する。
First, the abnormality detection processing unit 105 subtracts the average phase value of the N × N region from the phase value of the light of each pixel of the phase image data (a pixel value representing the pixel value) using the pixel as a reference (for example, the center). (Step S1201), phase average difference image data is generated. The phase average difference image data corresponds to the phase gradient.
次に、異常検出処理部105は、減算により生成された位相の平均差分画像データの大きさ(絶対値)と、閾値とを比較し、平均差分画像データの大きさが閾値以上となる画素を、異常(欠陥)のある画素として検出する(ステップS1202)。
Next, the abnormality detection processing unit 105 compares the magnitude (absolute value) of the average difference image data of the phase generated by the subtraction with a threshold value, and determines pixels whose average difference image data size is equal to or greater than the threshold value. Then, it is detected as an abnormal (defect) pixel (step S1202).
このS1202の検出結果により、異常検出処理部105は、平均差分画像データの正負、すなわち、画素の位相値と平均位相値との大小関係によって、凹凸を判別することができる(ステップS1203)。画素の位相値と平均位相値とのどちらが大きい場合に凸となるかは、各部の設定によって変化するが、大小関係が異なると、凹凸が異なる。
Based on the detection result of S1202, the abnormality detection processing unit 105 can determine the unevenness based on the sign of the average difference image data, that is, the magnitude relationship between the phase value of the pixel and the average phase value (Step S1203). Which of the pixel phase value and the average phase value is convex depends on the setting of each part, but the unevenness differs if the magnitude relationship is different.
なお、他の手法によって得られた位相の分布の勾配から、異常を検出することができる。例えば、異常検出処理部105は、別の手法として、正規化された時間相関画像データのN×Nの領域の平均ベクトルと、正規化された各画素のベクトルとの差の大きさが、閾値よりも大きい場合に、異常(欠陥)がある画素として検出することができる。また、位相の分布の勾配に限られず、位相の分布に対応する情報に基づいて被検査体の異常を検出すればよい。
Note that an abnormality can be detected from the gradient of the phase distribution obtained by another method. For example, as another method, the abnormality detection processing unit 105 determines whether the difference between the average vector of the N × N region of the normalized time correlation image data and the normalized vector of each pixel is a threshold value. If it is larger than that, it can be detected as a pixel having an abnormality (defect). Further, the abnormality of the object to be inspected may be detected based on information corresponding to the phase distribution, not limited to the gradient of the phase distribution.
次に、本実施形態の異常検出処理部105における振幅および強度に基づく異常検出処理について説明する。図13は、本実施形態の異常検出処理部105における当該処理の手順を示すフローチャートである。
Next, the abnormality detection process based on the amplitude and intensity in the abnormality detection processing unit 105 of the present embodiment will be described. FIG. 13 is a flowchart showing a procedure of the processing in the abnormality detection processing unit 105 of the present embodiment.
まず、異常検出処理部105は、時間相関画像データと強度画像データとから、各画素について、次の式(100)を用いて、振幅(を表す画素値)C(x,y)(式(7)参照)と強度(を表す画素値)G(x,y)(式(6)参照)との比R(x,y)を算出する(ステップS1301)。
First, the abnormality detection processing unit 105 uses the following equation (100) for each pixel from the time correlation image data and the intensity image data, and uses the following equation (100) to represent the amplitude (representing pixel value) C (x, y) (equation ( 7)) and intensity (a pixel value representing) G (x, y) (see equation (6)) R (x, y) is calculated (step S1301).
R(x,y)=C(x,y)/G(x,y)……(100)
R (x, y) = C (x, y) / G (x, y) (100)
次に、異常検出処理部105は、比R(x,y)と閾値とを比較し、比R(x,y)の値が対応する閾値以下となる画素を、異常(欠陥)のある画素として検出する(ステップS1302)。また、異常検出処理部105は、比R(x,y)と閾値とを比較し、比R(x,y)の値が対応する別の閾値以上となる画素を、ムラ(汚れ等)のある画素として検出する(ステップS1303)。法線ベクトルの分布の異常により、振幅の打ち消し合い(減殺)が顕著となった場合には、強度に比べて振幅がより大きく下がる。一方、法線ベクトルの分布にはそれほどの異常は無いものの被検査体150の表面の汚れ等によって光の吸収が顕著となった場合には、振幅に比べて強度がより大きく下がる。よって、異常検出処理部105は、ステップS1302およびステップS1303による異常種別の検出が可能となる。
Next, the abnormality detection processing unit 105 compares the ratio R (x, y) with a threshold value, and sets a pixel having a ratio R (x, y) value equal to or less than the corresponding threshold value to a pixel having an abnormality (defect). (Step S1302). In addition, the abnormality detection processing unit 105 compares the ratio R (x, y) with a threshold value, and determines that a pixel whose ratio R (x, y) is equal to or greater than another corresponding threshold value is uneven (dirt or the like). A pixel is detected (step S1303). When the cancellation of the amplitude (attenuation) becomes significant due to an abnormality in the distribution of the normal vector, the amplitude decreases more than the strength. On the other hand, although there is not so much abnormality in the normal vector distribution, when the light absorption becomes significant due to dirt on the surface of the object 150 to be inspected, the intensity is greatly reduced compared to the amplitude. Therefore, the abnormality detection processing unit 105 can detect the abnormality type in steps S1302 and S1303.
次に、本実施形態の検査システムにおける被検査体の検査処理について説明する。図14は、本実施形態の検査システムにおける上述した処理の手順を示すフローチャートである。なお、被検査体150は、すでにアーム140に固定された状態で、検査の初期位置に配置されているものとする。
Next, the inspection process of the object to be inspected in the inspection system of this embodiment will be described. FIG. 14 is a flowchart showing a procedure of the above-described processing in the inspection system of the present embodiment. It is assumed that the device under test 150 is already fixed to the arm 140 and arranged at the initial position of the inspection.
本実施形態のPC100が、照明装置120に対して、被検査体を検査するための縞パターンを出力する(ステップS1401)。
The PC 100 of the present embodiment outputs a fringe pattern for inspecting the object to be inspected to the illumination device 120 (step S1401).
照明装置120は、PC100から入力された縞パターンを格納する(ステップS1421)。そして、照明装置120は、格納された縞パターンを、時間遷移に従って変化するように表示する(ステップS1422)。なお、照明装置120が表示を開始する条件は、縞パターンが格納された際に制限するものではなく、例えば検査者が照明装置120に対して開始操作を行った際でもよい。
The lighting device 120 stores the fringe pattern input from the PC 100 (step S1421). And the illuminating device 120 displays the stored fringe pattern so that it may change according to a time transition (step S1422). Note that the conditions under which the illuminating device 120 starts display are not limited when the fringe pattern is stored, and may be, for example, when the inspector performs a start operation on the illuminating device 120.
そして、PC100の制御部103が、時間相関カメラ110に対して、撮影の開始指示を送信する(ステップS1402)。
And the control part 103 of PC100 transmits the start instruction | indication of imaging | photography with respect to the time correlation camera 110 (step S1402).
次に、時間相関カメラ110が、送信されてきた撮影指示に従って、被検査体150を含む領域について撮像を開始する(ステップS1411)。次に、時間相関カメラ110の制御部240が、強度画像データと、時間相関画像データと、を生成する(ステップS1412)。そして、時間相関カメラ110の制御部240が、強度画像データと、時間相関画像データと、を、PC100に出力する(ステップS1413)。
Next, the time correlation camera 110 starts imaging in the area including the inspected object 150 in accordance with the transmitted imaging instruction (step S1411). Next, the control unit 240 of the time correlation camera 110 generates intensity image data and time correlation image data (step S1412). Then, the control unit 240 of the time correlation camera 110 outputs the intensity image data and the time correlation image data to the PC 100 (step S1413).
PC100の制御部103は、強度画像データと、時間相関画像データと、を受け取る(ステップS1403)。そして、振幅-位相画像生成部104は、受け取った強度画像データと時間相関画像データとから、振幅画像データと、位相画像データとを生成する(ステップS1404)。
The control unit 103 of the PC 100 receives the intensity image data and the time correlation image data (step S1403). Then, the amplitude-phase image generation unit 104 generates amplitude image data and phase image data from the received intensity image data and time correlation image data (step S1404).
そして、異常検出処理部105が、振幅画像データと、位相画像データとに基づいて、被検査体の異常検出制御を行う(ステップS1405)。そして、異常検出処理部105は、異常検出結果を、PC100が備える(図示しない)表示装置に出力する(ステップS1406)。
Then, the abnormality detection processing unit 105 performs abnormality detection control of the inspected object based on the amplitude image data and the phase image data (step S1405). Then, the abnormality detection processing unit 105 outputs the abnormality detection result to a display device (not shown) included in the PC 100 (step S1406).
異常検出結果の出力例としては、強度画像データを表示するとともに、振幅画像データと位相画像データとに基づいて異常が検出された領域に対応する、強度画像データの領域を、検査者が異常を認識できるように装飾表示するなどが考えられる。また、視覚に基づく出力に制限するものではなく、音声等で異常が検出されたことを出力してもよい。
As an output example of the abnormality detection result, the intensity image data is displayed, and an area of the intensity image data corresponding to the area where the abnormality is detected based on the amplitude image data and the phase image data is displayed. For example, it is possible to display the decoration so that it can be recognized. Further, the output is not limited to visual output, and it may be output that an abnormality has been detected by voice or the like.
制御部103は、当該被検査体の検査が終了したか否かを判定する(ステップS1407)。検査が終了していないと判定した場合(ステップS1407:No)、アーム制御部101が、予め定められた設定に従って、次の検査対象となる被検査体の表面が、時間相関カメラ110で撮影できるように、アームの移動制御を行う(ステップS1408)。アームの移動制御が終了した後、制御部103が、再び時間相関カメラ110に対して、撮影の開始指示を送信する(ステップS1402)。
The control unit 103 determines whether or not the inspection of the inspected object has been completed (step S1407). When it is determined that the inspection has not been completed (step S1407: No), the arm control unit 101 can photograph the surface of the inspection object to be inspected with the time correlation camera 110 according to a predetermined setting. In this manner, arm movement control is performed (step S1408). After the arm movement control is completed, the control unit 103 transmits an imaging start instruction to the time correlation camera 110 again (step S1402).
一方、制御部103は、当該被検査体の検査が終了したと判定した場合(ステップS1407:Yes)、終了指示を時間相関カメラ110に対して出力し(ステップS1409)、処理を終了する。
On the other hand, when it is determined that the inspection of the object to be inspected is completed (step S1407: Yes), the control unit 103 outputs an end instruction to the time correlation camera 110 (step S1409) and ends the process.
そして、時間相関カメラ110は、終了指示を受け付けたか否かを判定する(ステップS1414)。終了指示を受け付けていない場合(ステップS1414:No)、再びステップS1411から処理を行う。一方、終了指示を受け付けた場合(ステップS1414:Yes)、処理を終了する。
Then, the time correlation camera 110 determines whether an end instruction has been received (step S1414). If an end instruction has not been received (step S1414: NO), the processing is performed again from step S1411. On the other hand, if an end instruction has been received (step S1414: YES), the process ends.
なお、照明装置120の終了処理は、検査者が行ってもよいし、他の構成からの指示に従って終了してもよい。
It should be noted that the termination process of the lighting device 120 may be performed by an inspector or may be terminated according to an instruction from another configuration.
また、本実施形態では、時間相関カメラ110を用いて生成された強度画像データと、時間相関画像データと、を生成する例について説明した。しかしながら、強度画像データと、時間相関画像データと、を生成するために時間相関カメラ110を用いることに制限するものではなく、アナログ的な処理で実現可能な時間相関カメラや、それと等価な動作をする撮像システムを用いてもよい。例えば、通常のデジタルスチルカメラが生成した画像データを出力し、情報処理装置が、デジタルスチルカメラが生成した画像データを、フレーム画像データとして用いて参照信号を重畳することで、時間相関画像データを生成してもよいし、イメージセンサ内で光強度信号に参照信号を重畳するようなデジタルカメラを用いて、時間相関画像データを生成してもよい。
In the present embodiment, the example in which the intensity image data generated using the time correlation camera 110 and the time correlation image data are generated has been described. However, the present invention is not limited to the use of the time correlation camera 110 for generating the intensity image data and the time correlation image data, and a time correlation camera that can be realized by analog processing or an operation equivalent thereto. An imaging system may be used. For example, image data generated by a normal digital still camera is output, and the information processing apparatus superimposes a reference signal using the image data generated by the digital still camera as frame image data, thereby generating time-correlated image data. The time correlation image data may be generated by using a digital camera that superimposes a reference signal on a light intensity signal in the image sensor.
(変形例1)
本実施形態では、周囲との違いに基づいて、異常に関連する特徴を検出する例について説明したが、周囲との違いに基づいて当該特徴を検出することに制限するものではなく、参照形状のデータ(参照データ、例えば、時間相関データや、振幅画像データ、位相画像データ等)との差異に基づいて当該特徴を検出してもよい。この場合、参照データの場合とで、空間位相変調照明(縞パターン)の位置合わせおよび同期が必要となる。 (Modification 1)
In this embodiment, an example in which a feature related to an abnormality is detected based on a difference from the surroundings has been described, but the present invention is not limited to detecting the feature based on a difference from the surroundings. The feature may be detected based on a difference from data (reference data such as time correlation data, amplitude image data, phase image data, etc.). In this case, it is necessary to align and synchronize the spatial phase modulation illumination (stripe pattern) with the reference data.
本変形例では、異常検出処理部105が、予め(図示しない)記憶部に記憶された、参照表面から得られた振幅画像データ及び位相画像データと、被検査体150の振幅画像データ及び位相画像データと、を比較し、被検査体150の表面と参照表面との間で、光の振幅及び光の位相とのうちいずれか一つ以上について所定の基準以上の違いがあるか否かを判定する。
In this modification, the abnormality detection processing unit 105 stores the amplitude image data and phase image data obtained from the reference surface and the amplitude image data and phase image of the inspected object 150, which are stored in advance in a storage unit (not shown). The data is compared, and it is determined whether or not there is a difference greater than a predetermined standard for any one or more of the light amplitude and the light phase between the surface of the inspected object 150 and the reference surface. To do.
本変形例は、第1の実施形態と同じ構成の検査システムを用い、参照表面として正常な被検査体の表面を用いる例とする。
This modification is an example in which the inspection system having the same configuration as that of the first embodiment is used and the surface of a normal inspection object is used as the reference surface.
照明装置120がスクリーン130を介して縞パターンを照射している間に、時間相関カメラ110が、正常な被検査体の表面を撮像し、時間相関画像データを生成する。そして、PC100が、時間相関カメラ110で生成された時間相関画像データを入力し、振幅画像データ及び位相画像データを生成し、PC100の図示しない記憶部に振幅画像データ及び位相画像データを記憶させておく。そして、時間相関カメラ110が、異常が生じているか否か判定したい被検査体を撮像し、時間相関画像データを生成する。そして、PC100が、時間相関画像データから、振幅画像データ及び位相画像データを生成した後、記憶部に記憶されていた、正常な被検査体の振幅画像データ及び位相画像データと比較する。その際に、正常な被検査体の振幅画像データ及び位相画像データと、検査対象の被検査体の振幅画像データ及び位相画像データと、の比較結果を、異常を検出する特徴を示したデータとして出力する。そして、異常を検出する特徴が、当該所定の基準以上の場合に、被検査体150に対して異常があると推測できる。
While the illumination device 120 irradiates the fringe pattern via the screen 130, the time correlation camera 110 images the surface of a normal object to be inspected and generates time correlation image data. Then, the PC 100 inputs the time correlation image data generated by the time correlation camera 110, generates amplitude image data and phase image data, and stores the amplitude image data and phase image data in a storage unit (not shown) of the PC 100. deep. Then, the time correlation camera 110 captures an object to be inspected for determining whether or not an abnormality has occurred, and generates time correlation image data. Then, the PC 100 generates the amplitude image data and the phase image data from the time correlation image data, and then compares the amplitude image data and the phase image data with the amplitude image data and the phase image data of the normal inspection object stored in the storage unit. At that time, the comparison result of the amplitude image data and phase image data of a normal inspection object and the amplitude image data and phase image data of the inspection object to be inspected is data indicating characteristics for detecting an abnormality. Output. Then, when the feature for detecting an abnormality is equal to or greater than the predetermined reference, it can be estimated that the inspection object 150 is abnormal.
これにより、本変形例では、正常な被検査体の表面と差異が生じているか否か、換言すれば、被検査体の表面に異常が生じているか否かを判定できる。なお、振幅画像データ及び位相画像データの比較手法は、どのような手法を用いてもよいので、説明を省略する。
Thus, in this modification, it is possible to determine whether or not there is a difference from the surface of the normal inspection object, in other words, whether or not an abnormality occurs on the surface of the inspection object. Note that any method may be used as a method for comparing the amplitude image data and the phase image data, and thus description thereof is omitted.
さらに、本変形例では参照表面の違いに基づいて、異常を検出する特徴を示したデータを出力する例について説明したが、参照表面の違いと、第1の実施形態で示した周囲との違いと、を組み合わせて、異常を検出する特徴を算出してもよい。組み合わせる手法は、どのような手法を用いてもよいので、説明を省略する。
Furthermore, in this modification, an example in which data indicating characteristics for detecting an abnormality is output based on the difference in the reference surface has been described. However, the difference between the reference surface and the surroundings described in the first embodiment And a feature for detecting an abnormality may be calculated. Since any method may be used as the method of combination, description thereof is omitted.
(変形例2)
第1の実施形態では、x方向に縞パターンを動かして、被検査体の異常(欠陥)を検出する例について説明した。しかしながら、x方向に垂直なy方向で急峻に法線の分布が変化する異常(欠陥)が被検査体に生じている場合、x方向に縞パターンを動かすよりも、y方向に縞パターンを動かす方が欠陥の検出が容易になる場合がある。そこで、変形例では、x方向に移動する縞パターンと、y方向に移動する縞パターンとを、交互に切り替える例について説明する。 (Modification 2)
In the first embodiment, the example in which the fringe pattern is moved in the x direction to detect an abnormality (defect) of the inspection object has been described. However, when an abnormality (defect) in which the normal distribution changes sharply in the y direction perpendicular to the x direction is generated in the inspection object, the fringe pattern is moved in the y direction rather than in the x direction. It may be easier to detect defects. Therefore, in the modification, an example will be described in which a fringe pattern moving in the x direction and a fringe pattern moving in the y direction are alternately switched.
本変形例の照明制御部102は、所定の時間間隔毎に、照明装置120に出力する縞パターンを切り替える。これにより、照明装置120は、一つの検査対象面に対して、異なる方向に延びた複数の縞パターンを出力する。
The illumination control unit 102 of this modification switches the fringe pattern output to the illumination device 120 at every predetermined time interval. Thereby, the illuminating device 120 outputs the some fringe pattern extended in the different direction with respect to one test object surface.
図15は、本変形例の照明制御部102が出力する縞パターンの切り替え例を示した図である。図15の(A)では、照明制御部102は、照明装置120が表示する縞パターンをx方向に遷移させる。その後、(B)に示されるように、照明制御部102は、照明装置120が表示する縞パターンをy方向に遷移させる。
FIG. 15 is a diagram illustrating a switching example of the fringe pattern output from the illumination control unit 102 of the present modification. In FIG. 15A, the illumination control unit 102 changes the stripe pattern displayed by the illumination device 120 in the x direction. Thereafter, as illustrated in (B), the illumination control unit 102 causes the stripe pattern displayed by the illumination device 120 to transition in the y direction.
そして、PC100の制御部103は、図15の(A)の縞パターン照射から得られた時間相関画像データに基づいて、異常検出を行い、図15の(B)の縞パターン照射から得られた時間相関画像データに基づいて、異常検出を行う。
And the control part 103 of PC100 performed abnormality detection based on the time correlation image data obtained from the stripe pattern irradiation of FIG. 15 (A), and obtained from the stripe pattern irradiation of FIG. 15 (B). Abnormality detection is performed based on the time correlation image data.
図16は、本変形例の照明制御部102が、異常(欠陥)1601を含めた表面に縞パターンを照射した例を示した図である。図16に示す例では、異常(欠陥)1601が、x方向に延びている。この場合、照明制御部102は、x方向に交差するy方向、換言すれば異常(欠陥)1601の長手方向に交差する方向に縞パターンが移動するように設定する。当該設定により、検出精度を向上させることができる。
FIG. 16 is a diagram showing an example in which the illumination control unit 102 of the present modification irradiates the surface including the abnormality (defect) 1601 with a stripe pattern. In the example shown in FIG. 16, an abnormality (defect) 1601 extends in the x direction. In this case, the illumination control unit 102 sets the fringe pattern to move in the y direction that intersects the x direction, in other words, in the direction that intersects the longitudinal direction of the abnormality (defect) 1601. With this setting, detection accuracy can be improved.
図17は、y方向、換言すれば欠陥1601の長手方向に直交する方向に縞パターンを変化させた場合における、異常(欠陥)1701とスクリーン130上の縞パターンの関係を示した図である。図17に示されるように、y方向に幅が狭く、且つ当該y方向に交差するx方向を長手方向とする異常(欠陥)1701が生じている場合、照明装置120から照射された光は、x方向に交差するy方向で光の振幅の打ち消しが大きくなる。このため、PC100では、y方向に移動させた縞パターンに対応する振幅画像データから、当該異常(欠陥)を検出できる。
FIG. 17 is a diagram showing the relationship between the abnormality (defect) 1701 and the stripe pattern on the screen 130 when the stripe pattern is changed in the y direction, in other words, in the direction orthogonal to the longitudinal direction of the defect 1601. As shown in FIG. 17, when an abnormality (defect) 1701 having a narrow width in the y direction and a longitudinal direction in the x direction intersecting the y direction occurs, the light emitted from the illumination device 120 is In the y direction that intersects the x direction, the cancellation of the amplitude of light increases. Therefore, the PC 100 can detect the abnormality (defect) from the amplitude image data corresponding to the stripe pattern moved in the y direction.
本変形例の検査システムにおいて、被検査体に生じる欠陥の長手方向がランダムな場合には、複数方向(例えば、x方向、及び当該x方向に交差するy方向等)で縞パターンを表示することで、欠陥の形状を問わずに当該欠陥の検出が可能となり、異常(欠陥)の検出精度を向上させることができる。また、異常の形状に合わせた縞パターンを投影することで、異常の検出精度を向上させることができる。
In the inspection system of this modification, when the longitudinal direction of the defect generated in the inspection object is random, the fringe pattern is displayed in a plurality of directions (for example, the x direction and the y direction crossing the x direction). Thus, the defect can be detected regardless of the shape of the defect, and the detection accuracy of the abnormality (defect) can be improved. Further, by projecting a fringe pattern that matches the shape of the abnormality, the abnormality detection accuracy can be improved.
(変形例3)
また、上述した変形例2は、x方向の異常検出と、y方向の異常検出と、を行う際に、縞パターンを切り替える手法に制限するものでない。そこで、変形例3では、照明制御部102が照明装置120に出力する縞パターンをx方向及びy方向同時に動かす例について説明する。 (Modification 3)
In addition, the second modification described above is not limited to the method of switching the fringe pattern when performing abnormality detection in the x direction and abnormality detection in the y direction. Therefore, inModification 3, an example in which the stripe pattern output from the illumination control unit 102 to the illumination device 120 is moved simultaneously in the x direction and the y direction will be described.
また、上述した変形例2は、x方向の異常検出と、y方向の異常検出と、を行う際に、縞パターンを切り替える手法に制限するものでない。そこで、変形例3では、照明制御部102が照明装置120に出力する縞パターンをx方向及びy方向同時に動かす例について説明する。 (Modification 3)
In addition, the second modification described above is not limited to the method of switching the fringe pattern when performing abnormality detection in the x direction and abnormality detection in the y direction. Therefore, in
図18は、本変形例の照明制御部102が照明装置120に出力する縞パターンの例を示した図である。図18に示される例では、照明制御部102が縞パターンを、方向1801に移動させる。
FIG. 18 is a diagram illustrating an example of a fringe pattern output to the lighting device 120 by the lighting control unit 102 according to the present modification. In the example shown in FIG. 18, the illumination control unit 102 moves the fringe pattern in the direction 1801.
図18に示される縞パターンは、x方向では1周期1802の縞パターンを含み、y方向では一周期1803の縞パターンを含んでいる。つまり、図18に示される縞パターンは、幅が異なる交差する方向に延びた複数の縞を有している。なお、x方向の縞パターンの幅と、y方向の縞パターンの幅と、を異ならせる必要がある。これにより、x方向に対応する時間相関画像データと、y方向に対応する時間相関画像データと、を生成する際に、対応する参照信号を異ならせることができる。なお、縞パターンによる光の強度の変化の周期(周波数)が変化すればよいので、縞の幅を変化させるのに変えて、縞パターン(縞)の移動速度を変化させてもよい。
The stripe pattern shown in FIG. 18 includes a stripe pattern with one period 1802 in the x direction and a stripe pattern with one period 1803 in the y direction. That is, the stripe pattern shown in FIG. 18 has a plurality of stripes extending in crossing directions having different widths. It is necessary to make the width of the stripe pattern in the x direction different from the width of the stripe pattern in the y direction. Thereby, when generating the time correlation image data corresponding to the x direction and the time correlation image data corresponding to the y direction, the corresponding reference signals can be made different. In addition, since the period (frequency) of the light intensity change by the stripe pattern only needs to be changed, the moving speed of the stripe pattern (stripe) may be changed instead of changing the width of the stripe.
そして、時間相関カメラ110が、x方向の縞パターンに対応する参照信号に基づいて、x方向の縞パターンに対応する時間相関画像データを生成し、y方向の縞パターンに対応する参照信号に基づいて、y方向の縞パターンに対応する時間相関画像データを生成する。その後、PC100の制御部103は、x方向の縞パターンに対応する時間相関画像データに基づいて、異常検出を行った後、y方向の縞パターンに対応する時間相関画像データに基づいて、異常検出を行う。これにより、本変形例では、欠陥の生じた方向を問わずに検出が可能となり、異常(欠陥)の検出精度を向上させることができる。
Then, the time correlation camera 110 generates time correlation image data corresponding to the stripe pattern in the x direction based on the reference signal corresponding to the stripe pattern in the x direction, and based on the reference signal corresponding to the stripe pattern in the y direction. Thus, time correlation image data corresponding to the stripe pattern in the y direction is generated. After that, the control unit 103 of the PC 100 detects an abnormality based on the time correlation image data corresponding to the stripe pattern in the x direction, and then detects an abnormality based on the time correlation image data corresponding to the stripe pattern in the y direction. I do. Thereby, in this modification, it becomes possible to detect regardless of the direction in which the defect occurs, and the detection accuracy of the abnormality (defect) can be improved.
(第2の実施形態)
第1の実施形態では、照明装置120が、x方向に縞の幅が一種類の縞パターンを表示する例について説明した。しかしながら、上述した実施形態はx方向の縞の幅を一種類に制限するものではなく、x方向の縞の幅を複数種類にしてもよい。そこで、本実施形態では、x方向の縞の幅を複数種類とする例について説明する。 (Second Embodiment)
In 1st Embodiment, the illuminatingdevice 120 demonstrated the example which displays the stripe pattern with the width | variety of one stripe in the x direction. However, the embodiment described above does not limit the width of the stripe in the x direction to one type, and the width of the stripe in the x direction may be a plurality of types. Therefore, in the present embodiment, an example in which a plurality of types of stripe widths in the x direction are used will be described.
第1の実施形態では、照明装置120が、x方向に縞の幅が一種類の縞パターンを表示する例について説明した。しかしながら、上述した実施形態はx方向の縞の幅を一種類に制限するものではなく、x方向の縞の幅を複数種類にしてもよい。そこで、本実施形態では、x方向の縞の幅を複数種類とする例について説明する。 (Second Embodiment)
In 1st Embodiment, the illuminating
本実施形態は、被検査体の一つの検査対象面について、x方向に縞の幅を複数種類用いて、換言すれば縞が異なる複数の縞パターンを用いて、被検査体で生じた異常が突形状か否かを判定する例とする。
This embodiment uses a plurality of stripe widths in the x direction for one inspection target surface of the object to be inspected, in other words, using a plurality of stripe patterns having different stripes, An example of determining whether or not the shape is a protrusion is shown.
第2の実施形態の検査システムは、第1の実施形態の検査システムと同様の構成を備えているため、説明を省略する。次に、第2の実施形態の照明制御部102が出力する縞パターンについて説明する。
Since the inspection system of the second embodiment has the same configuration as the inspection system of the first embodiment, the description thereof is omitted. Next, the fringe pattern output by the illumination control unit 102 of the second embodiment will be described.
図19は、第2の実施形態の照明制御部102が照明装置120に出力する縞パターンの例を示した図である。図19に示されるように、照明制御部102は、幅が異なる同一方向に延びた複数の縞を有する縞パターンを出力するよう制御する。
FIG. 19 is a diagram illustrating an example of a fringe pattern output from the illumination control unit 102 of the second embodiment to the illumination device 120. As illustrated in FIG. 19, the illumination control unit 102 controls to output a stripe pattern having a plurality of stripes extending in the same direction and having different widths.
図19に示される例では、図19の矩形波(A)と、矩形波(B)と、を重畳した矩形波(C)に対応する縞パターン(D)が照明制御部102により出力される。本実施形態では、距離1901の間に、矩形波(A)が1周する間に、矩形波(B)が8周する。
In the example shown in FIG. 19, a stripe pattern (D) corresponding to a rectangular wave (C) obtained by superimposing the rectangular wave (A) and the rectangular wave (B) in FIG. 19 is output by the illumination control unit 102. . In the present embodiment, during the distance 1901, the rectangular wave (B) makes eight rounds while the rectangular wave (A) makes one round.
本実施形態では、矩形波(B)で表される縞の数が、矩形波(A)で表される縞の数の、偶数倍になるように設定されている。これは、矩形波には奇数倍の高調波成分が重畳されていることに基づくものであり、偶数倍にすることで高調波成分と干渉するのを抑止できる。
In the present embodiment, the number of stripes represented by the rectangular wave (B) is set to be an even multiple of the number of stripes represented by the rectangular wave (A). This is based on the fact that the odd-numbered harmonic component is superimposed on the rectangular wave, and interference with the harmonic component can be suppressed by increasing the even-numbered factor.
複数種類の縞パターンを用いて解析処理を行う場合、複数種類間の縞パターンについて、適宜な縞幅の差があるのが好ましい。例えば、一方の縞の幅に対して、他方の縞の幅が6倍以上であれば好ましい解析結果が得られる。そこで、本実施形態では、例として、一方の縞の幅に対して、他方の縞の幅が8倍になるように設定した。
When performing analysis processing using a plurality of types of stripe patterns, it is preferable that there is an appropriate difference in stripe width between the plurality of types of stripe patterns. For example, if the width of the other stripe is 6 times or more than the width of one stripe, a preferable analysis result can be obtained. Therefore, in this embodiment, as an example, the width of the other stripe is set to be 8 times the width of the other stripe.
なお、本実施形態では、矩形波(A)が1周するのに対して、矩形波(B)が8周する例について説明したが、このような例に制限するものではなく、矩形波(A)と、矩形波(B)と、の周波数(周期)が異なっていればよい。
In the present embodiment, an example in which the rectangular wave (A) makes one turn while the rectangular wave (B) makes eight turns has been described. However, the present invention is not limited to such an example. The frequency (cycle) of A) and the rectangular wave (B) may be different.
そして、照明装置120が、照明制御部102から出力された図19で示されるような縞パターンを、スクリーン130を介して、被検査体150に対して照射する。これに伴い、時間相関カメラ110は、図19に示される縞パターンの、被検査体からの反射光を撮影する。本実施形態の時間相関カメラ110は、撮影結果として、2系統分の時間相関画像データを生成する。
And the illuminating device 120 irradiates the to-be-inspected object 150 with the striped pattern as shown in FIG. 19 output from the illumination control unit 102 through the screen 130. Accordingly, the time correlation camera 110 captures the reflected light from the object to be inspected in the stripe pattern shown in FIG. The time correlation camera 110 of the present embodiment generates time correlation image data for two systems as a photographing result.
具体的には、時間相関カメラ110は、矩形波(A)の縞パターンに対応する参照信号に基づいて、矩形波(A)の縞パターンに対応する時間相関画像データを生成し、矩形波(B)の縞パターンに対応する参照信号に基づいて、矩形波(B)の縞パターンに対応する時間相関画像データを生成する。出力された2種類(2系統)の時間相関画像データと、強度画像データは、PC100に出力される。なお、1種類の時間相関画像データ毎に、第1の実施の形態で示したように、実部と虚部との時間相関画像データを含んでいる。
Specifically, the time correlation camera 110 generates time correlation image data corresponding to the fringe pattern of the rectangular wave (A) based on the reference signal corresponding to the fringe pattern of the rectangular wave (A). Based on the reference signal corresponding to the fringe pattern of B), time correlation image data corresponding to the fringe pattern of the rectangular wave (B) is generated. The two types (two systems) of output time correlation image data and intensity image data are output to the PC 100. Each type of time correlation image data includes time correlation image data of a real part and an imaginary part as shown in the first embodiment.
その後、PC100の制御部103は、矩形波(A)の縞パターンに対応する時間相関画像データと、矩形波(B)の縞パターンに対応する時間相関画像データと、に基づいて、被検査体の異常検出を行う。
Thereafter, the control unit 103 of the PC 100 determines the object to be inspected based on the time correlation image data corresponding to the stripe pattern of the rectangular wave (A) and the time correlation image data corresponding to the stripe pattern of the rectangular wave (B). Anomaly detection is performed.
本実施形態のPC100は、矩形波(A)の縞パターンに対応する時間相関画像データと、矩形波(B)の縞パターンに対応する時間相関画像データと、を受け取ることで、第1の実施形態で示したような、位相の違いに基づく異常と振幅の違いに基づく異常との他に、被検査体の表面の形状を確認することが容易となる。
The PC 100 of the present embodiment receives the time correlation image data corresponding to the stripe pattern of the rectangular wave (A) and the time correlation image data corresponding to the stripe pattern of the rectangular wave (B), thereby performing the first implementation. In addition to the abnormality based on the phase difference and the abnormality based on the amplitude difference as shown in the form, it becomes easy to confirm the shape of the surface of the object to be inspected.
なお、本実施形態では、一つの縞パターンに複数種類の縞幅を重畳した例について説明するが、複数種類の縞幅を用いる手法として、重畳する手法に制限するものではなく、一つの検査対象面について幅が異なる複数の縞パターンを出力できればどのような手法を用いてもよく、例えば、幅が異なる複数の縞パターンを切り替えて表示するように制御してもよい。
In this embodiment, an example in which a plurality of types of stripe widths are superimposed on one stripe pattern will be described. However, the method of using a plurality of types of stripe widths is not limited to the method of superimposing, and one inspection object is used. Any method may be used as long as a plurality of fringe patterns having different widths can be output on the surface, and for example, control may be performed so as to switch and display a plurality of fringe patterns having different widths.
図20は、本実施形態の検査システムにおけるイメージセンサ220と、スクリーン130と、被検査体の表面形状と、の対応関係を示した図である。図20に示される例では、スクリーン130を介して照射される縞パターンがx方向に移動し、当該スクリーン130から照射された光が被検査体の表面形状2001で反射して、イメージセンサ220に入るものとする。イメージセンサ220の画素2011の幅pとする。図20で示す例では、被検査体の表面形状2001のうち、当該座標2002を中心に-p/2~p/2の領域1902で反射した光が、画素2011に入るものとする。xは、空間位相変調照明(縞パターン)の移動方向(位相変化方向)、x’は、xから距離H離れたxと平行な方向である。スクリーン130およびイメージセンサ220は、このx’に沿って位置されているものとする。z方向は、x方向およびx’方向との直交方向である。nは、法線ベクトル、αは、計測対象位置のx方向の勾配(角度)であるとともに、z方向と法線ベクトルとの角度、θ0は、スクリーン130とz方向とのなす角度である。
FIG. 20 is a diagram illustrating a correspondence relationship among the image sensor 220, the screen 130, and the surface shape of the object to be inspected in the inspection system of the present embodiment. In the example shown in FIG. 20, the fringe pattern irradiated through the screen 130 moves in the x direction, and the light irradiated from the screen 130 is reflected by the surface shape 2001 of the object to be inspected to the image sensor 220. Enter. The width p of the pixel 2011 of the image sensor 220 is assumed. In the example shown in FIG. 20, it is assumed that light reflected from a region 1902 of −p / 2 to p / 2 around the coordinates 2002 in the surface shape 2001 of the object to be inspected enters the pixel 2011. x is a moving direction (phase change direction) of the spatial phase modulation illumination (stripe pattern), and x ′ is a direction parallel to x that is a distance H away from x. It is assumed that the screen 130 and the image sensor 220 are positioned along this x ′. The z direction is a direction orthogonal to the x direction and the x ′ direction. n is the normal vector, α is the gradient (angle) of the measurement target position in the x direction, the angle between the z direction and the normal vector, and θ 0 is the angle formed by the screen 130 and the z direction. .
ここで、x方向の被検査体の表面形状をf(x)と定義する。この場合、f(x)をテイラー展開した結果、以下の式(10)で表すことができる。式(10)において、被検査体の表面形状の初期位置f0(オフセット)であり、被検査体の表面形状の曲率をR(=1/fxx)とする。fxxは、f(x)の2階微分である。なお、fx、fxxx等については、シフト量に応じたスクリーン位置からの反射のみを考えればよいため省略できる。
f(x)=f0+1/2fxxx2…(10) Here, the surface shape of the inspection object in the x direction is defined as f (x). In this case, as a result of Taylor expansion of f (x), it can be expressed by the following equation (10). In the equation (10), the initial position f 0 (offset) of the surface shape of the object to be inspected, and the curvature of the surface shape of the object to be inspected is R (= 1 / f xx ). f xx is the second derivative of f (x). Note that the f x, f xxx etc., can be omitted because it considered only reflections from the screen position corresponding to the shift amount.
f (x) = f 0 + 1 / 2f xx x 2 (10)
次に二階微分fxxについて説明する。図21は、二階微分fxx<0の場合の被検査体の表面形状の例を示した図である。図21に示されるように、二階微分fxx<0の場合、被検査体の表面形状2001は、突形状となる。この場合、イメージセンサ220の各画素の幅より、当該画素に入る光を照射するスクリーン130の幅の方が広くなる。
Next, the second order differential f xx will be described. FIG. 21 is a diagram showing an example of the surface shape of the object to be inspected when the second order differential f xx <0. As shown in FIG. 21, when the second-order differential f xx <0, the surface shape 2001 of the object to be inspected has a protruding shape. In this case, the width of the screen 130 that irradiates light entering the pixel is wider than the width of each pixel of the image sensor 220.
図22は、fxx>0の場合の被検査体の表面形状の例を示した図である。図22に示されるように、fxx>0の場合、被検査体の表面形状2001は、窪み形状となる。この場合、イメージセンサ220の各画素の幅より、当該画素に入る光を照射するスクリーン130の幅が狭くなる。つまり、図21,22から、二階微分fxxの正負を導出できれば、視認せずとも、被検査体の表面形状を把握できることがわかる。
FIG. 22 is a diagram showing an example of the surface shape of the object to be inspected when f xx > 0. As shown in FIG. 22, when f xx > 0, the surface shape 2001 of the object to be inspected is a hollow shape. In this case, the width of the screen 130 that irradiates light entering the pixel is narrower than the width of each pixel of the image sensor 220. That is, from FIG. 21, if deriving the sign of the second derivative f xx, without viewing, it can be seen that recognize the surface shape of the inspection object.
図20に戻り、被検査体の座標2002における表面形状の傾きαとした場合に以下の式(11)の関係が成り立つ。
tanα=fxxx…(11) Returning to FIG. 20, the relationship of the following equation (11) is established when the inclination α of the surface shape at the coordinates 2002 of the object to be inspected is set.
tan α = f xx x (11)
tanα=fxxx…(11) Returning to FIG. 20, the relationship of the following equation (11) is established when the inclination α of the surface shape at the coordinates 2002 of the object to be inspected is set.
tan α = f xx x (11)
視線の反射角は、以下の式(12)から算出できる。

The reflection angle of the line of sight can be calculated from the following equation (12).
なお、γはtanθ0である。ここで、式(12)の左辺に含まれる(θ0+2α)は、表面形状2001上の検査対象位置(図20ではx=0)に対応したイメージセンサ220からの視線に対応した検査対象位置でのz方向に対する反射角であり、位相と対応する(比例する)。また、式(12)の右辺に含まれるfxxxは、式(11)より、tanαである。したがって、図20から明らかであるとも言えるが、この式(12)は、法線ベクトルnを特徴づける角度αが、空間位相変調照明(縞パターン)の位相と対応することを示している。
Note that γ is tan θ 0 . Here, (θ 0 + 2α) included in the left side of Expression (12) is the inspection target position corresponding to the line of sight from the image sensor 220 corresponding to the inspection target position on the surface shape 2001 (x = 0 in FIG. 20). Is a reflection angle with respect to the z direction at and corresponds to (proportional to) the phase. Further, f xx x included in the right side of Expression (12) is tan α according to Expression (11). Therefore, although it can be said that it is clear from FIG. 20, this equation (12) shows that the angle α characterizing the normal vector n corresponds to the phase of the spatial phase modulation illumination (stripe pattern).
被検査体の表面形状の座標xに光を照射するスクリーン130の座標x’は、以下の式(13)で導出できる。なお、座標2002のx軸方向の座標x0とする。距離Hは、座標2002から、イメージセンサ220及びスクリーン130が配置された面までの距離とする。
x’=x-Htan(θ0+2α)…(13) The coordinate x ′ of thescreen 130 that emits light to the coordinate x of the surface shape of the object to be inspected can be derived by the following equation (13). It is assumed that the coordinate 2002 is a coordinate x 0 in the x-axis direction. The distance H is a distance from the coordinate 2002 to the surface on which the image sensor 220 and the screen 130 are arranged.
x ′ = x−H tan (θ 0 + 2α) (13)
x’=x-Htan(θ0+2α)…(13) The coordinate x ′ of the
x ′ = x−H tan (θ 0 + 2α) (13)
画素2011に入る複素相関画素値gは、スクリーン130から出力される位相ejkx’を画素2011の幅pで積分することで求められる。つまり、複素相関画素値gは、式(14)から導出できる。なお、縞の波数k=2π/λとし、λを縞の幅とする。

ここで、変数wは以下の式(15)とする。
w=1-2H(1+γ2)fxx …(15) The complex correlation pixel value g entering the pixel 2011 is obtained by integrating the phase ejkx ′ output from thescreen 130 with the width p of the pixel 2011. That is, the complex correlation pixel value g can be derived from Expression (14). Here, the wave number k of the stripe is set to 2π / λ, and λ is the width of the stripe.
Here, the variable w is assumed to be the following equation (15).
w = 1−2H (1 + γ 2 ) f xx (15)
w=1-2H(1+γ2)fxx …(15) The complex correlation pixel value g entering the pixel 2011 is obtained by integrating the phase ejkx ′ output from the
w = 1−2H (1 + γ 2 ) f xx (15)
本実施形態の検査システムにおいては、照明装置120が複数種類の縞幅が重畳された縞パターンを照射した場合に、時間相関カメラ110が、2種類の縞幅に対応する2種類の時間相関画像データを、実部と虚部とに分けて生成する。そして、PC100の振幅-位相画像生成部104は、入力された時間相関画像データから、縞幅毎に、振幅画像データと位相画像データとを生成する。
In the inspection system of this embodiment, when the illumination device 120 irradiates a stripe pattern in which a plurality of types of stripe widths are superimposed, the time correlation camera 110 has two types of time correlation images corresponding to two types of stripe widths. Data is generated by dividing it into a real part and an imaginary part. Then, the amplitude-phase image generation unit 104 of the PC 100 generates amplitude image data and phase image data for each stripe width from the input time correlation image data.
図23は、縞パターンにおける縞幅を種々に変化させた場合の、g/pを示すグラフである。図23の横軸はw、縦軸はg/pである。式(15)から、w=1を境に、fxx>0の場合とfxx<0の場合とが分かれることになる。ここで、変数wの値は、被検査体150の表面の法線ベクトルの分布および検査システムの位置関係(図20)に変化が無ければ、被検査位置に応じた値となる。したがって、図23から、縞の幅を変えた場合のそれぞれの結果としての複数のg/pの値を得て、それらの比率と合致する変数wを探すことにより、変数wの値、ひいてはfxxの値を推定することが可能となることが、理解できる。
FIG. 23 is a graph showing g / p when the stripe width in the stripe pattern is variously changed. The horizontal axis of FIG. 23 is w, and the vertical axis is g / p. From Equation (15), the case of f xx > 0 and the case of f xx <0 are separated from w = 1. Here, the value of the variable w is a value corresponding to the inspection position if there is no change in the distribution of normal vectors on the surface of the inspection object 150 and the positional relationship of the inspection system (FIG. 20). Therefore, from FIG. 23, by obtaining a plurality of g / p values as the respective results when the width of the stripe is changed and searching for the variable w that matches the ratio thereof, the value of the variable w, and thus f It can be understood that the value of xx can be estimated.
具体的には、例えば、式(14)から導出される次の式(16)を用いる。

Specifically, for example, the following equation (16) derived from equation (14) is used.
変数αは、式(14)の縞の幅が広い場合の複素相関画素値(振幅値)g1と、縞の幅が狭い場合の複素相関画素値(振幅値)g2と、の比g2/g1に相当する。なお、波数k1,k2については、k1<k2とする。
Variable α is complex correlation pixel values of the width of the stripe is wide of the formula (14) and (amplitude value) g 1, complex correlation pixel values of the width of the stripe is narrow (amplitude) and g 2, the ratio of g equivalent to 2 / g 1. The wave numbers k 1 and k 2 are set to k 1 <k 2 .
図24は、振幅比対応テーブルの例を示した図である。図24に示される振幅比対応テーブルは、式(16)を示している。図24の横軸はwであり、縦軸はαである。この振幅比対応テーブルは、予め制御部103内の(図示しない)記憶部に格納されているものとする。
FIG. 24 is a diagram showing an example of an amplitude ratio correspondence table. The amplitude ratio correspondence table shown in FIG. 24 shows Expression (16). The horizontal axis in FIG. 24 is w, and the vertical axis is α. This amplitude ratio correspondence table is stored in advance in a storage unit (not shown) in the control unit 103.
ここで、特定の被検査位置(画素)について、縞幅を変えた結果に基づく次の式(17)で示される値α0を得る。

そして、図24に示されるように、式(16)において、α=α0を満たす変数wを得ることができる。二つの変数wのうち一方を選択できる条件下であれば、選択された変数wに基づいて、式(15)から、fxxを導出できる。これにより、例えば、被検査体150で生じた欠陥(異常)が、突形状であるか否かを判定することができる。このように、本実施形態では、複数種類の縞幅による縞パターンを用いることで、被検査体の検査精度を向上させることができる。
Here, a value α 0 represented by the following expression (17) based on the result of changing the stripe width is obtained for a specific inspection position (pixel).
Then, as shown in FIG. 24, in equation (16), a variable w satisfying α = α 0 can be obtained. Under the condition that one of the two variables w can be selected, f xx can be derived from the equation (15) based on the selected variable w. Thereby, for example, it is possible to determine whether or not a defect (abnormality) generated in the inspection object 150 has a protruding shape. As described above, in this embodiment, the inspection accuracy of the object to be inspected can be improved by using the stripe pattern having a plurality of types of stripe widths.
また、図23から、各sinc関数で、w>0の場合、最初のg/pが0となる変数w(最初の横軸切片となるw)よりも変数wが大きい範囲であれば、g/pの最大値に対する減少、すなわち振幅の打ち消し合いが検出されやすいことがわかる。sinc関数が0となる条件から、式(14)で、(π・p・w/λ)>πとなればよく、次の式(18)
p・w/λ>1 … (18)
を満たすよう、縞幅(すなわち空間位相変調照明の位相変化方向の周期長)を設定すればよい。また、図23から、実際には、変数wがさらにその半分程度でもg/pの差異による検出性は確保できると考えられるので、次の式(19)
p・w/λ>0.5 … (19)
を満たすよう、縞幅(すなわち空間位相変調照明の位相変化方向の周期長)を設定すればよい。 Further, from FIG. 23, in each sinc function, when w> 0, if the variable w is larger than the variable w where the first g / p is 0 (w which is the first horizontal axis intercept), g It can be seen that a decrease with respect to the maximum value of / p, that is, an amplitude cancellation is easily detected. From the condition that the sinc function becomes 0, it is sufficient that (π · p · w / λ)> π in the equation (14), and the following equation (18)
p · w / λ> 1 (18)
The stripe width (that is, the period length in the phase change direction of the spatial phase modulation illumination) may be set so as to satisfy the above. Further, from FIG. 23, it is considered that the detectability due to the difference in g / p can be secured even if the variable w is further about half of that, so the following equation (19)
p · w / λ> 0.5 (19)
The stripe width (that is, the period length in the phase change direction of the spatial phase modulation illumination) may be set so as to satisfy the above.
(第3の実施形態)
第1~第2の実施形態では、明暗が等間隔の縞パターンを、被検査体に照射する例について説明した。しかしながら、上述した実施形態は等間隔の縞パターンを照射することに制限するものではない。そこで、第3の実施形態では、被検査体の形状に合わせて、縞パターンの間隔を変更する例について説明する。 (Third embodiment)
In the first and second embodiments, the example in which the inspected object is irradiated with the stripe pattern with the light and dark equally spaced has been described. However, the above-described embodiment is not limited to irradiating a stripe pattern with equal intervals. Therefore, in the third embodiment, an example in which the stripe pattern interval is changed in accordance with the shape of the object to be inspected will be described.
検査システムにおいては、検査対象となる被検査体の形状を制限するものではないため、被検査体の表面形状としては様々な形状が考えられる。そして、本実施形態の検査システムのPC100は、被検査体を撮影する際に、アーム140を制御して、被検査体の表面が適切に検査できるように被検査体の位置を設定する。その際に、PC100は、被検査体の表面に適した縞パターンを、照明装置120に対して、受け渡す。
In the inspection system, since the shape of the inspection object to be inspected is not limited, various shapes can be considered as the surface shape of the inspection object. And PC100 of the inspection system of this embodiment controls arm 140, and sets the position of a to-be-inspected object so that the surface of a to-be-inspected object can be inspected appropriately, when imaging a to-be-inspected object. At that time, the PC 100 delivers a fringe pattern suitable for the surface of the object to be inspected to the illumination device 120.
図25は、被検査体2501の表面形状に合わせた縞パターンを、スクリーン130から照射した例を示した図である。図25に示される例では、検査システムが被検査体2501の異常を検出するために、時間相関カメラ110に入力される縞パターンが等間隔であることが好ましい。このため、図25に示される例のように、被検査体2501を反射した後の縞パターンが等間隔になるように、照明装置120がスクリーン130に対して縞パターンを照射する。
FIG. 25 is a diagram showing an example in which a stripe pattern matching the surface shape of the inspection object 2501 is irradiated from the screen 130. In the example shown in FIG. 25, it is preferable that the fringe patterns input to the time correlation camera 110 are equally spaced in order for the inspection system to detect an abnormality of the inspection object 2501. For this reason, as in the example shown in FIG. 25, the illumination device 120 irradiates the screen 130 with the fringe pattern so that the fringe pattern after reflecting the object 2501 is equally spaced.
PC100の記憶部では、被検査体2501の撮影対象となる表面毎に、対応する(反射した後に等間隔となる)縞パターンを記憶しておく。当該縞パターンは、被検査体2501の検査対象となる表面の傾きに応じて設定された縞パターンとする。例えば、当該表面で反射した後、時間相関カメラ110に入力される際に縞の幅がほぼ均等になるような縞パターンとする。
The storage unit of the PC 100 stores a corresponding fringe pattern (equal intervals after reflection) for each surface to be imaged of the inspection object 2501. The stripe pattern is a stripe pattern set according to the inclination of the surface to be inspected of the inspection object 2501. For example, a stripe pattern is formed so that the widths of the stripes are substantially uniform when being input to the time correlation camera 110 after being reflected by the surface.
そして、PC100が、被検査体2501の撮影対象となる表面をアーム140で変更させる毎に、当該表面の傾きに応じて設定された縞パターンを照明装置120に出力する。そして、照明装置120が入力された縞パターンの照射を開始する。これにより、被検査体2501の表面形状に適した縞パターンの照射を実現できる。
Then, every time the PC 100 changes the surface to be imaged of the inspection object 2501 with the arm 140, the PC 100 outputs a fringe pattern set according to the inclination of the surface to the illumination device 120. And the illumination device 120 starts irradiation of the input fringe pattern. Thereby, the irradiation of the fringe pattern suitable for the surface shape of the inspection object 2501 can be realized.
次に、本実施形態の検査システムにおける被検査体の検査処理について説明する。図26は、本実施形態の検査システムにおける上述した処理の手順を示すフローチャートである。なお、被検査体150は、すでにアーム140に固定された状態で、検査の初期位置に配置されているものとする。
Next, the inspection process of the object to be inspected in the inspection system of this embodiment will be described. FIG. 26 is a flowchart showing a procedure of the above-described processing in the inspection system of the present embodiment. It is assumed that the device under test 150 is already fixed to the arm 140 and arranged at the initial position of the inspection.
本実施形態のPC100が、照明装置120に対して、アームの位置に応じた縞パターンを出力する(ステップS2601)。つまり、本実施形態では、アームの位置に対応づけられた縞パターンが、当該アームに固定された被検査体の撮影対象となる表面形状に適した縞パターンとなる。
The PC 100 of the present embodiment outputs a fringe pattern corresponding to the position of the arm to the illumination device 120 (step S2601). That is, in the present embodiment, the stripe pattern associated with the position of the arm is a stripe pattern suitable for the surface shape to be imaged of the object to be inspected fixed to the arm.
照明装置120は、PC100から入力された縞パターンを格納する(ステップS2621)。そして、照明装置120は、検査対象の初期位置に対応する縞パターンを、時間遷移に従って変化するように表示する(ステップS2622)。
The lighting device 120 stores the fringe pattern input from the PC 100 (step S2621). And the illuminating device 120 displays the fringe pattern corresponding to the initial position of a test object so that it may change according to a time transition (step S2622).
その後、図14で示したステップS1402~S1406、ステップS1411~S1413と同様の処理で、撮影から被検査体の異常検出結果の出力まで行われる(ステップS2602~S2606、ステップS2611~S2613)。
Thereafter, in the same processing as steps S1402 to S1406 and steps S1411 to S1413 shown in FIG. 14, the process from imaging to output of the abnormality detection result of the object to be inspected is performed (steps S2602 to S2606, steps S2611 to S2613).
その後、制御部103は、当該被検査体の検査が終了したか否かを判定する(ステップS2607)。検査が終了していないと判定した場合(ステップS2607:No)、アーム制御部101が、予め定められた設定に従って、次の検査対象となる被検査体の表面が、時間相関カメラ110で撮影できるように、アームの移動制御を行う(ステップS2608)。
Thereafter, the control unit 103 determines whether or not the inspection of the object to be inspected is completed (step S2607). When it is determined that the inspection is not completed (step S2607: No), the arm control unit 101 can capture the surface of the inspection object to be inspected next with the time correlation camera 110 according to a predetermined setting. In this manner, arm movement control is performed (step S2608).
ステップS2608のアームの移動制御が終了した後、制御部103が、再び、照明装置120に対して、アームの位置に応じた縞パターンを出力する(ステップS2601)。これにより、撮影対象となる表面が切り替わる毎に、出力する縞パターンを切り替えることができる。
After the arm movement control in step S2608 is completed, the control unit 103 again outputs a stripe pattern corresponding to the position of the arm to the illumination device 120 (step S2601). Thereby, whenever the surface used as imaging | photography object switches, the fringe pattern to output can be switched.
一方、制御部103は、当該被検査体の検査が終了したと判定した場合(ステップS2607:Yes)、終了指示を時間相関カメラ110に対して出力し(ステップS2609)、処理を終了する。
On the other hand, if the control unit 103 determines that the inspection of the object to be inspected has ended (step S2607: Yes), the control unit 103 outputs an end instruction to the time correlation camera 110 (step S2609), and ends the process.
そして、時間相関カメラ110は、終了指示を受け付けたか否かを判定する(ステップS2614)。終了指示を受け付けていない場合(ステップS2614:No)、再びステップS2611から処理を行う。一方、終了指示を受け付けた場合(ステップS2614:Yes)、処理を終了する。
Then, the time correlation camera 110 determines whether or not an end instruction has been received (step S2614). If an end instruction has not been received (step S2614: NO), the processing is performed again from step S2611. On the other hand, if an end instruction has been received (step S2614: YES), the process ends.
なお、照明装置120の終了処理は、検査者が行ってもよいし、他の構成からの指示に従って終了してもよい。
It should be noted that the termination process of the lighting device 120 may be performed by an inspector or may be terminated according to an instruction from another configuration.
(第4の実施形態)
上述した実施形態及び変形例では、照明装置120が直線状の縞パターンを表示する例について説明した。しかしながら、照明装置120が直線状の縞パターンを表示する場合に制限するものではなく、他の態様の縞パターンを表示してもよい。そこで、第4の実施形態では、上述した実施形態と異なる縞パターンを表示する例について説明する。 (Fourth embodiment)
In the embodiment and the modification described above, the example in which thelighting device 120 displays a linear stripe pattern has been described. However, the present invention is not limited to the case where the illumination device 120 displays a linear stripe pattern, and other forms of stripe patterns may be displayed. Therefore, in the fourth embodiment, an example in which a fringe pattern different from the above-described embodiment is displayed will be described.
上述した実施形態及び変形例では、照明装置120が直線状の縞パターンを表示する例について説明した。しかしながら、照明装置120が直線状の縞パターンを表示する場合に制限するものではなく、他の態様の縞パターンを表示してもよい。そこで、第4の実施形態では、上述した実施形態と異なる縞パターンを表示する例について説明する。 (Fourth embodiment)
In the embodiment and the modification described above, the example in which the
図27は、本実施形態の照明装置120がスクリーン130に表示する縞パターンの例を示した図である。図27に示される縞パターンでは、発生点2701,2702(沸き出し点)で発生した縞パターンが、収束点2703(吸い込み点)に収束していくように表示される。図27に示されるように、光の強度が所定の間隔で変化していれば、被検査体の異常(欠陥)を検出できる。次に縞パターンの生成手法について説明する。
FIG. 27 is a diagram showing an example of a stripe pattern displayed on the screen 130 by the illumination device 120 of the present embodiment. In the fringe pattern shown in FIG. 27, the fringe pattern generated at the occurrence points 2701 and 2702 (boiling points) is displayed so as to converge at the convergence point 2703 (suction point). As shown in FIG. 27, if the light intensity changes at a predetermined interval, an abnormality (defect) in the inspection object can be detected. Next, a method for generating a fringe pattern will be described.
図28は、図27の縞パターンを生成するための被検査体150またはスクリーン130の表面での初期の位相分布φ0(x,y)(空間位相分布)を明暗(濃淡)で表した例を示した図である。白い点(明るい点)の値がπ、黒い点(暗い点)の値が-πである。図28では、例えば、点2701での値をπ、点2702での値をπ/2、点2703(底点)での初値を-πとし、それらの点を拘束条件として、各点を頂点または底点とし各点からの距離に応じた例えば釣り鐘型の分布が生じるよう、初期の位相分布φ0(x,y)を設定する。
FIG. 28 is an example in which the initial phase distribution φ 0 (x, y) (spatial phase distribution) on the surface of the inspection object 150 or the screen 130 for generating the stripe pattern of FIG. FIG. The white point (light point) has a value of π, and the black point (dark point) has a value of −π. In FIG. 28, for example, the value at the point 2701 is π, the value at the point 2702 is π / 2, the initial value at the point 2703 (bottom point) is −π, and these points are set as constraints, and each point is a vertex. Alternatively, the initial phase distribution φ 0 (x, y) is set so that, for example, a bell-shaped distribution corresponding to the distance from each point is generated as a bottom point.
図28の位相分布φ0(x,y)に基づいて、図27の縞パターンを生成する。頂点と底点との間の縞の数は、波数kによって調整することができる。この例では、波数kは、頂点と底点との間の縞の本数である。波数kを加味した位相分布φ(x,y)は、φ(x,y)=k・φ0(x,y)となる。白黒の縞を形成する場合は、φ(x,y)の値によって二値化すればよい。具体的には、例えば、位相φ(x,y)が-πから0までの領域を暗領域、0からπまでの領域を明領域とすればよい。これにより、図27に示されるような静止した縞パターンが得られる。静止した縞パターンは、R[ejφ(x,y)]と表せる。ここにR[]は、複素数の実部をとる演算である。動く縞パターンは、変調項ejωtを乗算して、R[ejωt・ejφ(x,y)]と表せる。このように、動く縞パターンは、ejωt・ejφ(x,y)に基づいて生成することができる。ここで例示した位相分布φ(x,y)および縞パターンは、一例である。被検査体150の形状に応じた初期位相分布を適宜に設定することにより、任意の縞パターンを得ることができる。波数kは、検出する欠陥のサイズに応じて適切な値が設定されるものとする。
Based on the phase distribution φ 0 (x, y) in FIG. 28, the fringe pattern in FIG. 27 is generated. The number of stripes between the top and bottom can be adjusted by the wave number k. In this example, the wave number k is the number of stripes between the vertex and the bottom point. The phase distribution φ (x, y) in consideration of the wave number k is φ (x, y) = k · φ 0 (x, y). When black and white stripes are formed, binarization may be performed according to the value of φ (x, y). Specifically, for example, a region where the phase φ (x, y) is from −π to 0 may be a dark region, and a region from 0 to π may be a bright region. As a result, a stationary stripe pattern as shown in FIG. 27 is obtained. A stationary stripe pattern can be expressed as R [e jφ (x, y )]. Here, R [] is an operation that takes a real part of a complex number. The moving fringe pattern can be expressed as R [e jωt · e jφ (x, y) ] by multiplying the modulation term e jωt . Thus, the moving fringe pattern can be generated based on e jωt · e jφ (x, y) . The phase distribution φ (x, y) and the fringe pattern exemplified here are examples. An arbitrary stripe pattern can be obtained by appropriately setting the initial phase distribution according to the shape of the inspection object 150. It is assumed that the wave number k is set to an appropriate value according to the size of the defect to be detected.
図28に示す例では、被検査体の表面における任意の点を、光強度が強い点2801,2802、及び光強度が弱い点2803と設定した。しかしながら、位相分布を生成する際に、光強度が強い点と、光強度が弱い点と、被検査体の表面形状に応じて設定することも考えられる。
In the example shown in FIG. 28, arbitrary points on the surface of the object to be inspected are set as points 2801 and 2802 where the light intensity is high and a point 2803 where the light intensity is low. However, when generating the phase distribution, it may be set according to the point where the light intensity is strong, the point where the light intensity is weak, and the surface shape of the object to be inspected.
図29は、球面状の被検査体150上に投影された縞パターンであって、図25で示したように、時間相関カメラ110からの視線では移動する平行な縞となる縞パターンの例を示した図である。図29の例では、左右方向では左側ほど傾斜(勾配)が大きく、上下方向では中央よりも上側および下側に向かうほど傾斜(勾配)が大きい。本実施形態によれば、被検査体150の形状に応じた位相分布φ(x,y)を設定することにより、より適切な検査結果を得やすい縞パターンを得ることができる。CADデータに基づいて位相分布φ(x,y)を設定することもできる。なお、被検査体150の立体形状を考慮した位相分布φ(x,y)から、当該被検査体150の表面における縞パターンを設定し、当該表面における縞パターンを座標変換等することにより、スクリーン130等の照明部における縞パターンを算出することができる。
FIG. 29 shows an example of a fringe pattern projected onto the spherical object 150, and as shown in FIG. 25, the fringe pattern is a parallel fringe that moves in the line of sight from the time correlation camera 110. FIG. In the example of FIG. 29, the slope (gradient) is larger toward the left side in the left-right direction, and the slope (gradient) is greater toward the upper side and the lower side than the center in the vertical direction. According to the present embodiment, by setting the phase distribution φ (x, y) corresponding to the shape of the inspection object 150, it is possible to obtain a fringe pattern that facilitates obtaining a more appropriate inspection result. The phase distribution φ (x, y) can also be set based on CAD data. A screen is obtained by setting a fringe pattern on the surface of the object to be inspected 150 from the phase distribution φ (x, y) in consideration of the three-dimensional shape of the object to be inspected 150, and performing coordinate conversion on the fringe pattern on the surface. The fringe pattern in the illumination unit such as 130 can be calculated.
上述した実施形態のPC100で実行される検査プログラムは、インストール可能な形式又は実行可能な形式のファイルでCD-ROM、フレキシブルディスク(FD)、CD-R、DVD(Digital Versatile Disk)等のコンピュータで読み取り可能な記録媒体に記録されて提供される。
The inspection program executed by the PC 100 of the above-described embodiment is a file in an installable format or an executable format, and is a computer such as a CD-ROM, flexible disk (FD), CD-R, DVD (Digital Versatile Disk). It is recorded on a readable recording medium and provided.
また、上述した実施形態のPC100で実行される検査プログラムを、インターネット等のネットワークに接続されたコンピュータ上に格納し、ネットワーク経由でダウンロードさせることにより提供するように構成してもよい。また、上述した実施形態のPC100で実行される検査プログラムをインターネット等のネットワーク経由で提供または配布するように構成してもよい。
Further, the inspection program executed by the PC 100 of the above-described embodiment may be provided by being stored on a computer connected to a network such as the Internet and downloaded via the network. Further, the inspection program executed on the PC 100 according to the above-described embodiment may be provided or distributed via a network such as the Internet.
本発明のいくつかの実施形態を説明したが、これらの実施形態は、例として提示したものであり、発明の範囲を限定することは意図していない。これら新規な実施形態は、その他の様々な形態で実施されることが可能であり、発明の要旨を逸脱しない範囲で、種々の省略、置き換え、変更を行うことができる。これら実施形態やその変形は、発明の範囲や要旨に含まれるとともに、請求の範囲に記載された発明とその均等の範囲に含まれる。
Although several embodiments of the present invention have been described, these embodiments are presented as examples and are not intended to limit the scope of the invention. These novel embodiments can be implemented in various other forms, and various omissions, replacements, and changes can be made without departing from the scope of the invention. These embodiments and modifications thereof are included in the scope and gist of the invention, and are included in the invention described in the claims and the equivalents thereof.
Claims (11)
- 光の強度の縞パターンの空間的な移動により光の強度の周期的な時間変化を与える面的な照明部と、
時間相関カメラまたはそれと等価な動作をする撮像システムによって時間相関画像を生成する時間相関画像生成部と、
前記時間相関画像より、検査対象面の法線ベクトルの分布と対応した特徴であって、周囲との違いおよび参照表面との違いのうち少なくとも一方によって異常を検出する特徴を算出する、演算処理部と、
を備えた検査システム。 A planar illumination unit that gives periodic temporal changes in light intensity by spatial movement of the stripe pattern of light intensity;
A time correlation image generating unit that generates a time correlation image by a time correlation camera or an imaging system that performs an equivalent operation;
An arithmetic processing unit that calculates, from the time correlation image, a feature corresponding to the distribution of the normal vector on the surface to be inspected and detecting an abnormality by at least one of a difference from the surroundings and a difference from the reference surface When,
Inspection system equipped with. - 前記縞パターンが、
ejωt・ejφ(x,y) ・・・(1)
(ただし、e:指数関数、j:虚数、ω:時間的な角速度、t:時間、x,y:二次元座標、φ:x,y平面で連続的に変化する位相分布)
に基づき投影可能となるように設定された、請求項1に記載の検査システム。 The stripe pattern is
e jωt · e jφ (x, y) (1)
(Where e: exponential function, j: imaginary number, ω: temporal angular velocity, t: time, x, y: two-dimensional coordinates, φ: phase distribution continuously changing in the x, y plane)
The inspection system according to claim 1, wherein the inspection system is set so that projection is possible based on the above. - 前記縞パターンに含まれる縞の幅が、
p・w/λ>0.5 ・・・(2)
(ただし、w=1-2H(1+γ2)・fxx、p:時間相関カメラの撮像素子の幅、λ:縞の幅、H:被検査体と面的な照明部との距離、γ:tanθ0、θ0:被検査体の正面方向に対する撮像素子の方向の角度、fxx:f(x)の2階微分、f(x):表面の形状を示す関数、x:被検査体の代表面に沿った一方向)
を満たすよう設定された、請求項1または2に記載の検査システム。 The width of the stripes included in the stripe pattern is
p · w / λ> 0.5 (2)
(Where w = 1−2H (1 + γ 2 ) · f xx , p: width of the image sensor of the time correlation camera, λ: width of the stripe, H: distance between the object to be inspected and the planar illumination unit, γ: tan θ 0 , θ 0 : angle of the direction of the image sensor with respect to the front direction of the object to be inspected, f xx : second derivative of f (x), f (x): function indicating the shape of the surface, x: function of the object to be inspected (One direction along the representative surface)
The inspection system according to claim 1, wherein the inspection system is set to satisfy the following. - 前記縞パターンが、欠陥の長手方向と交差する方向に移動するよう設定された、請求項1または2に記載の検査システム。 The inspection system according to claim 1 or 2, wherein the fringe pattern is set to move in a direction intersecting with the longitudinal direction of the defect.
- 前記縞パターンに含まれる縞の幅が、検査対象面の傾きに応じて設定された、請求項1~4のうちいずれか一つに記載の検査システム。 The inspection system according to any one of claims 1 to 4, wherein a width of a stripe included in the stripe pattern is set according to an inclination of a surface to be inspected.
- 前記照明部は、一つの検査対象面について幅が異なる複数の縞パターンを出力する、請求項1~5のうちいずれか一つに記載の検査システム。 6. The inspection system according to claim 1, wherein the illumination unit outputs a plurality of stripe patterns having different widths for one inspection target surface.
- 前記照明部は、幅が異なる複数の縞を有する縞パターンを出力する、請求項1~6のうちいずれか一つに記載の検査システム。 The inspection system according to any one of claims 1 to 6, wherein the illumination unit outputs a stripe pattern having a plurality of stripes having different widths.
- 前記縞パターンは、幅が異なる同一方向に延びた複数の縞を有する、請求項7に記載の検査システム。 The inspection system according to claim 7, wherein the stripe pattern has a plurality of stripes extending in the same direction and having different widths.
- 前記縞パターンは、幅が異なる交差する方向に延びた複数の縞を有する、請求項7に記載の検査システム。 The inspection system according to claim 7, wherein the stripe pattern has a plurality of stripes extending in crossing directions having different widths.
- 前記照明部は、一つの検査対象面に対して、異なる方向に延びた複数の縞パターンを出力する、請求項1~5のうちいずれか一つに記載の検査システム。 6. The inspection system according to claim 1, wherein the illumination unit outputs a plurality of stripe patterns extending in different directions with respect to one inspection target surface.
- 光の強度の縞パターンの空間的な移動により光の強度の周期的な時間変化を与える面的な照明で照らされた被検査体について、時間相関カメラまたはそれと等価な動作をする撮像システムによって時間相関画像を生成し、
前記時間相関画像より、検査対象面の法線ベクトルの分布と対応した特徴であって、周囲との違いおよび参照表面との違いのうち少なくとも一方によって異常を検出する特徴を算出する、
検査方法。 For an object illuminated by a planar illumination that gives a periodic temporal change in light intensity due to spatial movement of the light intensity fringe pattern, the time is correlated with a time-correlated camera or an imaging system that operates equivalently. Generate correlation images,
From the time correlation image, a feature corresponding to the distribution of the normal vector of the surface to be inspected, and calculating a feature for detecting an abnormality by at least one of a difference from the surroundings and a difference from the reference surface,
Inspection method.
Priority Applications (3)
| Application Number | Priority Date | Filing Date | Title |
|---|---|---|---|
| US15/129,273 US10724960B2 (en) | 2014-03-31 | 2015-03-31 | Inspection system and inspection method |
| CN201580017619.6A CN106164653B (en) | 2014-03-31 | 2015-03-31 | Inspection system and inspection method |
| DE112015001561.2T DE112015001561T5 (en) | 2014-03-31 | 2015-03-31 | Test system and test method |
Applications Claiming Priority (2)
| Application Number | Priority Date | Filing Date | Title |
|---|---|---|---|
| JP2014-074880 | 2014-03-31 | ||
| JP2014074880A JP6316068B2 (en) | 2014-03-31 | 2014-03-31 | Inspection system and inspection method |
Publications (1)
| Publication Number | Publication Date |
|---|---|
| WO2015152307A1 true WO2015152307A1 (en) | 2015-10-08 |
Family
ID=54240625
Family Applications (1)
| Application Number | Title | Priority Date | Filing Date |
|---|---|---|---|
| PCT/JP2015/060277 WO2015152307A1 (en) | 2014-03-31 | 2015-03-31 | Inspection system and inspection method |
Country Status (5)
| Country | Link |
|---|---|
| US (1) | US10724960B2 (en) |
| JP (1) | JP6316068B2 (en) |
| CN (1) | CN106164653B (en) |
| DE (1) | DE112015001561T5 (en) |
| WO (1) | WO2015152307A1 (en) |
Cited By (1)
| Publication number | Priority date | Publication date | Assignee | Title |
|---|---|---|---|---|
| US20200011810A1 (en) * | 2017-03-03 | 2020-01-09 | Ricoh Elemex Corporation | Inspection system and inspection method |
Families Citing this family (23)
| Publication number | Priority date | Publication date | Assignee | Title |
|---|---|---|---|---|
| JP6316068B2 (en) | 2014-03-31 | 2018-04-25 | 国立大学法人 東京大学 | Inspection system and inspection method |
| JP6433268B2 (en) * | 2014-03-31 | 2018-12-05 | 国立大学法人 東京大学 | Inspection system and inspection method |
| JP6424020B2 (en) * | 2014-06-09 | 2018-11-14 | 株式会社キーエンス | Image inspection apparatus, image inspection method, image inspection program, computer-readable recording medium, and recorded apparatus |
| JP6682251B2 (en) * | 2015-11-30 | 2020-04-15 | リコーエレメックス株式会社 | Inspection system and inspection method |
| JP2017101979A (en) * | 2015-11-30 | 2017-06-08 | リコーエレメックス株式会社 | Inspection system |
| WO2017168711A1 (en) * | 2016-03-31 | 2017-10-05 | 株式会社ニコン | Imaging element, imaging system, and imaging method |
| JP6677060B2 (en) | 2016-04-21 | 2020-04-08 | アイシン精機株式会社 | Inspection device, storage medium, and program |
| JP2018009849A (en) * | 2016-07-12 | 2018-01-18 | リコーエレメックス株式会社 | Inspection system and inspection method |
| CN106706664A (en) | 2016-12-28 | 2017-05-24 | 武汉华星光电技术有限公司 | Detection method, detection system and detection device for flexible substrate |
| JP2018112470A (en) * | 2017-01-11 | 2018-07-19 | リコーエレメックス株式会社 | Inspection system and inspection method |
| JP6945106B2 (en) * | 2017-07-11 | 2021-10-06 | 高知県公立大学法人 | Inspection system |
| JP2019061484A (en) * | 2017-09-26 | 2019-04-18 | キヤノン株式会社 | Image processing device and control method thereof and program |
| JP6867932B2 (en) * | 2017-11-14 | 2021-05-12 | 株式会社豊田中央研究所 | Surface inspection equipment |
| JP2019105458A (en) * | 2017-12-08 | 2019-06-27 | 株式会社日立ハイテクファインシステムズ | Defect inspection device and defect inspection method |
| DE102018202559A1 (en) * | 2018-02-20 | 2019-08-22 | Fraunhofer-Gesellschaft zur Förderung der angewandten Forschung e.V. | DEVICES AND METHODS FOR VIBRATION ANALYSIS |
| JP2019178941A (en) * | 2018-03-30 | 2019-10-17 | リコーエレメックス株式会社 | Inspection system and inspection method |
| JP7131118B2 (en) * | 2018-06-22 | 2022-09-06 | 富士通株式会社 | Authentication device, authentication program, authentication method |
| JP6482710B1 (en) * | 2018-09-06 | 2019-03-13 | 五洋商事株式会社 | Appearance inspection apparatus and inspection system |
| CN109521028B (en) * | 2018-12-04 | 2021-06-25 | 燕山大学 | Method for detecting macroscopic defects inside metal three-dimensional multilayer lattice structure |
| JP7242418B2 (en) * | 2019-05-15 | 2023-03-20 | 興和株式会社 | SURFACE INSPECTION METHOD AND ITS DEVICE |
| CN110243831B (en) * | 2019-06-06 | 2022-02-15 | 锐捷网络股份有限公司 | Surface defect acquisition system, surface defect detection method, surface defect detection device and storage medium |
| JPWO2021065349A1 (en) * | 2019-10-02 | 2021-04-08 | ||
| CN110736751B (en) * | 2019-11-06 | 2022-04-19 | 合肥御微半导体技术有限公司 | Surface defect detection method and device |
Citations (4)
| Publication number | Priority date | Publication date | Assignee | Title |
|---|---|---|---|---|
| JP2000127353A (en) * | 1998-10-27 | 2000-05-09 | Dainippon Screen Mfg Co Ltd | Plate deviation detector and printer therewith |
| JP2007305061A (en) * | 2006-05-15 | 2007-11-22 | Univ Of Tokyo | Moving object information acquisition device and image acquisition device |
| JP2013239934A (en) * | 2012-05-16 | 2013-11-28 | Univ Of Tokyo | Time correlation calculation system and time correlation camera |
| JP2014002125A (en) * | 2012-06-21 | 2014-01-09 | Fujitsu Ltd | Inspection method and inspection device |
Family Cites Families (21)
| Publication number | Priority date | Publication date | Assignee | Title |
|---|---|---|---|---|
| JP2002107309A (en) | 2000-09-28 | 2002-04-10 | Toshiba Corp | Defect inspecting apparatus and method |
| JP4633245B2 (en) | 2000-11-06 | 2011-02-16 | 住友化学株式会社 | Surface inspection apparatus and surface inspection method |
| US7164810B2 (en) * | 2001-11-21 | 2007-01-16 | Metrologic Instruments, Inc. | Planar light illumination and linear imaging (PLILIM) device with image-based velocity detection and aspect ratio compensation |
| JP2002323454A (en) * | 2001-04-26 | 2002-11-08 | Asahi Glass Co Ltd | Method and apparatus for inspecting defects in specimen |
| JP4235046B2 (en) | 2003-07-08 | 2009-03-04 | 新日本製鐵株式会社 | Steel plate surface inspection method, system, image processing apparatus, and computer program |
| JP4140619B2 (en) | 2005-06-14 | 2008-08-27 | 松下電器産業株式会社 | Image composition apparatus, image collation apparatus using the same, and image composition method |
| US7612502B2 (en) * | 2006-06-01 | 2009-11-03 | Chunghwa Picture Tubes, Ltd. | Planar light source |
| TWI449898B (en) * | 2007-02-28 | 2014-08-21 | 尼康股份有限公司 | Observation device, inspection device and inspection method |
| US8629981B2 (en) * | 2008-02-01 | 2014-01-14 | Palo Alto Research Center Incorporated | Analyzers with time variation based on color-coded spatial modulation |
| WO2009149103A1 (en) | 2008-06-03 | 2009-12-10 | Jeong Hwan J | Interferometric defect detection and classification |
| JP5560628B2 (en) | 2009-09-04 | 2014-07-30 | ソニー株式会社 | Inspection apparatus and inspection method |
| JP4685971B2 (en) * | 2009-09-24 | 2011-05-18 | 株式会社ケー・デー・イー | Inspection system and inspection method |
| JP5333143B2 (en) | 2009-10-13 | 2013-11-06 | 新日鐵住金株式会社 | Shape measuring apparatus, shape measuring method and program |
| CN102564302A (en) * | 2010-12-10 | 2012-07-11 | 通用电气公司 | Measuring system and method |
| JP5895733B2 (en) | 2012-06-22 | 2016-03-30 | 富士通株式会社 | Surface defect inspection apparatus and surface defect inspection method |
| WO2014013985A1 (en) * | 2012-07-17 | 2014-01-23 | 日産自動車株式会社 | Driving assistance system and driving assistance method |
| JP5958779B2 (en) * | 2012-10-12 | 2016-08-02 | 株式会社ニコン | Microscope and observation method |
| US20140103929A1 (en) | 2012-10-13 | 2014-04-17 | Chunlei Liu | Systems and methods for susceptibility tensor imaging in the p-space |
| CN103487441B (en) | 2013-09-24 | 2015-09-30 | 电子科技大学 | A kind of method for silicon wafer defects detection and surface shape measurement |
| JP6433268B2 (en) * | 2014-03-31 | 2018-12-05 | 国立大学法人 東京大学 | Inspection system and inspection method |
| JP6316068B2 (en) | 2014-03-31 | 2018-04-25 | 国立大学法人 東京大学 | Inspection system and inspection method |
-
2014
- 2014-03-31 JP JP2014074880A patent/JP6316068B2/en not_active Expired - Fee Related
-
2015
- 2015-03-31 DE DE112015001561.2T patent/DE112015001561T5/en not_active Withdrawn
- 2015-03-31 US US15/129,273 patent/US10724960B2/en active Active
- 2015-03-31 CN CN201580017619.6A patent/CN106164653B/en not_active Expired - Fee Related
- 2015-03-31 WO PCT/JP2015/060277 patent/WO2015152307A1/en active Application Filing
Patent Citations (4)
| Publication number | Priority date | Publication date | Assignee | Title |
|---|---|---|---|---|
| JP2000127353A (en) * | 1998-10-27 | 2000-05-09 | Dainippon Screen Mfg Co Ltd | Plate deviation detector and printer therewith |
| JP2007305061A (en) * | 2006-05-15 | 2007-11-22 | Univ Of Tokyo | Moving object information acquisition device and image acquisition device |
| JP2013239934A (en) * | 2012-05-16 | 2013-11-28 | Univ Of Tokyo | Time correlation calculation system and time correlation camera |
| JP2014002125A (en) * | 2012-06-21 | 2014-01-09 | Fujitsu Ltd | Inspection method and inspection device |
Cited By (2)
| Publication number | Priority date | Publication date | Assignee | Title |
|---|---|---|---|---|
| US20200011810A1 (en) * | 2017-03-03 | 2020-01-09 | Ricoh Elemex Corporation | Inspection system and inspection method |
| US10775316B2 (en) * | 2017-03-03 | 2020-09-15 | Ricoh Elemex Corporation | Inspection system and inspection method |
Also Published As
| Publication number | Publication date |
|---|---|
| CN106164653A (en) | 2016-11-23 |
| CN106164653B (en) | 2019-10-29 |
| US20170115230A1 (en) | 2017-04-27 |
| JP2015197345A (en) | 2015-11-09 |
| JP6316068B2 (en) | 2018-04-25 |
| US10724960B2 (en) | 2020-07-28 |
| DE112015001561T5 (en) | 2017-02-23 |
Similar Documents
| Publication | Publication Date | Title |
|---|---|---|
| JP6316068B2 (en) | Inspection system and inspection method | |
| JP6433268B2 (en) | Inspection system and inspection method | |
| JP6542586B2 (en) | Inspection system | |
| JP6553412B2 (en) | Inspection system | |
| WO2018159825A1 (en) | Inspection system and inspection method | |
| JP6682251B2 (en) | Inspection system and inspection method | |
| JP6276092B2 (en) | Inspection system and inspection method | |
| JP6529248B2 (en) | Inspection system and flexible lighting device | |
| JP6420131B2 (en) | Inspection system and inspection method | |
| JP2018028527A (en) | Inspection system | |
| JP2017101979A (en) | Inspection system | |
| JP6909378B2 (en) | Inspection system | |
| JP6703415B2 (en) | Inspection device and inspection method | |
| JP6902684B2 (en) | Image processing equipment and inspection system | |
| JP6781430B2 (en) | Inspection system | |
| JP2018116026A (en) | Illumination device and light-transmissive member | |
| JP6909377B2 (en) | Inspection system and inspection method | |
| JP6826813B2 (en) | Inspection equipment and inspection method | |
| JP6529247B2 (en) | Calibration system and inspection system | |
| JP2018205039A (en) | Image processing device and inspection system | |
| JP2024017231A (en) | Inspection system and method | |
| JP2020012816A (en) | Detection system and detection method | |
| JP2019002873A (en) | Inspection system and inspection method | |
| JP2024017225A (en) | Inspection system and method | |
| JP2024017229A (en) | Inspection system and method |
Legal Events
| Date | Code | Title | Description |
|---|---|---|---|
| 121 | Ep: the epo has been informed by wipo that ep was designated in this application |
Ref document number: 15773701 Country of ref document: EP Kind code of ref document: A1 |
|
| WWE | Wipo information: entry into national phase |
Ref document number: 15129273 Country of ref document: US |
|
| WWE | Wipo information: entry into national phase |
Ref document number: 112015001561 Country of ref document: DE |
|
| 122 | Ep: pct application non-entry in european phase |
Ref document number: 15773701 Country of ref document: EP Kind code of ref document: A1 |