WO2015141302A1 - 画像処理装置、画像処理方法、及び画像処理プログラム - Google Patents
画像処理装置、画像処理方法、及び画像処理プログラム Download PDFInfo
- Publication number
- WO2015141302A1 WO2015141302A1 PCT/JP2015/052870 JP2015052870W WO2015141302A1 WO 2015141302 A1 WO2015141302 A1 WO 2015141302A1 JP 2015052870 W JP2015052870 W JP 2015052870W WO 2015141302 A1 WO2015141302 A1 WO 2015141302A1
- Authority
- WO
- WIPO (PCT)
- Prior art keywords
- abnormal
- image
- attention
- region
- images
- Prior art date
- Legal status (The legal status is an assumption and is not a legal conclusion. Google has not performed a legal analysis and makes no representation as to the accuracy of the status listed.)
- Ceased
Links
Images










Classifications
-
- G—PHYSICS
- G06—COMPUTING OR CALCULATING; COUNTING
- G06T—IMAGE DATA PROCESSING OR GENERATION, IN GENERAL
- G06T7/00—Image analysis
- G06T7/0002—Inspection of images, e.g. flaw detection
- G06T7/0012—Biomedical image inspection
-
- A—HUMAN NECESSITIES
- A61—MEDICAL OR VETERINARY SCIENCE; HYGIENE
- A61B—DIAGNOSIS; SURGERY; IDENTIFICATION
- A61B1/00—Instruments for performing medical examinations of the interior of cavities or tubes of the body by visual or photographical inspection, e.g. endoscopes; Illuminating arrangements therefor
- A61B1/00002—Operational features of endoscopes
- A61B1/00004—Operational features of endoscopes characterised by electronic signal processing
- A61B1/00009—Operational features of endoscopes characterised by electronic signal processing of image signals during a use of endoscope
- A61B1/000094—Operational features of endoscopes characterised by electronic signal processing of image signals during a use of endoscope extracting biological structures
-
- A—HUMAN NECESSITIES
- A61—MEDICAL OR VETERINARY SCIENCE; HYGIENE
- A61B—DIAGNOSIS; SURGERY; IDENTIFICATION
- A61B1/00—Instruments for performing medical examinations of the interior of cavities or tubes of the body by visual or photographical inspection, e.g. endoscopes; Illuminating arrangements therefor
- A61B1/00002—Operational features of endoscopes
- A61B1/00043—Operational features of endoscopes provided with output arrangements
- A61B1/00045—Display arrangement
- A61B1/0005—Display arrangement combining images e.g. side-by-side, superimposed or tiled
-
- A—HUMAN NECESSITIES
- A61—MEDICAL OR VETERINARY SCIENCE; HYGIENE
- A61B—DIAGNOSIS; SURGERY; IDENTIFICATION
- A61B1/00—Instruments for performing medical examinations of the interior of cavities or tubes of the body by visual or photographical inspection, e.g. endoscopes; Illuminating arrangements therefor
- A61B1/04—Instruments for performing medical examinations of the interior of cavities or tubes of the body by visual or photographical inspection, e.g. endoscopes; Illuminating arrangements therefor combined with photographic or television appliances
- A61B1/041—Capsule endoscopes for imaging
-
- A—HUMAN NECESSITIES
- A61—MEDICAL OR VETERINARY SCIENCE; HYGIENE
- A61B—DIAGNOSIS; SURGERY; IDENTIFICATION
- A61B5/00—Measuring for diagnostic purposes; Identification of persons
- A61B5/02—Detecting, measuring or recording for evaluating the cardiovascular system, e.g. pulse, heart rate, blood pressure or blood flow
- A61B5/02042—Determining blood loss or bleeding, e.g. during a surgical procedure
-
- A—HUMAN NECESSITIES
- A61—MEDICAL OR VETERINARY SCIENCE; HYGIENE
- A61B—DIAGNOSIS; SURGERY; IDENTIFICATION
- A61B5/00—Measuring for diagnostic purposes; Identification of persons
- A61B5/42—Detecting, measuring or recording for evaluating the gastrointestinal, the endocrine or the exocrine systems
- A61B5/4216—Diagnosing or evaluating gastrointestinal ulcers
-
- A—HUMAN NECESSITIES
- A61—MEDICAL OR VETERINARY SCIENCE; HYGIENE
- A61B—DIAGNOSIS; SURGERY; IDENTIFICATION
- A61B5/00—Measuring for diagnostic purposes; Identification of persons
- A61B5/42—Detecting, measuring or recording for evaluating the gastrointestinal, the endocrine or the exocrine systems
- A61B5/4222—Evaluating particular parts, e.g. particular organs
- A61B5/4255—Intestines, colon or appendix
-
- G—PHYSICS
- G06—COMPUTING OR CALCULATING; COUNTING
- G06T—IMAGE DATA PROCESSING OR GENERATION, IN GENERAL
- G06T7/00—Image analysis
- G06T7/0002—Inspection of images, e.g. flaw detection
- G06T7/0012—Biomedical image inspection
- G06T7/0014—Biomedical image inspection using an image reference approach
- G06T7/0016—Biomedical image inspection using an image reference approach involving temporal comparison
-
- G—PHYSICS
- G06—COMPUTING OR CALCULATING; COUNTING
- G06T—IMAGE DATA PROCESSING OR GENERATION, IN GENERAL
- G06T7/00—Image analysis
- G06T7/70—Determining position or orientation of objects or cameras
- G06T7/73—Determining position or orientation of objects or cameras using feature-based methods
-
- G—PHYSICS
- G06—COMPUTING OR CALCULATING; COUNTING
- G06T—IMAGE DATA PROCESSING OR GENERATION, IN GENERAL
- G06T7/00—Image analysis
- G06T7/90—Determination of colour characteristics
-
- A—HUMAN NECESSITIES
- A61—MEDICAL OR VETERINARY SCIENCE; HYGIENE
- A61B—DIAGNOSIS; SURGERY; IDENTIFICATION
- A61B2576/00—Medical imaging apparatus involving image processing or analysis
- A61B2576/02—Medical imaging apparatus involving image processing or analysis specially adapted for a particular organ or body part
-
- A—HUMAN NECESSITIES
- A61—MEDICAL OR VETERINARY SCIENCE; HYGIENE
- A61B—DIAGNOSIS; SURGERY; IDENTIFICATION
- A61B5/00—Measuring for diagnostic purposes; Identification of persons
- A61B5/42—Detecting, measuring or recording for evaluating the gastrointestinal, the endocrine or the exocrine systems
- A61B5/4222—Evaluating particular parts, e.g. particular organs
- A61B5/4233—Evaluating particular parts, e.g. particular organs oesophagus
-
- A—HUMAN NECESSITIES
- A61—MEDICAL OR VETERINARY SCIENCE; HYGIENE
- A61B—DIAGNOSIS; SURGERY; IDENTIFICATION
- A61B5/00—Measuring for diagnostic purposes; Identification of persons
- A61B5/42—Detecting, measuring or recording for evaluating the gastrointestinal, the endocrine or the exocrine systems
- A61B5/4222—Evaluating particular parts, e.g. particular organs
- A61B5/4238—Evaluating particular parts, e.g. particular organs stomach
-
- G—PHYSICS
- G06—COMPUTING OR CALCULATING; COUNTING
- G06T—IMAGE DATA PROCESSING OR GENERATION, IN GENERAL
- G06T2207/00—Indexing scheme for image analysis or image enhancement
- G06T2207/10—Image acquisition modality
- G06T2207/10016—Video; Image sequence
-
- G—PHYSICS
- G06—COMPUTING OR CALCULATING; COUNTING
- G06T—IMAGE DATA PROCESSING OR GENERATION, IN GENERAL
- G06T2207/00—Indexing scheme for image analysis or image enhancement
- G06T2207/10—Image acquisition modality
- G06T2207/10024—Color image
-
- G—PHYSICS
- G06—COMPUTING OR CALCULATING; COUNTING
- G06T—IMAGE DATA PROCESSING OR GENERATION, IN GENERAL
- G06T2207/00—Indexing scheme for image analysis or image enhancement
- G06T2207/10—Image acquisition modality
- G06T2207/10068—Endoscopic image
-
- G—PHYSICS
- G06—COMPUTING OR CALCULATING; COUNTING
- G06T—IMAGE DATA PROCESSING OR GENERATION, IN GENERAL
- G06T2207/00—Indexing scheme for image analysis or image enhancement
- G06T2207/30—Subject of image; Context of image processing
- G06T2207/30004—Biomedical image processing
- G06T2207/30101—Blood vessel; Artery; Vein; Vascular
-
- G—PHYSICS
- G16—INFORMATION AND COMMUNICATION TECHNOLOGY [ICT] SPECIALLY ADAPTED FOR SPECIFIC APPLICATION FIELDS
- G16H—HEALTHCARE INFORMATICS, i.e. INFORMATION AND COMMUNICATION TECHNOLOGY [ICT] SPECIALLY ADAPTED FOR THE HANDLING OR PROCESSING OF MEDICAL OR HEALTHCARE DATA
- G16H30/00—ICT specially adapted for the handling or processing of medical images
- G16H30/40—ICT specially adapted for the handling or processing of medical images for processing medical images, e.g. editing
Definitions
- the present invention relates to an image processing apparatus, an image processing method, and an image processing program for extracting a representative image from an image group acquired by imaging the inside of a lumen of a living body.
- an intraluminal image group acquired by imaging the lumen of a living body in chronological order using a medical observation device such as an endoscope or a capsule endoscope.
- a medical observation device such as an endoscope or a capsule endoscope.
- a technique for extracting an image in which a region of interest such as an abnormal region is captured as a representative image is known.
- the user can reduce the burden of observing a large amount of images in detail by observing the representative images extracted from the image group, and can perform an accurate and efficient diagnosis.
- Patent Document 1 attention areas are detected from a group of intraluminal images acquired in time series, and attentions that are adjacent in time series and have similar feature quantities are based on the detected feature quantities of the attention areas.
- the regions are classified as the same group, and from the attention regions classified into each group, the representative region of the group is selected based on the average value of the feature amount, and an image including the selected representative region is used as the representative image.
- An image processing apparatus for outputting is disclosed.
- the same region of interest is captured between adjacent intraluminal images in time series.
- the position, shape, and color of the region of interest may change greatly, or the same region of interest may disappear from the field of view or reappear.
- an abnormality that does not have a specific shape, such as floating bleeding is set as the attention area, the shape of the attention area often changes frequently.
- Patent Document 1 When the technique disclosed in Patent Document 1 is applied to such an intraluminal image group, attention areas whose positions, shapes, and colors greatly change are determined as different attention areas, and are classified into different groups. May end up. As a result, there is a possibility that images of interest in which the same region of interest is captured are continuously extracted as representative images.
- the present invention has been made in view of the above, and in the case where a representative image is extracted from a series of image groups acquired by imaging the inside of a lumen of a living body in chronological order, the same region of interest is It is an object of the present invention to provide an image processing apparatus, an image processing method, and an image processing program that can prevent a captured attention image from being continuously extracted as a representative image.
- an image processing apparatus is a region estimated as a detection target from a series of image groups acquired by sequentially imaging the inside of a lumen of a living body.
- Detecting means for detecting an attention image including an attention area and a global similarity calculation means for calculating a global similarity that is a similarity between areas including at least a region other than the attention area between different attention images;
- attention image group extraction means Based on the comparison between the global similarity or the discrimination parameter based on the global similarity and a threshold, attention image group extraction means for extracting the attention image group including the same attention area, and representative images are extracted from the attention image group And representative image extraction means.
- An image processing method is an image processing to be executed by a calculation unit included in a computer based on image data of a series of image groups acquired by sequentially imaging the inside of a lumen of a living body and recorded in a recording unit.
- a detection step of detecting an attention image including a region of interest from the series of images and a global similarity that is a similarity between at least regions other than the region of interest between different attention images is calculated.
- a global similarity calculation step and based on a comparison between the global similarity or a discrimination parameter based on the global similarity and a threshold value, an attention image group extraction step for extracting an attention image group including the same attention area;
- An image processing program includes at least the detection step for detecting a target image including a target region from a series of image groups acquired by sequentially capturing the inside of a lumen of a living body, and a different target image. Based on a comparison between a global similarity calculation step for calculating a global similarity that is a similarity between regions including a region other than the region of interest, and a threshold value and a determination parameter based on the global similarity or the global similarity An attention image group extraction step for extracting an attention image group including a region of interest and a representative image extraction step for extracting a representative image from the attention image group are executed by a computer.
- the attention image group is extracted based on the global similarity between the attention images. Therefore, the abnormal image in which the same abnormal region is reflected is used as the representative image. It is possible to suppress continuous extraction.
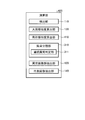
- FIG. 1 is a block diagram showing a configuration of an image processing apparatus according to Embodiment 1 of the present invention.
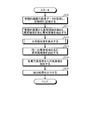
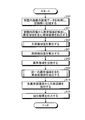
- FIG. 2 is a flowchart showing the operation of the image processing apparatus shown in FIG.
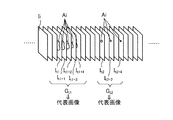
- FIG. 3 is a schematic diagram showing a series of intraluminal images acquired in chronological order.
- FIG. 4 is a flowchart showing a global similarity calculation process executed by the global similarity calculation unit shown in FIG.
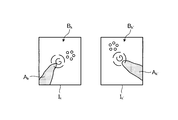
- FIG. 5 is a schematic diagram for explaining the global similarity calculation processing executed by the global similarity calculation unit shown in FIG.
- FIG. 6 is a schematic diagram for explaining the global similarity calculation process in Modification 1-1 of Embodiment 1 of the present invention.
- FIG. 7 is a block diagram illustrating a configuration of a calculation unit included in the image processing apparatus according to Embodiment 2 of the present invention.
- FIG. 8 is a flowchart showing the operation of the image processing apparatus according to the second embodiment of the present invention.
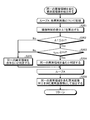
- FIG. 9 is a flowchart showing an abnormal image group extraction process executed by the abnormal image group extraction unit shown in FIG.
- FIG. 10 is a schematic diagram for explaining the abnormal image group extraction processing executed by the abnormal image group extraction unit shown in FIG.
- FIG. 11 is a block diagram illustrating a configuration of a calculation unit included in the image processing apparatus according to the second modification of the second embodiment of the present invention.
- FIG. 12 is a flowchart showing representative image extraction processing executed by the representative image extraction unit shown in FIG. FIG.
- FIG. 13 is a block diagram illustrating a configuration of a calculation unit included in the image processing apparatus according to Embodiment 3 of the present invention.
- FIG. 14 is a flowchart showing the operation of the image processing apparatus according to the third embodiment of the present invention.
- FIG. 15 is a flowchart showing an abnormal image group extraction process executed by the abnormal image group extraction unit shown in FIG.
- FIG. 16 is a block diagram illustrating another configuration example of the abnormality classification unit illustrated in FIG. 13.
- FIG. 17 is a block diagram illustrating still another configuration example of the abnormality classification unit illustrated in FIG. 13.
- FIG. 18 is a block diagram showing a configuration of a calculation unit provided in the image processing apparatus according to Embodiment 4 of the present invention.
- FIG. 19 is a flowchart showing the operation of the image processing apparatus according to the fourth embodiment of the present invention.
- FIG. 20 is a flowchart showing the abnormal image group extraction processing executed by the abnormal image group extraction unit shown in FIG.
- FIG. 21 is a block diagram illustrating a configuration of a calculation unit included in the image processing apparatus according to the fifth embodiment of the present invention.
- FIG. 22 is a flowchart showing the operation of the image processing apparatus according to the fifth embodiment of the present invention.
- FIG. 23 is a flowchart showing an abnormal image group extraction process executed by the abnormal image group extraction unit shown in FIG.
- FIG. 24 is a flowchart showing the abnormal image group extraction processing in Modification 5-3 of Embodiment 5 of the present invention.
- FIG. 1 is a block diagram showing an image processing apparatus according to Embodiment 1 of the present invention.
- the image processing apparatus 1 according to the first embodiment is detected as a detection target from a series of images acquired by sequentially imaging the inside of a lumen of a living body as a subject with a medical observation apparatus such as a capsule endoscope.
- This is an apparatus for extracting an image (attention image) group including an estimated attention area, and further extracting a representative image from the extracted attention image group.
- An image of a living body's lumen (also referred to as an intraluminal image) usually has pixel levels (pixel values) for wavelength components of R (red), G (green), and B (blue) at each pixel position. This is a color image.
- abnormal region such as bleeding, redness, after, or ulcer
- a representative image is extracted from a group of attention images (abnormal images) including these abnormal regions.
- the region is not limited to the abnormal region exemplified above.
- the image processing apparatus 1 corresponds to an intraluminal image captured by a control unit 10 that controls the operation of the entire image processing apparatus 1 and a medical observation apparatus such as a capsule endoscope.
- a control unit 10 that controls the operation of the entire image processing apparatus 1 and a medical observation apparatus such as a capsule endoscope.
- the control unit 10 is realized by hardware such as a CPU, and by reading various programs recorded in the recording unit 50, according to image data input from the image acquisition unit 20, signals input from the input unit 30, and the like. Instructions to each unit constituting the image processing apparatus 1 and data transfer are performed, and the overall operation of the image processing apparatus 1 is comprehensively controlled.
- the image acquisition unit 20 is appropriately configured according to the mode of the system including the capsule endoscope that images the inside of the subject.
- the image acquisition unit 20 detachably mounts the recording medium and records image data of the recorded image. It is comprised with the reader apparatus which reads.
- the image acquisition unit 20 includes a communication device connected to the server and performs data communication with the server. To obtain image data.
- the input unit 30 is realized by input devices such as a keyboard, a mouse, a touch panel, and various switches, for example, and outputs an input signal generated in response to an external operation on these input devices to the control unit 10.
- the display unit 40 is realized by a display device such as an LCD or an EL display, and displays various screens including intraluminal images under the control of the control unit 10.
- the recording unit 50 is realized by various IC memories such as ROM and RAM such as flash memory that can be updated and recorded, a hard disk built in or connected by a data communication terminal, or an information recording device such as a CD-ROM and its reading device.
- ROM and RAM such as flash memory that can be updated and recorded
- a hard disk built in or connected by a data communication terminal or an information recording device such as a CD-ROM and its reading device.
- the recording unit 50 operates the image processing apparatus 1 and causes the image processing apparatus 1 to execute various functions. Stores data used during execution. Specifically, the recording unit 50 detects abnormal regions such as bleeding, redness, after, and ulcer from the intraluminal image, and an abnormal image including the same abnormal region from an image including these abnormal regions (abnormal image).
- the image processing program 51 for causing the image processing apparatus 1 to execute image processing for extracting a group and extracting a representative image from each abnormal image group, a discrimination criterion used when detecting an abnormal region, and a representative image are extracted.
- the discriminant reference used at the time is stored.
- the calculation unit 100 is realized by hardware such as a CPU, and by reading the image processing program 51, extracts an abnormal image group including the same abnormal region from the intraluminal image, and extracts a representative image from each abnormal image group. Perform image processing.
- the calculation unit 100 detects a global similarity that is an overall similarity between different abnormal images from a detection unit 110 that detects an abnormal image including an abnormal region from a series of intraluminal image groups.
- a global similarity calculation unit 120 to calculate, an abnormal image group extraction unit 130 to extract an abnormal image group including the same abnormal region from the abnormal images detected by the detection unit 110 based on the global similarity, and each extracted
- a representative image extraction unit 140 that extracts a representative image from the abnormal image group.
- the detection unit 110 detects an abnormal region based on various feature amounts of the intraluminal image.
- an abnormal region is detected based on a color feature amount (color information) of an intraluminal image.
- abnormal areas such as bleeding, redness, and vascular abnormalities show a specific color in red
- abnormal areas such as ulcers and after show a specific color in white. Therefore, the detection unit 110 has each color component (R component, G component, B component) of the pixel value, and a value that is secondarily calculated by known conversion based on these color components (for example, calculated by YCbCr conversion).
- a region showing a specific color in the intraluminal image is detected using color feature values such as color difference, hue calculated by HSI conversion, saturation, G / R, B / G color ratio, etc.) Is an abnormal region. More specifically, based on the color feature values of various abnormal areas collected in advance, an abnormal area discrimination reference (color range) is created in advance and recorded in the recording unit 50. Then, when detecting an abnormal region from the intraluminal image, the discrimination criterion is read from the recording unit 50, the color feature amount is calculated for each pixel constituting the intraluminal image, and the color feature amount of each pixel is calculated. An abnormal region is detected from the intraluminal image by comparison with the discrimination criterion.
- color feature values such as color difference, hue calculated by HSI conversion, saturation, G / R, B / G color ratio, etc.
- the detection method of the abnormal region is not limited to the detection method described above, and various known methods can be applied as long as the abnormal region can be detected. For example, a method based on a feature space distance with a representative color feature amount may be used. Further, in the above description, the abnormal region is detected using the color feature amount in units of pixels constituting the intraluminal image, but the intraluminal image is divided into small regions based on edge information in the image, etc. An abnormal region may be detected using a color feature amount in units of small regions. Furthermore, an abnormal region may be detected using a shape feature amount other than a color feature amount or a texture feature amount.
- the global similarity calculation unit 120 calculates, as the global similarity, the similarity between regions including at least regions other than the abnormal region, that is, regions including the background of the abnormal region, between different abnormal images.
- the abnormal image group extraction unit 130 extracts, as one abnormal image group, images including the same abnormal region among the abnormal regions detected by the detection unit 110 based on the global similarity calculated by the global similarity calculation unit 120. Attention image group extraction means.
- the representative image extraction unit 140 extracts a representative image from each of the abnormal image groups including the same abnormal region.
- the method for extracting the representative image is not particularly limited, and the first image or the center image in the time series of the abnormal image group may be extracted as the representative image, or an abnormal region having high importance in image diagnosis is included.
- An abnormal image or an abnormal image with high visibility of the abnormal region may be extracted as a representative image.
- the importance and visibility of the abnormal region can be determined based on, for example, the color feature amount, shape feature amount, texture feature amount, and the like of the abnormal region.
- FIG. 2 is a flowchart showing the operation of the image processing apparatus 1.
- the image processing apparatus 1 acquires image data of a series of intraluminal images captured in chronological order via the image acquisition unit 20 and records them in the recording unit 50.
- the detection unit 110 sequentially reads the image data of the intraluminal image recorded in the recording unit 50, detects an abnormal region from each intraluminal image, and extracts an abnormal image including the abnormal region. . Specifically, the detection unit 110 reads out the abnormal region discrimination criterion recorded in advance in the recording unit 50, and compares the color feature amount of each pixel constituting each intraluminal image with this discrimination criterion. Detect abnormal areas.
- FIG. 3 is a schematic diagram showing a series of intraluminal images I i acquired in chronological order.
- the intraluminal image I i comprising abnormal region A i and abnormal image I i, the time-series image sequence consisting of only abnormal images I i arranged along the (imaging sequence), also an abnormal image sequence .
- the global similarity calculation unit 120 calculates the global similarity between adjacent abnormal images in the abnormal image sequence for each abnormal image extracted in step S11. For example, in the case of FIG. 3, abnormal images I t1 and I t1 + 1 , abnormal images I t1 + 1 and I t1 + 2 , abnormal images I t1 + 2 and I t1 + 3 , as adjacent abnormal images in the abnormal image sequence, Global similarity in each combination of abnormal images I t1 + 3 and I t1 + 4 , abnormal images I t1 + 4 and I t2 , abnormal images I t2 and I t2 + 2 , abnormal images I t2 + 2 and I t2 + 4 Is calculated.
- FIG. 4 is a flowchart showing a global similarity calculation process executed by the global similarity calculation unit 120 in step S12.
- FIG. 5 is a schematic diagram for explaining the global similarity calculation process.
- abnormal regions A k and A k ′ are detected from abnormal images I k and I k ′ (k and k ′ are natural numbers k ⁇ k ′) adjacent to each other in the abnormal image sequence.
- the global similarity calculation unit 120 uses, as the background area, the areas other than the abnormal areas A k and A k ′ , that is, non-abnormal areas from the abnormal images I k and I k ′.
- B k and B k ′ are extracted, respectively.
- global similarity calculation unit 120 calculates the background region, i.e. non-abnormal region B k, 'feature quantity c k of, c k' B k respectively.
- feature quantities c k and c k ′ statistics such as the average value or median value of the pixel values (luminance values and G component values) of the pixels constituting the non-abnormal areas B k and B k ′ , non-abnormal areas
- Color feature values of pixels constituting B k and B k ′ color difference calculated by YCbCr conversion using each value of R component, G component, and B component, hue, saturation, G / R calculated by HSI conversion) , B / G color ratio, etc.
- average value or median statistic non-abnormal region B k , B k ′ shape feature amount (area, circularity, etc.), non-abnormal region B k , B k
- a statistical value such as an average value or a median value of
- the global similarity calculation unit 120 calculates the global similarity s global given by the following equation (1) using the maximum value c max and the change amount ⁇ c of the feature amount.
- s global (c max ⁇ c) / c max (1)
- the maximum value c max of the feature amount of the feature amount is the maximum value that the feature amounts c k and c k ′ can take.
- the maximum value c max is 256.
- the maximum value c max is 1.
- the abnormal image group extraction unit 130 includes an abnormal image group including the same abnormal region based on the global similarity s global calculated in step S12 from the abnormal image extracted in step S11. To extract. Specifically, the abnormal image group extraction unit 130 determines abnormal images having a global similarity s global that is equal to or greater than a predetermined threshold as abnormal images including the same abnormal region. Conversely, abnormal images having a global similarity s global less than a predetermined threshold are determined as abnormal images that do not include the same abnormal region. Then, the abnormal image group extraction unit 130 extracts abnormal images including the same abnormal area as one abnormal image group.
- these abnormal images I t1 , I t1 + 1 , It1 + 2 , It1 + 3 , and It1 + 4 are one abnormal image group. Extracted as G t1 .
- the abnormal image It2 is not extracted as the same abnormal image group as the abnormal image It1 + 4 .
- abnormal images I t2 and I t2 + 2 and the abnormal images I t2 + 2 and I t2 + 4 respectively include the same abnormal region
- these abnormal images I t2 , I t2 + 2 , I t2 + 4 is extracted as one abnormal image group G t2 .
- the representative image extraction unit 140 extracts a representative image from each abnormal image group extracted in step S13.
- the number of representative images to be extracted may be a constant (for example, one from each abnormal image group) or may be determined according to the number of abnormal images included in the abnormal image group (for example, abnormal ⁇ times the number of images, 0 ⁇ ⁇ 1). In the latter case, when the number of representative images is less than one, at least one representative image is extracted.
- all abnormal images satisfying a predetermined criterion for example, abnormal images having a color feature amount equal to or larger than a predetermined threshold
- a predetermined criterion for example, abnormal images having a color feature amount equal to or larger than a predetermined threshold
- the method for extracting the representative image is not particularly limited.
- the top image or the center image in the time series order of each abnormal image group may be extracted as the representative image.
- an abnormal image with a strong red color of the abnormal region is preferentially extracted as a representative image
- an abnormal image with strong white color is preferentially extracted as a representative image.
- an abnormal image having a large area of the abnormal region or an abnormal image whose abnormal region is close to the center may be preferentially extracted as a representative image.
- step S15 the calculation unit 100 outputs information representing the representative image extracted from each abnormal image group in step S14 as a representative image extraction result.
- the recording unit 50 adds information (flag) indicating that the image is the representative image to the image data of the intraluminal image extracted as the representative image.
- the abnormal image group is extracted based on the global similarity between the regions including the background region in the abnormal image.
- the position, shape and color of the abnormal area greatly changed between the abnormal images, or the abnormal area was temporarily out of the field of view and the abnormal images were separated in time series,
- These abnormal images can be extracted as the same abnormal image group. Therefore, it is possible to suppress the abnormal images in which the same abnormal region is captured from being continuously extracted as the representative image. Therefore, by observing the representative image in which the number of extracted images is suppressed while covering all detected abnormalities, the user can perform an accurate and efficient diagnosis.
- the background area extracted from each abnormal image when calculating the global similarity may not be the entire non-abnormal area.
- an area (mucosal area) where the mucous membrane appears in the abnormal image may be extracted as a background area, and the global similarity between the mucosal areas may be calculated.
- the mucous membrane region can be extracted using a discrimination criterion created in advance.
- the discrimination criteria are color feature values of non-mucosal areas such as bleeding, residue, bubbles, halation, dark areas, etc. (values of R component, G component, B component of pixel values, values of these color components) Secondarily calculated based on known conversion (color difference calculated by YCbCr conversion, hue, saturation, color ratio of G / R, B / G, etc.
- FIG. 6 is a schematic diagram for explaining the global similarity calculation process (see step S12 in FIG. 2 and FIG. 4) in Modification 1-1.
- the global similarity calculation unit 120 reads out the discrimination criterion for discriminating the mucous membrane region from the recording unit 50, and compares the feature amount calculated for each pixel constituting the abnormal image with the discrimination criterion.
- the mucous membrane region is extracted.
- abnormal regions A k and A k ′ such as bleeding and unnecessary regions C k and C k ′ such as bubbles are detected.
- the mucosal regions D k and D k ′ excluding are extracted.
- the global similarity calculation unit 120 calculates the feature values c k and c k ′ using the mucosa regions D k and D k ′ as background regions (see step S102), and the maximum value c max and the change amount ⁇ c of the feature values. Is used to calculate the global similarity s global given by equation (1) (see steps S103 and S104).
- the global similarity between the mucous membrane regions between the abnormal images is calculated, so that it occurs locally like bleeding, residue, foam, halation, and dark part. It is possible to extract an abnormal image group including the same abnormal region while suppressing the influence caused by the phenomenon.
- the global similarity may be calculated based on the feature amount of the area including the abnormal area as well as the background area. Specifically, the global similarity may be calculated based on the feature amount of the entire abnormal image including the abnormal region and the non-abnormal region. Alternatively, the global similarity may be calculated from the entire abnormal image using the feature amount of a region excluding unnecessary regions (regions other than the detection target in diagnosis) such as residues, bubbles, halation, and dark parts. In any case, the global similarity may be calculated for regions including at least non-abnormal regions.
- Modification 1-3 of Embodiment 1 of the present invention will be described.
- the global similarity between abnormal images may be determined based on the type of organ shown in the abnormal image.
- a method for determining the global similarity based on the type of organ will be described.
- the type of organ shown in each abnormal image is determined.
- the type of organ can be determined using various known methods. In the following, as an example, a method disclosed in Japanese Patent Application Laid-Open No. 2006-288612 will be described.
- a numerical range of R, G, and B color components (color elements) in an image showing each organ (esophagus, stomach, small intestine, and large intestine) in the lumen is determined in advance.
- an average value of each of the R component, G component, and B component values of each pixel constituting the abnormal image is calculated, and compared with a predetermined numerical range of the color component of each organ.
- the organ shown in the abnormal image is the esophagus.
- the average value for each color component calculated for the abnormal image is within the numerical range of the stomach color component determined in advance
- the organ shown in the abnormal image is the stomach and within the numerical range of the color component of the small intestine If so, the organ shown in the abnormal image is the small intestine, and if it is within the numerical range of the color component of the large intestine, the organ shown in the abnormal image is determined as the large intestine.
- the global similarity calculation unit 120 determines the global similarity based on the organ type determined for each abnormal image. Specifically, if the types of organs are the same between adjacent abnormal images in the abnormal image sequence, the similarity is determined to be 1.0. On the other hand, when the types of organs are different between adjacent abnormal images in the abnormal image sequence, the similarity is determined to be 0.0.
- the type of organ may be determined by the user. Specifically, an average color of each of a series of intraluminal images is calculated by image processing in the calculation unit 100, and a color bar in which these average colors are arranged in the arrangement order of the intraluminal images (time-series order). Is generated and displayed on the display unit 40. An average color transition (boundary) on the color bar corresponds to an organ boundary in a series of intraluminal images. Therefore, when a signal for selecting a specific point on the color bar is input from the input unit 30 to the control unit 10 in response to a user operation on the input unit 30, the control unit 10 stores the lumen in the lumen corresponding to the point. The image number of the image is input to the calculation unit 100.
- the calculation unit 100 identifies the type of organ shown in each intraluminal image using the intraluminal image corresponding to the input image number as the boundary of the organ.
- the global similarity calculation unit 120 determines the global similarity based on the organ type of the intraluminal image in which the abnormal region is detected.
- Modification 1-4 of Embodiment 2 of the present invention will be described.
- the calculation unit 100 may perform organ type determination processing on the entire series of intraluminal images after acquiring the image data in step S10. Note that the organ type discriminating method is the same as in Modification 1-3, and automatic discrimination may be performed, or the user may discriminate manually.
- the calculation unit 100 performs the above-described processing of steps S11 to S14 (see FIG. 2) on the intraluminal image showing the organ to be examined (for example, the small intestine).
- the calculation unit 100 extracts an abnormal image by detecting an abnormal region for an intraluminal image in which an organ (for example, the esophagus, stomach, and large intestine) that is not the subject of examination is shown, and then, for example, A predetermined number of abnormal images (for example, a small number such as 10) are extracted in the order of increasing redness or increasing whiteness of the abnormal region, and output as a representative image.
- the intensity of redness can be expressed by the color ratio G / R, and the smaller the color ratio G / R, the stronger the redness.
- the intensity of white can be represented by the color ratios G / R and B / G, and the greater the color ratios G / R and B / G, the stronger the whiteness.
- the calculation unit 100 does not detect an abnormal region with respect to an intraluminal image in which an organ that is not the subject of examination is captured, and based on the color feature amount (color ratio and the like described above) of each intraluminal image.
- a predetermined number for example, a small number such as 10
- the calculation unit 100 does not have to extract a representative image from an intraluminal image in which an organ not to be examined is shown.
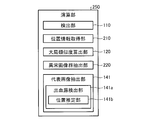
- FIG. 7 is a block diagram illustrating a configuration of a calculation unit included in the image processing apparatus according to Embodiment 2 of the present invention.
- the image processing apparatus according to the second embodiment includes a calculation unit 200 illustrated in FIG. 7 instead of the calculation unit 100 illustrated in FIG.
- the configuration and operation of each unit other than the calculation unit 200 are the same as those in the first embodiment.
- the calculation unit 200 includes a detection unit 110, a position information acquisition unit 210, a global similarity calculation unit 120, an abnormal image group extraction unit 220, and a representative image extraction unit 140. Among these, the operations of the detection unit 110, the global similarity calculation unit 120, and the representative image extraction unit 140 are the same as those in the first embodiment.
- the position information acquisition unit 210 includes time series arrangement order (imaging order) of each abnormal image I i in a series of intraluminal images (see FIG. 3), an image number representing the arrangement order, or each abnormal image I i. Is acquired as time-series position information of the abnormal image I i .
- the imaging position of the intraluminal image (abnormal image) I i is estimated to be a position advanced by a distance i ⁇ v / F (mm) from the imaging start position (for example, in the oral cavity) of a series of intraluminal images. be able to. Also, the position of the capsule endoscope can be estimated in the same manner using the imaging time. Therefore, the arrangement order of the intraluminal images, the image number, and the imaging time can be handled as position information of the abnormal image I i .
- the abnormal image group extraction unit 220 extracts an abnormal image group including the same abnormal region based on the position information acquired by the position information acquisition unit 210 and the global similarity calculated by the global similarity calculation unit 120.
- FIG. 8 is a flowchart showing the operation of the image processing apparatus according to the second embodiment. Note that steps S10 and S11 shown in FIG. 8 are the same as those in the first embodiment (see FIG. 2).
- step S21 following step S11 the position information acquisition unit 210 acquires time-series position information of the abnormal image extracted in step S11. Specifically, the imaging time or arrangement order i of the abnormal image I i is acquired as position information.
- the global similarity calculation unit 120 calculates the global similarity between adjacent abnormal images in the abnormal image sequence.
- the method for calculating the global similarity is the same as that in the first embodiment (see FIGS. 4 and 5).
- the global similarity may be calculated in the same manner as in Modifications 1-1 to 1-3.
- the abnormal image group extraction unit 220 extracts an abnormal image group including the same abnormal region based on the positional information acquired in step S21 and the global similarity calculated in step S22.
- FIG. 9 is a flowchart showing the abnormal image group extraction processing executed by the abnormal image group extraction unit 220 in step S23.
- FIG. 10 is a schematic diagram for explaining the abnormal image group extraction processing.
- the abnormal image group extraction unit 220 executes the process of loop A for each abnormal image extracted in step S11.
- the abnormal image group extraction unit 220 sets an abnormal image I k ′ (k ′ is a natural number of k ⁇ k ′) adjacent to the abnormal image I k (k is a natural number) to be processed in the abnormal image sequence.
- the difference ⁇ T ( T (I k ′ ) ⁇ T (I k )) between the imaging times T (I k ) and T (I k ′ ) between the two images, ie, the elapsed time is calculated.
- the abnormal image group extraction unit 220 determines whether or not the imaging time difference ⁇ T calculated in step S201 is equal to or smaller than a predetermined threshold th1.
- the abnormal image group extraction unit 220 determines that the global similarity s global between the abnormal images I k and I k ′ is a predetermined threshold. It is determined whether or not it is greater than or equal to th2 (step S203).
- the abnormal image group extraction unit 220 determines that the abnormal image I k to be processed and the abnormal image I k ′ extracted next are the same abnormality. It is determined that the area is included (step S204).
- step S202 when the difference ⁇ T in imaging time is larger than the threshold th1 in step S202 (step S202: No), or when the global similarity s global is smaller than the threshold th2 in step S203 (step S203: No).
- the abnormal image group extraction unit 220 determines that the abnormal image I k to be processed and the abnormal image I k ′ extracted next do not include the same abnormal region (step S205). For example, in the case of FIG. 10, the difference ⁇ T3 the imaging time of the abnormal image I t1 + 4 abnormal image I t2 is is greater than the threshold value th1, is determined not to contain the same abnormal region.
- step S206 the abnormal image group extraction unit 220 extracts the abnormal images determined as having the same abnormal area as the same abnormal image group. Thereafter, the operation of the image processing apparatus returns to the main routine.
- step S201 a difference in the arrangement order i of the abnormal images I i may be calculated instead of the imaging time.
- step S202 it is determined whether or not the arrangement order difference is equal to or less than a predetermined threshold value.
- Steps S14 and S15 following step S22 are the same as those in the first embodiment (see FIG. 2).
- an abnormal image group including the same abnormal region is extracted based on time-series positional information and global similarity of abnormal images. Therefore, it is possible to prevent abnormal images that are significantly separated from each other from being extracted as the same abnormal image group.
- FIG. 11 is a block diagram illustrating a configuration of a calculation unit included in the image processing apparatus according to the second modification.
- the calculation unit 250 in the second modification includes a representative image extraction unit 141 instead of the representative image extraction unit 140 included in the calculation unit 200 (see FIG. 7) in the second embodiment.
- the configuration and operation of each unit of the calculation unit 250 other than the representative image extraction unit 141 are the same as those in the second embodiment.
- the representative image extraction unit 141 preferentially extracts, as a representative image, an abnormal image showing a bleeding source as an abnormal region having a high degree of importance from each of abnormal image groups including the same abnormal region. More specifically, the representative image extraction unit 141 includes a bleeding source detection unit 141a that detects a bleeding source from an abnormal image group in which an abnormal region of bleeding is reflected. The bleeding source detection unit 141a includes a position estimation unit 141b that estimates the position of the subject (organ) captured in the abnormal image in the lumen, that is, the imaging position of the abnormal image in the lumen.
- FIG. 12 is a flowchart showing representative image extraction processing executed by the representative image extraction unit 141 in step S14 shown in FIG.
- the representative image extraction unit 141 executes the process of loop B for each abnormal image group extracted in step S23.
- the number of representative images extracted from each abnormal image group is n.
- the representative image extraction unit 141 determines whether or not the same abnormal area included in the abnormal image group to be processed is bleeding. Specifically, in step S11 (see Embodiment 1), an abnormal region detected as indicating a specific color of red tone is determined as bleeding. Alternatively, whether or not the abnormal region is bleeding may be determined based on the color feature amount, shape feature amount, or texture feature amount of the abnormal region.
- the position estimation unit 141b uses the time-series position information (abnormal image capturing time or arrangement order) acquired by the position information acquisition unit 210 in step S21. Based on the acquired position information, the imaging position in the lumen of each abnormal image included in the abnormal image group is estimated (step S212).
- the bleeding source detection unit 141a detects a bleeding source image (an abnormal image in which the bleeding source is reflected). Specifically, from an abnormal image including an abnormal region with strong redness in the abnormal image group, an abnormal image whose imaging position in the lumen is the most upstream (in other words, the oldest abnormal image in time series) is bleeding. Detect as source image.
- the abnormal region with strong redness can be determined as a region where the value of the color ratio G / R is equal to or less than a predetermined threshold, for example.
- the threshold value of the color ratio G / R used at this time may be set to be stricter (smaller value) than the discrimination standard (color ratio G / R) used when detecting the abnormal area in step S11.
- step S214 the representative image extraction unit 141 extracts one bleeding source image detected in step S213 as a representative image.
- the representative image extraction unit 141 extracts the representative image by the number n minus 1 of the representative images extracted from the abnormal images (excluding the bleeding source image) including the abnormal region having a strong redness in the abnormal image group. Are extracted at random.
- step S216 the representative image extraction unit 141 determines whether n representative images have been extracted.
- the number of abnormal images including a strong reddish abnormal region is n or more, n representative images can be extracted from these abnormal images in total. In this case (step S216: Yes), the process proceeds to step S219.
- step S216 the representative image extraction unit 141 randomly extracts representative images from the remaining abnormal images that do not include a strong reddish abnormal region until the total number becomes n (step S217). Thereafter, the process proceeds to step S219.
- step S211 when the same abnormal region in the abnormal image group to be processed is not bleeding (step S211: No), the representative image extraction unit 141 performs n sheets from the abnormal image group in the same manner as in the first embodiment. The representative image is extracted (step S218). Thereafter, the process proceeds to step S219.
- step S219 the representative image extraction unit 141 adds information (flag) indicating that it is a representative image to the image data of the extracted n representative images.
- step S23 After executing loop B processing for all abnormal image groups extracted in step S23 (see FIG. 8), the operation of the image processing apparatus returns to the main routine.
- the bleeding source having a high importance in diagnosis is preferentially used as the representative image. Can be extracted.
- FIG. 13 is a block diagram illustrating a configuration of a calculation unit included in the image processing apparatus according to Embodiment 3 of the present invention.
- the image processing apparatus according to the third embodiment includes a calculation unit 300 illustrated in FIG. 13 instead of the calculation unit 100 illustrated in FIG.
- the configuration and operation of each unit other than the calculation unit 300 are the same as those in the first embodiment.
- the calculation unit 300 includes a detection unit 110, a position information acquisition unit 210, a global similarity calculation unit 120, an abnormality classification unit 310, an abnormal image group extraction unit 320, and a representative image extraction unit 140.
- the operations of the detection unit 110, the global similarity calculation unit 120, and the representative image extraction unit 140 are the same as those in the first embodiment.
- the operation of the position information acquisition unit 210 is the same as that in the second embodiment.
- the abnormality classification unit 310 is an attention area classification unit that classifies an abnormal area as an attention area according to the type of subject in the abnormal area.
- the abnormality classification unit 310 includes a continuous abnormality determination unit (continuity determination unit) 311 that determines whether or not an abnormal region is an abnormal region that continuously occurs in a series of intraluminal images.
- the continuous abnormality determination unit 311 determines that the abnormal region is an abnormal region that continuously occurs when the subject in the abnormal region has an abnormality such as floating bleeding or blood vessel abnormality.
- the types of abnormalities can be determined using a discrimination criterion created in advance.
- Discrimination criteria are known based on color feature values of abnormal regions such as floating bleeding and vascular abnormalities shown in the intraluminal image (the R component, G component, and B component values of the pixel values, and the values of these color components) Secondarily calculated values (color difference calculated by YCbCr conversion, hue, saturation, color ratio of G / R, B / G, etc.
- HSI conversion calculates shape feature values
- HOG shape feature values
- LBP feature distribution of texture features
- SVM support vector machine
- the abnormal image group extraction unit 320 uses the same abnormal region based on the position information acquired by the position information acquisition unit 210, the global similarity calculated by the global similarity calculation unit 120, and the classification result by the abnormality classification unit 310. An abnormal image group including is extracted.
- FIG. 14 is a flowchart showing the operation of the image processing apparatus according to the third embodiment. Note that steps S10 and S11 shown in FIG. 14 are the same as those in the first embodiment (see FIG. 2).
- step S31 following step S11 the position information acquisition unit 210 acquires time-series position information of the abnormal image extracted in step S11. Specifically, the arrangement order i or imaging time of the abnormal image I i is acquired as position information.
- the global similarity calculation unit 120 calculates the global similarity between adjacent abnormal images in the abnormal image sequence.
- the method for calculating the global similarity is the same as that in the first embodiment (see FIGS. 4 and 5).
- the global similarity may be calculated in the same manner as in Modifications 1-1 to 1-3.
- the abnormality classification unit 310 classifies each abnormal region detected in step 11. Specifically, the continuous abnormality determination unit 311 reads out a determination criterion for determining a continuously occurring abnormal region from the recording unit 50, and compares the feature amount calculated for the abnormal region to be processed with the determination criterion. Thus, the type of the subject in the abnormal area is determined, and it is determined whether or not the abnormal area is an abnormal area that continuously occurs according to the type of the subject. Specifically, if the subject in the abnormal region is a bleeding or blood vessel abnormality that floats, it is determined that the abnormal region is an abnormal region that occurs continuously.
- the abnormal image group extraction unit 320 uses the positional information acquired in step S31 and the global similarity calculated in step S32 based on the classification result in step S33, and includes an abnormality including the same abnormal region. Extract an image group.
- FIG. 15 is a flowchart showing the abnormal image group extraction processing executed by the abnormal image group extraction unit 320 in step S34.
- the abnormal image group extraction unit 320 executes the process of loop C for each abnormal image extracted in step S11.
- step S301 the abnormal image group extraction section 320, an abnormal image I j to be processed (j is a natural number), the abnormal image I j + n (n adjacent in the abnormal image sequence with respect to the abnormal image I j Is a natural number) to calculate a parameter s pos representing the proximity of the position.
- the parameter s pos is given by the following equation (2).
- s pos (N ⁇ n) / N (2)
- the value of the parameter s pos increases as the position of the subject captured in the abnormal images I j and I j + n in the lumen is closer (the smaller n is).
- step S31 when the imaging time of the abnormal image I i is acquired as the position information, the imaging time difference is substituted for the arrangement order difference n in Equation (2), and the parameter N is used instead.
- a parameter for normalizing the difference in imaging time By using a parameter for normalizing the difference in imaging time, a parameter representing the proximity of the position is calculated.
- the abnormal image group extracting unit 320 sets the global similarity s global and the position s pos representing the position proximity based on the classification result of the abnormal area in the abnormal image to be processed (see step S33), respectively.
- the weights w 1 and w 2 are determined so that the weight w 2 is relatively larger than the weight w 1 if the abnormal area in the abnormal image I j is an abnormal area continuously generated.
- the abnormal region in the abnormal image I j is not a continuous abnormal area generated, the weight w 1 with respect to the weight w 2 is a weight w 1 to be relatively large, w 2 are determined.
- the abnormal image group extraction unit 320 uses the weights w 1 and w 2 determined in step S302 to perform total discrimination in consideration of the global similarity s global and the parameter s pos indicating the position proximity.
- the parameter s total1 is calculated.
- the abnormal image group extraction unit 320 determines whether or not the total discrimination parameter s total1 is equal to or greater than a predetermined threshold th3.
- the total discrimination parameter s total1 is equal to or greater than the threshold th3 (step S304: Yes)
- the abnormal image group extraction unit 320 determines that the abnormal image I j to be processed and the abnormal image I j + n extracted next are the same. It is determined that the abnormal region is included (step S305).
- the total discrimination parameter s total is smaller than the threshold th3 (step S304: No)
- the abnormal image group extraction unit 320 outputs the abnormal image I j to be processed and the abnormal image I j + n extracted next. Are not included in the same abnormal area (step S306).
- step S307 the abnormal image group extraction unit 320 extracts the abnormal images determined as having the same abnormal area as the same abnormal image group. Thereafter, the operation of the image processing apparatus returns to the main routine.
- Steps S14 and S15 following step S34 are the same as those in the first embodiment (see FIG. 2).
- Embodiment 3 of the present invention when an abnormal image group including the same abnormal region is extracted based on time-series position information and global similarity of the abnormal image, the abnormal image is extracted. Since the weight of the global similarity and the position information is changed depending on whether or not the abnormal region in FIG. Is a continuously occurring abnormal region, it is possible to improve the extraction accuracy of an abnormal image group including the same abnormal region. It becomes possible.
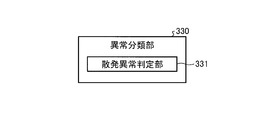
- FIG. 16 is a block diagram illustrating another configuration example of the abnormality classification unit 310 illustrated in FIG. 13.
- an abnormality classification unit 330 illustrated in FIG. 16 may be provided instead of the abnormality classification unit 310.
- the abnormality classification unit 330 includes a sporadic abnormality determination unit (sporadicity determination unit) 331 that determines whether the abnormal region is an abnormal region that occurs sporadically in a series of intraluminal images. If the subject in the abnormal region is abnormal such as redness, bleeding point, after, or ulcer, the sporadic abnormality determining unit 331 determines that the abnormal region is an abnormal region that occurs sporadically.
- the types of abnormalities such as redness, bleeding points, after, and ulcers can be determined using a discrimination criterion created in advance.
- the discrimination criteria are based on the color feature values of abnormal regions such as redness, bleeding points, after, and ulcers (values of R component, G component, and B component of the pixel value, and the values of these color components that appear in the intraluminal image. 2ndly calculated values by known conversion (color difference calculated by YCbCr conversion, hue, saturation, color ratio of G / R, B / G, etc.
- HSI conversion calculates shape feature amount ( Created by a learning device such as a support vector machine (SVM) based on the feature amount distribution of HOG, area, perimeter length, ferret diameter, etc.) and texture feature amount (LBP, simultaneous normal matrix, etc.) Record 50.
- SVM support vector machine
- the abnormality classification unit 330 classifies each abnormal region detected in step S11. Specifically, the sporadic abnormality determination unit 331 reads out a determination criterion for determining a sporadic abnormal region from the recording unit 50, and compares the feature amount calculated for the abnormal region to be processed with the determination criterion. Thus, the type of the subject in the abnormal area is determined, and whether or not the abnormal area is a sporadic abnormal area is determined according to the type of the subject.
- step S34 shown in FIG. 14 the abnormal image group extraction unit 320 calculates the position information acquired in step S31 and the global similarity calculated in step S32 based on the classification result by the abnormality classification unit 330. And extracting an abnormal image group including the same abnormal region.
- the abnormal image group extraction unit 320 sets the global similarity s global and the position s pos representing the position proximity based on the abnormal region classification result by the abnormality classification unit 330, respectively.
- the given weights w 1 and w 2 are determined.
- the weights w 1 and w 2 are determined so that the weight w 1 is relatively larger than the weight w 2 if the abnormal area in the abnormal image I j is an abnormal area that occurs sporadically.
- the weight w 1 as the weight w 2 is relatively large, w 2 are determined for the weights w 1.
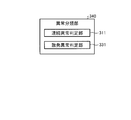
- FIG. 17 is a block diagram showing still another configuration example of the abnormality classification unit 310 shown in FIG.
- an abnormality classification unit 340 illustrated in FIG. 17 may be provided instead of the abnormality classification unit 310.
- the abnormality classification unit 340 includes a continuous abnormality determination unit 311 and a sporadic abnormality determination unit 331.
- the operation of continuous abnormality determination unit 311 is the same as that of Embodiment 3, and the operation of sporadic abnormality determination unit 331 is the same as that of Modification 3-1.
- the abnormality classification unit 340 classifies each abnormal region detected in step S11. Specifically, the continuous abnormality determination unit 311 determines whether or not the abnormal region to be processed is an abnormal region that continuously occurs in a series of intraluminal image groups. Further, the sporadic abnormality determination unit 331 determines whether or not the abnormal region to be processed is an abnormal region that occurs sporadically in a series of intraluminal image groups. As a result, the abnormal area is classified into a continuous abnormal area, a sporadic abnormal area, and other abnormal areas.
- step S34 shown in FIG. 14 the abnormal image group extraction unit 320 calculates the position information acquired in step S31 and the global similarity calculated in step S32 based on the classification result by the abnormality classification unit 340. And extracting an abnormal image group including the same abnormal region.
- the abnormal image group extraction unit 320 based on the classification result by the abnormality classification unit 340, weights respectively given to the global similarity s global and the parameter s pos representing the position proximity. Determine w 1 and w 2 .
- the weights w 1 and w 2 are determined so that the weight w 2 is relatively larger than the weight w 1 if the abnormal area in the abnormal image I j is an abnormal area continuously generated.
- the abnormal region in the abnormal image I j is equal sporadic abnormal region occurs, the weights w 1, w 2 as weighting w 1 is relatively large with respect to the weight w 2 is determined.
- the weights w 1 and w 2 are determined to be approximately the same.
- FIG. 18 is a block diagram showing a configuration of a calculation unit provided in the image processing apparatus according to Embodiment 4 of the present invention.
- the image processing apparatus according to the fourth embodiment includes a calculation unit 400 shown in FIG. 18 instead of the calculation unit 100 shown in FIG.
- the configuration and operation of each unit other than the calculation unit 400 are the same as those in the first embodiment.
- the calculation unit 400 includes a detection unit 110, a global similarity calculation unit 120, a local similarity calculation unit 410, an abnormality classification unit 310, an abnormal image group extraction unit 420, and a representative image extraction unit 140.
- the operations of the detection unit 110, the global similarity calculation unit 120, and the representative image extraction unit 140 are the same as those in the first embodiment (see FIG. 1).
- the operation of the abnormality classification unit 310 is the same as that in the third embodiment.
- the local similarity calculation unit 410 calculates the similarity between abnormal regions as the local similarity between adjacent abnormal images in the abnormal image sequence.
- the abnormal image group extraction unit 420 is based on the global similarity calculated by the global similarity calculation unit 120, the local similarity calculated by the local similarity calculation unit 410, and the classification result by the abnormality classification unit 310. An abnormal image group including an abnormal region is extracted.
- FIG. 19 is a flowchart showing the operation of the image processing apparatus according to the fourth embodiment. Note that steps S10 to S12 shown in FIG. 19 are the same as those in the first embodiment (see FIG. 2). For step S12, the global similarity may be calculated in the same manner as in the modified examples 1-1 to 1-3.
- step S41 following step S12 the local similarity calculation unit 410 calculates the local similarity between adjacent abnormal images in the abnormal image sequence.
- the method for calculating the local similarity is not particularly limited. As an example, when a corresponding point between abnormal images is extracted by a known method such as SIFT (Scale Invariant Feature Transform) and the abnormal region corresponds between two abnormal images, the local similarity is set to 1.0. On the other hand, if the abnormal region does not correspond between two abnormal images, the local similarity is set to 0.0.
- SIFT Scale Invariant Feature Transform
- the abnormality classification unit 310 classifies each abnormal region detected in step 11. That is, the continuous abnormality determination unit 311 reads out a determination criterion for determining a continuously occurring abnormal region from the recording unit 50, and the abnormal region is an abnormal region that continuously occurs based on the determination criterion. It is determined whether or not.
- the abnormal image group extraction unit 420 includes the same abnormal region using the global similarity calculated in step S12 and the local similarity calculated in step S41 based on the classification result in step S42. An abnormal image group is extracted.
- FIG. 20 is a flowchart showing the abnormal image group extraction processing executed by the abnormal image group extraction unit 420 in step S43.
- the abnormal image group extraction unit 420 executes the process of loop D for each abnormal image extracted in step S11.
- the abnormal image group extraction unit 420 assigns weights to the global similarity s global and the local similarity s local based on the abnormal region classification result in the abnormal image to be processed (see step S42).
- the abnormal image group extraction unit 420 uses the weights w 3 and w 4 determined in step S401 to obtain a total discrimination parameter s total2 that takes into account the global similarity s global and the local similarity s local. calculate.
- the abnormal image group extraction unit 420 determines whether or not the total discrimination parameter s total2 is equal to or greater than a predetermined threshold th4.
- the total determination parameter s total2 is equal to or greater than the threshold th4 (step S403: Yes)
- the abnormal image group extraction unit 420 determines that the abnormal image to be processed and the abnormal image extracted next include the same abnormal region. Determination is made (step S404).
- the total discrimination parameter s total2 is smaller than the threshold th4 (step S403: No)
- the abnormal image group extraction unit 420 determines that the abnormal image to be processed and the abnormal image extracted next are the same abnormal region. It determines with not including (step S405).
- step S406 the abnormal image group extraction unit 420 extracts the abnormal images determined as having the same abnormal area as the same abnormal image group. Thereafter, the operation of the image processing apparatus returns to the main routine.
- Steps S14 and S15 following step S43 are the same as in the first embodiment (see FIG. 2).
- the overall similarity of the abnormal image and the local region of the abnormal region are determined.
- the weights given to the respective similarities are changed, and based on these total discrimination parameters, it is determined whether or not two abnormal images include the same abnormal region. Therefore, the abnormal image group including the same abnormal region The extraction accuracy can be improved.
- the local similarity calculation unit 410 illustrated in FIG. 18 may calculate the local similarity by various methods other than the method described in the fourth embodiment.
- the local similarity calculation unit 410 first calculates a feature amount of an abnormal region included in each abnormal image.
- a statistical value such as an average value or median value of pixel values (luminance values and G component values) of pixels constituting each abnormal region, and a color feature amount (R component, pixel value) of the pixels constituting each abnormal region.
- the local similarity calculating unit 410 calculates a change amount .DELTA.c a of the above-described feature quantity. Then, using the maximum value c a (max) and variation .DELTA.c a feature quantity, and calculates the local similarity s local given by the following equation (5).
- s local (c a (max ) - ⁇ c a) / c a (max) ... (5)
- the maximum value c a (max) of the feature value is the maximum value that the feature value can take.
- the maximum value c a (max) is 256. Further, when the circularity is calculated as the feature amount, the maximum value c a (max) is 1.
- an abnormality classification unit 330 including only the sporadic abnormality determination unit 331 shown in FIG. It may be classified into two areas, ie, whether or not it is an area (see Modification 3-1).
- step S42 shown in FIG. 19 the abnormality classification unit 330 classifies each abnormal region detected in step S11. That is, the sporadic abnormality determination unit 331 reads out a discrimination criterion for determining the sporadic abnormal region from the recording unit 50, and whether the abnormal region is a sporadic abnormal region based on the discrimination criterion. Determine whether or not.
- step S43 shown in FIG. 19 the abnormal image group extraction unit 420, based on the classification result by the abnormality classification unit 330, the global similarity s global calculated in step S12 and the local similarity calculated in step S41. An abnormal image group including the same abnormal region is extracted using the similarity s local .
- the abnormal image group extraction unit 420 based on the abnormal region classification result by the abnormality classification unit 330, weights w given to the global similarity s global and the local similarity s local , respectively. 3, to determine the w 4.
- an abnormality classification unit 340 including a continuous abnormality determination unit 311 and a sporadic abnormality determination unit 331 shown in FIG. It is also possible to classify them into three types, ie, abnormal regions that occur regularly, abnormal regions that occur sporadically, or neither of them (see Modification 3-2).
- step S42 shown in FIG. 19 the abnormality classification unit 340 classifies each abnormal region detected in step S11. That is, the continuous abnormality determination unit 311 determines whether or not the abnormal region to be processed is an abnormal region that continuously occurs in a series of intraluminal image groups. Further, the sporadic abnormality determination unit 331 determines whether or not the abnormal region to be processed is an abnormal region that occurs sporadically in a series of intraluminal image groups.
- step S43 shown in FIG. 19 the abnormal image group extraction unit 420 determines the global similarity s global calculated in step S12 and the local similarity calculated in step S41 based on the classification result by the abnormality classification unit 340. An abnormal image group including the same abnormal region is extracted using the similarity s local .
- the abnormal image group extraction unit 420 determines the weights w 3 and w given to the global similarity s global and the local similarity s local based on the classification result by the abnormality classification unit 340, respectively. Determine 4 .
- FIG. 21 is a block diagram illustrating a configuration of a calculation unit included in the image processing apparatus according to the fifth embodiment of the present invention.
- the image processing apparatus according to the fifth embodiment includes a calculation unit 500 illustrated in FIG. 21 instead of the calculation unit 100 illustrated in FIG.
- the configuration and operation of each unit other than the calculation unit 500 are the same as those in the first embodiment.
- the calculation unit 500 includes a detection unit 110, a position information acquisition unit 210, a global similarity calculation unit 120, a local similarity calculation unit 410, an abnormality classification unit 340, an abnormal image group extraction unit 510, and a representative image extraction unit 140.
- the operations of the detection unit 110, the global similarity calculation unit 120, and the representative image extraction unit 140 are the same as those in the first embodiment (see FIG. 1).
- the operation of the position information acquisition unit 210 is the same as in the second embodiment (see FIG. 7).
- the operation of the local similarity calculation unit 410 is the same as that in the fourth embodiment or the modified example 4-1 (see FIG. 18).
- the operation of the abnormality classification unit 340 is the same as that of the modified example 3-2 (see FIG. 17).
- the abnormal image group extraction unit 510 includes the positional information acquired by the positional information acquisition unit 210, the global similarity calculated by the global similarity calculation unit 120, the local similarity calculated by the local similarity calculation unit 410, and the abnormality classification. Based on the classification result by the unit 340, an abnormal image group including the same abnormal region is extracted.
- FIG. 22 is a flowchart showing the operation of the image processing apparatus according to the fifth embodiment. Note that steps S10 and S11 shown in FIG. 14 are the same as those in the first embodiment (see FIG. 2).
- step S51 following step S11 the position information acquisition unit 210 acquires the imaging time or the arrangement order i of the abnormal images I i as time-series position information of the abnormal images extracted in step S11.
- the global similarity calculation unit 120 calculates a global similarity s global between adjacent abnormal images in the abnormal image sequence.
- the method of calculating the global similarity s global is the same as that in the first embodiment (see FIGS. 4 and 5).
- the global similarity s global may be calculated in the same manner as in the modified examples 1-1 to 1-3.
- the local similarity calculation unit 410 calculates a local similarity s local between adjacent abnormal images in the abnormal image sequence.
- the method for calculating the local similarity s local is the same as that in the fourth embodiment or the modified example 4-1 (see step S41 in FIG. 19).
- the abnormality classification unit 340 classifies each abnormal region detected in step 11.
- the method for classifying the abnormal region is the same as that in Modification 3-2. As a result, each abnormal region is classified into a continuously occurring abnormal region, a sporadic abnormal region, and other abnormal regions.
- step S55 the abnormal image group extraction unit 510, based on the classification result in step S54, the position information acquired in step S51, the global similarity s global calculated in step S52, and the calculation in step S53.
- An abnormal image group including the same abnormal region is extracted based on the local similarity s local .
- FIG. 23 is a flowchart showing the abnormal image group extraction processing executed by the abnormal image group extraction unit 510 in step S55.
- the abnormal image group extraction unit 510 performs a loop E process on each abnormal image extracted in step S11.
- the abnormal image group extraction unit 510 sets an abnormal image I k ′ (k ′ is a natural number where k ⁇ k ′) adjacent to the abnormal image I k (k is a natural number) to be processed in the abnormal image sequence.
- the difference ⁇ T ( T (I k ′ ) ⁇ T (I k )) between the imaging times T (I k ) and T (I k ′ ) between the two images, ie, the elapsed time is calculated.
- step S502 the abnormal image group extraction section 510, the classification result of the abnormal region in the abnormal image I k (see step S54) and determines whether it is continuous.
- the abnormal image group extraction unit 510 determines whether or not the difference ⁇ T in imaging time is equal to or less than a predetermined threshold th5 (step S503).
- the abnormal image group extraction unit 510 subsequently determines that the global similarity s global between the abnormal images I k and I k ′ is a predetermined threshold th6. It is determined whether or not this is the case (step S504).
- the abnormal image group extraction unit 510 detects that the abnormal image I k to be processed and the abnormal image I k ′ extracted next are the same abnormality. It is determined that the area is included (step S505).
- step S503 determines that the abnormal image I k to be processed and the abnormal image I k ′ extracted next do not include the same abnormal region (step S506).
- step S502 when the classification results are not continuous (step S502: No), the abnormal image group extraction unit 510 determines whether the classification results are sporadic (step S507).
- the abnormal image group extraction unit 510 determines whether or not the difference ⁇ T in imaging time is equal to or less than a predetermined threshold th7 (step S508).
- a predetermined threshold th7 is set longer than the threshold th5 in step S503.
- the abnormal image group extraction unit 510 subsequently determines that the local similarity s local between the abnormal images I k and I k ′ is a predetermined threshold th8. It is determined whether or not this is the case (step S509).
- the abnormal image group extraction unit 510 detects that the abnormal image I k to be processed and the abnormal image I k ′ extracted next are the same abnormality. It is determined that the area is included (step S505).
- step S508 when the imaging time difference ⁇ T is larger than the threshold th7 (step S508: No), or in step S509, the local similarity s local is smaller than the threshold th8 (step S509: No).
- the abnormal image group extraction unit 510 determines that the abnormal image I k to be processed and the abnormal image I k ′ extracted next do not include the same abnormal region (step S506).
- step S507 determines whether the imaging time difference ⁇ T is equal to or smaller than a predetermined threshold th9 (step S507).
- the threshold th9 is set to a value between the threshold th5 in step S503 and the threshold th7 in step S508. Is done.
- the abnormal image group extraction unit 510 subsequently determines that the global similarity s global between the abnormal images I k and I k ′ is a predetermined threshold th6. Whether the local similarity s local is equal to or greater than the predetermined threshold th8 is determined (step S511).
- the abnormal image group extraction unit 510 performs processing on the abnormal image to be processed. It is determined that I k and the abnormal image I k ′ extracted next include the same abnormal region (step S505).
- step S510 when the imaging time difference ⁇ T is larger than the threshold th9 in step S510 (step S510: No), or in step S511, the global similarity s global is smaller than the threshold th6 or the local similarity s local Is smaller than the threshold th8 (step S511: No), the abnormal image group extraction unit 510 determines that the abnormal image I k to be processed and the abnormal image I k ′ extracted next do not include the same abnormal region. Determination is made (step S506).
- the abnormal image group extraction unit 510 extracts abnormal images determined as having the same abnormal area as the same abnormal image group in step S512. Thereafter, the operation of the image processing apparatus returns to the main routine.
- Steps S14 and S15 following step S55 are the same as those in the first embodiment (see FIG. 2).
- the threshold for determining the imaging time difference ⁇ T is changed according to the type of the subject in the abnormal region, and the similarity determination between the abnormal images is performed. Since the similarity (overall similarity s global , local similarity s local ) used for is switched, it is possible to improve the extraction accuracy of abnormal image groups including the same abnormal region.
- all abnormal regions are continuously generated by adjusting the determination criteria used when the continuous abnormality determining unit 311 and the sporadic abnormality determining unit 331 determine the abnormal regions, respectively. It is good also as classifying into any one of the abnormal field and the abnormal field which occurs sporadically. In this case, steps S510 and S511 are omitted.
- step S502 shown in FIG. 23 if the abnormal region to be processed is not an abnormal region that continuously occurs (step S502: No), it is regarded as an abnormal region that occurs sporadically, and the process directly proceeds to step S508. Transition. In this case, steps S510 and S511 are omitted.
- step S507 if the abnormal area to be dealt with is not an abnormal area that occurs sporadically (step S507: No), it is regarded as an abnormal area that occurs continuously, and the process proceeds to step S503. In this case, steps S510 and S511 are omitted.
- step S55 shown in FIG. 22 the abnormal image group extraction unit 510 extracts an abnormal image group including the same abnormal region based on the total discrimination parameter using the position information, the global similarity, and the local similarity. May be.
- FIG. 24 is a flowchart showing an abnormal image group extraction process executed by the abnormal image group extraction unit 510 in Modification 5-3.
- the abnormal image group extraction unit 510 executes a process of loop F for each abnormal image extracted in step S11.
- a parameter representing the proximity of the position may be calculated based on the difference in imaging time.
- the abnormal image group extraction unit 510 based on the abnormal region classification result in the abnormal image to be processed (see step S54), the global similarity s global , the local similarity s local , and the position proximity
- the weights w 5 , w 6 , and w 7 are relatively large if the abnormal area in the abnormal image I j is continuously generated.
- the weight w 7 is relatively large, and between the weights w 5 and w 6 ,
- the weight w 5 is set to be relatively large.
- the weight w 7 is set to be relatively small, and the weight w 6 is set to be relatively large between the weights w 5 and w 6.
- the abnormal image group extraction unit 510 uses the weights w 5 , w 6 , and w 7 determined in step S522, and parameters indicating the global similarity s global , the local similarity s local, and the position proximity.
- a total discrimination parameter s total3 is calculated in consideration of s pos .
- abnormal image group extraction unit 510 determines whether or not total discrimination parameter s total3 is equal to or greater than a predetermined threshold th10.
- the abnormal image group extraction unit 510 determines that the abnormal image I j to be processed and the abnormal image I j + n extracted next are the same. It is determined that the abnormal region is included (step S525).
- the total discrimination parameter s total3 is smaller than the threshold th10 (step S524: No)
- the abnormal image group extraction unit 510 outputs the abnormal image I j to be processed and the abnormal image I j + n extracted next. Are not included in the same abnormal area (step S526).
- step S527 the abnormal image group extraction unit 510 extracts the abnormal images determined to have the same abnormal area as the same abnormal image group. Thereafter, the operation of the image processing apparatus returns to the main routine.
- the image processing apparatuses according to the first to fifth embodiments and the modifications described above can be realized by executing an image processing program recorded on a recording medium by a computer system such as a personal computer or a workstation. .
- a computer system such as a personal computer or a workstation.
- such a computer system is used by being connected to other computer systems, servers, and other devices via a public line such as a local area network (LAN), a wide area network (WAN), or the Internet. Also good.
- the image processing apparatuses according to Embodiments 1 to 5 and these modifications acquire various types of image data of intraluminal images via these networks, and various types of devices connected via these networks.
- the image processing result may be output to an output device (viewer, printer, etc.), or the image processing result may be stored in a storage device (recording medium and its reading device, etc.) connected via these networks.
- the present invention is not limited to the first to fifth embodiments and the modifications thereof, and various inventions can be made by appropriately combining a plurality of components disclosed in the embodiments and modifications. Can be formed. For example, some constituent elements may be excluded from all the constituent elements shown in each embodiment or modification, or may be formed by appropriately combining the constituent elements shown in different embodiments or modifications. May be.
Landscapes
- Health & Medical Sciences (AREA)
- Engineering & Computer Science (AREA)
- Life Sciences & Earth Sciences (AREA)
- Physics & Mathematics (AREA)
- Surgery (AREA)
- General Health & Medical Sciences (AREA)
- Medical Informatics (AREA)
- Nuclear Medicine, Radiotherapy & Molecular Imaging (AREA)
- Animal Behavior & Ethology (AREA)
- Veterinary Medicine (AREA)
- Biophysics (AREA)
- Pathology (AREA)
- Biomedical Technology (AREA)
- Heart & Thoracic Surgery (AREA)
- Public Health (AREA)
- Molecular Biology (AREA)
- Radiology & Medical Imaging (AREA)
- General Physics & Mathematics (AREA)
- Theoretical Computer Science (AREA)
- Computer Vision & Pattern Recognition (AREA)
- Optics & Photonics (AREA)
- Physiology (AREA)
- Quality & Reliability (AREA)
- Gastroenterology & Hepatology (AREA)
- Endocrinology (AREA)
- Signal Processing (AREA)
- Cardiology (AREA)
- Endoscopes (AREA)
- Closed-Circuit Television Systems (AREA)
- Instruments For Viewing The Inside Of Hollow Bodies (AREA)
- Image Analysis (AREA)
Abstract
生体の管腔内を時系列順に撮像することにより取得された一連の画像群から代表画像を抽出する場合において、同一の異常領域が写った異常画像が代表画像として連続抽出されることを抑制することができる画像処理装置等を提供する。画像処理装置1は、生体の管腔内を順次撮像することにより取得された一連の画像群から、異常領域を含む異常画像を検出する検出部110と、異なる異常画像間において、異常領域以外の領域を含む領域同士における類似度である大局類似度を算出する大局類似度算出部120と、大局類似度又は該大局類似度に基づく判別パラメータと閾値との比較に基づいて、同一の異常領域を含む異常画像群を抽出する異常画像群抽出部130と、抽出された異常画像群から代表画像を抽出する代表画像抽出部140と、を備える。
Description
本発明は、生体の管腔内を撮像することにより取得された画像群から代表画像を抽出する画像処理装置、画像処理方法、及び画像処理プログラムに関する。
内視鏡やカプセル型内視鏡等の医用観察装置を用いて生体の管腔内を時系列順に撮像することにより取得された一連の画像群(以下、管腔内画像群ともいう)から、異常領域等の注目領域が写った画像を代表画像として抽出する技術が知られている。ユーザは、画像群から抽出された代表画像を観察することで、大量の画像を詳細に観察する負担を軽減することができ、正確且つ効率の良い診断を行うことが可能となる。
例えば特許文献1には、時系列順に取得された管腔内画像群から注目領域を検出し、検出した各注目領域の特徴量に基づいて、時系列で隣接し、且つ特徴量が類似する注目領域を同一のグループとして分類し、各グループに分類された注目領域のうちから、特徴量の平均値に基づいて、当該グループの代表領域を選出し、選出した代表領域を含む画像を代表画像として出力する画像処理装置が開示されている。
カプセル型内視鏡のように、撮像方向が頻繁に変化する医用観察装置を用いて撮像を行った場合、時系列において近傍の管腔内画像間に同一の注目領域が写っているにもかかわらず、注目領域の位置や形状や色が大きく変化する、或いは、同一の注目領域が視野から消えたり、再び現れたりするといったことがある。例えば浮遊出血のように、特定の形状を有しない異常を注目領域とする場合、注目領域の形状は頻繁に変化することが多い。
このような管腔内画像群に対して上記特許文献1に開示された技術を適用すると、位置や形状や色が大きく変化する注目領域を異なる注目領域として判断し、別のグループに分類してしまう場合がある。その結果、同一の注目領域が写った注目画像が代表画像として連続して抽出されてしまう可能性がある。
本発明は、上記に鑑みて為されたものであって、生体の管腔内を時系列順に撮像することにより取得された一連の画像群から代表画像を抽出する場合において、同一の注目領域が写った注目画像が代表画像として連続抽出されることを抑制することができる画像処理装置、画像処理方法、及び画像処理プログラムの提供を目的とする。
上述した課題を解決し、目的を達成するために、本発明に係る画像処理装置は、生体の管腔内を順次撮像することにより取得された一連の画像群から、検出対象として推定される領域である注目領域を含む注目画像を検出する検出手段と、異なる注目画像間において、少なくとも前記注目領域以外の領域を含む領域同士における類似度である大局類似度を算出する大局類似度算出手段と、前記大局類似度又は該大局類似度に基づく判別パラメータと閾値との比較に基づいて、同一の注目領域を含む注目画像群を抽出する注目画像群抽出手段と、前記注目画像群から代表画像を抽出する代表画像抽出手段と、を備えることを特徴とする。
本発明に係る画像処理方法は、生体の管腔内を順次撮像することにより取得され、記録部に記録された一連の画像群の画像データに基づいて、コンピュータが備える演算部に実行させる画像処理方法において、前記一連の画像群から、注目領域を含む注目画像を検出する検出ステップと、異なる注目画像間において、少なくとも前記注目領域以外の領域を含む領域同士における類似度である大局類似度を算出する大局類似度算出ステップと、前記大局類似度又は該大局類似度に基づく判別パラメータと閾値との比較に基づいて、同一の注目領域を含む注目画像群を抽出する注目画像群抽出ステップと、前記注目画像群から代表画像を抽出する代表画像抽出ステップと、を含むことを特徴とする。
本発明に係る画像処理プログラムは、生体の管腔内を順次撮像することにより取得された一連の画像群から、注目領域を含む注目画像を検出する検出ステップと、異なる注目画像間において、少なくとも前記注目領域以外の領域を含む領域同士における類似度である大局類似度を算出する大局類似度算出ステップと、前記大局類似度又は該大局類似度に基づく判別パラメータと閾値との比較に基づいて、同一の注目領域を含む注目画像群を抽出する注目画像群抽出ステップと、前記注目画像群から代表画像を抽出する代表画像抽出ステップと、をコンピュータに実行させることを特徴とする。
本発明によれば、一連の画像群から検出された注目画像に対し、注目画像間の大局類似度に基づいて注目画像群を抽出するので、同一の異常領域が写った異常画像が代表画像として連続抽出されることを抑制することが可能となる。
以下、本発明の実施の形態に係る画像処理装置、画像処理方法、及び画像処理プログラムについて、図面を参照しながら説明する。なお、これらの実施の形態によって本発明が限定されるものではない。また、各図面の記載において、同一部分には同一の符号を付して示している。
(実施の形態1)
図1は、本発明の実施の形態1に係る画像処理装置を示すブロック図である。実施の形態1に係る画像処理装置1は、被検体である生体の管腔内をカプセル型内視鏡等の医用観察装置により順次撮像することにより取得された一連の画像群から、検出対象として推定される注目領域を含む画像(注目画像)群を抽出し、抽出した注目画像群からさらに代表画像を抽出する装置である。生体の管腔内が写った画像(管腔内画像ともいう)は、通常、各画素位置においてR(赤)、G(緑)、B(青)の波長成分に対する画素レベル(画素値)を持つカラー画像である。以下の説明においては、注目領域として出血、発赤、アフタ、潰瘍等の異常領域を検出し、これらの異常領域を含む注目画像(異常画像)群から代表画像を抽出する場合を説明するが、注目領域は上記例示した異常領域に限定されない。
図1は、本発明の実施の形態1に係る画像処理装置を示すブロック図である。実施の形態1に係る画像処理装置1は、被検体である生体の管腔内をカプセル型内視鏡等の医用観察装置により順次撮像することにより取得された一連の画像群から、検出対象として推定される注目領域を含む画像(注目画像)群を抽出し、抽出した注目画像群からさらに代表画像を抽出する装置である。生体の管腔内が写った画像(管腔内画像ともいう)は、通常、各画素位置においてR(赤)、G(緑)、B(青)の波長成分に対する画素レベル(画素値)を持つカラー画像である。以下の説明においては、注目領域として出血、発赤、アフタ、潰瘍等の異常領域を検出し、これらの異常領域を含む注目画像(異常画像)群から代表画像を抽出する場合を説明するが、注目領域は上記例示した異常領域に限定されない。
図1に示すように、画像処理装置1は、該画像処理装置1全体の動作を制御する制御部10と、カプセル型内視鏡等の医用観察装置により撮像された管腔内画像に対応する画像データを取得する画像取得部20と、外部からの操作に応じた信号を制御部10に入力する入力部30と、各種情報や画像の表示を行う表示部40と、画像取得部20によって取得された画像データや種々のプログラムを格納する記録部50と、画像データに対して所定の画像処理を実行する演算部100とを備える。
制御部10は、CPU等のハードウェアによって実現され、記録部50に記録された各種プログラムを読み込むことにより、画像取得部20から入力される画像データや入力部30から入力される信号等に従って、画像処理装置1を構成する各部への指示やデータの転送等を行い、画像処理装置1全体の動作を統括的に制御する。
画像取得部20は、被検体内を撮像するカプセル型内視鏡を含むシステムの態様に応じて適宜構成される。例えば、カプセル型内視鏡との間の画像データの受け渡しに可搬型の記録媒体が使用される場合、画像取得部20は、この記録媒体を着脱自在に装着し、記録された画像の画像データを読み出すリーダ装置で構成される。また、カプセル型内視鏡によって撮像された画像の画像データを保存しておくサーバを設置する場合、画像取得部20は、サーバと接続される通信装置等で構成され、サーバとデータ通信を行って画像データを取得する。
入力部30は、例えばキーボードやマウス、タッチパネル、各種スイッチ等の入力デバイスによって実現され、これらの入力デバイスに対する外部からの操作に応じて発生させた入力信号を制御部10に出力する。
表示部40は、LCDやELディスプレイ等の表示装置によって実現され、制御部10の制御の下で、管腔内画像を含む各種画面を表示する。
記録部50は、更新記録可能なフラッシュメモリ等のROMやRAMといった各種ICメモリ、内蔵若しくはデータ通信端子で接続されたハードディスク、又は、CD-ROM等の情報記録装置及びその読取装置等によって実現される。記録部50は、画像取得部20によって取得された管腔内画像の画像データの他、画像処理装置1を動作させると共に、種々の機能を画像処理装置1に実行させるためのプログラムや、このプログラムの実行中に使用されるデータ等を格納する。具体的には、記録部50は、管腔内画像から出血、発赤、アフタ、潰瘍等の異常領域を検出し、これらの異常領域を含む画像(異常画像)から同一の異常領域を含む異常画像群を抽出し、各異常画像群から代表画像を抽出する画像処理を当該画像処理装置1に実行させる画像処理プログラム51や、異常領域を検出する際に用いられる判別基準や、代表画像を抽出する際に用いられる判別基準等を格納する。
演算部100は、CPU等のハードウェアによって実現され、画像処理プログラム51を読み込むことにより、管腔内画像から同一の異常領域を含む異常画像群を抽出し、各異常画像群から代表画像を抽出する画像処理を行う。
次に、演算部100の構成について説明する。図1に示すように、演算部100は、一連の管腔内画像群から異常領域を含む異常画像を検出する検出部110と、異なる異常画像間における全体的な類似度である大局類似度を算出する大局類似度算出部120と、大局類似度に基づいて、検出部110が検出した異常画像から同一の異常領域を含む異常画像群を抽出する異常画像群抽出部130と、抽出された各異常画像群から代表画像を抽出する代表画像抽出部140とを備える。
検出部110は、管腔内画像の各種特徴量に基づいて異常領域を検出する。実施の形態1においては、管腔内画像の色特徴量(色情報)に基づいて異常領域を検出する例を説明する。ここで、出血や発赤、血管異常等の異常領域は赤色調の特定色を示し、潰瘍やアフタ等の異常領域は白色調の特定色を示す。そこで、検出部110は、画素値の各色成分(R成分、G成分、B成分)や、これらの各色成分を基に公知の変換により2次的に算出した値(例えば、YCbCr変換により算出した色差、HSI変換により算出した色相、彩度、G/R、B/G等の色比など)といった色特徴量を用いて、管腔内画像内の特定色を示す領域を検出し、この領域を異常領域とする。より詳細には、事前に収集した各種の異常領域の色特徴量を基に、異常領域の判別基準(色範囲)を予め作成し、記録部50に記録しておく。そして、管腔内画像から異常領域を検出する際に、この判別基準を記録部50から読み出すと共に、管腔内画像を構成する各画素について色特徴量を算出し、各画素の色特徴量を判別基準と比較することにより、当該管腔内画像から異常領域を検出する。
なお、異常領域の検出方法は、上述した検出方法に限定されず、異常領域を検出することができれば、公知の種々の方法を適用することができる。例えば、代表的な色特徴量との特徴空間距離に基づく方法等を用いても良い。また、上記説明においては、管腔内画像を構成する画素単位の色特徴量を用いて異常領域を検出したが、画像内のエッジ情報等を基に管腔内画像を小領域に分割し、小領域単位の色特徴量を用いて異常領域を検出しても良い。さらに、色特徴量以外の形状特徴量や、テクスチャ特徴量を用いて、異常領域を検出しても良い。
大局類似度算出部120は、互いに異なる異常画像間において、少なくとも異常領域以外の領域を含む領域、即ち、異常領域の背景を含む領域同士における類似度を大局類似度として算出する。
異常画像群抽出部130は、大局類似度算出部120が算出した大局類似度に基づいて、検出部110が検出した異常領域のうちで同一の異常領域を含む画像を1つの異常画像群として抽出する注目画像群抽出手段である。
代表画像抽出部140は、同一の異常領域を含む異常画像群の各々から代表画像を抽出する。代表画像の抽出方法は特に限定されず、単に異常画像群の時系列の先頭の画像や中央の画像を代表画像として抽出しても良いし、画像診断の上で重要度の高い異常領域を含む異常画像や、異常領域の視認性の良い異常画像を代表画像として抽出しても良い。異常領域の重要度や視認性は、例えば異常領域の色特徴量、形状特徴量、テクスチャ特徴量等に基づいて判別することができる。
次に、図1に示す画像処理装置1の動作について説明する。図2は、画像処理装置1の動作を示すフローチャートである。まず、ステップS10において、画像処理装置1は、時系列順に撮像された一連の管腔内画像の画像データを、画像取得部20を介して取得し、記録部50に記録する。
続くステップS11において、検出部110は、記録部50に記録された管腔内画像の画像データを順次読み出し、各管腔内画像から異常領域を検出して、異常領域を含む異常画像を抽出する。具体的には、検出部110は、記録部50に予め記録されている異常領域の判別基準を読み出し、各管腔内画像を構成する各画素の色特徴量をこの判別基準と比較することにより、異常領域を検出する。
図3は、時系列順に取得された一連の管腔内画像Iiを示す模式図である。ここで、添え字i(i=1、2、…)は、各管腔内画像の時系列的な並び順(撮像順序)を示し、画像番号に対応する。ステップS11の処理により、異常領域Ai(i=t1~t1+4、t2、t2+2、t2+4)が検出され、各異常領域Aiを含む管腔内画像Iiが抽出される。以下、異常領域Aiを含む管腔内画像Iiを異常画像Iiと記し、時系列(撮像順序)に沿って並べられた異常画像Iiのみからなる画像列を、異常画像列ともいう。
続くステップS12において、大局類似度算出部120は、ステップS11において抽出された各異常画像に対し、異常画像列において隣接する異常画像間の大局類似度を算出する。例えば図3の場合、異常画像列で隣接する異常画像として、異常画像It1とIt1+1、異常画像It1+1とIt1+2、異常画像It1+2とIt1+3、異常画像It1+3とIt1+4、異常画像It1+4とIt2、異常画像It2とIt2+2、異常画像It2+2とIt2+4の各組み合わせにおける大局類似度が算出される。
実施の形態1においては、大局類似度として、異常領域の背景領域同士の類似度を算出する例を説明する。図4は、ステップS12において大局類似度算出部120が実行する大局類似度算出処理を示すフローチャートである。また、図5は、大局類似度算出処理を説明するための模式図である。
図5に示すように、異常画像列で隣接する異常画像Ik、Ik’(k、k’はk<k’の自然数)から、異常領域Ak、Ak’がそれぞれ検出されているものとする。この場合、図4に示すステップS101において、大局類似度算出部120は、各異常画像Ik、Ik’から、背景領域として、異常領域Ak、Ak’以外の領域、即ち非異常領域Bk、Bk’をそれぞれ抽出する。
続くステップS102において、大局類似度算出部120は、背景領域、即ち非異常領域Bk、Bk’の特徴量ck、ck’をそれぞれ算出する。特徴量ck、ck’としては、非異常領域Bk、Bk’を構成する画素の画素値(輝度値やG成分の値)の平均値又は中央値等の統計量、非異常領域Bk、Bk’を構成する画素の色特徴量(R成分、G成分、B成分の各値を用いて、YCbCr変換により算出した色差、HSI変換により算出した色相、彩度、G/R、B/G等の色比など)の平均値又は中央値等の統計量、非異常領域Bk、Bk’の形状特徴量(面積や円形度等)、非異常領域Bk、Bk’を構成する各画素におけるテクスチャ特徴量(ソーベルフィルタやラプラシアンフィルタ等を用いて算出されるエッジ量等)の平均値又は中央値等の統計量等が挙げられる。
続くステップS103において、大局類似度算出部120は、異常画像列で隣接する異常画像Ik、Ik’間における非異常領域Bk、Bk’の特徴量ck、ck’の変化量Δc(Δc=ck-ck’)を算出する。
続くステップS104において、大局類似度算出部120は、特徴量の最大値cmax及び変化量Δcを用いて、次式(1)によって与えられる大局類似度sglobalを算出する。
sglobal=(cmax-Δc)/cmax …(1)
式(1)において、特徴量の特徴量の最大値cmaxは、特徴量ck、ck’が取り得る最大の値である。例えば256階調の異常画像Ik、Ik’に対し、特徴量ck、ck’として画素値(G成分の値)の統計値を算出した場合、最大値cmaxは256である。また、特徴量ck、ck’として円形度を算出した場合、最大値cmaxは1である。その後、画像処理装置1の動作はメインルーチンに戻る。
sglobal=(cmax-Δc)/cmax …(1)
式(1)において、特徴量の特徴量の最大値cmaxは、特徴量ck、ck’が取り得る最大の値である。例えば256階調の異常画像Ik、Ik’に対し、特徴量ck、ck’として画素値(G成分の値)の統計値を算出した場合、最大値cmaxは256である。また、特徴量ck、ck’として円形度を算出した場合、最大値cmaxは1である。その後、画像処理装置1の動作はメインルーチンに戻る。
ステップS12に続くステップS13において、異常画像群抽出部130は、ステップS11において抽出された異常画像から、ステップS12において算出された大局類似度sglobalに基づいて、同一の異常領域を含む異常画像群を抽出する。詳細には、異常画像群抽出部130は、大局類似度sglobalが所定の閾値以上である異常画像同士を、同一の異常領域を含む異常画像として判定する。反対に、大局類似度sglobalが所定の閾値未満である異常画像同士を、同一の異常領域を含まない異常画像として判定する。そして、異常画像群抽出部130は、同一の異常領域を含む異常画像を、1つの異常画像群として抽出する。
例えば、図3において、異常画像It1とIt1+1、異常画像It1+1とIt1+2、異常画像It1+2とIt1+3、及び異常画像It1+3とIt1+4が、それぞれ同一の異常領域を含むと判定された場合、これらの異常画像It1、It1+1、It1+2、It1+3、It1+4が、1つの異常画像群Gt1として抽出される。また、異常画像It1+4とIt2が同一の異常領域を含まないと判定された場合、異常画像It2は、異常画像It1+4と同じ異常画像群として抽出されない。さらに、異常画像It2とIt2+2、異常画像It2+2とIt2+4が、それぞれ同一の異常領域を含むと判定された場合、これらの異常画像It2、It2+2、It2+4が、1つの異常画像群Gt2として抽出される。
続くステップS14において、代表画像抽出部140は、ステップS13において抽出された各異常画像群から代表画像を抽出する。抽出される代表画像の数は、定数であっても良いし(例えば、各異常画像群から1枚)、異常画像群に含まれる異常画像の枚数に応じて決定しても良い(例えば、異常画像の枚数のα倍、0<α<1)。なお、後者の場合、代表画像の枚数が1枚に満たないときには、少なくとも1枚の代表画像を抽出するものとする。或いは、抽出される代表画像の数を特定せず、所定の基準を満たす異常画像(例えば、色特徴量が所定の閾値以上の異常画像)を全て代表画像として抽出しても良い。
代表画像の抽出方法は特に限定されない。例えば、各異常画像群の時系列順での先頭の画像や中央の画像を代表画像として抽出しても良い。或いは、各異常画像群における同一の異常領域の色特徴量に基づいて抽出しても良い。具体的には、異常領域が赤色調の特定色を示す場合、異常領域の赤色が強い異常画像を代表画像として優先的に抽出し、異常領域が白色調の特定色を示す場合、異常領域の白色が強い異常画像を代表画像として優先的に抽出する。また、異常領域の面積が大きい異常画像や、異常領域の位置が中央に近い異常画像を代表画像として優先的に抽出しても良い。
続くステップS15において、演算部100は、代表画像の抽出結果として、ステップS14において各異常画像群から抽出された代表画像を表す情報を出力する。これに応じて、記録部50は、代表画像として抽出された管腔内画像の画像データに代表画像である旨を示す情報(フラグ)を付加する。
以上説明したように、本発明の実施の形態1によれば、異常画像内の背景領域を含む領域間の大局類似度に基づいて異常画像群を抽出するので、異常領域が撮像された際の状況により、異常画像間において異常領域の位置や形状や色が大きく変化した、或いは、異常領域が一瞬視野から外れ、異常画像同士が時系列的に離れてしまった、といった場合であっても、これらの異常画像を同じ異常画像群として抽出することができる。そのため、同一の異常領域が写った異常画像が代表画像として連続抽出されるのを抑制することができる。従って、検出された全ての異常を網羅しつつ、抽出枚数が抑制された代表画像を観察することで、ユーザは、正確且つ効率の良い診断を行うことが可能となる。
(変形例1-1)
次に、本発明の実施の形態1の変形例1-1について説明する。
大局類似度を算出する際に各異常画像から抽出する背景領域は、非異常領域の全体でなくても良い。例えば、異常画像内の粘膜が写った領域(粘膜領域)を背景領域として抽出し、この粘膜領域同士の大局類似度を算出しても良い。
次に、本発明の実施の形態1の変形例1-1について説明する。
大局類似度を算出する際に各異常画像から抽出する背景領域は、非異常領域の全体でなくても良い。例えば、異常画像内の粘膜が写った領域(粘膜領域)を背景領域として抽出し、この粘膜領域同士の大局類似度を算出しても良い。
粘膜領域は、事前に作成された判別基準を用いて抽出することができる。判別基準は、管腔内画像に写った出血、残渣、泡、ハレーション、暗部等の非粘膜領域の色特徴量(画素値のR成分、G成分、B成分の値、これらの各色成分の値を基に公知の変換により2次的に算出した値(YCbCr変換により算出した色差、HSI変換により算出した色相、彩度、G/R、B/G等の色比など))や、形状特徴量(Histograms of Oriented Gradients(HOG)、面積、周囲長、フェレ径等の形状情報)や、テクスチャ特徴量(Local Binary Pattern(LBP)、同時正規行列等)の特徴量分布に基づき、サポートベクターマシン(SVM)等の学習器により作成し、記録部50に記録しておく。
図6は、変形例1-1における大局類似度算出処理(図2のステップS12及び図4参照)を説明するための模式図である。この場合、ステップS101において、大局類似度算出部120は、粘膜領域を判別するための判別基準を記録部50から読み出し、異常画像を構成する各画素について算出された特徴量を判別基準と比較することにより、粘膜領域を抽出する。それにより、図6に示すように、異常画像列で隣接する異常画像Ik、Ik’から、出血等の異常領域Ak、Ak’や、泡等の不要領域Ck、Ck’を除いた粘膜領域Dk、Dk’がそれぞれ抽出される。
大局類似度算出部120は、この粘膜領域Dk、Dk’を背景領域として特徴量ck、ck’を算出し(ステップS102参照)、該特徴量の最大値cmax及び変化量Δcを用いて、式(1)によって与えられる大局類似度sglobalを算出する(ステップS103、S104参照)。
以上説明したように、変形例1-1によれば、異常画像間における粘膜領域同士の大局類似度を算出するので、出血、残渣、泡、ハレーション、及び暗部のように、局所的に発生する現象に起因する影響を抑制しつつ、同一の異常領域を含む異常画像群を抽出することが可能となる。
(変形例1-2)
次に、本発明の実施の形態1の変形例1-2について説明する。
大局類似度は、背景領域だけでなく、異常領域を含む領域の特徴量に基づいて算出しても良い。具体的には、異常領域及び非異常領域を含む異常画像全体の特徴量に基づいて大局類似度を算出しても良い。或いは、異常画像全体から、残渣、泡、ハレーション、暗部等の不要領域(診断における検出対象以外の領域)を除いた領域の特徴量を用いて大局類似度を算出しても良い。いずれにしても、大局類似度は、少なくとも非異常領域を含む領域同士について算出したものであれば良い。
次に、本発明の実施の形態1の変形例1-2について説明する。
大局類似度は、背景領域だけでなく、異常領域を含む領域の特徴量に基づいて算出しても良い。具体的には、異常領域及び非異常領域を含む異常画像全体の特徴量に基づいて大局類似度を算出しても良い。或いは、異常画像全体から、残渣、泡、ハレーション、暗部等の不要領域(診断における検出対象以外の領域)を除いた領域の特徴量を用いて大局類似度を算出しても良い。いずれにしても、大局類似度は、少なくとも非異常領域を含む領域同士について算出したものであれば良い。
(変形例1-3)
次に、本発明の実施の形態1の変形例1-3について説明する。
異常画像間の大局類似度は、異常画像に写った臓器の種類に基づいて決定しても良い。以下、臓器の種類に基づく大局類似度の決定方法を説明する。
次に、本発明の実施の形態1の変形例1-3について説明する。
異常画像間の大局類似度は、異常画像に写った臓器の種類に基づいて決定しても良い。以下、臓器の種類に基づく大局類似度の決定方法を説明する。
まず、各異常画像に写った臓器の種類を判別する。臓器の種類は、公知の種々の方法を用いて判別することができる。以下においては、一例として、特開2006-288612号公報に開示されている方法を説明する。まず、事前に、管腔内の各臓器(食道、胃、小腸、及び大腸)が写った画像におけるR、G、Bの各色成分(色要素)の数値範囲を決定しておく。そして、異常画像を構成する各画素のR成分、G成分、及びB成分の値それぞれの平均値を算出し、事前に決定した各臓器の色成分の数値範囲と比較する。その結果、異常画像について算出した色成分ごとの平均値が事前に決定した食道の色成分の数値範囲内であれば、当該異常画像に写った臓器は食道であると判別する。同様に、異常画像について算出した色成分ごとの平均値が事前に決定した胃の色成分の数値範囲内であれば当該異常画像に写った臓器は胃であり、小腸の色成分の数値範囲内であれば当該異常画像に写った臓器は小腸であり、大腸の色成分の数値範囲内であれば当該異常画像に写った臓器は大腸であると判別する。
大局類似度算出部120は、各異常画像に対して判別された臓器の種類に基づいて大局類似度を決定する。具体的には、異常画像列で隣接する異常画像間において、臓器の種類が同一であれば、類似度を1.0に決定する。一方、異常画像列で隣接する異常画像間において、臓器の種類が異なる場合、類似度を0.0に決定する。
なお、臓器の種類は、ユーザが判別することとしても良い。具体的には、演算部100における画像処理により、一連の管腔内画像の各々の平均色を算出し、これらの平均色を管腔内画像の並び順(時系列順)に配列したカラーバーを作成して表示部40に表示させる。このカラーバー上における平均色の変わり目(境界)が、一連の管腔内画像における臓器の境界に対応する。そこで、入力部30に対するユーザ操作に応じて、カラーバー上の特定のポイントを選択する信号が入力部30から制御部10に入力されると、制御部10は、当該ポイントに対応する管腔内画像の画像番号を演算部100に入力する。演算部100は、入力された画像番号に対応する管腔内画像を臓器の境界として、各管腔内画像に写った臓器の種類を特定する。大局類似度算出部120は、異常領域が検出された管腔内画像の臓器の種類に基づいて、大局類似度を決定する。
(変形例1-4)
次に、本発明の実施の形態2の変形例1-4について説明する。
演算部100は、ステップS10において画像データを取得した後、一連の管腔内画像全体に対して臓器の種類の判別処理を行っても良い。なお、臓器の種類の判別方法は、変形例1-3と同様であり、自動判別を行っても良いし、ユーザが手動で判別することとしても良い。
次に、本発明の実施の形態2の変形例1-4について説明する。
演算部100は、ステップS10において画像データを取得した後、一連の管腔内画像全体に対して臓器の種類の判別処理を行っても良い。なお、臓器の種類の判別方法は、変形例1-3と同様であり、自動判別を行っても良いし、ユーザが手動で判別することとしても良い。
この場合、演算部100は、検査対象の臓器(例えば小腸)が写った管腔内画像に対して、上述したステップS11~S14の処理(図2参照)を実行する。一方、演算部100は、検査対象外の臓器(例えば食道、胃、大腸)が写った管腔内画像に対しては、異常領域を検出することにより異常画像を抽出した後、例えば異常領域の赤みが強い順、或いは、異常領域の白色が強い順に、異常画像を所定枚数(例えば10枚などの少数)だけ抽出し、代表画像として出力する。なお、赤みの強さは、色比G/Rによって表すことができ、色比G/Rが小さいほど赤みが強いことを示す。また、白色の強さは、色比G/R及びB/Gによって表すことができ、色比G/R及びB/Gが共に大きいほど白みが強いことを示す。或いは、演算部100は、検査対象外の臓器が写った管腔内画像については異常領域の検出を行うことなく、各管腔内画像の色特徴量(上述した色比等)に基づいて、所定枚数(例えば10枚などの少数)の管腔内画像を代表画像として抽出しても良い。さらには、演算部100は、検査対象外の臓器が写った管腔内画像からは代表画像の抽出を行わなくても良い。
(実施の形態2)
次に、本発明の実施の形態2について説明する。
図7は、本発明の実施の形態2に係る画像処理装置が備える演算部の構成を示すブロック図である。実施の形態2に係る画像処理装置は、図1に示す演算部100の代わりに、図7に示す演算部200を備える。演算部200以外の各部の構成及び動作については、実施の形態1と同様である。
次に、本発明の実施の形態2について説明する。
図7は、本発明の実施の形態2に係る画像処理装置が備える演算部の構成を示すブロック図である。実施の形態2に係る画像処理装置は、図1に示す演算部100の代わりに、図7に示す演算部200を備える。演算部200以外の各部の構成及び動作については、実施の形態1と同様である。
演算部200は、検出部110、位置情報取得部210、大局類似度算出部120、異常画像群抽出部220、及び代表画像抽出部140を備える。このうち、検出部110、大局類似度算出部120、及び代表画像抽出部140の動作は、実施の形態1と同様である。
位置情報取得部210は、各異常画像Iiの一連の管腔内画像(図3参照)における時系列的な並び順(撮像順)若しくは該並び順を表す画像番号、又は各異常画像Iiの撮像時刻を、当該異常画像Iiの時系列的な位置情報として取得する。ここで、一連の管腔内画像の撮像に用いられたカプセル型内視鏡の平均進行速度をv(例えば、1mm/秒)、撮像フレームレートをF(例えば、2枚/秒)とすると、管腔内画像(異常画像)Iiの撮像位置は、一連の管腔内画像の撮像開始位置(例えば、口腔内)から距離i・v/F(mm)だけ進行した位置であると推定することができる。また、撮像時刻を用いても、同様にしてカプセル型内視鏡の位置を推定することができる。従って、管腔内画像の並び順、画像番号、及び撮像時刻を、異常画像Iiの位置情報として扱うことができる。
異常画像群抽出部220は、位置情報取得部210が取得した位置情報と、大局類似度算出部120が算出した大局類似度とに基づいて、同一の異常領域を含む異常画像群を抽出する。
次に、実施の形態2に係る画像処理装置の動作について説明する。図8は、実施の形態2に係る画像処理装置の動作を示すフローチャートである。なお、図8に示すステップS10及びS11は、実施の形態1と同様である(図2参照)。
ステップS11に続くステップS21において、位置情報取得部210は、ステップS11において抽出された異常画像の時系列的な位置情報を取得する。具体的には、異常画像Iiの撮像時刻又は並び順iを位置情報として取得する。
続くステップS22において、大局類似度算出部120は、異常画像列において隣接する異常画像間の大局類似度を算出する。大局類似度の算出方法は、実施の形態1と同様である(図4及び図5参照)。或いは、変形例1-1~1-3と同様にして大局類似度を算出しても良い。
続くステップS23において、異常画像群抽出部220は、ステップS21において取得された位置情報及びステップS22において算出された大局類似度に基づいて、同一の異常領域を含む異常画像群を抽出する。
図9は、ステップS23において異常画像群抽出部220が実行する異常画像群の抽出処理を示すフローチャートである。また、図10は、異常画像群の抽出処理を説明するための模式図である。異常画像群抽出部220は、ステップS11において抽出された各異常画像について、ループAの処理を実行する。
まず、ステップS201において、異常画像群抽出部220は、処理対象の異常画像Ik(kは自然数)に対し、異常画像列で隣接する異常画像Ik’(k’はk<k’の自然数)との間における撮像時刻T(Ik)、T(Ik’)の差分ΔT(=T(Ik’)-T(Ik))、即ち経過時間を算出する。
続くステップS202において、異常画像群抽出部220は、ステップS201において算出した撮像時刻の差分ΔTが所定の閾値th1以下であるか否かを判定する。
撮像時刻の差分ΔTが閾値th1以下である場合(ステップS202:Yes)、続いて、異常画像群抽出部220は、当該異常画像Ik、Ik’間の大局類似度sglobalが所定の閾値th2以上であるか否かを判定する(ステップS203)。
大局類似度sglobalが閾値th2以上である場合(ステップS203:Yes)、異常画像群抽出部220は、処理対象の異常画像Ik及びその次に抽出された異常画像Ik’が同一の異常領域を含むと判定する(ステップS204)。
例えば図10に示す異常画像It1と異常画像It1+1のように、時系列的に隣接する場合(ΔT1<th1)、大局類似度sglobalが閾値th2以上であれば、これらの異常画像It1、It1+1は同一の異常領域を含むと判定される。また、異常画像It2と異常画像It2+2のように、管腔内画像群Ii(i=1、2、…)においては時系列的に直接隣接していない場合であっても、撮像時刻の差分ΔT2が閾値th1以下であれば、大局類似度sglobalが閾値th2以上であることを条件に、これらの異常画像It2、It2+2は同一の異常領域を含むと判定される。
一方、ステップS202において、撮像時刻の差分ΔTが閾値th1よりも大きい場合(ステップS202:No)、又は、ステップS203において、大局類似度sglobalが閾値th2よりも小さい場合(ステップS203:No)、異常画像群抽出部220は、処理対象の異常画像Ik及びその次に抽出された異常画像Ik’は同一の異常領域を含まないと判定する(ステップS205)。例えば図10の場合、異常画像It1+4と異常画像It2との撮像時刻の差分ΔT3は閾値th1よりも大きいので、同一の異常領域を含まないと判定される。
全ての異常画像についてループAの処理が終了すると、ステップS206において、異常画像群抽出部220は、同一の異常領域が写っていると判定した異常画像同士を同じ異常画像群として抽出する。その後、画像処理装置の動作はメインルーチンに戻る。
なお、ステップS201においては、撮像時刻の代わりに、異常画像Iiの並び順iの差分を算出しても良い。この場合、ステップS202においては、並び順の差分が所定の閾値以下であるか否かが判定される。
ステップS22に続くステップS14及びS15は、実施の形態1と同様である(図2参照)。
以上説明したように、本発明の実施の形態2によれば、異常画像の時系列的な位置情報及び大局類似度に基づいて、同一の異常領域を含む異常画像群を抽出するので、時系列的に大きく離れた異常画像同士が同一の異常画像群として抽出されるのを防ぐことができる。
(変形例2)
次に、本発明の実施の形態2の変形例2について説明する。
上記実施の形態2においては、異常画像の時系列的な位置情報を、同一の異常領域を含む異常画像群の抽出処理に用いたが、この位置情報を用いて代表画像の抽出処理を行っても良い。
次に、本発明の実施の形態2の変形例2について説明する。
上記実施の形態2においては、異常画像の時系列的な位置情報を、同一の異常領域を含む異常画像群の抽出処理に用いたが、この位置情報を用いて代表画像の抽出処理を行っても良い。
図11は、変形例2に係る画像処理装置が備える演算部の構成を示すブロック図である。図11に示すように、変形例2における演算部250は、実施の形態2における演算部200(図7参照)が備える代表画像抽出部140の代わりに、代表画像抽出部141を備える。代表画像抽出部141以外の演算部250の各部の構成及び動作については、実施の形態2と同様である。
代表画像抽出部141は、同一の異常領域を含む異常画像群の各々から、重要度の高い異常領域として、出血源が写った異常画像を優先的に代表画像として抽出する。より詳細には、代表画像抽出部141は、出血の異常領域が写った異常画像群から出血源を検出する出血源検出部141aを備える。この出血源検出部141aは、異常画像に写った被写体(臓器)の管腔内における位置、即ち、異常画像の管腔内における撮像位置を推定する位置推定部141bを備える。
図12は、図8に示すステップS14において代表画像抽出部141が実行する代表画像抽出処理を示すフローチャートである。代表画像抽出部141は、ステップS23において抽出された各異常画像群についてループBの処理を実行する。なお、以下の説明においては、各異常画像群から抽出される代表画像の枚数をn枚とする。
まず、ステップS211において、代表画像抽出部141は、処理対象の異常画像群に含まれる同一の異常領域が出血であるか否か判定する。具体的には、ステップS11(実施の形態1参照)において、赤色調の特定色を示すものとして検出された異常領域を出血として判定する。或いは、異常領域の色特徴量、形状特徴量、又はテクスチャ特徴量に基づいて、異常領域が出血であるか否かを判定しても良い。
同一の異常領域が出血である場合(ステップS211:Yes)、位置推定部141bは、ステップS21において位置情報取得部210が取得した時系列的な位置情報(異常画像の撮像時刻又は並び順)を取り込み、該位置情報に基づいて当該異常画像群に含まれる各異常画像の管腔内における撮像位置を推定する(ステップS212)。
続くステップS213において、出血源検出部141aは、出血源画像(出血源が写った異常画像)を検出する。詳細には、当該異常画像群のうちで赤みの強い異常領域を含む異常画像から、管腔内における撮像位置が最も上流である異常画像(言い換えると、時系列で最も古い異常画像)を、出血源画像として検出する。ここで、赤みの強い異常領域は、例えば、色比G/Rの値が所定の閾値以下である領域として判別することができる。なお、このときに用いられる色比G/Rの閾値は、ステップS11において異常領域を検出する際に用いた判別基準(色比G/R)よりも厳しく(値を小さく)設定すると良い。
一般に、管腔内において出血が発生した場合、血液は上流(口腔側)から下流(肛門側)に向けて流れる。そのため、赤みの強い異常領域を含む異常画像のうち撮像位置が最も上流である異常画像に出血源が写っているものと推定することができる。
続くステップS214において、代表画像抽出部141は、ステップS213において検出された出血源画像を1枚、代表画像として抽出する。
続くステップS215において、代表画像抽出部141は、当該異常画像群のうち、赤みの強い異常領域を含む異常画像(出血源画像を除く)から、代表画像の抽出枚数nマイナス1枚だけ、代表画像をランダムに抽出する。
続くステップS216において、代表画像抽出部141は、代表画像をn枚抽出できたか否かを判定する。当該異常画像群のうち、赤みの強い異常領域を含む異常画像の枚数がn枚以上である場合、これらの異常画像からトータルでn枚の代表画像を抽出することができる。この場合(ステップS216:Yes)、処理はステップS219に移行する。
一方、当該異常画像群のうち、赤みの強い異常領域を含む異常画像の枚数がn枚に満たない場合、代表画像をn枚抽出できていないことになる。この場合(ステップS216:No)、代表画像抽出部141は、赤みの強い異常領域を含まない残りの異常画像から、トータルの枚数がn枚になるまで代表画像をランダムに抽出する(ステップS217)。その後、処理はステップS219に移行する。
また、ステップS211において、処理対象の異常画像群における同一の異常領域が出血でない場合(ステップS211:No)、代表画像抽出部141は、実施の形態1と同様にして、異常画像群からn枚の代表画像を抽出する(ステップS218)。その後、処理はステップS219に移行する。
ステップS219において、代表画像抽出部141は、抽出したn枚の代表画像の画像データに、代表画像である旨を示す情報(フラグ)を付加する。
ステップS23(図8参照)において抽出された全ての異常画像群に対してループBの処理を実行した後、画像処理装置の動作はメインルーチンに戻る。
以上説明したように、変形例2によれば、異常領域の赤みの強さと各異常画像の管腔内における位置情報とに基づいて、診断において重要度が高い出血源を代表画像として優先的に抽出することができる。
(実施の形態3)
次に、本発明の実施の形態3について説明する。
図13は、本発明の実施の形態3に係る画像処理装置が備える演算部の構成を示すブロック図である。実施の形態3に係る画像処理装置は、図1に示す演算部100の代わりに、図13に示す演算部300を備える。演算部300以外の各部の構成及び動作については、実施の形態1と同様である。
次に、本発明の実施の形態3について説明する。
図13は、本発明の実施の形態3に係る画像処理装置が備える演算部の構成を示すブロック図である。実施の形態3に係る画像処理装置は、図1に示す演算部100の代わりに、図13に示す演算部300を備える。演算部300以外の各部の構成及び動作については、実施の形態1と同様である。
演算部300は、検出部110、位置情報取得部210、大局類似度算出部120、異常分類部310、異常画像群抽出部320、及び代表画像抽出部140を備える。このうち、検出部110、大局類似度算出部120、及び代表画像抽出部140の動作は、実施の形態1と同様である。また、位置情報取得部210の動作は、実施の形態2と同様である。
異常分類部310は、注目領域としての異常領域を、該異常領域における被写体の種類に応じて分類する注目領域分類手段である。詳細には、異常分類部310は、異常領域が一連の管腔内画像において連続的に発生する異常領域であるか否かを判定する連続異常判定部(連続性判定手段)311を備える。連続異常判定部311は、異常領域における被写体が、浮遊する出血や血管異常等の異常である場合、当該異常領域が連続的に発生する異常領域であると判定する。
浮遊する出血や血管異常といった異常の種類は、事前に作成した判別基準を用いて判定することができる。判別基準は、管腔内画像に写った浮遊する出血や血管異常等の異常領域の色特徴量(画素値のR成分、G成分、B成分の値、これらの各色成分の値を基に公知の変換により2次的に算出した値(YCbCr変換により算出した色差、HSI変換により算出した色相、彩度、G/R、B/G等の色比など))や、形状特徴量(HOG、面積、周囲長、フェレ径等の形状情報)や、テクスチャ特徴量(LBP、同時正規行列等)の特徴量分布に基づき、サポートベクターマシン(SVM)等の学習器により作成し、記録部50に記録しておく。
異常画像群抽出部320は、位置情報取得部210が取得した位置情報と、大局類似度算出部120が算出した大局類似度と、異常分類部310による分類結果とに基づいて、同一の異常領域を含む異常画像群を抽出する。
次に、実施の形態3に係る画像処理装置の動作を説明する。図14は、実施の形態3に係る画像処理装置の動作を示すフローチャートである。なお、図14に示すステップS10、S11は、実施の形態1と同様である(図2参照)。
ステップS11に続くステップS31において、位置情報取得部210は、ステップS11において抽出された異常画像の時系列的な位置情報を取得する。具体的には、異常画像Iiの並び順i又は撮像時刻を位置情報として取得する。
続くステップS32において、大局類似度算出部120は、異常画像列において隣接する異常画像間の大局類似度を算出する。大局類似度の算出方法は、実施の形態1と同様である(図4及び図5参照)。或いは、変形例1-1~1-3と同様にして大局類似度を算出しても良い。
続くステップS33において、異常分類部310は、ステップ11において検出された各異常領域を分類する。詳細には、連続異常判定部311は、連続的に発生する異常領域を判定するための判別基準を記録部50から読み出し、処理対象の異常領域について算出された特徴量を判別基準と比較することにより、当該異常領域における被写体の種類を判別し、該被写体の種類に応じて、当該異常領域が連続的に発生する異常領域であるか否かを判定する。具体的には、異常領域における被写体が浮遊する出血や血管異常である場合、当該異常領域は連続的に発生する異常領域であると判定する。
続くステップS34において、異常画像群抽出部320は、ステップS33における分類結果に基づき、ステップS31において取得された位置情報及びステップS32において算出された大局類似度を用いて、同一の異常領域を含む異常画像群を抽出する。
図15は、ステップS34において異常画像群抽出部320が実行する異常画像群の抽出処理を示すフローチャートである。異常画像群抽出部320は、ステップS11において抽出された各異常画像について、ループCの処理を実行する。
まず、ステップS301において、異常画像群抽出部320は、処理対象の異常画像Ij(jは自然数)と、該異常画像Ijに対して異常画像列において隣接する異常画像Ij+n(nは自然数)との間における位置の近接度を表すパラメータsposを算出する。パラメータsposは次式(2)によって与えられる。
spos=(N-n)/N …(2)
式(2)においてNは、並び順の差nを規格化するためのパラメータであり、例えばN=10に設定される。このパラメータsposは、異常画像Ij、Ij+nにそれぞれ写った被写体の管腔内における位置が近いほど(nが小さいほど)、値が大きくなる。
spos=(N-n)/N …(2)
式(2)においてNは、並び順の差nを規格化するためのパラメータであり、例えばN=10に設定される。このパラメータsposは、異常画像Ij、Ij+nにそれぞれ写った被写体の管腔内における位置が近いほど(nが小さいほど)、値が大きくなる。
なお、ステップS31において、位置情報として異常画像Iiの撮像時刻が取得された場合には、式(2)における並び順の差nの代わりに撮像時刻の差を代入し、パラメータNの代わりに撮像時刻の差を規格化するためのパラメータを用いることにより、位置の近接度を表すパラメータを算出する。
続くステップS302において、異常画像群抽出部320は、処理対象の異常画像における異常領域の分類結果(ステップS33参照)に基づいて、大局類似度sglobal及び位置の近接度を表すパラメータsposにそれぞれ与えられる重みw1、w2(w1+w2=1)を決定する。この際、重みw1、w2は、異常画像Ijにおける異常領域が連続的に発生する異常領域であれば、重みw1に対して重みw2が相対的に大きくなるように決定される。一方、異常画像Ijにおける異常領域が連続的に発生する異常領域でなければ、重みw2に対して重みw1が相対的に大きくなるように重みw1、w2が決定される。
続くステップS303において、異常画像群抽出部320は、ステップS302において決定した重みw1、w2を用いて、大局類似度sglobalと位置の近接度を表すパラメータsposとを加味したトータルの判別パラメータstotal1を算出する。トータルの判別パラメータstotal1は、次式(3)によって与えられる。
stotal1=w1・sglobal+w2・spos …(3)
stotal1=w1・sglobal+w2・spos …(3)
続くステップS304において、異常画像群抽出部320は、トータルの判別パラメータstotal1が所定の閾値th3以上であるか否かを判定する。トータルの判別パラメータstotal1が閾値th3以上である場合(ステップS304:Yes)、異常画像群抽出部320は、処理対象の異常画像Ij及びその次に抽出された異常画像Ij+nが同一の異常領域を含むと判定する(ステップS305)。一方、トータルの判別パラメータstotalが閾値th3よりも小さい場合(ステップS304:No)、異常画像群抽出部320は、処理対象の異常画像Ij及びその次に抽出された異常画像Ij+nが同一の異常領域を含まないと判定する(ステップS306)。
全ての異常画像についてループCの処理が終了すると、ステップS307において、異常画像群抽出部320は、同一の異常領域が写っていると判定した異常画像同士を同じ異常画像群として抽出する。その後、画像処理装置の動作はメインルーチンに戻る。
ステップS34に続くステップS14及びS15は、実施の形態1と同様である(図2参照)。
以上説明したように、本発明の実施の形態3によれば、異常画像の時系列的な位置情報及び大局類似度に基づいて同一の異常領域を含む異常画像群を抽出する際に、異常画像における異常領域が連続的に発生する異常領域である否かに応じて、大局類似度と位置情報との重みを変更するので、同一の異常領域を含む異常画像群の抽出精度を向上させることが可能となる。
(変形例3-1)
次に、本発明の実施の形態3の変形例3-1について説明する。
図16は、図13に示す異常分類部310の別の構成例を示すブロック図である。図13に示す演算部300においては、異常分類部310の代わりに、図16に示す異常分類部330を設けても良い。異常分類部330は、異常領域が一連の管腔内画像において散発的に発生する異常領域であるか否かを判定する散発異常判定部(散発性判定手段)331と備える。散発異常判定部331は、異常領域における被写体が、発赤、出血点、アフタ、潰瘍等の異常である場合、当該異常領域は散発的に発生する異常領域であると判定する。
次に、本発明の実施の形態3の変形例3-1について説明する。
図16は、図13に示す異常分類部310の別の構成例を示すブロック図である。図13に示す演算部300においては、異常分類部310の代わりに、図16に示す異常分類部330を設けても良い。異常分類部330は、異常領域が一連の管腔内画像において散発的に発生する異常領域であるか否かを判定する散発異常判定部(散発性判定手段)331と備える。散発異常判定部331は、異常領域における被写体が、発赤、出血点、アフタ、潰瘍等の異常である場合、当該異常領域は散発的に発生する異常領域であると判定する。
発赤、出血点、アフタ、潰瘍といった異常の種類は、事前に作成した判別基準を用いて判定することができる。判別基準は、管腔内画像に写った発赤、出血点、アフタ、潰瘍等の異常領域の色特徴量(画素値のR成分、G成分、B成分の値、これらの各色成分の値を基に公知の変換により2次的に算出した値(YCbCr変換により算出した色差、HSI変換により算出した色相、彩度、G/R、B/G等の色比など))や、形状特徴量(HOG、面積、周囲長、フェレ径等の形状情報)や、テクスチャ特徴量(LBP、同時正規行列等)の特徴量分布に基づき、サポートベクターマシン(SVM)等の学習器により作成し、記録部50に記録しておく。
この場合、図14に示すステップS33においては、異常分類部330が、ステップS11において検出された各異常領域を分類する。詳細には、散発異常判定部331が、散発的に発生する異常領域を判定するための判別基準を記録部50から読み出し、処理対象の異常領域について算出された特徴量を判別基準と比較することにより、当該異常領域における被写体の種類を判別し、該被写体の種類に応じて、異常領域が散発的に発生する異常領域であるか否かを判定する。
また、この場合、図14に示すステップS34において、異常画像群抽出部320は、異常分類部330による分類結果に基づき、ステップS31において取得された位置情報及びステップS32において算出された大局類似度を用いて、同一の異常領域を含む異常画像群を抽出する。
詳細には、図15に示すステップS302において、異常画像群抽出部320は、異常分類部330による異常領域の分類結果に基づき、大局類似度sglobal及び位置の近接度を表すパラメータsposにそれぞれ与えられる重みw1、w2を決定する。この際、重みw1、w2は、異常画像Ijにおける異常領域が散発的に発生する異常領域であれば、重みw2に対して重みw1が相対的に大きくなるように決定される。一方、異常画像Ijにおける異常領域が散発的に発生する異常領域でなければ、重みw1に対して重みw2が相対的に大きくなるように重みw1、w2が決定される。
(変形例3-2)
次に、本発明の実施の形態3の変形例3-2について説明する。
図17は、図13に示す異常分類部310のさらに別の構成例を示すブロック図である。図13に示す演算部300においては、異常分類部310の代わりに、図17に示す異常分類部340を設けても良い。異常分類部340は、連続異常判定部311及び散発異常判定部331を備える。連続異常判定部311の動作は実施の形態3と同様であり、散発異常判定部331の動作は変形例3-1と同様である。
次に、本発明の実施の形態3の変形例3-2について説明する。
図17は、図13に示す異常分類部310のさらに別の構成例を示すブロック図である。図13に示す演算部300においては、異常分類部310の代わりに、図17に示す異常分類部340を設けても良い。異常分類部340は、連続異常判定部311及び散発異常判定部331を備える。連続異常判定部311の動作は実施の形態3と同様であり、散発異常判定部331の動作は変形例3-1と同様である。
この場合、図14に示すステップS33においては、異常分類部340が、ステップS11において検出された各異常領域を分類する。詳細には、連続異常判定部311は、処理対象の異常領域が一連の管腔内画像群において連続的に発生する異常領域であるか否かを判定する。また、散発異常判定部331は、処理対象の異常領域が一連の管腔内画像群において散発的に発生する異常領域であるか否かを判定する。その結果、当該異常領域が、連続的に発生する異常領域と、散発的に発生する異常領域と、それ以外の異常領域とに分類される。
また、この場合、図14に示すステップS34において、異常画像群抽出部320は、異常分類部340による分類結果に基づき、ステップS31において取得された位置情報及びステップS32において算出された大局類似度を用いて、同一の異常領域を含む異常画像群を抽出する。
詳細には、図15に示すステップS302において、異常画像群抽出部320は、異常分類部340による分類結果に基づき、大局類似度sglobal及び位置の近接度を表すパラメータsposにそれぞれ与えられる重みw1、w2を決定する。この際、重みw1、w2は、異常画像Ijにおける異常領域が連続的に発生する異常領域であれば、重みw1に対して重みw2が相対的に大きくなるように決定される。一方、異常画像Ijにおける異常領域が散発的に発生する異常領域であれば、重みw2に対して重みw1が相対的に大きくなるように重みw1、w2が決定される。さらに、異常画像Ijにおける異常領域が連続的に発生する異常領域でもなく、散発的に発生する異常領域でもない場合、重みw1、w2は同程度に決定される。
(実施の形態4)
次に、本発明の実施の形態4について説明する。
図18は、本発明の実施の形態4に係る画像処理装置が備える演算部の構成を示すブロック図である。実施の形態4に係る画像処理装置は、図1に示す演算部100の代わりに、図18に示す演算部400を備える。演算部400以外の各部の構成及び動作については、実施の形態1と同様である。
次に、本発明の実施の形態4について説明する。
図18は、本発明の実施の形態4に係る画像処理装置が備える演算部の構成を示すブロック図である。実施の形態4に係る画像処理装置は、図1に示す演算部100の代わりに、図18に示す演算部400を備える。演算部400以外の各部の構成及び動作については、実施の形態1と同様である。
演算部400は、検出部110、大局類似度算出部120、局所類似度算出部410、異常分類部310、異常画像群抽出部420、及び代表画像抽出部140を備える。このうち、検出部110、大局類似度算出部120、及び代表画像抽出部140の動作は、実施の形態1と同様である(図1参照)。また、異常分類部310の動作は、実施の形態3と同様である。
局所類似度算出部410は、異常画像列で隣接する異常画像間において、異常領域同士の類似度を局所類似度として算出する。
異常画像群抽出部420は、大局類似度算出部120が算出した大局類似度と、局所類似度算出部410が算出した局所類似度と、異常分類部310による分類結果とに基づいて、同一の異常領域を含む異常画像群を抽出する。
次に、実施の形態4に係る画像処理装置の動作について説明する。図19は、実施の形態4に係る画像処理装置の動作を示すフローチャートである。なお、図19に示すステップS10~S12は、実施の形態1と同様である(図2参照)。ステップS12については、変形例1-1~1-3と同様にして大局類似度を算出しても良い。
ステップS12に続くステップS41において、局所類似度算出部410は、異常画像列において隣接する異常画像間の局所類似度を算出する。局所類似度の算出方法は特に限定されない。一例として、SIFT(Scale Invariant Feature Transform)等の公知の手法によって異常画像間における対応点を抽出し、異常領域が2つの異常画像間において対応付いた場合、局所類似度を1.0とする。一方、異常領域が2つの異常画像間において対応付かない場合、局所類似度を0.0とする。
続くステップS42において、異常分類部310は、ステップ11において検出された各異常領域を分類する。即ち、連続異常判定部311が、連続的に発生する異常領域を判定するための判別基準を記録部50から読み出し、該判別基準に基づいて、当該異常領域が連続的に発生する異常領域であるか否かを判定する。
続くステップS43において、異常画像群抽出部420は、ステップS42における分類結果に基づき、ステップS12において算出された大局類似度及びステップS41において算出された局所類似度を用いて、同一の異常領域を含む異常画像群を抽出する。
図20は、ステップS43において異常画像群抽出部420が実行する異常画像群の抽出処理を示すフローチャートである。異常画像群抽出部420は、ステップS11において抽出された各異常画像について、ループDの処理を実行する。
まず、ステップS401において、異常画像群抽出部420は、処理対象の異常画像における異常領域の分類結果(ステップS42参照)に基づいて、大局類似度sglobal及び局所類似度slocalにそれぞれ与えられる重みw3、w4を決定する。重みw3、w4は、当該異常領域が連続的に発生する異常領域であれば、重みw3が相対的に大きくなるように決定される(例えば、w3=1、w4=0等)。一方、当該異常領域が連続的に発生する異常領域でなければ、重みw4が相対的に大きくなるように重みw3、w4が決定される(例えば、w3=0、w4=1等)。
続くステップS402において、異常画像群抽出部420は、ステップS401において決定した重みw3、w4を用いて、大局類似度sglobalと局所類似度slocalとを加味したトータルの判別パラメータstotal2を算出する。トータルの判別パラメータstotal2は、次式(4)によって与えられる。
stotal2=w3・sglobal+w4・slocal …(4)
stotal2=w3・sglobal+w4・slocal …(4)
続くステップS403において、異常画像群抽出部420は、トータルの判別パラメータstotal2が所定の閾値th4以上であるか否かを判定する。トータルの判別パラメータstotal2が閾値th4以上である場合(ステップS403:Yes)、異常画像群抽出部420は、処理対象の異常画像及びその次に抽出された異常画像が同一の異常領域を含むと判定する(ステップS404)。一方、トータルの判別パラメータstotal2が閾値th4よりも小さい場合(ステップS403:No)、異常画像群抽出部420は、処理対象の異常画像及びその次に抽出された異常画像が同一の異常領域を含まないと判定する(ステップS405)。
全ての異常画像についてループDの処理が終了すると、ステップS406において、異常画像群抽出部420は、同一の異常領域が写っていると判定した異常画像同士を同じ異常画像群として抽出する。その後、画像処理装置の動作はメインルーチンに戻る。
ステップS43に続くステップS14及びS15は、実施の形態1と同様である(図2参照)。
以上説明したように、本発明の実施の形態4によれば、異常領域が連続的に発生する異常領域であるか否かに応じて、異常画像の全体的な類似度と、異常領域の局所的な類似度とにそれぞれ与えられる重みを変え、これらのトータルの判別パラメータに基づいて2つの異常画像が同一の異常領域を含むか否かを判断するので、同一の異常領域を含む異常画像群の抽出精度を向上させることが可能となる。
(変形例4-1)
次に、本発明の実施の形態4の変形例4-1について説明する。
図18に示す局所類似度算出部410は、上記実施の形態4において説明した手法の他にも、種々の手法により局所類似度を算出しても良い。
次に、本発明の実施の形態4の変形例4-1について説明する。
図18に示す局所類似度算出部410は、上記実施の形態4において説明した手法の他にも、種々の手法により局所類似度を算出しても良い。
一例として、局所類似度算出部410は、まず、各異常画像に含まれる異常領域の特徴量を算出する。特徴量としては、各異常領域を構成する画素の画素値(輝度値やG成分の値)の平均値又は中央値等の統計量、各異常領域を構成する画素の色特徴量(R成分、G成分、B成分の各値を用いて、YCbCr変換により算出した色差、HSI変換により算出した色相、彩度、G/R、B/G等の色比など)の平均値又は中央値等の統計量、各異常領域の形状特徴量(面積や円形度等)、各異常領域を構成する各画素におけるテクスチャ特徴量(ソーベルフィルタやラプラシアンフィルタ等を用いて算出されるエッジ量等)の平均値又は中央値等の統計量等が挙げられる。
続いて、局所類似度算出部410は、異常画像列で隣接する異常画像間において、上述した特徴量の変化量Δcaを算出する。そして、特徴量の最大値ca(max)及び変化量Δcaを用いて、次式(5)によって与えられる局所類似度slocalを算出する。
slocal=(ca(max)-Δca)/ca(max) …(5)
式(5)において、特徴量の最大値ca(max)は、特徴量が取り得る最大の値である。例えば256階調の異常画像に対し、特徴量として画素値(G成分の値)の統計値を算出した場合、最大値ca(max)は256である。また、特徴量として円形度を算出した場合、最大値ca(max)は1である。
slocal=(ca(max)-Δca)/ca(max) …(5)
式(5)において、特徴量の最大値ca(max)は、特徴量が取り得る最大の値である。例えば256階調の異常画像に対し、特徴量として画素値(G成分の値)の統計値を算出した場合、最大値ca(max)は256である。また、特徴量として円形度を算出した場合、最大値ca(max)は1である。
(変形例4-2)
次に、本発明の実施の形態4の変形例4-2について説明する。
図18に示す演算部400においては、異常分類部310の代わりに、図16に示す散発異常判定部331のみを備える異常分類部330を設け、処理対象の異常領域を、散発的に発生する異常領域であるか否かの2つに分類することとしても良い(変形例3-1参照)。
次に、本発明の実施の形態4の変形例4-2について説明する。
図18に示す演算部400においては、異常分類部310の代わりに、図16に示す散発異常判定部331のみを備える異常分類部330を設け、処理対象の異常領域を、散発的に発生する異常領域であるか否かの2つに分類することとしても良い(変形例3-1参照)。
この場合、図19に示すステップS42においては、異常分類部330が、ステップS11において検出された各異常領域を分類する。即ち、散発異常判定部331が、散発的に発生する異常領域を判定するための判別基準を記録部50から読み出し、該判別基準に基づいて、異常領域が散発的に発生する異常領域であるか否かを判定する。
また、この場合、図19に示すステップS43において、異常画像群抽出部420は、異常分類部330による分類結果に基づき、ステップS12において算出された大局類似度sglobal及びステップS41において算出された局所類似度slocalを用いて、同一の異常領域を含む異常画像群を抽出する。
詳細には、図20に示すステップS401において、異常画像群抽出部420は、異常分類部330による異常領域の分類結果に基づき、大局類似度sglobal及び局所類似度slocalにそれぞれ与えられる重みw3、w4を決定する。重みw3、w4は、当該異常領域が散発的に発生する異常領域であれば、重みw4が相対的に大きくなるように決定される(例えば、w3=0、w4=1等)。一方、当該異常領域が散発的に発生する異常領域でなければ、重みw3が相対的に大きくなるように重みw3、w4が決定される(例えば、w3=1、w4=0等)。
(変形例4-3)
次に、本発明の実施の形態4の変形例4-3について説明する。
図18に示す演算部400においては、異常分類部310の代わりに、図17に示す連続異常判定部311及び散発異常判定部331を備える異常分類部340を設け、処理対処の異常領域を、連続的に発生する異常領域であるか、散発的に発生する異常領域であるか、そのどちらでもないかの3つに分類することとしても良い(変形例3-2参照)。
次に、本発明の実施の形態4の変形例4-3について説明する。
図18に示す演算部400においては、異常分類部310の代わりに、図17に示す連続異常判定部311及び散発異常判定部331を備える異常分類部340を設け、処理対処の異常領域を、連続的に発生する異常領域であるか、散発的に発生する異常領域であるか、そのどちらでもないかの3つに分類することとしても良い(変形例3-2参照)。
この場合、図19に示すステップS42においては、異常分類部340が、ステップS11において検出された各異常領域を分類する。即ち、連続異常判定部311は、処理対象の異常領域が一連の管腔内画像群において連続的に発生する異常領域であるか否かを判定する。また、散発異常判定部331は、処理対象の異常領域が一連の管腔内画像群において散発的に発生する異常領域であるか否かを判定する。
また、この場合、図19に示すステップS43において、異常画像群抽出部420は、異常分類部340による分類結果に基づき、ステップS12において算出された大局類似度sglobal及びステップS41において算出された局所類似度slocalを用いて、同一の異常領域を含む異常画像群を抽出する。
詳細には、図20に示すステップS401において、異常画像群抽出部420は、異常分類部340による分類結果に基づき、大局類似度sglobal及び局所類似度slocalにそれぞれ与えられる重みw3、w4を決定する。重みw3、w4は、異常領域が連続的に発生する異常領域であれば、重みw3が相対的に大きくなるように決定される(例えば、w3=1、w4=0等)。また、異常領域が散発的に発生する異常領域であれば、重みw4が相対的に大きくなるように重みw3、w4が決定される(例えば、w3=0、w4=1等)。さらに、異常領域が、連続的に発生する異常領域でもなく、散発的に発生する異常領域でもない場合、重みw3、w4は、同程度の値に決定される(例えば、w3=0.5、w4=0.5等)。
(実施の形態5)
次に、本発明の実施の形態5について説明する。
図21は、本発明の実施の形態5に係る画像処理装置が備える演算部の構成を示すブロック図である。実施の形態5に係る画像処理装置は、図1に示す演算部100の代わりに、図21に備える演算部500を備える。演算部500以外の各部の構成及び動作については、実施の形態1と同様である。
次に、本発明の実施の形態5について説明する。
図21は、本発明の実施の形態5に係る画像処理装置が備える演算部の構成を示すブロック図である。実施の形態5に係る画像処理装置は、図1に示す演算部100の代わりに、図21に備える演算部500を備える。演算部500以外の各部の構成及び動作については、実施の形態1と同様である。
演算部500は、検出部110、位置情報取得部210、大局類似度算出部120、局所類似度算出部410、異常分類部340、異常画像群抽出部510、及び代表画像抽出部140を備える。このうち、検出部110、大局類似度算出部120、及び代表画像抽出部140の動作は、実施の形態1と同様である(図1参照)。位置情報取得部210の動作は、実施の形態2(図7参照)と同様である。局所類似度算出部410の動作は、実施の形態4又は変形例4-1(図18参照)と同様である。異常分類部340の動作は、変形例3-2(図17参照)と同様である。
異常画像群抽出部510は、位置情報取得部210が取得した位置情報と、大局類似度算出部120が算出した大局類似度と、局所類似度算出部410が算出した局所類似度と、異常分類部340による分類結果とに基づいて、同一の異常領域を含む異常画像群を抽出する。
次に、実施の形態5に係る画像処理装置の動作について説明する。図22は、実施の形態5に係る画像処理装置の動作を示すフローチャートである。なお、図14に示すステップS10及びS11は、実施の形態1と同様である(図2参照)。
ステップS11に続くステップS51において、位置情報取得部210は、ステップS11において抽出された異常画像の時系列的な位置情報として、異常画像Iiの撮像時刻又は並び順iを取得する。
続くステップS52において、大局類似度算出部120は、異常画像列において隣接する異常画像間の大局類似度sglobalを算出する。大局類似度sglobalの算出方法は、実施の形態1と同様である(図4及び図5参照)。或いは、変形例1-1~1-3と同様にして大局類似度sglobalを算出しても良い。
続くステップS53において、局所類似度算出部410は、異常画像列において隣接する異常画像間の局所類似度slocalを算出する。局所類似度slocalの算出方法は、実施の形態4又は変形例4-1と同様である(図19のステップS41参照)。
続くステップS54において、異常分類部340は、ステップ11において検出された各異常領域を分類する。異常領域の分類方法は、変形例3-2と同様である。その結果、各異常領域が、連続的に発生する異常領域と、散発的に発生する異常領域と、それ以外の異常領域とに分類される。
続くステップS55において、異常画像群抽出部510は、ステップS54における分類結果に基づき、ステップS51において取得された位置情報と、ステップS52において算出された大局類似度sglobalと、ステップS53において算出された局所類似度slocalとに基づいて、同一の異常領域を含む異常画像群を抽出する。
図23は、ステップS55において異常画像群抽出部510が実行する異常画像群の抽出処理を示すフローチャートである。異常画像群抽出部510は、ステップS11において抽出された各異常画像について、ループEの処理を実行する。
まず、ステップS501において、異常画像群抽出部510は、処理対象の異常画像Ik(kは自然数)に対し、異常画像列で隣接する異常画像Ik’(k’はk<k’の自然数)との間における撮像時刻T(Ik)、T(Ik’)の差分ΔT(=T(Ik’)-T(Ik))、即ち経過時間を算出する。
続くステップS502において、異常画像群抽出部510は、異常画像Ikにおける異常領域の分類結果(ステップS54参照)が連続的であるか否かを判定する。
上記分類結果が連続的である場合(ステップS502:Yes)、異常画像群抽出部510は、撮像時刻の差分ΔTが所定の閾値th5以下であるか否かを判定する(ステップS503)。
撮像時刻の差分ΔTが閾値th5以下である場合(ステップS503:Yes)、続いて、異常画像群抽出部510は、異常画像Ik、Ik’間の大局類似度sglobalが所定の閾値th6以上であるか否かを判定する(ステップS504)。
大局類似度sglobalが閾値th6以上である場合(ステップS504:Yes)、異常画像群抽出部510は、処理対象の異常画像Ik及びその次に抽出された異常画像Ik’が同一の異常領域を含むと判定する(ステップS505)。
一方、ステップS503において、撮像時刻の差分ΔTが閾値th5よりも大きい場合(ステップS503:No)、又は、ステップS504において、大局類似度sglobalが閾値th6よりも小さい場合(ステップS504:No)、異常画像群抽出部510は、処理対象の異常画像Ik及びその次に抽出された異常画像Ik’は同一の異常領域を含まないと判定する(ステップS506)。
ステップS502において、分類結果が連続的でない場合(ステップS502:No)、続いて、異常画像群抽出部510は、当該分類結果が散発的であるか否かを判定する(ステップS507)。
上記分類結果が散発的である場合(ステップS507:Yes)、異常画像群抽出部510は、撮像時刻の差分ΔTが所定の閾値th7以下であるか否かを判定する(ステップS508)。ここで、散発的に発生する異常領域の場合、一連の時系列画像において、同一の異常領域が飛び飛びに写っている可能性がある。そのため、閾値th7は、ステップS503における閾値th5よりも長めに設定されている。
撮像時刻の差分ΔTが閾値th7以下である場合(ステップS508:Yes)、続いて、異常画像群抽出部510は、異常画像Ik、Ik’間の局所類似度slocalが所定の閾値th8以上であるか否かを判定する(ステップS509)。
局所類似度slocalが閾値th8以上である場合(ステップS509:Yes)、異常画像群抽出部510は、処理対象の異常画像Ik及びその次に抽出された異常画像Ik’が同一の異常領域を含むと判定する(ステップS505)。
一方、ステップS508において、撮像時刻の差分ΔTが閾値th7よりも大きい場合(ステップS508:No)、又は、ステップS509において、局所類似度slocalが閾値th8よりも小さい場合(ステップS509:No)、異常画像群抽出部510は、処理対象の異常画像Ik及びその次に抽出された異常画像Ik’は同一の異常領域を含まないと判定する(ステップS506)。
ステップS507において、分類結果が散発的でない場合(ステップS507:No)、続いて、異常画像群抽出部510は、撮像時刻の差分ΔTが所定の閾値th9以下であるか否かを判定する(ステップS510)。ここで、異常領域が連続的に発生する異常領域でもなく、散発的に発生する異常領域でもない場合、閾値th9は、ステップS503における閾値th5と、ステップS508における閾値th7との間の値に設定される。
撮像時刻の差分ΔTが閾値th9以下である場合(ステップS510:Yes)、続いて、異常画像群抽出部510は、異常画像Ik、Ik’間の大局類似度sglobalが所定の閾値th6以上であり、且つ、局所類似度slocalが所定の閾値th8以上であるか否かを判定する(ステップS511)。
大局類似度sglobalが所定の閾値th6以上であり、且つ、局所類似度slocalが所定の閾値th8以上である場合(ステップS511:Yes)、異常画像群抽出部510は、処理対象の異常画像Ik及びその次に抽出された異常画像Ik’は同一の異常領域を含むと判定する(ステップS505)。
一方、ステップS510において、撮像時刻の差分ΔTが閾値th9よりも大きい場合(ステップS510:No)、又は、ステップS511において、大局類似度sglobalが閾値th6よりも小さい、若しくは、局所類似度slocalが閾値th8よりも小さい場合(ステップS511:No)、異常画像群抽出部510は、処理対象の異常画像Ik及びその次に抽出された異常画像Ik’は同一の異常領域を含まないと判定する(ステップS506)。
全ての異常画像についてループEの処理が終了すると、ステップS512において、異常画像群抽出部510は、同一の異常領域が写っていると判定した異常画像同士を同じ異常画像群として抽出する。その後、画像処理装置の動作はメインルーチンに戻る。
ステップS55に続くステップS14及びS15は、実施の形態1と同様である(図2参照)。
以上説明したように、本発明の実施の形態5によれば、異常領域における被写体の種類に応じて、撮像時刻の差分ΔTを判定する際の閾値を変化させると共に、異常画像間の類似の判定に用いる類似度(大局類似度sglobal、局所類似度slocal)を切り替えるので、同一の異常領域を含む異常画像群の抽出精度を向上させることが可能となる。
なお、本実施の形態5において、連続異常判定部311及び散発異常判定部331が異常領域の判定を行う際にそれぞれ用いる判別基準を調整することにより、全ての異常領域を、連続的に発生する異常領域と散発的に発生する異常領域とのうちのいずれかに分類することとしても良い。この場合、上記ステップS510、S511は省略される。
(変形例5-1)
次に、本発明の実施の形態5の変形例5-1について説明する。
図21に示す演算部500においては、異常分類部340の代わりに、図13に示す連続異常判定部311のみを備える異常分類部310を設け、処理対象の異常領域を、連続的に発生する異常領域であるか否かの2つに分類することとしても良い(実施の形態3参照)。この場合、図23に示すステップS502においては、処理対象の異常領域が連続的に発生する異常領域でない場合(ステップS502:No)、散発的に発生する異常領域とみなし、処理は直接ステップS508に移行する。また、この場合、ステップS510、S511は省略される。
次に、本発明の実施の形態5の変形例5-1について説明する。
図21に示す演算部500においては、異常分類部340の代わりに、図13に示す連続異常判定部311のみを備える異常分類部310を設け、処理対象の異常領域を、連続的に発生する異常領域であるか否かの2つに分類することとしても良い(実施の形態3参照)。この場合、図23に示すステップS502においては、処理対象の異常領域が連続的に発生する異常領域でない場合(ステップS502:No)、散発的に発生する異常領域とみなし、処理は直接ステップS508に移行する。また、この場合、ステップS510、S511は省略される。
(変形例5-2)
次に、本発明の実施の形態5の変形例5-2について説明する。
図21に示す演算部500においては、異常分類部340の代わりに、図16に示す散発異常判定部331のみを備える異常分類部330を設け、処理対象の異常領域を、散発的に発生する異常領域であるか否かの2つに分類することとしても良い(変形例3-1参照)。この場合、図23に示すステップS501の後、処理は直接ステップS507に移行する。そして、ステップS507において、処理対処の異常領域が散発的に発生する異常領域でない場合(ステップS507:No)、連続的に発生する異常領域とみなし、処理はステップS503に移行する。また、この場合、ステップS510、S511は省略される。
次に、本発明の実施の形態5の変形例5-2について説明する。
図21に示す演算部500においては、異常分類部340の代わりに、図16に示す散発異常判定部331のみを備える異常分類部330を設け、処理対象の異常領域を、散発的に発生する異常領域であるか否かの2つに分類することとしても良い(変形例3-1参照)。この場合、図23に示すステップS501の後、処理は直接ステップS507に移行する。そして、ステップS507において、処理対処の異常領域が散発的に発生する異常領域でない場合(ステップS507:No)、連続的に発生する異常領域とみなし、処理はステップS503に移行する。また、この場合、ステップS510、S511は省略される。
(変形例5-3)
次に、本発明の実施の形態5の変形例5-3について説明する。
図22に示すステップS55において、異常画像群抽出部510は、位置情報、大局類似度、及び局所類似度を用いたトータルの判別パラメータに基づいて、同一の異常領域を含む異常画像群を抽出しても良い。
次に、本発明の実施の形態5の変形例5-3について説明する。
図22に示すステップS55において、異常画像群抽出部510は、位置情報、大局類似度、及び局所類似度を用いたトータルの判別パラメータに基づいて、同一の異常領域を含む異常画像群を抽出しても良い。
図24は、変形例5-3において異常画像群抽出部510が実行する異常画像群の抽出処理を示すフローチャートである。異常画像群抽出部510は、ステップS11において抽出された各異常画像について、ループFの処理を実行する。
まず、ステップS521において、異常画像群抽出部510は、処理対象の異常画像Ij(jは自然数)と、該異常画像Ijに対し、異常画像列において隣接する異常画像Ij+n(nは自然数)との間における位置の近接度を表すパラメータspos(spos=(N-n)/N)を算出する。なお、ステップS51において、位置情報として異常画像Iiの撮像時刻が取得された場合には、撮像時刻の差に基づいて位置の近接度を表すパラメータを算出しても良い。
続くステップS522において、異常画像群抽出部510は、処理対象の異常画像における異常領域の分類結果(ステップS54参照)に基づいて、大局類似度sglobal、局所類似度slocal、及び位置の近接度を表すパラメータsposにそれぞれ与えられる重みw5、w6、w7(w5+w6+w7=1)を決定する。
重みw5、w6、w7は、異常画像Ijにおける異常領域が連続的に発生する異常領域であれば、重みw7が相対的に大きくなり、重みw5、w6の間では、重みw5が相対的に大きくなるように設定される。一方、当該異常領域が散発的に発生する異常領域であれば、重みw7が相対的に小さくなり、重みw5、w6の間では、重みw6が相対的に大きくなるように設定される。
続くステップS523において、異常画像群抽出部510は、ステップS522において決定した重みw5、w6、w7を用いて、大局類似度sglobalと局所類似度slocalと位置の近接度を表すパラメータsposとを加味したトータルの判別パラメータstotal3を算出する。トータルの判別パラメータstotal3は、次式(6)によって与えられる。
stotal3=w5・sglobal+w6・slocal+w7・spos …(6)
stotal3=w5・sglobal+w6・slocal+w7・spos …(6)
続くステップS524において、異常画像群抽出部510は、トータルの判別パラメータstotal3が所定の閾値th10以上であるか否かを判定する。トータルの判別パラメータstotal3が閾値th10以上である場合(ステップS524:Yes)、異常画像群抽出部510は、処理対象の異常画像Ij及びその次に抽出された異常画像Ij+nが同一の異常領域を含むと判定する(ステップS525)。一方、トータルの判別パラメータstotal3が閾値th10よりも小さい場合(ステップS524:No)、異常画像群抽出部510は、処理対象の異常画像Ij及びその次に抽出された異常画像Ij+nが同一の異常領域を含まないと判定する(ステップS526)。
全ての異常画像についてループFの処理が終了すると、ステップS527において、異常画像群抽出部510は、同一の異常領域が写っていると判定した異常画像同士を同じ異常画像群として抽出する。その後、画像処理装置の動作はメインルーチンに戻る。
以上説明した実施の形態1~5及びこれらの変形例においては、異なる異常画像間で大局類似度又は該大局類似度に基づく判別パラメータが所定の閾値以上の場合に、これらの異常画像が同一の異常領域を含むと判定する構成としたが、大局類似度又は判別パラメータの算出方法によっては、大局類似度又は判別パラメータが所定の閾値以下の場合に同一の異常領域を含むと判定する構成としても良い。
以上説明した実施の形態1~5及びこれらの変形例に係る画像処理装置は、記録媒体に記録された画像処理プログラムをパーソナルコンピュータやワークステーション等のコンピュータシステムで実行することによって実現することができる。また、このようなコンピュータシステムを、ローカルエリアネットワーク(LAN)、広域エリアネットワーク(WAN)、又は、インターネット等の公衆回線を介して、他のコンピュータシステムやサーバ等の機器に接続して使用しても良い。この場合、実施の形態1~5及びこれらの変形例に係る画像処理装置は、これらのネットワークを介して管腔内画像の画像データを取得したり、これらのネットワークを介して接続された種々の出力機器(ビュアーやプリンタ等)に画像処理結果を出力したり、これらのネットワークを介して接続された記憶装置(記録媒体及びその読取装置等)に画像処理結果を格納するようにしても良い。
なお、本発明は、実施の形態1~5及びこれらの変形例に限定されるものではなく、各実施の形態や変形例に開示されている複数の構成要素を適宜組み合わせることによって、種々の発明を形成できる。例えば、各実施の形態や変形例に示される全構成要素からいくつかの構成要素を除外して形成しても良いし、異なる実施の形態や変形例に示した構成要素を適宜組み合わせて形成しても良い。
1 画像処理装置
10 制御部
20 画像取得部
30 入力部
40 表示部
50 記録部
51 画像処理プログラム
100、200、250、300、400、500 演算部
110 検出部
120 大局類似度算出部
130、220、320、420、510 異常画像群抽出部
140、141 代表画像抽出部
210 位置情報取得部
310、330、340 異常分類部
311 連続異常判定部
331 散発異常判定部
410 局所類似度算出部
10 制御部
20 画像取得部
30 入力部
40 表示部
50 記録部
51 画像処理プログラム
100、200、250、300、400、500 演算部
110 検出部
120 大局類似度算出部
130、220、320、420、510 異常画像群抽出部
140、141 代表画像抽出部
210 位置情報取得部
310、330、340 異常分類部
311 連続異常判定部
331 散発異常判定部
410 局所類似度算出部
Claims (20)
- 生体の管腔内を順次撮像することにより取得された一連の画像群から、検出対象として推定される領域である注目領域を含む注目画像を検出する検出手段と、
異なる注目画像間において、少なくとも前記注目領域以外の領域を含む領域同士における類似度である大局類似度を算出する大局類似度算出手段と、
前記大局類似度又は該大局類似度に基づく判別パラメータと閾値との比較に基づいて、同一の注目領域を含む注目画像群を抽出する注目画像群抽出手段と、
前記注目画像群から代表画像を抽出する代表画像抽出手段と、
を備えることを特徴とする画像処理装置。 - 前記大局類似度算出手段は、前記注目画像から背景領域を抽出し、前記異なる注目画像間において、前記背景領域同士の類似度を算出する、ことを特徴とする請求項1に記載の画像処理装置。
- 前記大局類似度算出手段は、前記背景領域として、前記注目画像から前記注目領域を除く領域を抽出する、ことを特徴とする請求項2に記載の画像処理装置。
- 前記大局類似度算出手段は、前記背景領域として、前記注目画像から粘膜が写った領域を抽出する、ことを特徴とする請求項2に記載の画像処理装置。
- 前記異なる注目画像間において、前記注目領域同士の類似度である局所類似度を算出する局所類似度算出手段をさらに備え、
前記注目画像群抽出手段は、前記大局類似度及び前記局所類似度に基づいて、前記同一の注目領域を含む注目画像群を抽出する、
ことを特徴とする請求項1に記載の画像処理装置。 - 前記局所類似度算出手段は、前記注目領域同士の対応付けを行い、該対応付けの結果に基づいて前記局所類似度を算出する、ことを特徴とする請求項5に記載の画像処理装置。
- 前記注目領域を、該注目領域における被写体の種類に応じて分類する注目領域分類手段をさらに備え、
前記判別パラメータは、前記大局類似度と前記局所類似度とを重み付け加算することにより与えられ、
前記注目画像群抽出手段は、前記大局類似度と前記局所類似度とにそれぞれ与えられる重みを前記注目領域分類手段による分類結果に応じて変化させて、前記注目画像群を抽出する、
ことを特徴とする請求項5に記載の画像処理装置。 - 前記注目画像群抽出手段は、前記判別パラメータが前記閾値以上である注目画像同士を、前記同一の注目領域を含む注目画像群として抽出する、ことを特徴とする請求項7に記載の画像処理装置。
- 前記注目領域分類手段は、前記注目領域が前記一連の画像群において散発的に発生する注目領域であるか否かを判定する散発性判定手段を備え、
前記注目画像群抽出手段は、前記注目領域が前記散発的に発生する注目領域である場合、前記局所類似度に対する重みを前記大局類似度に対する重みよりも大きくする、
ことを特徴とする請求項7又は8に記載の画像処理装置。 - 前記注目領域分類手段は、前記注目領域が前記一連の画像群において連続的に発生する注目領域であるか否かを判定する連続性判定手段を備え、
前記注目画像群抽出手段は、前記注目領域が前記連続的に発生する注目領域である場合、前記大局類似度に対する重みを前記局所類似度に対する重みよりも大きくする、
ことを特徴とする請求項7又は8に記載の画像処理装置。 - 前記一連の画像群における前記注目画像の撮像順序に対応する時系列的な位置情報を取得する位置情報取得手段をさらに備え、
前記注目画像群抽出手段は、前記大局類似度及び前記位置情報に基づいて、前記同一の注目領域を含む注目画像群を抽出する、
ことを特徴とする請求項1に記載の画像処理装置。 - 前記注目領域を分類する注目領域分類手段をさらに備え、
前記判別パラメータは、前記大局類似度と、前記位置情報に基づく前記異なる注目画像間の近接度を表すパラメータとを重み付け加算することにより与えられ、
前記注目画像群抽出手段は、前記大局類似度と前記近接度を表すパラメータとにそれぞれ与えられる重みを、前記注目領域分類手段による分類結果に応じて変化させて、前記抽出画像群を抽出する、
ことを特徴とする請求項11に記載の画像処理装置。 - 前記近接度を表すパラメータは、値が大きいほど前記異なる注目画像間が近接していることを示し、
前記注目画像群抽出手段は、前記判別パラメータが前記閾値以上である注目画像同士を、前記同一の注目領域を含む注目画像群として抽出する、
ことを特徴とする請求項12に記載の画像処理装置。 - 前記注目領域分類手段は、前記注目領域が前記一連の画像群において散発的に発生する注目領域であるか否かを判定する散発性判定手段を備え、
前記注目画像群抽出手段は、前記注目領域が前記散発的に発生する注目領域である場合、前記大局類似度に対する重みを前記近接度を表すパラメータに対する重みよりも大きくする、
ことを特徴とする請求項12又は13に記載の画像処理装置。 - 前記注目領域分類手段は、前記注目領域が前記一連の画像群において連続的に発生する注目領域であるか否かを判定する連続性判定手段を備え、
前記注目画像群抽出手段は、前記注目領域が前記連続的に発生する注目領域である場合、前記近接度を表すパラメータに対する重みを前記大局類似度に対する重みよりも大きくする、
ことを特徴とする請求項12又は13に記載の画像処理装置。 - 前記散発性判定手段は、前記注目領域における被写体が、発赤と、出血点と、潰瘍とのうちのいずれかである場合、前記注目領域が前記散発的に発生する注目領域であると判定する、ことを特徴とする請求項9又は14に記載の画像処理装置。
- 前記連続性判定手段は、前記注目領域における被写体が、浮遊する出血と、血管異常とのうちのいずれかである場合、前記注目領域が前記連続的に発生する注目領域であると判定する、ことを特徴とする請求項10又は15に記載の画像処理装置。
- 前記注目画像群抽出手段は、前記大局類似度が前記閾値以上である注目画像同士を、前記同一の注目領域を含む注目画像群として抽出する、ことを特徴とする請求項1に記載の画像処理装置。
- 生体の管腔内を順次撮像することにより取得され、記録部に記録された一連の画像群の画像データに基づいて、コンピュータが備える演算部に実行させる画像処理方法において、
前記一連の画像群から、注目領域を含む注目画像を検出する検出ステップと、
異なる注目画像間において、少なくとも前記注目領域以外の領域を含む領域同士における類似度である大局類似度を算出する大局類似度算出ステップと、
前記大局類似度又は該大局類似度に基づく判別パラメータと閾値との比較に基づいて、同一の注目領域を含む注目画像群を抽出する注目画像群抽出ステップと、
前記注目画像群から代表画像を抽出する代表画像抽出ステップと、
を含むことを特徴とする画像処理方法。 - 生体の管腔内を順次撮像することにより取得された一連の画像群から、注目領域を含む注目画像を検出する検出ステップと、
異なる注目画像間において、少なくとも前記注目領域以外の領域を含む領域同士における類似度である大局類似度を算出する大局類似度算出ステップと、
前記大局類似度又は該大局類似度に基づく判別パラメータと閾値との比較に基づいて、同一の注目領域を含む注目画像群を抽出する注目画像群抽出ステップと、
前記注目画像群から代表画像を抽出する代表画像抽出ステップと、
をコンピュータに実行させることを特徴とする画像処理プログラム。
Priority Applications (3)
| Application Number | Priority Date | Filing Date | Title |
|---|---|---|---|
| DE112015000972.8T DE112015000972T5 (de) | 2014-03-17 | 2015-02-02 | Bildverarbeitungsgerät, Bildverarbeitungsverfahren und Bildverarbeitungsprogramm |
| CN201580014177.XA CN106132266A (zh) | 2014-03-17 | 2015-02-02 | 图像处理装置、图像处理方法以及图像处理程序 |
| US15/267,544 US9959618B2 (en) | 2014-03-17 | 2016-09-16 | Image processing apparatus, image processing method, and computer-readable recording medium |
Applications Claiming Priority (2)
| Application Number | Priority Date | Filing Date | Title |
|---|---|---|---|
| JP2014-054126 | 2014-03-17 | ||
| JP2014054126A JP6196922B2 (ja) | 2014-03-17 | 2014-03-17 | 画像処理装置、画像処理方法、及び画像処理プログラム |
Related Child Applications (1)
| Application Number | Title | Priority Date | Filing Date |
|---|---|---|---|
| US15/267,544 Continuation US9959618B2 (en) | 2014-03-17 | 2016-09-16 | Image processing apparatus, image processing method, and computer-readable recording medium |
Publications (1)
| Publication Number | Publication Date |
|---|---|
| WO2015141302A1 true WO2015141302A1 (ja) | 2015-09-24 |
Family
ID=54144282
Family Applications (1)
| Application Number | Title | Priority Date | Filing Date |
|---|---|---|---|
| PCT/JP2015/052870 Ceased WO2015141302A1 (ja) | 2014-03-17 | 2015-02-02 | 画像処理装置、画像処理方法、及び画像処理プログラム |
Country Status (5)
| Country | Link |
|---|---|
| US (1) | US9959618B2 (ja) |
| JP (1) | JP6196922B2 (ja) |
| CN (1) | CN106132266A (ja) |
| DE (1) | DE112015000972T5 (ja) |
| WO (1) | WO2015141302A1 (ja) |
Cited By (2)
| Publication number | Priority date | Publication date | Assignee | Title |
|---|---|---|---|---|
| CN109475278A (zh) * | 2016-07-25 | 2019-03-15 | 奥林巴斯株式会社 | 图像处理装置、图像处理方法和程序 |
| CN113674270A (zh) * | 2021-09-06 | 2021-11-19 | 深邦智能科技(青岛)有限公司 | 一种轮胎花纹一致性检测系统及其方法 |
Families Citing this family (20)
| Publication number | Priority date | Publication date | Assignee | Title |
|---|---|---|---|---|
| JP6339872B2 (ja) * | 2014-06-24 | 2018-06-06 | オリンパス株式会社 | 画像処理装置、内視鏡システム及び画像処理方法 |
| CN105992546B (zh) | 2015-01-21 | 2018-08-28 | Hoya株式会社 | 内窥镜系统 |
| US9576219B2 (en) * | 2015-07-14 | 2017-02-21 | ADANI Systems, Inc. | Method and system for detection of contraband narcotics in human digestive tract |
| JP6850225B2 (ja) * | 2017-09-01 | 2021-03-31 | 富士フイルム株式会社 | 医療画像処理装置、内視鏡装置、診断支援装置、及び、医療業務支援装置 |
| KR20190046530A (ko) * | 2017-10-26 | 2019-05-07 | 아주대학교산학협력단 | 캡슐내시경의 위치 추적 방법 및 장치 |
| US11026585B2 (en) * | 2018-06-05 | 2021-06-08 | Synaptive Medical Inc. | System and method for intraoperative video processing |
| JP7045453B2 (ja) * | 2018-06-19 | 2022-03-31 | オリンパス株式会社 | 内視鏡画像処理装置、内視鏡画像処理装置の作動方法およびプログラム |
| CN112584738B (zh) * | 2018-08-30 | 2024-04-23 | 奥林巴斯株式会社 | 记录装置、图像观察装置、观察系统、观察系统的控制方法及存储介质 |
| CN109977194B (zh) * | 2019-03-20 | 2021-08-10 | 华南理工大学 | 基于无监督学习的文本相似度计算方法、系统、设备及介质 |
| GB201906103D0 (en) * | 2019-05-01 | 2019-06-12 | Cambridge Entpr Ltd | Method and apparatus for analysing intracoronary images |
| JP6879520B2 (ja) * | 2019-08-28 | 2021-06-02 | サイバネットシステム株式会社 | 画像処理装置及び画像処理方法 |
| CN114521122A (zh) * | 2019-09-27 | 2022-05-20 | 富士胶片株式会社 | 图像处理装置、内窥镜系统及图像处理的工作方法 |
| CN110891129A (zh) * | 2019-11-13 | 2020-03-17 | 上海华力集成电路制造有限公司 | 扫描式电子显微镜晶圆照片拍摄方法及拍摄系统 |
| WO2021199152A1 (ja) | 2020-03-30 | 2021-10-07 | 日本電気株式会社 | 情報処理装置、表示方法、及びプログラムが格納された非一時的なコンピュータ可読媒体 |
| EP4129151A4 (en) * | 2020-03-31 | 2023-12-13 | NEC Corporation | Information processing device, display method, and non-transitory computer-readable medium having program stored therein |
| WO2022059668A1 (ja) * | 2020-09-15 | 2022-03-24 | 富士フイルム株式会社 | 医用画像処理装置及び医用画像処理装置の作動方法並びに医用画像処理装置用プログラム |
| CN113298724B (zh) * | 2020-12-31 | 2024-09-06 | 深圳北芯生命科技股份有限公司 | 图像处理方法 |
| US11138734B1 (en) | 2021-02-19 | 2021-10-05 | Vr Media Technology, Inc. | Hyperspectral facial analysis system and method for personalized health scoring |
| WO2023175916A1 (ja) * | 2022-03-18 | 2023-09-21 | オリンパスメディカルシステムズ株式会社 | 医療支援システムおよび画像表示方法 |
| JP2024154762A (ja) * | 2023-04-19 | 2024-10-31 | ラピステクノロジー株式会社 | 画像処理装置及び撮像装置 |
Citations (4)
| Publication number | Priority date | Publication date | Assignee | Title |
|---|---|---|---|---|
| WO2006100808A1 (ja) * | 2005-03-22 | 2006-09-28 | Osaka University | カプセル内視鏡画像表示制御装置 |
| JP2006320650A (ja) * | 2005-05-20 | 2006-11-30 | Olympus Medical Systems Corp | 画像表示装置 |
| JP2010158308A (ja) * | 2009-01-06 | 2010-07-22 | Olympus Corp | 画像処理装置、画像処理方法および画像処理プログラム |
| JP2011024727A (ja) * | 2009-07-23 | 2011-02-10 | Olympus Corp | 画像処理装置、画像処理プログラムおよび画像処理方法 |
Family Cites Families (12)
| Publication number | Priority date | Publication date | Assignee | Title |
|---|---|---|---|---|
| AU2003270687B2 (en) * | 2002-09-13 | 2008-05-08 | Life Technologies Corporation | Interactive and automated tissue image analysis with global training database and variable-abstraction processing in cytological specimen classification and laser capture microdissection applications |
| CN101421745B (zh) * | 2004-04-15 | 2016-05-11 | 美国医软科技公司 | 空间-时间肿瘤检测,分割和诊断信息提取系统及方法 |
| US7756309B2 (en) * | 2005-07-27 | 2010-07-13 | Bioimagene, Inc. | Method and system for storing, indexing and searching medical images using anatomical structures of interest |
| JP5281826B2 (ja) * | 2008-06-05 | 2013-09-04 | オリンパス株式会社 | 画像処理装置、画像処理プログラムおよび画像処理方法 |
| JP5374078B2 (ja) * | 2008-06-16 | 2013-12-25 | オリンパス株式会社 | 画像処理装置、画像処理方法および画像処理プログラム |
| JP5374135B2 (ja) * | 2008-12-16 | 2013-12-25 | オリンパス株式会社 | 画像処理装置、画像処理装置の作動方法および画像処理プログラム |
| JP5492480B2 (ja) * | 2009-07-13 | 2014-05-14 | 日立アプライアンス株式会社 | モータ制御装置並びにこれを備えた氷破砕機,給水機及び冷蔵庫 |
| JP5959168B2 (ja) * | 2011-08-31 | 2016-08-02 | オリンパス株式会社 | 画像処理装置、画像処理装置の作動方法、及び画像処理プログラム |
| US8891881B2 (en) * | 2012-01-25 | 2014-11-18 | General Electric Company | System and method for identifying an optimal image frame for ultrasound imaging |
| JP5963480B2 (ja) * | 2012-03-08 | 2016-08-03 | オリンパス株式会社 | 画像要約装置及びプログラム |
| EP2823749A4 (en) * | 2012-03-08 | 2016-07-20 | Olympus Corp | Image processing device, program and image processing method |
| JP6371544B2 (ja) * | 2014-03-14 | 2018-08-08 | オリンパス株式会社 | 画像処理装置、画像処理方法、及び画像処理プログラム |
-
2014
- 2014-03-17 JP JP2014054126A patent/JP6196922B2/ja active Active
-
2015
- 2015-02-02 CN CN201580014177.XA patent/CN106132266A/zh active Pending
- 2015-02-02 WO PCT/JP2015/052870 patent/WO2015141302A1/ja not_active Ceased
- 2015-02-02 DE DE112015000972.8T patent/DE112015000972T5/de not_active Withdrawn
-
2016
- 2016-09-16 US US15/267,544 patent/US9959618B2/en active Active
Patent Citations (4)
| Publication number | Priority date | Publication date | Assignee | Title |
|---|---|---|---|---|
| WO2006100808A1 (ja) * | 2005-03-22 | 2006-09-28 | Osaka University | カプセル内視鏡画像表示制御装置 |
| JP2006320650A (ja) * | 2005-05-20 | 2006-11-30 | Olympus Medical Systems Corp | 画像表示装置 |
| JP2010158308A (ja) * | 2009-01-06 | 2010-07-22 | Olympus Corp | 画像処理装置、画像処理方法および画像処理プログラム |
| JP2011024727A (ja) * | 2009-07-23 | 2011-02-10 | Olympus Corp | 画像処理装置、画像処理プログラムおよび画像処理方法 |
Cited By (3)
| Publication number | Priority date | Publication date | Assignee | Title |
|---|---|---|---|---|
| CN109475278A (zh) * | 2016-07-25 | 2019-03-15 | 奥林巴斯株式会社 | 图像处理装置、图像处理方法和程序 |
| CN113674270A (zh) * | 2021-09-06 | 2021-11-19 | 深邦智能科技(青岛)有限公司 | 一种轮胎花纹一致性检测系统及其方法 |
| CN113674270B (zh) * | 2021-09-06 | 2023-11-14 | 深邦智能科技集团(青岛)有限公司 | 一种轮胎花纹一致性检测系统及其方法 |
Also Published As
| Publication number | Publication date |
|---|---|
| US20170004620A1 (en) | 2017-01-05 |
| JP6196922B2 (ja) | 2017-09-13 |
| CN106132266A (zh) | 2016-11-16 |
| DE112015000972T5 (de) | 2016-12-29 |
| US9959618B2 (en) | 2018-05-01 |
| JP2015173921A (ja) | 2015-10-05 |
Similar Documents
| Publication | Publication Date | Title |
|---|---|---|
| JP6196922B2 (ja) | 画像処理装置、画像処理方法、及び画像処理プログラム | |
| JP6371544B2 (ja) | 画像処理装置、画像処理方法、及び画像処理プログラム | |
| US10456009B2 (en) | Image processing apparatus, image processing method, and computer-readable recording medium | |
| US9959481B2 (en) | Image processing apparatus, image processing method, and computer-readable recording medium | |
| US10198811B2 (en) | Image processing apparatus, image processing method, and computer-readable recording medium | |
| JP6265588B2 (ja) | 画像処理装置、画像処理装置の作動方法、及び画像処理プログラム | |
| US10360474B2 (en) | Image processing device, endoscope system, and image processing method | |
| JP6552601B2 (ja) | 画像処理装置、画像処理装置の作動方法および画像処理プログラム | |
| US20190156483A1 (en) | Image processing apparatus and image processing method | |
| Ghosh et al. | A statistical feature based novel method to detect bleeding in wireless capsule endoscopy images | |
| Riaz et al. | Detecting melanoma in dermoscopy images using scale adaptive local binary patterns | |
| US8457376B2 (en) | Image processing apparatus, image processing method, and computer-readable recording medium | |
| Ghosh et al. | Automatic bleeding detection in wireless capsule endoscopy based on RGB pixel intensity ratio | |
| Ghosh et al. | An automatic bleeding detection technique in wireless capsule endoscopy from region of interest | |
| Ghosh et al. | A feature extraction scheme from region of interest of wireless capsule endoscopy images for automatic bleeding detection | |
| Ghosh et al. | Block based histogram feature extraction method for bleeding detection in wireless capsule endoscopy | |
| Fu et al. | Bleeding region detection in WCE images based on color features and neural network | |
| Ghosh et al. | An automatic bleeding detection scheme in wireless capsule endoscopy based on statistical features in hue space | |
| Kundu et al. | A histogram based scheme in YIQ domain for automatic bleeding image detection from wireless capsule endoscopy | |
| Law et al. | Color image processing in Hirschsprung's disease diagnosis | |
| Geurts et al. | Automated Quantitative Analysis of Microglia in Bright-Field Images of Zebrafish | |
| Bhargavi et al. | Exploring Filters in Color Segmentation for Detection of Duodenal Cysts in Wireless Capsule Endoscopy Images | |
| KR20240079994A (ko) | 민감도 설정이 가능한 인공지능 기반의 병변 검출 방법 및 장치 |
Legal Events
| Date | Code | Title | Description |
|---|---|---|---|
| 121 | Ep: the epo has been informed by wipo that ep was designated in this application |
Ref document number: 15764138 Country of ref document: EP Kind code of ref document: A1 |
|
| WWE | Wipo information: entry into national phase |
Ref document number: 112015000972 Country of ref document: DE |
|
| 122 | Ep: pct application non-entry in european phase |
Ref document number: 15764138 Country of ref document: EP Kind code of ref document: A1 |