WO2015137828A1 - Substance or contamination detection - Google Patents
Substance or contamination detection Download PDFInfo
- Publication number
- WO2015137828A1 WO2015137828A1 PCT/NZ2015/050026 NZ2015050026W WO2015137828A1 WO 2015137828 A1 WO2015137828 A1 WO 2015137828A1 NZ 2015050026 W NZ2015050026 W NZ 2015050026W WO 2015137828 A1 WO2015137828 A1 WO 2015137828A1
- Authority
- WO
- WIPO (PCT)
- Prior art keywords
- product
- substance
- contaminant
- waveband
- isolated
- Prior art date
Links
- 239000000126 substance Substances 0.000 title claims abstract description 205
- 238000011109 contamination Methods 0.000 title claims abstract description 32
- 238000001514 detection method Methods 0.000 title description 32
- 239000000356 contaminant Substances 0.000 claims abstract description 176
- 230000002550 fecal effect Effects 0.000 claims abstract description 37
- 235000013372 meat Nutrition 0.000 claims abstract description 25
- 238000000034 method Methods 0.000 claims description 81
- 230000005284 excitation Effects 0.000 claims description 57
- 230000006399 behavior Effects 0.000 claims description 43
- 230000003287 optical effect Effects 0.000 claims description 28
- 239000011159 matrix material Substances 0.000 claims description 27
- 102000008186 Collagen Human genes 0.000 claims description 20
- 108010035532 Collagen Proteins 0.000 claims description 20
- 229920001436 collagen Polymers 0.000 claims description 20
- 230000004044 response Effects 0.000 claims description 18
- 238000005286 illumination Methods 0.000 claims description 15
- 238000002955 isolation Methods 0.000 claims description 15
- 239000000835 fiber Substances 0.000 claims description 11
- 238000001914 filtration Methods 0.000 claims description 6
- 241000894006 Bacteria Species 0.000 claims description 4
- 150000004032 porphyrins Chemical class 0.000 claims description 4
- 239000013307 optical fiber Substances 0.000 claims description 3
- 238000004611 spectroscopical analysis Methods 0.000 abstract description 4
- 210000003608 fece Anatomy 0.000 description 28
- 238000012545 processing Methods 0.000 description 25
- 230000008569 process Effects 0.000 description 18
- 239000000523 sample Substances 0.000 description 17
- 229930002875 chlorophyll Natural products 0.000 description 10
- 235000019804 chlorophyll Nutrition 0.000 description 10
- ATNHDLDRLWWWCB-AENOIHSZSA-M chlorophyll a Chemical compound C1([C@@H](C(=O)OC)C(=O)C2=C3C)=C2N2C3=CC(C(CC)=C3C)=[N+]4C3=CC3=C(C=C)C(C)=C5N3[Mg-2]42[N+]2=C1[C@@H](CCC(=O)OC\C=C(/C)CCC[C@H](C)CCC[C@H](C)CCCC(C)C)[C@H](C)C2=C5 ATNHDLDRLWWWCB-AENOIHSZSA-M 0.000 description 10
- 230000006870 function Effects 0.000 description 9
- 238000004458 analytical method Methods 0.000 description 7
- 238000003860 storage Methods 0.000 description 6
- 230000005540 biological transmission Effects 0.000 description 5
- 238000004590 computer program Methods 0.000 description 4
- 238000010586 diagram Methods 0.000 description 4
- 235000013622 meat product Nutrition 0.000 description 4
- 102000001554 Hemoglobins Human genes 0.000 description 3
- 108010054147 Hemoglobins Proteins 0.000 description 3
- 241001465754 Metazoa Species 0.000 description 3
- 238000010521 absorption reaction Methods 0.000 description 3
- 238000000295 emission spectrum Methods 0.000 description 3
- 238000002189 fluorescence spectrum Methods 0.000 description 3
- 238000004519 manufacturing process Methods 0.000 description 3
- 239000002207 metabolite Substances 0.000 description 3
- 241000894007 species Species 0.000 description 3
- 230000003595 spectral effect Effects 0.000 description 3
- XLYOFNOQVPJJNP-UHFFFAOYSA-N water Substances O XLYOFNOQVPJJNP-UHFFFAOYSA-N 0.000 description 3
- 241000196324 Embryophyta Species 0.000 description 2
- 230000009102 absorption Effects 0.000 description 2
- 238000004891 communication Methods 0.000 description 2
- 239000000463 material Substances 0.000 description 2
- 238000011897 real-time detection Methods 0.000 description 2
- 238000003307 slaughter Methods 0.000 description 2
- 239000000243 solution Substances 0.000 description 2
- 238000011179 visual inspection Methods 0.000 description 2
- 241000283690 Bos taurus Species 0.000 description 1
- 241000589876 Campylobacter Species 0.000 description 1
- 244000025254 Cannabis sativa Species 0.000 description 1
- 241000588724 Escherichia coli Species 0.000 description 1
- 235000019687 Lamb Nutrition 0.000 description 1
- 241001494479 Pecora Species 0.000 description 1
- 241000607142 Salmonella Species 0.000 description 1
- 230000009286 beneficial effect Effects 0.000 description 1
- 210000004204 blood vessel Anatomy 0.000 description 1
- 230000008859 change Effects 0.000 description 1
- 239000001752 chlorophylls and chlorophyllins Substances 0.000 description 1
- 238000010276 construction Methods 0.000 description 1
- 230000008878 coupling Effects 0.000 description 1
- 238000010168 coupling process Methods 0.000 description 1
- 238000005859 coupling reaction Methods 0.000 description 1
- 238000012864 cross contamination Methods 0.000 description 1
- 230000001419 dependent effect Effects 0.000 description 1
- 230000001066 destructive effect Effects 0.000 description 1
- 238000010790 dilution Methods 0.000 description 1
- 239000012895 dilution Substances 0.000 description 1
- 238000009826 distribution Methods 0.000 description 1
- 230000000694 effects Effects 0.000 description 1
- 238000000695 excitation spectrum Methods 0.000 description 1
- 238000002073 fluorescence micrograph Methods 0.000 description 1
- 235000013305 food Nutrition 0.000 description 1
- 235000013569 fruit product Nutrition 0.000 description 1
- 238000003384 imaging method Methods 0.000 description 1
- 238000007689 inspection Methods 0.000 description 1
- 230000000968 intestinal effect Effects 0.000 description 1
- -1 matter Substances 0.000 description 1
- 244000000010 microbial pathogen Species 0.000 description 1
- 238000012986 modification Methods 0.000 description 1
- 230000004048 modification Effects 0.000 description 1
- 238000005424 photoluminescence Methods 0.000 description 1
- 230000035945 sensitivity Effects 0.000 description 1
- 238000000926 separation method Methods 0.000 description 1
- 238000012306 spectroscopic technique Methods 0.000 description 1
- 238000001228 spectrum Methods 0.000 description 1
- 238000012360 testing method Methods 0.000 description 1
- 238000012549 training Methods 0.000 description 1
- 238000012546 transfer Methods 0.000 description 1
- 235000013311 vegetables Nutrition 0.000 description 1
- 230000000007 visual effect Effects 0.000 description 1
Classifications
-
- C—CHEMISTRY; METALLURGY
- C12—BIOCHEMISTRY; BEER; SPIRITS; WINE; VINEGAR; MICROBIOLOGY; ENZYMOLOGY; MUTATION OR GENETIC ENGINEERING
- C12Q—MEASURING OR TESTING PROCESSES INVOLVING ENZYMES, NUCLEIC ACIDS OR MICROORGANISMS; COMPOSITIONS OR TEST PAPERS THEREFOR; PROCESSES OF PREPARING SUCH COMPOSITIONS; CONDITION-RESPONSIVE CONTROL IN MICROBIOLOGICAL OR ENZYMOLOGICAL PROCESSES
- C12Q1/00—Measuring or testing processes involving enzymes, nucleic acids or microorganisms; Compositions therefor; Processes of preparing such compositions
- C12Q1/02—Measuring or testing processes involving enzymes, nucleic acids or microorganisms; Compositions therefor; Processes of preparing such compositions involving viable microorganisms
- C12Q1/04—Determining presence or kind of microorganism; Use of selective media for testing antibiotics or bacteriocides; Compositions containing a chemical indicator therefor
-
- G—PHYSICS
- G01—MEASURING; TESTING
- G01J—MEASUREMENT OF INTENSITY, VELOCITY, SPECTRAL CONTENT, POLARISATION, PHASE OR PULSE CHARACTERISTICS OF INFRARED, VISIBLE OR ULTRAVIOLET LIGHT; COLORIMETRY; RADIATION PYROMETRY
- G01J3/00—Spectrometry; Spectrophotometry; Monochromators; Measuring colours
- G01J3/28—Investigating the spectrum
- G01J3/44—Raman spectrometry; Scattering spectrometry ; Fluorescence spectrometry
- G01J3/4406—Fluorescence spectrometry
-
- G—PHYSICS
- G01—MEASURING; TESTING
- G01N—INVESTIGATING OR ANALYSING MATERIALS BY DETERMINING THEIR CHEMICAL OR PHYSICAL PROPERTIES
- G01N21/00—Investigating or analysing materials by the use of optical means, i.e. using sub-millimetre waves, infrared, visible or ultraviolet light
- G01N21/62—Systems in which the material investigated is excited whereby it emits light or causes a change in wavelength of the incident light
- G01N21/63—Systems in which the material investigated is excited whereby it emits light or causes a change in wavelength of the incident light optically excited
- G01N21/64—Fluorescence; Phosphorescence
- G01N21/645—Specially adapted constructive features of fluorimeters
- G01N21/6456—Spatial resolved fluorescence measurements; Imaging
-
- G—PHYSICS
- G01—MEASURING; TESTING
- G01N—INVESTIGATING OR ANALYSING MATERIALS BY DETERMINING THEIR CHEMICAL OR PHYSICAL PROPERTIES
- G01N21/00—Investigating or analysing materials by the use of optical means, i.e. using sub-millimetre waves, infrared, visible or ultraviolet light
- G01N21/84—Systems specially adapted for particular applications
- G01N21/88—Investigating the presence of flaws or contamination
- G01N21/94—Investigating contamination, e.g. dust
-
- G—PHYSICS
- G01—MEASURING; TESTING
- G01N—INVESTIGATING OR ANALYSING MATERIALS BY DETERMINING THEIR CHEMICAL OR PHYSICAL PROPERTIES
- G01N33/00—Investigating or analysing materials by specific methods not covered by groups G01N1/00 - G01N31/00
- G01N33/02—Food
- G01N33/12—Meat; fish
-
- G—PHYSICS
- G06—COMPUTING; CALCULATING OR COUNTING
- G06V—IMAGE OR VIDEO RECOGNITION OR UNDERSTANDING
- G06V20/00—Scenes; Scene-specific elements
- G06V20/60—Type of objects
- G06V20/69—Microscopic objects, e.g. biological cells or cellular parts
- G06V20/693—Acquisition
-
- G—PHYSICS
- G01—MEASURING; TESTING
- G01J—MEASUREMENT OF INTENSITY, VELOCITY, SPECTRAL CONTENT, POLARISATION, PHASE OR PULSE CHARACTERISTICS OF INFRARED, VISIBLE OR ULTRAVIOLET LIGHT; COLORIMETRY; RADIATION PYROMETRY
- G01J3/00—Spectrometry; Spectrophotometry; Monochromators; Measuring colours
- G01J3/28—Investigating the spectrum
- G01J3/44—Raman spectrometry; Scattering spectrometry ; Fluorescence spectrometry
-
- G—PHYSICS
- G01—MEASURING; TESTING
- G01N—INVESTIGATING OR ANALYSING MATERIALS BY DETERMINING THEIR CHEMICAL OR PHYSICAL PROPERTIES
- G01N21/00—Investigating or analysing materials by the use of optical means, i.e. using sub-millimetre waves, infrared, visible or ultraviolet light
- G01N21/62—Systems in which the material investigated is excited whereby it emits light or causes a change in wavelength of the incident light
- G01N21/63—Systems in which the material investigated is excited whereby it emits light or causes a change in wavelength of the incident light optically excited
- G01N21/64—Fluorescence; Phosphorescence
- G01N2021/6417—Spectrofluorimetric devices
- G01N2021/6421—Measuring at two or more wavelengths
-
- G—PHYSICS
- G01—MEASURING; TESTING
- G01N—INVESTIGATING OR ANALYSING MATERIALS BY DETERMINING THEIR CHEMICAL OR PHYSICAL PROPERTIES
- G01N2201/00—Features of devices classified in G01N21/00
- G01N2201/12—Circuits of general importance; Signal processing
- G01N2201/129—Using chemometrical methods
Definitions
- the invention relates to real time detection of substances or contaminants, and in particular to a spectroscopic method, system and device for detection of fecal contamination on meat samples.
- Animal feces contain microbial pathogens such as Escherichia coli 0157: 1-17, Campylobacter and Salmonella and it also caters for bacteria growth.
- carcasses can be contaminated with fecal residue when intestinal tracks and pelts are removed.
- each carcass is visually inspected and intervened upon positive detection of fecal contamination and/or upon detection of other contaminations.
- some contaminated carcasses may proceed to further processing without being detected. This may result in cross contaminations.
- the traceability of contaminated products diminishes, meaning large scale recall is unavoidable upon positive fecal detection.
- chlorophyll and its metabolites are largely present in feces. Also chlorophyll can be found in feces from grain-fed bovines. Spectroscopic techniques for determining the presence of chlorophyll and its metabolites in feces are known. In such devices, a sample is typically exposed to a light signal having a certain excitation wavelength, and a light detector detects emitted light of a longer wavelength (fluorescence) from the sample to identify the presence of bacteria. Spectroscopy is often real time, non invasive, non-destructive and non-chemical. Through careful examinations of excitation and emission spectra of chlorophyll one can construct 'fingerprints' for fecal detection and identification.
- the invention may broadly be said to consist of a method for determining the amount of one or more substances or contaminants in or on an illuminated product, the method comprising the steps of:
- isolated product a main or more abundant substance of the product isolated from the substance or contaminant
- the second waveband is within the first waveband.
- the second waveband may be outside the first waveband.
- the step of determining or predicting the value indicative of the amount of the substance or contaminant comprises separating from the first signal a portion of the signal relating to the substance or contaminant based on : the second signal, the fluorescent behaviour of the substance or contaminant in isolation from the product and the fluorescent behaviour of the isolated product.
- the method further comprises determining or predicting a value indicative of an amount of the main or more abundant substance of the product by separating from the first signal a portion of the signal relating to the main substance based on: the second signal, the fluorescent behaviour of each isolated substance or contaminant and the fluorescent behaviour of the isolated product.
- the predetermined information relates to:
- first and second isolated product signals indicative of the light emitted from the isolated (uncontaminated) product across the first and second wavebands respectively in response to optical excitation
- first and second isolated substance or contaminant signals indicative of the light emitted from the isolated substance or contaminant within the first and second wavebands respectively in response to optical excitation.
- the predetermined information is indicative of: a strength of each of the first and second isolated product signals and for each of the one or more isolated substances or contaminants, a strength of each the first and second isolated substance or contaminant signals.
- the strength of the isolated product signal is an integral of an intensity of the isolated product signal across the relevant waveband
- the strength of the isolated substance or contaminant signal is an integral of an intensity of the isolated substance or contaminant signal across the relevant waveband
- the predetermined information includes one or more of:
- the step of determining or predicting the value indicative of the amount of the substance or contaminant comprises multiplying the first and second signals by the inverse of a matrix, A, containing the strength of each of the first and second isolated product signals and the strength of each the first and second isolated substance or contaminant signals, for each of substance or contaminants.
- A may be an n by n or m by n sized matrix, where n and m depend on the number of substances or contaminants to be determined.
- the entries of matrix A relating to the isolated product are normalised to the strength of the first isolated product signal and for each contaminant or substance, the entries relating to the substance or contaminant are normalised to the strength of the first isolated substance or contaminant signal.
- the matrix A is:
- Detlip the strength of the first isolated product signal
- Det2ip the strength of the second isolated product signal
- Detl c the strength of the first isolated substance or contaminant signal
- Det2 c the strength of the second isolated substance or contaminant signal
- Ip a value indicative of the amount of the product
- I c a value indicative of the amount of the substance or contaminant in or on the product.
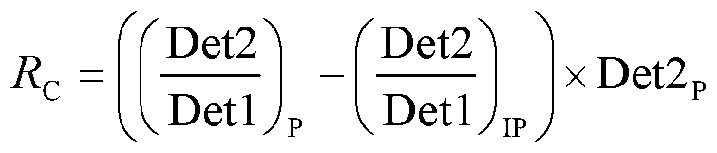
- the step of determined or predicting the value indicative of the amount of the substance or contaminant comprises determining a parameter, R c , indicative of the deviation of the signals associated with the product from the signals associated with the isolated product.
- Detlip the strength of the first isolated product signal
- Det2ip the strength of the second isolated product signal.
- the method further comprises prior to receiving the first and second signals, the steps of:
- the method further comprises prior to receiving the first and second signals, the step of deriving the predetermined information.
- the step of deriving the predetermined information comprises:
- Preferably obtaining the first and second isolated product signals comprises:
- Preferably obtaining the first and second isolated substance or contaminant signals comprises:
- the product may be a meat sample or carcass, the main or more abundant substance of the product may be any combination of one or more of collagen, tissue or fat and the substance(s) or contaminant(s) to be determined may be any combination of one or more of: fecal residue, fat, porphyrin, collagen or bacteria.
- the excitation wavelength is between approximately 350nm to 650nm. More preferably the excitation wavelength is approximately 365nm, 405nm, 450nm, 532nm or 650nm. Most preferably the excitation wavelength is 450nrm.
- the first waveband is between approximately 625nm and 850nm.
- the second waveband is between approximately 666nm and 676nrm.
- the first waveband is approximately 450-800nm and the second waveband is approximately 580-800nm.
- the excitation light is frequency modulated to between 1kHz and 10MHz.
- the invention may broadly be said to consist of a method for determining or predicting the amount of one or more substances or contaminants in or on an illuminated product, the method comprising the steps of:
- isolated product determining or predicting the amount of each, or at least one, of the one or more substances or contaminants in or on the product by separating a portion of the emitted signal relating to the substance or contaminant from the overall signal emitted from the product based on fluorescent behaviour of the substance or contaminant in isolation from the product and/or based on the fluorescent behaviour of the product or a main or more abundant substance of the product in isolation from the substances or contaminants (hereinafter referred to as isolated product).
- the step of receiving at least one signal comprises:
- the second waveband is within the first waveband.
- the second waveband may be outside the first waveband.
- the step of determining or predicting the value indicative of the amount of the substance or contaminant comprises separating from the first signal a portion of the signal relating to the substance or contaminant based on : the second signal, the fluorescent behaviour of the substance or contaminant in isolation from the product and the fluorescent behaviour of the isolated product.
- the method further comprises determining or predicting a value indicative of an amount of the main or more abundant substance of the product by separating from the first signal a portion of the signal relating to the main substance based on: the second signal, the fluorescent behaviour of each isolated substance or contaminant and the fluorescent behaviour of the isolated product.
- the invention may broadly be said to consist of a method for determining fecal contamination in a product comprising the steps of:
- the method further comprises outputting a signal indicative of fecal contamination when the amount of the contaminant exceeds the predetermined threshold or thresholds.
- the amount may be determined based on either I c , R c or a combination of both.
- the step of determining fecal contamination may include determining contamination when Ic exceeds a predetermined I threshold, when R c exceeds a predetermined R threshold, or when both I c and R c exceed both the I threshold and the R threshold respectively.
- the invention may broadly be said to consist of a device for determining an amount of one or more substances or contaminations in or on a product, the device comprising :
- a memory component for storing data indicative of predetermined information relating to fluorescence behaviour of a same or similar product or a main or more abundant substance of the product isolated from a substance or contaminant (hereinafter referred to as isolated product) and/or relating to the fluorescence behaviour of each of the one or more substances or contaminants isolated from the product, and
- a processor configured to:
- the second waveband is within the first waveband.
- the second waveband may be outside the first waveband.
- the device further comprises a light source for generating a beam of light.
- a first band pass filter arranged to filter a light beam and having a first operative waveband associated with the first waveband
- a second band pass filter arranged to filter a light beam and having a second operative waveband associated with the second waveband.
- the device further comprises first and second photomultiplier tubes adjacent the first and second filters respectively, for receiving filtered light beams from the first and second filters and outputting the first and second signals indicative of light intensities to the processor respectively.
- the device further comprises an optical fibre cable coupled to the light source for transmitting light out of the device and onto the product and for transmitted light emitted from the product to the first and second filters.
- the cable is optically coupled to a lens element adjacent the product.
- the lens is arranged to yield an excitation light beam from a central excitation fibre of the fibre cable onto a region of interest on the product in one direction and yield an emission light beam emitted from the product into emission fibres of the fibre cable in an opposite direction.
- the device further comprises a camera lens configured to receive light emitted from the product in response to excitation from the light source and output an image signal.
- the device further comprises a beam splitter configured to divide the image signal into a first and second channel.
- the device further comprises a first image sensor with a first optical filter associated with the first channel and a second image sensor with a second optical fitler associated with the second channel, wherein a first optical filter is arranged to filter the output image signal based on a first operative waveband, and the second optical filter is arranged to filter the output image signal based on a second operative waveband, the second waveband being within the first waveband.
- the invention may broadly be said to consist of a system for determining an amount of one or more substances or contaminations in or on a product, the system comprising :
- a light detector for determining the amount of one or more substances or contaminations in or on a product, the detector having :
- a memory component for storing data indicative of predetermined information relating to fluorescence behaviour of a same or similar product or a main or more abundant substance of the product isolated from a substance or contaminant (hereinafter referred to as isolated product) and/or relating to the fluorescence behaviour of each of the one or more substances or contaminants isolated from the product, and
- a processor configured to:
- the second waveband is within the first waveband.
- the second waveband may be outside the first waveband.
- Figure 1 is a schematic of showing the components of a preferred form detector of the invention
- Figure 2 is a schematic of showing the components of an imaging system of the invention
- Figure 3 (a) is a graph showing collagen (re-scaled due to high intensity), fat, surface and tissue fluorescence spectra under 450 nm excitation, with diluted feces fluorescence spectra shown as an inset,
- Figure 3 (b) is a graph showing fluorescence spectra of the same meat samples contaminated with feces
- Figure 4 is a graph showing fluorescence of chlorophyll present on the surface/epimysium of meat
- Figure 5 is a graph showing comparison of the two parameters, fe ces and I feces , in the possible ranges of both positive and negative fecal detection,
- Figure 6 is a flow diagram of a process of determining an absolute amount of a substance or contaminant in or on a product of the invention.
- Figure 7 is a flow diagram of a process of obtaining predetermined information in accordance with an initial step of figure 6.
- the system 100 comprises an illumination sub-system 120 and a detection sub-system 110 (hereinafter "detector" 110.
- the system 100 is spectroscopic and utilises the fluorescent properties of contaminants such as feces, or other substance(s) or matter, to identify the presence of one or more of said contaminants or other substances 210 within or on a target product or sample 200.
- the system 100 operates by illuminating the sample 200 using a light beam 121 from a light source, and analysing at the detector 110 light emitted from the product 200 in response to the illumination.
- a light transmission medium 130 may provide optical communication between the light source and the product, and between the product and the detector.
- a product or sample 200 to be analysed is positioned adjacent the output of the illumination sub-system 120 to yield an excitation beam onto the area 220 of the product to be analysed.
- the product 200 may be from a living or non-living species or surface.
- the product is from a living species such as a meat product, a fruit product or a vegetable product.
- the product 200 may be or may be from a non-living surface or structure such as a bench, tool, piece of equipment or any other non-living surface where the detection of a contaminant or other substance may be desirable.
- the detector 110 is arranged to receive light emitted from the illuminated region 220 of the product 200 and analyse the emission spectra to determine the presence and preferably the absolute amount of each of one or more substances or contaminants.
- the detector 110 in particular, is arranged to separate from the emission spectra, the portion of the signal relating to the substance or contaminant and calculate an absolute amount of the contaminant or substance from this portion of the signal.
- the detector 110 may be further configured to determine if the absolute the amount exceeds a predetermined threshold and output a signal to a user accordingly to indicate as such.
- an initial analysis stage is conducted where the fluorescence behaviour of a similar product in isolation of the contaminant or substance, and an analysis of the fluorescence behaviour of each contaminant or substance to be detected in isolation of the product is determined.
- the predetermined fluorescence behaviour information is stored in memory for processing at a later stage when a product is to be analysed for contamination or the detection of a substance/ contaminant.
- the emission signal from the product is analysed in conjunction with the predetermined information to determine the presence and preferably the absolute amount of each contaminant or substance to be detected.
- the emitted fluorescence or photoluminescence signal is filtered into two or more signals, including a base signal and one or more fluorescence signals.
- the base signal has a relatively wide waveband/bandwidth and includes, for each contaminant or substance to be detected, at least one of the fluorescence wavelength associated with that contaminant or substance.
- the base signal may be a narrowband signal. The width of the waveband of the base signal depends on the spectral signatures of the contaminant or substance to be detected.
- the emitted fluorescence signal is also filtered into at least one fluorescence signal for each contaminant or substance to be detected.
- the waveband of each fluorescence signal contains a fluorescence wavelength of an associated contaminant or substance to be detected.
- Each fluorescence signal has a waveband that is different to the waveband of the base signal.
- the waveband of the fluorescence signal is preferably relatively narrow compared to the base signal.
- the fluorescence signal comprises a waveband that is contained entirely within the waveband of the base signal. In other words, the fluorescence signal forms part of the overall base signal.
- any one of the fluorescence signals may have a relatively wider or same width waveband as the base signal, and/or the waveband of the fluorescence signal may partially overlap with or be contained entirely outside the waveband of the base signal.
- the base signal and each of the fluorescence signals are utilised and processed by the detector in conjunction with the predetermined information relating to the fluorescence behaviour of the isolated product and substances/contaminants to determine the presence of each contaminant or substance, and preferably the absolute amount of each contaminant or substance in or on the product.
- the methods and systems described for this invention are not intended to be limited to any particular application.
- the preferred embodiment predominantly used to describe the features of the invention is for the detection of feces or other contaminants or substances or matter such as tissue or fat in or on meat products.
- the method and system for detection can be applied in various alternative applications to detect the presence, and preferably the absolute amount of any species or substance or matter on a product that exhibits fluorescent properties when the product is illuminated. Such alternative applications are not intended to be excluded from the scope of the invention.
- the detector 110 is configured to operate in real time.
- the detector 110 is configured to receive, filter and process the light emitted from the illuminated region 220 of the product 200 in real time or near real time with minimal delay from time of excitation.
- Such a detector 110 can therefore be used in a multitude of applications where real time detection is necessary or highly beneficial such as in the food product industries where a large number of products may need to be examined for contamination and transported to another location quickly and efficiently.
- the first embodiment is more suited for portable or smaller type detection devices for analysing smaller products or portions of products, whereas the second embodiment may be more suited for analysing larger portions or larger products.
- the illumination system comprises a light source.
- the light source 120 is any device capable of producing light of one or more excitation wavelengths as required by the particular application.
- the light source 121 delivers (monochromatic) light of wavelengths between approximately 350nm and 700nm, and more preferably at excitation wavelengths of or around approximately 365nm, 405 nm, 450 nm, 532 nm and 650nm.
- the light source 121 delivers an excitation light of approximately 450nm as this is the optimum wavelength for maximizing the fluorescence ratio between chlorophyll (indicative of presence of feces) and meat background.
- the detector 110 is configured to receive the emitted fluorescence signal from the product in response to excitation and output one or more filtered signals for processing by the signal processing component, in particular a base signal and one or more fluorescence signals.
- the detector 110 is arranged for detection of the presence of fecal matter on the surface of a meat product 200. Chlorophylls and their metabolites are present in the fecal matter of plant eating animals and exhibit fluorescent properties when exited by light. Chlorophyll is therefore a suitable indicator for the inspection and identification of fecal contamination.
- the detector 110 is configured to output a base signal having a waveband of approximately 625nm to 850nm and a fluorescence signal having a waveband of approximately 666 nm to 676 nm.
- the signal processing component of the system is preferably integrated within the detector 110 of either embodiment but may alternatively be integrated in a separate and/or remote system.
- the same hardware can be, and is preferably, used for obtaining the predetermined fluorescence behaviour information which is utilised by the signal processing system to detect contaminations or other substances in or on a product.
- the illumination sub-system 120 comprises a light source 121 and one or more lenses 122/123 for focussing the light onto the appropriate region or regions of the product.
- the light source 121 may be, for example, a diode laser configured to output an excitation beam at the desired wavelength.
- the light source 121 may be housed within the detector 110 or alternatively separate from the detector 110.
- one or more, and preferably a pair, of collimating and focussing lenses 122 are provided between the light source 121 and the transmission medium 130 to couple the excitation light beam with the transmission medium 130.
- the light source 121 may be embedded in a probe allowing direct excitation of the product 200 without the need for a transmission medium.
- the mode of operation of the light source 121 can be continuous, modulated or pulsed.
- the excitation light is frequency modulated between 1 kHz and 10 MHz so that fluorescence is also modulated at that frequency. This allows ambient signals to be rejected during signal processing.
- excitation light modulation can be achieved using a mechanical chopper as is well known in the art.
- a collimating lens 123 is provided adjacent the product 200 for provided a focussed light beam on a desired region of the product.
- the lens 123 may be a convex lens for example adapted to deliver collimated excitation light spots of 5 mm, 10 mm or 20 mm diameter or any other desired size on the product 200.
- the incident angle of the excitation light beam on the product 200 may be any desired angle but is preferably approximately orthogonal (90 degrees) to the surface of the product 200. It will be appreciated that alternative light sources and excitation wavelengths may be used as required by the particular application.
- the light source 121 may be configured to output one or more excitation light beams.
- the detector 110 is configured to receive light emitted from the illuminated region 220 of the product 200 and output two or more distinct filtered light signals for processing by the signal processor.
- the number of filtered light signals may be dependent on the number of contaminants or substances to be detected in or on the product.
- light is transmitted by the system 100 using optical cable 130 having an emission light branch.
- the light branch splits into two or more channels depending on the number of wavebands the signal is to be separated into.
- the light branch splits into two channels 131 and 132.
- a beam splitter may also be used in this process to redirect the emitted light across two separate channels.
- each channel 131/132 is an optical filter 111/112 having a particular optical characteristic.
- a first filter 111 is configured to output the base signal having the relatively wider waveband from the emitted light
- a second filter 112 is configured to output the fluorescence signal of relatively narrower waveband from the emitted light. It will be appreciated that any number of second filters 112 may be used depending on the number of contaminants or substances to be detected.
- the first filter 111 is configured to output a base signal having a waveband of approximately 625nm to 850nrm
- the second filter 112 is configured to output a fluorescence signal of approximately 666 nm to 676 nm.
- the gain voltage associated with the output of the filter 112 may be set higher than that for filter 111. It will be appreciated that for different contamination, substance, matter, product and/or applications different wavebands may be used for the filters 112 and 113 without departing from the scope of the invention.
- the light transmitted from filters 111 and 112 is then input into two respective photomultiplier tubes (PMTs) 113 and 114 or photodiodes.
- the tubes 113/114 have the function of outputting electrical energy in response to input optical energy.
- PMTs 113 and 114 convert the received light beams transmitted from filters 111 and 112 into current or voltage signals.
- the PMTs may then process the current or voltage signals or output the signals for external processing.
- Control circuitry may be used to control the operation of the various components associated with this embodiment.
- an optical transmission medium 130 is an optical fibre cable 130 is provided for optically coupling the detector 110 and the light source to the region of the product to be analysed.
- the optical cable 130 may comprise a bundle of optical fibres. These fibres are configured to allow the cable to separately transmit excitation and emission beams.
- the preferred form cable 130 comprises a central excitation fibre element surround by an array of emission fibre elements. It will be appreciated that the number and distribution of the fibre elements within the cable 130 may be different in alternative embodiments.
- Excitation light from the light source 120 travels through the excitation fibre to the lens 123 where it is projected onto the region 220 to be analysed. Light emitted from the region is projected by the lens 123 into the surrounding array of fibre elements to then be transmitted through the cable 130 to the beam splitter 111 and/or the various channels before the appropriate filters 111/112 of the detector 110.
- the light source 120 may be un-collimated at the product end to illuminate larger products such as large meat samples or carcasses.
- the detection system of the second embodiment is more suited for applications where a larger region or area of the product is to be covered per scan.
- the detector 110 employs an array of sensors to create fluorescence images of the fecal residue or other contaminant or substance on the meat or other product.
- an individual pixel or a bin of pixels of the array sensors measure fluorescence signals.
- a camera lens 115 is used to collect the emitted light from the product in response to excitation.
- the camera lens outputs an image signal which is divided into two or more channels, preferably using a beam splitter 116.
- the beam splitter 116 splits the image into two channels and focuses each signal onto one of two image sensors 117/118.
- the image signal may be divided into more than two channels associated with more than two image sensors and using more than one beam splitter, for example to detect more than one substance or contaminant in or on the illuminated product.
- the first image sensor 117 receives an image indicative of the waveband of the required base signal (625nm - 850 nm as in the preferred embodiment) and the second image sensor 118 receives an image indicative of the waveband of the fluorescence signal (666 nm to 676nm).
- one image sensor can be used in conjunction with a filter wheel fitted with two or more optical filters. The image sensor would then sequentially receive the images within the various required wavebands as the filter wheel is rotated.
- the detector 110 can employ two image sensors each coupled with a camera lens and an optical filter to receive the images within the required wavebands.
- each sensor receives emitted light from the same region or spot of illumination through slightly different optical paths.
- Post image processing to fix the spatial offset can be employed in such a configuration.
- the detector 110 also obtains background images of the product.
- the excitation light is turned off briefly and each sensorl l7/118 is allowed to receive background fluorescence/emissions.
- the background images are used in image processing to eliminate ambient light present in the detected images.
- An image processing and control circuit board 119 may be used to control the illumination and reception of emitted light in accordance with this embodiment.
- Each of the first and second embodiments described above outputs a series of two or more filtered signals to a signal processing component of the system.
- the output signals include a base signal of a relatively wide waveband and one or more fluorescence signals of relatively narrow waveband(s).
- the waveband of the base signal contains the fluorescence wavelengths of each of the contaminants or substances to be detected, and the waveband of each fluorescence signal is a narrowband signal containing the fluorescence wavelength of the associated contaminant or substance.
- the signal processing component is configured to separate from the base signal of the product (with the substance or contaminant therein/thereon) a portion of the signal relating solely or predominantly to the substance or contaminant. This separation is done based on : the fluorescence signal, the fluorescence behaviour of the substance or contaminant in isolation from the product and/or the fluorescent behaviour of the product or a main substance of the product in isolation of the substance or contaminant.
- a memory component associated with the signal processing circuitry is initially populated with fluorescence behaviour information of at least the product or a main substance of the product, in isolation from the one or more contaminants or substances to be detected in or on the product, and the fluorescence behaviour of the one or more contaminants or substances in isolation of each other and in isolation of the product.
- the fluorescence behaviour information can be obtained using any one of the preferred systems described above.
- This step 210 is carried out initially for each product and contaminant/substance to be detected in or on the product to pre-calibrate the system for that product and contaminant(s)/substance(s).
- the system may be useable on a number of products in a production line for example to detect the presence of the contaminant(s)/substance(s) in or on the product.
- the system may be calibrated for a number of products and/or a number of contaminant(s)/substance(s) for each product at step 210.
- the fluorescence behaviour information is obtained 210 by: subjecting an isolated product or an isolated main substance of the product to excitation light 211b and obtaining from the emitted light a base signal and at least one fluorescence signal indicative of the light emitted across the wide base and narrow fluorescence wavebands respectively 212b; and
- each contaminant or substance isolated from the product or the main substance of the product
- excitation light 211a subjecting each contaminant or substance (isolated from the product or the main substance of the product) to excitation light 211a and obtaining from the emitted light a base signal and at least a fluorescence signal indicative of the light emitted across the wide base and narrow fluorescence wavebands respectively 211b.
- the strength may be calculated as an integral of the respective signal as shown following series of equations:
- F IP ( ) and F C (X) are the fluorescence waveform of isolated product and contaminant/substance respectively after excitation
- BU is the upper wavelength of base signal
- BL is the lower wavelength of the base signal
- FU is the upper wavelength of the fluorescence signal
- FL is the lower wavelength of the fluorescence signal.
- the predetermined information stored in memory is indicative of:
- the strengths calculated at 213a and 213b may be normalised relative to the base signal strengths at 214a and 214b before being stored in memory.
- the absolute or normalised strength information or other data indicative thereof is stored in memory at 216.
- a product is first illuminated at step 220 and at step 230 the emitted signal in response to illumination is then divided into the base signal and the one or more fluorescence signals as described above.
- the signal processing component of the system receives the base and fluorescence signals and determines values indicative of the strength of each signal (step 240).
- the strengths are then compared to the predetermined information stored in memory at step 250 and from this comparison one or more parameters indicative of an amount of each substance/contaminant to be detected are calculated or predicted (step 260). From this determination or prediction the signal processing component may then preferably compare the parameter(s) against a threshold or thresholds to determine if the product contains an excess amount of the substance/contaminant (step 270) and preferably output a signal indicating such if the amount is in excess (step 280).
- Two preferred methods are described below for determining or predicting a value indicative of the absolute amount of a contaminant or substance in or on a product from the comparison stage 250. Both methods operate to separate the portion of the emitted light that is due to the contaminant or substance by utilising the prior knowledge stored in memory.
- the step of determining or predicting the value indicative of the amount of the substance or contaminant comprises multiplying the base signal and the fluorescence signal by the inverse of a matrix, A, containing the predetermined information described above.
- This matrix may be generated and pre-stored in memory at step 215 prior to product analysis or may be generated from pre-stored information during the comparison stage 250.
- Matrix A is predetermined based on equation 1.
- the entities of the matrix A represent a collection of the above described predetermined information.
- the first column of the matrix represents isolated product normalized to the base signal of the isolated product.
- the second column represents isolated substance or contaminant normalized to the base signal of the isolated substance or contaminant.
- matrix A For example, for determining one substance or contaminant in or on the product, matrix A can be expressed as:
- the entities of the resultant matrices, 7 P and I c represent calculated absolute intensities of the product and of the contaminant/substance respectively.
- the matrix A may be a n n by n or m by n sized matrix, where n and m depend on the number of substances or contaminants to be determined.
- A may be 4 x 4 matrix determined from a 1 x 4 input matrix of signal strengths.
- the size of the input matrix does not exclusively represent the number of detectors. In this example, two detectors still can be used under different experimental conditions to construct the input matrix such as at two different excitation wavelengths, two d ifferent excitation powers or two different detection time frames.
- the step of determined or predicting the value indicative of the amount of the substance or contaminant comprises determining a parameter, R c , indicative of the deviation between the signals associated with the product from the signals associated with the isolated product.
- R c is determined from the difference between the normalised strength of the product fluorescence signal and the normalised strength of the isolated product fluorescence signal.
- a parameter, R c is determined in this method based on equation 4 below.
- Rc is a parameter indicative of the absolute strength of the emitted light signal due to the associate contaminant or substance.
- the signal processing system may be further configured to determine or predict if there is an excess amount of the contaminant or substance in the product from one or both parameters.
- the signal processing system may be configured to compa re one or each parameter against a predetermined threshold associated with the parameter and indicates an excess amount of substance or contaminant when one or both parameters exceed the associated threshold .
- the parameters may be combined, for example summed or multiplied, and their combination is compared against a predetermined threshold to indicate excess amount of substance or contaminant.
- a process is terminated when its operations are completed.
- a process may correspond to a method, a function, a procedure, a subroutine, a subprogram, etc., in a computer program.
- a process corresponds to a function
- its termination corresponds to a return of the function to the calling function or a main function.
- a storage medium may represent one or more devices for storing data, including read-only memory (ROM), random access memory (RAM), magnetic disk storage mediums, optical storage mediums, flash memory devices and/or other machine readable mediums for storing information.
- ROM read-only memory
- RAM random access memory
- magnetic disk storage mediums magnetic disk storage mediums
- optical storage mediums flash memory devices and/or other machine readable mediums for storing information.
- machine readable medium and “computer readable medium” include, but are not limited to portable or fixed storage devices, optical storage devices, and/or various other mediums capable of storing, containing or carrying instruction(s) and/or data.
- the various illustrative logical blocks, modules, circuits, elements, and/or components described in connection with the examples disclosed herein may be implemented or performed with any combination of one or more of the following implementation mediums: general purpose processor, a digital signal processor (DSP), an application specific integrated circuit (ASIC), a field programmable gate array (FPGA) or other programmable logic component, discrete gate or transistor logic, discrete hardware components, designed to perform the one or more functions described herein.
- DSP digital signal processor
- ASIC application specific integrated circuit
- FPGA field programmable gate array
- the implementation mediums may be communicatively coupled either directly or via any suitable communications network as is well known in the arts of electrical and software engineering.
- a general purpose processor may be a microprocessor, but in the alternative, the processor may be any conventional processor, controller, microcontroller, circuit, and/or state machine.
- a processor may also be implemented as a combination of computing components, e.g., a combination of a DSP and a microprocessor, a number of microprocessors, one or more microprocessors in conjunction with a DSP core, or any other such configuration.
- One or more of the components and functions illustrated the figures may be rearranged and/or combined into a single component or embodied in several components without departing from the invention. Additional elements or components may also be added without departing from the invention.
- the invention can be embodied in a computer-implemented process, a machine (such as an electronic device, or a general purpose computer or other device that provides a platform on which computer programs can be executed), processes performed by these machines, or an article of manufacture.
- a machine such as an electronic device, or a general purpose computer or other device that provides a platform on which computer programs can be executed
- Such articles can include a computer program product or digital information product in which a computer readable storage medium containing computer program instructions or computer readable data stored thereon, and processes and machines that create and use these articles of manufacture.
- Figure 3 (a) shows fluorescence of isolated collagen, surface, fat and tissue within lamb spare flap cuts. Fluorescence of diluted sheep feces is also presented on the inset of figure 3 (a). Small volume (0.1 ml) of diluted feces were deposited to the same excitation spot of each sample and the resultant spectra were taken immediately after as shown in figure 3(b).
- tissue showed the greatest contrast between contaminated and uncontaminated fluorescence signature at 670 nm.
- collagen showed very little change at the same spectral region even though the same volume of feces was applied. In other words relative signal of feces on collagen is very small compared to that in other meat parts. This could results in false negative detection.
- absolute fluorescence signal of chlorophyll rather than relative signal to minimize false detection.
- the first detection parameter 7 feces was calculated from an inverse matrix problem solving method. As shown in figure 4 each detector (113 of fig. 1 is detector 1 and 114 of fig 1 is detector 2 for example) receives fluorescence signal equivalent to the area under the curve provided by the optical filter if detector response with wavelength is ignored. Signal strength received by each detector from each isolated meat and fecal solution can be expressed as
- F meat (X) and F ieces (X) are the fluorescence waveform of isolated meat and fecal solution, respectively.
- the entities of the matrix A represent a collection of uncontarminated collagen and diluted feces signals each measured by detector 1 and detector 2 simultaneously.
- the first column of the matrix represents uncontaminated collagen normalized to detector 1.
- the second column represents diluted feces normalized to detector 1 value. It should be noted that we have used detector values measured from isolated collagen to represent uncontaminated meat. Due to the high collagen fluorescence signal compared to fecal signal, it was a good set point to test sensitivity of the inverse matrix problem solving method.
- the entities of the resultant matrices, 7 meat and I feces represent calculated absolute intensities of meat background and fecal contamination respectively.
- the entity 7 meat is also a valid parameter for estimation of uncontaminated meat within the sample of interest.
- the 2 x 2 matrix can be expanded to n x n or m x n , where and m ean be any integer. Having bigger matrix sizes means that we can quantify more fluorescing material within the sample of interest such as fecal residue, collagen, fat and porphyrin.
- the inverse matrix solving method can therefore be applied in more generalized situations where fuller analysis is needed.
- the second parameter i? feces was calculated from differences between the ratio of measured data and the ratio of uncontaminated collagen.
- the parameter R iecss is defined in equation3.
- the first term is the measured data from any sample of interest expressed as a ratio of the two detectors.
- the second term in equation 3 is predetermined ratio of uncontaminated collagen. The difference between the first and the second term is then multiplied to measured detector 2 signal of the same sample to yield an absolute calculated fecal fluorescence signal.
- the two parameters feces and R f ⁇ gave independent estimations of fecal fluorescence strength.
- the values of feces and 3 ⁇ 4 ⁇ 8 calculated from contaminated and uncontaminated meat samples showed a good agreement as shown in figure 5.
- An arbitrary threshold level for fecal detection was set at 50. Any value above this level is considered as fecal contamination.
- the threshold level can be varied.
- the values of 7 feces and 3 ⁇ 4 ⁇ 5 are compared to the predetermined threshold level and a warning indication is generated when the values of the both parameters exceed the threshold.
- the fecal contamination detection limit is approximately equal to 1/32 dilution of feces with water. Since collimated beam was used an a primary excitation delivery, the detection performance with distance was stable from 100 mm to 400 mm from the surface of meat samples.
Abstract
Description


Claims
Priority Applications (5)
| Application Number | Priority Date | Filing Date | Title |
|---|---|---|---|
| EP15762354.7A EP3117203B1 (en) | 2014-03-14 | 2015-03-13 | Substance or contamination detection |
| CN201580019729.6A CN106461555B (en) | 2014-03-14 | 2015-03-13 | Substance or contaminant detection |
| AU2015230052A AU2015230052B2 (en) | 2014-03-14 | 2015-03-13 | Substance or contamination detection |
| US15/125,618 US20170002394A1 (en) | 2014-03-14 | 2015-03-13 | Substance or contamination detection |
| US16/819,954 US10961558B2 (en) | 2014-03-14 | 2020-03-16 | Substance or contamination detection |
Applications Claiming Priority (2)
| Application Number | Priority Date | Filing Date | Title |
|---|---|---|---|
| NZ622444 | 2014-03-14 | ||
| NZ62244414 | 2014-03-14 |
Related Child Applications (2)
| Application Number | Title | Priority Date | Filing Date |
|---|---|---|---|
| US15/125,618 A-371-Of-International US20170002394A1 (en) | 2014-03-14 | 2015-03-13 | Substance or contamination detection |
| US16/819,954 Continuation US10961558B2 (en) | 2014-03-14 | 2020-03-16 | Substance or contamination detection |
Publications (1)
| Publication Number | Publication Date |
|---|---|
| WO2015137828A1 true WO2015137828A1 (en) | 2015-09-17 |
Family
ID=54072144
Family Applications (1)
| Application Number | Title | Priority Date | Filing Date |
|---|---|---|---|
| PCT/NZ2015/050026 WO2015137828A1 (en) | 2014-03-14 | 2015-03-13 | Substance or contamination detection |
Country Status (5)
| Country | Link |
|---|---|
| US (2) | US20170002394A1 (en) |
| EP (1) | EP3117203B1 (en) |
| CN (1) | CN106461555B (en) |
| AU (1) | AU2015230052B2 (en) |
| WO (1) | WO2015137828A1 (en) |
Cited By (2)
| Publication number | Priority date | Publication date | Assignee | Title |
|---|---|---|---|---|
| NL1041809A (en) * | 2015-10-09 | 2017-04-24 | Condi Food B V | A spectral imaging system to detect contamination. |
| GB2577770A (en) * | 2019-07-25 | 2020-04-08 | Oxford Optronix Ltd | Method for detection of bacteria |
Families Citing this family (5)
| Publication number | Priority date | Publication date | Assignee | Title |
|---|---|---|---|---|
| US10241509B1 (en) * | 2014-11-13 | 2019-03-26 | State Farm Mutual Automobile Insurance Company | Autonomous vehicle control assessment and selection |
| US10245730B2 (en) * | 2016-05-24 | 2019-04-02 | Asustek Computer Inc. | Autonomous mobile robot and control method thereof |
| WO2019074926A1 (en) * | 2017-10-09 | 2019-04-18 | Pathspot Technologies Inc. | Systems and methods for detection of contaminants on surfaces |
| CN110044913A (en) * | 2019-03-27 | 2019-07-23 | 易安基自动化设备(北京)有限公司 | A kind of method and device of the surface cleanness of detection object |
| US11408825B2 (en) * | 2020-08-28 | 2022-08-09 | Hong Kong Applied Science and Technology Research Institute Company Limited | Forensic detector and the system thereof |
Citations (11)
| Publication number | Priority date | Publication date | Assignee | Title |
|---|---|---|---|---|
| US5914247A (en) | 1998-03-03 | 1999-06-22 | The United States Of America As Represented By The Secretary Of Agriculture | Method and system for detecting fecal and ingesta contamination on the carcasses of meat animals |
| US6587575B1 (en) * | 2001-02-09 | 2003-07-01 | The United States Of America As Represented By The Secretary Of Agriculture | Method and system for contaminant detection during food processing |
| US20030164456A1 (en) * | 2002-02-25 | 2003-09-04 | Emerge Interactive, Inc. | Apparatus and method for detecting fecal and ingesta contamination on hands using an lllumination imaging device |
| US20060008866A1 (en) * | 2004-07-09 | 2006-01-12 | Emerge Interactive, Inc. | Apparatus and method for detecting human fecal contamination on hands and other objects using an illumination imaging device |
| US7209836B1 (en) | 1999-07-16 | 2007-04-24 | Perkinelmer Las, Inc. | Method and system for automatically creating crosstalk-corrected data of a microarray |
| EP2270475A1 (en) | 2009-06-30 | 2011-01-05 | Star Ecotronics S.r.l. | Automated system for detecting aflatoxin in food |
| US20120056103A1 (en) | 2010-09-03 | 2012-03-08 | Sony Corporation | Fluorescence intensity compensation method and fluorescence intensity computing apparatus |
| US20120223251A1 (en) | 2011-03-01 | 2012-09-06 | Gauge Scientific, Llc | Analyte Detector and Method |
| US20120280146A1 (en) * | 2009-12-16 | 2012-11-08 | Spectralys Innovation | Method and spectroscopic analysis appliance, especially for analysing food, with multi-channel treatment of spectral data |
| EP2525213A1 (en) | 2011-05-16 | 2012-11-21 | Renishaw plc | Spectroscopic apparatus and methods for determining components present in a sample |
| WO2013180583A1 (en) | 2012-06-01 | 2013-12-05 | Veritide Limited | Real time optical detection of bacteria |
Family Cites Families (8)
| Publication number | Priority date | Publication date | Assignee | Title |
|---|---|---|---|---|
| US5621215A (en) * | 1995-06-07 | 1997-04-15 | The Board Of Trustees Of The University Of Arkansas | Method and system for fecal detection |
| US5658798A (en) * | 1996-02-08 | 1997-08-19 | Nalco Chemical Company | Detection of process components in food process streams by fluorescence |
| US5821546A (en) * | 1996-11-13 | 1998-10-13 | Board Of Trustees Of The University Of Arkansas | Method and system for fecal detection |
| US6639665B2 (en) * | 2001-02-09 | 2003-10-28 | Institute For Technology Development | Multispectral imaging system for contaminant detection |
| US6618140B2 (en) * | 2001-06-18 | 2003-09-09 | Amnis Corporation | Spectral deconvolution of fluorescent markers |
| US7547508B1 (en) * | 2004-12-30 | 2009-06-16 | The United States Of America As Represented By The Secretary Of Agriculture | Use of nanosecond scale, time-resolved, imaging to differentiate contemporaneous fluorescence responses from multiple substances |
| CN104939806B (en) * | 2008-05-20 | 2021-12-10 | 大学健康网络 | Apparatus and method for fluorescence-based imaging and monitoring |
| DE102013008003B4 (en) * | 2013-05-08 | 2015-03-19 | Freshdetect Gmbh | Measuring device for measuring a surface covering on a measuring object, in particular on a food, and its use |
-
2015
- 2015-03-13 US US15/125,618 patent/US20170002394A1/en not_active Abandoned
- 2015-03-13 WO PCT/NZ2015/050026 patent/WO2015137828A1/en active Application Filing
- 2015-03-13 AU AU2015230052A patent/AU2015230052B2/en active Active
- 2015-03-13 EP EP15762354.7A patent/EP3117203B1/en active Active
- 2015-03-13 CN CN201580019729.6A patent/CN106461555B/en active Active
-
2020
- 2020-03-16 US US16/819,954 patent/US10961558B2/en active Active
Patent Citations (11)
| Publication number | Priority date | Publication date | Assignee | Title |
|---|---|---|---|---|
| US5914247A (en) | 1998-03-03 | 1999-06-22 | The United States Of America As Represented By The Secretary Of Agriculture | Method and system for detecting fecal and ingesta contamination on the carcasses of meat animals |
| US7209836B1 (en) | 1999-07-16 | 2007-04-24 | Perkinelmer Las, Inc. | Method and system for automatically creating crosstalk-corrected data of a microarray |
| US6587575B1 (en) * | 2001-02-09 | 2003-07-01 | The United States Of America As Represented By The Secretary Of Agriculture | Method and system for contaminant detection during food processing |
| US20030164456A1 (en) * | 2002-02-25 | 2003-09-04 | Emerge Interactive, Inc. | Apparatus and method for detecting fecal and ingesta contamination on hands using an lllumination imaging device |
| US20060008866A1 (en) * | 2004-07-09 | 2006-01-12 | Emerge Interactive, Inc. | Apparatus and method for detecting human fecal contamination on hands and other objects using an illumination imaging device |
| EP2270475A1 (en) | 2009-06-30 | 2011-01-05 | Star Ecotronics S.r.l. | Automated system for detecting aflatoxin in food |
| US20120280146A1 (en) * | 2009-12-16 | 2012-11-08 | Spectralys Innovation | Method and spectroscopic analysis appliance, especially for analysing food, with multi-channel treatment of spectral data |
| US20120056103A1 (en) | 2010-09-03 | 2012-03-08 | Sony Corporation | Fluorescence intensity compensation method and fluorescence intensity computing apparatus |
| US20120223251A1 (en) | 2011-03-01 | 2012-09-06 | Gauge Scientific, Llc | Analyte Detector and Method |
| EP2525213A1 (en) | 2011-05-16 | 2012-11-21 | Renishaw plc | Spectroscopic apparatus and methods for determining components present in a sample |
| WO2013180583A1 (en) | 2012-06-01 | 2013-12-05 | Veritide Limited | Real time optical detection of bacteria |
Non-Patent Citations (1)
| Title |
|---|
| See also references of EP3117203A4 |
Cited By (4)
| Publication number | Priority date | Publication date | Assignee | Title |
|---|---|---|---|---|
| NL1041809A (en) * | 2015-10-09 | 2017-04-24 | Condi Food B V | A spectral imaging system to detect contamination. |
| GB2577770A (en) * | 2019-07-25 | 2020-04-08 | Oxford Optronix Ltd | Method for detection of bacteria |
| GB2577770B (en) * | 2019-07-25 | 2020-10-21 | Oxford Optronix Solutions Ltd | Method for detection of bacteria |
| WO2021013523A1 (en) * | 2019-07-25 | 2021-01-28 | Oxford Optronix (Solutions) Ltd | Method for detection of bacteria in faeces |
Also Published As
| Publication number | Publication date |
|---|---|
| EP3117203B1 (en) | 2021-02-17 |
| US20170002394A1 (en) | 2017-01-05 |
| CN106461555A (en) | 2017-02-22 |
| EP3117203A1 (en) | 2017-01-18 |
| EP3117203A4 (en) | 2017-11-29 |
| AU2015230052A1 (en) | 2016-10-27 |
| US20200392555A1 (en) | 2020-12-17 |
| US10961558B2 (en) | 2021-03-30 |
| CN106461555B (en) | 2020-12-18 |
| AU2015230052B2 (en) | 2019-12-12 |
Similar Documents
| Publication | Publication Date | Title |
|---|---|---|
| US10961558B2 (en) | Substance or contamination detection | |
| Cho et al. | Detection of cuticle defects on cherry tomatoes using hyperspectral fluorescence imagery | |
| EP2976620B1 (en) | System for and method of combined libs and ir absorption spectroscopy investigations | |
| Park et al. | Performance of hyperspectral imaging system for poultry surface fecal contaminant detection | |
| US8563934B2 (en) | Method and detection system for detection of aflatoxin in corn with fluorescence spectra | |
| US20190293620A1 (en) | Apparatus and method for multimode analytical sensing of items such as food | |
| US6587575B1 (en) | Method and system for contaminant detection during food processing | |
| US20170254741A1 (en) | Quality evaluation method and quality evaluation device | |
| US10012584B2 (en) | System and method for determining solute concentration in a colored liquid sample | |
| JP2013164338A (en) | Method for detecting foreign matter of plant or plant product | |
| Qin et al. | Detection of organic residues on poultry processing equipment surfaces by LED-induced fluorescence imaging | |
| CN109477793B (en) | Quality evaluation method and quality evaluation device | |
| KR101951758B1 (en) | Method for quantitative analysis of pork lard in a fat mixture using raman spectroscopy and apparatus for the same | |
| JP2009068850A (en) | Method and device for inspecting residual agricultural chemical in agricultural produce by spectral image method | |
| Rahi et al. | Spectroscopy and spectral imaging techniques for non-destructive food microbial assessment | |
| CN110031442B (en) | Agricultural product pesticide residue detecting system | |
| JP2013050375A (en) | Inspection method of ballast water | |
| CN115003995A (en) | System and method for in-situ optimization of tunable light emitting diode light sources | |
| WO2021187503A1 (en) | Near-infrared spectroscopy-based contamination inspection method and detection device | |
| Gowen et al. | Hyperspectral imaging | |
| Swatland | An investigation of UV meat probe optics, comparing fluorescence, reflectance and colorimetry | |
| CN114414551B (en) | Fish identification method based on LIBS-RAMAN spectrum technology | |
| JP2020038077A (en) | Bone inspection device | |
| US20220120676A1 (en) | Multispectral sample analysis using absorption signatures | |
| Swatland | Recognition of spectra in the automated assessment of pork quality through single optical fibers |
Legal Events
| Date | Code | Title | Description |
|---|---|---|---|
| 121 | Ep: the epo has been informed by wipo that ep was designated in this application |
Ref document number: 15762354 Country of ref document: EP Kind code of ref document: A1 |
|
| DPE1 | Request for preliminary examination filed after expiration of 19th month from priority date (pct application filed from 20040101) | ||
| WWE | Wipo information: entry into national phase |
Ref document number: 15125618 Country of ref document: US |
|
| NENP | Non-entry into the national phase |
Ref country code: DE |
|
| REEP | Request for entry into the european phase |
Ref document number: 2015762354 Country of ref document: EP |
|
| WWE | Wipo information: entry into national phase |
Ref document number: 2015762354 Country of ref document: EP |
|
| ENP | Entry into the national phase |
Ref document number: 2015230052 Country of ref document: AU Date of ref document: 20150313 Kind code of ref document: A |
|
| REG | Reference to national code |
Ref country code: BR Ref legal event code: B01A Ref document number: 112016020980 Country of ref document: BR |
|
| ENP | Entry into the national phase |
Ref document number: 112016020980 Country of ref document: BR Kind code of ref document: A2 Effective date: 20160912 |