WO2015118914A1 - Information display device, information processing device, information display system, and information display method - Google Patents
Information display device, information processing device, information display system, and information display method Download PDFInfo
- Publication number
- WO2015118914A1 WO2015118914A1 PCT/JP2015/050739 JP2015050739W WO2015118914A1 WO 2015118914 A1 WO2015118914 A1 WO 2015118914A1 JP 2015050739 W JP2015050739 W JP 2015050739W WO 2015118914 A1 WO2015118914 A1 WO 2015118914A1
- Authority
- WO
- WIPO (PCT)
- Prior art keywords
- information
- display
- communication quality
- unit
- data
- Prior art date
Links
Images


Classifications
-
- H—ELECTRICITY
- H04—ELECTRIC COMMUNICATION TECHNIQUE
- H04L—TRANSMISSION OF DIGITAL INFORMATION, e.g. TELEGRAPHIC COMMUNICATION
- H04L43/00—Arrangements for monitoring or testing data switching networks
- H04L43/04—Processing captured monitoring data, e.g. for logfile generation
- H04L43/045—Processing captured monitoring data, e.g. for logfile generation for graphical visualisation of monitoring data
-
- G—PHYSICS
- G05—CONTROLLING; REGULATING
- G05B—CONTROL OR REGULATING SYSTEMS IN GENERAL; FUNCTIONAL ELEMENTS OF SUCH SYSTEMS; MONITORING OR TESTING ARRANGEMENTS FOR SUCH SYSTEMS OR ELEMENTS
- G05B19/00—Programme-control systems
- G05B19/02—Programme-control systems electric
- G05B19/04—Programme control other than numerical control, i.e. in sequence controllers or logic controllers
- G05B19/042—Programme control other than numerical control, i.e. in sequence controllers or logic controllers using digital processors
- G05B19/0428—Safety, monitoring
-
- H—ELECTRICITY
- H04—ELECTRIC COMMUNICATION TECHNIQUE
- H04L—TRANSMISSION OF DIGITAL INFORMATION, e.g. TELEGRAPHIC COMMUNICATION
- H04L43/00—Arrangements for monitoring or testing data switching networks
- H04L43/08—Monitoring or testing based on specific metrics, e.g. QoS, energy consumption or environmental parameters
- H04L43/0823—Errors, e.g. transmission errors
-
- H—ELECTRICITY
- H04—ELECTRIC COMMUNICATION TECHNIQUE
- H04L—TRANSMISSION OF DIGITAL INFORMATION, e.g. TELEGRAPHIC COMMUNICATION
- H04L43/00—Arrangements for monitoring or testing data switching networks
- H04L43/08—Monitoring or testing based on specific metrics, e.g. QoS, energy consumption or environmental parameters
- H04L43/0876—Network utilisation, e.g. volume of load or congestion level
- H04L43/0894—Packet rate
-
- G—PHYSICS
- G05—CONTROLLING; REGULATING
- G05B—CONTROL OR REGULATING SYSTEMS IN GENERAL; FUNCTIONAL ELEMENTS OF SUCH SYSTEMS; MONITORING OR TESTING ARRANGEMENTS FOR SUCH SYSTEMS OR ELEMENTS
- G05B2219/00—Program-control systems
- G05B2219/10—Plc systems
- G05B2219/12—Plc mp multi processor system
- G05B2219/1208—Communication, exchange of control, I-O data between different plc
Definitions
- the present invention relates to an information display device, an information processing device, an information display system, and an information display method.
- field devices measuring instruments, operating devices
- control devices that manage and control these devices
- a distributed control system DCS: Distributed Control System
- DCS Distributed Control System
- indexes such as packet error rate (PER), received signal strength (RSSI), and delay between transmission and reception (Latency) are used.
- PER packet error rate
- RSSI received signal strength
- Latency delay between transmission and reception
- the control device acquires information such as the packet error rate and received signal strength as needed and uses it for monitoring and control, but information such as the packet error rate and received signal strength has not been retained. Therefore, it has been impossible to analyze changes over time in the communication quality of the communication path and to indicate whether the communication path is stable for a long time.
- the present invention has been made in view of the above points, and provides an information display device, an information processing device, an information display system, and an information display method for easily showing the stability of a communication path over a long period of time.
- an information display device provides communication quality information indicating communication quality between a display unit, a field device installed in a plant, and an information processing apparatus over a predetermined period.
- a display control unit that displays the statistical information obtained by the statistical processing on the display unit in association with the device specifying information for specifying the field device.
- the communication quality information is information obtained using at least one of communication health information and process data transmitted from the field device.
- the display control unit causes the display unit to display device power information indicating the remaining battery level of the field device in association with the device specifying information.
- the display control unit associates a comparison result between the statistical information and a threshold value set for determining the quality of communication of the field device with the device identification information. Display on the display unit. Moreover, the information display apparatus of this invention can set a different value for every field apparatus as said threshold value.
- the display control unit causes the display unit to display a distribution of the communication quality information in the predetermined period in association with the device specifying information.
- the display control unit causes the display unit to display the statistical information together with the distribution of the communication quality information. Further, in the information display device of the present invention, the display control unit further causes the display unit to display a change over time of the communication quality information.
- the display control unit is superior in communication quality indicated by the communication quality information for the same field device as compared to a communication path currently used by the field device.
- a notification indicating that another communication path exists is displayed on the display unit in association with the device identification information.
- the information processing apparatus includes an arithmetic unit that obtains communication quality information indicating communication quality of the field device using at least one of communication health information and process data transmitted from the field device installed in the plant; A statistical processing unit that obtains statistical information by statistically processing the communication quality information obtained by the arithmetic unit over a predetermined period, and an output unit that outputs the statistical information obtained by the statistical processing unit And comprising.
- the information display system of the present invention is an information display system for displaying information obtained from a plant, and uses at least one of communication health information and process data transmitted from a field device installed in the plant.
- the information display device includes a display unit, and a display control unit that displays the statistical information on the display unit in association with device specifying information that specifies the field device. Prepare.
- the information display method of the present invention is a method for obtaining statistical information by statistically processing communication quality information indicating communication quality between a field device installed in a plant and an information processing apparatus over a predetermined period. And a second step of displaying the statistical information obtained in the first step in correspondence with the device specifying information for specifying the field device.
- the information display method of the present invention can improve the communication quality of the field device using at least one of communication health information and process data transmitted from the field device installed in the plant before the first step.
- the long-term stability of the communication path can be shown in an easily understandable manner.
- 1 is a conceptual diagram of an information display system according to an embodiment of the present invention. It is a sequence diagram which shows the 1st example of operation
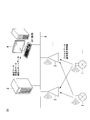
- FIG. 1 is a conceptual diagram of an information display system S1 according to an embodiment of the present invention.
- the information display system S1 is a system for managing and controlling field devices in a plant or factory. Plants include chemical and other industrial plants, plants that manage and control wells in and around gas fields and oil fields, plants that manage and control power generation such as hydropower, thermal power, and nuclear power, and environments such as solar and wind power. There are plants that manage and control power generation, and plants that manage and control water and sewage and dams.
- the information display system S1 includes a field device 1, an access point 2, an information processing device 3, and an information display device 4.
- the field device 1 is, for example, a sensor device such as a flow meter or a temperature sensor, a valve device such as a flow control valve or an on-off valve, an actuator device such as a fan or a motor, a camera or video for photographing a situation or an object in a plant, etc.
- An imaging device an acoustic device such as a microphone or a speaker that collects abnormal sounds or the like in a plant or emits an alarm sound, a position detection device that outputs position information of each device, and other devices.
- the access point 2 is, for example, a backbone router.
- the information processing device 3 is a device that processes information obtained from a plant, and is, for example, a device such as a gateway or a system manager.
- the information display device 4 is a device including a display unit that displays information obtained from a plant by using a GUI (Graphical User Interface).
- the field device 1 and the access point 2 perform wireless communication conforming to an industrial wireless communication standard such as ISA100.11a or WirelessHART (registered trademark).
- the field device 1 can perform redundant communication with a plurality of access points 2 on the first route and the second route. Further, the field device 1 has a function of switching the access point 2 that performs communication as the first route or the second route according to the setting.
- the access point 2, the information processing device 3, and the information display device 4 communicate via the network 5.
- the network 5 is a backbone network, for example.
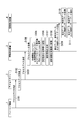
- FIG. 2 is a sequence diagram showing a first example of the operation of the information display system S1.
- the field device 1 acquires process data such as the flow rate, pressure, and temperature of the fluid to be measured, and transmits the acquired process data to the access point 2 via wireless communication (step S101).
- the process data includes transmission time information (time stamp) indicating a transmission time and a sequence number indicating a data number, and is transmitted at a predetermined cycle.
- the access point 2 acquires process data (step S102), and transmits the acquired process data to the information processing apparatus 3 (step S103).
- the information processing apparatus 3 acquires process data (step S104), and based on the acquired process data, sets a reception interval (Interval), a transmission / reception delay (Latency), and a process data loss number (Publication Loss). Calculation is performed (step S105).
- the reception interval, the delay between transmission and reception, and the number of process data loss are communication quality information indicating the communication quality of the communication path from the field device 1 to the information processing apparatus 3. A method for calculating the communication quality information will be described later.
- the information processing device 3 stores the communication quality information of the calculation result as the latest data in the storage unit of the own device (step S106). Next, the information processing device 3 generates statistical information by statistically processing the communication quality information of the calculation result over a predetermined period (step S107).
- the statistical information includes time-series data associated with time and statistical report data.
- the time series data includes minute data, hourly data, and daily data.
- the data per minute is data obtained by statistically processing the communication quality information for one minute.
- the hourly data is data obtained by statistically processing one hour of communication quality information.
- the daily data is data obtained by statistically processing communication quality information for one day.
- the latest data and the time series data include operation state information indicating the operation state of the field device 1.
- the statistical report data is a collection of information for displaying a statistical report described later.
- the information processing apparatus 3 stores the generated statistical information in the storage unit of the own apparatus (step S108).
- the information processing device 3 transmits the latest data, time series data, and statistical report data to the information display device (step S109).
- the information display device 4 acquires the latest data, time series data, and statistical report data (step S110), and displays the acquired information (step S111).
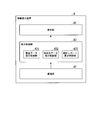
- FIG. 3 is a sequence diagram showing a second example of the operation of the information display system S1.
- the field device 1 transmits communication health information to the access point 2 via wireless communication (step S201).
- the communication soundness information includes the number of successful communication of wireless communication, the number of communication failures, the measured received signal strength, the use channel number, and the number of transmission postpones, and is transmitted at a predetermined cycle. Further, the field device 1 may acquire the communication soundness information for each access point 2 existing in a range where the own device can perform communication.
- the access point 2 acquires communication health information (step S202), and transmits the acquired communication health information to the information processing device 3 (step S203).
- the information processing device 3 acquires communication health information (step S204), and based on the acquired communication health information, the packet error rate (PER), the received signal strength (RSSI), and the transmission see-off rate ( CCA Back off Note that the CCA calculates Clear Channel Association (step S205).
- the packet error rate, received signal strength, and transmission postponing rate are communication quality information. A method for calculating the communication quality information will be described later.
- the information processing device 3 stores the communication quality information of the calculation result as the latest data in the storage unit of the own device (step S206).
- the processing from step S207 to step S211 is the same as the processing from step S107 to step S111 shown in FIG.
- the field device 1 transmits device power information indicating the power state of the device itself to the information processing device 3.
- the device power source information includes information on the remaining battery level.
- FIG. 4 is a block diagram illustrating an example of a schematic functional configuration of the information processing apparatus 3.
- the information processing apparatus 3 includes a communication unit 31, a storage unit 32, an acquisition unit 331, a calculation unit 332, a minute data generation unit 333, an hourly data generation unit 334, a daily data generation unit 335, and a statistical report.
- a generation unit 336 and a transmission control unit 337 are provided.
- the information processing apparatus 3 includes a CPU (Central Processing Unit) and a storage device inside the apparatus.
- CPU Central Processing Unit
- the communication unit 31 includes a communication interface connected to the network 5 and communicates with the access point 2 and the information display device 4.
- the storage unit 32 includes, for example, a main storage device such as a ROM (Read Only Memory) and a RAM (Random Access Memory) and an auxiliary storage device.
- these storage devices include, for example, a large-capacity nonvolatile memory such as a flash memory, a large-capacity volatile memory such as a DRAM (Dynamic Random Access Memory), and a small-capacity nonvolatile memory such as a FeRAM (Ferroelectric Random Access Memory). Configured using memory.
- the storage unit 32 stores various programs to be executed by the CPU included in the information processing apparatus 3, such as firmware and application programs, and results of processing executed by the CPU.
- the storage unit 32 stores setting information indicating a transmission time interval of process data for each device.
- the storage unit 32 stores threshold setting information for each device used for the determination process by the statistical report generation unit 336.
- the storage unit 32 stores channel assignment information indicating assignment of used channel numbers of devices to slots.
- the acquisition unit 331, the calculation unit 332, the minute data generation unit 333, the hourly data generation unit 334, the daily data generation unit 335, the statistical report generation unit 336, and the transmission control unit 337 include, for example, information processing
- the CPU provided in the apparatus 3 functions by executing a program stored in the storage unit 32.
- the storage unit 32 includes a recent data storage unit 321, a minute data storage unit 322, an hourly data storage unit 323, a daily data storage unit 324, and a statistical report storage unit 325.
- the latest data storage unit 321 stores the latest data of communication quality information.
- the minute-by-minute data storage unit 322 stores minute-by-minute data, which is communication quality information for each minute obtained by statistically processing the latest data every minute among time-series data.
- the hourly data storage unit 323 stores hourly data that is communication quality information for each hour obtained by statistically processing the hourly data every hour among the time series data.
- the daily data storage unit 324 stores daily data that is daily communication quality information obtained by statistically processing hourly data for each day among time series data.
- the statistical report storage unit 325 stores statistical report data generated from the communication quality information.
- FIG. 5 is a diagram illustrating an example of the types of storage devices that store data processed by the information processing device 3.
- a flash memory has a large capacity and has a characteristic that data is not lost even when the power is turned off, but the lifetime of the number of writing is short.
- This flash memory stores data per minute, hourly data, daily data, route information indicating the connection mode of each device included in the information display system S1, device information indicating the type and setting of each device, identification information, and the like.
- DRAM loses data when power is turned off, but has a large capacity and a long life of writing.
- temporary storage data temporary storage every minute data used for the calculation of the latest data, hourly data, temporary storage data (temporary storage every hour data) used for daily data calculation.
- FeRAM has a small capacity, but has a characteristic that data is not lost when the power is turned off.
- the FeRAM stores index information that is information about the storage position of each data stored in the flash memory.
- the flash memory is non-volatile, but the number of times of writing is limited. Therefore, in the present embodiment, the information processing device 3 reads the latest data having a high update frequency, the minute data calculated based on the latest data, and the hourly data calculated based on the minute data. To temporarily accumulate. Then, after storing the data for every minute and the data for every hour, the number of times of writing to the flash memory is reduced by moving from the DRAM to the flash memory. Thereby, the information processing apparatus 3 can suppress the failure of the flash memory and hold the data more stably. Further, daily data, path information, and device information calculated based on hourly data stored in the DRAM may be directly written into the flash memory because the update frequency is low.
- the acquisition unit 331 acquires process data and communication health information from the access point 2 via the communication unit 31.
- the acquisition unit 331 outputs the acquired process data and communication health information to the calculation unit 332.
- the calculation unit 332 acquires process data and communication health information from the acquisition unit 331, and calculates communication quality information based on the acquired process data and communication health information.
- the calculation unit 332 stores the latest data of the calculated communication quality information in the latest data storage unit 321 and outputs the latest data to the data generation unit 333 every minute.
- the computing unit 332 computes the packet error rate of the communication health information based on the number of communication failures and the number of communication successes included in the communication health information by the following equation (1).
- PER [%] 100 ⁇ communication failure count / (communication success count + communication failure count) (1)
- the parameter of the packet error rate may be determined based on the measurement time and the total number of communication times for determination.
- the computing unit 332 computes the received signal strength by computing the average value of the measured received signal strength included in the communication soundness information. The average value is calculated by, for example, a moving average.
- the computing unit 332 computes the transmission see-off rate of each channel by the following equation (2).
- Transmission miss rate [%] 100 ⁇ (number of transmission misses for each channel) / (total number of transmission slots for each channel) (2)
- the total number of transmission slots for each channel is acquired from the channel assignment information stored in the storage unit 32.
- the calculation unit 332 calculates the number of process data loss indicating the number of lost process data by the following equation (3).
- Number of process data loss (sequence number received most recently) ⁇ (sequence number received last time) ⁇ 1 (3)
- the calculation unit 332 calculates the delay between transmission and reception of process data by the following equation (4).
- Delay between transmission and reception (process data reception time of information processing device 3)-(transmission time added by field device during transmission) (4)
- the calculation unit 332 calculates the process data reception interval by the following equation (5).
- Reception interval ⁇ (Latest reception time) ⁇ (Previous reception time) ⁇ / (Predetermined transmission time interval) (5)
- FIG. 6 is a timing chart showing the number of process data loss, delay between transmission and reception, and reception interval.
- the horizontal axis indicates time.
- 6 shows the transmission time and sequence number of process data transmitted by the field device 1.
- 6 shows the reception time and sequence number of the process data acquired by the information processing apparatus 3 from the field device 1.
- the number of process data loss, the delay between transmission and reception, and the value of the reception interval are shown.
- the internal clocks of the field device 1 and the information processing device 3 are synchronized.
- the field device 1 transmits process data at a predetermined time interval, for example, at intervals of 10 seconds.
- the field device 1 adds 1 to the sequence number at every transmission.
- the information processing apparatus 3 can identify process data lost in the course of communication by confirming the sequence number. For example, as illustrated in FIG. 6, when the information processing apparatus 3 receives the process data with the sequence number “5” after the process data with the sequence number “3”, the sequence number “ It is estimated that the process data of “4” is lost in the communication process. Therefore, the information processing apparatus 3 calculates the number of process data loss at the transmission time “9:00:40” as “1” by the above-described equation (3). Further, the information processing apparatus 3 does not have to determine the number of process data lost when the first process data is received as in the process data of the sequence number “1” illustrated in FIG. 6.
- the delay between transmission and reception indicates the time until the information processing device 3 receives the process data transmitted from the field device 1.
- the process data with the sequence number “2” is transmitted from the field device 1 to “9:00:10” and received by the information processing apparatus 3 at “9:00:13”. ing. Therefore, the information processing device 3 calculates the inter-transmission / reception delay at the transmission time “9:00:10” as “3” seconds by the above-described equation (4). Further, for example, the information processing apparatus 3 does not measure the inter-transmission / reception delay for the lost process data like the process data of the sequence number “4” shown in FIG.
- the reception interval indicates the reception interval of process data in the information processing apparatus 3.
- the information processing apparatus 3 receives the process data with the sequence number “2” at “9:00:13” and the process data with the sequence number “3” is “9:00:22”. Is receiving.
- the process data transmission time interval by the field device 1 is 10 seconds. Therefore, the information processing device 3 calculates the reception interval at the transmission time “9:00:10” as “0.9” times by the above-described equation (5).
- the information processing apparatus 3 after receiving the process data with the sequence number “3” at “9:00:22”, the information processing apparatus 3 does not receive the process data with the sequence number “4”, but the process data with the sequence number “5”. Is received at “9:00:42”. Therefore, the information processing apparatus 3 calculates the reception interval at the transmission time “9:00:20” as “2.0” times.
- the minute data generation unit 333 performs statistical processing on the acquired latest data and generates data every minute. Specifically, the minute data generation unit 333 acquires, for example, the maximum value, the minimum value, and the average value of the latest data for one minute of the communication quality information, and sets it as the minute data of the communication quality information. For the process data loss count, the minute data generation unit 333 acquires, for example, the integrated value of the latest data for one minute of the process data loss count, and sets it as the minute data. For example, when the hourly data generation unit 333 generates the hourly data for one hour on the DRAM, the generated hourly data is stored in the hourly data storage unit 322 of the flash memory, and the hourly data is generated. To the unit 334.
- the hourly data generation unit 334 When the hourly data generation unit 334 acquires the data per minute from the minute data generation unit 333, the hourly data generation unit 334 performs statistical processing on the acquired data per minute to generate hourly data. Specifically, the hourly data generation unit 334 acquires the maximum value, the minimum value, and the average value for the hourly data for one hour of the communication quality information, and sets it as hourly data for the communication quality information. For the process data loss count, the hourly data generation unit 334 acquires, for example, an integrated value of hourly data for one hour of the process data loss count and uses it as hourly data.
- the hourly data generation unit 334 sets the hourly data of the driving state information to an abnormal state. For example, when generating hourly data for one day on the DRAM, the hourly data generation unit 334 stores the generated hourly data in the hourly data storage unit 323 of the flash memory, and outputs the hourly data to the data generation unit 335 every day. .
- the daily data generation unit 335 When the hourly data generation unit 335 acquires the hourly data from the hourly data generation unit 334, the daily data generation unit 335 statistically processes the acquired hourly data to generate the data every day. Statistical processing by the daily data generation unit 335 is the same as that of the minute data generation unit 333 or the hourly data generation unit 334. For example, the daily data generation unit 335 stores the generated daily data in the daily data storage unit 324 of the flash memory.
- the statistical report generation unit 336 reads time-series data such as data per minute from the storage unit 32 and generates statistical report data.
- Statistical report data is communicated by comparing device identification information, process data transmission time interval setting information for each device, threshold setting information for each device, communication quality information statistical information, and a predetermined threshold. This is data in which a determination result for determining quality is associated with device power supply information.
- the latest information among the latest data of the device power supply information is associated with the device power supply information.
- the statistical report generation unit 336 stores the generated statistical report data in the statistical report storage unit 325.
- the statistical report generation unit 336 may determine the quality of communication quality by comparing hourly data or daily data with a predetermined threshold in the statistical information to generate statistical report data.
- the statistical report generation unit 336 may determine the quality of the communication quality based on the latest calculated statistical information, for example, and may determine the communication quality based on the statistical information at an arbitrary time point designated by the user. Good or bad may be determined.
- the transmission control unit 337 transmits data stored in the information processing device 3 to the information display device 4 via the communication unit 31. For example, when the communication unit 31 receives a request for acquiring the latest data from the information display device 4, the transmission control unit 337 reads the latest data from the latest data storage unit 321 and transmits the read latest data to the information display device 4. Further, for example, when the communication unit 31 receives a time-series data acquisition request from the information display device 4, the transmission control unit 337 receives the data from the minute data storage unit 322, the hourly data storage unit 323, or the daily data storage unit 324. Each minute data, hourly data, or daily data is read, and the read time series data is transmitted to the information display device 4. For example, when the communication unit 31 receives an acquisition request for statistical report data from the information display device 4, the transmission control unit 337 reads the statistical report data from the statistical report storage unit 325, and the read statistical report data is displayed on the information display device. 4 to send.
- FIG. 7 is a block diagram illustrating an example of a schematic functional configuration of the information display apparatus according to the present embodiment.
- the information display device 4 is, for example, a personal computer, a mobile phone, a tablet, a smartphone, or a PDA (Personal Digital Assistant), and includes a CPU and a storage device inside the device.
- the information display device 4 includes a display unit 41, a communication unit 42, and a display control unit 43.
- the information display device 4 may include an input device such as a mouse, a keyboard, or a touch panel.
- the display unit 41 includes, for example, a liquid crystal display or an organic EL (Electro-Luminescence) display.
- the communication unit 42 includes a communication interface connected to the network 5 and communicates with the information processing apparatus 3.
- the display control unit 43 acquires data from the information processing device 3 via the communication unit 42 and causes the display unit 41 to display the acquired data.
- the display control unit 43 includes a latest data display control unit 431, a time-series data display control unit 432, and a statistical report display control unit 433.
- the latest data display control unit 431 transmits an acquisition request for the latest data to the information processing device 3.
- the latest data display control unit 431 causes the display unit 41 to display the acquired latest data.
- the time-series data display control unit 432 transmits a time-series data acquisition request to the information processing apparatus 3.
- the time series data display control unit 432 causes the display unit 41 to display the acquired time series data.
- the statistical report display control unit 433 transmits a statistical report data acquisition request to the information processing device 3.
- the statistical report display control unit 433 causes the display unit 41 to display the acquired statistical report data.
- FIG. 8 is a diagram illustrating an example of a display mode when displaying the latest data or the like.
- Area A1 shows the 1st example of the display mode of the screen which information display device 4 displays.
- the information display device 4 displays, for example, a first example of a display mode at the time of system startup or maintenance.
- the area A11 displays a tab indicating the subnet of the wireless network composed of the field device 1 and the access point 2.
- subnet identification information for example, “10001” in FIG. 8
- the state of the subnet are displayed in association with each other.
- the state of the subnet is indicated by changing the color of the icon “ ⁇ ” arranged on the left side of the subnet identification information in accordance with the communication quality of the field device connected to the subnet.
- the tab displayed in the area A11 can be selected, and the area A12 displays information on the field device 1 connected to the subnet indicated by the selected tab. In the example shown in FIG. 8, “All” indicating all the field devices 1 in the wireless network is selected.
- the table shown in the area A12 shows the latest data for each field device.
- the column C11 shows a status icon that represents an overview of the status of the field device 1.
- the information processing device 3 indicates the state of the field device 1 by changing the color of the state icon according to the driving state information.
- the status icon indicates three statuses of “normal”, “abnormal”, and “warning” by three patterns respectively illustrated by items I11, I12, and I13.
- “Device Tag” in the column C121, “Network ID” in the column C122, and “Vendor / Model” in the column C123 indicate device specifying information for specifying the field device 1.
- “Device Role” in the column C13 indicates setting information (role) of the field device 1.
- “Join Status” in column C14 indicates a connection state of the field device to the network. The connection state includes “Full Join” indicating that the connection is established and “Disconnected” indicating that the communication is disconnected.
- “Operation Status” in the column C15 indicates the operation state of the field device 1. The operation state of the field device includes “Published” for transmitting process data and “Not published” for not transmitting process data.
- “Interval” in column C161 indicates the latest data of the reception interval. “Latency” in column C162 indicates the latest data of the delay between transmission and reception. “Primary Router” in column C163 indicates the access point 2 used by the field device 1 as the first route. “RSSI (P)” in column C164 indicates the latest data of the received signal strength of the field device 1 in communication with the access point 2 used as the first route. “PER (P)” in column C165 indicates the most recent data of the packet error rate of the field device 1 in communication with the access point 2 used as the first route.
- “Secondary Router” in column C166 indicates the access point 2 used by the field device 1 as the second route.
- RSSI (P) indicates the latest data of the received signal strength of the field device 1 in communication with the access point 2 used as the second route.
- PER (P) indicates the most recent data of the packet error rate of the field device 1 in communication with the access point 2 used as the second route.
- CCA Back off indicates the latest data of the transmission miss rate and the channel number obtained by calculating the send miss rate.
- the column “Battery Life” in the column C171 and the column “Power Supply Status” in the column C172 indicate device power supply information indicating the power state of each device.
- “Battery Life” indicates the number of days until the battery (battery) remaining amount is zero or the remaining amount is such that the device cannot be operated.
- “Power Supply Status” in the device power supply information indicates the ratio of the remaining battery capacity to the battery capacity.
- a column for displaying the number of process data loss may be provided.
- information obtained by statistically processing the latest data may be displayed in each item of the communication quality information.
- the information display device 4 may display the maximum value among the reception intervals calculated during the period until the screen is updated. For example, when the screen update cycle is 1 minute, the information display device 4 displays data for every minute of the maximum value of the reception interval. Similarly, for example, the information display device 4 may display the maximum value among the delays between transmission and reception calculated during the period until the screen is updated in the item “Latency” in the column C162.
- the information display device 4 for example, in the item “CCA Back off” in column C169, the maximum value of the transmission rate for each channel calculated within a predetermined time is set to the channel indicating the maximum value. It may be displayed with a number. The channel number will be described later in the description of FIG.
- FIG. 9 is a diagram illustrating an example of a display mode when a statistical report according to the present embodiment is displayed.
- Region A2 shows a second example of the display mode of the screen displayed by information display device 4.
- the information display device 4 displays a second example of the display mode when, for example, the start-up of the system is completed and the system is in an operating state.
- Area A21 displays a list of subnets that make up the wireless network. In the area A21, as in the area A11 in FIG. 8, the subnet identification information and the state of the subnet are displayed in association with each other. In the example shown in FIG. 9, the state of the subnet is indicated by the design of the icon in addition to the color.
- “L” mark in which item I211 is exemplified indicates that all devices in the subnet are normal. “!” Exemplified in item I212 indicates that one or more field devices 1 or access points 2 in the subnet are in a warning state.
- the “x” mark exemplified in the item I213 indicates that there are one or more abnormal devices in the field device 1 or the access point 2 in the subnet.
- the “?” Mark illustrated in the item I214 indicates that the state of the field device 1 or the access point 2 in the subnet is being measured, and the result is an unknown state for which a result has not yet been obtained. In the following, similar marks are used not only to indicate the status of the subnet but also to indicate the status of the device. The meaning of each mark in the case of indicating the state of the device is similar to that described above, “L” is a normal state, “!” Is a warning state, “X” is an abnormal state, “ "?” Indicates that the state is unknown.
- Each subnet displayed in the area A21 can be selected, and the area A22 and the area A23 display information of devices connected to the selected subnet.
- “All” indicating all devices in the wireless network is selected.
- Area A22 indicates the number of devices for each state.
- Items I221, I222, and I223 indicate the number of access points 2 for each state of the device.
- Items I224, I225, and I226 indicate the number of field devices 1 for each device state.
- Items I221 and I224 indicate the number of devices in an abnormal state.
- Items I222 and I225 indicate the number of devices in a warning state.
- Items I223 and I226 indicate the number of devices in an unknown state.
- the table shown in the area A23 shows statistical information for each device.
- the icon shown in the column C21 indicates the role and state of the device.
- the role of the device is indicated by the shape of the icon.
- the outline of “ ⁇ ” like the icon of the item I231 indicates the access point 2.
- the outline of “ ⁇ ” like the icon of the item I232 indicates the field device 1.
- the characters “I” and “R” in the icons of the items I232 and I233 indicate further detailed classification of the field device 1.
- the state of the device may be indicated by, for example, an icon color as described using the items I11, I12, and I13 in FIG.
- the “Device Tag” in the column C221 and the “Model” in the column C222 indicate the device identification information as in the column C121 and the column C123 in FIG. 8, respectively.
- “Publication Period” in column C23 indicates a set value (predetermined transmission time interval) of the process data transmission time interval by the field device 1.
- “Alert Threshold” in the column C24 indicates a setting state of a threshold for determining the state of the field device 1.
- one of two threshold values is set in the field device 1 according to its application.
- the setting of the threshold is indicated by a first threshold “A” and a second threshold “B”.
- the second threshold “B” is a more severe value than the first threshold “A”.
- the first threshold is set, for example, for the field device 1 for monitoring use.
- the second threshold value is set, for example, for a field device 1 for high-speed monitoring that needs to transmit and receive information accurately at short time intervals and a field device 1 for plant control.
- “Status” in column C251 indicates operating state information.
- “Publication Loss” in column C252 indicates a comparison result between the statistical information of the number of process data loss and the threshold value.
- “Interval” in the column C253 indicates a comparison result between the statistical information of the reception interval and the threshold value.
- “Latency” in column C254 indicates a comparison result between the statistical information of the delay between transmission and reception and the threshold value.
- “PER” in column C255 indicates a comparison result between the statistical information of the packet error rate and the threshold value.
- the information display device 4 displays the items in columns C252 to C255 based on the communication state information included in the statistical report data.
- a column for displaying the comparison result between the statistical information of the received signal strength and the transmission see-off rate and the threshold value may be provided.
- “Power Status” in column C26 indicates device power supply information.
- the device power supply information is indicated by an image indicating the power supply state of the device.
- the device power source information is indicated by superimposing information indicating details of the remaining amount of the battery on the image, such as a numerical value indicating the remaining days of the battery.
- the information display device 4 can display a large amount of information in a small area.
- the illustrated image other than the battery indicates a device that is supplied with power from a commercial power source or the like (line connection).
- Area A24 shows a button for changing the display content of the display screen. For example, when the button of the area A24 is pressed, the information display device 4 may display a third example of a display mode to be described later.
- the display of columns C252 to C255 is determined based on statistical information such as an average value or maximum value of communication quality information, for example.
- statistical information such as an average value or maximum value of communication quality information, for example.
- the maximum value of the communication quality information is smaller than the threshold value, it is assumed that the field device 1 is in a normal state for the communication quality information.
- the maximum value of the communication quality information is larger than the threshold value and the average value is equal to or less than the threshold value, it is assumed that the field device 1 is in a warning state for the communication quality information.
- the average value of communication quality information is larger than a threshold value, it is assumed that the field device 1 is in an abnormal state for the communication quality information.
- the statistical information used for displaying the columns C252 to C255 is, for example, data per minute, but the statistical information may be hourly data or daily data.
- FIG. 10 is a table showing an example of a display mode selection method when device power supply information is displayed.
- the “state name” in column C31 indicates the classification of the power supply state of the device.
- Power Supply Status in column C32 indicates the type of power source and the remaining battery level.
- Line Powered indicating that power is supplied from the line (power supply line) and “100-75%”, “75-25%” indicating the remaining battery level, or There are “25-0%” and “Unknown” indicating unknown.
- “Image” in column C33 shows an example of a display mode corresponding to the state of the power source. For example, when “Power Supply Status” in the column C32 is “Line Powered”, an image indicating a line connection associated with the “Line Powered” is selected as “Image”. When the “state name” in the column C31 is “unknown”, an image indicating unknown associated with the “unknown” is selected as the “image”. In addition, when the power source is a battery, an image whose “state name” is “normal” or “warning” is selected from images associated with “Power Supply” corresponding to the remaining battery level. The The image selected in this way is used for displaying the device power information shown in C26 of FIG.
- FIG. 11 is a diagram illustrating an example of a display mode when displaying a distribution of values of communication quality information and the like.
- Region A3 shows a third example of the display mode of the screen displayed by information display device 4.
- the information display device 4 displays the third example of the display mode when there is an abnormal or warning device and communication quality information.
- the information shown in the region A31, the region A32, and the region A33 is the same as the region A21, the region A22, and the region 23 in FIG. 9 described above.
- Area A34 displays a tab indicating communication quality information.
- the communication quality information displayed in the area A34 includes the number of process data loss (“Publication Loss”), the reception interval (“Interval”), the delay between transmission and reception (“Latency”), the packet error rate (“PER”), and the received signal. Strength (“RSSI”) and transmission rate (“CCA Back off”).
- the tab displayed in the area A34 can be selected, and the area A35 displays the distribution of the communication quality information indicated by the selected tab in association with the device identification information. In the example shown in FIG. 11, “PER” is selected, and the distribution of packet error rates is shown in region A35.
- the device displayed in the area A35 may be changeable according to the selection of the subnet in the area A31 or the equipment in the area A33.
- the broken line L31 indicates the first threshold “A” for the communication quality information.
- a broken line L32 indicates the second threshold “B” for the communication quality information.
- the graph G3 is a graph showing the distribution of communication quality information corresponding to the device identification information.
- the horizontal axis of the graph G3 indicates the magnitude of the communication quality information value. Since the field device 1 has two communication routes, the first route and the second route, the graph indicating the distribution of the communication quality information of the first route and the communication of the second route for each piece of device specifying information in the area A35. Two graphs are shown, a graph showing the distribution of quality information. For example, in the example shown in FIG. 11, the distribution of “PER” related to the first route of the field device 1 indicated by the device identification information “DEV002” is shown as a graph G31, and the distribution of “PER” related to the second route is shown in the graph G32. Is shown as
- Each graph showing the distribution of communication quality information is shown as a line connecting points of maximum value, minimum value, and average value respectively exemplified by points P311, P312 and P313, for example.
- each graph of the graph G3 is shown in a mode according to a comparison result between the communication quality information and the threshold value of the device identification information. For example, when the threshold value setting of “DEV002” is the first threshold value “A”, the average value of “PER” indicated by the graph G31 is larger than the first threshold value “A”. The field device 1 is in an abnormal state. Therefore, the point P313 indicating the average value of the graph G31 is indicated by the shape of “x” indicating the abnormal state.
- the graph showing the distribution of communication quality information shows the maximum value, minimum value, and average value of data every minute, but the maximum value, minimum value of hourly data and daily data, And an average value etc. may be shown.
- the point P321 indicating the average value of the graph G313 is indicated by the shape of “ ⁇ ” indicating the normal state.
- the threshold value setting of “DEV003” is the second threshold value “B”
- the maximum value of “PER” indicated by the graph G33 is larger than the second threshold value “B”
- the average value is the first value Since it is smaller than the threshold value “B” of 2
- the point P331 indicating the average value of the graph G33 is indicated by the shape of “ ⁇ ” indicating the warning state.
- Each graph may be displayed in different colors according to the state of the field device 1.
- FIG. 12 is a diagram illustrating an example of a display mode when displaying time-series data of communication quality information and the like.
- Region A4 shows a fourth example of the display mode of the screen displayed by information display device 4.
- the information display device 4 displays, for example, a fourth example of the display mode when there is an abnormal or warning device in the display of the statistical report.
- An area A41 shows device specifying information and settings of the target field device 1 for displaying time-series data.
- Area A42 shows the selection status of communication quality information to be displayed for time-series data. Items that can be selected in the area A42 are substantially the same as those that can be selected in the area A34 of FIG. 11, and the packet error rate and the received signal strength can be selected by distinguishing between the first path and the second path.
- Area A43 shows a graph of time-series data of the communication quality information selected in area A42.
- the time-series data shown in the area A43 is data for every minute, but may be data for every hour or daily data.
- the vertical axis of the graph of the area A43 indicates the magnitude of the communication quality information value.
- the horizontal axis of the graph in the area A43 indicates the date and time.
- a broken line L41 indicates a fluctuation tolerance (Stall Limit) of the reception interval.
- a broken line L42 indicates a threshold value.
- the reception interval “Interval” is selected in the area A42, and the graph G4 of the reception interval “Interval” corresponding to the selection is displayed in the area A43.
- the second threshold “B” is set as the threshold “Threshold” (broken line L42).
- a region A431 indicates a portion where the field device 1 is in a warning state in the graph G4 indicating the time series data of the reception interval.
- a region A432 indicates a portion of the graph G4 in which the maximum value is equal to or less than the threshold value and is in a normal state.
- the marker “ ⁇ ” at point P41 indicates a change in threshold setting or a change in route.
- a region A441 shows details of the change. For example, when the marker at the point P41 is selected by mouse over or the like, the information display device 4 may display the route information of the region A441.
- FIG. 13 is a diagram illustrating an example of a display mode of a threshold setting screen for comparison with statistical information.
- the area A5 shows a fifth example of the display mode of the screen displayed by the information display device 4.
- the area A51 is an area for selecting setting items.
- the area A52 is an area for setting a threshold value to be compared with the statistical information of the communication quality information.
- the area A521 is an area for setting a threshold value related to communication quality information of the field device 1.
- a column C511 of the table shown in the region A521 indicates whether the threshold value to be set is the first threshold value “A” or the second threshold value “B”.
- Column C512 shows the threshold value for the number of process data losses.
- Column C513 indicates the threshold value of the reception interval.
- a column C514 indicates a threshold value for delay between transmission and reception.
- a column C515 indicates a packet error rate threshold.
- Column C516 indicates a threshold value of the received signal strength. Each item in columns C512 to C516 can be selected and input, and a desired value may be set as a threshold value. Further, by setting any item in the columns C512 to C516 to “Disable”, the threshold value may not be set, and the information display device 4 may be set not to notify a warning state or an abnormal state regarding the item.
- a column for setting a threshold value of the transmission send-off rate may be provided.
- Areas A522 and A523 indicate threshold values for the remaining battery level of the field device 1.
- the area A522 is an area for setting the number of days until the battery remaining amount is zero or the remaining amount of the device cannot be operated as a threshold for the device power supply information.
- An area A523 is an area for setting the ratio of the remaining battery capacity to the battery capacity as a threshold for the device power supply information.
- Area A524 is an area for selecting a threshold to be compared with statistical information of communication quality information.
- columns C521, C522, and C523 indicate device identification information.
- a column C524 indicates setting information (role) of the field device 1.
- Column C525 indicates that either the first threshold “A” or the second threshold “B” can be selected as the threshold for the communication quality information.
- the column C526 indicates that the threshold for the device power supply information can be selected from either the remaining amount of zero, the planned number of days until the remaining amount that the device cannot be operated and the ratio of the remaining amount of the battery, or both. .
- FIG. 14 is a diagram illustrating an example of a display mode when displaying the latest data and the like.
- the area A6 shows a sixth example of the display mode of the screen displayed by the information display device 4.
- Items shown in the area A61 are the same as the items shown in the area A11 of FIG.
- the table shown in the area A62 is the same as the table shown in the area A12 in FIG.
- the letter “i” is assigned to the right side of the status icon “ ⁇ ” in the status icon item I61 in the row L61 of the area A62.
- “i-75 dBm” is displayed in the item I62 of “RSSI (S)” in the row L61 of the table in the area A62.
- FIG. 15 is a diagram illustrating an example of a display form of a screen for setting a communication path of the field device 1.
- a region A7 shows a seventh display mode example of the information display device 4.
- the information display device 4 changes the display mode to the seventh example.
- An area A71 indicates device identification information.
- the device identification information is “DEV006”.
- Area A72 shows device identification information of access point 2 on the first route and communication quality information related to access point 2.
- the access point 2 of the first route is “BBR001”, and the received signal strength of the communication quality information is “ ⁇ 65 dBm”.
- Area A73 shows device identification information of access point 2 on the second route and communication quality information related to access point 2.
- the access point 2 of the second route is “BBR002”
- the received signal strength of the communication quality information is “i-75 dBm”.
- the table shown in the area A74 shows information on the access point 2 that can be set as the first route or the second route by the device shown in the region A71. Each row of the table can be selected.
- “Neighbor” in the column C71 and “Vendor / Model” in the column C72 indicate device identification information of the access point 2 that can be set as the first route or the second route by the device indicated in the area A71.
- “Device Role” in column C73 indicates setting information (role).
- “RSSI” in column C74 indicates the received signal strength.
- Area A75 shows a button for setting the access point 2 selected in area A74 as the first route.
- Area A76 shows a button for setting the access point 2 selected in area A74 as the second route.
- Area A77 shows a button for ending the setting of the communication path.
- the received signal strength of “DEV001” shown in row L71 is “ ⁇ 68 dBm”.
- the received signal strength is superior to “ ⁇ 75 dBm” of the received signal strength of the second path shown in the region A73. Therefore, by selecting the row L71 and pressing the button shown in the area A76, “DEV001” may be set as the access point 2 of the second route of “DEV006”, and the communication quality of the second route may be improved. There is.
- the information display device 4 may notify that the delay between transmission and reception is affected when the number of hops changes due to the change in the setting.
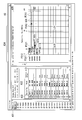
- FIG. 16 is a diagram illustrating an example of a time-dependent change in the frequency band used by the field device 1 for communication.
- the vertical axis indicates the frequency band (channel number).
- the horizontal axis indicates time.
- “A” indicates the field device 1 for normal monitoring, for which the first threshold is set.
- “B” indicates the field device 1 for high-speed monitoring or control for which the second threshold is set.
- the information processing device 3 detects an abnormality of the channel “11” in the time zone T81. Abnormality about the channel is determined by, for example, the transmission transmission rate and the threshold value described above.
- the field device 1 “B” requires better communication quality. Therefore, after the time zone T81, the channel “11” in which the abnormality is detected is not assigned to the field device 1 “B”, and the frequency band from the channels “17” to “22” as shown in the region A81. Is assigned.
- the field device 1 “A” for normal monitoring does not require communication quality as excellent as the field device 1 “B”. Further, the number of channels that can be used by the field device 1 is limited. Therefore, after the time period T81, the field device 1 “A” is proactively assigned the channel “11”, and the field device 1 “B” is set to be easily used preferentially. Has been. Thereby, it is possible to maintain communication constancy in the entire system while avoiding a shortage of channel resources. Such setting may be performed manually or automatically.
- the information display device 4 uses the information processing device 3 to display communication quality information indicating the communication quality between the display unit 41 and the field device 1 installed in the plant and the information processing device 3. And a display control unit 43 that displays statistical information obtained by performing statistical processing over a predetermined period on the display unit 41 in association with device specifying information for specifying the field device 1.
- the information display apparatus 4 can show the stability of the communication path over a long period of time in an easily understandable manner.
- the display control unit 43 causes the display unit 41 to display device power information indicating the remaining battery level of the field device 1 in association with the device identification information.
- the information display device 4 can indicate the remaining battery level of the field device 1 in an easily understandable manner. Therefore, the user of the information display device 4 can maintain the stability of the communication path.
- the display control unit 43 causes the display unit 41 to display the comparison result between the statistical information and the threshold value set for determining whether the communication quality of the field device 1 is good or not, corresponding to the device identification information.
- the information display device 4 can easily show whether or not the state of the communication path is good without checking the numerical values of the statistical information. Therefore, the information display device 4 can more easily show the stability of the communication path over a long period of time.
- the information display device 4 can easily indicate whether or not the state of the communication path is good based on the determination criterion according to the application of the field device 1. Therefore, the information display device 4 can more easily show the stability of the communication path over a long period of time.
- the display control unit 43 causes the display unit 41 to display the distribution of communication quality information in a predetermined period such as 1 minute or 1 hour in association with the device identification information.
- the display control unit 43 causes the display unit 41 to display statistical information together with the distribution of communication quality information. Accordingly, the information display device 4 can simply indicate the communication quality of the communication path from the past to the present, for example. Therefore, the information display device 4 can more easily show the stability of the communication path over a long period of time.
- the display control unit 43 further causes the display unit 41 to display the change over time of the communication quality information.
- the information display apparatus 4 can show the communication quality details of the communication path from the past to the present. Therefore, the information display device 4 can more easily show the stability of the communication path over a long period of time.
- the display control unit 43 uses other communication in which the communication quality indicated by the communication quality information for the same field device 1 is superior to the access point 2 of the communication path currently used by the field device 1.
- a notification indicating that the route access point 2 exists is displayed on the display unit 41 in association with the device identification information. Thereby, the user of the information display device 4 can set a communication path with higher communication quality for the field device 1.
- the information processing device 3 includes a calculation unit 332 that obtains communication quality information indicating communication quality of the field device 1 using at least one of communication health information and process data transmitted from the field device 1 installed in the plant;
- the statistical data processing unit 333, the hourly data generation unit 334, and the daily data generation as statistical processing units that obtain statistical information by statistically processing the communication quality information obtained by the arithmetic unit 332 over a predetermined period.
- a transmission control unit 337 as an output unit that outputs statistical information obtained by the statistical processing unit.
- the information processing apparatus 3 can generate and output data that easily shows the stability of the communication path over a long period of time.
- the information display device 4 displays the transmission postponing rate.
- the user of the information display device 4 can determine which is caused by insufficient received signal strength or interference by external noise. Therefore, for example, the user of the information display device 4 can more appropriately set the hopping pattern of the channel used by the field device 1 and improve the communication quality of the communication path.
- the information display device 4 displays the received signal strength. Thereby, the user of the information display device 4 can determine, for example, that an obstacle has occurred in the communication path or that the installation position of the field device 1 is inappropriate. In addition, the user of the information display device 4 can determine whether the occurrence of the obstacle is temporary due to, for example, passage of a large vehicle or long-term due to plant growth. it can. Then, the user of the information display device 4 appropriately selects measures such as equipment rearrangement, use of an extension antenna, use of a high gain antenna, and entry prohibition measures in the wireless path, and improves the communication quality of the communication path. be able to.
- the information display device 4 displays the reception interval.
- the user of the information display device 4 can confirm, for example, how much margin the calculated reception interval has with respect to the fluctuation tolerance, so that the communication quality of the communication path can be more accurately determined. Can be confirmed.
- the user of the information display device 4 can appropriately select a countermeasure such as adding a retry slot used by the field device 1 and improve the communication quality of the communication path.
- the information display device 4 displays the delay between transmission and reception. Thereby, since the user of the information display apparatus 4 can confirm the degree of occurrence of delay in signal transmission / reception, for example, the communication quality of the communication path can be confirmed more accurately. In addition, when there is an abnormality in the delay between transmission and reception, the user of the information display device 4 can appropriately select measures such as reducing the number of hops in the communication path and improve the communication quality of the communication path.
- the information display device 4 displays the number of process data loss. Unlike the packet error rate which does not indicate whether or not the process data has actually reached the transmission destination through retry or communication on a redundant path, the number of process data loss can indicate this information. Therefore, the user of the information display device 4 can accurately determine the communication quality of the wireless communication based on the same standard as the wired communication in which the communication quality is determined based on whether or not the process data has arrived.
- any item may be displayed.
- the table shown in the area A23 in FIG. 9 may include an item indicating the comparison result between the statistical information of the received signal strength and the threshold value, for example.
- an arbitrary item may be associated with information and displayed in a color-coded manner. For example, when “Join Status” in the column C14 shown in the area A12 of FIG. 8 is “Disconnected”, the information display device 4 may display the corresponding item in red letters to indicate that it is in an abnormal state.
- the information display device 4 displays the corresponding item in yellow characters and displays a warning state. You may show that. Further, for example, when “RSSI (P)” in column C164 and “RSSI (S)” in column C167 are smaller than a predetermined threshold, the information display device 4 displays the corresponding item in yellow characters and displays a warning state. You may show that there is. For example, when “Battery Life” in the column C171 is smaller than a predetermined threshold, the information display device 4 may display the corresponding item in yellow characters to indicate a warning state.
- the color coding may be performed not by changing the character color but by, for example, filling a cell or character.
- the information processing device 3 may express information by performing hatching or underlining.
- the information display device 4 may display information using an arbitrary visual effect.
- the statistical information shown in the display example of the screen display of the information display device 4 described above may be statistically processed over an arbitrary period.
- each item in the columns C252 to C255 shown in the area A23 in FIG. 9 may be, for example, a comparison result between the hourly data and the threshold value, or may be a comparison result between the hourly data and the threshold value.
- the graph shown in the area A43 in FIG. 12 may be any of minute data, hourly data, and daily data.
- the information processing device 3 may statistically process communication quality information without being limited to the above-described period of 1 minute, 1 hour, or 1 day.
- the information processing apparatus 3 may calculate statistical information from communication quality information in an arbitrary period such as 5 minutes or half a day.
- the example in which the field device 1 and the access point 2 are connected via a wireless network has been described.
- the field device 1 and the access point 2 may be connected by wire.
- the information processing device 3 does not have to calculate the received signal strength that specifically matches the determination of the communication quality of wireless communication.
- a part of the information processing device 3 and the information display device 4 in each of the above-described embodiments for example, the acquisition unit 331, the calculation unit 332, the minute data generation unit 333, the hourly data generation unit 334, the daily data generation unit 335, The statistical report generation unit 336, the transmission control unit 337, the display control unit 43, and the like may be realized by a computer.
- a program for realizing this function may be recorded on a computer-readable recording medium, and the program recorded on this recording medium may be read into a computer system and executed.
- the “computer system” is a computer system built in the information processing apparatus 3 and the information display apparatus 4 and includes hardware such as an OS (Operating System) and peripheral devices.
- the “computer-readable recording medium” means a storage device such as a flexible disk, a magneto-optical disk, a portable medium such as a ROM and a CD-ROM, and a hard disk incorporated in a computer system.
- the program may be a program for realizing a part of the functions described above, and may be a program capable of realizing the functions described above in combination with a program already recorded in a computer system.
- a part or all of the information processing apparatus 3 and the information display apparatus 4 in the above-described embodiment may be realized as an integrated circuit such as an LSI (Large Scale Integration).
- LSI Large Scale Integration
- Each functional unit of the information processing device 3 and the information display device 4 may be individually made into a processor, or a part or all of them may be integrated into a processor.
- the method of circuit integration is not limited to LSI, and may be realized by a dedicated circuit or a general-purpose processor.
- an integrated circuit based on the technology may be used.
- the information processing device 3 and the information display device 4 may be integrated as a device.
Landscapes
- Engineering & Computer Science (AREA)
- Computer Networks & Wireless Communication (AREA)
- Signal Processing (AREA)
- Environmental & Geological Engineering (AREA)
- Data Mining & Analysis (AREA)
- Physics & Mathematics (AREA)
- General Physics & Mathematics (AREA)
- Automation & Control Theory (AREA)
- Testing And Monitoring For Control Systems (AREA)
- Mobile Radio Communication Systems (AREA)
- Maintenance And Management Of Digital Transmission (AREA)
Abstract
An information display device is provided with a display unit and a display control unit. The display control unit causes statistical information obtained by statistically processing, over a predefined period and using an information processing device, communication quality information indicating the quality of communication between a field apparatus installed in a plant and the information processing device to be displayed by the display unit in correspondence with apparatus specification information for specifying the field apparatus.
Description
本発明は、情報表示装置、情報処理装置、情報表示システム、および情報表示方法に関する。
The present invention relates to an information display device, an information processing device, an information display system, and an information display method.
従来から、プラントや工場などにおいて高度な自動操業を実現すべく、フィールド機器と呼ばれる現場機器(測定器、操作器)と、これらの管理および制御を行う制御装置とを、通信手段を介して接続した分散制御システム(DCS:Distributed Control System)が構築されている。プラントや工場などの運用を安定させるには、フィールド機器からの情報が損失したり、遅延したりすることなく、制御装置に送信されることが望ましい。
Conventionally, in order to realize advanced automatic operation in plants, factories, etc., field devices called field devices (measuring instruments, operating devices) and control devices that manage and control these devices are connected via communication means. A distributed control system (DCS: Distributed Control System) is constructed. In order to stabilize the operation of a plant or factory, it is desirable that information from the field device is transmitted to the control device without being lost or delayed.
通信経路の監視や設定には、例えば、パケット誤り率(PER:Packet Error Rate)や受信信号強度(RSSI:Received Signal Strength Indication)、送受信間遅延(Latency)などの指標が用いられる。これらの指標に基づいて、無線経路の設定を行う装置が提供されている。
For monitoring and setting the communication path, for example, indexes such as packet error rate (PER), received signal strength (RSSI), and delay between transmission and reception (Latency) are used. An apparatus for setting a wireless path based on these indices is provided.
しかしながら、従来の技術では、通信経路が長時間安定しているか否かがわかりにくい場合があった。例えば、制御装置は、上記パケット誤り率や受信信号強度などの情報を随時取得し、監視や制御に利用するが、当該パケット誤り率や受信信号強度などの情報は保持されて来なかった。従って、通信経路の通信品質の経時変化を解析することができず、通信経路が長期的に安定しているか否かをわかり易く示すことができない場合があった。
However, with the conventional technology, it may be difficult to determine whether the communication path is stable for a long time. For example, the control device acquires information such as the packet error rate and received signal strength as needed and uses it for monitoring and control, but information such as the packet error rate and received signal strength has not been retained. Therefore, it has been impossible to analyze changes over time in the communication quality of the communication path and to indicate whether the communication path is stable for a long time.
本発明は上記の点に鑑みてなされたものであり、通信経路の長期間に亘る安定性をわかり易く示すための情報表示装置、情報処理装置、情報表示システム、および情報表示方法を提供する。
The present invention has been made in view of the above points, and provides an information display device, an information processing device, an information display system, and an information display method for easily showing the stability of a communication path over a long period of time.
上記課題を解決するために、本発明の情報表示装置は、表示部と、プラントに設置されたフィールド機器と情報処理装置との間の通信品質を示す通信品質情報を予め規定された期間に亘って統計処理して得られる統計情報を、前記フィールド機器を特定する機器特定情報に対応させて前記表示部に表示させる表示制御部と、を備える。
また、本発明の情報表示装置は、前記通信品質情報は、前記フィールド機器から送信される通信健全性情報およびプロセスデータの少なくとも一方を用いて求められる情報である。
また、本発明の情報表示装置は、前記表示制御部は、前記フィールド機器のバッテリー残量を示す機器電源情報を、前記機器特定情報に対応させて前記表示部に表示させる。
また、本発明の情報表示装置は、前記表示制御部は、前記統計情報と前記フィールド機器の通信品質の良否を判定するために設定された閾値との比較結果を、前記機器特定情報に対応させて前記表示部に表示させる。
また、本発明の情報表示装置は、前記閾値として、フィールド機器毎に異なる値を設定可能である。
また、本発明の情報表示装置は、前記表示制御部は、前記予め規定された期間における前記通信品質情報の分布を、前記機器特定情報に対応させて前記表示部に表示させる。
また、本発明の情報表示装置は、前記表示制御部は、前記通信品質情報の分布とともに前記統計情報を前記表示部に表示させる。
また、本発明の情報表示装置は、前記表示制御部は、前記通信品質情報の経時変化を前記表示部に更に表示させる。
また、本発明の情報表示装置は、前記表示制御部は、同一のフィールド機器について、前記通信品質情報が示す通信品質が、当該フィールド機器が現在使用している通信経路に比して優れている他の通信経路が存在することを示す通知を、前記機器特定情報に対応させて前記表示部に表示させる。
また、本発明の情報処理装置は、プラントに設置されたフィールド機器から送信される通信健全性情報およびプロセスデータの少なくとも一方を用いて前記フィールド機器の通信品質を示す通信品質情報を求める演算部と、前記演算部によって求められた前記通信品質情報を予め規定された期間に亘って統計処理して統計情報を得る統計処理部と、前記統計処理部で得られた前記統計情報を出力する出力部と、を備える。
また、本発明の情報表示システムは、プラントから得られる情報を表示する情報表示システムであって、前記プラントに設置されたフィールド機器から送信される通信健全性情報およびプロセスデータの少なくとも一方を用いて前記フィールド機器の通信品質を示す通信品質情報を求める演算部と、前記演算部によって求められた前記通信品質情報を予め規定された期間に亘って統計処理して統計情報を得る統計処理部と、前記統計処理部で得られた前記統計情報を出力する出力部と、を備える情報処理装置と、前記情報処理装置から出力される前記統計情報を表示する情報表示装置と、を備える。
また、本発明の情報表示システムにおいて、前記情報表示装置は、表示部と、前記統計情報を、前記フィールド機器を特定する機器特定情報に対応させて前記表示部に表示させる表示制御部と、を備える。
また、本発明の情報表示方法は、プラントに設置されたフィールド機器と情報処理装置との間の通信品質を示す通信品質情報を予め規定された期間に亘って統計処理して統計情報を得る第1ステップと、前記第1ステップで得られた前記統計情報を、前記フィールド機器を特定する機器特定情報に対応させて表示する第2ステップと、を有する。
また、本発明の情報表示方法は、前記第1ステップの前に、前記プラントに設置されたフィールド機器から送信される通信健全性情報およびプロセスデータの少なくとも一方を用いて前記フィールド機器の通信品質を示す通信品質情報を求める第3ステップを有する。 In order to solve the above problems, an information display device according to the present invention provides communication quality information indicating communication quality between a display unit, a field device installed in a plant, and an information processing apparatus over a predetermined period. A display control unit that displays the statistical information obtained by the statistical processing on the display unit in association with the device specifying information for specifying the field device.
In the information display device of the present invention, the communication quality information is information obtained using at least one of communication health information and process data transmitted from the field device.
In the information display device of the present invention, the display control unit causes the display unit to display device power information indicating the remaining battery level of the field device in association with the device specifying information.
Further, in the information display device of the present invention, the display control unit associates a comparison result between the statistical information and a threshold value set for determining the quality of communication of the field device with the device identification information. Display on the display unit.
Moreover, the information display apparatus of this invention can set a different value for every field apparatus as said threshold value.
In the information display device of the present invention, the display control unit causes the display unit to display a distribution of the communication quality information in the predetermined period in association with the device specifying information.
In the information display device of the present invention, the display control unit causes the display unit to display the statistical information together with the distribution of the communication quality information.
Further, in the information display device of the present invention, the display control unit further causes the display unit to display a change over time of the communication quality information.
In the information display device of the present invention, the display control unit is superior in communication quality indicated by the communication quality information for the same field device as compared to a communication path currently used by the field device. A notification indicating that another communication path exists is displayed on the display unit in association with the device identification information.
The information processing apparatus according to the present invention includes an arithmetic unit that obtains communication quality information indicating communication quality of the field device using at least one of communication health information and process data transmitted from the field device installed in the plant; A statistical processing unit that obtains statistical information by statistically processing the communication quality information obtained by the arithmetic unit over a predetermined period, and an output unit that outputs the statistical information obtained by the statistical processing unit And comprising.
The information display system of the present invention is an information display system for displaying information obtained from a plant, and uses at least one of communication health information and process data transmitted from a field device installed in the plant. A calculation unit for obtaining communication quality information indicating the communication quality of the field device; a statistical processing unit for statistically processing the communication quality information obtained by the calculation unit over a predetermined period to obtain statistical information; An information processing device including an output unit that outputs the statistical information obtained by the statistical processing unit; and an information display device that displays the statistical information output from the information processing device.
In the information display system of the present invention, the information display device includes a display unit, and a display control unit that displays the statistical information on the display unit in association with device specifying information that specifies the field device. Prepare.
Further, the information display method of the present invention is a method for obtaining statistical information by statistically processing communication quality information indicating communication quality between a field device installed in a plant and an information processing apparatus over a predetermined period. And a second step of displaying the statistical information obtained in the first step in correspondence with the device specifying information for specifying the field device.
In addition, the information display method of the present invention can improve the communication quality of the field device using at least one of communication health information and process data transmitted from the field device installed in the plant before the first step. A third step of obtaining communication quality information to be indicated.
本発明によれば、通信経路の長期間に亘る安定性をわかり易く示すことができる。
According to the present invention, the long-term stability of the communication path can be shown in an easily understandable manner.
[情報表示システムの概要]
以下、図面を参照しながら本発明の一実施形態について詳しく説明する。
図1は、本発明の一実施形態に係る情報表示システムS1の概念図である。
情報表示システムS1は、プラントや工場などにおいて、フィールド機器を管理し、制御するためのシステムである。プラントとしては、化学等の工業プラントの他、ガス田や油田等の井戸元やその周辺を管理制御するプラント、水力・火力・原子力等の発電を管理制御するプラント、太陽光や風力等の環境発電を管理制御するプラント、上下水やダム等を管理制御するプラント等がある。情報表示システムS1は、フィールド機器1と、アクセスポイント2と、情報処理装置3と、情報表示装置4と、を備える。 [Outline of Information Display System]
Hereinafter, an embodiment of the present invention will be described in detail with reference to the drawings.
FIG. 1 is a conceptual diagram of an information display system S1 according to an embodiment of the present invention.
The information display system S1 is a system for managing and controlling field devices in a plant or factory. Plants include chemical and other industrial plants, plants that manage and control wells in and around gas fields and oil fields, plants that manage and control power generation such as hydropower, thermal power, and nuclear power, and environments such as solar and wind power. There are plants that manage and control power generation, and plants that manage and control water and sewage and dams. The information display system S1 includes afield device 1, an access point 2, an information processing device 3, and an information display device 4.
以下、図面を参照しながら本発明の一実施形態について詳しく説明する。
図1は、本発明の一実施形態に係る情報表示システムS1の概念図である。
情報表示システムS1は、プラントや工場などにおいて、フィールド機器を管理し、制御するためのシステムである。プラントとしては、化学等の工業プラントの他、ガス田や油田等の井戸元やその周辺を管理制御するプラント、水力・火力・原子力等の発電を管理制御するプラント、太陽光や風力等の環境発電を管理制御するプラント、上下水やダム等を管理制御するプラント等がある。情報表示システムS1は、フィールド機器1と、アクセスポイント2と、情報処理装置3と、情報表示装置4と、を備える。 [Outline of Information Display System]
Hereinafter, an embodiment of the present invention will be described in detail with reference to the drawings.
FIG. 1 is a conceptual diagram of an information display system S1 according to an embodiment of the present invention.
The information display system S1 is a system for managing and controlling field devices in a plant or factory. Plants include chemical and other industrial plants, plants that manage and control wells in and around gas fields and oil fields, plants that manage and control power generation such as hydropower, thermal power, and nuclear power, and environments such as solar and wind power. There are plants that manage and control power generation, and plants that manage and control water and sewage and dams. The information display system S1 includes a
フィールド機器1は、例えば流量計や温度センサ等のセンサ機器、流量制御弁や開閉弁等のバルブ機器、ファンやモータ等のアクチュエータ機器、プラント内の状況や対象物を撮影するカメラやビデオ等の撮像機器、プラント内の異音等を収集したり警報音等を発したりするマイクやスピーカ等の音響機器、各機器の位置情報を出力する位置検出機器、その他の機器である。アクセスポイント2は、例えば、バックボーンルータである。情報処理装置3は、プラントから得られる情報を処理する装置であり、例えば、ゲートウェイやシステムマネージャなどの装置である。情報表示装置4は、プラントから得られる情報をGUI(Graphical User Interface)によって表示する表示部を備える装置である。
The field device 1 is, for example, a sensor device such as a flow meter or a temperature sensor, a valve device such as a flow control valve or an on-off valve, an actuator device such as a fan or a motor, a camera or video for photographing a situation or an object in a plant, etc. An imaging device, an acoustic device such as a microphone or a speaker that collects abnormal sounds or the like in a plant or emits an alarm sound, a position detection device that outputs position information of each device, and other devices. The access point 2 is, for example, a backbone router. The information processing device 3 is a device that processes information obtained from a plant, and is, for example, a device such as a gateway or a system manager. The information display device 4 is a device including a display unit that displays information obtained from a plant by using a GUI (Graphical User Interface).
フィールド機器1とアクセスポイント2とは、例えばISA100.11aやWirelessHART(登録商標)等の産業用無線通信規格に準拠した無線通信を行う。フィールド機器1は、例えば、第1経路と第2経路との複数のアクセスポイント2と、冗長化された通信が可能である。また、フィールド機器1は、設定に応じて、第1経路または第2経路として通信を行うアクセスポイント2を切り替える機能を有する。アクセスポイント2と、情報処理装置3と、情報表示装置4とは、ネットワーク5を介して通信を行う。ネットワーク5は、例えばバックボーンネットワークである。
The field device 1 and the access point 2 perform wireless communication conforming to an industrial wireless communication standard such as ISA100.11a or WirelessHART (registered trademark). For example, the field device 1 can perform redundant communication with a plurality of access points 2 on the first route and the second route. Further, the field device 1 has a function of switching the access point 2 that performs communication as the first route or the second route according to the setting. The access point 2, the information processing device 3, and the information display device 4 communicate via the network 5. The network 5 is a backbone network, for example.
図2は、情報表示システムS1の動作の第1例を示すシーケンス図である。
まず、フィールド機器1は、被測定流体の流量や圧力や温度等のプロセスデータを取得し、取得したプロセスデータを、無線通信を介して、アクセスポイント2に送信する(ステップS101)。ここで、プロセスデータは、送信時刻を示す送信時刻情報(タイムスタンプ)と、データ番号を示すシーケンス番号とを含み、所定の周期で送信される。次に、アクセスポイント2は、プロセスデータを取得し(ステップS102)、取得したプロセスデータを情報処理装置3に送信する(ステップS103)。 FIG. 2 is a sequence diagram showing a first example of the operation of the information display system S1.
First, thefield device 1 acquires process data such as the flow rate, pressure, and temperature of the fluid to be measured, and transmits the acquired process data to the access point 2 via wireless communication (step S101). Here, the process data includes transmission time information (time stamp) indicating a transmission time and a sequence number indicating a data number, and is transmitted at a predetermined cycle. Next, the access point 2 acquires process data (step S102), and transmits the acquired process data to the information processing apparatus 3 (step S103).
まず、フィールド機器1は、被測定流体の流量や圧力や温度等のプロセスデータを取得し、取得したプロセスデータを、無線通信を介して、アクセスポイント2に送信する(ステップS101)。ここで、プロセスデータは、送信時刻を示す送信時刻情報(タイムスタンプ)と、データ番号を示すシーケンス番号とを含み、所定の周期で送信される。次に、アクセスポイント2は、プロセスデータを取得し(ステップS102)、取得したプロセスデータを情報処理装置3に送信する(ステップS103)。 FIG. 2 is a sequence diagram showing a first example of the operation of the information display system S1.
First, the
次に、情報処理装置3は、プロセスデータを取得し(ステップS104)、取得したプロセスデータに基づいて、受信間隔(Interval)、送受信間遅延(Latency)、およびプロセスデータ損失数(Publication Loss)を演算する(ステップS105)。受信間隔、送受信間遅延、およびプロセスデータ損失数は、フィールド機器1から情報処理装置3までの通信経路の通信品質を示す通信品質情報である。通信品質情報の算出方法は、後述する。情報処理装置3は、演算結果の通信品質情報を自装置の記憶部に直近データとして記憶する(ステップS106)。次に、情報処理装置3は、演算結果の通信品質情報を、予め規定された期間に亘って統計処理することにより、統計情報を生成する(ステップS107)。
Next, the information processing apparatus 3 acquires process data (step S104), and based on the acquired process data, sets a reception interval (Interval), a transmission / reception delay (Latency), and a process data loss number (Publication Loss). Calculation is performed (step S105). The reception interval, the delay between transmission and reception, and the number of process data loss are communication quality information indicating the communication quality of the communication path from the field device 1 to the information processing apparatus 3. A method for calculating the communication quality information will be described later. The information processing device 3 stores the communication quality information of the calculation result as the latest data in the storage unit of the own device (step S106). Next, the information processing device 3 generates statistical information by statistically processing the communication quality information of the calculation result over a predetermined period (step S107).
ここで、本実施形態において、統計情報には、時間に対応付けられた時系列データと、統計レポートデータとがある。時系列データには、毎分データ、毎時データ、および毎日データがある。毎分データは、1分間の通信品質情報を統計処理したデータである。毎時データは、1時間の通信品質情報を統計処理したデータである。毎日データは、1日間の通信品質情報を統計処理したデータである。直近データと時系列データとには、フィールド機器1の運転状態を示す運転状態情報が含まれる。統計レポートデータは、後述する統計レポートを表示するための情報を集約したものである。
Here, in the present embodiment, the statistical information includes time-series data associated with time and statistical report data. The time series data includes minute data, hourly data, and daily data. The data per minute is data obtained by statistically processing the communication quality information for one minute. The hourly data is data obtained by statistically processing one hour of communication quality information. The daily data is data obtained by statistically processing communication quality information for one day. The latest data and the time series data include operation state information indicating the operation state of the field device 1. The statistical report data is a collection of information for displaying a statistical report described later.
次に、情報処理装置3は、生成した統計情報を自装置の記憶部に記憶する(ステップS108)。情報処理装置3は、情報表示装置4からの要求に応じて、直近データ、時系列データ、および統計レポートデータを情報表示装置に送信する(ステップS109)。情報表示装置4は、直近データ、時系列データ、および統計レポートデータを取得し(ステップS110)、取得した情報を表示する(ステップS111)。
Next, the information processing apparatus 3 stores the generated statistical information in the storage unit of the own apparatus (step S108). In response to the request from the information display device 4, the information processing device 3 transmits the latest data, time series data, and statistical report data to the information display device (step S109). The information display device 4 acquires the latest data, time series data, and statistical report data (step S110), and displays the acquired information (step S111).
図3は、情報表示システムS1の動作の第2例を示すシーケンス図である。
まず、フィールド機器1は、無線通信を介して、通信健全性情報をアクセスポイント2に送信する(ステップS201)。ここで、通信健全性情報は、無線通信の通信成功回数、通信失敗回数、計測受信信号強度、利用チャネル番号、および送信見送り回数を含み、所定の周期で送信される。また、フィールド機器1は、自装置が通信を行うことができる範囲に存在するアクセスポイント2各々について、通信健全性情報を取得してよい。次に、アクセスポイント2は、通信健全性情報を取得し(ステップS202)、取得した通信健全性情報を情報処理装置3に送信する(ステップS203)。 FIG. 3 is a sequence diagram showing a second example of the operation of the information display system S1.
First, thefield device 1 transmits communication health information to the access point 2 via wireless communication (step S201). Here, the communication soundness information includes the number of successful communication of wireless communication, the number of communication failures, the measured received signal strength, the use channel number, and the number of transmission postpones, and is transmitted at a predetermined cycle. Further, the field device 1 may acquire the communication soundness information for each access point 2 existing in a range where the own device can perform communication. Next, the access point 2 acquires communication health information (step S202), and transmits the acquired communication health information to the information processing device 3 (step S203).
まず、フィールド機器1は、無線通信を介して、通信健全性情報をアクセスポイント2に送信する(ステップS201)。ここで、通信健全性情報は、無線通信の通信成功回数、通信失敗回数、計測受信信号強度、利用チャネル番号、および送信見送り回数を含み、所定の周期で送信される。また、フィールド機器1は、自装置が通信を行うことができる範囲に存在するアクセスポイント2各々について、通信健全性情報を取得してよい。次に、アクセスポイント2は、通信健全性情報を取得し(ステップS202)、取得した通信健全性情報を情報処理装置3に送信する(ステップS203)。 FIG. 3 is a sequence diagram showing a second example of the operation of the information display system S1.
First, the
次に、情報処理装置3は、通信健全性情報を取得し(ステップS204)、取得した通信健全性情報に基づいて、パケット誤り率(PER)、受信信号強度(RSSI)、および送信見送り率(CCA Back off。なお、CCAは、Clear Channel Associationの略)を演算する(ステップS205)。パケット誤り率、受信信号強度、および送信見送り率は、通信品質情報である。通信品質情報の算出方法は後述する。情報処理装置3は、演算結果の通信品質情報を自装置の記憶部に直近データとして記憶する(ステップS206)。ステップS207からステップS211までの処理は、それぞれ、図2に示すステップS107からステップS111までの処理と同様であるため説明を省略する。なお、フィールド機器1は、自装置の電源の状態を示す機器電源情報を情報処理装置3に送信する。また、電源がバッテリーの場合、機器電源情報はバッテリー残量の情報を含む。
Next, the information processing device 3 acquires communication health information (step S204), and based on the acquired communication health information, the packet error rate (PER), the received signal strength (RSSI), and the transmission see-off rate ( CCA Back off Note that the CCA calculates Clear Channel Association (step S205). The packet error rate, received signal strength, and transmission postponing rate are communication quality information. A method for calculating the communication quality information will be described later. The information processing device 3 stores the communication quality information of the calculation result as the latest data in the storage unit of the own device (step S206). The processing from step S207 to step S211 is the same as the processing from step S107 to step S111 shown in FIG. The field device 1 transmits device power information indicating the power state of the device itself to the information processing device 3. When the power source is a battery, the device power source information includes information on the remaining battery level.
[情報処理装置の概要]
図4は、情報処理装置3の概略機能構成の一例を示すブロック図である。
情報処理装置3は、通信部31と、記憶部32と、取得部331と、演算部332と、毎分データ生成部333と、毎時データ生成部334と、毎日データ生成部335と、統計レポート生成部336と、送信制御部337と、を備える。また、情報処理装置3は、装置の内部にCPU(Central Processing Unit)や記憶装置を備える。 [Outline of information processing equipment]
FIG. 4 is a block diagram illustrating an example of a schematic functional configuration of theinformation processing apparatus 3.
Theinformation processing apparatus 3 includes a communication unit 31, a storage unit 32, an acquisition unit 331, a calculation unit 332, a minute data generation unit 333, an hourly data generation unit 334, a daily data generation unit 335, and a statistical report. A generation unit 336 and a transmission control unit 337 are provided. In addition, the information processing apparatus 3 includes a CPU (Central Processing Unit) and a storage device inside the apparatus.
図4は、情報処理装置3の概略機能構成の一例を示すブロック図である。
情報処理装置3は、通信部31と、記憶部32と、取得部331と、演算部332と、毎分データ生成部333と、毎時データ生成部334と、毎日データ生成部335と、統計レポート生成部336と、送信制御部337と、を備える。また、情報処理装置3は、装置の内部にCPU(Central Processing Unit)や記憶装置を備える。 [Outline of information processing equipment]
FIG. 4 is a block diagram illustrating an example of a schematic functional configuration of the
The
通信部31は、ネットワーク5に接続される通信インタフェースを備え、アクセスポイント2および情報表示装置4と通信する。
記憶部32は、例えば、ROM(Read Only Memory)やRAM(Random Access Memory)などの主記憶装置と補助記憶装置とを備える。また、これらの記憶装置は、例えば、フラッシュメモリ(Flash memory)などの大容量不揮発メモリや、DRAM(Dynamic Random Access Memory)などの大容量揮発メモリ、FeRAM(Ferroelectric Random Access Memory)などの小容量不揮発メモリを用いて構成される。 Thecommunication unit 31 includes a communication interface connected to the network 5 and communicates with the access point 2 and the information display device 4.
Thestorage unit 32 includes, for example, a main storage device such as a ROM (Read Only Memory) and a RAM (Random Access Memory) and an auxiliary storage device. In addition, these storage devices include, for example, a large-capacity nonvolatile memory such as a flash memory, a large-capacity volatile memory such as a DRAM (Dynamic Random Access Memory), and a small-capacity nonvolatile memory such as a FeRAM (Ferroelectric Random Access Memory). Configured using memory.
記憶部32は、例えば、ROM(Read Only Memory)やRAM(Random Access Memory)などの主記憶装置と補助記憶装置とを備える。また、これらの記憶装置は、例えば、フラッシュメモリ(Flash memory)などの大容量不揮発メモリや、DRAM(Dynamic Random Access Memory)などの大容量揮発メモリ、FeRAM(Ferroelectric Random Access Memory)などの小容量不揮発メモリを用いて構成される。 The
The
また、記憶部32は、ファームウェアやアプリケーションプログラムなど、情報処理装置3が備えるCPUが実行するための各種プログラムやCPUが実行した処理の結果などを記憶する。例えば、記憶部32は、機器毎のプロセスデータの送信時間間隔を示す設定情報を記憶する。また、例えば、記憶部32は、統計レポート生成部336による判定処理に利用する機器毎の閾値の設定情報を記憶する。また、例えば、記憶部32は、機器の使用チャネル番号のスロットへの割り当てを示すチャネル割当情報を記憶する。取得部331と、演算部332と、毎分データ生成部333と、毎時データ生成部334と、毎日データ生成部335と、統計レポート生成部336と、送信制御部337とは、例えば、情報処理装置3の備えるCPUが記憶部32に記憶されているプログラムを実行することによって機能する。
In addition, the storage unit 32 stores various programs to be executed by the CPU included in the information processing apparatus 3, such as firmware and application programs, and results of processing executed by the CPU. For example, the storage unit 32 stores setting information indicating a transmission time interval of process data for each device. For example, the storage unit 32 stores threshold setting information for each device used for the determination process by the statistical report generation unit 336. In addition, for example, the storage unit 32 stores channel assignment information indicating assignment of used channel numbers of devices to slots. The acquisition unit 331, the calculation unit 332, the minute data generation unit 333, the hourly data generation unit 334, the daily data generation unit 335, the statistical report generation unit 336, and the transmission control unit 337 include, for example, information processing The CPU provided in the apparatus 3 functions by executing a program stored in the storage unit 32.
また、記憶部32は、直近データ記憶部321と、毎分データ記憶部322と、毎時データ記憶部323と、毎日データ記憶部324と、統計レポート記憶部325と、を備える。
直近データ記憶部321は、通信品質情報の直近データを記憶する。
毎分データ記憶部322は、時系列データのうち、直近データを1分間毎に統計処理して得られる毎分の通信品質情報である毎分データを記憶する。
毎時データ記憶部323は、時系列データのうち、毎分データを1時間毎に統計処理して得られる毎時の通信品質情報である毎時データを記憶する。
毎日データ記憶部324は、時系列データのうち、毎時データを1日間毎に統計処理して得られる毎日の通信品質情報である毎日データを記憶する。
統計レポート記憶部325は、通信品質情報から生成される統計レポートデータを記憶する。 Thestorage unit 32 includes a recent data storage unit 321, a minute data storage unit 322, an hourly data storage unit 323, a daily data storage unit 324, and a statistical report storage unit 325.
The latestdata storage unit 321 stores the latest data of communication quality information.
The minute-by-minutedata storage unit 322 stores minute-by-minute data, which is communication quality information for each minute obtained by statistically processing the latest data every minute among time-series data.
The hourlydata storage unit 323 stores hourly data that is communication quality information for each hour obtained by statistically processing the hourly data every hour among the time series data.
The dailydata storage unit 324 stores daily data that is daily communication quality information obtained by statistically processing hourly data for each day among time series data.
The statisticalreport storage unit 325 stores statistical report data generated from the communication quality information.
直近データ記憶部321は、通信品質情報の直近データを記憶する。
毎分データ記憶部322は、時系列データのうち、直近データを1分間毎に統計処理して得られる毎分の通信品質情報である毎分データを記憶する。
毎時データ記憶部323は、時系列データのうち、毎分データを1時間毎に統計処理して得られる毎時の通信品質情報である毎時データを記憶する。
毎日データ記憶部324は、時系列データのうち、毎時データを1日間毎に統計処理して得られる毎日の通信品質情報である毎日データを記憶する。
統計レポート記憶部325は、通信品質情報から生成される統計レポートデータを記憶する。 The
The latest
The minute-by-minute
The hourly
The daily
The statistical
図5は、情報処理装置3が処理するデータを記憶する記憶装置の種類の一例を示す図である。
フラッシュメモリは、大容量であり、電源がオフになってもデータが失われないが、書き込み回数の寿命が短いという特性を有する。このフラッシュメモリには、毎分データ、毎時データ、毎日データ、情報表示システムS1が備える各機器の接続態様を示す経路情報、および各機器の種類や設定、識別情報を示す機器情報などが記憶される。 FIG. 5 is a diagram illustrating an example of the types of storage devices that store data processed by theinformation processing device 3.
A flash memory has a large capacity and has a characteristic that data is not lost even when the power is turned off, but the lifetime of the number of writing is short. This flash memory stores data per minute, hourly data, daily data, route information indicating the connection mode of each device included in the information display system S1, device information indicating the type and setting of each device, identification information, and the like. The
フラッシュメモリは、大容量であり、電源がオフになってもデータが失われないが、書き込み回数の寿命が短いという特性を有する。このフラッシュメモリには、毎分データ、毎時データ、毎日データ、情報表示システムS1が備える各機器の接続態様を示す経路情報、および各機器の種類や設定、識別情報を示す機器情報などが記憶される。 FIG. 5 is a diagram illustrating an example of the types of storage devices that store data processed by the
A flash memory has a large capacity and has a characteristic that data is not lost even when the power is turned off, but the lifetime of the number of writing is short. This flash memory stores data per minute, hourly data, daily data, route information indicating the connection mode of each device included in the information display system S1, device information indicating the type and setting of each device, identification information, and the like. The
DRAMは、電源がオフになるとデータが失われるが、大容量であり、書き込み回数の寿命が長いという特性を有する。このDRAMには、直近データ、毎時データの演算に利用する毎分データの一時保存データ(一時保存毎分データ)、毎日データの演算に利用する毎時データの一時保存データ(一時保存毎時データ)が記憶される。
FeRAMは、小容量であるが、電源オフによりデータが失われないという特性を有する。このFeRAMには、フラッシュメモリに記憶される各データの記憶位置についての情報である索引情報が記憶される。 DRAM loses data when power is turned off, but has a large capacity and a long life of writing. In this DRAM, temporary storage data (temporary storage every minute data) used for the calculation of the latest data, hourly data, temporary storage data (temporary storage every hour data) used for daily data calculation, Remembered.
FeRAM has a small capacity, but has a characteristic that data is not lost when the power is turned off. The FeRAM stores index information that is information about the storage position of each data stored in the flash memory.
上述したように、フラッシュメモリは、不揮発性であるが、書き込み回数に制限がある。そこで、本実施形態において、情報処理装置3は、更新頻度が高い直近データと、当該直近データに基づいて演算される毎分データと、当該毎分データに基づいて演算される毎時データとをDRAMに一時的に蓄積させる。そして、毎分データと毎時データとを蓄積後にDRAMからフラッシュメモリに移すことにより、フラッシュメモリの書き込み回数を低減させる。これにより、情報処理装置3は、フラッシュメモリの故障を抑制し、データをより安定して保持することができる。また、DRAMに蓄積された毎時データに基づいて演算される毎日データ、経路情報、および機器情報は、更新頻度が低いため、フラッシュメモリに直接書き込まれてよい。
As described above, the flash memory is non-volatile, but the number of times of writing is limited. Therefore, in the present embodiment, the information processing device 3 reads the latest data having a high update frequency, the minute data calculated based on the latest data, and the hourly data calculated based on the minute data. To temporarily accumulate. Then, after storing the data for every minute and the data for every hour, the number of times of writing to the flash memory is reduced by moving from the DRAM to the flash memory. Thereby, the information processing apparatus 3 can suppress the failure of the flash memory and hold the data more stably. Further, daily data, path information, and device information calculated based on hourly data stored in the DRAM may be directly written into the flash memory because the update frequency is low.
図4の説明に戻り、取得部331は、通信部31を介して、アクセスポイント2からプロセスデータと通信健全性情報とを取得する。取得部331は、取得したプロセスデータと通信健全性情報とを演算部332に出力する。
演算部332は、取得部331からプロセスデータと通信健全性情報とを取得し、取得したプロセスデータと通信健全性情報とに基づいて、通信品質情報を演算する。演算部332は、演算した通信品質情報の直近データを直近データ記憶部321に記憶させ、直近データを毎分データ生成部333に出力する。 Returning to the description of FIG. 4, theacquisition unit 331 acquires process data and communication health information from the access point 2 via the communication unit 31. The acquisition unit 331 outputs the acquired process data and communication health information to the calculation unit 332.
Thecalculation unit 332 acquires process data and communication health information from the acquisition unit 331, and calculates communication quality information based on the acquired process data and communication health information. The calculation unit 332 stores the latest data of the calculated communication quality information in the latest data storage unit 321 and outputs the latest data to the data generation unit 333 every minute.
演算部332は、取得部331からプロセスデータと通信健全性情報とを取得し、取得したプロセスデータと通信健全性情報とに基づいて、通信品質情報を演算する。演算部332は、演算した通信品質情報の直近データを直近データ記憶部321に記憶させ、直近データを毎分データ生成部333に出力する。 Returning to the description of FIG. 4, the
The
演算部332は、通信健全性情報が含む通信失敗回数と通信成功回数とに基づいて通信健全性情報のパケット誤り率を、以下の式(1)により演算する。
PER[%]=100×通信失敗回数/(通信成功回数+通信失敗回数)・・・(1)
パケット誤り率の母数は、測定時間や判定用の全通信回数により決定してよい。
演算部332は、通信健全性情報が含む計測受信信号強度の平均値を演算することにより、受信信号強度を演算する。平均値は、例えば、移動平均などにより算出される。
演算部332は、各チャネルの送信見送り率を以下の式(2)により演算する。
送信見送り率[%]=100×(各チャネルの送信見送り回数)/(各チャネルの全送信スロット数)・・・(2)
各チャネルの全送信スロット数は、記憶部32に記憶されているチャネル割当情報から取得される。 Thecomputing unit 332 computes the packet error rate of the communication health information based on the number of communication failures and the number of communication successes included in the communication health information by the following equation (1).
PER [%] = 100 × communication failure count / (communication success count + communication failure count) (1)
The parameter of the packet error rate may be determined based on the measurement time and the total number of communication times for determination.
Thecomputing unit 332 computes the received signal strength by computing the average value of the measured received signal strength included in the communication soundness information. The average value is calculated by, for example, a moving average.
Thecomputing unit 332 computes the transmission see-off rate of each channel by the following equation (2).
Transmission miss rate [%] = 100 × (number of transmission misses for each channel) / (total number of transmission slots for each channel) (2)
The total number of transmission slots for each channel is acquired from the channel assignment information stored in thestorage unit 32.
PER[%]=100×通信失敗回数/(通信成功回数+通信失敗回数)・・・(1)
パケット誤り率の母数は、測定時間や判定用の全通信回数により決定してよい。
演算部332は、通信健全性情報が含む計測受信信号強度の平均値を演算することにより、受信信号強度を演算する。平均値は、例えば、移動平均などにより算出される。
演算部332は、各チャネルの送信見送り率を以下の式(2)により演算する。
送信見送り率[%]=100×(各チャネルの送信見送り回数)/(各チャネルの全送信スロット数)・・・(2)
各チャネルの全送信スロット数は、記憶部32に記憶されているチャネル割当情報から取得される。 The
PER [%] = 100 × communication failure count / (communication success count + communication failure count) (1)
The parameter of the packet error rate may be determined based on the measurement time and the total number of communication times for determination.
The
The
Transmission miss rate [%] = 100 × (number of transmission misses for each channel) / (total number of transmission slots for each channel) (2)
The total number of transmission slots for each channel is acquired from the channel assignment information stored in the
演算部332は、失われたプロセスデータの数を示すプロセスデータ損失数を以下の式(3)により演算する。
プロセスデータ損失数=(最も新しく受信したシーケンス番号)-(前回受信したシーケンス番号)-1・・・(3)
演算部332は、プロセスデータの送受信間遅延を以下の式(4)により演算する。
送受信間遅延=(情報処理装置3のプロセスデータ受信時刻)-(フィールド機器が送信時に付加した送信時刻)・・・(4)
演算部332は、プロセスデータの受信間隔を以下の式(5)により演算する。
受信間隔={(最新の受信時刻)-(前回の受信時刻)}/(所定の送信時間間隔)・・・(5) Thecalculation unit 332 calculates the number of process data loss indicating the number of lost process data by the following equation (3).
Number of process data loss = (sequence number received most recently) − (sequence number received last time) −1 (3)
Thecalculation unit 332 calculates the delay between transmission and reception of process data by the following equation (4).
Delay between transmission and reception = (process data reception time of information processing device 3)-(transmission time added by field device during transmission) (4)
Thecalculation unit 332 calculates the process data reception interval by the following equation (5).
Reception interval = {(Latest reception time) − (Previous reception time)} / (Predetermined transmission time interval) (5)
プロセスデータ損失数=(最も新しく受信したシーケンス番号)-(前回受信したシーケンス番号)-1・・・(3)
演算部332は、プロセスデータの送受信間遅延を以下の式(4)により演算する。
送受信間遅延=(情報処理装置3のプロセスデータ受信時刻)-(フィールド機器が送信時に付加した送信時刻)・・・(4)
演算部332は、プロセスデータの受信間隔を以下の式(5)により演算する。
受信間隔={(最新の受信時刻)-(前回の受信時刻)}/(所定の送信時間間隔)・・・(5) The
Number of process data loss = (sequence number received most recently) − (sequence number received last time) −1 (3)
The
Delay between transmission and reception = (process data reception time of information processing device 3)-(transmission time added by field device during transmission) (4)
The
Reception interval = {(Latest reception time) − (Previous reception time)} / (Predetermined transmission time interval) (5)
図6は、プロセスデータ損失数、送受信間遅延、および受信間隔を示すタイミングチャートである。
図6において、横軸は、時刻を示す。また、図6の上段は、フィールド機器1が送信するプロセスデータの送信時刻とシーケンス番号とを示す。また、図6の中段は、情報処理装置3がフィールド機器1から取得するプロセスデータの受信時刻とシーケンス番号とを示す。図6の下部には、プロセスデータ損失数、送受信間遅延、および受信間隔の値とが示されている。本実施形態において、フィールド機器1と情報処理装置3との内部時計は同期されている。 FIG. 6 is a timing chart showing the number of process data loss, delay between transmission and reception, and reception interval.
In FIG. 6, the horizontal axis indicates time. 6 shows the transmission time and sequence number of process data transmitted by thefield device 1. 6 shows the reception time and sequence number of the process data acquired by the information processing apparatus 3 from the field device 1. In the lower part of FIG. 6, the number of process data loss, the delay between transmission and reception, and the value of the reception interval are shown. In this embodiment, the internal clocks of the field device 1 and the information processing device 3 are synchronized.
図6において、横軸は、時刻を示す。また、図6の上段は、フィールド機器1が送信するプロセスデータの送信時刻とシーケンス番号とを示す。また、図6の中段は、情報処理装置3がフィールド機器1から取得するプロセスデータの受信時刻とシーケンス番号とを示す。図6の下部には、プロセスデータ損失数、送受信間遅延、および受信間隔の値とが示されている。本実施形態において、フィールド機器1と情報処理装置3との内部時計は同期されている。 FIG. 6 is a timing chart showing the number of process data loss, delay between transmission and reception, and reception interval.
In FIG. 6, the horizontal axis indicates time. 6 shows the transmission time and sequence number of process data transmitted by the
図6において示されるように、フィールド機器1は、所定の時間間隔として、例えば、10秒間隔でプロセスデータを送信する。フィールド機器1は、送信の度に、シーケンス番号に1を加算する。情報処理装置3は、当該シーケンス番号を確認することにより、通信の過程で失われたプロセスデータを識別することができる。例えば、図6において示されるように、情報処理装置3がシーケンス番号「3」のプロセスデータの次に、シーケンス番号「5」のプロセスデータを受信した場合、フィールド機器1から送信されたシーケンス番号「4」のプロセスデータが通信過程で失われたことが推定される。従って、情報処理装置3は、上述の式(3)により、送信時刻「9:00:40」におけるプロセスデータ損失数を「1」と算出する。また、情報処理装置3は、図6において示されるシーケンス番号「1」のプロセスデータのように、最初のプロセスデータを受信した場合、プロセスデータの損失数を判定しなくてよい。
As shown in FIG. 6, the field device 1 transmits process data at a predetermined time interval, for example, at intervals of 10 seconds. The field device 1 adds 1 to the sequence number at every transmission. The information processing apparatus 3 can identify process data lost in the course of communication by confirming the sequence number. For example, as illustrated in FIG. 6, when the information processing apparatus 3 receives the process data with the sequence number “5” after the process data with the sequence number “3”, the sequence number “ It is estimated that the process data of “4” is lost in the communication process. Therefore, the information processing apparatus 3 calculates the number of process data loss at the transmission time “9:00:40” as “1” by the above-described equation (3). Further, the information processing apparatus 3 does not have to determine the number of process data lost when the first process data is received as in the process data of the sequence number “1” illustrated in FIG. 6.
送受信間遅延は、フィールド機器1から送信されたプロセスデータが情報処理装置3により受信されるまでの時間を示す。図6において示されるように、例えば、シーケンス番号「2」のプロセスデータは、フィールド機器1から「9:00:10」に送信され、情報処理装置3により「9:00:13」に受信されている。従って、情報処理装置3は、上述の式(4)により、送信時刻「9:00:10」における送受信間遅延を「3」秒と算出する。また、例えば、情報処理装置3は、図6において示されるシーケンス番号「4」のプロセスデータのように、失われたプロセスデータについては、送受信間遅延を測定しない。
The delay between transmission and reception indicates the time until the information processing device 3 receives the process data transmitted from the field device 1. As shown in FIG. 6, for example, the process data with the sequence number “2” is transmitted from the field device 1 to “9:00:10” and received by the information processing apparatus 3 at “9:00:13”. ing. Therefore, the information processing device 3 calculates the inter-transmission / reception delay at the transmission time “9:00:10” as “3” seconds by the above-described equation (4). Further, for example, the information processing apparatus 3 does not measure the inter-transmission / reception delay for the lost process data like the process data of the sequence number “4” shown in FIG.
受信間隔は、情報処理装置3におけるプロセスデータの受信間隔を示す。図6において示されるように、情報処理装置3は、シーケンス番号「2」のプロセスデータを「9:00:13」に受信し、シーケンス番号「3」のプロセスデータを「9:00:22」に受信している。また、図6に示す例において、フィールド機器1によるプロセスデータの送信時間間隔は10秒である。従って、情報処理装置3は、上述の式(5)により、送信時刻「9:00:10」における受信間隔を「0.9」倍と算出する。また、情報処理装置3は、シーケンス番号「3」のプロセスデータを「9:00:22」に受信した後、シーケンス番号「4」のプロセスデータは受信せず、シーケンス番号「5」のプロセスデータを「9:00:42」に受信している。従って、情報処理装置3は、送信時刻「9:00:20」における受信間隔を「2.0」倍と算出する。
The reception interval indicates the reception interval of process data in the information processing apparatus 3. As illustrated in FIG. 6, the information processing apparatus 3 receives the process data with the sequence number “2” at “9:00:13” and the process data with the sequence number “3” is “9:00:22”. Is receiving. In the example shown in FIG. 6, the process data transmission time interval by the field device 1 is 10 seconds. Therefore, the information processing device 3 calculates the reception interval at the transmission time “9:00:10” as “0.9” times by the above-described equation (5). In addition, after receiving the process data with the sequence number “3” at “9:00:22”, the information processing apparatus 3 does not receive the process data with the sequence number “4”, but the process data with the sequence number “5”. Is received at “9:00:42”. Therefore, the information processing apparatus 3 calculates the reception interval at the transmission time “9:00:20” as “2.0” times.
図4に戻り、説明を続ける。
毎分データ生成部333は、演算部332から直近データを取得すると、取得した直近データを統計処理して毎分データを生成する。具体的には、毎分データ生成部333は、例えば、通信品質情報の1分間分の直近データについて、最大値、最小値、および平均値を取得し、通信品質情報の毎分データとする。なお、プロセスデータ損失数については、毎分データ生成部333は、例えば、プロセスデータ損失数の1分間分の直近データの積算値を取得し、毎分データとする。毎分データ生成部333は、例えば、DRAM上で1時間分の毎分データを生成すると、生成した毎分データをフラッシュメモリの毎分データ記憶部322に記憶させ、毎分データを毎時データ生成部334に出力する。 Returning to FIG. 4, the description will be continued.
When the latest data is acquired from thecalculation unit 332, the minute data generation unit 333 performs statistical processing on the acquired latest data and generates data every minute. Specifically, the minute data generation unit 333 acquires, for example, the maximum value, the minimum value, and the average value of the latest data for one minute of the communication quality information, and sets it as the minute data of the communication quality information. For the process data loss count, the minute data generation unit 333 acquires, for example, the integrated value of the latest data for one minute of the process data loss count, and sets it as the minute data. For example, when the hourly data generation unit 333 generates the hourly data for one hour on the DRAM, the generated hourly data is stored in the hourly data storage unit 322 of the flash memory, and the hourly data is generated. To the unit 334.
毎分データ生成部333は、演算部332から直近データを取得すると、取得した直近データを統計処理して毎分データを生成する。具体的には、毎分データ生成部333は、例えば、通信品質情報の1分間分の直近データについて、最大値、最小値、および平均値を取得し、通信品質情報の毎分データとする。なお、プロセスデータ損失数については、毎分データ生成部333は、例えば、プロセスデータ損失数の1分間分の直近データの積算値を取得し、毎分データとする。毎分データ生成部333は、例えば、DRAM上で1時間分の毎分データを生成すると、生成した毎分データをフラッシュメモリの毎分データ記憶部322に記憶させ、毎分データを毎時データ生成部334に出力する。 Returning to FIG. 4, the description will be continued.
When the latest data is acquired from the
毎時データ生成部334は、毎分データ生成部333から毎分データを取得すると、取得した毎分データを統計処理して毎時データを生成する。具体的には、毎時データ生成部334は、通信品質情報の1時間分の毎分データについて、最大値、最小値、および平均値を取得し、通信品質情報の毎時データとする。なお、プロセスデータ損失数については、毎時データ生成部334は、例えば、プロセスデータ損失数の1時間分の毎分データの積算値を取得し、毎時データとする。また、毎時データ生成部334は、例えば、1時間分の毎分データにおいて、異常状態を示す運転状態情報が1つでもある場合は、運転状態情報の毎時データを異常状態とする。毎時データ生成部334は、例えば、DRAM上で1日分の毎時データを生成すると、生成した毎時データをフラッシュメモリの毎時データ記憶部323に記憶させ、毎時データを毎日データ生成部335に出力する。
When the hourly data generation unit 334 acquires the data per minute from the minute data generation unit 333, the hourly data generation unit 334 performs statistical processing on the acquired data per minute to generate hourly data. Specifically, the hourly data generation unit 334 acquires the maximum value, the minimum value, and the average value for the hourly data for one hour of the communication quality information, and sets it as hourly data for the communication quality information. For the process data loss count, the hourly data generation unit 334 acquires, for example, an integrated value of hourly data for one hour of the process data loss count and uses it as hourly data. Further, for example, when every hour of data for one hour includes at least one driving state information indicating an abnormal state, the hourly data generation unit 334 sets the hourly data of the driving state information to an abnormal state. For example, when generating hourly data for one day on the DRAM, the hourly data generation unit 334 stores the generated hourly data in the hourly data storage unit 323 of the flash memory, and outputs the hourly data to the data generation unit 335 every day. .
毎日データ生成部335は、毎時データ生成部334から毎時データを取得すると、取得した毎時データを統計処理して毎日データを生成する。毎日データ生成部335による統計処理は、毎分データ生成部333または毎時データ生成部334と同様である。毎日データ生成部335は、例えば、生成した毎日データをフラッシュメモリの毎日データ記憶部324に記憶させる。
When the hourly data generation unit 335 acquires the hourly data from the hourly data generation unit 334, the daily data generation unit 335 statistically processes the acquired hourly data to generate the data every day. Statistical processing by the daily data generation unit 335 is the same as that of the minute data generation unit 333 or the hourly data generation unit 334. For example, the daily data generation unit 335 stores the generated daily data in the daily data storage unit 324 of the flash memory.
統計レポート生成部336は、例えば、毎分データなどの時系列データを記憶部32から読み出して、統計レポートデータを生成する。統計レポートデータは、機器特定情報と、機器毎のプロセスデータの送信時間間隔の設定情報と、機器毎の閾値の設定情報と、通信品質情報の統計情報と所定の閾値とを比較することにより通信品質の良否を判定した判定結果と、機器電源情報と、を対応付けたデータである。
ここで、機器電源情報は、機器電源情報の直近データのうち、最新の情報が対応付けられる。統計レポート生成部336は、生成した統計レポートデータを統計レポート記憶部325に記憶させる。なお、統計レポート生成部336は、統計情報のうち、毎時データや毎日データを所定の閾値と比較して通信品質の良否を判定し、統計レポートデータを生成してもよい。また、統計レポート生成部336は、例えば、演算された最新の統計情報に基づいて通信品質の良否を判定してよく、また、ユーザにより指定された任意の時点における統計情報に基づいて通信品質の良否を判定してもよい。 For example, the statisticalreport generation unit 336 reads time-series data such as data per minute from the storage unit 32 and generates statistical report data. Statistical report data is communicated by comparing device identification information, process data transmission time interval setting information for each device, threshold setting information for each device, communication quality information statistical information, and a predetermined threshold. This is data in which a determination result for determining quality is associated with device power supply information.
Here, the latest information among the latest data of the device power supply information is associated with the device power supply information. The statisticalreport generation unit 336 stores the generated statistical report data in the statistical report storage unit 325. Note that the statistical report generation unit 336 may determine the quality of communication quality by comparing hourly data or daily data with a predetermined threshold in the statistical information to generate statistical report data. The statistical report generation unit 336 may determine the quality of the communication quality based on the latest calculated statistical information, for example, and may determine the communication quality based on the statistical information at an arbitrary time point designated by the user. Good or bad may be determined.
ここで、機器電源情報は、機器電源情報の直近データのうち、最新の情報が対応付けられる。統計レポート生成部336は、生成した統計レポートデータを統計レポート記憶部325に記憶させる。なお、統計レポート生成部336は、統計情報のうち、毎時データや毎日データを所定の閾値と比較して通信品質の良否を判定し、統計レポートデータを生成してもよい。また、統計レポート生成部336は、例えば、演算された最新の統計情報に基づいて通信品質の良否を判定してよく、また、ユーザにより指定された任意の時点における統計情報に基づいて通信品質の良否を判定してもよい。 For example, the statistical
Here, the latest information among the latest data of the device power supply information is associated with the device power supply information. The statistical
送信制御部337は、通信部31を介して、情報処理装置3が記憶するデータを情報表示装置4に送信する。例えば、通信部31が情報表示装置4から直近データの取得要求を受信すると、送信制御部337は、直近データ記憶部321から直近データを読み出し、読み出した直近データを情報表示装置4に送信する。また、例えば、通信部31が情報表示装置4から時系列データの取得要求を受信すると、送信制御部337は、毎分データ記憶部322、毎時データ記憶部323、または毎日データ記憶部324から、毎分データ、毎時データ、または毎日データをそれぞれ読み出し、読み出したこれら時系列データを情報表示装置4に送信する。また、例えば、通信部31が情報表示装置4から統計レポートデータの取得要求を受信すると、送信制御部337は、統計レポート記憶部325から統計レポートデータを読み出し、読み出した統計レポートデータを情報表示装置4に送信する。
The transmission control unit 337 transmits data stored in the information processing device 3 to the information display device 4 via the communication unit 31. For example, when the communication unit 31 receives a request for acquiring the latest data from the information display device 4, the transmission control unit 337 reads the latest data from the latest data storage unit 321 and transmits the read latest data to the information display device 4. Further, for example, when the communication unit 31 receives a time-series data acquisition request from the information display device 4, the transmission control unit 337 receives the data from the minute data storage unit 322, the hourly data storage unit 323, or the daily data storage unit 324. Each minute data, hourly data, or daily data is read, and the read time series data is transmitted to the information display device 4. For example, when the communication unit 31 receives an acquisition request for statistical report data from the information display device 4, the transmission control unit 337 reads the statistical report data from the statistical report storage unit 325, and the read statistical report data is displayed on the information display device. 4 to send.
[情報表示装置の概要]
図7は、本実施形態に係る情報表示装置の概略機能構成の一例を示すブロック図である。
情報表示装置4は、例えば、パーソナルコンピュータ、携帯電話、タブレット、スマートフォン、またはPDA(Personal Digital Assistant)などであり、装置の内部にCPUや記憶装置を備える。また、情報表示装置4は、表示部41と、通信部42と、表示制御部43と、を備える。また、情報表示装置4は、マウスやキーボード、タッチパネルなどの入力装置を備えてよい。 [Outline of information display device]
FIG. 7 is a block diagram illustrating an example of a schematic functional configuration of the information display apparatus according to the present embodiment.
Theinformation display device 4 is, for example, a personal computer, a mobile phone, a tablet, a smartphone, or a PDA (Personal Digital Assistant), and includes a CPU and a storage device inside the device. The information display device 4 includes a display unit 41, a communication unit 42, and a display control unit 43. The information display device 4 may include an input device such as a mouse, a keyboard, or a touch panel.
図7は、本実施形態に係る情報表示装置の概略機能構成の一例を示すブロック図である。
情報表示装置4は、例えば、パーソナルコンピュータ、携帯電話、タブレット、スマートフォン、またはPDA(Personal Digital Assistant)などであり、装置の内部にCPUや記憶装置を備える。また、情報表示装置4は、表示部41と、通信部42と、表示制御部43と、を備える。また、情報表示装置4は、マウスやキーボード、タッチパネルなどの入力装置を備えてよい。 [Outline of information display device]
FIG. 7 is a block diagram illustrating an example of a schematic functional configuration of the information display apparatus according to the present embodiment.
The
表示部41は、例えば、液晶ディスプレイや有機EL(Electro-Luminescence)ディスプレイなどを備える。
通信部42は、ネットワーク5に接続される通信インタフェースを備え、情報処理装置3と通信する。
表示制御部43は、通信部42を介して、情報処理装置3からデータを取得し、取得したデータを表示部41に表示させる。表示制御部43は、直近データ表示制御部431と、時系列データ表示制御部432と、統計レポート表示制御部433と、を備える。 Thedisplay unit 41 includes, for example, a liquid crystal display or an organic EL (Electro-Luminescence) display.
Thecommunication unit 42 includes a communication interface connected to the network 5 and communicates with the information processing apparatus 3.
Thedisplay control unit 43 acquires data from the information processing device 3 via the communication unit 42 and causes the display unit 41 to display the acquired data. The display control unit 43 includes a latest data display control unit 431, a time-series data display control unit 432, and a statistical report display control unit 433.
通信部42は、ネットワーク5に接続される通信インタフェースを備え、情報処理装置3と通信する。
表示制御部43は、通信部42を介して、情報処理装置3からデータを取得し、取得したデータを表示部41に表示させる。表示制御部43は、直近データ表示制御部431と、時系列データ表示制御部432と、統計レポート表示制御部433と、を備える。 The
The
The
直近データ表示制御部431は、情報処理装置3に対して直近データの取得要求を送信する。当該取得要求に応じて送信された直近データを通信部42が受信すると、直近データ表示制御部431は、取得した直近データを表示部41に表示させる。
時系列データ表示制御部432は、情報処理装置3に対して時系列データの取得要求を送信する。当該取得要求に応じて送信された時系列データを通信部42が受信すると、時系列データ表示制御部432は、取得した時系列データを表示部41に表示させる。
統計レポート表示制御部433は、情報処理装置3に対して統計レポートデータの取得要求を送信する。当該取得要求に応じて送信された統計レポートデータを通信部42が受信すると、統計レポート表示制御部433は、取得した統計レポートデータを表示部41に表示させる。 The latest datadisplay control unit 431 transmits an acquisition request for the latest data to the information processing device 3. When the communication unit 42 receives the latest data transmitted in response to the acquisition request, the latest data display control unit 431 causes the display unit 41 to display the acquired latest data.
The time-series datadisplay control unit 432 transmits a time-series data acquisition request to the information processing apparatus 3. When the communication unit 42 receives the time series data transmitted in response to the acquisition request, the time series data display control unit 432 causes the display unit 41 to display the acquired time series data.
The statistical reportdisplay control unit 433 transmits a statistical report data acquisition request to the information processing device 3. When the communication unit 42 receives the statistical report data transmitted in response to the acquisition request, the statistical report display control unit 433 causes the display unit 41 to display the acquired statistical report data.
時系列データ表示制御部432は、情報処理装置3に対して時系列データの取得要求を送信する。当該取得要求に応じて送信された時系列データを通信部42が受信すると、時系列データ表示制御部432は、取得した時系列データを表示部41に表示させる。
統計レポート表示制御部433は、情報処理装置3に対して統計レポートデータの取得要求を送信する。当該取得要求に応じて送信された統計レポートデータを通信部42が受信すると、統計レポート表示制御部433は、取得した統計レポートデータを表示部41に表示させる。 The latest data
The time-series data
The statistical report
[情報表示装置による表示態様の概要]
図8は、直近データなどを表示する場合の表示態様の一例を示す図である。
領域A1は、情報表示装置4が表示する画面の表示態様の第1例を示す。情報表示装置4は、例えば、システムの立ち上げ時やメンテナンス時に表示態様の第1例を表示する。領域A11は、フィールド機器1およびアクセスポイント2で構成される無線ネットワークのサブネットを示すタブを表示する。また、領域A11には、サブネットの識別情報(例えば、図8における「10001」)と当該サブネットの状態とが対応付けて表示される。サブネットの状態は、サブネットに接続されるフィールド機器の通信品質に応じて、サブネットの識別情報の左側に配置されたアイコン「○」の色を変化させることにより示される。領域A11に表示されるタブは選択可能であり、領域A12は、選択されたタブが示すサブネットに接続されるフィールド機器1の情報を表示する。図8において示される例では、無線ネットワーク内のすべてのフィールド機器1を示す「All(オール)」が選択されている。 [Outline of display mode by information display device]
FIG. 8 is a diagram illustrating an example of a display mode when displaying the latest data or the like.
Area A1 shows the 1st example of the display mode of the screen whichinformation display device 4 displays. The information display device 4 displays, for example, a first example of a display mode at the time of system startup or maintenance. The area A11 displays a tab indicating the subnet of the wireless network composed of the field device 1 and the access point 2. In the area A11, subnet identification information (for example, “10001” in FIG. 8) and the state of the subnet are displayed in association with each other. The state of the subnet is indicated by changing the color of the icon “◯” arranged on the left side of the subnet identification information in accordance with the communication quality of the field device connected to the subnet. The tab displayed in the area A11 can be selected, and the area A12 displays information on the field device 1 connected to the subnet indicated by the selected tab. In the example shown in FIG. 8, “All” indicating all the field devices 1 in the wireless network is selected.
図8は、直近データなどを表示する場合の表示態様の一例を示す図である。
領域A1は、情報表示装置4が表示する画面の表示態様の第1例を示す。情報表示装置4は、例えば、システムの立ち上げ時やメンテナンス時に表示態様の第1例を表示する。領域A11は、フィールド機器1およびアクセスポイント2で構成される無線ネットワークのサブネットを示すタブを表示する。また、領域A11には、サブネットの識別情報(例えば、図8における「10001」)と当該サブネットの状態とが対応付けて表示される。サブネットの状態は、サブネットに接続されるフィールド機器の通信品質に応じて、サブネットの識別情報の左側に配置されたアイコン「○」の色を変化させることにより示される。領域A11に表示されるタブは選択可能であり、領域A12は、選択されたタブが示すサブネットに接続されるフィールド機器1の情報を表示する。図8において示される例では、無線ネットワーク内のすべてのフィールド機器1を示す「All(オール)」が選択されている。 [Outline of display mode by information display device]
FIG. 8 is a diagram illustrating an example of a display mode when displaying the latest data or the like.
Area A1 shows the 1st example of the display mode of the screen which
領域A12において示される表は、フィールド機器毎の直近データなどを示す。
列C11は、フィールド機器1の状態の概要を表す状態アイコンを示す。情報処理装置3は、運転状態情報に応じて状態アイコンの色を変化させることにより、フィールド機器1の状態を示す。図8において示される例では、状態アイコンは、項目I11、I12、およびI13によってそれぞれ例示される3つのパターンによって、「正常」、「異常」、および「警告」の3つの状態を示す。 The table shown in the area A12 shows the latest data for each field device.
The column C11 shows a status icon that represents an overview of the status of thefield device 1. The information processing device 3 indicates the state of the field device 1 by changing the color of the state icon according to the driving state information. In the example shown in FIG. 8, the status icon indicates three statuses of “normal”, “abnormal”, and “warning” by three patterns respectively illustrated by items I11, I12, and I13.
列C11は、フィールド機器1の状態の概要を表す状態アイコンを示す。情報処理装置3は、運転状態情報に応じて状態アイコンの色を変化させることにより、フィールド機器1の状態を示す。図8において示される例では、状態アイコンは、項目I11、I12、およびI13によってそれぞれ例示される3つのパターンによって、「正常」、「異常」、および「警告」の3つの状態を示す。 The table shown in the area A12 shows the latest data for each field device.
The column C11 shows a status icon that represents an overview of the status of the
列C121の「Device Tag」、列C122の「Network ID」、および列C123の「Vendor/Model」は、フィールド機器1を特定する機器特定情報を示す。列C13の「Device Role」は、フィールド機器1の設定情報(役割)を示す。列C14の「Join Status」は、フィールド機器のネットワークへの接続状態を示す。接続状態には、接続されていることを示す「Full Join」と、通信が切断されていることを示す「Disconnected」とがある。列C15の「Operation Status」は、フィールド機器1の運転状態を示す。
フィールド機器の運転状態には、プロセスデータを送信する「Published」と、プロセスデータを送信しない「Not publish」とがある。 “Device Tag” in the column C121, “Network ID” in the column C122, and “Vendor / Model” in the column C123 indicate device specifying information for specifying thefield device 1. “Device Role” in the column C13 indicates setting information (role) of the field device 1. “Join Status” in column C14 indicates a connection state of the field device to the network. The connection state includes “Full Join” indicating that the connection is established and “Disconnected” indicating that the communication is disconnected. “Operation Status” in the column C15 indicates the operation state of the field device 1.
The operation state of the field device includes “Published” for transmitting process data and “Not published” for not transmitting process data.
フィールド機器の運転状態には、プロセスデータを送信する「Published」と、プロセスデータを送信しない「Not publish」とがある。 “Device Tag” in the column C121, “Network ID” in the column C122, and “Vendor / Model” in the column C123 indicate device specifying information for specifying the
The operation state of the field device includes “Published” for transmitting process data and “Not published” for not transmitting process data.
列C161の「Interval」は、受信間隔の直近データを示す。列C162の「Latency」は、送受信間遅延の直近データを示す。列C163の「Primary Router」は、フィールド機器1が第1経路として利用するアクセスポイント2を示す。列C164の「RSSI(P)」は、第1経路として利用するアクセスポイント2との通信におけるフィールド機器1の受信信号強度の直近データを示す。列C165の「PER(P)」は、第1経路として利用するアクセスポイント2との通信におけるフィールド機器1のパケット誤り率の直近データを示す。
“Interval” in column C161 indicates the latest data of the reception interval. “Latency” in column C162 indicates the latest data of the delay between transmission and reception. “Primary Router” in column C163 indicates the access point 2 used by the field device 1 as the first route. “RSSI (P)” in column C164 indicates the latest data of the received signal strength of the field device 1 in communication with the access point 2 used as the first route. “PER (P)” in column C165 indicates the most recent data of the packet error rate of the field device 1 in communication with the access point 2 used as the first route.
列C166の「Secondary Router」は、フィールド機器1が第2経路として利用するアクセスポイント2を示す。列C167の「RSSI(P)」は、第2経路として利用するアクセスポイント2との通信におけるフィールド機器1の受信信号強度の直近データを示す。列C168の「PER(P)」は、第2経路として利用するアクセスポイント2との通信におけるフィールド機器1のパケット誤り率の直近データを示す。列C169の「CCA Back off」は、送信見送り率と、当該送信見送り率を演算したチャネル番号との直近データを示す。
“Secondary Router” in column C166 indicates the access point 2 used by the field device 1 as the second route. “RSSI (P)” in column C167 indicates the latest data of the received signal strength of the field device 1 in communication with the access point 2 used as the second route. “PER (P)” in column C168 indicates the most recent data of the packet error rate of the field device 1 in communication with the access point 2 used as the second route. “CCA Back off” in column C169 indicates the latest data of the transmission miss rate and the channel number obtained by calculating the send miss rate.
列C171の「Battery Life」と、列C172の「Power Supply Status」は、機器毎の電源の状態を示す機器電源情報を示す。機器電源情報のうち、「Battery Life」は、電池(バッテリー)残量がゼロ、又は機器を動作させることのできない程度の残量になるまでの日数を示す。また、機器電源情報のうち、「Power Supply Status」は、電池容量に対するバッテリー残量の比率を示す。なお、図示されていないが、プロセスデータ損失数を表示する列を設けてもよい。
The column “Battery Life” in the column C171 and the column “Power Supply Status” in the column C172 indicate device power supply information indicating the power state of each device. Among the device power supply information, “Battery Life” indicates the number of days until the battery (battery) remaining amount is zero or the remaining amount is such that the device cannot be operated. Also, “Power Supply Status” in the device power supply information indicates the ratio of the remaining battery capacity to the battery capacity. Although not shown, a column for displaying the number of process data loss may be provided.
表示態様の第1例において、通信品質情報の各項目には、直近データを統計処理した情報を表示してもよい。情報表示装置4は、例えば、列C161の「Interval」の項目において、画面が更新されるまでの期間中に演算された受信間隔のうち、最大値を表示してよい。例えば、画面の更新周期が1分間の場合、情報表示装置4は、受信間隔の最大値の毎分データを表示する。同様に、情報表示装置4は、例えば、列C162の「Latency」の項目において、画面が更新されるまでの期間中に演算された送受信間遅延のうち、最大値を表示してよい。また、情報表示装置4は、例えば、列C169の「CCA Back off」の項目において、所定の時間内に演算されたチャネル毎の送信見送り率のうちの最大値を、当該最大値を示したチャネル番号とともに表示してよい。なお、チャネル番号は、図16の説明において後で説明する。
In the first example of the display mode, information obtained by statistically processing the latest data may be displayed in each item of the communication quality information. For example, in the item “Interval” in column C161, the information display device 4 may display the maximum value among the reception intervals calculated during the period until the screen is updated. For example, when the screen update cycle is 1 minute, the information display device 4 displays data for every minute of the maximum value of the reception interval. Similarly, for example, the information display device 4 may display the maximum value among the delays between transmission and reception calculated during the period until the screen is updated in the item “Latency” in the column C162. In addition, the information display device 4, for example, in the item “CCA Back off” in column C169, the maximum value of the transmission rate for each channel calculated within a predetermined time is set to the channel indicating the maximum value. It may be displayed with a number. The channel number will be described later in the description of FIG.
図9は、本実施形態に係る統計レポートを表示する場合の表示態様の一例を示す図である。
領域A2は、情報表示装置4が表示する画面の表示態様の第2例を示す。情報表示装置4は、例えば、システムの立ち上げが完了し、稼働状態となった場合に、表示態様の第2例を表示する。領域A21は、無線ネットワークを構成するサブネットを一覧表示する。
また、領域A21には、図8の領域A11と同様に、サブネットの識別情報と当該サブネットの状態とが対応付けて表示される。また、図9において示される例では、色に加えて、アイコンの意匠により、サブネットの状態が示される。 FIG. 9 is a diagram illustrating an example of a display mode when a statistical report according to the present embodiment is displayed.
Region A2 shows a second example of the display mode of the screen displayed byinformation display device 4. The information display device 4 displays a second example of the display mode when, for example, the start-up of the system is completed and the system is in an operating state. Area A21 displays a list of subnets that make up the wireless network.
In the area A21, as in the area A11 in FIG. 8, the subnet identification information and the state of the subnet are displayed in association with each other. In the example shown in FIG. 9, the state of the subnet is indicated by the design of the icon in addition to the color.
領域A2は、情報表示装置4が表示する画面の表示態様の第2例を示す。情報表示装置4は、例えば、システムの立ち上げが完了し、稼働状態となった場合に、表示態様の第2例を表示する。領域A21は、無線ネットワークを構成するサブネットを一覧表示する。
また、領域A21には、図8の領域A11と同様に、サブネットの識別情報と当該サブネットの状態とが対応付けて表示される。また、図9において示される例では、色に加えて、アイコンの意匠により、サブネットの状態が示される。 FIG. 9 is a diagram illustrating an example of a display mode when a statistical report according to the present embodiment is displayed.
Region A2 shows a second example of the display mode of the screen displayed by
In the area A21, as in the area A11 in FIG. 8, the subnet identification information and the state of the subnet are displayed in association with each other. In the example shown in FIG. 9, the state of the subnet is indicated by the design of the icon in addition to the color.
項目I211が例示される「レ」マークは、サブネット内のすべての機器が正常であることを示す。項目I212に例示される「!」は、サブネット内のフィールド機器1またはアクセスポイント2に、1台以上、警告状態のものがあることを示す。項目I213に例示される「×」マークは、サブネット内のフィールド機器1またはアクセスポイント2に、1台以上の異常状態のものがあることを示す。項目I214に例示される「?」マークは、サブネット内のフィールド機器1またはアクセスポイント2の状態を測定中であり、まだ結果が得られていない不明状態であることを表す。なお、以下では、サブネットの状態だけでなく、機器の状態を示すためにも同様のマークが利用される。機器の状態を示す場合の各マークの意味は上述したものに類似し、「レ」は正常状態であること、「!」は警告状態であること、「×」は異常状態であること、「?」は不明状態であることを、それぞれ示す。
“L” mark in which item I211 is exemplified indicates that all devices in the subnet are normal. “!” Exemplified in item I212 indicates that one or more field devices 1 or access points 2 in the subnet are in a warning state. The “x” mark exemplified in the item I213 indicates that there are one or more abnormal devices in the field device 1 or the access point 2 in the subnet. The “?” Mark illustrated in the item I214 indicates that the state of the field device 1 or the access point 2 in the subnet is being measured, and the result is an unknown state for which a result has not yet been obtained. In the following, similar marks are used not only to indicate the status of the subnet but also to indicate the status of the device. The meaning of each mark in the case of indicating the state of the device is similar to that described above, “L” is a normal state, “!” Is a warning state, “X” is an abnormal state, “ "?" Indicates that the state is unknown.
領域A21に表示される各サブネットは選択可能であり、領域A22および領域A23は、選択されたサブネットに接続される機器の情報を表示する。図9において示される例では、無線ネットワーク内のすべての機器を示す「All(オール)」が選択されている。
Each subnet displayed in the area A21 can be selected, and the area A22 and the area A23 display information of devices connected to the selected subnet. In the example shown in FIG. 9, “All” indicating all devices in the wireless network is selected.
領域A22は、状態毎の機器の数を示す。項目I221、I222、およびI223は、アクセスポイント2の数を機器の状態毎に示す。項目I224、I225、およびI226は、フィールド機器1の数を機器の状態毎に示す。項目I221およびI224は、異常状態の機器の数を示す。項目I222およびI225は、警告状態の機器の数を示す。項目I223およびI226は、不明状態の機器の数を示す。
Area A22 indicates the number of devices for each state. Items I221, I222, and I223 indicate the number of access points 2 for each state of the device. Items I224, I225, and I226 indicate the number of field devices 1 for each device state. Items I221 and I224 indicate the number of devices in an abnormal state. Items I222 and I225 indicate the number of devices in a warning state. Items I223 and I226 indicate the number of devices in an unknown state.
領域A23において示される表は、機器毎の統計情報などを示す。列C21において示されるアイコンは、機器の役割と状態とを示す。図9の例において、機器の役割は、アイコンの形状により示され、例えば、項目I231のアイコンのような「□」の輪郭は、アクセスポイント2を示す。また、例えば、項目I232のアイコンのような「○」の輪郭は、フィールド機器1を示す。また、項目I232およびI233のアイコンの中の文字「I」と「R」とは、フィールド機器1のさらに詳細な分類を示す。また、機器の状態は、例えば、図8の項目I11、I12、およびI13を用いて説明したように、例えば、アイコンの色によって示されてよい。
The table shown in the area A23 shows statistical information for each device. The icon shown in the column C21 indicates the role and state of the device. In the example of FIG. 9, the role of the device is indicated by the shape of the icon. For example, the outline of “□” like the icon of the item I231 indicates the access point 2. For example, the outline of “◯” like the icon of the item I232 indicates the field device 1. In addition, the characters “I” and “R” in the icons of the items I232 and I233 indicate further detailed classification of the field device 1. Further, the state of the device may be indicated by, for example, an icon color as described using the items I11, I12, and I13 in FIG.
列C221の「Device Tag」と列C222の「Model」とは、それぞれ、図8の列C121および列C123と同様に、機器特定情報を示す。列C23の「Publication Period」は、フィールド機器1によるプロセスデータの送信時間間隔の設定値(所定の送信時間間隔)を示す。列C24の「Alert Threshold」は、フィールド機器1の状態を判定するための閾値の設定状態を示す。本実施形態において、フィールド機器1には、その用途に応じて2つの閾値のうちのいずれかが設定される。図9において示される例では、当該閾値の設定は第1の閾値「A」と第2の閾値「B」とにより示されている。本実施形態において、第2の閾値「B」は、第1の閾値「A」に比してより条件の厳しい値である。第1の閾値は、例えば、監視用途のフィールド機器1に対して設定される。第2の閾値は、例えば、短い時間間隔で正確に情報を送受信する必要がある高速監視用途のフィールド機器1やプラントの制御用途のフィールド機器1に対して設定される。
The “Device Tag” in the column C221 and the “Model” in the column C222 indicate the device identification information as in the column C121 and the column C123 in FIG. 8, respectively. “Publication Period” in column C23 indicates a set value (predetermined transmission time interval) of the process data transmission time interval by the field device 1. “Alert Threshold” in the column C24 indicates a setting state of a threshold for determining the state of the field device 1. In the present embodiment, one of two threshold values is set in the field device 1 according to its application. In the example shown in FIG. 9, the setting of the threshold is indicated by a first threshold “A” and a second threshold “B”. In the present embodiment, the second threshold “B” is a more severe value than the first threshold “A”. The first threshold is set, for example, for the field device 1 for monitoring use. The second threshold value is set, for example, for a field device 1 for high-speed monitoring that needs to transmit and receive information accurately at short time intervals and a field device 1 for plant control.
列C251の「Status」は、運転状態情報を示す。列C252の「Publication Loss」は、プロセスデータ損失数の統計情報と閾値との比較結果を示す。列C253の「Interval」は、受信間隔の統計情報と閾値との比較結果を示す。列C254の「Latency」は、送受信間遅延の統計情報と閾値との比較結果を示す。列C255の「PER」は、パケット誤り率の統計情報と閾値との比較結果を示す。情報表示装置4は、統計レポートデータが含む通信状態情報に基づいて、列C252からC255の項目を表示する。なお、図示されていないが、受信信号強度や送信見送り率の統計情報と閾値との比較結果を表示する列を設けてもよい。
“Status” in column C251 indicates operating state information. “Publication Loss” in column C252 indicates a comparison result between the statistical information of the number of process data loss and the threshold value. “Interval” in the column C253 indicates a comparison result between the statistical information of the reception interval and the threshold value. “Latency” in column C254 indicates a comparison result between the statistical information of the delay between transmission and reception and the threshold value. “PER” in column C255 indicates a comparison result between the statistical information of the packet error rate and the threshold value. The information display device 4 displays the items in columns C252 to C255 based on the communication state information included in the statistical report data. Although not shown in the figure, a column for displaying the comparison result between the statistical information of the received signal strength and the transmission see-off rate and the threshold value may be provided.
列C26の「Power Status」は、機器電源情報を示す。機器電源情報は、機器の電源の状態を示す画像によって示される。また、機器の電源がバッテリーである場合、機器電源情報は、バッテリーの残日数を示す数値など、バッテリー残量の詳細を示す情報を当該画像上に重ねることによって示される。これにより、情報表示装置4は、少ない領域に多くの情報を表示することができる。なお、バッテリー以外の図示されている画像は、商用電源等から電源供給されている機器を示す(ライン接続)。領域A24は、表示画面の表示内容を変化させるためのボタンを示す。情報表示装置4は、例えば、領域A24のボタンが押下された場合に、後述する表示態様の第3例を表示してよい。
“Power Status” in column C26 indicates device power supply information. The device power supply information is indicated by an image indicating the power supply state of the device. Further, when the power source of the device is a battery, the device power source information is indicated by superimposing information indicating details of the remaining amount of the battery on the image, such as a numerical value indicating the remaining days of the battery. Thereby, the information display device 4 can display a large amount of information in a small area. The illustrated image other than the battery indicates a device that is supplied with power from a commercial power source or the like (line connection). Area A24 shows a button for changing the display content of the display screen. For example, when the button of the area A24 is pressed, the information display device 4 may display a third example of a display mode to be described later.
列C252~C255の表示は、例えば、通信品質情報の平均値や最大値などの統計情報に基づいて決定する。例えば、通信品質情報の最大値が閾値よりも小さい場合、当該通信品質情報について、フィールド機器1は正常状態であるとする。また、例えば、通信品質情報の最大値が閾値よりも大きく、平均値が閾値以下の場合、当該通信品質情報について、フィールド機器1は、警告状態であるとする。また、例えば、通信品質情報の平均値が閾値よりも大きい場合、当該通信品質情報について、フィールド機器1は、異常状態であるとする。なお、列C252~C255の表示に用いる統計情報は、一例として、毎分データとするが、統計情報は、毎時データであってもよいし、毎日データであってもよい。
The display of columns C252 to C255 is determined based on statistical information such as an average value or maximum value of communication quality information, for example. For example, when the maximum value of the communication quality information is smaller than the threshold value, it is assumed that the field device 1 is in a normal state for the communication quality information. For example, when the maximum value of the communication quality information is larger than the threshold value and the average value is equal to or less than the threshold value, it is assumed that the field device 1 is in a warning state for the communication quality information. For example, when the average value of communication quality information is larger than a threshold value, it is assumed that the field device 1 is in an abnormal state for the communication quality information. Note that the statistical information used for displaying the columns C252 to C255 is, for example, data per minute, but the statistical information may be hourly data or daily data.
図10は、機器電源情報を表示する場合の表示態様の選択方法の一例を示す表である。
図10において示される例において、列C31の「状態名」は、機器の電源の状態についての分類を示す。「状態名」には、「正常」、「警告」、および「不明」の3つがある。これらの状態は、電源の種類と閾値によるバッテリー残量の判定とによって決定される。例えば、電源の種類がライン接続の場合、「状態名」は「正常」である。例えば、電源の種類がバッテリーであり、当該バッテリーの残量が所定の閾値よりも多い場合、「状態名」は「正常」である。例えば、電源の種類がバッテリーであり、当該バッテリーの残量が所定の閾値以下の場合、「状態名」は「警告」である。 FIG. 10 is a table showing an example of a display mode selection method when device power supply information is displayed.
In the example shown in FIG. 10, the “state name” in column C31 indicates the classification of the power supply state of the device. There are three “state names”: “normal”, “warning”, and “unknown”. These states are determined by the type of power source and the determination of the remaining battery level based on the threshold value. For example, when the type of power supply is line connection, the “state name” is “normal”. For example, when the type of power source is a battery and the remaining amount of the battery is greater than a predetermined threshold, the “state name” is “normal”. For example, when the type of power source is a battery and the remaining amount of the battery is equal to or less than a predetermined threshold, the “state name” is “warning”.
列C32の「Power Supply Status」は、電源の種類とバッテリー残量とを示す。「Power Supply Status」には、ライン(電源供給ライン)から電力を供給されていることを示す「Line Powered」と、バッテリー残量を示す「100-75%」、「75-25%」、または「25-0%」と、不明であることを示す「Unknown」とがある。
“Power Supply Status” in column C32 indicates the type of power source and the remaining battery level. In “Power Supply Status”, “Line Powered” indicating that power is supplied from the line (power supply line) and “100-75%”, “75-25%” indicating the remaining battery level, or There are “25-0%” and “Unknown” indicating unknown.
列C33の「画像」は、電源の状態に応じた表示態様の一例を示す。例えば、列C32の「Power Supply Status」が「Line Powered」である場合、「画像」には、当該「Line Powered」に対応付けられているライン接続を示す画像が選択される。また、列C31の「状態名」が「不明」である場合、「画像」には、当該「不明」に対応付けられている不明を示す画像が選択される。また、電源がバッテリーである場合には、そのバッテリー残量が該当する「Power Supply」に対応付けられている画像のうち、「状態名」が「正常」または「警告」である画像が選択される。このようにして選択された画像は、図9のC26において示される機器電源情報の表示に使用される。
“Image” in column C33 shows an example of a display mode corresponding to the state of the power source. For example, when “Power Supply Status” in the column C32 is “Line Powered”, an image indicating a line connection associated with the “Line Powered” is selected as “Image”. When the “state name” in the column C31 is “unknown”, an image indicating unknown associated with the “unknown” is selected as the “image”. In addition, when the power source is a battery, an image whose “state name” is “normal” or “warning” is selected from images associated with “Power Supply” corresponding to the remaining battery level. The The image selected in this way is used for displaying the device power information shown in C26 of FIG.
図11は、通信品質情報の値の分布などを表示する場合の表示態様の一例を示す図である。
領域A3は、情報表示装置4が表示する画面の表示態様の第3例を示す。情報表示装置4は、例えば、統計レポートの表示において、異常または警告状態の機器および通信品質情報があった場合に、表示態様の第3例を表示する。領域A31、領域A32、および領域A33において示される情報は、上述した図9の領域A21、領域A22、および領域23と、それぞれ同様である。 FIG. 11 is a diagram illustrating an example of a display mode when displaying a distribution of values of communication quality information and the like.
Region A3 shows a third example of the display mode of the screen displayed byinformation display device 4. For example, in the display of the statistical report, the information display device 4 displays the third example of the display mode when there is an abnormal or warning device and communication quality information. The information shown in the region A31, the region A32, and the region A33 is the same as the region A21, the region A22, and the region 23 in FIG. 9 described above.
領域A3は、情報表示装置4が表示する画面の表示態様の第3例を示す。情報表示装置4は、例えば、統計レポートの表示において、異常または警告状態の機器および通信品質情報があった場合に、表示態様の第3例を表示する。領域A31、領域A32、および領域A33において示される情報は、上述した図9の領域A21、領域A22、および領域23と、それぞれ同様である。 FIG. 11 is a diagram illustrating an example of a display mode when displaying a distribution of values of communication quality information and the like.
Region A3 shows a third example of the display mode of the screen displayed by
領域A34は、通信品質情報を示すタブを表示する。領域A34に表示される通信品質情報は、プロセスデータ損失数(「Publication Loss」)、受信間隔(「Interval」)、送受信間遅延(「Latency」)、パケット誤り率(「PER」)、受信信号強度(「RSSI」)、および送信見送り率(「CCA Back off」)である。領域A34に表示されるタブは選択可能であり、領域A35は、選択されたタブが示す通信品質情報の分布を、機器特定情報に対応させて表示する。図11において示される例では、「PER」が選択され、パケット誤り率の分布が領域A35に示されている。また、領域A35において表示される機器は、領域A31におけるサブネットや領域A33における機器の選択に応じて変更可能としてよい。
Area A34 displays a tab indicating communication quality information. The communication quality information displayed in the area A34 includes the number of process data loss (“Publication Loss”), the reception interval (“Interval”), the delay between transmission and reception (“Latency”), the packet error rate (“PER”), and the received signal. Strength (“RSSI”) and transmission rate (“CCA Back off”). The tab displayed in the area A34 can be selected, and the area A35 displays the distribution of the communication quality information indicated by the selected tab in association with the device identification information. In the example shown in FIG. 11, “PER” is selected, and the distribution of packet error rates is shown in region A35. In addition, the device displayed in the area A35 may be changeable according to the selection of the subnet in the area A31 or the equipment in the area A33.
破線L31は、通信品質情報に対する第1の閾値「A」を示す。破線L32は、通信品質情報に対する第2の閾値「B」を示す。グラフG3は、機器特定情報に対応する通信品質情報の分布を示すグラフである。グラフG3の横軸は、通信品質情報の値の大きさを示す。フィールド機器1は、第1経路と第2経路との2つの通信経路を有するため、領域A35の機器特定情報各々に対して第1経路の通信品質情報の分布を示すグラフと第2経路の通信品質情報の分布を示すグラフとの2つのグラフが示されている。例えば、図11において示される例において、機器特定情報「DEV002」が示すフィールド機器1の第1経路に関する「PER」の分布はグラフG31として示され、第2経路に関する「PER」の分布はグラフG32として示されている。
The broken line L31 indicates the first threshold “A” for the communication quality information. A broken line L32 indicates the second threshold “B” for the communication quality information. The graph G3 is a graph showing the distribution of communication quality information corresponding to the device identification information. The horizontal axis of the graph G3 indicates the magnitude of the communication quality information value. Since the field device 1 has two communication routes, the first route and the second route, the graph indicating the distribution of the communication quality information of the first route and the communication of the second route for each piece of device specifying information in the area A35. Two graphs are shown, a graph showing the distribution of quality information. For example, in the example shown in FIG. 11, the distribution of “PER” related to the first route of the field device 1 indicated by the device identification information “DEV002” is shown as a graph G31, and the distribution of “PER” related to the second route is shown in the graph G32. Is shown as
通信品質情報の分布を示すグラフ各々は、例えば、点P311、P312、およびP313各々によってそれぞれ例示される最大値、最小値、および平均値の点を結ぶ線として示される。また、グラフG3のグラフ各々は、通信品質情報と機器特定情報の閾値との比較結果に応じた態様で示される。例えば、「DEV002」の閾値の設定が第1の閾値「A」である場合、グラフG31により示される「PER」の平均値は、第1の閾値「A」よりも大きいため、当該「PER」について、フィールド機器1は異常状態である。従って、グラフG31の平均値を示す点P313は、異常状態を示す「×」の形状で示されている。なお、ここでは一例として、通信品質情報の分布を示すグラフは、毎分データの最大値、最小値、および平均値が示されるものとするが、毎時データや毎日データの最大値、最小値、および平均値などが示されてもよい。
Each graph showing the distribution of communication quality information is shown as a line connecting points of maximum value, minimum value, and average value respectively exemplified by points P311, P312 and P313, for example. In addition, each graph of the graph G3 is shown in a mode according to a comparison result between the communication quality information and the threshold value of the device identification information. For example, when the threshold value setting of “DEV002” is the first threshold value “A”, the average value of “PER” indicated by the graph G31 is larger than the first threshold value “A”. The field device 1 is in an abnormal state. Therefore, the point P313 indicating the average value of the graph G31 is indicated by the shape of “x” indicating the abnormal state. Here, as an example, the graph showing the distribution of communication quality information shows the maximum value, minimum value, and average value of data every minute, but the maximum value, minimum value of hourly data and daily data, And an average value etc. may be shown.
また、例えば、グラフG32により示される最大値の点は、第1の閾値「A」よりも小さいため、当該「PER」について、フィールド機器1は、正常状態である。従って、グラフG313の平均値を示す点P321は、正常状態を示す「○」の形状で示されている。また、例えば、「DEV003」の閾値の設定が第2の閾値「B」である場合、グラフG33により示される「PER」の最大値は第2の閾値「B」よりも大きく、平均値は第2の閾値「B」よりも小さいため、グラフG33の平均値を示す点P331は、警告状態を示す「□」の形状で示されている。また、各グラフは、フィールド機器1の状態に応じて、色分けして示されてよい。
Further, for example, since the point of the maximum value indicated by the graph G32 is smaller than the first threshold “A”, the field device 1 is in a normal state for the “PER”. Therefore, the point P321 indicating the average value of the graph G313 is indicated by the shape of “◯” indicating the normal state. Further, for example, when the threshold value setting of “DEV003” is the second threshold value “B”, the maximum value of “PER” indicated by the graph G33 is larger than the second threshold value “B”, and the average value is the first value Since it is smaller than the threshold value “B” of 2, the point P331 indicating the average value of the graph G33 is indicated by the shape of “□” indicating the warning state. Each graph may be displayed in different colors according to the state of the field device 1.
図12は、通信品質情報の時系列データなどを表示する場合の表示態様の一例を示す図である。
領域A4は、情報表示装置4が表示する画面の表示態様の第4例を示す。情報表示装置4は、例えば、統計レポートの表示において、異常または警告状態の機器があった場合に、表示態様の第4例を表示する。領域A41は、時系列データを表示する対象のフィールド機器1の機器特定情報や設定を示す。領域A42は、時系列データを表示する対象の通信品質情報の選択状況を示す。領域A42において選択可能な項目は、図11の領域A34において選択可能なものとほぼ同様であり、パケット誤り率および受信信号強度については第1経路と第2経路とを区別して選択可能である。領域A43は、領域A42において選択された通信品質情報の時系列データのグラフを示す。ここでは一例として、領域A43において示される時系列データは、毎分データであるとするが、毎時データや毎日データであってもよい。領域A43のグラフの縦軸は、通信品質情報の値の大きさを示す。領域A43のグラフの横軸は、日時を示す。破線L41は、受信間隔の揺らぎ許容値(Stale Limit)を示す。破線L42は、閾値を示す。 FIG. 12 is a diagram illustrating an example of a display mode when displaying time-series data of communication quality information and the like.
Region A4 shows a fourth example of the display mode of the screen displayed byinformation display device 4. The information display device 4 displays, for example, a fourth example of the display mode when there is an abnormal or warning device in the display of the statistical report. An area A41 shows device specifying information and settings of the target field device 1 for displaying time-series data. Area A42 shows the selection status of communication quality information to be displayed for time-series data. Items that can be selected in the area A42 are substantially the same as those that can be selected in the area A34 of FIG. 11, and the packet error rate and the received signal strength can be selected by distinguishing between the first path and the second path. Area A43 shows a graph of time-series data of the communication quality information selected in area A42. Here, as an example, the time-series data shown in the area A43 is data for every minute, but may be data for every hour or daily data. The vertical axis of the graph of the area A43 indicates the magnitude of the communication quality information value. The horizontal axis of the graph in the area A43 indicates the date and time. A broken line L41 indicates a fluctuation tolerance (Stall Limit) of the reception interval. A broken line L42 indicates a threshold value.
領域A4は、情報表示装置4が表示する画面の表示態様の第4例を示す。情報表示装置4は、例えば、統計レポートの表示において、異常または警告状態の機器があった場合に、表示態様の第4例を表示する。領域A41は、時系列データを表示する対象のフィールド機器1の機器特定情報や設定を示す。領域A42は、時系列データを表示する対象の通信品質情報の選択状況を示す。領域A42において選択可能な項目は、図11の領域A34において選択可能なものとほぼ同様であり、パケット誤り率および受信信号強度については第1経路と第2経路とを区別して選択可能である。領域A43は、領域A42において選択された通信品質情報の時系列データのグラフを示す。ここでは一例として、領域A43において示される時系列データは、毎分データであるとするが、毎時データや毎日データであってもよい。領域A43のグラフの縦軸は、通信品質情報の値の大きさを示す。領域A43のグラフの横軸は、日時を示す。破線L41は、受信間隔の揺らぎ許容値(Stale Limit)を示す。破線L42は、閾値を示す。 FIG. 12 is a diagram illustrating an example of a display mode when displaying time-series data of communication quality information and the like.
Region A4 shows a fourth example of the display mode of the screen displayed by
図12に示される例において、領域A42では受信間隔「Interval」が選択されており、領域A43には、当該選択に対応する受信間隔「Interval」のグラフG4が表示されている。また、領域A41において示されるように、閾値「Threshold」として第2の閾値「B」が設定されている(破線L42)。領域A431は、受信間隔の時系列データを示すグラフG4のうち、フィールド機器1が警告状態となった部分を示す。領域A432は、グラフG4のうち、最大値が閾値以下であり、正常状態であった部分を示す。これにより、情報表示装置4のユーザは、通信品質の状態の経時変化を容易に確認することができる。また、情報表示装置4のユーザは、揺らぎ許容値に対する受信間隔の余裕度を容易に確認することができる。
In the example shown in FIG. 12, the reception interval “Interval” is selected in the area A42, and the graph G4 of the reception interval “Interval” corresponding to the selection is displayed in the area A43. Further, as shown in the region A41, the second threshold “B” is set as the threshold “Threshold” (broken line L42). A region A431 indicates a portion where the field device 1 is in a warning state in the graph G4 indicating the time series data of the reception interval. A region A432 indicates a portion of the graph G4 in which the maximum value is equal to or less than the threshold value and is in a normal state. Thereby, the user of the information display device 4 can easily check the change with time in the state of communication quality. Further, the user of the information display device 4 can easily confirm the margin of the reception interval with respect to the fluctuation allowable value.
点P41の「○」のマーカーは、閾値の設定の変更または経路の変更を示している。領域A441は、当該変更の詳細を示す。情報表示装置4は、例えば、点P41のマーカーがマウスオーバーなどにより選択された場合、領域A441の経路情報を表示するようにしてよい。
The marker “◯” at point P41 indicates a change in threshold setting or a change in route. A region A441 shows details of the change. For example, when the marker at the point P41 is selected by mouse over or the like, the information display device 4 may display the route information of the region A441.
図13は、統計情報と比較を行う閾値の設定画面の表示態様の一例を示す図である。
領域A5は、情報表示装置4が表示する画面の表示態様の第5例を示す。領域A51は、設定項目の選択のための領域である。領域A52は、通信品質情報の統計情報と比較する閾値の値の設定を行うための領域である。領域A521は、フィールド機器1の通信品質情報に関する閾値を設定するための領域である。領域A521において示される表の列C511は、設定する閾値が第1の閾値「A」と第2の閾値「B」のいずれであるかを示す。列C512は、プロセスデータ損失数の閾値を示す。列C513は、受信間隔の閾値を示す。列C514は、送受信間遅延の閾値を示す。列C515は、パケット誤り率の閾値を示す。列C516は、受信信号強度の閾値を示す。列C512~C516の各項目は選択および入力可能になっており、所望の値を閾値として設定してよい。また、列C512~C516の任意の項目を「Disable」とすることにより閾値を設定せず、情報表示装置4が、当該項目についての警告状態や異常状態を通知しないように設定してもよい。なお、図示されていないが、送信見送り率の閾値を設定する列を設けてもよい。 FIG. 13 is a diagram illustrating an example of a display mode of a threshold setting screen for comparison with statistical information.
The area A5 shows a fifth example of the display mode of the screen displayed by theinformation display device 4. The area A51 is an area for selecting setting items. The area A52 is an area for setting a threshold value to be compared with the statistical information of the communication quality information. The area A521 is an area for setting a threshold value related to communication quality information of the field device 1. A column C511 of the table shown in the region A521 indicates whether the threshold value to be set is the first threshold value “A” or the second threshold value “B”. Column C512 shows the threshold value for the number of process data losses. Column C513 indicates the threshold value of the reception interval. A column C514 indicates a threshold value for delay between transmission and reception. A column C515 indicates a packet error rate threshold. Column C516 indicates a threshold value of the received signal strength. Each item in columns C512 to C516 can be selected and input, and a desired value may be set as a threshold value. Further, by setting any item in the columns C512 to C516 to “Disable”, the threshold value may not be set, and the information display device 4 may be set not to notify a warning state or an abnormal state regarding the item. Although not shown in the figure, a column for setting a threshold value of the transmission send-off rate may be provided.
領域A5は、情報表示装置4が表示する画面の表示態様の第5例を示す。領域A51は、設定項目の選択のための領域である。領域A52は、通信品質情報の統計情報と比較する閾値の値の設定を行うための領域である。領域A521は、フィールド機器1の通信品質情報に関する閾値を設定するための領域である。領域A521において示される表の列C511は、設定する閾値が第1の閾値「A」と第2の閾値「B」のいずれであるかを示す。列C512は、プロセスデータ損失数の閾値を示す。列C513は、受信間隔の閾値を示す。列C514は、送受信間遅延の閾値を示す。列C515は、パケット誤り率の閾値を示す。列C516は、受信信号強度の閾値を示す。列C512~C516の各項目は選択および入力可能になっており、所望の値を閾値として設定してよい。また、列C512~C516の任意の項目を「Disable」とすることにより閾値を設定せず、情報表示装置4が、当該項目についての警告状態や異常状態を通知しないように設定してもよい。なお、図示されていないが、送信見送り率の閾値を設定する列を設けてもよい。 FIG. 13 is a diagram illustrating an example of a display mode of a threshold setting screen for comparison with statistical information.
The area A5 shows a fifth example of the display mode of the screen displayed by the
領域A522およびA523は、フィールド機器1のバッテリー残量についての閾値を示す。領域A522は、機器電源情報に対する閾値として、バッテリー残量がゼロ、又は機器を動作させることができない程度の残量になるまでの予定日数を設定するための領域である。また、領域A523は、機器電源情報に対する閾値として、バッテリー容量に対するバッテリー残量の比率を設定するための領域である。
Areas A522 and A523 indicate threshold values for the remaining battery level of the field device 1. The area A522 is an area for setting the number of days until the battery remaining amount is zero or the remaining amount of the device cannot be operated as a threshold for the device power supply information. An area A523 is an area for setting the ratio of the remaining battery capacity to the battery capacity as a threshold for the device power supply information.
領域A524は、通信品質情報の統計情報と比較する閾値の選択を行うための領域である。領域A524に示される表において、列C521、C522、およびC523は、機器特定情報を示す。列C524は、フィールド機器1の設定情報(役割)を示す。列C525は、通信品質情報に対する閾値として、第1の閾値「A」と第2の閾値「B」のいずれかを選択可能に示す。列C526は、機器電源情報に対する閾値として、残量ゼロ、又は機器を動作させることができない程度の残量までの予定日数とバッテリー残量の比率とのいずれか、または、両方を選択可能に示す。
Area A524 is an area for selecting a threshold to be compared with statistical information of communication quality information. In the table shown in the area A524, columns C521, C522, and C523 indicate device identification information. A column C524 indicates setting information (role) of the field device 1. Column C525 indicates that either the first threshold “A” or the second threshold “B” can be selected as the threshold for the communication quality information. The column C526 indicates that the threshold for the device power supply information can be selected from either the remaining amount of zero, the planned number of days until the remaining amount that the device cannot be operated and the ratio of the remaining amount of the battery, or both. .
[通信品質の改善方法の概要]
図14は、直近データなどを表示する場合の表示態様の一例を示す図である。
領域A6は、情報表示装置4が表示する画面の表示態様の第6例を示す。領域A61において示される項目は、図8の領域A11において示される項目と同様である。また、領域A62において示される表は、図8の領域A12において示される表と同様である。領域A62の行L61における状態アイコンの項目I61には、状態アイコン「○」の右側に「i」の文字が付与されている。領域A62の表の行L61における「RSSI(S)」の項目I62には、「i-75dBm」が表示されている。これらの「i」は、第1経路または第2経路の通信品質に比して、より優れた通信品質を提供しうるアクセスポイント2が存在することを通知するものである。図14において示される例では、第2経路の受信信号強度に「i」が示されており、受信信号強度が第2経路のアクセスポイント2よりも優れたアクセスポイント2が存在している。 [Outline of communication quality improvement method]
FIG. 14 is a diagram illustrating an example of a display mode when displaying the latest data and the like.
The area A6 shows a sixth example of the display mode of the screen displayed by theinformation display device 4. Items shown in the area A61 are the same as the items shown in the area A11 of FIG. The table shown in the area A62 is the same as the table shown in the area A12 in FIG. The letter “i” is assigned to the right side of the status icon “◯” in the status icon item I61 in the row L61 of the area A62. In the item I62 of “RSSI (S)” in the row L61 of the table in the area A62, “i-75 dBm” is displayed. These “i” s indicate that there is an access point 2 that can provide communication quality superior to the communication quality of the first route or the second route. In the example shown in FIG. 14, “i” is shown in the received signal strength of the second path, and there is an access point 2 whose received signal strength is superior to that of the access point 2 of the second path.
図14は、直近データなどを表示する場合の表示態様の一例を示す図である。
領域A6は、情報表示装置4が表示する画面の表示態様の第6例を示す。領域A61において示される項目は、図8の領域A11において示される項目と同様である。また、領域A62において示される表は、図8の領域A12において示される表と同様である。領域A62の行L61における状態アイコンの項目I61には、状態アイコン「○」の右側に「i」の文字が付与されている。領域A62の表の行L61における「RSSI(S)」の項目I62には、「i-75dBm」が表示されている。これらの「i」は、第1経路または第2経路の通信品質に比して、より優れた通信品質を提供しうるアクセスポイント2が存在することを通知するものである。図14において示される例では、第2経路の受信信号強度に「i」が示されており、受信信号強度が第2経路のアクセスポイント2よりも優れたアクセスポイント2が存在している。 [Outline of communication quality improvement method]
FIG. 14 is a diagram illustrating an example of a display mode when displaying the latest data and the like.
The area A6 shows a sixth example of the display mode of the screen displayed by the
図15は、フィールド機器1の通信経路設定のための画面の表示態様の一例を示す図である。
領域A7は、情報表示装置4の表示態様第7例を示す。情報表示装置4は、例えば、上述した図14における項目I61またはI62が選択された場合に、表示態様を第7例に遷移させる。領域A71は、機器特定情報を示し、図15に示される例において、機器特定情報は「DEV006」である。領域A72は、第1経路のアクセスポイント2の機器特定情報と当該アクセスポイント2に関する通信品質情報を示す。図15に示される例において、第1経路のアクセスポイント2は「BBR001」であり、通信品質情報の受信信号強度は「-65dBm」である。領域A73は、第2経路のアクセスポイント2の機器特定情報と当該アクセスポイント2に関する通信品質情報を示す。図15に示される例において、第2経路のアクセスポイント2は「BBR002」であり、通信品質情報の受信信号強度は「i-75dBm」である。 FIG. 15 is a diagram illustrating an example of a display form of a screen for setting a communication path of thefield device 1.
A region A7 shows a seventh display mode example of theinformation display device 4. For example, when the item I61 or I62 in FIG. 14 described above is selected, the information display device 4 changes the display mode to the seventh example. An area A71 indicates device identification information. In the example illustrated in FIG. 15, the device identification information is “DEV006”. Area A72 shows device identification information of access point 2 on the first route and communication quality information related to access point 2. In the example shown in FIG. 15, the access point 2 of the first route is “BBR001”, and the received signal strength of the communication quality information is “−65 dBm”. Area A73 shows device identification information of access point 2 on the second route and communication quality information related to access point 2. In the example shown in FIG. 15, the access point 2 of the second route is “BBR002”, and the received signal strength of the communication quality information is “i-75 dBm”.
領域A7は、情報表示装置4の表示態様第7例を示す。情報表示装置4は、例えば、上述した図14における項目I61またはI62が選択された場合に、表示態様を第7例に遷移させる。領域A71は、機器特定情報を示し、図15に示される例において、機器特定情報は「DEV006」である。領域A72は、第1経路のアクセスポイント2の機器特定情報と当該アクセスポイント2に関する通信品質情報を示す。図15に示される例において、第1経路のアクセスポイント2は「BBR001」であり、通信品質情報の受信信号強度は「-65dBm」である。領域A73は、第2経路のアクセスポイント2の機器特定情報と当該アクセスポイント2に関する通信品質情報を示す。図15に示される例において、第2経路のアクセスポイント2は「BBR002」であり、通信品質情報の受信信号強度は「i-75dBm」である。 FIG. 15 is a diagram illustrating an example of a display form of a screen for setting a communication path of the
A region A7 shows a seventh display mode example of the
領域A74において示される表は、領域A71に示される機器が第1経路または第2経路として設定可能なアクセスポイント2の情報を示す。当該表の各行は、選択可能である。列C71の「Neighbor」および列C72の「Vendor/Model」は、領域A71に示される機器が第1経路または第2経路として設定可能なアクセスポイント2の機器特定情報を示す。また、列C73の「Device Role」は、設定情報(役割)を示す。列C74の「RSSI」は、受信信号強度を示す。領域A75は、領域A74において選択されたアクセスポイント2を第1経路として設定するためのボタンを示す。領域A76は、領域A74において選択されたアクセスポイント2を第2経路として設定するためのボタンを示す。領域A77は、通信経路の設定を終了するためのボタンを示す。
The table shown in the area A74 shows information on the access point 2 that can be set as the first route or the second route by the device shown in the region A71. Each row of the table can be selected. “Neighbor” in the column C71 and “Vendor / Model” in the column C72 indicate device identification information of the access point 2 that can be set as the first route or the second route by the device indicated in the area A71. Further, “Device Role” in column C73 indicates setting information (role). “RSSI” in column C74 indicates the received signal strength. Area A75 shows a button for setting the access point 2 selected in area A74 as the first route. Area A76 shows a button for setting the access point 2 selected in area A74 as the second route. Area A77 shows a button for ending the setting of the communication path.
図15に示される例において、行L71に示す「DEV001」の受信信号強度は、「-68dBm」である。当該受信信号強度は、領域A73に示される第2経路の受信信号強度の「-75dBm」に比して優れている。従って、行L71を選択し、領域A76に示されるボタンを押下することにより、「DEV001」を「DEV006」の第2経路のアクセスポイント2に設定し、第2経路の通信品質を改善できる可能性がある。なお、情報表示装置4は、当該設定の変更によりホップ数が変化する場合は、送受信間遅延に影響があることを通知してよい。
In the example shown in FIG. 15, the received signal strength of “DEV001” shown in row L71 is “−68 dBm”. The received signal strength is superior to “−75 dBm” of the received signal strength of the second path shown in the region A73. Therefore, by selecting the row L71 and pressing the button shown in the area A76, “DEV001” may be set as the access point 2 of the second route of “DEV006”, and the communication quality of the second route may be improved. There is. Note that the information display device 4 may notify that the delay between transmission and reception is affected when the number of hops changes due to the change in the setting.
図16は、フィールド機器1が通信に使用する周波数帯域の経時変化の一例を示す図である。
図16において、縦軸は、周波数帯域(チャネル番号)を示す。横軸は、時間を示す。「A」は、第1の閾値が設定されている通常監視用途のフィールド機器1を示す。「B」は、第2の閾値が設定されている高速監視用途、または、制御用途のフィールド機器1を示す。図16において示されるように、情報処理装置3は、時間帯T81において、チャネル「11」の異常を検出している。チャネルについての異常は、例えば、上述した送信見送り率と閾値とによって判定される。フィールド機器1「B」には、より優れた通信品質を必要とする。従って、時間帯T81以降は、フィールド機器1「B」には、異常が検出されたチャネル「11」は割当てられず、領域A81において示されるようにチャネル「17」から「22」までの周波数帯域が割当てられている。 FIG. 16 is a diagram illustrating an example of a time-dependent change in the frequency band used by thefield device 1 for communication.
In FIG. 16, the vertical axis indicates the frequency band (channel number). The horizontal axis indicates time. “A” indicates thefield device 1 for normal monitoring, for which the first threshold is set. “B” indicates the field device 1 for high-speed monitoring or control for which the second threshold is set. As illustrated in FIG. 16, the information processing device 3 detects an abnormality of the channel “11” in the time zone T81. Abnormality about the channel is determined by, for example, the transmission transmission rate and the threshold value described above. The field device 1 “B” requires better communication quality. Therefore, after the time zone T81, the channel “11” in which the abnormality is detected is not assigned to the field device 1 “B”, and the frequency band from the channels “17” to “22” as shown in the region A81. Is assigned.
図16において、縦軸は、周波数帯域(チャネル番号)を示す。横軸は、時間を示す。「A」は、第1の閾値が設定されている通常監視用途のフィールド機器1を示す。「B」は、第2の閾値が設定されている高速監視用途、または、制御用途のフィールド機器1を示す。図16において示されるように、情報処理装置3は、時間帯T81において、チャネル「11」の異常を検出している。チャネルについての異常は、例えば、上述した送信見送り率と閾値とによって判定される。フィールド機器1「B」には、より優れた通信品質を必要とする。従って、時間帯T81以降は、フィールド機器1「B」には、異常が検出されたチャネル「11」は割当てられず、領域A81において示されるようにチャネル「17」から「22」までの周波数帯域が割当てられている。 FIG. 16 is a diagram illustrating an example of a time-dependent change in the frequency band used by the
In FIG. 16, the vertical axis indicates the frequency band (channel number). The horizontal axis indicates time. “A” indicates the
これに対し、通常監視用途のフィールド機器1「A」は、フィールド機器1「B」程には優れた通信品質を必要としない。また、フィールド機器1が使用可能なチャネルの数は限られている。従って、時間帯T81以降は、フィールド機器1「A」には、率先してチャネル「11」が割り当てられ、フィールド機器1「B」が正常状態のチャネルを優先的に使用しやすくなるように設定されている。これにより、チャネルのリソースが不足することを回避しつつ、システム全体における通信の恒常性を保つことができる。このような設定は、手動で行われてもよいし、自動で行われてもよい。
On the other hand, the field device 1 “A” for normal monitoring does not require communication quality as excellent as the field device 1 “B”. Further, the number of channels that can be used by the field device 1 is limited. Therefore, after the time period T81, the field device 1 “A” is proactively assigned the channel “11”, and the field device 1 “B” is set to be easily used preferentially. Has been. Thereby, it is possible to maintain communication constancy in the entire system while avoiding a shortage of channel resources. Such setting may be performed manually or automatically.
[まとめ]
通信経路の安定性を損なう原因として、例えば、通信経路において使用される周波数帯域と重複する帯域を使用する無線機器の存在や通信経路を遮断する物理的障害物の存在が考えられる。これらの障害による影響は、一時的なものである場合と長期的なものである場合とがある。しかしながら、従来の技術は、直近に得られた通信品質情報しか利用していなかったため、時間的な観点から障害による影響を解析することができなかった。 [Summary]
Possible causes of impairing the stability of the communication path include, for example, the presence of a wireless device that uses a band that overlaps the frequency band used in the communication path and the presence of a physical obstacle that blocks the communication path. The effects of these failures can be temporary or long-term. However, since the prior art uses only the communication quality information obtained most recently, it has not been possible to analyze the influence of the failure from a temporal viewpoint.
これに対し、本実施形態に係る情報表示装置4は、表示部41と、プラントに設置されたフィールド機器1と情報処理装置3との間の通信品質を示す通信品質情報を情報処理装置3により予め規定された期間に亘って統計処理して得られる統計情報を、フィールド機器1を特定する機器特定情報に対応させて表示部41に表示させる表示制御部43と、を備える。これにより、情報表示装置4は、通信経路の長期間に亘る安定性をわかり易く示すことができる。
On the other hand, the information display device 4 according to the present embodiment uses the information processing device 3 to display communication quality information indicating the communication quality between the display unit 41 and the field device 1 installed in the plant and the information processing device 3. And a display control unit 43 that displays statistical information obtained by performing statistical processing over a predetermined period on the display unit 41 in association with device specifying information for specifying the field device 1. Thereby, the information display apparatus 4 can show the stability of the communication path over a long period of time in an easily understandable manner.
また、表示制御部43は、フィールド機器1のバッテリー残量を示す機器電源情報を、機器特定情報に対応させて表示部41に表示させる。これにより、情報表示装置4は、フィールド機器1のバッテリー残量をわかり易く示すことができる。従って、情報表示装置4のユーザは、通信経路の安定性を維持することができる。
In addition, the display control unit 43 causes the display unit 41 to display device power information indicating the remaining battery level of the field device 1 in association with the device identification information. Thereby, the information display device 4 can indicate the remaining battery level of the field device 1 in an easily understandable manner. Therefore, the user of the information display device 4 can maintain the stability of the communication path.
また、表示制御部43は、統計情報とフィールド機器1の通信品質の良否を判定するために設定された閾値との比較結果を、機器特定情報に対応させて表示部41に表示させる。これにより、情報表示装置4は、統計情報の数値などを確認しなくても、通信経路の状態が良好か否かをわかり易く示すことができる。従って、情報表示装置4は、通信経路の長期間に亘る安定性をさらにわかり易く示すことができる。
Also, the display control unit 43 causes the display unit 41 to display the comparison result between the statistical information and the threshold value set for determining whether the communication quality of the field device 1 is good or not, corresponding to the device identification information. As a result, the information display device 4 can easily show whether or not the state of the communication path is good without checking the numerical values of the statistical information. Therefore, the information display device 4 can more easily show the stability of the communication path over a long period of time.
また、閾値として、フィールド機器1毎に異なる値を設定可能である。これにより、情報表示装置4は、フィールド機器1の用途に応じた判定基準で、通信経路の状態が良好か否かをわかり易く示すことができる。従って、情報表示装置4は、通信経路の長期間に亘る安定性をさらにわかり易く示すことができる。
Also, a different value can be set for each field device 1 as the threshold value. As a result, the information display device 4 can easily indicate whether or not the state of the communication path is good based on the determination criterion according to the application of the field device 1. Therefore, the information display device 4 can more easily show the stability of the communication path over a long period of time.
また、表示制御部43は、1分間や1時間などの予め規定された期間における通信品質情報の分布を、機器特定情報に対応させて表示部41に表示させる。また、表示制御部43は、通信品質情報の分布とともに統計情報を表示部41に表示させる。これらにより、情報表示装置4は、例えば、過去から現在に至るまでの通信経路の通信品質を簡潔に示すことができる。従って、情報表示装置4は、通信経路の長期間に亘る安定性をさらにわかり易く示すことができる。
Also, the display control unit 43 causes the display unit 41 to display the distribution of communication quality information in a predetermined period such as 1 minute or 1 hour in association with the device identification information. In addition, the display control unit 43 causes the display unit 41 to display statistical information together with the distribution of communication quality information. Accordingly, the information display device 4 can simply indicate the communication quality of the communication path from the past to the present, for example. Therefore, the information display device 4 can more easily show the stability of the communication path over a long period of time.
また、表示制御部43は、通信品質情報の経時変化を表示部41に更に表示させる。これにより、情報表示装置4は、過去から現在に至るまでの通信経路の通信品質の詳細を示すことができる。従って、情報表示装置4は、通信経路の長期間に亘る安定性をさらにわかり易く示すことができる。
In addition, the display control unit 43 further causes the display unit 41 to display the change over time of the communication quality information. Thereby, the information display apparatus 4 can show the communication quality details of the communication path from the past to the present. Therefore, the information display device 4 can more easily show the stability of the communication path over a long period of time.
また、表示制御部43は、同一のフィールド機器1について、通信品質情報が示す通信品質が、当該フィールド機器1が現在使用している通信経路のアクセスポイント2に比して優れている他の通信経路のアクセスポイント2が存在することを示す通知を、機器特定情報に対応させて表示部41に表示させる。これにより、情報表示装置4のユーザは、フィールド機器1に対して、より通信品質の高い通信経路を設定することができる。
In addition, the display control unit 43 uses other communication in which the communication quality indicated by the communication quality information for the same field device 1 is superior to the access point 2 of the communication path currently used by the field device 1. A notification indicating that the route access point 2 exists is displayed on the display unit 41 in association with the device identification information. Thereby, the user of the information display device 4 can set a communication path with higher communication quality for the field device 1.
また、情報処理装置3は、プラントに設置されたフィールド機器1から送信される通信健全性情報およびプロセスデータの少なくとも一方を用いてフィールド機器1の通信品質を示す通信品質情報を求める演算部332と、演算部332によって求められた通信品質情報を予め規定された期間に亘って統計処理して統計情報を得る統計処理部としての毎分データ生成部333、毎時データ生成部334、および毎日データ生成部335と、統計処理部で得られた統計情報を出力する出力部としての送信制御部337を備える。これにより、情報処理装置3は、通信経路の長期間に亘る安定性をわかり易く示すデータを生成し、出力することができる。
In addition, the information processing device 3 includes a calculation unit 332 that obtains communication quality information indicating communication quality of the field device 1 using at least one of communication health information and process data transmitted from the field device 1 installed in the plant; The statistical data processing unit 333, the hourly data generation unit 334, and the daily data generation as statistical processing units that obtain statistical information by statistically processing the communication quality information obtained by the arithmetic unit 332 over a predetermined period. And a transmission control unit 337 as an output unit that outputs statistical information obtained by the statistical processing unit. As a result, the information processing apparatus 3 can generate and output data that easily shows the stability of the communication path over a long period of time.
また、情報表示装置4は、送信見送り率を表示する。これにより、例えば、パケット誤り率について異常が検出された場合に、情報表示装置4のユーザは、受信信号強度の不足と外部ノイズによる干渉とのいずれが原因であるかを判断することができる。従って、情報表示装置4のユーザは、例えば、フィールド機器1が使用するチャネルのホッピングパターンをより適切に設定し、通信経路の通信品質を改善することができる。
In addition, the information display device 4 displays the transmission postponing rate. Thereby, for example, when an abnormality is detected in the packet error rate, the user of the information display device 4 can determine which is caused by insufficient received signal strength or interference by external noise. Therefore, for example, the user of the information display device 4 can more appropriately set the hopping pattern of the channel used by the field device 1 and improve the communication quality of the communication path.
また、情報表示装置4は、受信信号強度を表示する。これにより、情報表示装置4のユーザは、例えば、通信経路内に障害物が発生したことやフィールド機器1の設置位置が不適切であることを判断することができる。また、情報表示装置4のユーザは、当該障害物の発生が、例えば、大型車両の通行などによる一時的なものであるか、植物の成長などによる長期的なものであるかを判断することができる。そして、情報表示装置4のユーザは、機器の再配置や延長アンテナの使用、ハイゲインアンテナの使用、無線経路内への立ち入り禁止処置などの対策を適切に選択し、通信経路の通信品質を改善することができる。
Also, the information display device 4 displays the received signal strength. Thereby, the user of the information display device 4 can determine, for example, that an obstacle has occurred in the communication path or that the installation position of the field device 1 is inappropriate. In addition, the user of the information display device 4 can determine whether the occurrence of the obstacle is temporary due to, for example, passage of a large vehicle or long-term due to plant growth. it can. Then, the user of the information display device 4 appropriately selects measures such as equipment rearrangement, use of an extension antenna, use of a high gain antenna, and entry prohibition measures in the wireless path, and improves the communication quality of the communication path. be able to.
また、情報表示装置4は、受信間隔を表示する。これにより、情報表示装置4のユーザは、例えば、演算した受信間隔が揺らぎ許容値に対してどの程度の余裕を持つかとういことを確認することができるため、通信経路の通信品質をさらに正確に確認することができる。また、情報表示装置4のユーザは、受信間隔に異常がある場合、フィールド機器1が使用するリトライスロットを追加するなどの対策を適切に選択し、通信経路の通信品質を改善することができる。
Also, the information display device 4 displays the reception interval. As a result, the user of the information display device 4 can confirm, for example, how much margin the calculated reception interval has with respect to the fluctuation tolerance, so that the communication quality of the communication path can be more accurately determined. Can be confirmed. In addition, when there is an abnormality in the reception interval, the user of the information display device 4 can appropriately select a countermeasure such as adding a retry slot used by the field device 1 and improve the communication quality of the communication path.
また、情報表示装置4は、送受信間遅延を表示する。これにより、情報表示装置4のユーザは、例えば、信号の送受信における遅延の発生の程度を確認することができるため、通信経路の通信品質をさらに正確に確認することができる。また、情報表示装置4のユーザは、送受信間遅延に異常がある場合、通信経路におけるホップ数を減少させるなどの対策を適切に選択し、通信経路の通信品質を改善することができる。
Also, the information display device 4 displays the delay between transmission and reception. Thereby, since the user of the information display apparatus 4 can confirm the degree of occurrence of delay in signal transmission / reception, for example, the communication quality of the communication path can be confirmed more accurately. In addition, when there is an abnormality in the delay between transmission and reception, the user of the information display device 4 can appropriately select measures such as reducing the number of hops in the communication path and improve the communication quality of the communication path.
また、情報表示装置4は、プロセスデータ損失数を表示する。プロセスデータがリトライや冗長化された経路の通信により実際に送信先に到達したか否かを示さないパケット誤り率と異なり、プロセスデータ損失数は、これらの情報を示すことができる。従って、情報表示装置4のユーザは、プロセスデータが到達したか否かによって通信品質が判定される有線通信と同様の基準で、無線通信の通信品質を正確に判断することができる。
Also, the information display device 4 displays the number of process data loss. Unlike the packet error rate which does not indicate whether or not the process data has actually reached the transmission destination through retry or communication on a redundant path, the number of process data loss can indicate this information. Therefore, the user of the information display device 4 can accurately determine the communication quality of the wireless communication based on the same standard as the wired communication in which the communication quality is determined based on whether or not the process data has arrived.
なお、上述した情報表示装置4の画面表示の表示例において、任意の項目が表示されてよい。例えば、図9の領域A23において示される表には、例えば、受信信号強度の統計情報と閾値との比較結果を示す項目が示されてよい。
また、上述した情報表示装置4の画面表示の表示例において、任意の項目が情報と関連付けられて、色分けされて示されてよい。例えば、図8の領域A12において示される列C14の「Join Status」が「Disconnected」の場合、情報表示装置4は、該当項目を赤い文字で表示し、異常状態であることを示してよい。また、例えば、列C165の「PER(P)」および列C168の「PER(S)」が所定の閾値を超えた場合、情報表示装置4は、該当項目を黄色の文字で表示し、警告状態であることを示してよい。また、例えば、列C164の「RSSI(P)」および列C167の「RSSI(S)」が所定の閾値より小さい場合、情報表示装置4は、該当項目を黄色の文字で表示し、警告状態であることを示してよい。また、例えば、列C171の「Battery Life」が所定の閾値より小さい場合、情報表示装置4は、該当項目を黄色の文字で表示し、警告状態であることを示してよい。また、例えば、色分けは、文字色の変更ではなく、例えば、セルや文字の塗りつぶしにより行われてよい。また、情報処理装置3は、ハッチングを行ったり、下線を付したりすることにより情報を表現してよい。このように、情報表示装置4は、任意の視覚的効果を利用して情報を表示してよい。 In the display example of the screen display of theinformation display device 4 described above, any item may be displayed. For example, the table shown in the area A23 in FIG. 9 may include an item indicating the comparison result between the statistical information of the received signal strength and the threshold value, for example.
Moreover, in the display example of the screen display of theinformation display device 4 described above, an arbitrary item may be associated with information and displayed in a color-coded manner. For example, when “Join Status” in the column C14 shown in the area A12 of FIG. 8 is “Disconnected”, the information display device 4 may display the corresponding item in red letters to indicate that it is in an abnormal state. Further, for example, when “PER (P)” in column C165 and “PER (S)” in column C168 exceed a predetermined threshold, the information display device 4 displays the corresponding item in yellow characters and displays a warning state. You may show that. Further, for example, when “RSSI (P)” in column C164 and “RSSI (S)” in column C167 are smaller than a predetermined threshold, the information display device 4 displays the corresponding item in yellow characters and displays a warning state. You may show that there is. For example, when “Battery Life” in the column C171 is smaller than a predetermined threshold, the information display device 4 may display the corresponding item in yellow characters to indicate a warning state. Further, for example, the color coding may be performed not by changing the character color but by, for example, filling a cell or character. Further, the information processing device 3 may express information by performing hatching or underlining. Thus, the information display device 4 may display information using an arbitrary visual effect.
また、上述した情報表示装置4の画面表示の表示例において、任意の項目が情報と関連付けられて、色分けされて示されてよい。例えば、図8の領域A12において示される列C14の「Join Status」が「Disconnected」の場合、情報表示装置4は、該当項目を赤い文字で表示し、異常状態であることを示してよい。また、例えば、列C165の「PER(P)」および列C168の「PER(S)」が所定の閾値を超えた場合、情報表示装置4は、該当項目を黄色の文字で表示し、警告状態であることを示してよい。また、例えば、列C164の「RSSI(P)」および列C167の「RSSI(S)」が所定の閾値より小さい場合、情報表示装置4は、該当項目を黄色の文字で表示し、警告状態であることを示してよい。また、例えば、列C171の「Battery Life」が所定の閾値より小さい場合、情報表示装置4は、該当項目を黄色の文字で表示し、警告状態であることを示してよい。また、例えば、色分けは、文字色の変更ではなく、例えば、セルや文字の塗りつぶしにより行われてよい。また、情報処理装置3は、ハッチングを行ったり、下線を付したりすることにより情報を表現してよい。このように、情報表示装置4は、任意の視覚的効果を利用して情報を表示してよい。 In the display example of the screen display of the
Moreover, in the display example of the screen display of the
なお、上述した情報表示装置4の画面表示の表示例において示される統計情報は、任意の期間に亘って統計処理されたものであってよい。例えば、図9の領域A23において示される列C252~C255の各項目は、例えば、毎分データと閾値との比較結果であってよいし、毎時データと閾値との比較結果であってもよい。例えば、図12の領域A43において示されるグラフは、毎分データ、毎時データ、または毎日データのいずれであってもよい。また、情報処理装置3は、上述した1分間、1時間、または1日間などの期間に限らず、通信品質情報を統計処理してよい。例えば、情報処理装置3は、5分間、半日間など任意の期間における通信品質情報から統計情報を演算してよい。
In addition, the statistical information shown in the display example of the screen display of the information display device 4 described above may be statistically processed over an arbitrary period. For example, each item in the columns C252 to C255 shown in the area A23 in FIG. 9 may be, for example, a comparison result between the hourly data and the threshold value, or may be a comparison result between the hourly data and the threshold value. For example, the graph shown in the area A43 in FIG. 12 may be any of minute data, hourly data, and daily data. Further, the information processing device 3 may statistically process communication quality information without being limited to the above-described period of 1 minute, 1 hour, or 1 day. For example, the information processing apparatus 3 may calculate statistical information from communication quality information in an arbitrary period such as 5 minutes or half a day.
なお、上述した実施形態では、フィールド機器1とアクセスポイント2とが無線ネットワークを介して接続される例について説明したが、フィールド機器1とアクセスポイント2とは、有線により接続されていてもよい。この場合、情報処理装置3は、無線通信の通信品質の判定に特異的に適合する受信信号強度などを演算しなくてもよい。
In the above-described embodiment, the example in which the field device 1 and the access point 2 are connected via a wireless network has been described. However, the field device 1 and the access point 2 may be connected by wire. In this case, the information processing device 3 does not have to calculate the received signal strength that specifically matches the determination of the communication quality of wireless communication.
なお、上述した各実施形態における情報処理装置3および情報表示装置4の一部、例えば、取得部331、演算部332、毎分データ生成部333、毎時データ生成部334、毎日データ生成部335、統計レポート生成部336、送信制御部337、および表示制御部43などをコンピュータで実現するようにしてもよい。その場合、この機能を実現するためのプログラムをコンピュータ読み取り可能な記録媒体に記録して、この記録媒体に記録されたプログラムをコンピュータシステムに読み込ませ、実行することによって実現してもよい。なお、ここでいう「コンピュータシステム」とは、情報処理装置3および情報表示装置4に内蔵されたコンピュータシステムであって、OS(Operating System)や周辺機器等のハードウェアを含むものとする。
In addition, a part of the information processing device 3 and the information display device 4 in each of the above-described embodiments, for example, the acquisition unit 331, the calculation unit 332, the minute data generation unit 333, the hourly data generation unit 334, the daily data generation unit 335, The statistical report generation unit 336, the transmission control unit 337, the display control unit 43, and the like may be realized by a computer. In that case, a program for realizing this function may be recorded on a computer-readable recording medium, and the program recorded on this recording medium may be read into a computer system and executed. Here, the “computer system” is a computer system built in the information processing apparatus 3 and the information display apparatus 4 and includes hardware such as an OS (Operating System) and peripheral devices.
また、「コンピュータ読み取り可能な記録媒体」とは、フレキシブルディスク、光磁気ディスク、ROM、CD-ROM等の可搬媒体、コンピュータシステムに内蔵されるハードディスク等の記憶装置のことをいう。また上記プログラムは、前述した機能の一部を実現するためのものであってもよく、さらに前述した機能をコンピュータシステムにすでに記録されているプログラムとの組み合わせで実現できるものであってもよい。
Further, the “computer-readable recording medium” means a storage device such as a flexible disk, a magneto-optical disk, a portable medium such as a ROM and a CD-ROM, and a hard disk incorporated in a computer system. The program may be a program for realizing a part of the functions described above, and may be a program capable of realizing the functions described above in combination with a program already recorded in a computer system.
また、上述した実施形態における情報処理装置3および情報表示装置4の一部、または全部を、LSI(Large Scale Integration)等の集積回路として実現してもよい。情報処理装置3および情報表示装置4の各機能部は個別にプロセッサ化してもよいし、一部、または全部を集積してプロセッサ化してもよい。また、集積回路化の手法はLSIに限らず専用回路、または汎用プロセッサで実現してもよい。また、半導体技術の進歩によりLSIに代替する集積回路化の技術が出現した場合、当該技術による集積回路を用いてもよい。また、情報処理装置3と情報表示装置4とは、装置として一体化されてもよい。
Further, a part or all of the information processing apparatus 3 and the information display apparatus 4 in the above-described embodiment may be realized as an integrated circuit such as an LSI (Large Scale Integration). Each functional unit of the information processing device 3 and the information display device 4 may be individually made into a processor, or a part or all of them may be integrated into a processor. Further, the method of circuit integration is not limited to LSI, and may be realized by a dedicated circuit or a general-purpose processor. In addition, when an integrated circuit technology that replaces LSI appears due to the advancement of semiconductor technology, an integrated circuit based on the technology may be used. Further, the information processing device 3 and the information display device 4 may be integrated as a device.
以上、図面を参照してこの発明の一実施形態について詳しく説明してきたが、具体的な構成は上述のものに限られることはなく、この発明の要旨を逸脱しない範囲内において様々な設計変更等をすることが可能である。
As described above, the embodiment of the present invention has been described in detail with reference to the drawings. However, the specific configuration is not limited to the above, and various design changes and the like can be made without departing from the scope of the present invention. It is possible to
Claims (14)
- 表示部と、
プラントに設置されたフィールド機器と情報処理装置との間の通信品質を示す通信品質情報を前記情報処理装置により予め規定された期間に亘って統計処理して得られる統計情報を、前記フィールド機器を特定する機器特定情報に対応させて前記表示部に表示させる表示制御部と、
を備える情報表示装置。 A display unit;
Statistical information obtained by statistically processing communication quality information indicating communication quality between a field device installed in a plant and an information processing device over a predetermined period by the information processing device, A display control unit for displaying on the display unit in correspondence with the device identification information to be identified;
An information display device comprising: - 前記通信品質情報は、前記フィールド機器から送信される通信健全性情報およびプロセスデータの少なくとも一方を用いて求められる情報である、
請求項1記載の情報表示装置。 The communication quality information is information obtained using at least one of communication health information and process data transmitted from the field device.
The information display device according to claim 1. - 前記表示制御部は、前記フィールド機器のバッテリー残量を示す機器電源情報を、前記機器特定情報に対応させて前記表示部に表示させる、
請求項1または請求項2いずれか記載の情報表示装置。 The display control unit displays device power information indicating a remaining battery level of the field device on the display unit in association with the device identification information.
The information display device according to claim 1 or 2. - 前記表示制御部は、前記統計情報と前記フィールド機器の通信品質の良否を判定するために設定された閾値との比較結果を、前記機器特定情報に対応させて前記表示部に表示させる、
請求項1から請求項3の何れか一項に記載の情報表示装置。 The display control unit causes the display unit to display a comparison result between the statistical information and a threshold value set to determine whether the communication quality of the field device is good or not, corresponding to the device identification information.
The information display device according to any one of claims 1 to 3. - 前記閾値として、フィールド機器毎に異なる値を設定可能である、
請求項4記載の情報表示装置。 A different value can be set for each field device as the threshold value.
The information display device according to claim 4. - 前記表示制御部は、前記予め規定された期間における前記通信品質情報の分布を、前記機器特定情報に対応させて前記表示部に表示させる、
請求項1から請求項5の何れか一項に記載の情報表示装置。 The display control unit displays the distribution of the communication quality information in the predetermined period on the display unit in association with the device identification information;
The information display device according to any one of claims 1 to 5. - 前記表示制御部は、前記通信品質情報の分布とともに前記統計情報を前記表示部に表示させる、
請求項6記載の情報表示装置。 The display control unit displays the statistical information on the display unit together with the distribution of the communication quality information.
The information display device according to claim 6. - 前記表示制御部は、前記通信品質情報の経時変化を前記表示部に更に表示させる、
請求項1から請求項7の何れか一項に記載の情報表示装置。 The display control unit causes the display unit to further display a change over time of the communication quality information.
The information display device according to any one of claims 1 to 7. - 前記表示制御部は、同一のフィールド機器について、前記通信品質情報が示す通信品質が、当該フィールド機器が現在使用している通信経路に比して優れている他の通信経路が存在することを示す通知を、前記機器特定情報に対応させて前記表示部に表示させる、
請求項1から請求項8の何れか一項に記載の情報表示装置。 The display control unit indicates that, for the same field device, there is another communication path in which the communication quality indicated by the communication quality information is superior to the communication path currently used by the field device. A notification is displayed on the display unit corresponding to the device identification information;
The information display device according to any one of claims 1 to 8. - プラントに設置されたフィールド機器から送信される通信健全性情報およびプロセスデータの少なくとも一方を用いて前記フィールド機器の通信品質を示す通信品質情報を求める演算部と、
前記演算部によって求められた前記通信品質情報を予め規定された期間に亘って統計処理して統計情報を得る統計処理部と、
前記統計処理部で得られた前記統計情報を出力する出力部と、
を備える情報処理装置。 A calculation unit for obtaining communication quality information indicating communication quality of the field device using at least one of communication health information and process data transmitted from the field device installed in the plant;
A statistical processing unit that obtains statistical information by statistically processing the communication quality information obtained by the arithmetic unit over a predetermined period;
An output unit that outputs the statistical information obtained by the statistical processing unit;
An information processing apparatus comprising: - プラントから得られる情報を表示する情報表示システムであって、
前記プラントに設置されたフィールド機器から送信される通信健全性情報およびプロセスデータの少なくとも一方を用いて前記フィールド機器の通信品質を示す通信品質情報を求める演算部と、
前記演算部によって求められた前記通信品質情報を予め規定された期間に亘って統計処理して統計情報を得る統計処理部と、
前記統計処理部で得られた前記統計情報を出力する出力部と、
を備える情報処理装置と、
前記情報処理装置から出力される前記統計情報を表示する情報表示装置と、
を備える情報表示システム。 An information display system for displaying information obtained from a plant,
A calculation unit for obtaining communication quality information indicating communication quality of the field device using at least one of communication health information and process data transmitted from the field device installed in the plant,
A statistical processing unit that obtains statistical information by statistically processing the communication quality information obtained by the arithmetic unit over a predetermined period;
An output unit that outputs the statistical information obtained by the statistical processing unit;
An information processing apparatus comprising:
An information display device for displaying the statistical information output from the information processing device;
An information display system comprising: - 前記情報表示装置は、
表示部と、
前記統計情報を、前記フィールド機器を特定する機器特定情報に対応させて前記表示部に表示させる表示制御部と、
を備える請求項11記載の情報表示システム。 The information display device includes:
A display unit;
A display control unit that displays the statistical information on the display unit in association with device specifying information for specifying the field device;
An information display system according to claim 11. - プラントに設置されたフィールド機器と情報処理装置との間の通信品質を示す通信品質情報を予め規定された期間に亘って統計処理して統計情報を得る第1ステップと、
前記第1ステップで得られた前記統計情報を、前記フィールド機器を特定する機器特定情報に対応させて表示する第2ステップと、
を有する情報表示方法。 A first step of obtaining statistical information by statistically processing communication quality information indicating communication quality between a field device installed in a plant and an information processing apparatus over a predetermined period;
A second step of displaying the statistical information obtained in the first step in association with device specifying information for specifying the field device;
An information display method comprising: - 前記第1ステップの前に、前記プラントに設置されたフィールド機器から送信される通信健全性情報およびプロセスデータの少なくとも一方を用いて前記フィールド機器の通信品質を示す通信品質情報を求める第3ステップを有する、
請求項13記載の情報表示方法。 Prior to the first step, a third step of obtaining communication quality information indicating communication quality of the field device using at least one of communication health information and process data transmitted from the field device installed in the plant. Have
The information display method according to claim 13.
Priority Applications (3)
| Application Number | Priority Date | Filing Date | Title |
|---|---|---|---|
| EP15746892.7A EP3104582B1 (en) | 2014-02-04 | 2015-01-14 | Information processing device, information display system, and information display method |
| US15/111,519 US10361929B2 (en) | 2014-02-04 | 2015-01-14 | Information displaying device, information processing device, information displaying system, and information displaying method |
| CN201580006891.4A CN105960793B (en) | 2014-02-04 | 2015-01-14 | Information display device, information processing unit, information display system and information display method |
Applications Claiming Priority (2)
| Application Number | Priority Date | Filing Date | Title |
|---|---|---|---|
| JP2014-019594 | 2014-02-04 | ||
| JP2014019594A JP6135529B2 (en) | 2014-02-04 | 2014-02-04 | Information display device, information processing device, information display system, and information display method |
Publications (1)
| Publication Number | Publication Date |
|---|---|
| WO2015118914A1 true WO2015118914A1 (en) | 2015-08-13 |
Family
ID=53777722
Family Applications (1)
| Application Number | Title | Priority Date | Filing Date |
|---|---|---|---|
| PCT/JP2015/050739 WO2015118914A1 (en) | 2014-02-04 | 2015-01-14 | Information display device, information processing device, information display system, and information display method |
Country Status (5)
| Country | Link |
|---|---|
| US (1) | US10361929B2 (en) |
| EP (1) | EP3104582B1 (en) |
| JP (1) | JP6135529B2 (en) |
| CN (1) | CN105960793B (en) |
| WO (1) | WO2015118914A1 (en) |
Cited By (2)
| Publication number | Priority date | Publication date | Assignee | Title |
|---|---|---|---|---|
| JP2018190103A (en) * | 2017-04-28 | 2018-11-29 | 横河電機株式会社 | Battery management device, battery management system, and battery management method |
| US10911970B2 (en) | 2015-12-31 | 2021-02-02 | Huawei Technologies Co., Ltd. | Method and apparatus for detecting time series data |
Families Citing this family (17)
| Publication number | Priority date | Publication date | Assignee | Title |
|---|---|---|---|---|
| JP2017211839A (en) | 2016-05-25 | 2017-11-30 | 横河電機株式会社 | Instrument maintenance device, instrument maintenance method, instrument maintenance program, and recording medium |
| US11675808B2 (en) | 2016-06-19 | 2023-06-13 | Data.World, Inc. | Dataset analysis and dataset attribute inferencing to form collaborative datasets |
| US11755602B2 (en) | 2016-06-19 | 2023-09-12 | Data.World, Inc. | Correlating parallelized data from disparate data sources to aggregate graph data portions to predictively identify entity data |
| US10324925B2 (en) | 2016-06-19 | 2019-06-18 | Data.World, Inc. | Query generation for collaborative datasets |
| US10853376B2 (en) | 2016-06-19 | 2020-12-01 | Data.World, Inc. | Collaborative dataset consolidation via distributed computer networks |
| US11941140B2 (en) | 2016-06-19 | 2024-03-26 | Data.World, Inc. | Platform management of integrated access of public and privately-accessible datasets utilizing federated query generation and query schema rewriting optimization |
| US10452975B2 (en) | 2016-06-19 | 2019-10-22 | Data.World, Inc. | Platform management of integrated access of public and privately-accessible datasets utilizing federated query generation and query schema rewriting optimization |
| US11947554B2 (en) | 2016-06-19 | 2024-04-02 | Data.World, Inc. | Loading collaborative datasets into data stores for queries via distributed computer networks |
| JP6477662B2 (en) * | 2016-10-28 | 2019-03-06 | 横河電機株式会社 | Antenna module |
| US11068453B2 (en) * | 2017-03-09 | 2021-07-20 | data.world, Inc | Determining a degree of similarity of a subset of tabular data arrangements to subsets of graph data arrangements at ingestion into a data-driven collaborative dataset platform |
| JP7131015B2 (en) * | 2018-03-26 | 2022-09-06 | 横河電機株式会社 | INFORMATION ACQUISITION DEVICE, GATEWAY DEVICE, PROGRAM, RECORDING MEDIUM, AND METHOD |
| US11947529B2 (en) | 2018-05-22 | 2024-04-02 | Data.World, Inc. | Generating and analyzing a data model to identify relevant data catalog data derived from graph-based data arrangements to perform an action |
| EP3576349B1 (en) * | 2018-05-31 | 2021-09-01 | ABB Power Grids Switzerland AG | Condition monitoring of wireless networks in industrial plants |
| JP6708241B2 (en) * | 2018-11-09 | 2020-06-10 | 横河電機株式会社 | Equipment maintenance device, equipment maintenance method, equipment maintenance program and recording medium |
| WO2021084616A1 (en) * | 2019-10-29 | 2021-05-06 | 株式会社パトライト | Communication system |
| JP6844726B2 (en) * | 2020-02-12 | 2021-03-17 | 住友電気工業株式会社 | Sensor information processing device and processing program |
| US11947600B2 (en) | 2021-11-30 | 2024-04-02 | Data.World, Inc. | Content addressable caching and federation in linked data projects in a data-driven collaborative dataset platform using disparate database architectures |
Citations (3)
| Publication number | Priority date | Publication date | Assignee | Title |
|---|---|---|---|---|
| JP2009165099A (en) * | 2007-12-14 | 2009-07-23 | Yokogawa Electric Corp | System and method for estimating wireless communication quality |
| US20130077477A1 (en) * | 2009-11-04 | 2013-03-28 | Aramco Services Company | Adaptive hybrid wireless and wired process control system and method |
| JP2013114471A (en) * | 2011-11-29 | 2013-06-10 | Yokogawa Electric Corp | Wireless field monitoring and display apparatus |
Family Cites Families (18)
| Publication number | Priority date | Publication date | Assignee | Title |
|---|---|---|---|---|
| US6985465B2 (en) * | 2000-07-07 | 2006-01-10 | Koninklijke Philips Electronics N.V. | Dynamic channel selection scheme for IEEE 802.11 WLANs |
| JP2003244146A (en) * | 2002-02-19 | 2003-08-29 | Hitachi Ltd | Traffic trend replay displaying apparatus in network monitoring apparatus |
| US7697549B2 (en) * | 2002-08-07 | 2010-04-13 | Extricom Ltd. | Wireless LAN control over a wired network |
| US7020438B2 (en) * | 2003-01-09 | 2006-03-28 | Nokia Corporation | Selection of access point in a wireless communication system |
| US20050052992A1 (en) * | 2003-08-01 | 2005-03-10 | Cloonan Thomas J. | Method and system for dynamically managing cable data bandwidth based on channel congestion state and subscriber usage profile |
| US20080188972A1 (en) * | 2006-10-11 | 2008-08-07 | Fisher-Rosemount Systems, Inc. | Method and System for Detecting Faults in a Process Plant |
| ATE509478T1 (en) * | 2006-12-20 | 2011-05-15 | Phonak Ag | HEARING AID SYSTEM AND OPERATING METHOD THEREOF |
| CA2573711A1 (en) * | 2007-01-10 | 2008-07-10 | Hydro Quebec | Gamma monitoring of snow water equivalent and soil moisture content |
| GB2459814B8 (en) * | 2007-03-20 | 2012-07-11 | Fujitsu Ltd | Measuring method, measuring device, and computer program |
| GB0725276D0 (en) * | 2007-12-28 | 2008-02-06 | Vibration Technology Ltd | Seismic data recording |
| CN101583140A (en) * | 2009-05-14 | 2009-11-18 | 复旦大学 | Automatic communication network monitoring system and realization method thereof |
| US8737244B2 (en) * | 2010-11-29 | 2014-05-27 | Rosemount Inc. | Wireless sensor network access point and device RF spectrum analysis system and method |
| JP5299440B2 (en) | 2011-01-13 | 2013-09-25 | 横河電機株式会社 | Route setting device, route setting method, management device, management system, and recording medium |
| JP5664315B2 (en) * | 2011-02-15 | 2015-02-04 | 富士通株式会社 | Management device, management program, and management method |
| KR101861545B1 (en) * | 2012-01-02 | 2018-05-29 | 삼성전자주식회사 | Method for managing data in storage device |
| US8655307B1 (en) * | 2012-10-26 | 2014-02-18 | Lookout, Inc. | System and method for developing, updating, and using user device behavioral context models to modify user, device, and application state, settings and behavior for enhanced user security |
| US9154996B2 (en) * | 2013-06-12 | 2015-10-06 | Honeywell International Inc. | Apparatus and method for maintaining reliability of wireless network having asymmetric or other low quality wireless links |
| US20150222504A1 (en) * | 2014-02-03 | 2015-08-06 | Apigee Corporation | System and method for monitoring and reporting data in api processing systems |
-
2014
- 2014-02-04 JP JP2014019594A patent/JP6135529B2/en active Active
-
2015
- 2015-01-14 CN CN201580006891.4A patent/CN105960793B/en active Active
- 2015-01-14 US US15/111,519 patent/US10361929B2/en active Active
- 2015-01-14 EP EP15746892.7A patent/EP3104582B1/en active Active
- 2015-01-14 WO PCT/JP2015/050739 patent/WO2015118914A1/en active Application Filing
Patent Citations (3)
| Publication number | Priority date | Publication date | Assignee | Title |
|---|---|---|---|---|
| JP2009165099A (en) * | 2007-12-14 | 2009-07-23 | Yokogawa Electric Corp | System and method for estimating wireless communication quality |
| US20130077477A1 (en) * | 2009-11-04 | 2013-03-28 | Aramco Services Company | Adaptive hybrid wireless and wired process control system and method |
| JP2013114471A (en) * | 2011-11-29 | 2013-06-10 | Yokogawa Electric Corp | Wireless field monitoring and display apparatus |
Non-Patent Citations (1)
| Title |
|---|
| See also references of EP3104582A4 * |
Cited By (3)
| Publication number | Priority date | Publication date | Assignee | Title |
|---|---|---|---|---|
| US10911970B2 (en) | 2015-12-31 | 2021-02-02 | Huawei Technologies Co., Ltd. | Method and apparatus for detecting time series data |
| EP3393085B1 (en) * | 2015-12-31 | 2022-05-11 | Huawei Technologies Co., Ltd. | Method and device for time sequence data detection |
| JP2018190103A (en) * | 2017-04-28 | 2018-11-29 | 横河電機株式会社 | Battery management device, battery management system, and battery management method |
Also Published As
| Publication number | Publication date |
|---|---|
| JP6135529B2 (en) | 2017-05-31 |
| US20160352592A1 (en) | 2016-12-01 |
| CN105960793B (en) | 2019-10-11 |
| JP2015146562A (en) | 2015-08-13 |
| EP3104582A1 (en) | 2016-12-14 |
| US10361929B2 (en) | 2019-07-23 |
| CN105960793A (en) | 2016-09-21 |
| EP3104582A4 (en) | 2017-11-01 |
| EP3104582B1 (en) | 2020-11-25 |
Similar Documents
| Publication | Publication Date | Title |
|---|---|---|
| JP6135529B2 (en) | Information display device, information processing device, information display system, and information display method | |
| EP3007369B1 (en) | Method, device and system of prompting communication event | |
| JP4568641B2 (en) | Wireless communication system, node position calculation method, and node | |
| WO2011016943A2 (en) | Gps-based wireless network connection selection and network topology overlay on satellite geographic map | |
| CN106056825B (en) | Fire alarm method, device, domestic fan apparatus and system | |
| US10830862B2 (en) | Position measuring system including a server and a plurality of beacons | |
| US8587425B2 (en) | Methods, systems and apparatus for power management | |
| US7878008B1 (en) | Smart rack and intelligent wireless climate sensors | |
| JP6624780B2 (en) | Positioning method, server and program | |
| JP6697769B2 (en) | Energy management device and energy management method | |
| JP6191897B1 (en) | Energy management apparatus and energy management method | |
| US9992559B2 (en) | Sensor management device, sensor, monitoring system, sensor management method, sensor management program, monitoring method, and monitoring program | |
| JP4563252B2 (en) | Presence information provision system | |
| JP2012112865A (en) | Position detection system and method therefor | |
| JP2005286864A (en) | Mobile communication terminal, location positioning server, location positioning system, and location positioning method | |
| JP2017227442A (en) | Radio communication system, access point, control device, and position calculation method | |
| JP2009224907A (en) | Wireless communication system and communication path setting program used for the same | |
| JP6077987B2 (en) | Radio frequency management apparatus and method | |
| JP2017220789A (en) | Terminal management system, terminal management method and program | |
| JP4659576B2 (en) | Presence management apparatus and presence management method | |
| JP2018013281A (en) | Air conditioning request management device and method | |
| CN112600687A (en) | Physical location information maintenance method and device, network equipment and storage medium | |
| JP6000790B2 (en) | Device control apparatus and method | |
| JP2019193200A (en) | Wireless communication system | |
| US8755356B1 (en) | Methods and systems for dynamically selecting requested forward-link data rate based on C/I ratio |
Legal Events
| Date | Code | Title | Description |
|---|---|---|---|
| 121 | Ep: the epo has been informed by wipo that ep was designated in this application |
Ref document number: 15746892 Country of ref document: EP Kind code of ref document: A1 |
|
| REEP | Request for entry into the european phase |
Ref document number: 2015746892 Country of ref document: EP |
|
| WWE | Wipo information: entry into national phase |
Ref document number: 15111519 Country of ref document: US Ref document number: 2015746892 Country of ref document: EP |
|
| NENP | Non-entry into the national phase |
Ref country code: DE |