WO2014157495A1 - 解析装置および解析方法 - Google Patents
解析装置および解析方法 Download PDFInfo
- Publication number
- WO2014157495A1 WO2014157495A1 PCT/JP2014/058809 JP2014058809W WO2014157495A1 WO 2014157495 A1 WO2014157495 A1 WO 2014157495A1 JP 2014058809 W JP2014058809 W JP 2014058809W WO 2014157495 A1 WO2014157495 A1 WO 2014157495A1
- Authority
- WO
- WIPO (PCT)
- Prior art keywords
- circuit board
- sound pressure
- concentrated load
- analysis
- concentrated
- Prior art date
- Legal status (The legal status is an assumption and is not a legal conclusion. Google has not performed a legal analysis and makes no representation as to the accuracy of the status listed.)
- Ceased
Links
Images










Classifications
-
- G—PHYSICS
- G01—MEASURING; TESTING
- G01H—MEASUREMENT OF MECHANICAL VIBRATIONS OR ULTRASONIC, SONIC OR INFRASONIC WAVES
- G01H17/00—Measuring mechanical vibrations or ultrasonic, sonic or infrasonic waves, not provided for in the other groups of this subclass
-
- G—PHYSICS
- G01—MEASURING; TESTING
- G01H—MEASUREMENT OF MECHANICAL VIBRATIONS OR ULTRASONIC, SONIC OR INFRASONIC WAVES
- G01H1/00—Measuring characteristics of vibrations in solids by using direct conduction to the detector
-
- G—PHYSICS
- G01—MEASURING; TESTING
- G01H—MEASUREMENT OF MECHANICAL VIBRATIONS OR ULTRASONIC, SONIC OR INFRASONIC WAVES
- G01H11/00—Measuring mechanical vibrations or ultrasonic, sonic or infrasonic waves by detecting changes in electric or magnetic properties
- G01H11/06—Measuring mechanical vibrations or ultrasonic, sonic or infrasonic waves by detecting changes in electric or magnetic properties by electric means
- G01H11/08—Measuring mechanical vibrations or ultrasonic, sonic or infrasonic waves by detecting changes in electric or magnetic properties by electric means using piezoelectric devices
-
- G—PHYSICS
- G06—COMPUTING OR CALCULATING; COUNTING
- G06F—ELECTRIC DIGITAL DATA PROCESSING
- G06F30/00—Computer-aided design [CAD]
- G06F30/20—Design optimisation, verification or simulation
- G06F30/23—Design optimisation, verification or simulation using finite element methods [FEM] or finite difference methods [FDM]
Definitions
- the present invention relates to an analysis apparatus and an analysis method for analyzing a squealing phenomenon of a circuit board on which a multilayer ceramic capacitor is mounted.
- a multilayer ceramic capacitor which is a piezoelectric body, deforms when a voltage is applied. When a periodically changing voltage is applied, the multilayer ceramic capacitor contracts according to the cycle. At this time, it is known that the entire circuit board on which the multilayer ceramic capacitor is mounted vibrates and generates sound (for example, see Non-Patent Documents 1 and 2). For example, when a multilayer ceramic capacitor is mounted on a circuit board of a mobile phone, if such a squealing phenomenon occurs, the circuit board is located near the ear, so even a small sound is anxious. Therefore, in order to take measures against the noise phenomenon, vibration analysis of a circuit board on which a multilayer ceramic capacitor is mounted is performed using a finite element method.
- a calculation model including three types of solid bodies, that is, a multilayer ceramic capacitor, a circuit board, and a medium (for example, air) is used.
- the multilayer ceramic capacitor is composed of a piezoelectric body, external electrodes, internal electrodes, solder, land patterns, and the like.
- the calculation model is divided into meshes by reflecting a three-dimensional multilayer ceramic capacitor, and the physical quantities of adjacent meshes are continuous throughout the model so as to be consistent. We are seeking physical quantities.
- the multilayer ceramic capacitor is a detailed three-dimensional model, the number of meshes increases, the amount of memory used for calculation increases, and the calculation time tends to increase.
- a large number for example, 10 or more
- monolithic ceramic capacitors may be used for the circuit board.
- the present invention has been made in view of the above-described problems of the prior art, and an object of the present invention is to provide an analysis apparatus and an analysis method capable of reducing memory usage and calculation time.
- the present invention is an analysis apparatus for analyzing a squealing phenomenon of a circuit board on which a multilayer ceramic capacitor is mounted using a finite element method, and an analysis model is constructed by the circuit board and a medium.
- the circuit board of the analysis model corresponding to the monolithic ceramic capacitor, wherein the model building means and a plurality of concentrated loads in which the sum of the vectors becomes zero and the torque related to the center of gravity is zero
- a concentrated load group applying means for applying to the circuit board, a board vibration calculating means for obtaining a vibration of the circuit board to which the concentrated load group has been applied when the magnitude of each concentrated load changes periodically in time, and Sound pressure calculation means for obtaining a sound pressure in the medium based on a pressure change of the medium due to vibration.
- a concentrated load group including a plurality of concentrated loads is given to the circuit board of the analysis model.
- the plurality of concentrated loads are set such that the sum of their vectors becomes zero and the torque related to the center of gravity is set to zero so that the circuit board does not move or rotate.
- the load acting on the circuit board by the multilayer ceramic capacitor can be replaced with a plurality of concentrated loads by the concentrated load group.
- vibration analysis using a finite element method may be performed on an analysis model composed of a circuit board and a medium, so that the number of mesh divisions is larger than when a three-dimensional solid model is used as a multilayer ceramic capacitor. The memory usage and calculation time can be suppressed.
- set value determining means for determining a set value of the location and the magnitude of the concentrated load so that the calculated value of the sound pressure is close to the actually measured value.
- the set value determining means determines the set value and the size of the concentrated load so that the calculated sound pressure value and the actually measured value are close to each other. For this reason, the sound pressure calculation means can determine the sound pressure that is close to the actually measured value actually measured. Further, when a three-dimensional solid model is used as the multilayer ceramic capacitor, the structure of the multilayer ceramic capacitor is complicated, so that modeling is often insufficient, and there is a tendency for the deviation from the actual measurement value to increase. . On the other hand, in the present invention, the load acting on the circuit board by the multilayer ceramic capacitor is replaced with a plurality of concentrated loads, so that the calculated value of the sound pressure is measured by adjusting the location and size of each concentrated load. The calculation accuracy of the sound pressure can be increased.
- the set value determining means obtains the frequency characteristic of the sound pressure
- the calculated value of the sound pressure and the actually measured value are close to each other in a peripheral band where the maximum value of the sound pressure occurs.
- the setting value of the location and the size of the concentrated load is determined.
- the set value determining means sets the concentrated load location and magnitude setting values so that the calculated sound pressure value and the actually measured value are close to each other in the peripheral band where the maximum sound pressure value occurs. Decide. For this reason, compared with the case where the calculated value of sound pressure and the measured value are brought close to each other in all bands, it is possible to reduce the calculation time required until the set value of the concentrated load is determined. In addition, since the measured value of the sound pressure can be measured with higher accuracy in the peripheral band of the maximum value compared to other frequency regions, the location and size of the concentrated load according to the measured value of the sound pressure with high accuracy. Can be determined, and the calculation accuracy of the sound pressure can be increased.
- the setting value determining means obtains the setting value of the location and size of the concentrated load for each type of the multilayer ceramic capacitor, and registers these setting values in the library;
- the apparatus further comprises setting value selection means for selecting from the library the setting value of the concentrated load corresponding to the type of the ceramic capacitor.
- the library registration means registers the location and size setting values of concentrated loads in a plurality of types of multilayer ceramic capacitors in the library. For this reason, there is no need to re-determine the location and size of the concentrated load, and the set value selection means selects from the library the concentrated load set value according to the type of multilayer ceramic capacitor, and the circuit board squeals. The phenomenon can be easily analyzed.
- the present invention relates to an analysis method for analyzing a squealing phenomenon of a circuit board on which a multilayer ceramic capacitor is mounted using a finite element method, a model construction process for constructing an analysis model using the circuit board and a medium, and a mutual vector
- a sound pressure calculation step for obtaining a sound pressure in the medium.
- a concentrated load group composed of a plurality of concentrated loads is applied to the circuit board of the analysis model by the concentrated load group applying step.
- the plurality of concentrated loads are set such that the sum of their vectors becomes zero and the torque related to the center of gravity is set to zero so that the circuit board does not move or rotate.
- the load acting on the circuit board by the multilayer ceramic capacitor can be replaced with a plurality of concentrated loads by the concentrated load group.
- vibration analysis using a finite element method may be performed on an analysis model composed of a circuit board and a medium, so that the number of mesh divisions is larger than when a three-dimensional solid model is used as a multilayer ceramic capacitor. The memory usage and calculation time can be suppressed.
- FIG. 2 is a cross-sectional view of the multilayer ceramic capacitor as seen from the direction of arrows II-II in FIG.
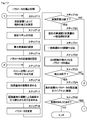
- FIG. 2 is a block diagram which shows the analyzer by the 1st Embodiment of this invention. It is a flowchart which shows the analysis process of the squealing phenomenon by the analyzer in FIG.
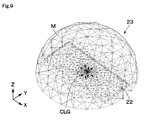
- FIG. 2 is a perspective view which shows the analysis model which consists of a circuit board and a medium. It is explanatory drawing which shows the observation point of the sound pressure in an analysis model. It is an expansion perspective view which shows the state which gave the concentrated load group to the circuit board.
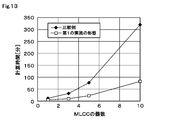
- FIG. 10 is an enlarged perspective view showing the vicinity of a concentrated load group in the circuit board in FIG. 9. It is a perspective view of the position corresponding to FIG. 10 which shows the three-dimensional model of the multilayer ceramic capacitor by a comparative example. It is a characteristic diagram which shows the frequency characteristic of a sound pressure about a comparative example and 1st Embodiment. It is a characteristic diagram which shows the relationship between the number of multilayer ceramic capacitors and calculation time about a comparative example and 1st Embodiment.
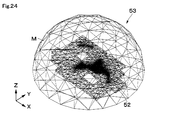
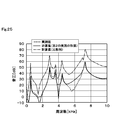
- FIG. 24 is a perspective view showing a finite element model obtained by dividing the analysis model in FIG. 23 into meshes. It is a characteristic diagram which shows the frequency characteristic of sound pressure about a measured value, a comparative example, and 2nd Embodiment.
- MLCC 1 multilayer ceramic capacitor 1
- circuit board 7 that are subject to analysis of the squeal phenomenon
- the MLCC 1 includes a piezoelectric body 2, external electrodes 3 and 4, and internal electrodes 5 and 6.
- the piezoelectric body 2 is formed of an insulating material having piezoelectricity and has, for example, a rectangular parallelepiped shape.
- External electrodes 3 and 4 are provided outside the piezoelectric body 2 at both ends in the length direction (X direction), respectively.
- a plurality of internal electrodes 5 and 6 are alternately stacked in the thickness direction (Z direction) inside the piezoelectric body 2.
- the internal electrode 5 is electrically connected to one external electrode 3, and the internal electrode 6 is electrically connected to the other external electrode 4. Further, the internal electrode 5 and the internal electrode 6 are separated from each other and electrically insulated.
- the internal electrodes 5 and 6 may be stacked not only in the thickness direction (Z direction) but also in the width direction (Y direction), for example.
- the external electrodes 3 and 4 of the MLCC 1 are joined to the land pattern 8 of the circuit board 7 by solder 9. As a result, the MLCC 1 is mounted on the circuit board 7.
- the MLCC 1 contracts in the thickness direction (Z direction) or the length direction (X direction), for example, according to the cycle. Due to the contraction of the MLCC 1, the entire circuit board 7 vibrates and generates a sound.
- FIG. 3 shows the overall configuration of the analysis apparatus 11 according to the first embodiment.
- the analysis device 11 is configured by a computer 12.
- the computer 12 includes a storage unit 12A including a ROM, a RAM, and the like that store an analysis program described later, and an output side thereof is connected to the display device 13. Then, the computer 12 analyzes a squeaking phenomenon caused by the circuit board 22 by executing a program of analysis processing using the finite element method shown in FIG.
- the analysis model 21 is constructed by the circuit board 22 and the medium M, and the vibration of the MLCC 1 is replaced with the vibration of the concentrated loads CLa to CLd to be given to the circuit board 22. .
- the analysis model 21 is analyzed for vibration and pressure change based on the finite element method, and the sound pressure at a predetermined observation point P is obtained. This operation is repeated while changing the vibration frequency of the concentrated loads CLa to CLd, and the frequency characteristic of the sound pressure at the observation point P is acquired.
- the computer 12 displays the frequency characteristic of the sound pressure thus obtained on the display device 13.
- the analysis model 21 is constructed by the circuit board 22 and a medium M such as air covering the circuit board 22 (see FIG. 5).
- the circuit board 22 corresponds to the circuit board 7 from which the MLCC 1 is omitted.
- the analysis model 21 is formed in a hemispherical shape having, for example, a circular bottom surface, and the bottom surface of the medium M and the bottom surface of the circuit board 22 are arranged on the same plane.
- the center position of the circuit board 22 is arranged at the center position of the bottom surface of the analysis model 21. For this reason, the center of the medium M and the center of the circuit board 22 coincide with each other on the bottom surface.
- the analysis model 21 adopts the above-described configuration in consideration of, for example, reduction of calculation load, but is not limited to this configuration. That is, the analysis model 21 is not limited to a hemispherical shape, and may be, for example, a spherical shape, a cubic shape, a cylindrical shape, or a polyhedral shape. Further, the position and shape of the circuit board 22 can be changed as appropriate.
- a concentrated load group CLG including four concentrated loads CLa to CLd is given to the circuit board 22 in the analysis model 21.
- the four concentrated loads CLa to CLd are set so that the sum of the vectors becomes zero and the torque related to the center of gravity G becomes zero.
- the concentrated loads CLa and CLb correspond to both ends of the MLCC 1 in the X direction (length direction) on the X axis passing through the center of gravity G of the MLCC 1 when the circuit board 22 is viewed in plan. Placed in position.
- the concentrated loads CLc and CLd are arranged on the Y axis passing through the center of gravity G of the MLCC 1 when the circuit board 22 is viewed in plan view, at positions corresponding to both ends of the MLCC 1 in the Y direction (width direction). For this reason, the concentrated loads CLa to CLd are arranged in a diamond shape.
- the concentrated load group CLG has the same length dimension L as the length dimension of the MLCC 1 and the same width dimension W as the width dimension of the MLCC 1.
- the longer direction (length dimension L) and the direction of the long side of the circuit board 22 coincide with each other.
- the shorter one of the length dimension L and the width dimension W (width dimension W) and the direction of the short side of the circuit board 22 coincide with each other.
- the concentrated loads CLa and CLb have X-direction components (parameter Fx) having the same magnitude in opposite directions and also having Z-direction components (parameter Fz) having the same magnitude in the same direction.
- the concentrated loads CLc and CLd have a Y direction component (parameter Fy) having the same magnitude in the opposite direction and a Z direction component (parameter Fz) having the same magnitude in the same direction.
- the Z direction components of the concentrated loads CLa and CLb and the Z direction components of the concentrated loads CLc and CLd are equal in the opposite directions. As a result, the four concentrated loads CLa to CLd have zero vector sum and zero torque about the center of gravity G.
- the concentrated load group CLG1 is exemplified by the case of four concentrated loads CLa to CLd.
- the concentrated load group CLG1 is not limited to four as long as a planar load distribution can be provided. That is, the concentrated load group CLG may be configured by three concentrated loads or may be configured by five or more concentrated loads. Further, the arrangement of the four concentrated loads CLa to CLd is not limited to the above-described position, and may be changed as appropriate. For this reason, the length dimension L and the width dimension W of the concentrated load group CLG are not limited to the above-described values, and can be appropriately changed within a range in which the vibration of the MLCC 1 is reflected on the circuit board 22.
- step 3 the values of parameters L, W, Fx, Fy, and Fz for concentrated loads CLa to CLd are set.
- the parameter L indicates the dimension in the X direction (length direction) of the concentrated load group CLG
- the parameter W indicates the dimension in the Y direction (width direction) of the concentrated load group CLG.
- the parameter Fx indicates the magnitude of the load in the X direction of the concentrated load set CLG
- the parameter Fy indicates the magnitude of the load in the Y direction of the concentrated load set CLG
- the parameter Fz indicates the concentrated load.
- the magnitude of the load force in the Z direction of the set CLG is shown.
- the units of the parameters Fx, Fy, and Fz are all [N] (Newton).
- the values of the parameters L and W are set to the length dimension and the width dimension of the MLCC 1, for example.
- the values of the parameters Fx, Fy, and Fz appropriate numerical values are set in consideration of, for example, the actual measurement result by the MLCC 1.
- a finite element model (hereinafter referred to as FEM model 23) is created by dividing the analysis model 21 into a finite number of elements. Specifically, as shown in FIG. 9, these reference shapes are modeled for the circuit board 22 and the medium M in the analysis model 21, and the FEM model 23 is divided into a plurality of finite elements by mesh division.
- the element examples include a tetrahedral solid element, a pentahedral solid element, a hexahedral solid element, and the like. These elements have three-dimensional coordinates (for example, the length direction of the circuit board 22 is the X axis, and the width direction of the circuit board 22 is XYZ coordinates) with the Y axis as the Y axis and the Z axis as the vertical direction. Then, physical quantities such as stress and displacement in the mesh are allocated to the memory of the computer 12. In order to reduce the calculation time while improving the accuracy of the analysis result, at the time of dividing the mesh, a mesh is formed more finely around the concentrated load group CLG than the other portions (see FIG. 10).
- step 5 the simultaneous equations based on the stiffness equation are solved for the circuit board 22 in the FEM model 23, and the vibration of the circuit board 22 is obtained.
- the concentrated loads CLa to CLd of the concentrated load group CLG are vibrated sinusoidally at a frequency f within a predetermined frequency band B.
- the vibration of the circuit board 22 at each frequency f is obtained while changing the frequency f every predetermined frequency interval (for example, 100 Hz). Thereby, the vibration of the circuit board 22 in the frequency band B is obtained.
- the frequency f is set, for example, within a range of a frequency band B of 10 kHz or less where human auditory sensitivity is high.
- the frequency band B is set to, for example, 10 kHz or less as a band having high human auditory sensitivity, but may be expanded to about 20 kHz, which is the upper limit frequency of the human audible band, as necessary.
- step 6 for the medium M in the FEM model 23, the simultaneous equations based on the equations relating to the fluid motion are solved, and the pressure change of the medium M based on the vibration of the circuit board 22 is obtained. Then, this pressure change is converted into sound pressure, and the sound pressure at the observation point P is obtained.
- the vibration of the circuit board 22 is calculated for each frequency f at which the concentrated loads CLa to CLd vibrate in step 5, the sound pressure level for each frequency f can be obtained. For this reason, the frequency characteristic of the sound pressure in the frequency band B can be obtained, and the frequency characteristic of the sound pressure is recorded as a calculated value.
- the position is set (see FIG. 6).
- observation point P is not limited to the position described above, and any position around the circuit board 22 is within the range of the analysis model 21 and within the range in which the sound pressure level changes due to the vibration of the circuit board 22. But you can. However, in consideration of the level of the sound pressure level, it is preferable to set the observation point P directly above the MLCC 1 serving as a vibration source.
- step 7 the frequency characteristics of the sound pressure recorded in step 6 are displayed on the display device 13. Thereafter, the process ends.
- the finite element model (FEM model) is configured by dividing the circuit board 22 and the medium M into a mesh including the three-dimensional model 31 while representing the three-dimensional model 31 of the MLCC 1. . Then, a voltage having a predetermined frequency is applied to an internal electrode (not shown) in the three-dimensional model 31, and the deformation of the three-dimensional model 31 at this time is obtained using a finite element method. Since the deformation of the three-dimensional model 31 is transmitted to the circuit board 22 through the solder, the vibration of the circuit board 22 is analyzed based on the analysis result of the deformation of the three-dimensional model 31. Thereafter, the pressure change of the medium M based on the vibration of the circuit board 22 is obtained, and the sound pressure is obtained from the pressure change.
- FEM model finite element model
- FIG. 12 shows the frequency characteristic of the sound pressure obtained by the analysis device 11 and the frequency characteristic of the sound pressure obtained by the comparative example.
- the circuit board 22 was a rectangular plate having dimensions of 100 mm in the X direction, 40 mm in the Y direction, and 1.6 mm in the Z direction.
- the medium M had a hemispherical shape with a radius of 60 mm.
- the MLCC 1 of the three-dimensional model 31 is a rectangular parallelepiped having dimensions of 2 mm in the X direction, 1.2 mm in the Y direction, and 1.2 mm in the Z direction, a capacitance of 47 ⁇ F, a DC bias voltage of 4 V, and 1 Vpp. The AC voltage was applied.
- the parameter L of the concentrated loads CLa to CLd is set to 2 mm
- the parameter W is set to 1.2 mm
- the parameter Fx is set to ⁇ 0.31 N
- the parameter Fy is set to ⁇ 0.1 N
- the parameter Fz is set to ⁇ 0.1 N. did.
- the analysis device 11 and the comparative example can obtain frequency characteristics of substantially the same sound pressure.
- the number of meshes is 17581.
- the number of meshes is 8641, which can be reduced to about 48% compared to the comparative example. That is, since the memory usage of the computer 12 is approximately proportional to the number of meshes, the memory usage of the computer 12 can be reduced to about half compared to the comparative example.
- the analysis apparatus 11 even if the number of MLCCs 1 increases, the number of meshes of the circuit board 22 and the medium M only increases. The number of meshes is reduced. As a result, in the first embodiment, the number of unknowns of simultaneous equations is reduced as compared with the comparative example, so that the calculation time can be reduced. As shown in FIG. 14, the effect of reducing the calculation time becomes more prominent as the number of MLCCs 1 increases.
- the analysis model 21 including the circuit board 22 and the medium M is constructed, and the circuit board 22 is provided with the concentrated load group CLG including the four concentrated loads CLa to CLd. That is, the load acting on the circuit board 22 by the MLCC 1 is replaced with four concentrated loads CLa to CLd.
- vibration analysis using the finite element method may be performed on the analysis model 21 composed of the circuit board 22 and the medium M, so that the FEM model is compared with the case where the three-dimensional solid model 31 is used as the MLCC 1.
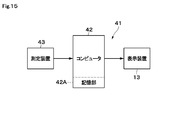
- FIG. 15 shows the overall configuration of the analysis apparatus 41 according to the second embodiment.
- the analysis device 41 includes a computer 42 and a measurement device 43 that measures sound pressure by the circuit board 7 on which the MLCC 1 is mounted.
- the computer 42 includes a storage unit 42 ⁇ / b> A that stores an analysis program, which will be described later, and the input side is connected to the measuring device 43 and the output side is connected to the display device 13.
- the measuring device 43 includes an anechoic box 43A, an oscillator 43B, a microphone 43C, and a noise meter 43D.
- the anechoic box 43A is formed in a box shape in which a sound wave absorbing material is provided on the inner surface.
- the circuit board 7 on which the MLCC 1 is mounted as a measurement target is disposed.
- MLCC 1 will be described as an example of a rectangular parallelepiped shape having dimensions of 1.6 mm in the X direction, 0.8 mm in the Y direction, and 0.8 mm in the Z direction and a capacitance of 22 ⁇ F.
- the oscillator 43B constitutes a signal input source, and inputs a sine wave signal having a predetermined frequency f and amplitude to the external electrodes 3 and 4 of the MLCC 1.
- the frequency f of the sine wave signal is controlled by the computer 42, and is set within the range of the frequency band B of 10 kHz or less where the human auditory sensitivity is high, for example.
- the oscillator 43B applies an AC voltage of 1 Vpp at 0 to 10 kHz, for example, as a sine wave signal to the MLCC 1 together with a DC bias voltage of about 4V.
- the frequency f and the amplitude are not limited to the values described above, and can be appropriately changed in consideration of, for example, the actual specification of the MLCC 1.
- the microphone 43C is a sound collecting microphone that collects vibration sound (sound pressure) of the circuit board 7, and is arranged in the anechoic box 43A together with the circuit board 7 and the like.
- This microphone 43C is arranged at the observation point P.
- the shape of the circuit board 7 is not limited to that described above, and may be other shapes such as a square, a polygon, and a circle. Further, the size of the circuit board 7 can be changed as appropriate in consideration of, for example, the size of the circuit board actually applied.
- step 11 the sound pressure of the circuit board 7 on which the MLCC 1 is mounted is measured over the predetermined frequency band B using the measuring device 43.
- the measurement result is stored in the storage unit 42A of the computer 42.
- an analysis model 21 corresponding to the circuit board 7 on which the MLCC 1 is mounted is constructed.
- the analysis model 21 is configured by a circuit board 22 and a medium M such as air that covers the circuit board 22 (see FIG. 5).
- the circuit board 22 corresponds to the circuit board 7 from which the MLCC 1 is omitted.
- the analysis model 21 is formed in a hemispherical shape having, for example, a circular bottom surface, and the center position of the circuit board 7 is arranged at the center position of the bottom surface.
- step 15 as in the first embodiment, an FEM model 23 is created by dividing the analysis model 21 into a finite number of elements (see FIG. 9). Then, physical quantities such as stress and displacement in the mesh are allocated to the memory of the computer 42. In order to reduce the calculation time while improving the accuracy of the analysis result, at the time of dividing the mesh, a finer mesh is formed around the concentrated load group CLG1 than the other portions.
- step 17 the simultaneous equations based on the equations relating to the fluid motion are solved for the medium M in the FEM model 23, and the pressure change of the medium M based on the vibration of the circuit board 22 is obtained. Then, this pressure change is converted into sound pressure, and the sound pressure at the observation point P is obtained.
- the vibration of the circuit board 22 is calculated for each frequency f at which the concentrated loads CLa to CLd vibrate, the sound pressure level for each frequency f can be obtained. For this reason, the frequency characteristic of the sound pressure in the frequency band B can be obtained, and the frequency characteristic of the sound pressure is recorded as a calculated value.
- step 18 At this time, in step 18, at least three different values are set for each parameter Fx, Fy, Fz.
- Step 19 it is determined whether or not a predetermined number of calculations (for example, 9 times) has been completed. If “NO” is determined in the step 19, the operations of the steps 15 to 18 are repeated. On the other hand, if “YES” is determined in the step 19, the process proceeds to the step 20.
- the parameters Fx, Fy, and Fz may be adjusted separately.
- the predetermined number of calculations used for the determination in step 19 can be, for example, three.
- step 20 for the calculated values of the frequency characteristics of the sound pressure for nine times, a coincidence index with the actually measured value is calculated.
- the coincidence index is an index of how much the measured value and the calculated value of the sound pressure match, and for example, the residual mean square is applied.
- the residual mean square is the mean square of the difference between the actual measurement value and the calculated value for each frequency, and the smaller the difference, the better the characteristics.
- This residual mean square may be calculated over the entire frequency band B. However, considering the reduction of calculation time and the fact that the measurement error is large and the sound pressure is low, the sound error is not suitable. Only the peripheral band of the maximum value (peak) of pressure is calculated. As the peripheral band of the maximum value of the sound pressure, for example, a frequency range in which the sound pressure is reduced by about 2 to 10 dB with respect to the maximum value may be set, and a predetermined frequency range centered on a frequency at which the maximum value occurs ( For example, it may be set to about ⁇ 25 to 100 Hz. The residual mean square may be calculated only for the frequency at which the maximum value of the sound pressure occurs.
- step 21 the coincidence index is approximated by a quadratic function, and a coefficient U 0 that is a minimum value of the quadratic function is obtained based on the formula 2 described later.
- step 22 parameters Fx, Fy, and Fz for minimizing the quadratic function are obtained based on the following formula (3). The method for obtaining the parameters Fx, Fy, and Fz will be described in detail below.
- the residual mean square V can be approximately expressed by the following equation 1 using the parameters Fx, Fy, and Fz. Note that a1, a2, b1, b2, c1, c2, and U in Equation 1 indicate coefficients.
- Mathematical formula 1 can be transformed into mathematical formula 2.
- the parameters Fx, Fy, and Fz that minimize the residual mean square V can be obtained by approximation using a quadratic function. However, this is only an approximation, and a theoretical minimum value cannot be obtained. . Therefore, using the parameters Fx, Fy, and Fz obtained once as a starting point, the residual mean square V is approximated again by a quadratic function, and the parameters Fx, Fy, and Fz that are minimum values are sequentially obtained. By repeating this operation, it is possible to search for a set of parameters Fx, Fy, Fz in which the residual mean square V gradually decreases.
- step 25 it is determined whether or not the parameters L, W, Fx, Fy, and Fz of the concentrated loads CLa to CLd are to be derived for different types of MLCCs 1 of different types.
- the different types of MLCCs 1 are, for example, those in which the capacitance, the shape and size of the piezoelectric body 2, the material constant, the shapes, sizes, and arrangements of the electrodes 3 to 6 are different.
- step 25 the registration of the parameter setting values L1 to Ln, W1 to Wn, Fx1 to Fxn, Fy1 to Fyn, and Fz1 to Fzn is completed for all types of MLCC1. Exit.
- parameters L, W, Fx, Fy, and Fz of the concentrated load groups CLG1 to CLGn corresponding to the plurality of types (n types) of MLCCs 1 has been described as an example.
- the present invention is not limited to this.
- parameters L, W, Fx, Fy, and Fz of the concentrated load group CLG corresponding to one type of MLCC 1 may be derived.
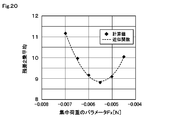
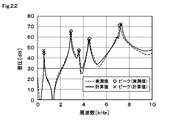
- the parameter Fx is set to -0.01N
- the parameter Fy is set to 0.001N
- the parameter Fz is set to 0.01N.
- the calculated value of the sound pressure deviates from the actually measured value, and the residual mean square at this time is about 33.3.
- the set values of the parameters Fx, Fy, and Fz are finally derived by the above-described parameter derivation process under the same conditions as in FIG. 21.
- the parameter Fx is ⁇ 0.0212N and the parameter Fy. Is set to -0.0014N
- the parameter Fz is set to 0.0108N.
- the calculated value of the sound pressure is close to the actually measured value, and the residual mean square is reduced to about 4.8.
- the calculated value of the sound pressure can be brought close to the measured value with high accuracy by adjusting a small number of parameters.
- step 32 MLCC1 mounted on the circuit board 52 from the set values L1 to Ln, W1 to Wn, Fx1 to Fxn, Fy1 to Fyn, Fz1 to Fzn of the concentrated load groups CLG1 to CLGn registered in the library 44. Select the one corresponding to. For example, when 10 types of MLCC1 corresponding to the concentrated load groups CLG1 to CLG10 are mounted on the circuit board 52, parameter setting values L1 to L10, W1 to W10, Fx1 to Fx10, Fy1 to Fy10, Fz1 from the library 44 ⁇ Fz10 is selected.
- step 33 the concentrated load groups CLG1 to CLG10 selected in step 32 are given to the circuit board 52 in the analysis model 51.
- the concentrated load groups CLG1 to CLG10 have concentrated loads CLa to CLd, respectively, and the concentrated loads CLa to CLd are set so that the sum of the vectors becomes zero and the torque related to the center of gravity G becomes zero.
- step 34 the set values L1 to L10, W1 to W10, Fx1 to Fx10, Fy1 to Fy10, Fz1 to Fz10 of the parameters selected in step 32 are set to the concentrated loads CLa to CLd of the concentrated load groups CLG1 to CLG10, respectively. .
- the measured value of the comparative example is different from the actually measured value, as compared to the actually measured value and the calculated value obtained by the analyzing device 41.
- the reason for this is considered that the structure of MLCC 1 is complicated and modeling of the three-dimensional model 31 is insufficient. That is, when the three-dimensional model 31 is used, for example, the dimensions and material constants of each part are set with 129 parameters, but the modeling is still not sufficient. There is also a problem that adjustment is difficult because the number of parameters is too large.
- the analysis device 41 can obtain a sound pressure characteristic close to the actual measurement value by adjusting a small number of parameters, for example, five, and matches the actual measurement value. Accuracy can be increased.
- the calculation time is 10 minutes 44 seconds, whereas in the analysis device 41, the calculation time is 4 minutes 48 seconds.
- the calculation time can be reduced to about 45% as compared with the comparative example.
- the same operational effects as those in the first embodiment can be obtained.
- the set values of the concentrated load parameters L, W, Fx, Fy, and Fz are determined so that the calculated value of the sound pressure is close to the actually measured value.
- the analyzer 41 can obtain the sound pressure that is close to the actually measured value.
- the load acting on the circuit board 52 by the MLCC 1 is replaced by four concentrated loads CLa to CLd. Therefore, by adjusting the parameters L, W, Fx, Fy, and Fz of each concentrated load, The calculated value of sound pressure can be brought close to the actually measured value.
- the analysis device 41 registers the set values L1 to Ln, W1 to Wn, Fx1 to Fxn, Fy1 to Fyn, and Fz1 to Fzn of concentrated load parameters in a plurality of types of MLCC 1 in the library 44. Therefore, there is no need to obtain the parameter setting values L1 to Ln, W1 to Wn, Fx1 to Fxn, Fy1 to Fyn, and Fz1 to Fzn, and the parameter setting values L1 to Ln, W1 to Wn according to the type of MLCC1.
- Fx1 to Fxn, Fy1 to Fyn, and Fz1 to Fzn are selected from the library 44, so that the squeaking phenomenon of the circuit board 52 can be easily analyzed.
- a supplier that manufactures MLCC 1 creates the library 44
- a user using the MLCC 1 can analyze the squealing phenomenon of the circuit board 52 using the library 44 created by the supplier.
- the user does not need to inquire the supplier about the vibration characteristics of the MLCC 1 to be used, and can easily analyze the squealing phenomenon of the circuit board 52 using the library 44. Efficiency in circuit design can be increased.
- steps 1 and 31 in FIGS. 4 and 18 show specific examples of the model building means (model building process), and steps 2 and 33 are concentrated load group applying means (concentrated load group applying process).
- steps 5 and 36 show a specific example of the substrate vibration calculation means (substrate vibration calculation step)
- steps 6 and 37 show a specific example of the sound pressure calculation means (sound pressure calculation step).
- steps 14 to 22 in FIG. 17 show a specific example of the set value determining means (set value determining step)
- step 24 shows a specific example of the library registering means (library registration step)
- the specific example of a value selection means (setting value selection process) is shown.
Landscapes
- Physics & Mathematics (AREA)
- General Physics & Mathematics (AREA)
- Engineering & Computer Science (AREA)
- Theoretical Computer Science (AREA)
- Computer Hardware Design (AREA)
- Evolutionary Computation (AREA)
- Geometry (AREA)
- General Engineering & Computer Science (AREA)
- Measurement Of Mechanical Vibrations Or Ultrasonic Waves (AREA)
Abstract
Description



7,22,52 回路基板
11,41 解析装置
12,42 コンピュータ
13 表示装置
21,51 解析モデル
43 測定装置
44 ライブラリ
CLG,CLG1~CLGn 集中荷重組
CLa~CLd 集中荷重
Claims (5)
- 有限要素法を用いて積層セラミックコンデンサを実装した回路基板の鳴き現象を解析する解析装置であって、
前記回路基板と媒質とによって解析モデルを構築するモデル構築手段と、
互いのベクトルの和が零になり、かつ重心に関するトルクが零になる複数の集中荷重からなる集中荷重組を、前記積層セラミックコンデンサに対応して前記解析モデルの前記回路基板に与える集中荷重組付与手段と、
前記各集中荷重の大きさが時間的に周期変化したときに、前記集中荷重組を与えた前記回路基板の振動を求める基板振動演算手段と、
前記回路基板の振動による前記媒質の圧力変化に基づいて前記媒質中の音圧を求める音圧演算手段とを備えた解析装置。 - 前記音圧の計算値と実測値とが近い値となるように、前記集中荷重の場所と大きさの設定値を決める設定値決定手段をさらに備えてなる請求項1に記載の解析装置。
- 前記設定値決定手段は、前記音圧の周波数特性を求めたときに、前記音圧の極大値が生じる周辺帯域で前記音圧の計算値と実測値とが近い値となるように、前記集中荷重の場所と大きさの設定値を決めてなる請求項2に記載の解析装置。
- 前記設定値決定手段によって、前記積層セラミックコンデンサの種類毎に前記集中荷重の場所と大きさの設定値を求めて、これらの設定値をライブラリに登録するライブラリ登録手段と、
前記積層セラミックコンデンサの種類に応じた前記集中荷重の設定値を前記ライブラリから選択する設定値選択手段とをさらに備えてなる請求項2に記載の解析装置。 - 有限要素法を用いて積層セラミックコンデンサを実装した回路基板の鳴き現象を解析する解析方法であって、
前記回路基板と媒質とによって解析モデルを構築するモデル構築工程と、
互いのベクトルの和が零になり、かつ重心に関するトルクが零になる複数の集中荷重からなる集中荷重組を、前記積層セラミックコンデンサに対応して前記解析モデルの前記回路基板に与える集中荷重組付与工程と、
前記各集中荷重の大きさが時間的に周期変化したときに、前記集中荷重組を与えた前記回路基板の振動を求める基板振動演算工程と、
前記回路基板の振動による前記媒質の圧力変化に基づいて前記媒質中の音圧を求める音圧演算工程とを備えた解析方法。
Priority Applications (3)
| Application Number | Priority Date | Filing Date | Title |
|---|---|---|---|
| CN201480018291.5A CN105103155B (zh) | 2013-03-28 | 2014-03-27 | 分析装置以及分析方法 |
| JP2015508684A JP5854170B2 (ja) | 2013-03-28 | 2014-03-27 | 解析装置および解析方法 |
| US14/865,584 US10267674B2 (en) | 2013-03-28 | 2015-09-25 | Analysis device and analysis method |
Applications Claiming Priority (2)
| Application Number | Priority Date | Filing Date | Title |
|---|---|---|---|
| JP2013-069619 | 2013-03-28 | ||
| JP2013069619 | 2013-03-28 |
Related Child Applications (1)
| Application Number | Title | Priority Date | Filing Date |
|---|---|---|---|
| US14/865,584 Continuation US10267674B2 (en) | 2013-03-28 | 2015-09-25 | Analysis device and analysis method |
Publications (1)
| Publication Number | Publication Date |
|---|---|
| WO2014157495A1 true WO2014157495A1 (ja) | 2014-10-02 |
Family
ID=51624456
Family Applications (1)
| Application Number | Title | Priority Date | Filing Date |
|---|---|---|---|
| PCT/JP2014/058809 Ceased WO2014157495A1 (ja) | 2013-03-28 | 2014-03-27 | 解析装置および解析方法 |
Country Status (4)
| Country | Link |
|---|---|
| US (1) | US10267674B2 (ja) |
| JP (1) | JP5854170B2 (ja) |
| CN (1) | CN105103155B (ja) |
| WO (1) | WO2014157495A1 (ja) |
Families Citing this family (3)
| Publication number | Priority date | Publication date | Assignee | Title |
|---|---|---|---|---|
| US10296693B2 (en) * | 2014-12-11 | 2019-05-21 | Mentor Graphics Corporation | Three-dimensional composite solid component modeling |
| DE102017109712A1 (de) * | 2017-05-05 | 2018-11-08 | Avl Software And Functions Gmbh | Bestimmung akustischer Störsignale in elektrischen Schaltungen |
| JP7147831B2 (ja) * | 2020-02-21 | 2022-10-05 | Jfeスチール株式会社 | 変圧器の積層鉄心の弾性マトリックス決定方法および振動解析方法 |
Citations (1)
| Publication number | Priority date | Publication date | Assignee | Title |
|---|---|---|---|---|
| JP2000349360A (ja) * | 1999-06-04 | 2000-12-15 | Murata Mfg Co Ltd | 圧電トランス、圧電インバータ及び液晶ディスプレイ |
Family Cites Families (4)
| Publication number | Priority date | Publication date | Assignee | Title |
|---|---|---|---|---|
| US9061139B2 (en) * | 1998-11-04 | 2015-06-23 | Greatbatch Ltd. | Implantable lead with a band stop filter having a capacitor in parallel with an inductor embedded in a dielectric body |
| US7742257B2 (en) * | 2006-01-18 | 2010-06-22 | Seagate Technology Llc | Acoustic damping pad that reduces deflection of a circuit board |
| KR101499717B1 (ko) * | 2013-05-21 | 2015-03-06 | 삼성전기주식회사 | 적층 세라믹 커패시터 및 적층 세라믹 커패시터 실장 기판 |
| JP5897661B2 (ja) * | 2013-08-30 | 2016-03-30 | 太陽誘電株式会社 | 積層セラミックコンデンサ |
-
2014
- 2014-03-27 WO PCT/JP2014/058809 patent/WO2014157495A1/ja not_active Ceased
- 2014-03-27 JP JP2015508684A patent/JP5854170B2/ja active Active
- 2014-03-27 CN CN201480018291.5A patent/CN105103155B/zh active Active
-
2015
- 2015-09-25 US US14/865,584 patent/US10267674B2/en active Active
Patent Citations (1)
| Publication number | Priority date | Publication date | Assignee | Title |
|---|---|---|---|---|
| JP2000349360A (ja) * | 1999-06-04 | 2000-12-15 | Murata Mfg Co Ltd | 圧電トランス、圧電インバータ及び液晶ディスプレイ |
Non-Patent Citations (2)
| Title |
|---|
| QIANG-TAO LAI ET AL.: "Compensation Design for DC Blocking Multilayer Ceramic Capacitor in High-Speed Applications", COMPONENTS, PACKAGING AND MANUFACTURING TECHNOLOGY, IEEE TRANSACTIONS, vol. 1, no. ISSUE, May 2011 (2011-05-01), pages 742 - 751 * |
| TATSUYA HOSOKAWA ET AL.: "A Novel Multi- Resonant Current ZVS Converter Operated in Fixed Frequency", IEICE TECHNICAL REPORT. EE , ENERGY ENGINEERING IN ELECTRONICS AND COMMUNICATIONS, vol. 110, no. 393, 20 January 2011 (2011-01-20), pages 11 - 16 * |
Also Published As
| Publication number | Publication date |
|---|---|
| JP5854170B2 (ja) | 2016-02-09 |
| JPWO2014157495A1 (ja) | 2017-02-16 |
| CN105103155B (zh) | 2018-05-08 |
| US20160011040A1 (en) | 2016-01-14 |
| CN105103155A (zh) | 2015-11-25 |
| US10267674B2 (en) | 2019-04-23 |
Similar Documents
| Publication | Publication Date | Title |
|---|---|---|
| JP5854170B2 (ja) | 解析装置および解析方法 | |
| Ghemari et al. | Optimizing damping ratio in capacitive sensors to enhance accuracy and reduce noise | |
| Saheban et al. | A multi-objective optimization of sensitivity and bandwidth of a 3-D MEMS bionic vector hydrophone | |
| CN112487679A (zh) | 一种音箱声学特性的数值仿真方法、系统、终端及介质 | |
| CN118964806B (zh) | 一种光学关键尺寸测量方法、装置、存储介质及设备 | |
| CN112016234B (zh) | 差容式地震计机械摆、测试系统及测试方法 | |
| Huang | Electromechanical coupling efficiency of transverse vibration in piezoelectric plates according to electrode configuration | |
| CN115204016A (zh) | 一种小尺寸圆柱体空间振动模态测量结果的验证方法 | |
| CN118036411A (zh) | 压电微型传感器的优化设计方法和装置 | |
| AU2015286224A1 (en) | An electromechanical transducer | |
| Shim et al. | New equivalent circuit of a cymbal transducer incorporating the third harmonic mode of vibration | |
| Moretti et al. | Finite element modelling of the vibro-acoustic response in dielectric elastomer membranes | |
| Koszewnik | The influence of a slider gap in the beam–slider structure with an MFC element on energy harvesting from the system: Experimental case | |
| Sellountos et al. | A meshless local boundary integral equation method for solving transient elastodynamic problems | |
| Gueorguiev et al. | Frequency characteristics of seismic piezoelectric sensors under one-dimensional mechanical action | |
| CN121475280B (zh) | 一种应对惯性测量单元的误差识别方法及系统 | |
| Blažević et al. | Nonlinear numerical modelling and experimental validation of multilayer piezoelectric vibration energy scavengers | |
| CN114139336B (zh) | 一种虚拟振动系统建模方法及装置 | |
| Berezovski et al. | Comparative study of finite element method, isogeometric analysis, and finite volume method in elastic wave propagation of stress discontinuities | |
| Aitbaeva et al. | Identification of fixedness and loading of an end of the Euler–Bernoulli beam by the natural frequencies of its vibrations | |
| Tao et al. | Bio-inspired directional sensor with piezoelectric microfiber and helical electrodes | |
| Li et al. | 785. Bond graph-based analysis of energy conversion in vibration-piezoelectricity coupling and its application to a cantilever vibration energy harvester | |
| Ghemari et al. | Modeling and improvement in piezoelectric sensor design | |
| CN121960272A (zh) | 一种基于模态匹配与谱展开的开口圆柱腔内嵌刚性球散射体声场计算方法、程序、设备及存储介质 | |
| Vasilyuk | Recurrent Implementation of Integral Magnetometer Calibration Algorithm Using the Measurements of a Three-Axis Gyro |
Legal Events
| Date | Code | Title | Description |
|---|---|---|---|
| WWE | Wipo information: entry into national phase |
Ref document number: 201480018291.5 Country of ref document: CN |
|
| 121 | Ep: the epo has been informed by wipo that ep was designated in this application |
Ref document number: 14774832 Country of ref document: EP Kind code of ref document: A1 |
|
| ENP | Entry into the national phase |
Ref document number: 2015508684 Country of ref document: JP Kind code of ref document: A |
|
| NENP | Non-entry into the national phase |
Ref country code: DE |
|
| 122 | Ep: pct application non-entry in european phase |
Ref document number: 14774832 Country of ref document: EP Kind code of ref document: A1 |