WO2014103729A1 - 生体光計測装置およびその信号分離方法 - Google Patents
生体光計測装置およびその信号分離方法 Download PDFInfo
- Publication number
- WO2014103729A1 WO2014103729A1 PCT/JP2013/083284 JP2013083284W WO2014103729A1 WO 2014103729 A1 WO2014103729 A1 WO 2014103729A1 JP 2013083284 W JP2013083284 W JP 2013083284W WO 2014103729 A1 WO2014103729 A1 WO 2014103729A1
- Authority
- WO
- WIPO (PCT)
- Prior art keywords
- delay time
- component
- separation
- data
- measurement data
- Prior art date
- Legal status (The legal status is an assumption and is not a legal conclusion. Google has not performed a legal analysis and makes no representation as to the accuracy of the status listed.)
- Ceased
Links
Images



Classifications
-
- A—HUMAN NECESSITIES
- A61—MEDICAL OR VETERINARY SCIENCE; HYGIENE
- A61B—DIAGNOSIS; SURGERY; IDENTIFICATION
- A61B5/00—Measuring for diagnostic purposes; Identification of persons
- A61B5/72—Signal processing specially adapted for physiological signals or for diagnostic purposes
- A61B5/7203—Signal processing specially adapted for physiological signals or for diagnostic purposes for noise prevention, reduction or removal
-
- A—HUMAN NECESSITIES
- A61—MEDICAL OR VETERINARY SCIENCE; HYGIENE
- A61B—DIAGNOSIS; SURGERY; IDENTIFICATION
- A61B5/00—Measuring for diagnostic purposes; Identification of persons
- A61B5/02—Detecting, measuring or recording for evaluating the cardiovascular system, e.g. pulse, heart rate, blood pressure or blood flow
- A61B5/026—Measuring blood flow
- A61B5/0261—Measuring blood flow using optical means, e.g. infrared light
-
- A—HUMAN NECESSITIES
- A61—MEDICAL OR VETERINARY SCIENCE; HYGIENE
- A61B—DIAGNOSIS; SURGERY; IDENTIFICATION
- A61B5/00—Measuring for diagnostic purposes; Identification of persons
- A61B5/145—Measuring characteristics of blood in vivo, e.g. gas concentration or pH-value ; Measuring characteristics of body fluids or tissues, e.g. interstitial fluid or cerebral tissue
- A61B5/14546—Measuring characteristics of blood in vivo, e.g. gas concentration or pH-value ; Measuring characteristics of body fluids or tissues, e.g. interstitial fluid or cerebral tissue for measuring analytes not otherwise provided for, e.g. ions, cytochromes
-
- A—HUMAN NECESSITIES
- A61—MEDICAL OR VETERINARY SCIENCE; HYGIENE
- A61B—DIAGNOSIS; SURGERY; IDENTIFICATION
- A61B5/00—Measuring for diagnostic purposes; Identification of persons
- A61B5/145—Measuring characteristics of blood in vivo, e.g. gas concentration or pH-value ; Measuring characteristics of body fluids or tissues, e.g. interstitial fluid or cerebral tissue
- A61B5/1455—Measuring characteristics of blood in vivo, e.g. gas concentration or pH-value ; Measuring characteristics of body fluids or tissues, e.g. interstitial fluid or cerebral tissue using optical sensors, e.g. spectral photometrical oximeters
- A61B5/14551—Measuring characteristics of blood in vivo, e.g. gas concentration or pH-value ; Measuring characteristics of body fluids or tissues, e.g. interstitial fluid or cerebral tissue using optical sensors, e.g. spectral photometrical oximeters for measuring blood gases
- A61B5/14552—Details of sensors specially adapted therefor
-
- A—HUMAN NECESSITIES
- A61—MEDICAL OR VETERINARY SCIENCE; HYGIENE
- A61B—DIAGNOSIS; SURGERY; IDENTIFICATION
- A61B5/00—Measuring for diagnostic purposes; Identification of persons
- A61B5/145—Measuring characteristics of blood in vivo, e.g. gas concentration or pH-value ; Measuring characteristics of body fluids or tissues, e.g. interstitial fluid or cerebral tissue
- A61B5/1455—Measuring characteristics of blood in vivo, e.g. gas concentration or pH-value ; Measuring characteristics of body fluids or tissues, e.g. interstitial fluid or cerebral tissue using optical sensors, e.g. spectral photometrical oximeters
- A61B5/14551—Measuring characteristics of blood in vivo, e.g. gas concentration or pH-value ; Measuring characteristics of body fluids or tissues, e.g. interstitial fluid or cerebral tissue using optical sensors, e.g. spectral photometrical oximeters for measuring blood gases
- A61B5/14553—Measuring characteristics of blood in vivo, e.g. gas concentration or pH-value ; Measuring characteristics of body fluids or tissues, e.g. interstitial fluid or cerebral tissue using optical sensors, e.g. spectral photometrical oximeters for measuring blood gases specially adapted for cerebral tissue
-
- A—HUMAN NECESSITIES
- A61—MEDICAL OR VETERINARY SCIENCE; HYGIENE
- A61B—DIAGNOSIS; SURGERY; IDENTIFICATION
- A61B5/00—Measuring for diagnostic purposes; Identification of persons
- A61B5/74—Details of notification to user or communication with user or patient; User input means
- A61B5/742—Details of notification to user or communication with user or patient; User input means using visual displays
-
- A—HUMAN NECESSITIES
- A61—MEDICAL OR VETERINARY SCIENCE; HYGIENE
- A61B—DIAGNOSIS; SURGERY; IDENTIFICATION
- A61B2562/00—Details of sensors; Constructional details of sensor housings or probes; Accessories for sensors
- A61B2562/02—Details of sensors specially adapted for in-vivo measurements
- A61B2562/0233—Special features of optical sensors or probes classified in A61B5/00
- A61B2562/0238—Optical sensor arrangements for performing transmission measurements on body tissue
-
- A—HUMAN NECESSITIES
- A61—MEDICAL OR VETERINARY SCIENCE; HYGIENE
- A61B—DIAGNOSIS; SURGERY; IDENTIFICATION
- A61B2562/00—Details of sensors; Constructional details of sensor housings or probes; Accessories for sensors
- A61B2562/02—Details of sensors specially adapted for in-vivo measurements
- A61B2562/0233—Special features of optical sensors or probes classified in A61B5/00
- A61B2562/0242—Special features of optical sensors or probes classified in A61B5/00 for varying or adjusting the optical path length in the tissue
Definitions
- the present invention relates to a biological light measurement technique using visible light or near infrared light, and more particularly to a technique for separating and removing the influence of surface layer components such as skin blood flow components mixed with signal components.
- a deep blood flow component (brain blood flow signal) mainly including a brain-derived signal and a shallow blood flow mainly including a skin-derived signal. Separation from components (skin blood flow signal) is effective.
- ICA Independent Component Analysis
- shallow blood flow components are removed using data measured at a plurality of light receiving positions.
- data processing by the ICA method is performed using multiple data (short SD distance measurement data and long SD distance measurement data) measured at different distances between the irradiation point and the light receiving point (Source Detector distance: SD distance),
- Source Detector distance SD distance
- There is also a technique for removing a shallow blood flow component see, for example, Patent Document 1).
- the delay time used in the TDD-ICA method varies depending on the length of the task and the subject, and the timing of changes in blood flow components differs. Therefore, the optimum delay time differs for each subject and task.
- the present invention has been made in view of the above circumstances, and it is possible to separate the skin blood flow signal and the cerebral blood flow signal without increasing the burden on the user in separating the signal components of the deep layer region and the surface layer region in biological light measurement.
- the purpose is to provide technology that can grasp the situation.
- the present invention provides a plurality of candidate delays to at least one of a plurality of principal components obtained by applying principal component analysis to data measured with a short SD distance and data measured with a long SD distance. Give time. Then, for each candidate delay time given, after separating the skin blood flow signal and the cerebral blood flow signal, the ICA method is used using a plurality of data measured at different SD distances (short SD distance measurement data and long SD distance measurement data). Data processing is performed to separate the skin blood flow signal and the cerebral blood flow signal. Further, the degree of separation indicating the degree of separation of the skin blood flow signal is calculated, and the optimum delay time is determined according to the degree of separation. Also, when displaying the result of separation using the determined delay time, the cerebral blood flow signal before separation, the waveform in which the skin blood flow signal is mixed, the waveform by the cerebral blood flow signal after separation, and the skin blood flow Compare and display the waveforms of signals.
- the user can simply compare and display the cerebral blood flow signal before separation, the waveform in which the skin blood flow signal is mixed, the waveform based on the cerebral blood flow signal after separation, and the waveform based on the skin blood flow signal. Since it is possible to confirm whether the waveform due to the cerebral blood flow signal after separation and the waveform due to the skin blood flow signal are separated, it is difficult for the user to separate the signal components of the deep layer portion and the surface layer portion in the biological light measurement. The separation of the skin blood flow signal and the cerebral blood flow signal can be grasped without increasing.
- the biological light measuring device irradiates near-infrared light in the living body, detects light reflected from the surface of the living body or passed through the living body (hereinafter simply referred to as passing light), and an electrical signal corresponding to the intensity of the light Is a device that generates
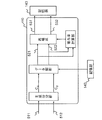
- the biological light measurement apparatus 100 includes a light source unit 110 that irradiates near infrared light, a light receiving unit 120 that measures passing light and converts it into an electrical signal, and the light source unit 110 and the light receiving unit 120. And a control unit 140 that processes data output from the light receiving unit.
- the light source unit 110 irradiates a predetermined irradiation point on the subject 190 with light.
- the light source unit 110 includes a semiconductor laser 111 that emits light of a predetermined wavelength, and a plurality of optical modules 112 each including a modulator that modulates light emitted from the semiconductor laser 111 at a plurality of different frequencies. For example, as many optical modules 112 as the number of irradiation points are provided. Output light from each optical module 112 is irradiated onto a predetermined measurement region of the subject 190 via the optical fiber 130 (irradiation light optical fiber 131).
- the irradiation is performed through each probe of the probe holder 150 attached to the subject 190, and light is irradiated to a predetermined region of the subject 190 from a plurality of predetermined irradiation points.
- the optical fiber 130 is fixed to the probe holder 150.
- the probe holder 150 is fixed to, for example, the head of the subject 190.
- the wavelength of light output from the light source unit 110 depends on the spectral characteristics of the target substance in the living body. For example, when measuring oxygen saturation and blood volume from the concentrations of hemoglobin (Hb) and oxygenated hemoglobin (HbO 2 ), one or more wavelengths are selected from light in the wavelength range of 600 nm to 1400 nm.
- Hb hemoglobin
- HbO 2 oxygenated hemoglobin
- the light source unit 110 has two wavelengths corresponding to the two types of measurement targets, For example, it is configured to generate light at 780 nm and 830 nm. These two types of wavelengths of light are combined at the irradiation point and irradiated from one light irradiation position of the probe holder 150.
- the light receiving unit 120 receives the passing light guided from the plurality of measurement points in the measurement region via the optical fiber 130 (light receiving optical fiber 132), and outputs the received light to the control unit 140 as digital data.
- the light irradiated to the irradiation point and propagated through the subject 190 is received at a plurality of predetermined light receiving points on the subject 190 and output as measurement data.
- Light reception is performed at a light receiving point corresponding to each irradiation point on the probe holder 150.
- the measurement data is separated into cerebral blood flow (deep component) and skin blood flow (shallow component) using the TDD-ICA method as described later.
- TDD-ICA method light emitted from one irradiation point is received by at least two light receiving points having different distances from the irradiation point (SD distance: Source) Detector distance).
- SD distance Source
- Detector distance the case where light is received at two light receiving points with different SD distances will be described.
- any configuration may be used as long as there are a plurality of light receiving points / irradiation points and a plurality of measurement data with different SD distances are obtained.
- a light receiving point having a longer distance from the irradiation point is referred to as a long light receiving point
- a light receiving point having a shorter distance from the irradiation point than the long light receiving point is referred to as a short light receiving point.
- measurement data obtained from a signal received at a short light receiving point is referred to as short measurement data
- measurement data obtained from a signal received at a long light receiving point is referred to as long measurement data.
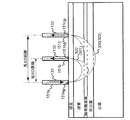
- FIG. 2 is a diagram for explaining an arrangement example.
- the irradiation point 151ap, the short light receiving point 151bp, and the long light receiving point 151cp are arranged.
- the probes 151 are arranged in a lattice pattern.
- ⁇ is a probe 151a connected to the optical fiber 131 for irradiation light connected to the light source unit 110, and is the irradiation point 151ap.
- ⁇ and ⁇ are probes 151b and 151c connected to the light receiving optical fiber 132 connected to the light receiving unit 120, which are the short light receiving point 151bp and the long light receiving point 151cp, respectively.
- a point on the probe holder 150 between the irradiation point 151ap and each of the short light receiving point 151bp and the long light receiving point 151cp is called a measurement point.
- light is received by two light receiving points (short light receiving point 151bp and long light receiving point 151cp), and a deep component and a shallow component are obtained from the results, respectively.
- a set of the irradiation point 151ap, the short light receiving point 151bp, and the long light receiving point 151cp, which obtains one set of deep component and shallow component, is called a measurement channel.
- the light receiving unit 120 includes a light receiving unit 120 for a long light receiving point and a light receiving unit 120 for a short light receiving point, for each measurement channel, as shown in FIG.
- each light receiving unit 120 of the present embodiment converts the received light into an electric quantity corresponding to the amount of light in order to obtain each measurement data from signals received at each short light receiving point 151bp and long light receiving point 151cp.
- a photoelectric conversion element 121 such as a photodiode
- a lock-in amplifier 122 that receives an electric signal from the photoelectric conversion element 121 and selectively detects a modulation signal corresponding to the light irradiation position, and outputs an output signal of the lock-in amplifier 122 digitally
- an A / D converter 123 for converting the signal.
- the photoelectric conversion elements 121 are provided in the number of long light receiving points and the number of short light receiving points, respectively.
- the lock-in amplifier 122 selectively detects a modulation signal corresponding to the two wavelengths for each irradiation point 151ap of the probe holder 150.
- the detected modulation signal indicates a change in the amount of hemoglobin. For this reason, this modulation signal is called a hemoglobin amount change signal. That is, the short measurement data and the long measurement data that are output are each a hemoglobin amount change signal.
- the “hemoglobin amount” includes “oxygenated hemoglobin amount” and “deoxygenated hemoglobin amount”.
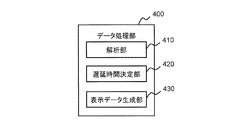
- control unit 140 includes a data processing unit 400 that processes the short measurement data and the long measurement data output from the light receiving unit 120.
- the data processing unit 400 processes the short measurement data and the long measurement data received from the light receiving unit 120 to create display data.
- the display data to be created include, for example, oxygenated hemoglobin (oxyHb) concentration change, deoxygenated hemoglobin ( These are a graph showing changes in deoxyHb) concentration and total hemoglobin (TotalHb) concentration for each measurement channel, and an image in which these are plotted on a two-dimensional image of a subject 190.
- oxygenated hemoglobin oxygenated hemoglobin
- deoxygenated hemoglobin deoxygenated hemoglobin
- the data processing unit 400 assigns a predetermined delay time T to at least one of the long measurement data and the short measurement data, and then performs independent component analysis (ICA) to extract the separated components (TDD-ICA Processing), the extracted separation component is reconfigured to separate into a deep component and a shallow component.
- ICA independent component analysis
- the data processing unit 400 of the present embodiment includes an analysis unit 410 that performs TDD-ICA processing, and a delay time determination unit that determines an optimal delay time (optimum delay time) to be used at this time. 420, and a display data generation unit 430 that generates display data from the deep component and the shallow component obtained by giving the optimum delay time.
- the control unit 140 includes a processing result by the data processing unit 400, for example, a display unit 142 that displays the created image and data necessary for processing by the data processing unit 400. And a storage unit 143 for storing the processing results and an input unit 141 for inputting various commands necessary for the operation of the biological light measurement apparatus 100 are connected.
- Each function realized by the control unit 140 is realized by loading a program stored in advance in the storage unit 143 into a memory and executing it by a CPU included in the control unit 140. It may be realized by hardware such as PLD (Programmable Logic Device).
- the short light receiving point 151bp and the long light receiving point 151cp are arranged at an SD distance of 15 mm (short SD distance) and 30 mm (long SD distance), respectively.
- the light 300 irradiated from the light source unit 110 via the irradiation point 151ap is incident on the scalp and propagates in all directions in the tissue.
- the light 300 (301) received at the short light receiving point 151bp is transmitted through a shallower portion on average than the light 300 (302) received at the long light receiving point 151cp.
- the partial average optical path length in each layer of the head changes.
- the SD distance is approximately 10 mm or more and 40 mm or less
- the partial optical path length of the scalp has a small SD distance dependency, but gray matter has a substantially linear SD distance dependency.
- NIRS Near-Infrared Spectroscopy
- the NIRS signal intensity is the same as the blood flow change, the site where the blood flow change occurs Is proportional to the partial optical path length. For this reason, as the SD distance increases, the brain-derived component (brain blood flow) in the NIRS measurement signal increases, but the skin-derived component (skin blood flow) is expected not to change.
- the short measurement data does not include the brain in the light propagation path as much as the long measurement data. Therefore, the relationship between the short measurement data, the long measurement data, the cerebral blood flow, and the skin blood flow is expressed by the following equations (1) and (2).
- the ICA method skin blood flow and cerebral blood flow are extracted as independent components from two or more measurement data.
- the ICA method is a method that extracts multiple independent components from signals received at multiple measurement points and separates them into brain-derived components or skin-derived components. It is an analysis technique that can separate There are multiple signal sources, which is effective for analyzing multipoint measured data.
- the SD distances of the plurality of measurement data to be acquired may be equal distances, but if the measurement data includes both long SD data and short SD data, the contribution rate using the method disclosed in Patent Document 1 By performing the calculation, the separation can be performed with higher accuracy.
- the TDD-ICA process executed by the analysis unit 410 is a ICA method that separates the deep and shallow components, and uses multiple data measured at two different SD distances to give a delay time to at least one of the data. The accuracy is improved by processing.
- TDD-ICA processing in order to extract independent components, the principal components are repeatedly rotated so that the secondary correlations between the signals taking into account multiple time differences are all zero.
- To make all the secondary correlations 0 is to simultaneously diagonalize a plurality of covariance matrices corresponding to each time difference. A plurality of time differences are obtained by dividing a given delay time T into a predetermined number.
- FIG. 5 is a diagram for explaining the TDD-ICA process executed by the analysis unit 410 of the present embodiment.
- the analysis unit 410 performs principal component analysis (PCA: Principal Component Analysis) on the short measurement data 512 and the long measurement data 511 and separates them into principal components C 1 and C 2 .
- PCA Principal Component Analysis
- the analysis unit 410 performs a reconstruction process on the first separation component 521 and the second separation component 522 after data analysis, and the deep blood flow waveform (depth component) 531 and Separated into a shallow blood flow waveform (shallow component) 532.
- the depth contribution ratio is a value indicating the ratio of the separation components 521 and 522 contributing to the deep blood flow.
- the analysis unit 410 uses this depth contribution rate to calculate a deep blood flow waveform 531 and subtracts the deep blood flow waveform 531 from the measurement waveform (entire component) to calculate a shallow blood flow waveform 532.
- the analysis unit 410 performs the TDD-ICA process on the long measurement data 511 and the short measurement data 512 for each measurement channel.
- the delay time determination unit 420 determines the optimum delay time (optimum delay time) Tbest to be given to at least one of the obtained long measurement data and short measurement data as described above.
- the delay time determination unit 420 prepares a plurality of candidate delay times T in advance, and causes the analysis unit 410 to calculate the deep component 531 and the shallow component 532 when each delay time is given. Then, using the result, the degree of separation is calculated as an index indicating the degree of separation between the deep component 531 and the shallow component 532. Then, the optimum delay time Tbest is determined from the candidate delay times T.
- the candidate delay time T that maximizes the degree of separation is determined as the optimum delay time Tbest.
- the separation degree is an index for judging whether the processing result is good or bad.
- a wide area coefficient is used for the degree of separation.
- the regionality coefficient is defined as, for example, an average value of root mean square (RMS) of hemoglobin changes of all channels divided by a standard deviation.
- RMS root mean square
- the degree of separation is calculated as the difference between the wideness coefficient and the shallow component. This is because the skin blood flow shown by the shallow blood flow waveform moves in the same manner as a whole, and thus has a wide area, and the cerebral blood flow shown by the deep blood flow waveform is partially active. It uses the low nature.
- the degree of separation may be calculated from the deep component and shallow component of oxygenated hemoglobin (oxyHb), or may be calculated from the deep component and shallow component of deoxygenated hemoglobin (deoxyHb), or both It may be calculated from the deep component and the shallow component. You may comprise so that it can select from which it calculates.
- the measurement result of another biological signal for example, LDF (Laser Doppler Flowmeter) may be used to calculate from a correlation with a shallow component.
- the resolution may be calculated using the task synchronism of the deep signal or the shallow signal.
- time series data is divided for each trial, and the average of correlation coefficients in all combinations in which two trials are selected from trial times is calculated as the task synchronization. This is particularly effective for obtaining deep signals with high reproducibility.
- the degree of separation may be calculated using the correlation between oxygenated and deoxygenated hemoglobin changes (oxyHb, deoxyHb) in the deep signal or the shallow signal.
- the difference in correlation coefficient between oxygenated and deoxygenated hemoglobin changes (oxyHb, deoxyHb) in the deep signal and the shallow signal is calculated as the degree of separation. This is particularly effective for isolating systemic signals and the like that have been reported to show a positive correlation between oxygenated hemoglobin changes and deoxygenated hemoglobin changes.
- the degree of separation may be calculated from the correlation coefficient between the waveform estimated from the hemodynamic response function and the deep signal or shallow signal.
- the brain activity waveform is estimated by convolution of a hemodynamic response function and a rectangular wave of a period.
- the above degree of separation calculation method may be selectable by the user, or may be analyzed simultaneously by a plurality of calculation methods.
- the delay time determining unit 420 stores the calculated degree of separation in the storage unit 143 in association with the candidate delay time T.
- the calculation result may be presented to the user, that is, displayed on the display unit 142.
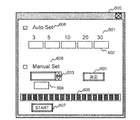
- An example of the display screen (separation degree display screen 600) in this case is shown in FIG.
- the separation degree display screen 600 includes a candidate delay time display area 601 and a separation degree display area 602 for displaying the separation degree of each candidate delay time T.
- a predetermined candidate delay time is 3, 5, 10, 20, or 30 seconds.
- the separation degree display area 602 only the separation degree regarding the oxygenated hemoglobin concentration change (oxyHb) may be displayed, and further, the deoxygenated hemoglobin concentration change (deoxyHb), the total hemoglobin concentration change (Total), The degree of separation may be displayed. Further, the display mode of the set of candidate delay time and separation degree indicating the best separation degree (maximum value) may be changed so as to be distinguishable from others.
- the display data generation unit 430 gives display data to be displayed on the display unit 142 from the deep component 531 and the shallow component 532 obtained by the analysis unit 410 by giving the optimum delay time Tbest determined by the delay time determination unit 420. Is generated.
- the display data is a comparison of the waveform of the cerebral blood flow signal before separation, the waveform of the mixed skin blood flow signal, the waveform of the cerebral blood flow signal after separation, and the waveform of the skin blood flow signal.
- the waveforms of the component, the deep component 531 and the shallow component 532 at least one waveform and the optimum delay time Tbest are included. Further, the ratio of the deep component 531 to the whole may be further included.
- the waveform of the component before separation is generated from the length measurement data 511.
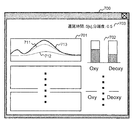
- the result display screen 700 includes a waveform display field 701 for displaying the waveform of each component, a ratio display field 702 for displaying the ratio of the deep component to the whole, and an information display for displaying the optimum delay time Tbest.
- the waveform display field 701 the waveform of the deep component (depth blood flow waveform 711) for each measurement channel, the waveform of the shallow component (shallow blood flow waveform 712), and the waveform before separation, A waveform (total blood volume 713) obtained from the length measurement data is displayed. That is, display data is generated for each of the deep component and the shallow component obtained from the short measurement data and the long measurement data received by the set of a plurality of irradiation points, short light reception points, and long light reception points, and the waveform display field 701 Is displayed.
- the waveform display field 701 may be arranged to display a map in accordance with the position of the long measurement data measurement point or the short measurement data measurement point.
- the ratio display column 702 the ratio of the deep component is displayed for each measurement channel for each of oxygenated hemoglobin (oxyHb) and deoxygenated hemoglobin (deoxyHb).
- the indication may be either oxygenated hemoglobin (oxyHb) or deoxygenated hemoglobin (deoxyHb). You may comprise so that the object to display can be selected.
- the candidate delay time adopted as the optimum delay time and its degree of separation are displayed.
- FIG. 8 is a processing flow of the delay time determination process of the present embodiment.
- the delay time determination unit 420 assigns a predetermined candidate delay time to at least one of a plurality of principal components obtained by applying principal component analysis to the short measurement data and the long measurement, and the analysis unit includes the deep component and The separation of the shallow component and the calculation of the degree of separation, which is an index indicating the degree of separation, are repeated while changing the candidate delay time, and the candidate delay time with the best index is set as the optimal candidate delay time.
- ⁇ This process starts after acquiring short measurement data and long measurement data for all measurement channels.
- M is an integer of 1 or more
- i is a counter for counting the candidate delay time
- the i-th candidate delay time is T [i].
- the number of measurement channels is N (N is an integer of 1 or more).
- j is a counter for counting the number of measurement channels.
- the delay time determination unit 420 causes the analysis unit 410 to perform TDD-ICA processing for each measurement channel j using T [i] as the candidate delay time.
- the analysis unit 410 performs TDD-ICA processing on the short measurement data SSD [j] and the long measurement data LSD [j] acquired in the measurement channel j (step S1003), and for the measurement channel j, the deep component DEP Obtain [i, j] and shallow component SHA [i, j].
- the deep component DEP [i, j] and the shallow component SHA [i, j] are obtained for the oxygenated hemoglobin amount, the deoxygenated hemoglobin amount, and the total hemoglobin amount, respectively.
- the analysis unit 410 stores the obtained deep component DEP [i, j] and shallow component SHA [i, j] in the storage unit 143 in association with the candidate delay time T [i] and the measurement channel j. (Step S1004).
- the delay time determination unit 420 repeats the processing of step S1003 and step S1004 for the data of all measurement channels (steps S1005 and S1006).
- Delay time determining section 420 uses the deep component and shallow component of all measurement channels of T [i] as the candidate delay time, and calculates the degree of separation SEP [i] based on the candidate delay time T [i] (step S1007). ). As the degree of separation, for example, the above-described regionality coefficient is calculated.
- the delay time determination unit stores the calculated degree of separation SEP [i] in the storage unit 143 in association with the candidate delay time T [i].
- the delay time determination unit 420 repeats the above processing for all candidate delay times (steps S1008 and S1009).
- the delay time determination unit 420 determines the optimum delay time Tbest based on the degree of separation of the obtained candidate delay times (step S1010).
- the candidate delay time with the maximum value of the degree of separation is selected as the optimum delay time.
- the display data generation unit 430 reads the deep component DEP [Tbest, j] and the shallow component SHA [Tbest, j] stored in the storage unit 143 in association with the optimum delay time Tbest, and displays a result display screen as display data 700 is generated and displayed on the display unit 142 (step S1011).
- the delay time determination unit 420 performs the separation process for each measurement channel, but is not limited thereto. You may comprise so that the separation process of all the measurement channels may be performed in parallel.
- the optimal delay time is determined as the optimal delay time among the predetermined candidate delay times, but the determination of the optimal delay time is not limited to this.
- the candidate delay time Tbest with the maximum degree of separation may be determined, and then the vicinity of the best candidate delay time Tbest may be searched, and the delay time with the best degree of separation may be set as the optimum delay time.
- a plurality of times within a predetermined range centering on the candidate delay time Tbest are set as new candidate delay times in the vicinity of the best candidate delay time Tbest. Then, the TDD-ICA analysis is performed on each candidate delay time as described above, and the degree of separation is calculated from the result.
- the TDD-ICA analysis is performed by the analysis unit 410, and the delay time determination unit 420 performs calculation of the degree of separation and determination of the optimum delay time.
- the best delay time can be set as the optimum delay time, not limited to the predetermined candidate delay time.
- the optimum delay time Tbest is determined using the degree of separation as an index for separating two different signals.
- the degree of mixing indicating the degree of mixing of two signals opposite to the separation may be used as the separation index. If the degree of mixing is defined as the reciprocal of the degree of separation, the delay time determination unit 420 selects the candidate delay time with the smallest value of the degree of mixing as the optimum delay time Tbest using the above-described wideness factor.
- the candidate delay time may not be determined in advance. For example, the time for each predetermined time interval ⁇ t from 0 (sec) may be set as the candidate delay time. In this case, it is assumed that the maximum candidate delay time does not exceed the total measurement time S (sec) for acquiring the short measurement data and the long measurement data of the present embodiment.
- an optimal delay time may be calculated in advance based on the total measurement time S and the stimulation period of the measured data and set as a candidate delay time. At this time, for example, the total measurement time S or half of the stimulation period may be set as the candidate delay time.
- the data giving the candidate delay time that is, the data to be analyzed in FIG. 5 is a plurality of principal components in the principal component analysis, but is not limited thereto.
- the original measurement data may be data obtained by a method using a signal separation method such as factor analysis, multiple regression analysis, or cluster analysis.
- the terms “cerebral blood flow component” and “skin blood flow component” used here are names for convenience, and independent components separated formally by the gradient of the weight value with respect to the SD distance in the above method, and separated. NIRS signal reconstructed from a plurality of independent components. Therefore, for example, the “cerebral blood flow component” may include a fluctuation component of blood in the blood vessel in the skull, in addition to the biological signal of the deep tissue including the brain. Further, the “skin blood flow component” may include a non-brain-derived component, that is, a systemic biological signal, apparatus noise, noise due to body movement, or the like in addition to a biological signal of a shallow tissue. .
- the delay time determination unit automatically determines the best delay time among the predetermined candidate delay times, but the present invention is not limited to this.
- the user may designate the optimum delay time by looking at the separation degree of each candidate delay time displayed on the separation degree display screen 600.
- the degree-of-separation display screen 600 includes a designation accepting button that accepts designation of the optimum delay time.
- the separation degree display screen 600 receives a candidate delay time input and displays a candidate delay time input area 603 and an input delay time separation that displays the separation degree based on the inputted candidate delay time.
- a degree display area 604 is further provided.
- the delay time determination unit 420 calculates the degree of separation for the newly input candidate delay time and displays it in the input delay time separation degree display area 604. Also at this time, the degree of separation is calculated using a result obtained by causing the analysis unit 410 to calculate the deep component and the shallow component using the short measurement data and the long measurement data for each channel.
- the delay time determination unit 420 may be configured to calculate and display the degree of separation every time the user inputs a new numerical value in the candidate delay time input area 603.
- a determination button 605 that accepts the user's intention to determine the optimum delay time may be provided.
- the delay time determination unit 420 sets the candidate delay time input in the candidate delay time input area 603 as the optimum delay time.
- the separation degree display screen 600 may include a reception field 606 for receiving an instruction to automatically determine the optimum delay time (Auto Set) or manual determination (Manual Set).
- automatic determination is a method in which the delay time determination unit 420 automatically determines the optimal delay time from predetermined candidate delay times, and manual determination (Manual Set) is input by the user. This is a method of determining from the candidate delay time.
- the separation degree display screen 600 may include a START button 607 that receives an instruction to start the delay time determination process, and a progress bar 608 that indicates the progress of the delay time determination process.
- the delay time is uniquely set.
- the optimum delay time varies depending on the length of measurement data acquisition time, the task, and the like, it is difficult to confirm whether the set delay time is the best, and it is difficult to find the optimum value.
- an optimum delay time is determined from a plurality of predetermined candidate delay times. Thereby, a user's setting burden can be reduced. Further, the degree of separation for each candidate delay time is calculated, and the optimum candidate delay time is automatically determined. Thereby, the setting burden by the user is further reduced. At this time, by setting the candidate delay time with the maximum degree of separation as the optimum delay time, the accuracy of separation is also improved. Furthermore, by searching for the vicinity of the candidate delay time that maximizes the degree of separation and setting the delay time with a higher degree of separation as the optimum delay time, the accuracy of separation is further increased. Moreover, according to this embodiment, since the separation degree of each candidate delay time is displayed, the user can easily grasp the separation degree for each delay time. Furthermore, since the user can set the candidate delay time and the degree of separation of the set candidate delay time is also presented to the user, the user can set the delay time for obtaining the desired degree of separation. The degree of freedom of delay time setting by the user is increased.
- the optimum delay time can be easily set, and the user's setting burden can be reduced.
- the optimum delay time can be determined without increasing the burden on the user, and the separation process is performed using the delay time, so that the separation accuracy is improved.
- the results are displayed so that the deep component, shallow component, and total component can be compared for each measurement channel.
- the user can easily grasp how much the deep component or the shallow component is included in the original waveform.
- the degree of separation which is an index indicating the degree of separation, is also displayed. Therefore, according to the present embodiment, the user can clearly indicate whether the analysis is good or bad for the delay time, the degree of separation, and the waveform after separation.
- a plurality of candidate delay times are given to one of the data with a short SD distance and the data with a long SD distance acquired in advance. Then, for each candidate delay time to be given, after separation by the TDD-ICA method, an analysis unit 410 that calculates the degree of separation indicating the degree of separation of the skin blood flow signal, and a delay that determines the optimum delay time according to the degree of separation.
- an analysis unit 410 that calculates the degree of separation indicating the degree of separation of the skin blood flow signal, and a delay that determines the optimum delay time according to the degree of separation
- the waveform before separation, the waveform based on the cerebral blood flow signal after separation, and the waveform based on the skin blood flow signal are compared and displayed on the display unit 142.
- a display data generation unit 430 that generates display data to be displayed.
- one or a plurality of light source units 110 that irradiate light to a predetermined irradiation point on the subject 190, and the light that has been irradiated to the irradiation point and propagated inside the subject 190, Light is received at a predetermined light receiving point on the object 190, and the distance between the irradiation point for measuring short measurement data and the light receiving point is the distance between the irradiation point and the light receiving point for measuring long measurement data.
- One set or a plurality of sets of light receiving units 120 that output at least the short measurement data and the length measurement data obtained from the received signal, and the short measurement data and the long measurement data.
- a data processing unit 400 that performs processing, and a display unit 142 that displays the short measurement data and the long measurement data processed by the data processing unit 400 and analysis data thereof, and the data processing unit 400 includes: Short Perform an independent component analysis including a process of assigning a delay time to at least one of a plurality of principal components obtained by calculation using at least one of constant data and the length measurement data, extract a separated component, and extract the separated component
- An analysis unit 410 that separates into a deep component and a shallow component by reconfiguration, a delay time determination unit 420 that determines a delay time from candidate delay times indicated in the process of assigning the delay time, and the delay time
- a display data generation unit 430 that generates display data to be displayed on the display unit from the deep component and the shallow component obtained by applying.
- the user can easily confirm the result and can grasp the numerical value.
- the method of presenting the condition / result to the user which has not been conventionally considered, is improved in the technique of separating the signal components of the deep layer portion and the surface layer portion by the biological light measurement. Therefore, the user can easily and accurately perform analysis in the biological light measurement.
- the light received at two light receiving points with different SD distances of the short light receiving point and the long light receiving point is used to separate the deep component and the shallow component.
- the score is not limited to two. It may be 3 or more.
- the short measurement data and the long measurement data may be measured with a probe arrangement having two or more irradiation points for one light receiving point, and each measurement data includes one irradiation point and one light receiving point. It may be measured in pairs.
- the data processing unit 400 is included in the control unit 140 of the biological light measurement apparatus 100, but is not limited thereto. It may be constructed on an information processing device that can transmit and receive data to and from the biological light measurement device 100 and is independent of the biological light measurement device 100.
- 100 biological light measuring device 110 light source unit, 111 semiconductor laser, 112 optical module, 120 light receiving unit, 121 photoelectric conversion element, 122 lock-in amplifier, 123 A / D converter, 130 optical fiber, 131 optical fiber for irradiation light, 132 optical fiber for light reception, 140 control unit, 141 input unit, 142 display unit, 143 storage unit, 150 probe holder, 151 probe, 151a irradiation point, 151b short light reception point, 151c long light reception point, 190 subject, 300 light, 301 light, 302 light, 400 data processing unit, 410 analysis unit, 420 delay time determination unit, 430 display data generation unit, 511 long measurement data, 512 short measurement data, 521 first separation component, 522 second separation component, 531 Deep component, 532 shallow component, 600 separability display screen, 601 candidate delay time display area, 602 separability display area, 603 candidate delay time input area, 604 input delay time separability display area, 605 decision button , 606 reception section, 607 ST
Landscapes
- Health & Medical Sciences (AREA)
- Life Sciences & Earth Sciences (AREA)
- Physics & Mathematics (AREA)
- Engineering & Computer Science (AREA)
- Molecular Biology (AREA)
- General Health & Medical Sciences (AREA)
- Biophysics (AREA)
- Pathology (AREA)
- Veterinary Medicine (AREA)
- Biomedical Technology (AREA)
- Heart & Thoracic Surgery (AREA)
- Medical Informatics (AREA)
- Public Health (AREA)
- Surgery (AREA)
- Animal Behavior & Ethology (AREA)
- Optics & Photonics (AREA)
- Spectroscopy & Molecular Physics (AREA)
- Physiology (AREA)
- Signal Processing (AREA)
- Neurology (AREA)
- Hematology (AREA)
- Cardiology (AREA)
- Artificial Intelligence (AREA)
- Computer Vision & Pattern Recognition (AREA)
- Psychiatry (AREA)
- Measurement Of The Respiration, Hearing Ability, Form, And Blood Characteristics Of Living Organisms (AREA)
- Investigating Or Analysing Materials By Optical Means (AREA)
Abstract
Description
このため、この変調信号をヘモグロビン量変化信号と呼ぶ。すなわち、出力される短測定データおよび長測定データは、それぞれ、ヘモグロビン量変化信号である。なお、この「ヘモグロビン量」は、「酸素化ヘモグロビン量」と「脱酸素化ヘモグロビン量」とを含む。
なお、PLD(Programmable Logic Device)等のハードウェアにより実現されてもよい。
また、送信する光に近赤外光(Near InfraRed)を用いる近赤外分光法(Near‐InfraRed Spectroscopy:NIRS)では、NIRS信号強度は血流変化が同じであれば、血流変化が生じる部位の部分光路長に比例する。このため、SD距離が大きくなると、NIRS計測信号における脳由来成分(脳血流)は大きくなるが、皮膚由来成分(皮膚血流)は変化しないことが予想される。
短測定データ=皮膚血流+脳血流(少)・・・(2)
よって、脳血流を、式(1)および式(2)から、長測定データから短測定データを減算することにより得る方法もある。
さらに、ユーザが候補遅延時間を設定することも可能であり、設定した候補遅延時間の分離度もユーザに提示されるため、ユーザは、所望の分離度を得る遅延時間を設定することができる。ユーザによる遅延時間設定の自由度が高まる。
Claims (15)
- 被検体上の予め定められた照射点に光を照射する1つまたは複数の光源部と、
前記照射点に照射され前記被検体内部を伝播した光を、前記被検体上の予め定めた受光点において受光し、短測定データを測定するための前記照射点と前記受光点との距離が長測定データを測定するための前記照射点と前記受光点との距離よりも短くなるよう配置され、受光した信号から得られる前記短測定データおよび前記長測定データの少なくとも一方を出力する1対または複数対の受光部と、
前記短測定データおよび長測定データに対し、処理を行うデータ処理部と、
前記データ処理部によって処理された前記短測定データおよび長測定データとそれらの解析データを表示する表示部と、を備え、
前記データ処理部は、
前記短測定データおよび前記長測定データの少なくとも一方を用いた演算により得た複数の主成分の少なくとも一つに遅延時間を付与する過程を含む独立成分解析を行い、分離成分を抽出し、当該分離成分を再構成することにより深部成分と浅部成分とに分離する解析部と、
前記遅延時間を付与する過程で示された候補遅延時間から遅延時間を決定する遅延時間決定部と、
前記遅延時間を付与することにより得た深部成分および浅部成分とから、前記表示部に表示する表示データを生成する表示データ生成部と、を備えたことを特徴とする生体光計測装置。 - 前記遅延時間決定部は、前記候補遅延時間の中で、前記深部成分と前記浅部成分との分離の度合いを示す分離度が最大となる前記候補遅延時間を、最適な遅延時間と決定すること
を特徴とする請求項1記載の生体光計測装置。 - 前記遅延時間決定部は、前記深部成分と前記浅部成分との分離の度合いを示す分離度が最大となる候補遅延時間の近傍の予め定めた時間範囲の予め定めた1以上の時間をさらに候補遅延時間とし、それぞれについて前記分離度を算出し、当該分離度が最大となる前記候補遅延時間を、最適な遅延時間と決定すること
を特徴とする請求項1記載の生体光計測装置。 - 前記遅延時間決定部は、ユーザから少なくとも1つの前記候補遅延時間の入力を受け付け、当該候補遅延時間の前記深部成分と前記浅部成分との分離の度合いを示す分離度を算出して前記表示部に表示すること
を特徴とする請求項1記載の生体光計測装置。 - 前記遅延時間決定部は、ユーザから前記候補遅延時間の指定を受け付け、当該指定された候補遅延時間を、前記遅延時間と決定すること
を特徴とする請求項1記載の生体光計測装置。 - 前記データ処理部は、前記遅延時間決定部が決定した前記遅延時間を付与することにより得た前記深部成分および前記浅部成分から、前記表示部に表示する表示データを生成する表示データ生成部をさらに備え、
前記表示データは、前記決定した遅延時間を付与することにより得た分離成分の波形、深部成分の波形、および浅部成分の波形の少なくとも1つと、当該遅延時間と、を含むこと
を特徴とする請求項1記載の生体光計測装置。 - 前記短測定データおよび前記長測定データは、酸素化ヘモグロビン濃度変化、脱酸素化ヘモグロビン濃度変化、および、総ヘモグロビン濃度変化の少なくとも一つであり、
前記解析部は、短測定データおよび前記長測定データとして得た各濃度変化それぞれの前記分離成分、前記深部成分および前記浅部成分を算出し、
前記表示データは、前記各濃度変化それぞれの、前記深部成分の割合を含むこと
を特徴とする請求項6記載の生体光計測装置。 - 前記データ処理部は、前記浅部成分の分布の指標と前記深部成分の分布の指標との差より、前記深部成分および前記浅部成分との分離の度合いを示す分離度を算出し、前記表示部に当該分離度を表示すること
を特徴とする請求項1記載の生体光計測装置。 - 前記分布の指標は、それぞれの成分の時系列データから算出される二乗平均平方根の、全計測点の平均を全計測点の標準偏差で割ったものであること
を特徴とする請求項8記載の生体光計測装置。 - 前記表示データ生成部は、前記短測定データおよび前記長測定データから得た前記深部成分および前記浅部成分毎に、前記表示データを生成し、表示すること
を特徴とする請求項6記載の生体光計測装置。 - 前記表示データ生成部は、決定した遅延時間を用いて分離した結果を表示する際、分離前の脳血流信号、皮膚血流信号が混合している波形、分離後の脳血流信号による波形、および皮膚血流信号による波形が比較表示されるよう前記表示データを生成すること
を特徴とする請求項1記載の生体光計測装置。 - 前記表示データ生成部が生成する表示データは、前記遅延時間を自動決定するか手動決定するかの指示を受け付ける受付欄を備えること
を特徴とする請求項1記載の生体光計測装置。 - 前記遅延時間決定部は、前記候補遅延時間の中で、前記深部成分と前記浅部成分との混合の度合いを示す混合度が最小となる前記候補遅延時間を、最適な遅延時間と決定すること
を特徴とする請求項1記載の生体光計測装置。 - 前記遅延時間決定部は、前記深部成分と前記浅部成分との混合の度合いを示す混合度が最小となる候補遅延時間の近傍の予め定めた時間範囲の予め定めた1以上の時間をさらに候補遅延時間とし、それぞれについて前記混合度を算出し、当該混合度が最小となる前記候補遅延時間を、最適な遅延時間と決定すること
を特徴とする請求項1記載の生体光計測装置。 - 1つまたは複数の光源部によって、被検体上の予め定められた照射点に光を照射するステップと、
前記照射点に照射され前記被検体内部を伝播した光を、短測定データを測定するための前記照射点と受光点との距離が長測定データを測定するための前記照射点と受光点との距離よりも短くなるよう前記受光点が前記被検体上に配置された1組または複数組の受光部によって、前記被検体上の予め定めた前記受光点において受光し、当該受光した信号から得られる前記短測定データおよび前記長測定データの少なくとも一方を出力するステップと、
データ処理部によって、前記短測定データおよび長測定データに対し、処理を行うデータ処理ステップと、
表示部に前記データ処理部によって処理された前記短測定データおよび長測定データとそれらの解析データを表示するステップと、を有し
前記データ処理ステップは、
解析部によって、前記短測定データおよび前記長測定データの少なくとも一方を用いた演算により得た複数の主成分の少なくとも一つに遅延時間を付与する過程を含む独立成分解析を行い、分離成分を抽出し、当該分離成分を再構成することにより深部成分と浅部成分とに分離するステップと、
遅延時間決定部によって、遅延時間を付与する過程で示された候補遅延時間から遅延時間を決定するステップと、
表示データ生成部によって、前記遅延時間を付与することにより得た深部成分および浅部成分とから、前記表示部に表示する表示データを生成するステップと、を含むことを特徴とする生体光計測装置の信号分離方法。
Priority Applications (3)
| Application Number | Priority Date | Filing Date | Title |
|---|---|---|---|
| US14/654,111 US20150351696A1 (en) | 2012-12-27 | 2013-12-12 | Biological optical measurement device and signal separation method for same |
| CN201380065544.XA CN104869913B (zh) | 2012-12-27 | 2013-12-12 | 生物光测量装置及其信号分离方法 |
| JP2014554308A JP6245763B2 (ja) | 2012-12-27 | 2013-12-12 | 生体光計測装置およびその信号分離方法 |
Applications Claiming Priority (2)
| Application Number | Priority Date | Filing Date | Title |
|---|---|---|---|
| JP2012284994 | 2012-12-27 | ||
| JP2012-284994 | 2012-12-27 |
Publications (1)
| Publication Number | Publication Date |
|---|---|
| WO2014103729A1 true WO2014103729A1 (ja) | 2014-07-03 |
Family
ID=51020818
Family Applications (1)
| Application Number | Title | Priority Date | Filing Date |
|---|---|---|---|
| PCT/JP2013/083284 Ceased WO2014103729A1 (ja) | 2012-12-27 | 2013-12-12 | 生体光計測装置およびその信号分離方法 |
Country Status (4)
| Country | Link |
|---|---|
| US (1) | US20150351696A1 (ja) |
| JP (1) | JP6245763B2 (ja) |
| CN (1) | CN104869913B (ja) |
| WO (1) | WO2014103729A1 (ja) |
Families Citing this family (1)
| Publication number | Priority date | Publication date | Assignee | Title |
|---|---|---|---|---|
| JP2963312B2 (ja) | 1993-07-28 | 1999-10-18 | 三菱電線工業株式会社 | ケーブル貫通部の防火構造 |
Citations (4)
| Publication number | Priority date | Publication date | Assignee | Title |
|---|---|---|---|---|
| JP2010240298A (ja) * | 2009-04-09 | 2010-10-28 | Hitachi Ltd | 生体光計測装置及び生体光計測方法 |
| WO2010150751A1 (ja) * | 2009-06-24 | 2010-12-29 | 株式会社日立製作所 | 生体計測装置 |
| WO2012005303A1 (ja) * | 2010-07-06 | 2012-01-12 | 株式会社日立メディコ | 生体光計測装置およびそれを用いた生体光計測方法 |
| JP2012125370A (ja) * | 2010-12-15 | 2012-07-05 | Hitachi Ltd | 生体計測装置 |
Family Cites Families (1)
| Publication number | Priority date | Publication date | Assignee | Title |
|---|---|---|---|---|
| CN100463049C (zh) * | 2003-09-02 | 2009-02-18 | 日本电信电话株式会社 | 信号分离方法以及信号分离装置 |
-
2013
- 2013-12-12 WO PCT/JP2013/083284 patent/WO2014103729A1/ja not_active Ceased
- 2013-12-12 JP JP2014554308A patent/JP6245763B2/ja active Active
- 2013-12-12 CN CN201380065544.XA patent/CN104869913B/zh active Active
- 2013-12-12 US US14/654,111 patent/US20150351696A1/en not_active Abandoned
Patent Citations (4)
| Publication number | Priority date | Publication date | Assignee | Title |
|---|---|---|---|---|
| JP2010240298A (ja) * | 2009-04-09 | 2010-10-28 | Hitachi Ltd | 生体光計測装置及び生体光計測方法 |
| WO2010150751A1 (ja) * | 2009-06-24 | 2010-12-29 | 株式会社日立製作所 | 生体計測装置 |
| WO2012005303A1 (ja) * | 2010-07-06 | 2012-01-12 | 株式会社日立メディコ | 生体光計測装置およびそれを用いた生体光計測方法 |
| JP2012125370A (ja) * | 2010-12-15 | 2012-07-05 | Hitachi Ltd | 生体計測装置 |
Also Published As
| Publication number | Publication date |
|---|---|
| US20150351696A1 (en) | 2015-12-10 |
| CN104869913A (zh) | 2015-08-26 |
| JPWO2014103729A1 (ja) | 2017-01-12 |
| JP6245763B2 (ja) | 2017-12-13 |
| CN104869913B (zh) | 2017-05-10 |
Similar Documents
| Publication | Publication Date | Title |
|---|---|---|
| JP4474145B2 (ja) | 光計測装置 | |
| US9198624B2 (en) | Biological photometric device and biological photometry method using same | |
| DK2162064T3 (en) | NON-INVASIVE MONITORING SYSTEM FOR A PERSON | |
| KR100762659B1 (ko) | 비관혈 혈액 성분치 측정 장치 및 방법 | |
| CN102908164B (zh) | 被检体信息获取设备和方法 | |
| EP1653218B1 (en) | Device and method for measuring scattering absorber | |
| EP2826417B1 (en) | Object information acquiring apparatus and method for controlling object information acquiring apparatus | |
| JP2014016235A (ja) | 光吸収係数分布推定装置、濃度測定装置及び光吸収係数分布推定装置の制御方法 | |
| US10408741B2 (en) | Optical phantom for producing a time-resolved diffuse reflectance spectrum | |
| JP2012237595A (ja) | 光トモグラフィ装置 | |
| US20200256733A1 (en) | Analyte detection apparatus and method of detecting an analyte | |
| JP6211628B2 (ja) | 生体光計測装置およびそれを用いた生体光計測方法 | |
| JPWO2018194056A1 (ja) | 血液の吸収スペクトルを算出する情報処理方法、情報処理装置およびプログラム | |
| JP6245763B2 (ja) | 生体光計測装置およびその信号分離方法 | |
| JP5652599B2 (ja) | 濃度定量装置、濃度定量方法及びプログラム | |
| Tuzson et al. | Human breath acetone analysis by mid-IR laser spectroscopy: development and application | |
| JP2018001013A (ja) | データ処理装置およびデータ処理方法 | |
| US20170340252A1 (en) | Device for optical measurement of living body, analysis device, and analysis method | |
| JP2005342359A (ja) | 脳機能測定装置、脳機能測定方法及び脳機能測定プログラム | |
| JP5909388B2 (ja) | 生体光計測装置 | |
| US10495516B2 (en) | Dedicated transformation spectroscopy | |
| Speh et al. | Standardized assessment of fNIRS data quality with NeuroDOT and OXI | |
| US8880136B2 (en) | Calibration method for calibrating an instrument for measuring biogenic substance, using near-infrared spectral spectroscopy | |
| JP2016144502A (ja) | 生体光計測装置 | |
| Zucchelli et al. | 2 Time domain functional NIRS imaging for human brain mapping☆ |
Legal Events
| Date | Code | Title | Description |
|---|---|---|---|
| 121 | Ep: the epo has been informed by wipo that ep was designated in this application |
Ref document number: 13867818 Country of ref document: EP Kind code of ref document: A1 |
|
| ENP | Entry into the national phase |
Ref document number: 2014554308 Country of ref document: JP Kind code of ref document: A |
|
| WWE | Wipo information: entry into national phase |
Ref document number: 14654111 Country of ref document: US |
|
| NENP | Non-entry into the national phase |
Ref country code: DE |
|
| 122 | Ep: pct application non-entry in european phase |
Ref document number: 13867818 Country of ref document: EP Kind code of ref document: A1 |