WO2014076808A1 - 磁気共鳴イメージング装置および定量的磁化率マッピング法 - Google Patents
磁気共鳴イメージング装置および定量的磁化率マッピング法 Download PDFInfo
- Publication number
- WO2014076808A1 WO2014076808A1 PCT/JP2012/079728 JP2012079728W WO2014076808A1 WO 2014076808 A1 WO2014076808 A1 WO 2014076808A1 JP 2012079728 W JP2012079728 W JP 2012079728W WO 2014076808 A1 WO2014076808 A1 WO 2014076808A1
- Authority
- WO
- WIPO (PCT)
- Prior art keywords
- image
- susceptibility
- magnetic susceptibility
- frequency region
- magnetic
- Prior art date
- Legal status (The legal status is an assumption and is not a legal conclusion. Google has not performed a legal analysis and makes no representation as to the accuracy of the status listed.)
- Ceased
Links
Images



Classifications
-
- G—PHYSICS
- G01—MEASURING; TESTING
- G01R—MEASURING ELECTRIC VARIABLES; MEASURING MAGNETIC VARIABLES
- G01R33/00—Arrangements or instruments for measuring magnetic variables
- G01R33/20—Arrangements or instruments for measuring magnetic variables involving magnetic resonance
- G01R33/44—Arrangements or instruments for measuring magnetic variables involving magnetic resonance using nuclear magnetic resonance [NMR]
- G01R33/48—NMR imaging systems
- G01R33/54—Signal processing systems, e.g. using pulse sequences ; Generation or control of pulse sequences; Operator console
- G01R33/56—Image enhancement or correction, e.g. subtraction or averaging techniques, e.g. improvement of signal-to-noise ratio and resolution
- G01R33/565—Correction of image distortions, e.g. due to magnetic field inhomogeneities
- G01R33/56536—Correction of image distortions, e.g. due to magnetic field inhomogeneities due to magnetic susceptibility variations
-
- A—HUMAN NECESSITIES
- A61—MEDICAL OR VETERINARY SCIENCE; HYGIENE
- A61B—DIAGNOSIS; SURGERY; IDENTIFICATION
- A61B5/00—Measuring for diagnostic purposes; Identification of persons
- A61B5/05—Detecting, measuring or recording for diagnosis by means of electric currents or magnetic fields; Measuring using microwaves or radio waves
- A61B5/055—Detecting, measuring or recording for diagnosis by means of electric currents or magnetic fields; Measuring using microwaves or radio waves involving electronic [EMR] or nuclear [NMR] magnetic resonance, e.g. magnetic resonance imaging
-
- G—PHYSICS
- G01—MEASURING; TESTING
- G01R—MEASURING ELECTRIC VARIABLES; MEASURING MAGNETIC VARIABLES
- G01R33/00—Arrangements or instruments for measuring magnetic variables
- G01R33/20—Arrangements or instruments for measuring magnetic variables involving magnetic resonance
- G01R33/44—Arrangements or instruments for measuring magnetic variables involving magnetic resonance using nuclear magnetic resonance [NMR]
- G01R33/48—NMR imaging systems
- G01R33/4818—MR characterised by data acquisition along a specific k-space trajectory or by the temporal order of k-space coverage, e.g. centric or segmented coverage of k-space
-
- G—PHYSICS
- G01—MEASURING; TESTING
- G01R—MEASURING ELECTRIC VARIABLES; MEASURING MAGNETIC VARIABLES
- G01R33/00—Arrangements or instruments for measuring magnetic variables
- G01R33/20—Arrangements or instruments for measuring magnetic variables involving magnetic resonance
- G01R33/44—Arrangements or instruments for measuring magnetic variables involving magnetic resonance using nuclear magnetic resonance [NMR]
- G01R33/48—NMR imaging systems
- G01R33/4828—Resolving the MR signals of different chemical species, e.g. water-fat imaging
-
- G—PHYSICS
- G01—MEASURING; TESTING
- G01R—MEASURING ELECTRIC VARIABLES; MEASURING MAGNETIC VARIABLES
- G01R33/00—Arrangements or instruments for measuring magnetic variables
- G01R33/20—Arrangements or instruments for measuring magnetic variables involving magnetic resonance
- G01R33/44—Arrangements or instruments for measuring magnetic variables involving magnetic resonance using nuclear magnetic resonance [NMR]
- G01R33/48—NMR imaging systems
- G01R33/50—NMR imaging systems based on the determination of relaxation times, e.g. T1 measurement by IR sequences; T2 measurement by multiple-echo sequences
-
- G—PHYSICS
- G01—MEASURING; TESTING
- G01R—MEASURING ELECTRIC VARIABLES; MEASURING MAGNETIC VARIABLES
- G01R33/00—Arrangements or instruments for measuring magnetic variables
- G01R33/20—Arrangements or instruments for measuring magnetic variables involving magnetic resonance
- G01R33/44—Arrangements or instruments for measuring magnetic variables involving magnetic resonance using nuclear magnetic resonance [NMR]
- G01R33/48—NMR imaging systems
- G01R33/54—Signal processing systems, e.g. using pulse sequences ; Generation or control of pulse sequences; Operator console
- G01R33/56—Image enhancement or correction, e.g. subtraction or averaging techniques, e.g. improvement of signal-to-noise ratio and resolution
- G01R33/5608—Data processing and visualization specially adapted for MR, e.g. for feature analysis and pattern recognition on the basis of measured MR data, segmentation of measured MR data, edge contour detection on the basis of measured MR data, for enhancing measured MR data in terms of signal-to-noise ratio by means of noise filtering or apodization, for enhancing measured MR data in terms of resolution by means for deblurring, windowing, zero filling, or generation of gray-scaled images, colour-coded images or images displaying vectors instead of pixels
-
- A—HUMAN NECESSITIES
- A61—MEDICAL OR VETERINARY SCIENCE; HYGIENE
- A61B—DIAGNOSIS; SURGERY; IDENTIFICATION
- A61B2576/00—Medical imaging apparatus involving image processing or analysis
-
- G—PHYSICS
- G01—MEASURING; TESTING
- G01R—MEASURING ELECTRIC VARIABLES; MEASURING MAGNETIC VARIABLES
- G01R33/00—Arrangements or instruments for measuring magnetic variables
- G01R33/20—Arrangements or instruments for measuring magnetic variables involving magnetic resonance
- G01R33/44—Arrangements or instruments for measuring magnetic variables involving magnetic resonance using nuclear magnetic resonance [NMR]
- G01R33/48—NMR imaging systems
- G01R33/54—Signal processing systems, e.g. using pulse sequences ; Generation or control of pulse sequences; Operator console
- G01R33/56—Image enhancement or correction, e.g. subtraction or averaging techniques, e.g. improvement of signal-to-noise ratio and resolution
- G01R33/561—Image enhancement or correction, e.g. subtraction or averaging techniques, e.g. improvement of signal-to-noise ratio and resolution by reduction of the scanning time, i.e. fast acquiring systems, e.g. using echo-planar pulse sequences
- G01R33/5613—Generating steady state signals, e.g. low flip angle sequences [FLASH]
Definitions
- the present invention relates to a magnetic resonance imaging (MRI) technique.
- the present invention relates to an image processing technique for a reconstructed image.
- MRI magnetic resonance imaging
- a magnetic resonance imaging apparatus (hereinafter also referred to as an MRI apparatus) applies a high-frequency magnetic field and a gradient magnetic field to a subject placed in a static magnetic field, and measures and images a signal generated from the subject by nuclear magnetic resonance.
- This is a medical image diagnostic apparatus.
- a slice gradient magnetic field that specifies an imaging cross section is applied, and at the same time, an excitation pulse (a high frequency magnetic field pulse) that excites magnetization in the plane is applied, and nuclei that are generated when the excited magnetization converges thereby.
- a magnetic resonance signal (echo) is obtained.
- a slice gradient magnetic field and a phase encode gradient magnetic field and a readout gradient magnetic field in a direction perpendicular to each other in the imaging section are applied between excitation and echo acquisition.
- the measured echoes are arranged in k space with kx, ky, and kz as axes, and image reconstruction is performed by inverse Fourier transform.
- Each pixel value of the reconstructed image is a complex number composed of an absolute value and a declination (phase).
- a grayscale image (absolute value image) having an absolute value as a pixel value is an image reflecting the density of protons (hydrogen nuclei) and relaxation times (T1, T2), and is excellent in rendering a tissue structure.
- a grayscale image (phase image) having a pixel value as a phase is an image reflecting a change in magnetic field due to non-uniform static magnetic field or a difference in magnetic susceptibility between living tissues.
- QSM quantitative susceptibility mapping
- the amount of iron deposited in multiple tissues in the brain increases as the disease progresses, resulting in an increase in magnetic susceptibility. It is known to do. Therefore, if the magnetic susceptibility of these tissues can be measured, it is expected that objective information regarding the degree of progression of the Alzheimer's disease state can be obtained.
- the magnetic susceptibility of the tissue is defined by an average magnetic susceptibility value in an ROI (Region of Interest) set in an arbitrary size in the target tissue.
- ⁇ (r) is the phase (rad) at the position r
- ⁇ is the magnetorotational ratio of protons
- B 0 is the static magnetic field strength (T)
- ⁇ TE is TE (Echo Time: Echo Time).
- ⁇ (r ′) is the magnetic susceptibility (ppm) at the position r ′
- ⁇ is the angle formed by the static magnetic field direction and the vector r′-r.
- the QSM method estimates an approximate magnetic susceptibility distribution and images it.
- an image obtained by approximately estimating and imaging the magnetic susceptibility distribution based on the equation (1) is referred to as a magnetic susceptibility image.
- the magnetic susceptibility image varies depending on the calculation method and the parameters used for the calculation.
- k is a position vector in the k space
- k z is a z component of the vector k
- ⁇ is a phase distribution in the k space
- X is a magnetic susceptibility distribution in the k space.
- a region near the magic angle in the k space is referred to as a magic angle region.
- the magic angle region is defined as a region satisfying
- the contour image is an image in which the pixel value in the tissue contour region has a larger value than the pixel value in other regions. If a contour image representing the tissue contour region on the magnetic susceptibility distribution can be calculated in advance, it can be used to smooth the magnetic susceptibility value corresponding to the magic angle region, thereby reducing background noise and The estimation accuracy can be improved.
- the background noise is defined by a standard deviation in the ROI set in an arbitrary region such as a brain parenchyma on a magnetic susceptibility image, for example.
- MEDI Magnetic vapor deposition
- HEIDI Homogenity Enablement Dipole Inversion
- the MEDI method creates a contour image from an absolute value image on the assumption that the contour of the tissue appearing in the absolute value image and the tissue appearing in the magnetic susceptibility distribution are similar, and smoothes the area other than the contour to susceptibility. This is a method for calculating an image. By the MEDI method, a magnetic susceptibility image with little background noise can be obtained.
- the HEIDI method creates a tissue contour image from a phase image on the assumption that the tissue contour shown in the phase image is similar to the tissue contour shown in the magnetic susceptibility distribution, and the phase image is subjected to Laplace filter processing there.
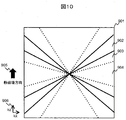
- the contour information obtained from the absolute value image is added, and the region other than the contour is smoothed to calculate the magnetic susceptibility image. As shown in FIG. 10, the smoothing is performed only on the magnetic susceptibility values corresponding to the magic angle region 902 in the k space of the magnetic susceptibility image and the surrounding region 903.
- the contour image of the tissue extracted from the phase image also changes depending on the direction of the magnetic field, and the estimation accuracy of the magnetic susceptibility of the tissue decreases. Further, since it is necessary to calculate the contour image from the three images, the parameters necessary for calculating the contour image increase, and the processing becomes complicated.
- the magnetic susceptibility value corresponding to the region 903 around the magic angle is smoothed, information on the magnetic susceptibility of the tissue exists in the low frequency region. Therefore, as in the MEDI method, the magnetic susceptibility value of the tissue is obtained by the smoothing effect. There exists a subject that it falls and estimation accuracy falls.
- the present invention has been made in view of the above circumstances.
- By calculating a correct contour image representing a tissue on the magnetic susceptibility distribution the accuracy of estimating the magnetic susceptibility of the tissue is improved, and the magnetic susceptibility value of the tissue is decreased.
- An object of the present invention is to provide a technique for reducing background noise.
- a static magnetic field applying unit that applies a static magnetic field to the subject
- a gradient magnetic field applying unit that applies a gradient magnetic field to the subject
- a high-frequency magnetic field pulse irradiating unit that irradiates the subject with a high-frequency magnetic field pulse
- a magnetic resonance imaging apparatus comprising: reception means for receiving a nuclear magnetic resonance signal; and calculation means for controlling the gradient magnetic field and the high-frequency magnetic field pulse and calculating the received nuclear magnetic resonance signal, The calculation unit applies the high-frequency magnetic field pulse and the gradient magnetic field to the subject placed in the static magnetic field, and detects the nuclear magnetic resonance signal generated from the subject as a complex signal
- An image reconstructing unit for reconstructing a complex image in which the value of each pixel is a complex number from the complex signal, an image converting unit for converting the complex image into a magnetic susceptibility image, and displaying the generated image on a display device
- a display processing unit to The image conversion unit includes a complex image conversion unit that generates an absolute value image
- the magnetic susceptibility of the tissue can be calculated with high accuracy.
- FIG. 1A is an external view of a vertical magnetic field type magnetic resonance imaging apparatus
- FIG. 1B is an external view of a horizontal magnetic field type magnetic resonance imaging apparatus
- FIG. 2C is an external view of the magnetic resonance imaging apparatus with a sense of openness.
- It is a block diagram which shows schematic structure of the MRI apparatus in this embodiment. It is a functional block diagram of the computer in this embodiment. It is a flowchart of the imaging process in this embodiment. It is a pulse sequence diagram of an RSSG (RF-soiled-Steady-state Acquisition with Rebound Gradient-Echo) sequence. It is a flowchart of the image conversion process in this embodiment. It is a flowchart of the phase image process in this embodiment.
- RSSG RF-soiled-Steady-state Acquisition with Rebound Gradient-Echo
- FIG. 1 is an external view of the MRI apparatus of this embodiment.
- FIG. 1 (a) shows a hamburger type (open type) vertical magnetic field type MRI apparatus (vertical magnetic field MRI apparatus) 100 in which magnets are separated into upper and lower parts in order to enhance the feeling of opening.
- FIG. 1 shows a hamburger type (open type) vertical magnetic field type MRI apparatus (vertical magnetic field MRI apparatus) 100 in which magnets are separated into upper and lower parts in order to enhance the feeling of opening.
- FIG. 1B shows a horizontal magnetic field type MRI apparatus (horizontal magnetic field MRI apparatus) 101 using a tunnel magnet that generates a static magnetic field with a solenoid coil.
- FIG. 1C shows an MRI apparatus 102 that uses the same tunnel-type magnet as in FIG. 1B and has a feeling of openness by shortening the depth of the magnet and tilting it obliquely.
- the form of each MRI apparatus is an example of a vertical magnetic field system and a horizontal magnetic field system, respectively, It is not limited to these.
- the present embodiment will be described by taking as an example the case of using the horizontal magnetic field MRI apparatus 101 shown in FIG.
- the direction of the static magnetic field of the MRI apparatus 101 is the z direction
- the two directions perpendicular to the z direction are the direction parallel to the bed surface on which the measurement symmetrical object is placed and the other direction is the x direction.
- a coordinate system with the y direction is used.
- the static magnetic field is also simply referred to as a magnetic field.
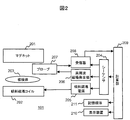
- FIG. 2 is a block diagram showing a schematic configuration of the MRI apparatus 101 of the present embodiment.
- the MRI apparatus 101 includes a magnet 201 that generates a static magnetic field in a direction parallel to a subject, a gradient magnetic field coil 202 that generates a gradient magnetic field, a sequencer 204, a gradient magnetic field power source 205, a high-frequency magnetic field generator 206, and a high-frequency magnetic field generator 206.
- a probe 207 that irradiates a magnetic field and detects a nuclear magnetic resonance signal (echo), a receiver 208, a computer 209, a display device 210, and a storage device 211 are provided.
- a subject (for example, a living body) 203 is placed on a bed (table) or the like and placed in a static magnetic field space generated by the magnet 201.
- the imaging target is the brain.
- the head of the subject is placed in the static magnetic field space.
- the imaging target is not limited to the brain, and it is needless to say that the liver or heart is arbitrary.
- the sequencer 204 sends commands to the gradient magnetic field power source 205 and the high frequency magnetic field generator 206 to generate a gradient magnetic field and a high frequency magnetic field, respectively.
- the generated high frequency magnetic field is applied to the subject 203 through the probe 207.
- the echo generated from the subject 203 is received by the probe 207 and detected by the receiver 208.
- the nuclear magnetic resonance frequency (detection reference frequency f0) as a reference for detection is set by the sequencer 204.
- the detected signal is sent to a computer 209 where signal processing such as image reconstruction is performed.
- the result is displayed on the display device 210.
- the detected signal, measurement conditions, image information after signal processing, and the like may be stored in the storage device 211.
- the sequencer 204 performs control so that each unit operates at a timing and intensity programmed in advance.
- a program that particularly describes a high-frequency magnetic field, a gradient magnetic field, and timing and intensity of signal reception is called a pulse sequence.
- the MRI apparatus 101 of the present embodiment uses a GrE (Gradient Echo) pulse sequence that can obtain a signal corresponding to the non-uniformity of the spatial distribution of the magnetic field strength.
- the GrE pulse sequence includes, for example, an RSSG (RF-soiled-Steady-state Acquisition with Rebound Gradient-Echo) sequence.
- the computer 209 of the present embodiment instructs the sequencer 204 to measure echoes according to the set measurement parameters and pulse sequence, measures the echoes, places the obtained echoes in k space, and echoes placed in the k space. Is calculated to generate an image with a desired contrast, and the obtained image is displayed on the display device 210.
- Each of these functions of the computer 209 is realized when the CPU of the computer 209 loads the program stored in the storage device 211 to the memory and executes it.
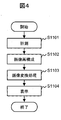
- FIG. 4 is a processing flow of the imaging process of the present embodiment.
- the measurement unit 300 When various measurement parameters are set and an instruction to start imaging is received, the measurement unit 300 performs measurement (step S1101).
- measurement unit 300 instructs sequencer 204 according to a predetermined pulse sequence, acquires an echo signal, and arranges it in k-space.
- the sequencer 204 sends instructions to the gradient magnetic field power supply 205 and the high frequency magnetic field generator 206 in accordance with the instructions to generate a gradient magnetic field and a high frequency magnetic field, respectively.
- the echo received by the probe 207 and detected by the receiver 208 is received as a complex signal.
- a GrE pulse sequence is used as described above.
- a GrE-based pulse sequence used in the present embodiment will be described using an RSSG sequence as an example.
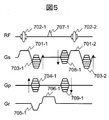
- FIG. 5 is a pulse sequence diagram of the RSSG sequence.
- RF, Gs, Gp, and Gr represent a high-frequency magnetic field, a slice gradient magnetic field, a phase encoding gradient magnetic field, and a readout gradient magnetic field, respectively.
- the application of the slice gradient magnetic field pulse 701 and the irradiation of a high frequency magnetic field (RF) pulse 702 excite magnetization of a predetermined slice in the subject 203.
- a slice encode gradient magnetic field pulse 703 and a phase encode gradient magnetic field pulse 704 for adding position information in the slice direction and the phase encode direction to the phase of magnetization are applied.
- a nuclear magnetic resonance signal is applied while applying a readout gradient magnetic field pulse 706 for adding position information in the readout direction.
- a readout gradient magnetic field pulse 706 for adding position information in the readout direction.
- a re-phase slice encode gradient magnetic field pulse 708 and a phase encode gradient magnetic field pulse 709 for converging the phase of the nuclear magnetization dephased by the slice encode gradient magnetic field pulse 703 and the phase encode gradient magnetic field pulse 704 are applied.
- the measurement unit 300 performs the above procedure using the intensity of the slice encode gradient magnetic field pulses 703 and 708 (slice encode number ks) and the phase encode gradient magnetic field pulses 704 and 709 (phase encode number kp) and the phase of the RF pulse 702. While changing, it is repeatedly executed at a repetition time TR, and an echo necessary for obtaining one image is measured. At this time, the phase of the RF pulse 702 is increased by, for example, 117 degrees. In FIG. 5, the numbers below the hyphen indicate the number of repetitions.
- Each measured echo is arranged in a three-dimensional k space with kr, kp, and ks as coordinate axes. At this time, one echo occupies one line parallel to the kr axis in the k space.
- the absolute value image obtained by this RSSG sequence has a T1 (longitudinal relaxation time) weighted image when TE (time from irradiation of RF pulse 702 to measurement of echo 707) is set short, and phase dispersion within the pixel when TE is set long. It becomes a T2 * emphasized image reflecting the above.
- the RSSG sequence which is one of Cartesian imaging that acquires data parallel to the coordinate axis of the k space, is used.
- a plurality of echoes may be acquired by one TR and arranged in different k-space images.
- a single complex image or phase image may be created from separate complex images or phase images acquired by a plurality of echoes.
- non-Cartesian imaging such as a radial scan that acquires data in a rotational manner in the k space may be used.
- the image reconstruction unit 400 When the measurement is finished, the image reconstruction unit 400 performs an image reconstruction process for reconstructing an image from the echo signals arranged in the k space (step S1102).
- the image reconstruction unit 400 performs processing such as three-dimensional inverse Fourier transform on the echo (data) arranged in the k space, and reconstructs a complex image in which the value of each pixel is represented by a complex number. To do.
- the image conversion unit 500 performs various image conversion processes to be described later on the obtained complex image (step S1103).
- the image conversion unit 500 converts the complex image obtained by the image reconstruction unit 400 into a susceptibility image. Details of the image conversion processing of this embodiment will be described later.
- the display processing unit 600 in the present embodiment displays the obtained magnetic susceptibility image on the display device 210 as a grayscale image (step S1104).
- a plurality of pieces of image information may be integrated and displayed using a method such as maximum value projection processing.
- image processing may be performed on the magnetic susceptibility image to create an image having a contrast different from that of the magnetic susceptibility image and displayed on the display device 210.
- an enhancement mask that emphasizes the magnetic susceptibility difference between tissues may be created from the magnetic susceptibility image, and a magnetic susceptibility difference enhanced image obtained by multiplying it by an absolute value image may be displayed.
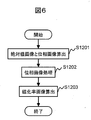
- FIG. 6 is a processing flow of the image conversion processing of the present embodiment.
- an absolute value image and a phase image are generated from the complex image generated by the image reconstruction unit 510 (step S1201).
- the absolute value image and the phase image are respectively created from the complex absolute value component and phase component of each pixel of the complex image.
- the pixel value S (i) of the absolute value image and the pixel value ⁇ (i) of the phase image at the pixel i are expressed by the equations (3) and (4), respectively, using the pixel value c (i) of the complex image. And calculated from
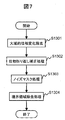
- phase image processing described below is performed on the phase image (step S1202).
- four types of phase image processing are performed.
- the four types of phase image processing will be described with reference to the processing flow of FIG.
- a global phase change removal process for removing a global phase change from the phase image is performed (step S1301).
- the phase image calculated by Equation (4) is based on the global phase change caused by the static magnetic field inhomogeneity that occurs depending on the shape of the imaging region (for example, the head) and the susceptibility change between tissues. It is the sum of the local phase change caused.
- each corresponds to a low frequency component and a high frequency component in the k space of the phase image.
- the global phase change included in the low resolution image is removed from the original image by complex division of the original image by the low resolution image.
- There are various methods for removing a global phase change For example, there is a method of extracting a global phase change by fitting a three-dimensional image with a low-order polynomial and subtracting it from the original image. Such other methods may be used in the global phase change removal processing.
- phase wrap correction process for correcting the phase wrap is performed (step S1302).
- phase values exceeding the range of ⁇ to ⁇ are folded back within the range of ⁇ to ⁇ . Therefore, in order to obtain an accurate phase in the entire brain region, it is necessary to correct these folds.
- a region enlargement method or the like is used to correct the phase value that is folded back in the range of ⁇ to ⁇ .
- a noise mask process is performed on an area containing only noise components (noise area) in the phase image (step S1303).
- a mask image is created using an absolute value image.
- the mask image uses a predetermined threshold, and the pixel value of an area having a value smaller than the threshold in the absolute value image is 0, and the pixel value of the other area is 1.
- the created mask image is multiplied with the phase image.
- the threshold value may be obtained from a pixel value distribution of all pixels of the absolute value image using a method such as a discriminant analysis method.
- noise mask processing methods there are various noise mask processing methods. For example, there is a method of setting the pixel value of the air region to 0 as a mask image used for noise mask processing. In this case, the boundary between the brain and air is detected, and the air region is extracted based on the detection result. Such other methods may be used in the noise mask process.
- a process of removing the boundary region between the brain and air in the phase image subjected to the noise mask process is performed (step S1304).
- the phase of the boundary region adjacent to the air has a greater spatial variation than other regions, and may cause artifacts in the calculated susceptibility image. Therefore, it is necessary to remove this boundary area.
- the boundary region is removed by enlarging the region from the air region in the phase image subjected to noise mask processing by the region expansion method, and changing the value to 0 when the phase value exceeds a predetermined threshold. Remove region.
- There are various known methods for removing the boundary region For example, there is a method of fitting the phase change of the boundary region using a Gaussian function and subtracting it from the original image. Such other methods may be used in the boundary region removal processing.
- phase image processing is merely examples, and need not be limited to these. Also, some of these four processes can be omitted. Moreover, the processing order of each process is not ask
- a magnetic susceptibility image to be displayed on the display device 210 is calculated from the phase image subjected to the phase image processing (step S1203).
- a low-frequency region susceptibility image ⁇ 0 that is a susceptibility image used for the low-frequency region is calculated from the phase image (step S1401), and the susceptibility value is incorrect but the tissue on the susceptibility distribution
- the contour information magnetic susceptibility image ⁇ g which is the magnetic susceptibility image having the contour information step S1402
- the high frequency region magnetic susceptibility image ⁇ C which is the magnetic susceptibility image used for the high frequency region
- a contour mask is calculated from ⁇ g (step S1404)
- the susceptibility value corresponding to the magic angle region is smoothed from the contour mask and the low frequency region susceptibility image ⁇ 0 (step S1405), and finally the high frequency region susceptibility image ⁇ .
- the magnetic susceptibility value corresponding to the high frequency region is smoothed using C (step S1406).
- step S1401 Before explaining the specific processing method from step S1401 to step S1406, the k-space region dividing method of the magnetic susceptibility image calculation processing in this embodiment will be described.
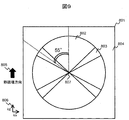
- FIG. 9 is a schematic diagram of k-space region division in the present embodiment.
- the low-frequency region 802 where the information on the magnetic susceptibility of the tissue exists
- the magic angle region 803 where the accuracy of the solution is greatly reduced
- the information on the magnetic susceptibility of the tissue are compared with those in the low-frequency region. It is divided into three high frequency regions 804 in which there is a small amount of microscopic contrast information.
- the low frequency region 802 uses a magnetic susceptibility image ⁇ 0 having background noise larger than a desired value but having information on the magnetic susceptibility value of the tissue.
- the magnetic susceptibility image ⁇ 0 used for the low frequency region is called a low frequency region magnetic susceptibility image.
- a magnetic susceptibility image ⁇ g having information on the contour of the tissue on the magnetic susceptibility distribution is calculated in advance, but the contour image calculated from the magnetic susceptibility image is displayed. Perform the smoothing used.
- the magnetic susceptibility image ⁇ g used for calculating the contour image is referred to as a contour information magnetic susceptibility image.
- a magnetic susceptibility image ⁇ C calculated by a regularization method using a regularization parameter that maximizes the CNR (contrast to noise ratio) although the tissue magnetic susceptibility value is not correct is used.
- the magnetic susceptibility image ⁇ C used in the high frequency region is referred to as a high frequency region susceptibility image.
- smoothing is not performed in the low frequency region where the information of the magnetic susceptibility of the tissue exists, and smoothing is performed in the high frequency region, so that the magnetic susceptibility value of the tissue is not decreased. Background noise can be reduced.
- a contour image is calculated from a contour information magnetic susceptibility image ⁇ g having correct tissue contour information on the magnetic susceptibility distribution, and smoothing is performed using the contour image.
- the contour image calculated from the contour information magnetic susceptibility image ⁇ g coincides with the tissue contour on the magnetic susceptibility distribution, and the contour does not change depending on the direction of the static magnetic field. Therefore, the estimation accuracy of the magnetic susceptibility of the tissue is improved as compared with the case where the smoothing is performed using the contour image calculated from the absolute value image or the phase image.
- the three low-frequency region susceptibility images ⁇ 0 , the contour information susceptibility image ⁇ c , and the high-frequency region susceptibility image ⁇ g described above in the present embodiment are calculated by the L1 norm regularization method.
- the susceptibility images of these different properties are calculated by changing the regularization parameters of the L1 norm regularization method.
- the relationship between the size of the regularization parameter of the L1 norm regularization method and the property of the calculated magnetic susceptibility image will be briefly described.
- the following evaluation function e ( ⁇ ) is set using the relational expression of Equation (1), and the magnetic susceptibility image is calculated by minimizing e ( ⁇ ).
- ⁇ is a column vector of a phase image having a size of the total number of pixels N
- ⁇ is a column vector of a magnetic susceptibility image
- C has a size of N ⁇ N, and is a matrix corresponding to a convolution operation on ⁇
- W Is a column vector having a magnitude of N, which is a coefficient vector that weights the error in each pixel.
- is the norm of the vector A, ⁇ is an arbitrary constant, and
- 1 is the L1 norm of the vector A.
- 1 of the vector A is represented by the sum of absolute values of the elements of the vector A.
- the first item serves to reduce the error in the relational expression between phase and magnetic susceptibility
- the second item serves to reduce background noise.
- the magnitude of the contribution to the magnetic susceptibility image of the second item having the function of reducing background noise is controlled by the size of the regularization parameter ⁇ , and the property of the magnetic susceptibility image changes.
- the L1 norm regularization method has a feature that the reduction rate of the background noise is larger than the reduction rate of the magnetic susceptibility of the tissue in a certain ⁇ range. Specifically, when ⁇ is increased from 0, first, the estimation accuracy of the magnetic susceptibility is maximized at a certain ⁇ - 0 . Further, when ⁇ is further increased from ⁇ 0 , the background noise and the magnetic susceptibility of the tissue decrease. However, the reduction rate of the background noise is lower than the reduction rate of the magnetic susceptibility of the tissue up to a certain ⁇ value ⁇ C. large.
- the CNR defined by the ratio between the magnetic susceptibility difference between tissues and the background noise has a maximum value at ⁇ C.
- the relationship between ⁇ 0 and ⁇ C is ⁇ 0 ⁇ C.
- the background noise reduction rate is larger than the reduction rate of the magnetic susceptibility difference inside and outside the tissue in the contour region of the target tissue up to a certain ⁇ value ⁇ g .
- the accuracy of the contour image using the magnetic susceptibility image is proportional to the ratio of the difference in magnetic susceptibility inside and outside the tissue in the contour region to the background noise. Therefore, the accuracy of the contour image using the susceptibility image calculated from equation (5) becomes maximum at lambda g.
- the relationship between ⁇ 0 and ⁇ g is ⁇ 0 ⁇ g .
- the regularization method for regularizing the L1 norm of the spatial gradient of the magnetic susceptibility image has the same characteristics as the L1 norm regularization method described above.
- a low frequency region susceptibility image ⁇ 0 that is a susceptibility image used in the low frequency region is calculated (step S1401).
- ⁇ 0 in the present embodiment is calculated using ⁇ that maximizes the estimation accuracy of the magnetic susceptibility of the tissue using the L1 norm regularization method of Equation (5).
- the estimation accuracy of the magnetic susceptibility of the tissue represents the similarity between the magnetic susceptibility value of the tissue in the magnetic susceptibility distribution and the magnetic susceptibility value of the tissue in the calculated magnetic susceptibility image.
- the estimation accuracy of the magnetic susceptibility of the tissue can be calculated using, for example, computer simulation.
- the susceptibility distribution of the model is first set.
- As the model susceptibility distribution for example, an approximately calculated susceptibility image is used.
- a phase image is calculated by computer simulation using the relational expression of equation (1) from the magnetic susceptibility distribution of the model, and a magnetic susceptibility image is estimated from the calculated phase image using equation (5).
- a relative error between the average magnetic susceptibility value in the target tissue on the magnetic susceptibility distribution of the model and the average magnetic susceptibility value in the target tissue on the magnetic susceptibility image estimated using Equation (5) is calculated, and the relative error is calculated.
- the value of ⁇ when is the smallest is adopted.
- all the coefficient vectors W in the equation (5) use 1 values.
- the value of ⁇ 0 that minimizes the evaluation function e ( ⁇ 0 ) in the equation (5) is obtained by iterative calculation using the nonlinear conjugate gradient method.
- the iteration termination condition of the nonlinear conjugate gradient method is based on the criterion that the iteration is terminated when the number of iterations exceeds a predetermined number.
- the initial value of the iterative calculation is a vector in which all elements are zero.
- the value of ⁇ may always be a constant value depending on the apparatus and the imaging method, or may be automatically calculated from the SN ratio (signal-to-noise ratio) of the absolute value image.
- the coefficient vector W an arbitrary vector such as a pixel value of an absolute value image can be used.
- an arbitrary vector such as a magnetic susceptibility image obtained at a low resolution or a magnetic susceptibility image obtained using Fourier transform can be used.
- the minimum value of ⁇ 0 may be obtained using a method such as linear programming.
- the iterative termination condition may be any condition such as termination when e ( ⁇ 0 ) becomes smaller than a predetermined threshold.
- any regularization method such as an L2 norm regularization method or a method of regularizing the L1 norm of the spatial gradient of the magnetic susceptibility image can be used.
- other methods can be used instead of the regularization method.
- the magnetic susceptibility image in the k space may be obtained from the relational expression in the k space in the equation (2), and the susceptibility image in the real space may be obtained by inverse Fourier transform.
- a low-resolution phase image may be calculated from the phase image, and a low-frequency region susceptibility image may be calculated from the low-resolution phase image.
- the magnetic susceptibility distribution of the model used for calculating the estimation accuracy of the magnetic susceptibility of the tissue is arbitrary.
- the estimation accuracy of the magnetic susceptibility can be calculated by an arbitrary method.
- the contour information magnetic susceptibility image ⁇ g is calculated (step S1401).
- the contour information magnetic susceptibility image ⁇ g in this embodiment is calculated using ⁇ that improves the accuracy of the contour image most.
- the accuracy of the contour image indicates how correctly the contour image represents the tissue contour information in the magnetic susceptibility distribution.
- the accuracy of the contour image can be calculated using, for example, computer simulation.
- a contour mask calculated by the method in step S1404 is calculated from the magnetic susceptibility image estimated using equation (5), and this corresponds to the magic angle region by the method in step S1405 using the calculated contour mask.
- the susceptibility value to be smoothed is smoothed, and ⁇ when the estimation accuracy of the susceptibility of the tissue in the smoothed susceptibility image is maximized is adopted.
- the method of minimizing the coefficient vector W and the evaluation function e ( ⁇ g ) in Equation (5), and the minimization calculation end condition are the same as those in step S1401.
- Equation (5) the value of ⁇ , the coefficient vector W, the e ( ⁇ g ) minimization method, and the minimization calculation end condition in Equation (5) are arbitrary as in step S1401. Also, the calculation method of the magnetic susceptibility image is arbitrary as in step S1401. Also, the method for calculating the accuracy of the contour image is arbitrary.
- a high frequency region susceptibility image ⁇ C is calculated (step S1403).
- ⁇ C is calculated using ⁇ that improves the CNR most.
- the CNR is calculated by dividing the difference between the average value of the susceptibility values of the target tissue and the average value of the susceptibility values of the white matter by the standard deviation of the susceptibility values of the white matter.
- arbitrary definitions can be used for CNR.
- the method for minimizing the coefficient vector W and the evaluation function e ( ⁇ C ) in Equation (5) and the termination condition for the minimization calculation are the same as those in the method of step S1401.
- Equation (5) the value of ⁇ , coefficient vector W, e ( ⁇ C ) minimization method, and minimization calculation end condition in Equation (5) are arbitrary as in step S1401. Also, the calculation method of the magnetic susceptibility image is arbitrary as in step S1401. In addition, a magnetic susceptibility image obtained by multiplying ⁇ C in the present embodiment by a constant may be used as a new ⁇ C.
- the contour mask calculation unit 534 calculates a contour image from the contour information magnetic susceptibility image ⁇ g and calculates a contour mask from the contour image (step S1404).
- the contour image in the present embodiment is an image having a large pixel value in a region having a large spatial change in ⁇ g and a small pixel value in a region having a small change.
- the contour image is calculated by calculating the gradient of ⁇ g in the three directions of the x direction, the y direction, and the z direction.
- S x G x ⁇ g (Equation 6)
- S y G y ⁇ g (Equation 7)
- S z G z ⁇ g (Equation 8)
- S x , S y , and S z are the contour images in the x , y , and z directions, respectively
- G x , G y , and G z are the gradients in the x, y, and z directions, respectively.
- the gradient is defined by a value obtained by dividing the difference between the left and right pixel values of the pixel by the distance between the left and right pixels.
- the gradient can have any definition, such as defining the difference between adjacent pixel values as a value divided by the distance between adjacent pixels.
- the contour can be extracted by an arbitrary method such as filtering the image with a Laplacian filter. Further, the contour image may be calculated after smoothing the contour information magnetic susceptibility image ⁇ g using a median filter or the like. Further, the contour image may be smoothed using a median filter or the like.
- a tissue contour mask is calculated from the contour image.
- the contour mask W x in the x direction at the pixel i is calculated using the following equation.
- the tissue contour mask is an image in which the pixel value in the tissue contour region is 0 and the pixel value in the region other than the contour is 1.
- Contour mask W x in this embodiment based on the threshold a W, in the pixel the pixel value is large contour image S x is 0, the pixel a pixel value is smaller contour image S x is a mask image to 1.
- This threshold value aW is set as a contour mask threshold value. The same calculation is performed for the y direction and the z direction to calculate W y and W z .
- a contour mask may be calculated from a plurality of images such as an absolute value image and an image acquired in advance, and multiplied by W x , W y , and W z .
- the outline mask threshold a W can be arbitrarily determined. Different contour mask threshold values may be used in the x direction, the y direction, and the z direction.
- W x , W y , and W z in this embodiment are composed of only binary values of 0 and 1, but may be configured to change smoothly at the boundary point between 0 and 1.
- the magic angle region smoothing unit 535 smoothes the magnetic susceptibility value corresponding to the magic angle region, and calculates a magic smooth magnetic susceptibility image ⁇ 1 (step S1405).
- the magic angle area smoothing is a process of smoothing the magnetic susceptibility value corresponding to the magic angle area and reducing background noise.
- the magic angle region smoothing is performed from the low frequency region magnetic susceptibility image ⁇ 0 and the contour masks W x , W y , W z by performing the minimization calculation of g ( ⁇ 1 ) in the following equation (10). To do.
- ⁇ 1 is a magic smooth magnetic susceptibility image to be calculated
- M k of the first item is a magic angle mask in which the magic angle region is 0, and other regions are 1, and ⁇ 1 is an arbitrary constant.
- the first item has a function of making the region other than the magic angle on the k space of the magic smooth magnetic susceptibility image ⁇ 1 the same solution as the low frequency region susceptibility image ⁇ 0 .
- the second item has a function of bringing the pixel values of adjacent pixels of ⁇ 1 closer to each other in a region where W x , W y , and W z are 1.
- a region where W x , W y and W z are 1, that is, a region other than the contour in the contour information magnetic susceptibility image ⁇ g is smoothed.
- ⁇ a th , and M k 1 in the other areas
- Equation (10) is calculated by iterative calculation using the nonlinear conjugate gradient method, and the iteration termination condition is based on the criterion that the iteration is terminated when the number of iterations exceeds a predetermined number.
- a contour image is calculated from the contour information magnetic susceptibility image ⁇ g and is used for smoothing.
- the contour image calculated from the contour information magnetic susceptibility image ⁇ g coincides with the tissue contour on the magnetic susceptibility distribution, and the contour does not change depending on the direction of the static magnetic field. Therefore, the estimation accuracy of the magnetic susceptibility of the tissue is improved as compared with the case where the smoothing is performed using the contour image calculated from the absolute value image or the phase image. Further, as in the case where smoothing is performed using the contour image calculated from the absolute value image or the phase image, the background noise is reduced by the smoothing effect.
- the magic angle mask Mk may be set to 0 only in the magic angle area in the low frequency area.
- M k is composed of only binary values of 0 and 1.
- 0 and 1 change smoothly at a boundary point where
- a th.
- any value can be used for the magic angle threshold value a th and ⁇ 1 .
- the solution of equation (10) can be calculated using any method such as linear programming.
- the iterative termination condition can be any condition such as termination when g ( ⁇ 1 ) becomes smaller than a predetermined threshold. Any formulation can be used for smoothing in the magic angle region. For example, h ( ⁇ 1 ) expressed by the equation (12) may be minimized under the condition that satisfies the following equation (11).
- the high frequency region smoothing unit 536 performs smoothing on the high frequency region and calculates a high frequency smooth magnetic susceptibility image ⁇ L (step S1406).
- High frequency region smoothing is a process of reducing background noise of a susceptibility image by smoothing a susceptibility value corresponding to a high frequency region in the k space of the susceptibility image.
- the high frequency region is replaced with the high frequency region magnetic susceptibility image ⁇ C calculated by the high frequency region magnetic susceptibility image calculation unit 533. That is, the equation (13), obtain the k-space signal X L of the high-frequency smoothing susceptibility images.
- k is a position vector in the k space
- X 1 is a k space signal of the magic smooth susceptibility image ⁇ 1
- X C is a k space signal of the high frequency region susceptibility image ⁇ C.
- by ⁇ (k x 2 + k y 2 + k z 2), defines the boundary of the high-frequency region and the low-frequency region.
- k th a region where
- a value at which the background noise is most reduced without decreasing the accuracy of estimating the magnetic susceptibility of the tissue is adopted as the dividing point k th .
- k th 0.4.
- the high-frequency region susceptibility image ⁇ C in the present embodiment is calculated by the L1 regularization method that performs smoothing while enhancing the contrast of a minute structure. Therefore, even if the high-frequency region susceptibility image ⁇ C is used in the high-frequency region, information on the contrast of minute tissue existing in the high-frequency region is not lost due to the smoothing effect.
- the high frequency region not only an image with a large CNR can be replaced but also an arbitrary method can be used.
- smoothing can be performed using an arbitrary regularization method, or smoothing can be performed by a filter process such as a median filter.
- any value can be used as the value of the dividing point k th .
- the value at which the background noise is most reduced without decreasing the magnetic susceptibility value of the tissue may be adopted.
- the mixing of X 1 and X C in the present embodiment is performed so as to change stepwise at the dividing points of the high frequency region and the low frequency region, but the ratio of X 1 and X C gradually changes. May be mixed.
- the high-frequency region and the low-frequency region are divided in two stages.
- the high-frequency area and the low-frequency area may be divided in any number of stages, such as dividing in three stages and applying different processing to each.
- step S1406 may not be performed. In this case, step S1403 may not be performed. Further, the order of step S1405 and step S1406 may be switched.
- the high-frequency smooth magnetic susceptibility image ⁇ L in this embodiment is calculated using a contour image in which the contour of the tissue can be correctly extracted without changing the contrast depending on the magnetic field direction, so that the magnetic susceptibility of the tissue can be estimated with high accuracy. Further, by performing smoothing in the high frequency region, background noise can be reduced without lowering the magnetic susceptibility value of the tissue. As a result, the magnetic susceptibility of the tissue can be calculated with low background noise and high accuracy.
- various magnetic susceptibility images can be calculated by arbitrarily combining the processes of steps S1401 to S1406 in the magnetic susceptibility image calculation processing of the present embodiment.
- the low frequency region susceptibility image ⁇ 0 is calculated by the low frequency region susceptibility image calculation processing (step S1401)
- the high frequency region susceptibility image ⁇ C is calculated by the high frequency region susceptibility image calculation processing (step S1403)
- a magnetic susceptibility image ⁇ L1 obtained by mixing these two images may be calculated by the high-frequency region smoothing process (step S1406).
- the magic angle area smoothing process is not performed, the estimation accuracy of the magnetic susceptibility of the tissue is lowered and the background noise increases compared with the high-frequency smoothed magnetic susceptibility image ⁇ L calculated in the present embodiment, but the background noise increases
- the magnetic susceptibility image ⁇ L1 can be calculated by the number of times of processing.
- the contour information susceptibility image calculation processing by calculating contour information susceptibility image chi g
- outline mask calculating process step S1404 contour mask from the outline information susceptibility images chi g by W x, W y
- the magnetic susceptibility image ⁇ L2 may be calculated by calculating W z and performing, for example, minimization calculation of g ( ⁇ L2 ) in the following equation (14).
- the 1st item in Formula (14) is the same as the 1st item in Formula (5), and the 2nd item is the same as the 2nd item in Formula (10).
- the magnetic susceptibility value of the tissue is lowered. Therefore, the accuracy of estimating the magnetic susceptibility of the tissue is lower than that of the high-frequency smooth magnetic susceptibility image ⁇ L calculated in the present embodiment, but the susceptibility image ⁇ L2 can be calculated with a small number of processes.
- the magic smooth magnetic susceptibility image ⁇ 1 and the high frequency smooth magnetic susceptibility image ⁇ L calculated in the present embodiment are used as the contour information magnetic susceptibility image ⁇ g ′, and the magnetic susceptibility image calculation process in the present embodiment is performed once again to obtain a new
- the magic smooth magnetic susceptibility image ⁇ 1 ′ and the high frequency smooth susceptibility image ⁇ L ′ may be calculated.
- the contour information susceptibility image ⁇ g ′ has a higher accuracy of the contour image than the contour information susceptibility image ⁇ g in the present embodiment.
- the high frequency smooth magnetic susceptibility image ⁇ L ′ has a higher estimation accuracy of the magnetic susceptibility of the tissue than the high frequency smooth magnetic susceptibility image ⁇ L in the present embodiment, although the number of processes required for calculation is increased.
- the magic smooth magnetic susceptibility image ⁇ 1 ′ and the high frequency smooth magnetic susceptibility image ⁇ L ′ calculated by the above method are used as new contour information magnetic susceptibility images ⁇ g ′, and the magnetic susceptibility image calculation processing in this embodiment is performed once again.
- a new magic smooth magnetic susceptibility image ⁇ 1 ′ ′ and high frequency smooth susceptibility image ⁇ L ′ ′ may be calculated. Moreover, you may perform these series of processes in multiple times.
- any imaging section such as a transverse section, a coronal section, a sagittal section, and an oblique section, and the same effect can be obtained.
- the magnetic susceptibility image calculation processing may be performed directly from the complex image without converting the complex image into the absolute value image and the phase image.
- contour image calculation method and the high-frequency region smoothing method in the present embodiment can be applied in addition to the calculation of the magnetic susceptibility image.
- it can be used to calculate the distribution of quantitative values of T1 value and T2 value, and to calculate the distribution of conductivity.
- the present invention is not limited thereto.
- At least one of these units may be constructed on an information processing apparatus independent of the MRI apparatus capable of transmitting and receiving data to and from the computer 209 of the MRI apparatus, for example.
- the k-space region is divided into at least three regions, a low frequency region, a magic angle region, and a high frequency region, and the following different processing is applied to each region.
- the present invention is not limited to this, and the area can be further divided.
- 101 vertical magnetic field MRI apparatus, 102: horizontal magnetic field MRI apparatus, 103: MRI apparatus, 201: magnet, 202: gradient magnetic field coil, 203: subject, 204: sequencer, 205: gradient magnetic field power supply, 206: high frequency magnetic field generator 207: probe, 208: receiver, 209: computer, 210: display device, 211: storage device, 300: measurement unit, 400: image reconstruction unit, 500: image conversion unit, 510: complex image conversion unit, 520 : Phase image processing unit, 530: susceptibility image calculation unit, 531: low frequency region susceptibility image calculation unit, 532: contour information susceptibility image calculation unit, 533: high frequency region susceptibility image calculation unit, 534: contour mask calculation 535: Magic angle region smoothing unit, 536: High frequency region smoothing unit, 600: Display processing unit, 701: Slice gradient magnetic field Lus, 702: RF pulse, 703: Slice encoding gradient magnetic field pulse, 704: Phase encoding gradient magnetic field pulse, 705: Lead-out
Landscapes
- Physics & Mathematics (AREA)
- Health & Medical Sciences (AREA)
- High Energy & Nuclear Physics (AREA)
- Nuclear Medicine, Radiotherapy & Molecular Imaging (AREA)
- Engineering & Computer Science (AREA)
- General Physics & Mathematics (AREA)
- Condensed Matter Physics & Semiconductors (AREA)
- Life Sciences & Earth Sciences (AREA)
- Radiology & Medical Imaging (AREA)
- General Health & Medical Sciences (AREA)
- Signal Processing (AREA)
- Molecular Biology (AREA)
- Biophysics (AREA)
- Pathology (AREA)
- Biomedical Technology (AREA)
- Heart & Thoracic Surgery (AREA)
- Medical Informatics (AREA)
- Surgery (AREA)
- Animal Behavior & Ethology (AREA)
- Public Health (AREA)
- Veterinary Medicine (AREA)
- Artificial Intelligence (AREA)
- Computer Vision & Pattern Recognition (AREA)
- Magnetic Resonance Imaging Apparatus (AREA)
Abstract
Description


被検体に静磁場を印加する静磁場印加手段と、前記被検体に傾斜磁場を印加する傾斜磁場印加手段と、前記被検体に高周波磁場パルスを照射する高周波磁場パルス照射手段と、前記被検体から核磁気共鳴信号を受信する受信手段と、前記傾斜磁場と前記高周波磁場パルスを制御し受信した前記核磁気共鳴信号に演算を行う計算手段とを有する磁気共鳴イメージング装置であって、
前記計算手段は、前記静磁場の中に置かれた前記被検体に前記高周波磁場パルスおよび前記傾斜磁場を印加して、前記被検体から発生する前記核磁気共鳴信号を複素信号として検出する計測部と、前記複素信号から各画素の値が複素数である複素画像を再構成する画像再構成部と、前記複素画像を磁化率画像に変換する画像変換部と、前記生成した画像を表示装置に表示する表示処理部とを有し、
前記画像変換部は、前記複素画像から絶対値画像と位相画像とを生成する複素画像変換部と、前記位相画像から前記磁化率画像を生成する磁化率画像算出部とを備え、
前記磁化率画像算出部は、磁化率分布における組織の輪郭をあらわす輪郭情報磁化率画像を算出する輪郭情報磁化率画像算出部と、前記輪郭情報磁化率画像から組織の輪郭マスクを算出する輪郭マスク算出部とを備える。
実施例1
本発明の第一の実施形態について説明する。まず、本実施形態のMRI装置について説明する。図1は、本実施形態のMRI装置の外観図である。図1(a)は、開放感を高めるために磁石を上下に分離したハンバーガー型(オープン型)の垂直磁場方式のMRI装置(垂直磁場MRI装置)100である。図1(b)は、ソレノイドコイルで静磁場を生成するトンネル型磁石を用いた水平磁場方式のMRI装置(水平磁場MRI装置)101である。また、図1(c)は、図1(b)と同じトンネル型磁石を用い、磁石の奥行を短くし且つ斜めに傾けることによって、開放感を高めたMRI装置102である。なお、各MRI装置の形態は、それぞれ、垂直磁場方式、水平磁場方式の一例であり、これらに限定されるものではない。



Sx = Gxχg (数6)
Sy = Gyχg (数7)
Sz = Gzχg (数8)
ここで、Sx、Sy、Szはそれぞれx方向、y方向、z方向の輪郭画像、Gx、Gy、Gzはそれぞれx方向、y方向、z方向の画像の勾配を計算する演算子を表す。本実施形態では、勾配は当該画素の左右の画素値の差を、左右の画素間の距離でわった値で定義する。



最後に、高周波領域平滑化部536において、高周波領域に平滑化を行い、高周波平滑磁化率画像χLを算出する(ステップS1406)。高周波領域平滑化とは、磁化率画像のk空間上の高周波領域に相当する磁化率値を平滑化することにより、磁化率画像の背景ノイズを減少させる処理のことである。本実施形態における高周波領域平滑化処理では、高周波領域を高周波領域磁化率画像算出部533において算出した高周波領域磁化率画像χCでおきかえる。すなわち、式(13)により、高周波平滑磁化率画像のk空間信号XLを得る。


Claims (11)
- 被検体に静磁場を印加する静磁場印加手段と、前記被検体に傾斜磁場を印加する傾斜磁場印加手段と、前記被検体に高周波磁場パルスを照射する高周波磁場パルス照射手段と、前記被検体から核磁気共鳴信号を受信する受信手段と、前記傾斜磁場と前記高周波磁場パルスを制御し受信した前記核磁気共鳴信号に演算を行う計算手段とを有する磁気共鳴イメージング装置であって、
前記計算手段は、前記静磁場の中に置かれた前記被検体に前記高周波磁場パルスおよび前記傾斜磁場を印加して、前記被検体から発生する前記核磁気共鳴信号を複素信号として検出する計測部と、前記複素信号から各画素の値が複素数である複素画像を再構成する画像再構成部と、前記複素画像を磁化率画像に変換する画像変換部と、前記生成した画像を表示装置に表示する表示処理部とを有し、
前記画像変換部は、前記複素画像から絶対値画像と位相画像とを生成する複素画像変換部と、前記位相画像から前記磁化率画像を生成する磁化率画像算出部とを備え、
前記磁化率画像算出部は、磁化率分布における組織の輪郭をあらわす輪郭情報磁化率画像を算出する輪郭情報磁化率画像算出部と、前記輪郭情報磁化率画像から組織の輪郭マスクを算出する輪郭マスク算出部とを備えることを特徴とする磁気共鳴イメージング装置。 - 請求項1記載の磁気共鳴イメージング装置であって、
前記輪郭情報磁化率画像算出部は、前記輪郭情報磁化率画像から算出される輪郭画像の精度が最も向上する正則化パラメータを用いた正則化法で算出した磁化率画像を輪郭情報磁化率画像とすることを特徴とする磁気共鳴イメージング装置。 - 請求項1記載の磁気共鳴イメージング装置であって、
前記磁化率画像算出部は、k空間のマジックアングル領域以外に用いられる低周波領域磁化率画像を算出する低周波領域磁化率画像算出部と、前記低周波領域磁化率画像と前記輪郭マスクからk空間のマジックアングル領域における平滑化を行うマジックアングル領域平滑化部とを備えることを特徴とする磁気共鳴イメージング装置。 - 請求項3記載の磁気共鳴イメージング装置であって、
前記低周波領域磁化率画像算出部は、磁化率の推定精度が最も向上する正則化パラメータを用いた正則化法で推定した磁化率画像を前記低周波領域磁化率画像とすることを特徴とする磁気共鳴イメージング装置。 - 請求項4記載の磁気共鳴イメージング装置であって、
前記低周波領域磁化率画像算出部は、前記低周波領域磁化率画像の算出に用いられた正則化パラメータが前記輪郭情報磁化率画像の算出に用いられた正則化パラメータより小さい値をもつことを特徴とする磁気共鳴イメージング装置。 - 請求項3記載の磁気共鳴イメージング装置であって、
前記マジックアングル領域平滑化部は、マジックアングル領域の大きさを規定するマジックアングル閾値を組織の磁化率の推定精度が最も向上する値に設定することを特徴とする磁気共鳴イメージング装置。 - 請求項1記載の磁気共鳴イメージング装置であって、
前記磁化率画像算出部は、k空間の高周波領域を平滑化する高周波領域平滑化部を備えることを特徴とする磁気共鳴イメージング装置。 - 請求項7記載の磁気共鳴イメージング装置であって、
前記高周波領域平滑化部は、事前にL1ノルム正則化法で推定した高周波領域磁化率画像で高周波領域をおきかえることを特徴とする磁気共鳴イメージング装置。 - 請求項8記載の磁気共鳴イメージング装置であって、
前記高周波領域平滑化部は、コントラスト対ノイズ比が最も向上する正則化パラメータを用いたL1ノルム正則化法で算出した磁化率画像を前記高周波領域磁化率画像とすることを特徴とする磁気共鳴イメージング装置。 - 請求項9記載の磁気共鳴イメージング装置であって、
前記高周波領域平滑化部は、前記高周波領域磁化率画像の算出に用いられた正則化パラメータが前記低周波領域磁化率画像の算出に用いられた正則化パラメータより大きい値をもつことを特徴とする磁気共鳴イメージング装置。 - 請求項7記載の磁気共鳴イメージング装置であって、
前記高周波領域平滑化部は、高周波領域と低周波領域の分割点を磁化率の推定精度が低下せずに背景ノイズが最も低減される値に設定することを特徴とする磁気共鳴イメージング装置。
Priority Applications (3)
| Application Number | Priority Date | Filing Date | Title |
|---|---|---|---|
| US14/442,168 US9766316B2 (en) | 2012-11-16 | 2012-11-16 | Magnetic resonance imaging device and quantitative susceptibility mapping method |
| JP2014546796A JP5902317B2 (ja) | 2012-11-16 | 2012-11-16 | 磁気共鳴イメージング装置および定量的磁化率マッピング法 |
| PCT/JP2012/079728 WO2014076808A1 (ja) | 2012-11-16 | 2012-11-16 | 磁気共鳴イメージング装置および定量的磁化率マッピング法 |
Applications Claiming Priority (1)
| Application Number | Priority Date | Filing Date | Title |
|---|---|---|---|
| PCT/JP2012/079728 WO2014076808A1 (ja) | 2012-11-16 | 2012-11-16 | 磁気共鳴イメージング装置および定量的磁化率マッピング法 |
Publications (1)
| Publication Number | Publication Date |
|---|---|
| WO2014076808A1 true WO2014076808A1 (ja) | 2014-05-22 |
Family
ID=50730748
Family Applications (1)
| Application Number | Title | Priority Date | Filing Date |
|---|---|---|---|
| PCT/JP2012/079728 Ceased WO2014076808A1 (ja) | 2012-11-16 | 2012-11-16 | 磁気共鳴イメージング装置および定量的磁化率マッピング法 |
Country Status (3)
| Country | Link |
|---|---|
| US (1) | US9766316B2 (ja) |
| JP (1) | JP5902317B2 (ja) |
| WO (1) | WO2014076808A1 (ja) |
Cited By (9)
| Publication number | Priority date | Publication date | Assignee | Title |
|---|---|---|---|---|
| WO2016076076A1 (ja) * | 2014-11-11 | 2016-05-19 | 株式会社日立メディコ | 磁気共鳴イメージング装置および定量的磁化率マッピング方法 |
| JP2017080349A (ja) * | 2015-10-30 | 2017-05-18 | 東芝メディカルシステムズ株式会社 | 磁気共鳴イメージング及び医用画像処理装置 |
| JP2017184935A (ja) * | 2016-04-04 | 2017-10-12 | 株式会社日立製作所 | 磁気共鳴イメージング装置、及び、画像処理方法 |
| JP2019504664A (ja) * | 2015-12-17 | 2019-02-21 | コーニンクレッカ フィリップス エヌ ヴェKoninklijke Philips N.V. | 定量的磁化率マッピング画像のセグメンテーション |
| WO2019049443A1 (ja) * | 2017-09-11 | 2019-03-14 | 株式会社日立製作所 | 磁気共鳴イメージング装置 |
| JP2020121137A (ja) * | 2014-09-05 | 2020-08-13 | ハイパーファイン リサーチ,インコーポレイテッド | ノイズ抑制方法及び装置 |
| US11510588B2 (en) | 2019-11-27 | 2022-11-29 | Hyperfine Operations, Inc. | Techniques for noise suppression in an environment of a magnetic resonance imaging system |
| US11841408B2 (en) | 2016-11-22 | 2023-12-12 | Hyperfine Operations, Inc. | Electromagnetic shielding for magnetic resonance imaging methods and apparatus |
| US12050256B2 (en) | 2016-11-22 | 2024-07-30 | Hyperfine Operations, Inc. | Systems and methods for automated detection in magnetic resonance images |
Families Citing this family (14)
| Publication number | Priority date | Publication date | Assignee | Title |
|---|---|---|---|---|
| WO2014057716A1 (ja) * | 2012-10-10 | 2014-04-17 | 株式会社日立製作所 | 磁気共鳴イメージング装置 |
| US9766316B2 (en) * | 2012-11-16 | 2017-09-19 | Hitachi, Ltd. | Magnetic resonance imaging device and quantitative susceptibility mapping method |
| JP6085545B2 (ja) * | 2013-09-26 | 2017-02-22 | 株式会社日立製作所 | 磁気共鳴イメージング装置、画像処理装置および磁化率画像算出方法 |
| US10145928B2 (en) * | 2013-11-28 | 2018-12-04 | Medimagemetric LLC | Differential approach to quantitative susceptibility mapping without background field removal |
| DE102014202604B4 (de) * | 2014-02-13 | 2018-09-20 | Siemens Healthcare Gmbh | Automatisierte Ermittlung der Resonanzfrequenzen von Protonen für Magnetresonanzexperimente |
| DE102014206398B4 (de) * | 2014-04-03 | 2016-09-29 | Siemens Healthcare Gmbh | Magnetresonanz-Bildgebungsverfahren für zumindest zwei separate Hochfrequenz-Sendespulen mit zeitverzögerten schichtselektiven Anregungspulsen |
| KR101886159B1 (ko) | 2017-04-06 | 2018-08-09 | 서울대학교 산학협력단 | 자기감수율에 관한 정보를 처리하는 mri 데이터 처리방법 및 이를 위한 장치 |
| US11448717B2 (en) | 2017-12-29 | 2022-09-20 | Siemens Healthcare Gmbh | Method and deep quantitative susceptibility mapping (QSM) |
| JP7020930B2 (ja) * | 2018-01-24 | 2022-02-16 | 富士フイルムヘルスケア株式会社 | 磁気共鳴イメージング装置、磁気共鳴イメージングシステム及びパラメータ推定方法 |
| CN112423659B (zh) * | 2018-05-21 | 2023-04-21 | 上海联影医疗科技股份有限公司 | 多对比度磁共振成像的系统和方法 |
| JP7140606B2 (ja) * | 2018-08-29 | 2022-09-21 | 富士フイルムヘルスケア株式会社 | 画像処理装置、画像処理方法、画像処理プログラム及び磁気共鳴イメージング装置 |
| ES2773333B2 (es) * | 2019-01-10 | 2021-07-27 | Univ Valencia Politecnica | Metodo y sistema de generacion de senales de resonancia magnetica por rotacion rapida con angulo magico de campos con codificacion espacial |
| US11940519B2 (en) | 2021-04-21 | 2024-03-26 | Siemens Healthineers Ag | Method and system for determining a magnetic susceptibility distribution |
| DE102024205490A1 (de) | 2024-06-14 | 2025-12-18 | Siemens Healthineers Ag | Homogenisierung von Magnetresonanzdaten |
Citations (2)
| Publication number | Priority date | Publication date | Assignee | Title |
|---|---|---|---|---|
| WO2009081787A1 (ja) * | 2007-12-25 | 2009-07-02 | Hitachi Medical Corporation | 磁気共鳴イメージング装置及び磁化率強調画像撮影方法 |
| WO2010073923A1 (ja) * | 2008-12-26 | 2010-07-01 | 国立大学法人 熊本大学 | 位相差強調画像化法(Phase Difference Enhanced Imaging;PADRE)、機能画像作成法、位相差強調画像化プログラム、位相差強調画像化装置、機能画像作成装置および磁気共鳴画像化(Magnetic Resonance Imaging;MRI)装置 |
Family Cites Families (7)
| Publication number | Priority date | Publication date | Assignee | Title |
|---|---|---|---|---|
| US6658280B1 (en) * | 2002-05-10 | 2003-12-02 | E. Mark Haacke | Susceptibility weighted imaging |
| US9201129B2 (en) * | 2006-09-13 | 2015-12-01 | Kabushiki Kaisha Toshiba | Magnetic-resonance image diagnostic apparatus and method of controlling the same |
| US7573265B2 (en) * | 2007-10-23 | 2009-08-11 | Magnetic Resonance Innovations, Inc. | Complex threshold method for reducing noise in nuclear magnetic resonance images |
| US7782051B2 (en) * | 2008-04-18 | 2010-08-24 | Mr Innovations, Inc. | Geometry based field prediction method for susceptibility mapping and phase artifact removal |
| CN102077108B (zh) * | 2008-04-28 | 2015-02-25 | 康奈尔大学 | 分子mri中的磁敏度精确量化 |
| US8422756B2 (en) * | 2010-04-27 | 2013-04-16 | Magnetic Resonance Innovations, Inc. | Method of generating nuclear magnetic resonance images using susceptibility weighted imaging and susceptibility mapping (SWIM) |
| US9766316B2 (en) * | 2012-11-16 | 2017-09-19 | Hitachi, Ltd. | Magnetic resonance imaging device and quantitative susceptibility mapping method |
-
2012
- 2012-11-16 US US14/442,168 patent/US9766316B2/en active Active
- 2012-11-16 JP JP2014546796A patent/JP5902317B2/ja active Active
- 2012-11-16 WO PCT/JP2012/079728 patent/WO2014076808A1/ja not_active Ceased
Patent Citations (2)
| Publication number | Priority date | Publication date | Assignee | Title |
|---|---|---|---|---|
| WO2009081787A1 (ja) * | 2007-12-25 | 2009-07-02 | Hitachi Medical Corporation | 磁気共鳴イメージング装置及び磁化率強調画像撮影方法 |
| WO2010073923A1 (ja) * | 2008-12-26 | 2010-07-01 | 国立大学法人 熊本大学 | 位相差強調画像化法(Phase Difference Enhanced Imaging;PADRE)、機能画像作成法、位相差強調画像化プログラム、位相差強調画像化装置、機能画像作成装置および磁気共鳴画像化(Magnetic Resonance Imaging;MRI)装置 |
Non-Patent Citations (2)
| Title |
|---|
| F.SCHWESER ET AL.: "Feasibility of Brain Lesion Characterization at 1.5T . Whole-Brain Susceptibility Mapping Using A Homogeneous Lesion Constraint", PROC.INTL.SOC.MAGN.RES.MED., vol. 18, pages 5245 * |
| T.LIU ET AL.: "Quantitative Susceptibility Mapping: A comparison between COSMOS and weighted L1 regularization from single orientation", PROC.INTL.SOC.MAGN.RES.MED., vol. 18, pages 5116 * |
Cited By (20)
| Publication number | Priority date | Publication date | Assignee | Title |
|---|---|---|---|---|
| US11221386B2 (en) | 2014-09-05 | 2022-01-11 | Hyperfine, Inc. | Noise suppression methods and apparatus |
| JP2020121137A (ja) * | 2014-09-05 | 2020-08-13 | ハイパーファイン リサーチ,インコーポレイテッド | ノイズ抑制方法及び装置 |
| US11662412B2 (en) | 2014-09-05 | 2023-05-30 | Hyperfine Operations, Inc. | Noise suppression methods and apparatus |
| US12153113B2 (en) | 2014-09-05 | 2024-11-26 | Hyperfine Operations, Inc. | Automatic configuration of a low field magnetic resonance imaging system |
| WO2016076076A1 (ja) * | 2014-11-11 | 2016-05-19 | 株式会社日立メディコ | 磁気共鳴イメージング装置および定量的磁化率マッピング方法 |
| JPWO2016076076A1 (ja) * | 2014-11-11 | 2017-07-27 | 株式会社日立製作所 | 磁気共鳴イメージング装置、定量的磁化率マッピング方法、計算機、磁化率分布計算方法、及び、磁化率分布計算プログラム |
| CN107072592A (zh) * | 2014-11-11 | 2017-08-18 | 株式会社日立制作所 | 磁共振成像装置以及定量性磁化率匹配方法 |
| US10180474B2 (en) | 2014-11-11 | 2019-01-15 | Hitachi, Ltd. | Magnetic resonance imaging apparatus and quantitative magnetic susceptibility mapping method |
| JP2017080349A (ja) * | 2015-10-30 | 2017-05-18 | 東芝メディカルシステムズ株式会社 | 磁気共鳴イメージング及び医用画像処理装置 |
| US10204412B2 (en) | 2015-10-30 | 2019-02-12 | Toshiba Medical Systems Corporation | Magnetic resonance imaging apparatus, medical image processing device, and image processing method |
| JP2019504664A (ja) * | 2015-12-17 | 2019-02-21 | コーニンクレッカ フィリップス エヌ ヴェKoninklijke Philips N.V. | 定量的磁化率マッピング画像のセグメンテーション |
| US10605881B2 (en) | 2016-04-04 | 2020-03-31 | Hitachi, Ltd. | Magnetic resonance imaging apparatus and image processing method |
| WO2017175570A1 (ja) * | 2016-04-04 | 2017-10-12 | 株式会社日立製作所 | 磁気共鳴イメージング装置、及び、画像処理方法 |
| JP2017184935A (ja) * | 2016-04-04 | 2017-10-12 | 株式会社日立製作所 | 磁気共鳴イメージング装置、及び、画像処理方法 |
| US12050256B2 (en) | 2016-11-22 | 2024-07-30 | Hyperfine Operations, Inc. | Systems and methods for automated detection in magnetic resonance images |
| US11841408B2 (en) | 2016-11-22 | 2023-12-12 | Hyperfine Operations, Inc. | Electromagnetic shielding for magnetic resonance imaging methods and apparatus |
| JP2019047978A (ja) * | 2017-09-11 | 2019-03-28 | 株式会社日立製作所 | 磁気共鳴イメージング装置 |
| US11051695B2 (en) | 2017-09-11 | 2021-07-06 | Hitachi, Ltd. | Magnetic resonance imaging apparatus |
| WO2019049443A1 (ja) * | 2017-09-11 | 2019-03-14 | 株式会社日立製作所 | 磁気共鳴イメージング装置 |
| US11510588B2 (en) | 2019-11-27 | 2022-11-29 | Hyperfine Operations, Inc. | Techniques for noise suppression in an environment of a magnetic resonance imaging system |
Also Published As
| Publication number | Publication date |
|---|---|
| US9766316B2 (en) | 2017-09-19 |
| JP5902317B2 (ja) | 2016-04-13 |
| JPWO2014076808A1 (ja) | 2016-09-08 |
| US20150338492A1 (en) | 2015-11-26 |
Similar Documents
| Publication | Publication Date | Title |
|---|---|---|
| JP5902317B2 (ja) | 磁気共鳴イメージング装置および定量的磁化率マッピング法 | |
| JP5843876B2 (ja) | 磁気共鳴イメージング装置および磁化率強調画像生成方法 | |
| JP6289664B2 (ja) | 磁気共鳴イメージング装置、定量的磁化率マッピング方法、計算機、磁化率分布計算方法、及び、磁化率分布計算プログラム | |
| JP6085545B2 (ja) | 磁気共鳴イメージング装置、画像処理装置および磁化率画像算出方法 | |
| JP5982494B2 (ja) | 磁気共鳴イメージング装置 | |
| JP6595393B2 (ja) | 磁気共鳴イメージング装置、及び、画像処理方法 | |
| JP7140606B2 (ja) | 画像処理装置、画像処理方法、画像処理プログラム及び磁気共鳴イメージング装置 | |
| JP6679467B2 (ja) | 磁気共鳴イメージング装置および酸素摂取率算出方法 | |
| JP6568760B2 (ja) | 磁気共鳴イメージング装置、および、画像処理装置 | |
| JP6533571B2 (ja) | 磁気共鳴イメージング装置及び画像作成方法 | |
| WO2019000348A1 (en) | SYSTEM AND METHOD FOR ACCELERATING MAGNETIC RESONANCE IMAGING | |
| JP6608764B2 (ja) | 磁気共鳴イメージング装置、磁気共鳴イメージング方法及び磁化率算出プログラム | |
| JP7230149B2 (ja) | 磁気共鳴イメージングで得た画像の処理方法、画像処理プロブラム、及び、計算機 | |
| JP7321703B2 (ja) | 画像処理装置、及び、磁気共鳴イメージング装置 | |
| JP7280997B2 (ja) | 画像処理装置及び磁気共鳴イメージング装置 | |
| Kaaouana et al. | Phase contrast MRI for discriminating brain microbleed in a multicentre clinical study | |
| WO2019102658A1 (ja) | 画像処理装置、画像処理方法、画像処理プログラム及び磁気共鳴イメージング装置 |
Legal Events
| Date | Code | Title | Description |
|---|---|---|---|
| 121 | Ep: the epo has been informed by wipo that ep was designated in this application |
Ref document number: 12888602 Country of ref document: EP Kind code of ref document: A1 |
|
| ENP | Entry into the national phase |
Ref document number: 2014546796 Country of ref document: JP Kind code of ref document: A |
|
| WWE | Wipo information: entry into national phase |
Ref document number: 14442168 Country of ref document: US |
|
| NENP | Non-entry into the national phase |
Ref country code: DE |
|
| 122 | Ep: pct application non-entry in european phase |
Ref document number: 12888602 Country of ref document: EP Kind code of ref document: A1 |