WO2014076789A1 - Analysis region setting device - Google Patents
Analysis region setting device Download PDFInfo
- Publication number
- WO2014076789A1 WO2014076789A1 PCT/JP2012/079617 JP2012079617W WO2014076789A1 WO 2014076789 A1 WO2014076789 A1 WO 2014076789A1 JP 2012079617 W JP2012079617 W JP 2012079617W WO 2014076789 A1 WO2014076789 A1 WO 2014076789A1
- Authority
- WO
- WIPO (PCT)
- Prior art keywords
- region
- image
- area
- feature amount
- range
- Prior art date
Links
- 238000004458 analytical method Methods 0.000 title claims abstract description 56
- 238000000605 extraction Methods 0.000 claims description 3
- 238000000034 method Methods 0.000 description 12
- 230000003287 optical effect Effects 0.000 description 7
- 238000005259 measurement Methods 0.000 description 4
- 238000004364 calculation method Methods 0.000 description 3
- 238000010586 diagram Methods 0.000 description 3
- 238000001228 spectrum Methods 0.000 description 3
- 238000001514 detection method Methods 0.000 description 2
- 238000002835 absorbance Methods 0.000 description 1
- 238000010521 absorption reaction Methods 0.000 description 1
- 238000000862 absorption spectrum Methods 0.000 description 1
- 230000000903 blocking effect Effects 0.000 description 1
- 239000003086 colorant Substances 0.000 description 1
- 230000003247 decreasing effect Effects 0.000 description 1
- 230000007812 deficiency Effects 0.000 description 1
- 239000000284 extract Substances 0.000 description 1
- 230000002452 interceptive effect Effects 0.000 description 1
- 230000001678 irradiating effect Effects 0.000 description 1
- 238000004930 micro-infrared spectroscopy Methods 0.000 description 1
- 238000005457 optimization Methods 0.000 description 1
- 238000000513 principal component analysis Methods 0.000 description 1
- 238000004611 spectroscopical analysis Methods 0.000 description 1
- 239000000126 substance Substances 0.000 description 1
Images


Classifications
-
- G—PHYSICS
- G01—MEASURING; TESTING
- G01N—INVESTIGATING OR ANALYSING MATERIALS BY DETERMINING THEIR CHEMICAL OR PHYSICAL PROPERTIES
- G01N21/00—Investigating or analysing materials by the use of optical means, i.e. using sub-millimetre waves, infrared, visible or ultraviolet light
- G01N21/17—Systems in which incident light is modified in accordance with the properties of the material investigated
- G01N21/25—Colour; Spectral properties, i.e. comparison of effect of material on the light at two or more different wavelengths or wavelength bands
- G01N21/31—Investigating relative effect of material at wavelengths characteristic of specific elements or molecules, e.g. atomic absorption spectrometry
- G01N21/35—Investigating relative effect of material at wavelengths characteristic of specific elements or molecules, e.g. atomic absorption spectrometry using infrared light
- G01N21/3563—Investigating relative effect of material at wavelengths characteristic of specific elements or molecules, e.g. atomic absorption spectrometry using infrared light for analysing solids; Preparation of samples therefor
-
- G—PHYSICS
- G02—OPTICS
- G02B—OPTICAL ELEMENTS, SYSTEMS OR APPARATUS
- G02B21/00—Microscopes
- G02B21/36—Microscopes arranged for photographic purposes or projection purposes or digital imaging or video purposes including associated control and data processing arrangements
-
- G—PHYSICS
- G01—MEASURING; TESTING
- G01J—MEASUREMENT OF INTENSITY, VELOCITY, SPECTRAL CONTENT, POLARISATION, PHASE OR PULSE CHARACTERISTICS OF INFRARED, VISIBLE OR ULTRAVIOLET LIGHT; COLORIMETRY; RADIATION PYROMETRY
- G01J3/00—Spectrometry; Spectrophotometry; Monochromators; Measuring colours
- G01J3/02—Details
- G01J3/0205—Optical elements not provided otherwise, e.g. optical manifolds, diffusers, windows
- G01J3/0248—Optical elements not provided otherwise, e.g. optical manifolds, diffusers, windows using a sighting port, e.g. camera or human eye
-
- G—PHYSICS
- G01—MEASURING; TESTING
- G01J—MEASUREMENT OF INTENSITY, VELOCITY, SPECTRAL CONTENT, POLARISATION, PHASE OR PULSE CHARACTERISTICS OF INFRARED, VISIBLE OR ULTRAVIOLET LIGHT; COLORIMETRY; RADIATION PYROMETRY
- G01J3/00—Spectrometry; Spectrophotometry; Monochromators; Measuring colours
- G01J3/28—Investigating the spectrum
- G01J3/45—Interferometric spectrometry
- G01J3/453—Interferometric spectrometry by correlation of the amplitudes
-
- G—PHYSICS
- G02—OPTICS
- G02B—OPTICAL ELEMENTS, SYSTEMS OR APPARATUS
- G02B21/00—Microscopes
- G02B21/36—Microscopes arranged for photographic purposes or projection purposes or digital imaging or video purposes including associated control and data processing arrangements
- G02B21/365—Control or image processing arrangements for digital or video microscopes
-
- G—PHYSICS
- G01—MEASURING; TESTING
- G01N—INVESTIGATING OR ANALYSING MATERIALS BY DETERMINING THEIR CHEMICAL OR PHYSICAL PROPERTIES
- G01N21/00—Investigating or analysing materials by the use of optical means, i.e. using sub-millimetre waves, infrared, visible or ultraviolet light
- G01N21/17—Systems in which incident light is modified in accordance with the properties of the material investigated
- G01N21/25—Colour; Spectral properties, i.e. comparison of effect of material on the light at two or more different wavelengths or wavelength bands
- G01N21/31—Investigating relative effect of material at wavelengths characteristic of specific elements or molecules, e.g. atomic absorption spectrometry
- G01N21/35—Investigating relative effect of material at wavelengths characteristic of specific elements or molecules, e.g. atomic absorption spectrometry using infrared light
- G01N2021/3595—Investigating relative effect of material at wavelengths characteristic of specific elements or molecules, e.g. atomic absorption spectrometry using infrared light using FTIR
Definitions
- the present invention relates to an apparatus for setting an analysis target region in an observation image of a sample acquired by an observation optical system such as an optical microscope.
- the microspectroscopic analyzer is an apparatus including an observation optical system for microscopically observing a sample surface and an analysis system for performing spectroscopic analysis on a portion of interest in the observed region.
- an irradiation optical system that irradiates a sample with infrared light as the analysis system, and reflected or transmitted light of infrared light that is irradiated onto the sample.
- An aperture having an opening (generally a rectangular opening) for allowing only light from a specific region (region of interest) in which the user is interested to pass, and reflected light or transmitted light that has passed through the opening
- an infrared detector for detecting.
- the microinfrared spectroscopy analyzer is simply referred to as an infrared microscope.
- a visible light observation image of the sample surface is acquired by the observation optical system, and the position, size, and orientation (angle) of the aperture opening are adjusted from the visible light observation image according to the region of interest. specify.
- infrared light is irradiated by the irradiation optical system, and light that has passed through the opening is detected by the detector from the reflected light or transmitted light.
- the region of interest is analyzed from the infrared light spectrum (wavelength intensity distribution) thus obtained.
- the position, size, and orientation of the aperture opening are accurately adjusted so that the area of the opening in the region of interest is as large as possible while blocking infrared light from outside the region of interest. It is important to specify.
- a user views an observation image and designates the position, size, and orientation of the aperture opening with a pointing device such as a mouse.
- a pointing device such as a mouse.
- the region of interest has a complicated shape, it has been difficult to accurately specify these so as to satisfy the above-described conditions.
- Patent Document 1 discloses red for extracting an area having characteristic image information (hereinafter referred to as “characteristic image area”) by performing processing such as edge extraction and binarization on an observation image of a sample.
- Characteristic image area an area having characteristic image information
- An outer microscope is described.
- an analysis apparatus including an apparatus for extracting a feature image region from an observation image, for example, when a user designates an appropriate position in the observation image with a pointing device or the like, based on, for example, a luminance value at the designated position, the An area having a luminance value in a predetermined range centering on the luminance value is extracted (Patent Document 2), or an area surrounded by an edge including a designated position is extracted.
- an infrared microscope that automatically sets the position, size, and orientation of the aperture opening for the extracted feature image area by calculation such as optimization.
- the region of interest in the observation image in which the user is interested is extracted as a feature image region by the above processing
- the above processing may erroneously include a shadow caused by the unevenness in the feature image area.
- the feature image region is extracted larger than the region of interest.
- the threshold value for example, the above-mentioned “predetermined range”
- the feature image area is set smaller than the region of interest, and the aperture opening is automatically set accordingly. As a result, the S / N ratio of the analysis data is lowered.
- analysis target region a region to be analyzed by the user
- the problem to be solved by the present invention is based on the observation image of the sample obtained with an optical microscope or the like, and when setting the analysis target area therein, it does not require complicated work and can be performed quickly and as intended by the user.
- An object of the present invention is to provide an apparatus capable of accurately setting an analysis target region.
- an apparatus for setting an analysis target area that is an area to be analyzed by an analysis apparatus A feature amount calculating means for dividing the observation image into a plurality of regions and calculating a predetermined image feature amount in each of the divided regions; A plurality of divided areas, a divided area designating means for allowing a user to designate the divided areas; A feature amount range calculating means for determining a range of image feature amounts of the divided regions to be extracted as the analysis target region from the image feature amounts of the divided regions specified by the divided region specifying means; Area extraction means for extracting a divided area having an image feature amount within the range from the observed image; It is characterized by providing.
- the analysis target region setting apparatus divides an observation image into a number of regions (divided regions) by the feature amount calculation means, and a predetermined image feature amount (hereinafter referred to as “feature amount”) for each divided region. ) To get.
- the divided area of the present invention may be one pixel which is the minimum unit of the observation image, or a group of a plurality of adjacent pixels may be used as one divided area.
- As the feature amount for example, a pixel feature amount or a texture feature amount described later can be used.
- the feature amount used in the present invention may be one type or plural types. These are set in advance by the user or the manufacturer of the apparatus.
- the user designates a part of a region (region of interest) to be analyzed in the observation image by drawing a point, a line, a surface or the like with a mouse or the like (divided region designation means).
- a plurality of divided regions hereinafter referred to as “representative designated region group”.
- the feature amount range calculation means determines the feature amount range of the divided region to be extracted as the analysis target from the feature amount of the representative designated region group.
- the range of the feature amount for example, a method of statistically processing the feature amount of the representative designated region group and determining the range so as to include most (or all) of the feature amount can be used.
- the region extracting means determines whether or not each feature amount is within the range for all the divided regions in the observation image, and the divided region where the feature amount is within the range. To extract.
- the divided areas extracted in this way are set as analysis target areas.
- the observation image of the sample is divided into a number of divided regions, and the user is allowed to designate a plurality of divided regions (representative designated region group) from among them. This designation only needs to be a typical partial area. Then, a range to be set as the analysis target region is calculated from the feature amount data of the representative designated region group, a divided region having the feature amount within the range is extracted from the observation image, and is set as the analysis target region. With this configuration, it is possible to set the analysis target region quickly and accurately (without excess or deficiency) as compared with the case of setting only manually or automatically.
- the block diagram of the principal part of the infrared microscope which is one Example of this invention.
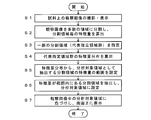
- the flowchart which shows the procedure of the setting of the analysis object area
- Explanatory drawing which shows the luminance distribution of a representative designation
- Explanatory drawing which shows the luminance distribution of the representative designation
- FIG. 1 is a configuration diagram of a main part of the infrared microscope of the present embodiment.
- an infrared interferometer 1 includes an infrared light source, a fixed mirror, a movable mirror, a beam splitter, and the like, and emits infrared interference light obtained by interfering with infrared light having different wavelengths.
- This infrared interference light is reflected by the half mirror 4 and applied to the sample 3 placed on the movable stage 2.
- the infrared interference light irradiated on the sample 3 is reflected on the surface, the infrared light is absorbed at a wavelength (generally a plurality of wavelengths) specific to the substance present at that location.
- Infrared light reflected from the sample 3 passes through the half mirror 4, is limited to only reflected light from a specific region by the aperture 5, enters the infrared detector 7 through the reflection mirror 6, and is detected. The Therefore, the infrared interference light reaching the infrared detector 7 reflects infrared absorption in a specific region in the sample 3.
- a detection signal from the infrared detector 7 is input to the data processing unit 10, and in the data processing unit 10, the Fourier transform operation unit 100 performs a Fourier transform process on the detection signal, thereby indicating red light that indicates absorbance in a predetermined wavelength range.
- An external absorption spectrum is obtained.
- the spectrum data obtained in this way is sent to the control unit 11 and displayed on the screen of the display unit 13 connected to the control unit 11.
- visible light emitted from the visible light source 8 hits a wide range on the sample 3, and visible reflected light from the sample 3 is introduced into the CCD camera 9.
- the CCD camera 9 creates an observation image of the surface of the sample 3 and sends the observation image data to the control unit 11.
- the observation image data sent to the control unit 11 is displayed on the screen of the display unit 13 like the spectrum data.
- the region irradiated with the infrared interference light can be changed by the control unit 11 appropriately controlling the movable stage 2 and the aperture 5.
- the control unit 11 also controls the operation of each unit such as the infrared interferometer 1 and the visible light source 8.
- the data processing unit 10 and the control unit 11 can achieve various functions as will be described later by executing dedicated control / data processing software installed in the personal computer in advance on the computer.
- FIG. 1 performs reflected infrared measurement and reflected visible observation, but can be configured to perform transmitted infrared measurement or can be changed to a configuration that performs transmitted visible observation.
- a mechanism that allows the user to observe the sample surface directly visually using an eyepiece may be incorporated.
- the procedure for setting the analysis target region from the observation image of the sample in the infrared microscope of this embodiment will be described with reference to the flowchart of FIG.
- the sample 3 to be measured is placed on the movable stage 2
- a visible image of the sample 3 is taken by the CCD camera 9, and the acquired image data is sent to the control unit 11, as shown in FIG.
- An observation image is displayed on the screen of the display unit 13 (step S1).
- the control unit 11 also divides this observation image into a plurality of (M ⁇ N in the figure) regions as shown in FIG. 4 and calculates the feature amount of each divided region (step S2).
- the divided area may be set for each pixel, or a plurality of adjacent pixels may be set as one divided area.
- a pixel feature amount or a texture feature amount can be used.
- the pixel feature amount is image information such as luminance, color, and saturation that each pixel has.
- a texture feature value is a numerical expression of the elements that make up a texture, such as points, lines, and roughness. Edges can be detected using a local histogram (the histogram of the area of interest and its surrounding areas), a secondary Sobel filter, etc. It is calculated using a histogram or the like of the extracted image. Since the texture feature amount generally includes a large amount of information, the dimension may be appropriately reduced by principal component analysis or the like for speeding up. In addition, any general feature amount used in image processing can be used.
- the feature amount data for each divided region calculated in step S2 is stored in a storage unit (not shown).
- the user uses the input unit 12 such as a mouse connected to the control unit 11 to display a representative partial region (representative designated region group) in the observation image displayed on the screen of the display unit 13. Is designated (step S3).
- FIG. 5 shows an example in which the user designates the representative designated region group by drawing a line 21 on the observation image.
- the control unit 11 determines all the divided areas including the line 21 as a representative designated area group (FIG. 6).
- the control unit 11 reads each feature amount of the representative designated region group designated by the user from the storage unit, and calculates the distribution (step S4, FIG. 7).
- FIG. 7 shows a one-dimensional distribution (luminance distribution) of the representative designated region group when only the luminance value is used as the feature amount for the sake of simplicity.
- step S5 the range of the feature amount of the divided area to be extracted as the measurement target area is determined for the distribution calculated in step S4.
- the average of the luminance distribution and the standard deviation ⁇ are obtained, and the range of ⁇ 3 ⁇ from the average is the range of luminance values to be extracted as the measurement target region.
- step S4 when a multi-peak distribution having a plurality of peaks as shown in FIG. 7B is obtained, k pieces (2 pieces in the example of FIG. 7B) are obtained by a technique such as k-means.
- the range of luminance values may be obtained by the above method for each distribution.
- step S6 the feature amounts of all the divided regions are read from the storage unit, and it is determined whether or not the feature amounts of the respective divided regions are within the range calculated in step S5. Then, a divided area having a feature amount within the range is extracted and set as an analysis target area.
- the control unit 11 colors the analysis target area in the observation image displayed on the screen of the display unit 13 (step S7, FIG. 8). The user views the image in FIG. 8 and ends the process if the analysis target area is set as intended. If the analysis target area is not set as intended, the representative designated area group is increased or decreased as appropriate.
- step S7 when the area
- control unit 11 adjusts the size of the opening of the aperture 5 and the position of the sample 3 on the movable stage 2 with respect to the analysis target region obtained by the above processing. Then, the analysis of the analysis target region is performed by irradiating the infrared interference light from the infrared interferometer.
- the range calculated in step S5 is within ⁇ 3 ⁇ from the average of the luminance distribution, but the user may appropriately determine the range based on the distribution calculated in step S4.
- the user extracts the analysis target region by setting the representative designated region group in the region of interest.
- the analysis target region can be extracted by a different method. Specifically, this is a method in which a representative designated region group is once set in a region other than the region of interest “other”, and on the contrary, a range that does not include the representative designated region group is extracted as an analysis target region. . This method will be described below with reference to FIGS.
- a lump 23 is the region of interest of the user.
- the user once draws a line 22 in a region other than the region of interest (lumps) 23 “other” and sets a representative designated region group (step S3).
- the obtained feature quantity distribution luminance distribution
- FIG. 10 step S4
- the luminance distribution of the representative designated region group in FIG. 10 does not include the luminance distribution of the region of interest 23. Therefore, conversely, in step S5, the range of the divided region to be extracted as the analysis target region is set so as not to include the luminance distribution of the representative designated region group (in FIG. 10, a range of ⁇ 6 ⁇ or more from the average).
- FIG. 11 is a diagram showing the analysis target region in the observation image set by this method.
- the control unit 11 automatically sets the position and size of the opening of the aperture 5 in the clicked region.
- the line 22 is a closed curve and there is an extracted area inside the curve, only the area in the closed curve is automatically set as the analysis target area, You may make it set automatically the position and size of the opening of the aperture 5 in the area
- region You may make it set automatically the position and size of the opening of the aperture 5 in the area
- this invention is applicable also to a microspectroscopic analyzer other than an infrared microscope, a microscopic mass spectrometer, etc.
Abstract
Description
近年では、このように抽出された特徴画像領域に対して更に、アパーチャの開口の位置、大きさ及び向きを、最適化等の計算により自動的に設定する赤外顕微鏡が提供されている。これらの自動化により、ユーザは、アパーチャの開口の位置、大きさ及び向きの設定を迅速に行うことができる。 On the other hand,
In recent years, there has been provided an infrared microscope that automatically sets the position, size, and orientation of the aperture opening for the extracted feature image area by calculation such as optimization. These automations allow the user to quickly set the position, size and orientation of the aperture opening.
一方、このような誤指定を避けるために閾値(例えば上記の「所定範囲」)の設定を調整すると、逆に特徴画像領域が関心領域よりも小さく設定され、それに伴い自動的にアパーチャの開口も小さく設定されてしまい、分析データのS/N比が低下する。
以上のような問題は、赤外顕微鏡に限らず、試料の観察画像に基づき、その中にユーザが分析対象とする領域(以下、「分析対象領域」とする)を設定し、該分析対象領域の分析を行う分析装置において一般的に生じる。 When the region of interest in the observation image in which the user is interested is extracted as a feature image region by the above processing, the following problems arise. For example, if the surface of the sample has three-dimensional unevenness, the above processing may erroneously include a shadow caused by the unevenness in the feature image area. Then, the feature image region is extracted larger than the region of interest.
On the other hand, if the threshold value (for example, the above-mentioned “predetermined range”) is adjusted in order to avoid such erroneous specification, the feature image area is set smaller than the region of interest, and the aperture opening is automatically set accordingly. As a result, the S / N ratio of the analysis data is lowered.
The above problems are not limited to the infrared microscope, and based on the observation image of the sample, a region to be analyzed by the user (hereinafter referred to as “analysis target region”) is set therein, and the analysis target region It generally occurs in an analyzer that performs the analysis of
試料の観察画像中に、分析装置により分析を行う領域である分析対象領域を設定する装置であって、
前記観察画像を複数の領域に分割し、各分割領域における所定の画像特徴量を算出する特徴量算出手段と、
前記分割領域を複数、ユーザに指定させる分割領域指定手段と、
前記分割領域指定手段により指定された各分割領域の画像特徴量から、前記分析対象領域として抽出する分割領域の画像特徴量の範囲を定める特徴量範囲算出手段と、
前記観察画像より、画像特徴量が前記範囲内にある分割領域を抽出する領域抽出手段と、
を備えることを特徴とする。 The present invention made to solve the above problems
In the observation image of the sample, an apparatus for setting an analysis target area that is an area to be analyzed by an analysis apparatus,
A feature amount calculating means for dividing the observation image into a plurality of regions and calculating a predetermined image feature amount in each of the divided regions;
A plurality of divided areas, a divided area designating means for allowing a user to designate the divided areas;
A feature amount range calculating means for determining a range of image feature amounts of the divided regions to be extracted as the analysis target region from the image feature amounts of the divided regions specified by the divided region specifying means;
Area extraction means for extracting a divided area having an image feature amount within the range from the observed image;
It is characterized by providing.
こうして範囲を定めた後、領域抽出手段は、観察画像中の全分割領域に対して、各々の特徴量が前記範囲内にあるか否かを判定し、特徴量が該範囲内にある分割領域を抽出する。このようにして抽出された分割領域が、分析対象領域として設定される。 The feature amount range calculation means determines the feature amount range of the divided region to be extracted as the analysis target from the feature amount of the representative designated region group. As the range of the feature amount, for example, a method of statistically processing the feature amount of the representative designated region group and determining the range so as to include most (or all) of the feature amount can be used.
After determining the range in this way, the region extracting means determines whether or not each feature amount is within the range for all the divided regions in the observation image, and the divided region where the feature amount is within the range. To extract. The divided areas extracted in this way are set as analysis target areas.
可動ステージ2上に測定対象の試料3が載置されると、まずCCDカメラ9により試料3の可視画像が撮影され、取得された画像データが制御部11に送られ、図3に示すような観察画像が、表示部13の画面上に表示される(ステップS1)。制御部11はまた、この観察画像を、図4に示すように複数の(図ではM×N個の)領域に分割し、各分割領域の特徴量を算出する(ステップS2)。分割領域はピクセル毎としても良いし、隣接する複数のピクセルを1分割領域としても良い。
また、ここで算出する特徴量には、ピクセル特徴量やテクスチャ特徴量を用いることができる。ピクセル特徴量とは、各ピクセルが有する輝度・色・彩度等の画像情報である。テクスチャ特徴量とは、点、線、ざらつき等のテクスチャを構成する要素を数値化したものであり、局所ヒストグラム(注目した領域とその周辺領域のヒストグラム)や、2次ソーベルフィルタ等によりエッジを抽出した画像のヒストグラム等を用いて算出される。なお、テクスチャ特徴量は一般的に多量の情報を含むため、高速化のために、主成分分析等により適宜、次元の削減を行っても良い。この他にも、画像処理で用いられる一般的な特徴量であれば用いることができる。
ステップS2で算出された分割領域毎の特徴量データは、図示しない記憶部に格納される。 Next, the procedure for setting the analysis target region from the observation image of the sample in the infrared microscope of this embodiment will be described with reference to the flowchart of FIG.
When the sample 3 to be measured is placed on the
In addition, as the feature amount calculated here, a pixel feature amount or a texture feature amount can be used. The pixel feature amount is image information such as luminance, color, and saturation that each pixel has. A texture feature value is a numerical expression of the elements that make up a texture, such as points, lines, and roughness. Edges can be detected using a local histogram (the histogram of the area of interest and its surrounding areas), a secondary Sobel filter, etc. It is calculated using a histogram or the like of the extracted image. Since the texture feature amount generally includes a large amount of information, the dimension may be appropriately reduced by principal component analysis or the like for speeding up. In addition, any general feature amount used in image processing can be used.
The feature amount data for each divided region calculated in step S2 is stored in a storage unit (not shown).
2…可動ステージ
3…試料
4…ハーフミラー
5…アパーチャ
6…反射ミラー
7…赤外検出器
8…可視光源
9…CCDカメラ
10…データ処理部
100…フーリエ変換演算部
11…制御部
12…入力部
13…表示部
21、22…線
23…関心領域(塊) DESCRIPTION OF
Claims (3)
- 試料の観察画像中に、分析装置により分析を行う領域である分析対象領域を設定する装置であって、
前記観察画像を複数の領域に分割し、各分割領域における所定の画像特徴量を算出する特徴量算出手段と、
前記分割領域を複数、ユーザに指定させる分割領域指定手段と、
前記分割領域指定手段により指定された各分割領域の画像特徴量から、前記分析対象領域として抽出する分割領域の画像特徴量の範囲を定める特徴量範囲算出手段と、
前記観察画像より、画像特徴量が前記範囲内にある分割領域を抽出する領域抽出手段と、
を備えることを特徴とする分析対象領域設定装置。 In the observation image of the sample, an apparatus for setting an analysis target area that is an area to be analyzed by an analysis apparatus,
A feature amount calculating means for dividing the observation image into a plurality of regions and calculating a predetermined image feature amount in each of the divided regions;
A plurality of divided areas, divided area designating means for allowing the user to designate;
A feature amount range calculating means for determining a range of image feature amounts of the divided regions to be extracted as the analysis target region from the image feature amounts of the divided regions specified by the divided region specifying means;
Area extraction means for extracting a divided area having an image feature amount within the range from the observed image;
An analysis target region setting device comprising: - 前記範囲が、前記ユーザに指定された全て又は一部の分割領域の画像特徴量を含むように設定されることを特徴とする請求項1に記載の分析対象領域設定装置。 2. The analysis target region setting apparatus according to claim 1, wherein the range is set so as to include image feature amounts of all or a part of divided regions designated by the user.
- 前記範囲が、前記ユーザに指定された分割領域の画像特徴量を全て含まないように設定されることを特徴とする請求項1に記載の分析対象領域設定装置。 2. The analysis target region setting apparatus according to claim 1, wherein the range is set so as not to include all image feature amounts of the divided regions designated by the user.
Priority Applications (5)
| Application Number | Priority Date | Filing Date | Title |
|---|---|---|---|
| US14/442,812 US20150301323A1 (en) | 2012-11-15 | 2012-11-15 | System for setting analysis target region |
| JP2014546779A JP5900644B2 (en) | 2012-11-15 | 2012-11-15 | Analysis area setting device |
| PCT/JP2012/079617 WO2014076789A1 (en) | 2012-11-15 | 2012-11-15 | Analysis region setting device |
| EP12888367.5A EP2921843A4 (en) | 2012-11-15 | 2012-11-15 | Analysis region setting device |
| US16/292,613 US20190196170A1 (en) | 2012-11-15 | 2019-03-05 | Method for setting analysis target region by extracting, from an observed image divisional areas having a value of image characteristic quantity within a value range |
Applications Claiming Priority (1)
| Application Number | Priority Date | Filing Date | Title |
|---|---|---|---|
| PCT/JP2012/079617 WO2014076789A1 (en) | 2012-11-15 | 2012-11-15 | Analysis region setting device |
Related Child Applications (2)
| Application Number | Title | Priority Date | Filing Date |
|---|---|---|---|
| US14/442,812 A-371-Of-International US20150301323A1 (en) | 2012-11-15 | 2012-11-15 | System for setting analysis target region |
| US16/292,613 Division US20190196170A1 (en) | 2012-11-15 | 2019-03-05 | Method for setting analysis target region by extracting, from an observed image divisional areas having a value of image characteristic quantity within a value range |
Publications (1)
| Publication Number | Publication Date |
|---|---|
| WO2014076789A1 true WO2014076789A1 (en) | 2014-05-22 |
Family
ID=50730729
Family Applications (1)
| Application Number | Title | Priority Date | Filing Date |
|---|---|---|---|
| PCT/JP2012/079617 WO2014076789A1 (en) | 2012-11-15 | 2012-11-15 | Analysis region setting device |
Country Status (4)
| Country | Link |
|---|---|
| US (2) | US20150301323A1 (en) |
| EP (1) | EP2921843A4 (en) |
| JP (1) | JP5900644B2 (en) |
| WO (1) | WO2014076789A1 (en) |
Cited By (5)
| Publication number | Priority date | Publication date | Assignee | Title |
|---|---|---|---|---|
| JP2016140388A (en) * | 2015-01-30 | 2016-08-08 | 株式会社ニデック | Ocular fundus imaging apparatus |
| WO2016185755A1 (en) * | 2015-05-15 | 2016-11-24 | ソニー株式会社 | Information processing device, information processing system, and information processing method |
| WO2019186965A1 (en) * | 2018-03-29 | 2019-10-03 | 株式会社島津製作所 | Data processing method and data processing program in imaging mass analysis |
| WO2019186999A1 (en) | 2018-03-30 | 2019-10-03 | 株式会社島津製作所 | Imaging data processing unit and imaging data processing program |
| JP2020504289A (en) * | 2016-10-20 | 2020-02-06 | オプティナ ダイアグノスティクス,インコーポレイテッド | Method and system for detecting abnormalities in biological tissue |
Families Citing this family (2)
| Publication number | Priority date | Publication date | Assignee | Title |
|---|---|---|---|---|
| JP5983858B2 (en) * | 2013-03-08 | 2016-09-06 | 株式会社島津製作所 | Analysis area setting device |
| US20180045937A1 (en) * | 2016-08-10 | 2018-02-15 | Zeta Instruments, Inc. | Automated 3-d measurement |
Citations (4)
| Publication number | Priority date | Publication date | Assignee | Title |
|---|---|---|---|---|
| JPH1096691A (en) * | 1991-03-19 | 1998-04-14 | Tokai Rika Co Ltd | Method and apparatus for analyzing plane |
| JP2007127485A (en) | 2005-11-02 | 2007-05-24 | Shimadzu Corp | Imaging mass spectrometer |
| JP2007183980A (en) * | 2007-02-13 | 2007-07-19 | Fujitsu Ltd | Data setting device |
| JP2010276371A (en) | 2009-05-26 | 2010-12-09 | Shimadzu Corp | Infrared microscope |
Family Cites Families (6)
| Publication number | Priority date | Publication date | Assignee | Title |
|---|---|---|---|---|
| US6136540A (en) * | 1994-10-03 | 2000-10-24 | Ikonisys Inc. | Automated fluorescence in situ hybridization detection of genetic abnormalities |
| US5706083A (en) * | 1995-12-21 | 1998-01-06 | Shimadzu Corporation | Spectrophotometer and its application to a colorimeter |
| US6011595A (en) * | 1997-09-19 | 2000-01-04 | Eastman Kodak Company | Method for segmenting a digital image into a foreground region and a key color region |
| US7272252B2 (en) * | 2002-06-12 | 2007-09-18 | Clarient, Inc. | Automated system for combining bright field and fluorescent microscopy |
| US7403646B2 (en) * | 2002-10-24 | 2008-07-22 | Canon Kabushiki Kaisha | Image processing apparatus, image processing method, program, and recording medium for generating a difference image from a first radiographic image and second radiographic image |
| EP2106536B1 (en) * | 2007-01-05 | 2015-08-12 | Malvern Instruments Incorporated | Spectrometric investigation of heterogeneity |
-
2012
- 2012-11-15 US US14/442,812 patent/US20150301323A1/en not_active Abandoned
- 2012-11-15 WO PCT/JP2012/079617 patent/WO2014076789A1/en active Application Filing
- 2012-11-15 JP JP2014546779A patent/JP5900644B2/en active Active
- 2012-11-15 EP EP12888367.5A patent/EP2921843A4/en not_active Ceased
-
2019
- 2019-03-05 US US16/292,613 patent/US20190196170A1/en not_active Abandoned
Patent Citations (4)
| Publication number | Priority date | Publication date | Assignee | Title |
|---|---|---|---|---|
| JPH1096691A (en) * | 1991-03-19 | 1998-04-14 | Tokai Rika Co Ltd | Method and apparatus for analyzing plane |
| JP2007127485A (en) | 2005-11-02 | 2007-05-24 | Shimadzu Corp | Imaging mass spectrometer |
| JP2007183980A (en) * | 2007-02-13 | 2007-07-19 | Fujitsu Ltd | Data setting device |
| JP2010276371A (en) | 2009-05-26 | 2010-12-09 | Shimadzu Corp | Infrared microscope |
Non-Patent Citations (1)
| Title |
|---|
| See also references of EP2921843A4 |
Cited By (10)
| Publication number | Priority date | Publication date | Assignee | Title |
|---|---|---|---|---|
| JP2016140388A (en) * | 2015-01-30 | 2016-08-08 | 株式会社ニデック | Ocular fundus imaging apparatus |
| WO2016185755A1 (en) * | 2015-05-15 | 2016-11-24 | ソニー株式会社 | Information processing device, information processing system, and information processing method |
| JP2016217789A (en) * | 2015-05-15 | 2016-12-22 | ソニー株式会社 | Information processor, information processing system and information processing method |
| JP2020504289A (en) * | 2016-10-20 | 2020-02-06 | オプティナ ダイアグノスティクス,インコーポレイテッド | Method and system for detecting abnormalities in biological tissue |
| US11769264B2 (en) | 2016-10-20 | 2023-09-26 | Optina Diagnostics Inc. | Method and system for imaging a biological tissue |
| WO2019186965A1 (en) * | 2018-03-29 | 2019-10-03 | 株式会社島津製作所 | Data processing method and data processing program in imaging mass analysis |
| JPWO2019186965A1 (en) * | 2018-03-29 | 2020-12-03 | 株式会社島津製作所 | Data processing methods and data processing programs in imaging mass spectrometry |
| WO2019186999A1 (en) | 2018-03-30 | 2019-10-03 | 株式会社島津製作所 | Imaging data processing unit and imaging data processing program |
| JPWO2019186999A1 (en) * | 2018-03-30 | 2020-12-03 | 株式会社島津製作所 | Imaging data processing equipment and imaging data processing program |
| US11636598B2 (en) | 2018-03-30 | 2023-04-25 | Shimadzu Corporation | Imaging data processing apparatus and imaging data processing program to perform image alignment by deforming images such that imaged observation target sites coincide |
Also Published As
| Publication number | Publication date |
|---|---|
| US20190196170A1 (en) | 2019-06-27 |
| EP2921843A1 (en) | 2015-09-23 |
| JPWO2014076789A1 (en) | 2016-09-08 |
| US20150301323A1 (en) | 2015-10-22 |
| JP5900644B2 (en) | 2016-04-06 |
| EP2921843A4 (en) | 2015-11-25 |
Similar Documents
| Publication | Publication Date | Title |
|---|---|---|
| JP5900644B2 (en) | Analysis area setting device | |
| US9092846B2 (en) | Detecting defects on a wafer using defect-specific and multi-channel information | |
| JP5507247B2 (en) | Spectroscopic microscopy with image-driven analysis | |
| JP2017519193A (en) | Apparatus and method for analyzing hair and / or for predicting the result of hair color treatment | |
| JP6896906B2 (en) | Spectral image data processing device and two-dimensional spectroscopic device | |
| US9558551B2 (en) | Image measurement apparatus and image measurement method for determining a proportion of positive cell nuclei among cell nuclei included in a pathologic examination specimen | |
| US8705698B2 (en) | X-ray analyzer and mapping method for an X-ray analysis | |
| JP2017203658A (en) | Inspection method and optical measurement device | |
| JP5983858B2 (en) | Analysis area setting device | |
| CN111344103A (en) | Coating area positioning method and device based on hyperspectral optical sensor and glue removing system | |
| WO2019150575A1 (en) | Imaging mass spectrometry data interpretation device | |
| JP6669189B2 (en) | Infrared microscope | |
| JP2016206060A (en) | Spectroscopic measurement device and spectroscopic measurement method | |
| JP2019060815A (en) | Automatic chemical image creation | |
| US11248962B2 (en) | Foreign matter analysis Method, storage medium storing foreign matter analysis program, and foreign matter analysis apparatus | |
| JP2015178986A (en) | infrared microscope | |
| JP2007192552A (en) | Spectral measuring instrument | |
| US9696203B2 (en) | Spectral data processing apparatus, spectral data processing method, and recording medium | |
| JP2017003499A (en) | Spectrometric device and spectrometric method | |
| CN115824982A (en) | Optical POCT color interpretation method, system and device |
Legal Events
| Date | Code | Title | Description |
|---|---|---|---|
| 121 | Ep: the epo has been informed by wipo that ep was designated in this application |
Ref document number: 12888367 Country of ref document: EP Kind code of ref document: A1 |
|
| ENP | Entry into the national phase |
Ref document number: 2014546779 Country of ref document: JP Kind code of ref document: A |
|
| WWE | Wipo information: entry into national phase |
Ref document number: 14442812 Country of ref document: US |
|
| NENP | Non-entry into the national phase |
Ref country code: DE |
|
| WWE | Wipo information: entry into national phase |
Ref document number: 2012888367 Country of ref document: EP |