일반적으로, 풍력발전단지의 경우 단지의 효율적이고 안정적인 운영이 매우 중요하며, 이를 위한 대표적인 핵심 운영 기술로는 SCADA(Supervisory Control and Data Acquisition) 시스템과 상태 감시 시스템(CMS : Condition Monitoring System)이 있다.In general, in the case of wind farms, efficient and stable operation of the complex is very important. Representative core operating technologies include a supervisory control and data acquisition (SCADA) system and a condition monitoring system (CMS).
풍력발전단지 운영을 위한 SCADA 시스템은 풍력터빈의 제어기(Controller)와 연계하여 원격으로 풍력터빈 제어 기능을 수행하고 풍력터빈 운영 성능을 분석 및 보고하기 위한 데이터 수집을 수행하는 컴퓨터 기반 시스템으로서, 크게 제어(Control), 모니터링(Monitoring), 분석(Analysis) 및 보고(Reporting) 기능을 수행한다. SCADA system for the operation of wind farms is a computer-based system that performs the control of wind turbines remotely and collects data to analyze and report the performance of wind turbines in conjunction with controllers of wind turbines. Performs Control, Monitoring, Analysis, and Reporting.
SCADA 시스템은 풍력단지의 전반적인 운영에 초점을 맞추어 개발되었기 때문에, 개별 터빈의 현재 운전 상태를 감시하는 데에 주안점을 두고 있다. 즉, SCADA 시스템은 각 풍력터빈 감시를 위하여 터빈의 운전 관련 정보 외에 각 구성요소의 대표 특성치, 특히 온도와 압력 값을 수집하여 분석하는데 주력하고 있다.Since the SCADA system was developed with a focus on the overall operation of the wind farm, the focus is on monitoring the current operating status of individual turbines. In other words, the SCADA system focuses on collecting and analyzing representative characteristic values of each component, especially temperature and pressure values, in addition to turbine operation information for monitoring each wind turbine.
이와 같이 SCADA 시스템은 터빈의 현재 운전 상태의 감시에 중점을 둔 반면, 상태 감시 시스템(CMS)은 풍력터빈 구성요소의 상태를 보다 면밀히 감시, 분석 및 예측함으로써, 풍력터빈의 이상 발생을 조기(早期)에 진단하여 고장을 사전에 예방하는데 목적을 두고 개발된 시스템으로서 풍력터빈의 신뢰성 및 경제성의 향상을 도모할 수 있다. As such, the SCADA system focuses on the monitoring of the turbine's current operating status, while the condition monitoring system (CMS) monitors, analyzes, and predicts the condition of wind turbine components more closely, thereby preventing the occurrence of wind turbine abnormalities. This system was developed for the purpose of diagnosing and preventing failures in advance and can improve the reliability and economic efficiency of wind turbines.
상태 감시 시스템은 그 감시 영역에 따라 크게 블레이드 상태 감시, 구성요소 진동 상태 감시 및 오일 상태 감시 기반 시스템으로 구분되며, 보다 다양하고 진보된 분석 기법을 활용하여 이상 여부를 사전에 진단한다. The condition monitoring system is divided into blade condition monitoring, component vibration condition monitoring, and oil condition monitoring based system according to its monitoring area, and diagnoses abnormality by using various advanced analysis techniques.
한편, 상태 감시 시스템도 SCADA 시스템과 마찬가지로 모니터링, 분석 및 보고 기능으로 나누어지나, 감시 대상 영역과 분석 및 예측 기법 차원에서 SCADA 시스템과 차별화된다.Like the SCADA system, the status monitoring system is divided into the monitoring, analysis, and reporting functions, but is different from the SCADA system in terms of monitoring area and analysis and prediction technique.
현재의 SCADA 시스템과 상태 감시 시스템은 전술한 바와 같이, 블레이드, 기어박스, 발전기 등과 같은 터빈 개별 구성요소의 이상 발생 여부를 감시하고, 이상 발생 영향의 예측 정도에 따라 알람 레벨(예컨대, Caution, Warning, Alarm)을 구분하여 알람 메시지를 발생시키고 있다. Current SCADA systems and condition monitoring systems, as described above, monitor the failure of individual turbine components, such as blades, gearboxes, generators, etc., and provide alarm levels (eg, Caution, Warning) depending on the predicted extent of the impact. , Alarm) is used to generate alarm messages.
하지만, 개별 구성요소 측면이 아니라 풍력터빈의 전체 시스템 측면에서 이상 여부를 판단하는 기법은 실제 SCADA 시스템이나 상태 감시 시스템에 아직 적용되고 있지 않다. However, the technique of determining anomalies not in terms of individual components but in terms of the overall system of the wind turbine is not yet applied to the actual SCADA system or the condition monitoring system.
풍속 입력에 대한 풍력터빈의 출력을 그래프로 나타낸 파워커브는 터빈 제작사에 의해 보증되어야 하는 풍력터빈의 공식적인 성능 보증 지표로서, 풍력터빈의 전체 시스템 측면에서 터빈 성능을 나타내는 대표적인 지표이다. The power curve that graphs the output of the wind turbine to the wind speed input is the official performance indicator of the wind turbine, which should be guaranteed by the turbine manufacturer, and is representative of the turbine performance in terms of the overall system of the wind turbine.
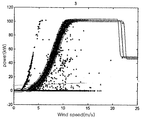
도 1은 일반적인 풍력발전의 파워터빈에서 나타나는 다양한 이상 발생 사례에 따른 파워커브의 유형을 각각 나타낸 도면이다. 1 is a view showing the types of power curves according to various abnormal cases appearing in a power turbine of a general wind power generation.
도 1에 도시된 바에 따르면, 다양한 이상 발생 사례에서 보이는 파워커브의 유형으로서, 이상 발생 시에는 정상적인 파워커브로부터 벗어나는 출력의 움직임이 나타나는 것을 알 수 있다. As shown in FIG. 1, it can be seen that as a type of power curve seen in various abnormal cases, an output movement deviating from the normal power curve appears when an abnormality occurs.
이러한 관찰 결과로부터 풍력터빈의 상태감시에 있어서 파워 커브를 기반으로 하는 모니터링 기법이 상태 감시 시스템과 동등하게 주목받고 있지만, 이와 같은 중요성에도 불구하고 파워커브 모니터링 기법에 관한 연구는 아직 활발하게 진행되고 있지 않다. Based on these observations, the monitoring method based on the power curve in the wind turbine condition monitoring has received the same attention as the condition monitoring system, but despite the importance, the research on the power curve monitoring technique is still active. not.
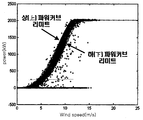
도 2는 종래의 파워커브 모니터링 기법에 따라 ISET에서 측정된 파워커브 리미트의 설정 사례를 나타낸 도면이다. 2 is a diagram illustrating an example of setting a power curve limit measured in ISET according to a conventional power curve monitoring technique.
도 2에 도시된 바와 같이, 독일의 ISET(Institute for Solar Energy Supply Technology)에서는 5분동안 측정된 출력의 평균값 데이터를 풍속 0.5m/s의 빈(Bin)으로 분류하고, 각 빈 별로 평균값과 표준편차를 구하여 알람 리미트를 설정하는 연구 사례가 있었다. As shown in FIG. 2, the German Institute for Solar Energy Supply Technology (IST) classifies the average value data of the output measured for 5 minutes into bins of 0.5m / s wind speed, and averages and standard values for each bin. There was a case study of setting the alarm limit by finding the deviation.
하지만, 상기 ISET에서 제안된 방법은 적용 대상으로 선정한 실속 제어(Stall-Control) 터빈에 적합하도록 정격 풍속(Rated Wind Speed) 이상에서 풍속이 높아질수록 상/하 리미트 간의 거리가 커지도록 설계되어 있어서, 현재 대형 풍력터빈의 주류를 이루고 있는 피치 제어(Pitch Control) 방식에는 적용이 어렵다.However, the method proposed by the ISET is designed to increase the distance between upper and lower limits as the wind speed increases above the rated wind speed so as to be suitable for a stall-control turbine selected as an application target. It is difficult to apply to the pitch control method that is the mainstream of large wind turbines.
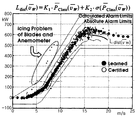
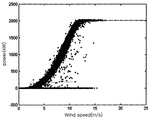
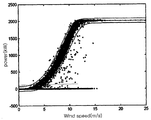
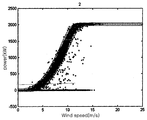
다음에, 도 3a 및 도 3b는 종래의 파워커브 모니터링 기법에 따라 인텔리젼트 시스템 연구소에서 측정된 파워커브 리미트의 설정 사례를 나타낸 도면이다. Next, FIGS. 3A and 3B are diagrams showing examples of setting power curve limits measured in an intelligent system lab according to a conventional power curve monitoring technique.
도 3a 및 도 3b에 도시된 바와 같이, 대표적인 파워커브 모니터링 기법으로는 미국 아이오와 대학교(University of Iowa)의 인텔리젼트 시스템 연구소(Intelligent Systems Lab(Andrew Kusiak 교수))에서 데이터 마이닝 알고리즘(Data Mining Algorithm)을 이용한 Non-Parametric 모델 기법으로 개발한 사례가 있다. As shown in FIGS. 3A and 3B, representative power curve monitoring techniques include a data mining algorithm at the Intelligent Systems Lab (Professor Andrew Kusiak) of the University of Iowa. There is an example developed using Non-Parametric modeling technique.
인텔리젼트 시스템 연구소에서는 파워커브 추정에 다양한 데이터 마이닝 알고리즘을 시험하였으며, 이 중에서 k-NN 모델이 가장 우수한 성능을 보여주었다. 또한, 파워커브 리미트를 설정하기 위한 오차 제어 차트(Residual Control Chart) 기법을 제시하였다. The Intelligent Systems Research Institute tested various data mining algorithms for power curve estimation, among which the k-NN model showed the best performance. In addition, a residual control chart technique for setting a power curve limit is presented.
하지만, 인텔리젼트 시스템 연구소에서 제시된 데이터 마이닝 기법의 k-NN 모델에 대한 정확성은, 이상 데이터에 의해 크게 저하될 수 있으며, 새로운 데이터가 주어질 때마다 학습 데이터 집합 전체와의 거리 계산을 통해 k개의 이웃 데이터를 선정해 주어야 하기 때문에, 학습 데이터의 양이 많아질수록 계산 시간이 오래 걸리는 단점이 있다.However, the accuracy of the k-NN model of the data mining technique presented by the Intelligent Systems Research Institute can be greatly degraded by the anomaly data, and each time new data is given, k Since the neighbor data must be selected, the larger the amount of learning data, the longer the calculation takes.
관련 기술로는 국내공개특허 제2010-0031897호(풍력발전기의 모니터링 장치)(2010.03.25)가 있다.Related technologies include Korean Patent Publication No. 2010-0031897 (Monitoring device for wind power generators) (2010.03.25).
상기 입력 데이터 분류부(10)는 가변 속도 빈(Variable Speed Bin)을 이용하여 풍력발전에 따라 입력되는 각 입력 데이터를 분류하는 작업을 수행하는데, 이는 각 빈 별 파워의 평균값과 표준편차를 계산하기 위하여 특정의 측정 수단들을 이용하여 측정된 속도-파워 데이터를 분류하기 위한 것이다. The input data classifying unit 10 classifies each input data input according to wind power using a variable speed bin, which calculates an average value and standard deviation of power for each bin. For classifying the measured velocity-power data using specific measurement means.
상기 파워 계산부(20)는 상기 입력 데이터 분류부(10)를 통해 분류된 각 빈 별 파워의 입력 데이터에 대한 평균값과 표준편차를 계산하여 구하는 것으로서, 상기 평균값은 이후 보간법을 통한 파워 커브의 추정을 위한 입력값으로 활용되고, 상기 표준편차값은 이후 전체 알고리즘 루프의 종료 여부를 결정하기 위해 활용된다. The power calculator 20 calculates and calculates an average value and a standard deviation of input data of power for each bin classified by the input data classifier 10, and the average value is then estimated by a power curve through interpolation. The standard deviation value is then used to determine whether to terminate the entire algorithm loop.
상기 파워커브 추정부(30)는 상기 파워 계산부(20)를 통해서 계산된 각 빈 별 입력 데이터에 대한 평균값을 입력받아 보간법을 이용하여 파워 커브를 추정하기 위한 것이다. The power curve estimator 30 is for estimating a power curve by using an interpolation method by receiving an average value of input data for each bin calculated by the power calculator 20.
상기 리미트 탐색부(40)는 상기 파워커브 추정부(30)를 통해서 추정된 파워 커브를 좌/우 및 상/하로 각각 이동시키면서, 입력 데이터에 포함되어 있는 이상(Fault) 데이터를 배제시키기 위한 것이다. The limit search unit 40 is to exclude the fault data included in the input data while moving the power curve estimated through the power curve estimator 30 to the left / right and up / down, respectively. .
상기 데이터 추출부(50)는 상기 리미트 탐색부(40)의 파워커브 좌/우 및 상/하 이동 탐색을 통해 이상 데이터가 배제된 파워커브 리미트 내의 데이터를 신규의 입력 데이터로서 추출하기 위한 것이다. The data extractor 50 extracts data within the power curve limit from which abnormal data is excluded through power curve left / right and up / down movement search of the limit search unit 40 as new input data.
상기 데이터 판정부(60)는 상기 데이터 추출부(50)를 통해 추출된 신규의 입력 데이터를 대상으로 하여, 상기 파워 계산부(20)에서 계산된 빈 별 파워의 표준편차 값들의 평균값을 구하고, 이전 알고리즘 루프에서 계산된 표준편차의 평균값과 비교하여 전체 알고리즘 루프를 종료할지, 또는 전체 알고리즘 루프를 반복할지의 여부를 판정하기 위한 것이다. The data determination unit 60 obtains an average value of standard deviation values of power for each bin calculated by the power calculation unit 20, targeting new input data extracted through the data extraction unit 50. It is to determine whether to terminate the entire algorithm loop or to repeat the entire algorithm loop by comparing with the average value of the standard deviation calculated in the previous algorithm loop.
이어, 상기한 바와 같이 이루어진 본 발명에 따른 풍력터빈의 파워커브 모니터링을 위한 파워커브 리미트 자동 산출 방법에 대한 동작을 도 5의 플로우차트와, 도 6 내지 도 16a ~ 도 16e의 도면을 각각 참조하여 상세히 설명한다. Subsequently, an operation of an automatic power curve limit calculation method for power curve monitoring of a wind turbine according to the present invention made as described above will be described with reference to the flowchart of FIG. 5 and the drawings of FIGS. 6 to 16A to 16E, respectively. It explains in detail.
도 5는 본 발명의 일실시예에 따른 풍력터빈의 파워커브 모니터링을 위한 파워커브 리미트 자동 산출 방법에 대한 동작을 설명하는 플로우차트이다. 5 is a flowchart illustrating an operation of a method for automatically calculating a power curve limit for power curve monitoring of a wind turbine according to an embodiment of the present invention.
먼저, 입력 데이터 분류부(10)는 첫 번째 과정으로서 가변 속도 빈을 통하여 풍력발전에 따라 특정 측정 수단들을 통해 측정된 입력 데이터를 각각 분류하게 된다(S10). First, as the first process, the input data classifying unit 10 classifies the input data measured through specific measuring means according to the wind power generation through the variable speed bin (S10).
도 6은 본 발명의 일실시예에 따른 풍력터빈의 파워커브 모니터링을 위한 파워커브 리미트 자동 산출 방법에서 풍력발전의 입력 데이터로서 풍속에 따른 풍력터빈의 출력 특성을 나타낸 그래프 도면이다. 6 is a graph showing the output characteristics of the wind turbine according to the wind speed as input data of the wind power generation in the automatic power curve limit calculation method for monitoring the power curve of the wind turbine according to an embodiment of the present invention.
도 6에 도시된 바와 같이, 상기 입력 데이터 분류부(10)는 입력 데이터의 분류 작업이 빈 별 파워의 평균값과 표준편차에 대한 계산을 준비하기 위한 것으로서, 측정된 속도-파워 데이터에 대해 속도 빈을 기준으로 분류하게 되는데, 그 분류 과정에서 속도 빈의 폭을 하기한 수학식 1에 따라 결정한다. As shown in FIG. 6, the input data classifying unit 10 is configured to prepare the calculation of the average value and standard deviation of the power for each bin for input data classification, and the speed bin with respect to the measured speed-power data. In the classification process, the width of the velocity bin is determined according to Equation 1 below.
상기 수학식 1에 따라 빈의 폭을 결정하는 경우에는, 처음의 폭이 1 m/sec에서 시작해서 전체 알고리즘의 루프가 반복됨에 따라 1/2 m/sec, 1/3 m/sec ... 와 같이 점차 빈의 폭이 좁아진다. In the case of determining the width of the bin according to Equation 1, the first width starts at 1 m / sec and then repeats 1/2 m / sec, 1/3 m / sec as the loop of the entire algorithm is repeated. Gradually, the bin becomes narrower.
이와 같이 가변(Variable) 속도 빈을 사용하는 이유는, 첫번째로 처음에는 입력 데이터에 이상 데이터가 많이 포함되어 있을 수 있으므로, 이상 데이터의 영향을 가급적 줄이기 위하여 넓은 폭의 빈을 사용하고, 두번째로 도 6에 도시된 바와 같이, 저풍속에서는 발전기의 특성이 전체 시스템의 특성을 지배하여 완만하게 출력이 증가하지만, 정격 풍속 인근부터는 피치 제어에 의한 풍력터빈 특성이 전체 시스템 특성을 지배하여 급격하게 출력이 조절된다. 따라서 이와 같은 풍력터빈 제어의 특성을 반영하기 위해서는 보다 좁은 폭의 빈을 사용할 필요가 있다.The reason for using variable speed bins is that first, since a large amount of abnormal data may be included in the input data at first, a wider bin is used to reduce the influence of the abnormal data as much as possible. As shown in Fig. 6, at low wind speed, the characteristics of the generator dominates the characteristics of the whole system, but the output increases slowly.However, from the vicinity of the rated wind speed, the characteristics of the wind turbine by the pitch control dominate the overall system characteristics. Adjusted. Therefore, in order to reflect the characteristics of such a wind turbine control, it is necessary to use a narrower bin.
그 다음에, 파워 계산부(20)는 두 번째 과정으로서 상기 분류된 빈 별 파워의 입력 데이터에 대한 평균값과 표준편차를 각각 계산하게 되는데(S20), 이는 빈 별 파워의 평균값들이 이후 파워 커브 추정부(30)에서 보간법을 통한 파워 커브 추정의 입력값으로 사용되고, 빈 별 파워의 표준편차 값들이 이후 데이터 판정부(60)에서 전체 알고리즘 루프를 종료할지 여부를 판단하는데 사용하기 위한 것이다. Next, as a second process, the power calculation unit 20 calculates an average value and a standard deviation for the input data of the classified bin powers, respectively (S20), in which the average values of the bin powers are then added to the power curve weight. It is used as an input value of power curve estimation through interpolation in the government unit 30, and is used for determining whether the standard deviation values of the vacant powers are to be terminated in the data determination unit 60 later.
도 7은 본 발명의 일실시예에 따른 풍력터빈의 파워커브 모니터링을 위한 파워커브 리미트 자동 산출 방법에서 입력 데이터에 대해 분류된 빈 별 파워의 평균값 계산치를 나타낸 그래프 도면이다. FIG. 7 is a graph illustrating an average calculated value of power for each bin classified for input data in a power curve limit automatic calculation method for power curve monitoring of a wind turbine according to an embodiment of the present invention.
도 7에 도시된 바와 같이, 상기 파워 계산부(20)는 상기 입력 데이터 분류부(10)를 통해 분류된 빈 별 파워의 입력 데이터에 대한 평균값을 계산함에 따라, 평균값이 빈의 중심에 표시되는 것을 알 수 있다. As shown in FIG. 7, the power calculator 20 calculates an average value of input data of power for each bin classified through the input data classifier 10, and thus the average value is displayed at the center of the bin. It can be seen that.
다음에, 상기 파워커브 추정부(30)는 세 번째 과정으로서 상기 파워 계산부(20)에서 계산된 빈 별 파워의 평균값을 입력하고 보간법을 이용하여 파워커브를 추정하게 된다(S30). Next, the power curve estimator 30 inputs an average value of the power of each bin calculated by the power calculator 20 as a third process and estimates the power curve by using interpolation (S30).
도 8은 본 발명의 일실시예에 따른 풍력터빈의 파워커브 모니터링을 위한 파워커브 리미트 자동 산출 방법에서 보간법을 이용하여 파워커브를 추정한 상태를 나타낸 그래프 도면이다. 8 is a graph illustrating a state of estimating a power curve by using interpolation in an automatic power curve limit calculation method for power curve monitoring of a wind turbine according to an embodiment of the present invention.
도 8에 도시된 바와 같이, 상기 파워커브 추정부(30)는 보간법 중에서 우수한 성능을 보이는 3차 B-스플라인(Cubic B-Spline) 보간법을 사용하여 파워커브를 추정하는 상태를 보여주고 있는데, 본 발명에서는 파워커브의 추정을 위한 보간법으로서 3차 B-스플라인 보간법을 적용하고 있지만, 이에 한정되지는 않는 것으로서 현재 개시되어 있는 다양한 보간법을 얼마든지 적용하는 것이 가능하다. As shown in FIG. 8, the power curve estimator 30 shows a state of estimating power curves by using a cubic B-spline interpolation method having excellent performance among interpolation methods. In the present invention, the third-order B-spline interpolation method is applied as an interpolation method for estimating a power curve, but the present invention is not limited thereto, and various interpolation methods currently disclosed can be applied.
파워커브의 추정이 이루어진 이후에, 리미트 탐색부(40)는 네 번째 과정으로서 상기 추정된 파워커브를 좌/우 및 상/하로 각각 이동시키면서 최대한 이상 데이터를 배제시킴으로써 가능한 한 정상 데이터만을 포함시키는 최적의 파워커브 리미트를 탐색하게 된다(S40). 즉, 기존의 입력 데이터로부터 최대한 이상 데이터를 배제시킴으로써 가급적 정상 데이터만을 이후 알고리즘 루프의 새로운 입력 데이터로 선정하게 되는 것이다.After the estimation of the power curve has been made, the limit search unit 40 is the fourth process to move the estimated power curve to the left / right and up / down, respectively, and to exclude the ideal data as much as possible so as to include only the normal data as much as possible. Search for the power curve limit (S40). That is, by excluding the abnormal data as much as possible from the existing input data, only the normal data is selected as new input data of the algorithm loop afterwards.
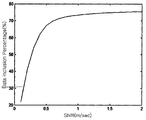
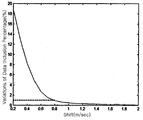
도 9a 및 도 9b는 본 발명의 일실시예에 따른 풍력터빈의 파워커브 모니터링을 위한 파워커브 리미트 자동 산출 방법에서 좌/우 이동 거리별로 상/하 파워커브 리미트 내에 존재하는 데이터의 백분율 및 변화량을 각각 나타낸 그래프 도면이고, 도 10은 본 발명의 일실시예에 따른 풍력터빈의 파워커브 모니터링을 위한 파워커브 리미트 자동 산출 방법에서 파워커브의 좌/우 이동 탐색을 통해 구한 최적의 상/하 파워커브 리미트를 나타낸 그래프 도면이다. 9A and 9B illustrate the percentage and change amount of data existing in the upper / lower power curve limit for each left / right moving distance in the automatic power curve limit calculation method for power curve monitoring of a wind turbine according to an embodiment of the present invention. FIG. 10 is a graph showing each, and FIG. 10 is an optimum upper / lower power curve obtained by searching for left / right movement of a power curve in a power curve limit automatic calculation method for monitoring a power curve of a wind turbine according to an embodiment of the present invention. It is a graph drawing showing a limit.
우선, 도 10에 도시된 바와 같이, 상기 리미트 탐색부(40)는 상기 추정 기능을 통해 구해진 파워커브를 각각 좌/우로 이동시키면서 가능한 한 정상 데이터만을 포함시키는 최적의 상(上), 하(下) 파워커브 리미트를 탐색하게 되는데, 결과적으로 상, 하 파워커브 리미트는 추정된 파워커브를 기준으로 각각 위쪽과 아래쪽에 위치하게 될 파워커브 리미트를 가리킨다. First, as shown in FIG. 10, the limit search unit 40 moves the power curves obtained through the estimation function to the left and right, respectively, and includes the best upper and lower optimal data. The power curve limit is searched. As a result, the upper and lower power curve limits indicate power curve limits which will be positioned above and below the estimated power curve, respectively.
이 때, 상기 리미트 탐색부(40)는 최적의 상, 하 파워커브 리미트를 구했는지의 여부를 하기한 수학식 2와 같은 부등식을 만족하는지의 여부로 판단하며, 수학식 2의 부등식을 만족할 때까지 반복적으로 파워커브를 ΔV 만큼 좌/우로 각각 이동시킨다. 한편, 도 10에서는 ΔV로 0.1m/sec를 사용하였다.At this time, the limit search unit 40 determines whether the optimum upper and lower power curve limit is determined by whether or not to satisfy the inequality, such as the following equation (2), when the inequality of the equation (2) Repeatedly move the power curve left / right by ΔV. In FIG. 10, 0.1 m / sec was used as ΔV.
여기서, 상기 "i"는 리미트 탐색 알고리즘의 반복 횟수를 나타내고, 상기 "β shift"는 현 단계에서 최적의 상, 하 파워커브 리미트를 결정했는지 여부를 판단하는 상수로, 도 9a 및 도 9b와 도 10에서는 1%를 사용하였다. 또한, 상기 "PDL"의 단위는 %로 하기한 수학식 3과 같이 정의된다. Here, "i" represents the number of iterations of the limit search algorithm, and "β shift " is a constant for determining whether the optimum upper and lower power curve limits are determined at this stage, and FIGS. 9A and 9B and FIG. In 10, 1% was used. In addition, the unit of "PDL" is defined as the following equation (3).
또한, 도 11a 및 도 11b는 본 발명의 일실시예에 따른 풍력터빈의 파워커브 모니터링을 위한 파워커브 리미트 자동 산출 방법에서 상/하 이동 거리별로 상/하 파워커브 리미트 내에 존재하는 데이터의 백분율 및 변화량을 각각 나타낸 그래프 도면이고, 도 12는 본 발명의 일실시예에 따른 풍력터빈의 파워커브 모니터링을 위한 파워커브 리미트 자동 산출 방법에서 파워커브 리므트의 상/하 이동 탐색을 통해 구한 최적의 상/하 파워커브 리미트를 나타낸 그래프 도면이다. 11A and 11B illustrate the percentage of data existing in the upper / lower power curve limit for each up / down moving distance in the automatic power curve limit calculation method for power curve monitoring of a wind turbine according to an embodiment of the present invention. Figure 12 is a graph showing the amount of change, respectively, Figure 12 is an optimal image obtained through the up / down movement search of the power curve limit in the automatic calculation of the power curve limit for power curve monitoring of the wind turbine according to an embodiment of the present invention It is a graph which shows the / low power curve limit.
그 다음에, 도 12에 도시된 바와 같이, 상기 리미트 탐색부(40)는 도 10에서 구해진 상, 하 파워커브 리미트를 상/하로 각각 이동시키면서 가능한 한 정상 데이터만을 포함시키는 최적의 상(上), 하(下) 파워커브 리미트를 탐색한다. Next, as shown in FIG. 12, the limit search unit 40 moves the upper and lower power curve limits obtained in FIG. 10 up and down, respectively, and includes only the best upper and lower normal data as much as possible. Search for the lower power curve limit.
마찬가지로, 상기 리미트 탐색부(40)는 현 단계에서 최적의 상, 하 파워커브 리미트를 구했는지의 여부에 대해, 하기한 수학식 4의 부등식을 만족하는지의 여부로 판단하며, 하기의 수학식 4의 부등식을 만족할 때까지 반복적으로 파워커브를 ΔP만큼 상/하로 각각 이동시킨다. 한편, 도 12에서는 ΔP로 5kW를 사용하였다.Similarly, the limit search unit 40 determines whether or not the optimum upper and lower power curve limit is obtained at this stage by whether the inequality of Equation 4 below is satisfied, and Equation 4 below. The power curve is repeatedly moved up and down by ΔP until the inequality is satisfied. In FIG. 12, 5 kW was used as ΔP.
여기서, 상기 "i"는 리미트 탐색 알고리즘의 반복 횟수를 나타내고, 상기 "PDL"은 수학식 3과 동일하게 정의되며, 상기 "γoffset"은 현 단계에서 최적의 상, 하 파워커브 리미트를 결정했는지의 여부를 판단하는 상수로서, 아래의 도 11a 및 도 11b과 도 12에서는 0.05%를 사용하였다. Here, "i" represents the number of iterations of the limit search algorithm, "PDL" is defined in the same manner as in Equation 3, and "γ offset " has been determined to determine the optimum upper and lower power curve limit at this stage. As a constant for determining whether or not, 0.05% was used in FIGS. 11A, 11B, and 12 below.
한편, 상기한 본 발명의 리미트 탐색 기능에서는, 파워커브 리미트에 대해 좌/우 이동 탐색을 먼저 수행한 후 상/하 이동 탐색을 후속적으로 수행하였지만, 그 순서가 한정되지는 않는 것으로서 역순으로 최적의 상, 하 파워커브 리미트를 탐색하는 것도 얼마든지 가능하다. On the other hand, in the limit search function of the present invention described above, the left / right movement search for the power curve limit is first performed, and then the up / down movement search is subsequently performed, but the order is not limited, the reverse order is optimal It is also possible to search for upper and lower power curve limits.
그 다음에, 데이터 추출부(50)는 다섯 번째 과정으로서 입력 데이터로부터 이상 데이터를 배제시키기 위하여 설정된 상, 하 파워커브 리미트를 대상으로 해당 상, 하 파워커브 리미트 내에 존재하는 데이터만을 새로운 입력 데이터로 추출해내게 된다(S50). Next, as a fifth process, the data extracting unit 50 uses only the data existing in the upper and lower power curve limits as the new input data for the upper and lower power curve limits set to exclude the abnormal data from the input data. It is extracted (S50).
도 13은 본 발명의 일실시예에 따른 풍력터빈의 파워커브 모니터링을 위한 파워커브 리미트 자동 산출 방법에서 파워커브 리미트의 자동 산출 알고리즘에 따라 신규하게 선정된 입력 데이터를 나타낸 그래프 도면이다. FIG. 13 is a graph illustrating newly selected input data according to an automatic calculation algorithm of a power curve limit in a method of automatically calculating a power curve limit for power curve monitoring of a wind turbine according to an embodiment of the present invention.
도 13에 도시된 바에 따르면, 기존의 입력 데이터에 대해 탐색된 상, 하 파워커브 리미트 내에서 존재하는 데이터만을 신규하게 선정된 새로운 입력 데이터로 추출하게 된다. As shown in FIG. 13, only data existing within upper and lower power curve limits searched for the existing input data is extracted as newly selected new input data.
이후, 데이터 판정부(60)는 상기 데이터 추출부(50)로부터 새롭게 추출된 입력 데이터를 대상으로 하여 전체 알고리즘 루프의 종료를 판정하기 위한 과정으로서, 상기 파워 계산부(20)에서 계산된 빈 별 파워의 표준편차 값을 입력받아 해당 표준편차의 평균값을 계산하게 된다(S60).Then, the data determination unit 60 is a process for determining the end of the entire algorithm loop for the input data newly extracted from the data extraction unit 50, the empty stars calculated by the power calculation unit 20 The average value of the standard deviation is calculated by receiving the standard deviation value of the power (S60).
상기 표준편차의 평균값을 계산한 이후에, 상기 데이터 판정부(60)는 현재 계산된 상기 표준편차의 평균값과 이전 알고리즘 루프에서 계산된 이전 표준편차의 평균값을 비교하여, 상기 평균값의 변화량이 파워 커브 산출 알고리즘의 종료 판단 상수인 "aloop"보다 큰지의 여부를 판단한다(S80).After calculating the average value of the standard deviation, the data determination unit 60 compares the average value of the standard deviation currently calculated with the average value of the previous standard deviation calculated in the previous algorithm loop, and the change amount of the average value is a power curve. It is determined whether or not it is larger than "a loop " which is an end determination constant of the calculation algorithm (S80).
한편, 상기 판단 단계에서의 평균값 비교 및 상수 판단에 대한 계산은 하기한 수학식 5의 부등식과 같이 이루어지게 된다. On the other hand, the calculation of the average value comparison and constant determination in the determination step is made as inequality of the following equation (5).
여기서, 상기 "k (k > 1)"는 전체 알고리즘 루프의 반복 횟수를 나타내고, 상기 "aloop"는 파워커브 리미트의 자동 산출을 위한 전체 알고리즘 루프의 종료 여부를 판단하는 상수로서, 도 13에서는 1을 사용하였다. Here, "k (k>1)" represents the number of iterations of the entire algorithm loop, and "a loop " is a constant for determining whether to end the entire algorithm loop for automatic calculation of the power curve limit. 1 was used.
상기 판단 결과, 상기 데이터 판정부(60)는 상기 수학식 5의 부등식과 같이 표준편차에 따른 평균값의 변화량이 설정 상수 "aloop"보다 작은 것으로 판단하게 하면 상기 리미트 탐색부(40)에서 탐색을 통해 구한 상, 하 파워커브 리미트를 최적의(즉, 정확한) 파워 커브 리미트로서 산출하면서 전체 알고리즘 루프를 종료하게 되고(S80), 상기 수학식 5의 부등식을 만족하지 않는 경우에는 상기 데이터 추출부(50)에서 추출된 신규의 입력데이터를 이용하여 상기 S10의 단계인 가변 속도 빈을 통한 입력 데이터의 분류 과정부터 다시 시작하여 전체 알고리즘 루프를 재차 수행하게 된다.As a result of the determination, when the data determination unit 60 determines that the amount of change of the average value according to the standard deviation is smaller than the set constant "a loop " as shown in the inequality of Equation 5, the limit search unit 40 searches. While calculating the upper and lower power curve limits obtained through the optimal (that is, accurate) power curve limits, the entire algorithm loop is terminated (S80). When the inequality of Equation 5 is not satisfied, the data extraction unit ( Using the new input data extracted in step 50), the entire algorithm loop is performed again by starting again from the process of classifying the input data through the variable speed bin in the step S10.
다음으로, 본 14a 내지 도 14d는 본 발명의 일실시예에 따른 풍력터빈의 파워커브 모니터링을 위한 파워커브 리미트 자동 산출 방법에서 파워커브 리미트의 자동 산출 알고리즘의 루프 횟수에 따른 실시 사례를 각각 나타낸 그래프 도면이다. Next, 14a to 14d are graphs each showing an exemplary embodiment according to the number of loops of an automatic calculation algorithm of the power curve limit in the method of automatically calculating the power curve limit for power curve monitoring of a wind turbine according to an embodiment of the present invention. Drawing.
도 14a 내지 도 14d에 도시된 바에 따르면, 본 발명의 파워커브 리미트 자동 계산 알고리즘을 적용하였을 때 전체 알고리즘 루프의 반복 횟수에 따른 결과를 보여주는데, 전체 알고리즘 루프가 4번 반복되었을 때 종료되었으며, 성공적으로 파워커브 리미트를 산출해주는 것을 알 수 있다. As shown in FIGS. 14A to 14D, when the power curve limit automatic calculation algorithm of the present invention is applied, the results are shown according to the number of iterations of the entire algorithm loop, which is terminated when the entire algorithm loop is repeated four times. It can be seen that the power curve limit is calculated.
도 15는 본 발명의 일실시예에 따른 풍력터빈의 파워커브 모니터링을 위한 파워커브 리미트 자동 산출 방법에서 이상 데이터가 다수 포함되어 있는 입력 데이터의 상태를 나타낸 그래프 도면이고, 도 16a 내지 도 16e는 본 발명의 일실시예에 따른 풍력터빈의 파워커브 모니터링을 위한 파워커브 리미트 자동 산출 방법에서 도 15의 입력 데이터를 적용하여 파워커브 리미트의 자동 산출 알고리즘의 루프 횟수에 따라 산출되는 실시 사례를 각각 나타낸 그래프 도면이다. 15 is a graph illustrating a state of input data including a plurality of abnormal data in a method for automatically calculating a power curve limit for power curve monitoring of a wind turbine according to an embodiment of the present invention, and FIGS. 16A to 16E illustrate In the method for automatically calculating the power curve limit for power curve monitoring of a wind turbine according to an embodiment of the present invention, a graph showing an exemplary embodiment calculated according to the number of loops of the automatic calculation algorithm of the power curve limit by applying the input data of FIG. 15. Drawing.
도 15에 나타낸 데이터는 또 다른 MW급 풍력터빈의 입력 데이터를 예시한 것으로서, 도 6에 나타난 입력 데이터에 비해 이상 데이터가 다수 포함되어 있는 것을 관찰할 수 있다. The data shown in FIG. 15 illustrates input data of another MW wind turbine, and it can be observed that a large number of abnormal data are included in comparison with the input data shown in FIG. 6.
이에, 도 16a 내지 도 16e에 도시된 바에 따르면, 도 15의 입력 데이터에 본 발명에 따른 알고리즘의 적용 결과로 전체 알고리즘 루프가 5번 반복되었을 때 종료되었으며, 이상 데이터가 많이 포함되어 있음에도 불구하고 성공적으로 파워커브 리미트를 산출해주는 것을 확인할 수 있다.16A to 16E, the algorithm is terminated when the entire algorithm loop is repeated five times as a result of the application of the algorithm according to the present invention to the input data of FIG. You can see that it calculates the power curve limit.
본 발명은 도면에 도시된 실시예를 참고로 하여 설명되었으나, 이는 예시적인 것에 불과하며, 당해 기술이 속하는 분야에서 통상의 지식을 가진 자라면 이로부터 다양한 변형 및 균등한 타 실시예가 가능하다는 점을 이해할 것이다. 따라서 본 발명의 기술적 보호범위는 아래의 특허청구범위에 의해서 정하여져야 할 것이다.Although the present invention has been described with reference to the embodiments shown in the drawings, this is merely exemplary, and those skilled in the art to which the art belongs can make various modifications and other equivalent embodiments therefrom. Will understand. Therefore, the technical protection scope of the present invention will be defined by the claims below.