WO2014034307A1 - 重層化及び/又は分化の程度を判定する方法並びに装置 - Google Patents
重層化及び/又は分化の程度を判定する方法並びに装置 Download PDFInfo
- Publication number
- WO2014034307A1 WO2014034307A1 PCT/JP2013/069336 JP2013069336W WO2014034307A1 WO 2014034307 A1 WO2014034307 A1 WO 2014034307A1 JP 2013069336 W JP2013069336 W JP 2013069336W WO 2014034307 A1 WO2014034307 A1 WO 2014034307A1
- Authority
- WO
- WIPO (PCT)
- Prior art keywords
- differentiation
- acid
- phosphate
- cells
- stratification
- Prior art date
- Legal status (The legal status is an assumption and is not a legal conclusion. Google has not performed a legal analysis and makes no representation as to the accuracy of the status listed.)
- Ceased
Links
Images





Classifications
-
- G—PHYSICS
- G01—MEASURING; TESTING
- G01N—INVESTIGATING OR ANALYSING MATERIALS BY DETERMINING THEIR CHEMICAL OR PHYSICAL PROPERTIES
- G01N33/00—Investigating or analysing materials by specific methods not covered by groups G01N1/00 - G01N31/00
- G01N33/48—Biological material, e.g. blood, urine; Haemocytometers
- G01N33/50—Chemical analysis of biological material, e.g. blood, urine; Testing involving biospecific ligand binding methods; Immunological testing
- G01N33/5005—Chemical analysis of biological material, e.g. blood, urine; Testing involving biospecific ligand binding methods; Immunological testing involving human or animal cells
- G01N33/5008—Chemical analysis of biological material, e.g. blood, urine; Testing involving biospecific ligand binding methods; Immunological testing involving human or animal cells for testing or evaluating the effect of chemical or biological compounds, e.g. drugs, cosmetics
- G01N33/502—Chemical analysis of biological material, e.g. blood, urine; Testing involving biospecific ligand binding methods; Immunological testing involving human or animal cells for testing or evaluating the effect of chemical or biological compounds, e.g. drugs, cosmetics for testing non-proliferative effects
- G01N33/5038—Chemical analysis of biological material, e.g. blood, urine; Testing involving biospecific ligand binding methods; Immunological testing involving human or animal cells for testing or evaluating the effect of chemical or biological compounds, e.g. drugs, cosmetics for testing non-proliferative effects involving detection of metabolites per se
-
- G—PHYSICS
- G01—MEASURING; TESTING
- G01N—INVESTIGATING OR ANALYSING MATERIALS BY DETERMINING THEIR CHEMICAL OR PHYSICAL PROPERTIES
- G01N33/00—Investigating or analysing materials by specific methods not covered by groups G01N1/00 - G01N31/00
- G01N33/48—Biological material, e.g. blood, urine; Haemocytometers
- G01N33/50—Chemical analysis of biological material, e.g. blood, urine; Testing involving biospecific ligand binding methods; Immunological testing
- G01N33/5005—Chemical analysis of biological material, e.g. blood, urine; Testing involving biospecific ligand binding methods; Immunological testing involving human or animal cells
- G01N33/5008—Chemical analysis of biological material, e.g. blood, urine; Testing involving biospecific ligand binding methods; Immunological testing involving human or animal cells for testing or evaluating the effect of chemical or biological compounds, e.g. drugs, cosmetics
- G01N33/502—Chemical analysis of biological material, e.g. blood, urine; Testing involving biospecific ligand binding methods; Immunological testing involving human or animal cells for testing or evaluating the effect of chemical or biological compounds, e.g. drugs, cosmetics for testing non-proliferative effects
- G01N33/5032—Chemical analysis of biological material, e.g. blood, urine; Testing involving biospecific ligand binding methods; Immunological testing involving human or animal cells for testing or evaluating the effect of chemical or biological compounds, e.g. drugs, cosmetics for testing non-proliferative effects on intercellular interactions
-
- G—PHYSICS
- G01—MEASURING; TESTING
- G01N—INVESTIGATING OR ANALYSING MATERIALS BY DETERMINING THEIR CHEMICAL OR PHYSICAL PROPERTIES
- G01N33/00—Investigating or analysing materials by specific methods not covered by groups G01N1/00 - G01N31/00
- G01N33/48—Biological material, e.g. blood, urine; Haemocytometers
- G01N33/50—Chemical analysis of biological material, e.g. blood, urine; Testing involving biospecific ligand binding methods; Immunological testing
- G01N33/5005—Chemical analysis of biological material, e.g. blood, urine; Testing involving biospecific ligand binding methods; Immunological testing involving human or animal cells
- G01N33/5091—Chemical analysis of biological material, e.g. blood, urine; Testing involving biospecific ligand binding methods; Immunological testing involving human or animal cells for testing the pathological state of an organism
-
- G—PHYSICS
- G01—MEASURING; TESTING
- G01N—INVESTIGATING OR ANALYSING MATERIALS BY DETERMINING THEIR CHEMICAL OR PHYSICAL PROPERTIES
- G01N2400/00—Assays, e.g. immunoassays or enzyme assays, involving carbohydrates
Definitions
- the present invention relates to a method for determining the degree of stratification and / or differentiation of cultured cells in a simple and non-invasive manner and an apparatus for determining the degree of stratification and / or differentiation of cultured cells.
- stem cells In regenerative medicine, cells (stem cells) that are the source of skin, nerves, bones, blood vessels, etc. are used to recover the function of tissues and organs that have failed due to illness or injury.
- the types of stem cells are mainly (1) somatic stem cells, (2) ES cells, and (3) iPS cells, each having the following properties.
- Somatic stem cells are immature cells contained in trace amounts in bone marrow, fat, blood and the like. Somatic stem cells are found in the bone marrow and fat of the body and differentiate into certain types of cells. Those that become blood cells when grown are called hematopoietic stem cells, those that become bone cells or adipocytes are called mesenchymal stem cells, and those that become nerves in the brain are called neural stem cells. Since somatic stem cells are collected from the patient himself, regenerative medicine using somatic stem cells has the advantage that rejection does not occur.
- ES cells ES cells are made from a part of a fertilized egg and have a function of becoming any cell in the body.
- iPS cells are produced by inserting genes into cells such as skin.
- iPS cells are considered to be any cells as well as ES cells.
- a cell sheet prepared by proliferating and culturing undifferentiated corneal cells or oral cell stem cells collected from the body and appropriately inducing stratification and / or differentiation can be used for treatment. .
- the cell sheet comprises the following steps: (1) separation / purification of collected stem cells, (2) culture of stem cells (increase to the required number of cells), (3) differentiation induction of stem cells into target tissue cells, and ( 4) It can be produced by preparing and commercializing differentiated cells into an appropriate form. In order to perform all of these steps under aseptic conditions and prevent contamination by other cells, a cell preparation facility (CellCProcessing Center) is often required.
- Dyeing method Hematoxylin and eosin staining (H & E staining) can distinguish the basal layer, spiny layer, granule layer, and stratum corneum. Moreover, the locality of a basement membrane component can be confirmed by using an epidermal differentiation marker. However, when the staining method is used, it is necessary to attach a substance serving as a marker to the cells, and there is a problem that the stained cells cannot be used as a therapeutic material.
- Cited Document 1 describes a method that uses optical measurement in order to easily and accurately measure the degree of layering without requiring steps such as dyeing and transfer. Using a confocal laser microscope, the autofluorescence emitted from the collected stratum corneum sample is observed, and image data divided in the height direction of the stratum corneum is compared and analyzed to measure the delamination state of the stratum corneum.
- Cited Document 2 captures an enlarged image of a stratum corneum cell sample taken under incident light conditions as an image, a monochrome image as a background portion, a portion of a stratum corneum cell that overlaps with another stratum corneum cell, and a stratum corneum cell Extracting images of three regions with portions that do not overlap with other stratum corneum cells, and using the results of multivariate analysis of the physical quantity of the images as an index, distinguishing stratum corneum cells such as how the stratum corneum peels Is described.
- the skin characteristics can be evaluated by grasping the shape of stratum corneum cells, in particular, the degree of peeling of stratum corneum cells, under the condition of staining or non-staining anywhere with this method. ing.
- Cited Document 3 describes a method for determining the degree of stratification based on the amount of change with time, using glucose, lactic acid, and ammonia as indicators as a component for cell survival in culture medium.
- it is possible to determine the degree of stratification, but it is difficult to determine the degree of progression of differentiation after differentiation induction.
- a method capable of analyzing the progress of differentiation after differentiation induction is required.
- An object of the present invention is to provide a method for easily and noninvasively determining the degree of stratification and / or differentiation of cultured cells and an apparatus for determining the degree of stratification and / or differentiation of cultured cells.
- the present inventors measure the pentose phosphate pathway metabolite and / or TCA cycle (citrate cycle) metabolite metabolized by cells, thereby easily and non-invasively layering cultured cells. And / or found that the degree of differentiation can be determined.
- the present invention includes the following inventions.
- a method for determining the degree of stratification and / or differentiation of cultured cells (a) a collecting step of collecting a culture solution of cultured cells; (b) an analysis step for analyzing at least one metabolite of the pentose phosphate pathway and / or TCA cycle in the culture medium; and (c) The analysis result obtained in the analysis step is referred to a correlation database between the degree of stratification and / or differentiation of the cultured cells obtained in advance and the analysis result of the metabolite, and stratification and / or culturing of the cultured cells is performed.
- the said method including the determination process which determines the grade of differentiation.
- Metabolites of the pentose phosphate pathway are glucose-6-phosphate, 6-phosphoglucono-1,5-lactone, 6-phosphogluconic acid, ribulose-5-phosphate, xylulose-5-phosphate, ribose-
- the above (1) which is at least one selected from the group consisting of 5-phosphate, glyceraldehyde-3-phosphate, sedoheptulose-7-phosphate, erythrose-4-phosphate and fructose-6-phosphate ) Method.
- Metabolites of the TCA cycle are acetyl CoA, citric acid, cis-aconitic acid, isocitric acid, oxalosuccinic acid, ⁇ -ketoglutaric acid, succinyl CoA, succinic acid, ubiquinone, fumaric acid, ubiquinol, L-malic acid
- the method according to (1) or (2) above which is at least one selected from the group consisting of oxaloacetic acid.
- the correlation database is based on a correlation between the degree of stratification and / or differentiation and the production rate and / or consumption rate of metabolites.
- step (c) The method according to any one of (1) to (4) above, wherein the correlation database is based on an analysis result by intracellular metabolic flux analysis.
- Collection means for collecting the culture solution of cultured cells
- the analysis means for analyzing at least one metabolite of the pentose phosphate pathway and / or the TCA cycle in the culture solution collected by the collection means, and the analysis result obtained by the analysis means is layered on the cultured cells obtained in advance And / or a determination database for determining the degree of stratification and / or differentiation of the cultured cell by referring to a correlation database between the degree of differentiation and the analysis result of the metabolite.
- a device that determines the degree of (9) The apparatus according to (8) above, wherein the analysis means is HPLC.
- the degree of stratification and / or differentiation of cells can be measured easily and non-invasively with respect to the cells. Problems, configurations, and effects other than those described above will be clarified by the following description of embodiments.
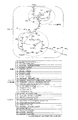
- FIG. 1 is a diagram showing a method for analyzing intracellular metabolic flux.
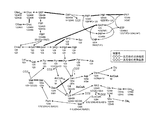
- FIG. 2 is a diagram showing an intracellular metabolic reaction pathway of general animal cells.
- FIG. 3 is a diagram showing a flowchart of the stratification / differentiation determination.
- FIG. 4 is a diagram showing an embodiment of the apparatus of the present invention.
- FIG. 5 shows isotope ratios of intracellular intermediate metabolites in human oral cells.
- FIG. 6 is a graph showing the isotope ratio of intracellular intermediate metabolites in human corneal cells.
- FIG. 7 is a diagram showing the movement of the position of carbon in the carbon skeleton in intracellular metabolism.
- FIG. 8 is a diagram showing changes in intracellular metabolism during differentiation / stratification using intracellular metabolic flux analysis for human oral cells.
- FIG. 9 is a diagram showing changes in intracellular metabolism during differentiation / stratification using intracellular metabolic flux analysis for human corneal cells.
- the present invention is a method for determining the degree of stratification and / or differentiation of cultured cells, (a) a collecting step of collecting a culture solution of cultured cells; (b) an analysis step for analyzing at least one metabolite of the pentose phosphate pathway and / or TCA cycle in the culture medium; and (c)
- the analysis result obtained in the analysis step is referred to a correlation database between the degree of stratification and / or differentiation of the cultured cells obtained in advance and the analysis result of the metabolite, and stratification and / or culturing of the cultured cells is performed. It includes a determination step of determining the degree of differentiation.
- the method for determining the degree of stratification and / or differentiation of the present invention includes the steps (a), (b), and (c) described above, thereby making it simple and non-invasive.
- the degree of stratification and / or differentiation of cultured cells can be determined.
- “differentiation” means that an individual cell changes structurally and functionally.
- “stratification” means that cells are layered to form a thickened plane.
- the “stratification” includes a case where cells are formed by differentiation, and in this case, stratification and differentiation occur simultaneously.
- the method of the present invention includes a collecting step of collecting a culture solution of cultured cells as step (a).
- the cell is not particularly limited as long as it is a layered or differentiated cell, but is an adhesion-dependent cell (a cell or scaffold that expands its adhesion area after directly or indirectly adhering to the culture surface and then divides the cell) Also referred to as dependent cells).
- the cells are preferably human blood, warm blooded animals such as humans, mice, rats, guinea pigs, hamsters, chickens, rabbits, pigs, sheep, cows, horses, dogs, cats and monkeys, preferably humans.
- Examples of the cells include keratinocytes, keratinocytes, epithelial cells, mucosal cells, endothelial cells, fibroblasts, oral cells, corneal cells, etc.
- human oral cells and human corneal cells include preferable. These cells may be primary cells collected directly from tissues or organs, or may be passaged from one generation to another.
- stem cells such as somatic stem cells, ES cells and iPS cells are preferred.
- these cells are embryonic stem cells that are undifferentiated cells, pluripotent stem cells such as pluripotent mesenchymal stem cells, unipotent stem cells such as vascular endothelial progenitor cells that have unipotency, and differentiation is completed. Any of the cells obtained may be used.
- the cells may be cultured as a single species or as a coculture of two or more cells.
- the culture solution is collected manually from the culture vessel in a safety cabinet, and sampling is performed by pumping or pumping through a flow path that is aseptically connected to the sampling port provided in the culture vessel.
- a device that performs sampling by pumping or pumping through a flow path that is aseptically connected to a sampling port provided in the culture vessel.
- the method of the present invention includes an analysis step of analyzing at least one metabolite of the pentose phosphate pathway and / or the TCA cycle in the culture solution as step (b).
- metabolic flux analysis can be performed in (1) proliferation stage of undifferentiated cells, (2) early differentiation induction, (3) middle differentiation induction (usually used for transplantation at this point), and (4) late differentiation induction.
- the metabolite consumption rate or production rate of each metabolite in the metabolic pathway is determined, and the metabolite that changes in the production rate or consumption rate in each cell state (1)-(4) can be used as an index.
- the concentration of the metabolite selected as an index in the culture solution is analyzed.
- Examples of the analysis means for performing the step (b) include biosensors using an immobilized enzyme method, mass spectrometry such as MALDI method, liquid chromatography, etc., and the ability to simultaneously measure multiple components in a culture solution. It is preferable to use HPLC or the like.
- Examples of metabolites of the pentose phosphate pathway include glucose-6-phosphate, 6-phosphoglucono-1,5-lactone, 6-phosphogluconic acid, ribulose-5-phosphate, xylulose-5-phosphate, and ribose. Mention may be made of -5-phosphate, glyceraldehyde-3-phosphate, sedoheptulose-7-phosphate, erythrose-4-phosphate and fructose-6-phosphate. These can be used alone or in combination of two or more.
- glucose-6-phosphate, ribulose-5-phosphate, xylulose-5-phosphate, ribose-5-phosphate, glyceraldehyde-3-phosphate, cedoheptulose-7-phosphate, fructose -6-phosphate and erythrose-4-phosphate are preferred, glucose-6-phosphate, glyceraldehyde-3-phosphate, sedheptulose-7-phosphate, fructose-6-phosphate, erythrose-4-phosphate Acid is particularly preferred.
- Metabolites of the TCA cycle include, for example, acetyl CoA, citric acid, cis-aconitic acid, isocitric acid, oxalosuccinic acid, ⁇ -ketoglutaric acid, succinyl CoA, succinic acid, ubiquinone, fumaric acid, ubiquinol, L-apple Mention may be made of acids and oxaloacetic acid. These can be used alone or in combination of two or more.
- oxaloacetic acid, acetyl CoA, citric acid, ⁇ -ketoglutaric acid, succinyl CoA, succinic acid, fumaric acid, and L-malic acid are preferable, and citric acid, ⁇ -ketoglutaric acid, succinyl CoA, succinic acid, fumaric acid are preferable. Acid is particularly preferred.
- the analysis result obtained in the analysis step is referred to a correlation database of the degree of stratification and / or differentiation of the cultured cells obtained in advance and the analysis result of the metabolite. And a determination step of determining the degree of stratification and / or differentiation of the cultured cells.
- the correlation database is preferably based on the correlation between the degree of stratification and / or differentiation and the production rate and / or consumption rate of metabolites.
- the production rate and / or consumption rate can be determined based on, for example, the isotope ratio of each metabolite in the culture medium of cells cultured in a medium containing isotope-labeled glucose.
- the correlation database can be based on the results of analysis by intracellular metabolic flux analysis in that the progress of stratification and differentiation and the production rate and / or consumption rate of intracellular intermediate metabolites can be examined in more detail. Particularly preferred.
- the principle of intracellular metabolic flux analysis is described below.
- Intracellular metabolism analysis consists of simulation and culture experiments (see Fig. 1).
- the simulation it is necessary to assume the intracellular metabolic pathway of the cell to be analyzed.
- a metabolic pathway model generally used in animal cells shown in FIG. 2 can be used.
- the metabolic pathway model can be modified according to the cells used and the accuracy.
- the concept of the metabolic flux estimation method is shown in FIG.
- random metabolic flux values R1 to R29 in Fig. 2 are first given.
- the ratio of the number of isotope carbon contained in each metabolite in the cell in the steady state. Calculate Compare this calculated value with the isotope carbon number ratio of the intracellular metabolite measured in the experiment.
- the isotope in the metabolite by simulation is corrected so that the mean square error between the number carbon ratio value and the isotope carbon number ratio value in the metabolite by experiment is minimized, and the isotope carbon ratio is calculated. Then, the operation of comparing the values of the isotope carbon number ratio in the metabolite by the above experiment is repeated until there is no statistically significant difference. Usually it can be estimated by a few iterations, but if there is a statistically significant difference after many iterations, it is judged that the metabolic pathway model is wrong or that the experimental data is not measured properly .
- the confidence interval of the estimated value can also be obtained from a statistical concept. Maciek ⁇ ⁇ R. et al., Metabolic Engineering 8 (2006) 324-337, Determination of confidence intervals of metabolic fluxes estimated from stable isotope measurements can be referred to for calculation of confidence intervals for estimated values.
- an estimated metabolic flux is obtained, and attention is paid to one of the estimated metabolic fluxes (R1 to R29) (for example, R3), and the value of the metabolic flux is gradually increased.
- R1 to R29 for example, R3
- the upper limit value of the metabolic flux is reached.
- the lower limit is gradually reduced from the estimated flux value, and becomes the lower limit when there is a statistically significant difference.
- AcCoA Acetyl-CoA (acetyl coenzyme A) AKG: ⁇ -Ketoglutarate ( ⁇ -ketoglutarate) Ala: Alanine Asp: Aspartic acid Cit: Citric acid DHAP: Dihydroxyacetone phosphate E4P: Erythrose-4-phosphate (erythrose-4-phosphate) Fum: Fumarate F6P: Fructose-6-phosphate (fructose-6-phosphate) GAP: Glyceraldehyde-3-phosphate (glyceraldehyde-3-phosphate) Gln: Glutamine Glnext: Extracellular Glutamine Gluc: Glucose Glucext: Extracellular Glucose Glu: Glutamic acid Gly: Glycine G6P: Glucose-6-phosphate (glucose-6-phosphate) Lac: Lactic acid Lacext
- the above simulation requires experimental observation parameters (the isotope carbon number ratio and extracellular metabolic flux of each metabolite in the cell), but usually the required observation parameters differ depending on the target cell or the medium used. .
- 13 types of measurement parameters Pyr, Lac, Ala, Gly, Suc, Fum, Ser, AKG, Mal, Asp, Glu, Gln, and Cit are used as measurement parameters, and these values are obtained by measurement of isotope ratios. Values can be used.
- determination means for performing step (c) for example, means for comparing intracellular metabolite concentration with a database, means for comparing metabolite concentration secreted into the culture solution with the database, and changes in nutrient concentration in the culture solution Means for comparing the consumption rate of nutrients consumed in cells with a database can be mentioned. In particular, it is preferable to use determination means for calculating the metabolic rate per cell and comparing it with a database in order to improve the determination accuracy.
- FIG. 3 An example of performing the method of the present invention with higher accuracy is a method as shown in FIG. As shown in FIG. 3, in this method, since the analysis result of step (b) and the correlation database are statistically compared, the determination step of step (c) can be performed with higher accuracy.
- the method shown in FIG. 3 will be specifically described below.
- the change with time of the indicator substance may be the change with time of the metabolic flux.
- the metabolic rate of the indicator substance can be estimated from the metabolic flux corresponding to the metabolism of the indicator substance.
- the culture solution of the target cultured cell is collected, and the concentration of the indicator component in the culture solution is measured. The amount of change is calculated by measuring this over time. When the change amount and the correlation database acquired in advance are compared and statistically match, it can be determined that the cultured cell is in the cell state in the matched database.
- the present invention further includes a collecting means for collecting a culture solution of cultured cells,
- the analysis means for analyzing at least one metabolite of the pentose phosphate pathway and / or the TCA cycle in the culture solution collected by the collection means, and the analysis result obtained by the analysis means is layered on the cultured cells obtained in advance And / or a determination database for determining the degree of stratification and / or differentiation of the cultured cell by referring to a correlation database between the degree of differentiation and the analysis result of the metabolite.
- the present invention relates to an apparatus for determining the degree of the above (hereinafter referred to as the apparatus of the present invention).
- the apparatus of the present invention is suitable for carrying out the method of the present invention. That is, according to the apparatus of the present invention, the degree of cell stratification and / or differentiation can be measured easily and non-invasively with respect to the cells.
- the path from the collection of the culture solution to the analysis is preferably configured as a closed system in order to prevent contamination from outside.
- FIG. 4 shows an embodiment of the apparatus of the present invention.
- the present embodiment includes a culture device, a collection device, an analysis device, an analysis device, a recording device, a correlation database, and a control device.
- stratification / differentiation of cultured cells can be determined as follows.
- Cell sheet culture is performed with an automatic culture apparatus, and a part of the culture solution is collected with a collection device when the medium is replaced.
- the collected culture solution is analyzed by an analyzer, and the result is calculated by the analyzer as necessary and recorded in a recording device.
- a correlation database and a measurement result are collated, and the present cell state is determined.
- Index determination for discriminating the degree of stratification and / or differentiation Cell culture is performed using human oral cells or human corneal cells, (1) undifferentiated growth phase, (2) early differentiation induction, (3) Cell samples of the differentiation-inducing middle stage and (4) differentiation-inducing late stage were prepared, and intracellular metabolic flux analysis was performed.
- DMEM Dulbecco's Modified Eagle Medium
- F12 F12 medium
- a medium supplemented with 10% bovine serum was used.
- glucose 25% of natural glucose, 25% of 1-13C glucose that is isotopically labeled at the 1st position of the carbon skeleton, and 25% of U-13C glucose that is isotopically labeled for all six carbons in the carbon skeleton It prepared so that it might become a ratio.
- KCM medium keratinocyte medium
- glucose as in the growth culture, 50% natural glucose, 25% 1-13C glucose, and 25% U-13C glucose were prepared.
- Agilent 7890A Agilent 7890A (Agilent) and column type 30m DB-35MS capillary column are used, and the measurement condition is temperature control from 100 ° C. to 300 ° C. with a column temperature gradient of 3.5 ° C./min.
- the inlet temperature was 270 ° C.
- the carrier gas was helium gas
- the flow rate was 1 mL / min.
- FIG. 5 shows the analysis results for human oral cells
- FIG. 6 shows the analysis results for human corneal cells.
- X in description of (m + X) in FIG.5 and FIG.6 shows the carbon number by which the isotope label in the intracellular metabolite was carried out.
- pyruvic acid the ratio of isotope-unlabeled pyruvic acid (m + 0) was highest in (1) undifferentiated growth phase, and (2) decreased during differentiation induction. However, (4) the ratio of isotope unlabeled pyruvate (m + 0) slightly increased in the late differentiation induction period.
- FIG. 7 shows a map showing the movement of the position of the carbon atom in the carbon skeleton of each intracellular metabolite.
- the isotope glucose is metabolized intracellularly to pyruvate, but the carbon atom at the 1-position is released as carbon dioxide in the pathway (G6P ⁇ P5P) that flows through the pentose phosphate pathway in this process (see FIGS. 7 and 2). ).
- the other route does not release the carbon atom at the 1-position.
- 25% of 1-13C glucose is mixed, so if the flow to the pentose phosphate pathway is large, the metabolite derived from 1-13C glucose loses isotope labeling and affects the metabolism to pyruvate.
- the ratio of isotope unlabeled fumaric acid showed an increase from (1) undifferentiated growth phase to (4) late differentiation induction phase. This indicates that there is a pathway that flows into the TCA circuit using unlabeled glutamine as a substrate, and that pathway (AKG ⁇ Glu, AKG ⁇ Suc, Suc ⁇ Fum) increases with stratification / differentiation.
- the ratio of isotopically unlabeled maleic acid (m + 0) decreased from (1) undifferentiated growth to (3) middle differentiation induction, and then (4) late differentiation induction. Increased. This is because (1) from undifferentiated growth, (3) during the induction of differentiation, the flux of Pyr ⁇ Oac, Oac ⁇ Mal, and Pyr ⁇ Mal into which isotope-labeled substances flow more than the flux of Mal ⁇ Fum increases. It shows that the flux of the metabolic pathway decreases from the middle stage of differentiation induction to the late stage of differentiation induction (4).
- human oral cells and human corneal cells have the same tendency of isotope ratio in stratification / differentiation, although their origins are different. Therefore, it is considered that the tendency of changes in metabolite generation or consumption rate accompanying stratification / differentiation is the same.
- FIG. 9 shows the results of analysis with human corneal cells. Except for the point that Pyr ⁇ Mal becomes smaller, the tendency was similar to that of human oral cells.
- stratification / differentiation can be determined by using each increase / decrease as an index in all metabolic components of the pentose phosphate pathway and the TCA cycle.
- this invention is not limited to the above-mentioned Example, Various modifications are included.
- the above-described embodiments have been described in detail for easy understanding of the present invention, and are not necessarily limited to those having all the configurations described.
- a part of the configuration of the embodiment can be replaced with the configuration of another embodiment, and the configuration of another embodiment can be added to the configuration of a certain embodiment.
- the method and apparatus for determining the degree of stratification and / or differentiation of the present invention can be used for quality control in a culture process and confirmation of an appropriate transplantation time, particularly for cells used for regenerative medicine. For example, it can be used for cell monitoring applied when cells used for regenerative medicine are cultured.
- Analyzing device 2 Recording device 3: Analyzing device 4: Control device 5: Culture device 6: Collection device 7: Correlation database 8: Culture experiment and metabolic analysis
Landscapes
- Health & Medical Sciences (AREA)
- Life Sciences & Earth Sciences (AREA)
- Engineering & Computer Science (AREA)
- Immunology (AREA)
- Biomedical Technology (AREA)
- Hematology (AREA)
- Chemical & Material Sciences (AREA)
- Urology & Nephrology (AREA)
- Molecular Biology (AREA)
- Tropical Medicine & Parasitology (AREA)
- Biochemistry (AREA)
- Microbiology (AREA)
- Biotechnology (AREA)
- Pathology (AREA)
- General Physics & Mathematics (AREA)
- Food Science & Technology (AREA)
- Medicinal Chemistry (AREA)
- Physics & Mathematics (AREA)
- Analytical Chemistry (AREA)
- Cell Biology (AREA)
- General Health & Medical Sciences (AREA)
- Bioinformatics & Cheminformatics (AREA)
- Toxicology (AREA)
- Physiology (AREA)
- Measuring Or Testing Involving Enzymes Or Micro-Organisms (AREA)
Description
本発明は、簡便かつ非侵襲的に培養細胞の重層化及び/又は分化の程度を判定する方法並びに培養細胞の重層化及び/又は分化の程度を判定する装置に関する。
再生医療では、皮膚、神経、骨、血管等のもとになる細胞(幹細胞)を用いて病気や怪我で故障した組織や臓器の機能回復を行う。幹細胞の種類は主に(1)体性幹細胞、(2)ES細胞、(3)iPS細胞があり、それぞれ以下の性質を持つ。
(1)体性幹細胞
体性幹細胞は、骨髄・脂肪・血液等に微量で含まれている未成熟の細胞である。体性幹細胞は、体の骨髄や脂肪等にあり、一定の種類の細胞に分化する。成長すると血液細胞になるものを造血幹細胞、骨細胞や脂肪細胞等になるものを間葉系幹細胞、脳の神経になるものを神経幹細胞という。体性幹細胞は患者自身から採取されるので、体性幹細胞を用いた再生医療は拒絶反応が起きないという利点を有する。
(2)ES細胞
ES細胞は、受精卵の一部から作られ、体のあらゆる細胞になる機能を持っている。
(3)iPS細胞は、皮膚等の細胞に遺伝子を入れて作られる。iPS細胞は、ES細胞と同様にあらゆる細胞になるとされる。
例えば、再生医療においては、体内から採取した未分化の角膜細胞や口腔細胞の幹細胞を増殖培養し、適切に重層化及び/又は分化誘導することにより作成された細胞シートを治療に用いることができる。
体性幹細胞は、骨髄・脂肪・血液等に微量で含まれている未成熟の細胞である。体性幹細胞は、体の骨髄や脂肪等にあり、一定の種類の細胞に分化する。成長すると血液細胞になるものを造血幹細胞、骨細胞や脂肪細胞等になるものを間葉系幹細胞、脳の神経になるものを神経幹細胞という。体性幹細胞は患者自身から採取されるので、体性幹細胞を用いた再生医療は拒絶反応が起きないという利点を有する。
(2)ES細胞
ES細胞は、受精卵の一部から作られ、体のあらゆる細胞になる機能を持っている。
(3)iPS細胞は、皮膚等の細胞に遺伝子を入れて作られる。iPS細胞は、ES細胞と同様にあらゆる細胞になるとされる。
例えば、再生医療においては、体内から採取した未分化の角膜細胞や口腔細胞の幹細胞を増殖培養し、適切に重層化及び/又は分化誘導することにより作成された細胞シートを治療に用いることができる。
上記幹細胞はいずれも採取される量が少ないため、採取された細胞は培養により十分な量に増殖させ適切な細胞へ分化誘導を行う必要がある。細胞シートは、以下の工程:(1)採取された幹細胞の分離・純化、(2)幹細胞の培養(必要な細胞数に増やす)、(3)幹細胞の目的組織細胞への分化誘導、及び(4)分化細胞の適当な形態への製剤・製品化により製造することができる。これらの工程をすべて無菌状態で行い、かつ他の細胞による汚染を防ぐために、細胞調製施設(Cell Processing Center)が必要となるケースが多い。
そして上記工程においては、分化誘導が適切に行われているかを確認し、また適切な移植時期を判断するために重層化及び分化の程度をモニタリングする必要がある。重層化及び分化の程度を判定する方法としては、従来以下の技術が知られている。
染色法:
ヘマトキシリン・エオシン染色(H&E染色)では、基底層・有棘層・顆粒層・角質層を識別できる。また、表皮分化マーカーを用いることで基底膜構成成分の局性を確認できる。しかしながら、染色法を用いた場合、細胞にマーカーとなる物質を付着させる必要があり、染色した細胞を治療用材料として用いることができないという問題がある。
ヘマトキシリン・エオシン染色(H&E染色)では、基底層・有棘層・顆粒層・角質層を識別できる。また、表皮分化マーカーを用いることで基底膜構成成分の局性を確認できる。しかしながら、染色法を用いた場合、細胞にマーカーとなる物質を付着させる必要があり、染色した細胞を治療用材料として用いることができないという問題がある。
光学的手法:
引用文献1には、染色や転写等の工程を必要とすることなく簡便かつ正確に重層度を測定するために光学的測定を利用する方法が記載されている。共焦点レーザー顕微鏡を用いて、採取した角層試料が発する自家蛍光を観察し、角層の高さ方向に分割した画像データを比較分析して角層の重層剥離状態を測定する。
引用文献1には、染色や転写等の工程を必要とすることなく簡便かつ正確に重層度を測定するために光学的測定を利用する方法が記載されている。共焦点レーザー顕微鏡を用いて、採取した角層試料が発する自家蛍光を観察し、角層の高さ方向に分割した画像データを比較分析して角層の重層剥離状態を測定する。
引用文献2には、落射光条件下で撮影した角層細胞標本の拡大イメージを画像として取り込み、モノクロ画像を背景部、角層細胞の他の角層細胞と重なっている部分及び角層細胞の他の角層細胞と重なっていない部分との3領域の画像を抽出し、該画像の物理量の多変量解析の結果を指標に、角層細胞の剥がれ具合等の角層細胞の鑑別を行うことが記載されている。引用文献2によれば、当該方法により、どこでも、迅速かつ精度良く、染色又は非染色の条件下における、角層細胞の形状、特に角層細胞の剥がれ具合を把握し肌特性を評価できるとされている。
しかしながら、光学的手法を用いた場合、通常の顕微鏡では重層化を判別することが困難であり、また、共焦点顕微鏡を用いた方法では、画像の3次元構築により重層化まで判別できるが、重層化の状態では細胞が密集しているため形態に基づき分化の程度を判別することは困難であるという問題がある。
培養液成分の検出:
引用文献3には、培養液の細胞生存関連成分、具体的には、グルコース、乳酸及びアンモニアを指標としてこれらの時間変化量に基づき重層化の程度を判定する方法が記載されている。しかしながら、引用文献3に記載の方法によれば、重層化の程度を判定することは可能であるが、分化誘導後の分化の進行程度を判定するのは困難である。分化誘導後に早すぎず遅すぎない適切な細胞の回収時期を判別するためには、分化誘導後にも分化の進行の程度を分析することが可能な方法が必要とされている。
引用文献3には、培養液の細胞生存関連成分、具体的には、グルコース、乳酸及びアンモニアを指標としてこれらの時間変化量に基づき重層化の程度を判定する方法が記載されている。しかしながら、引用文献3に記載の方法によれば、重層化の程度を判定することは可能であるが、分化誘導後の分化の進行程度を判定するのは困難である。分化誘導後に早すぎず遅すぎない適切な細胞の回収時期を判別するためには、分化誘導後にも分化の進行の程度を分析することが可能な方法が必要とされている。
また、培養液成分としての分化した細胞に特異的な特定のタンパクを、ELISA(Enzyme-Linked ImmunoSorbent Assay)法を用いて計測することも有効であるが、このような方法を用いた場合、分析時間が長くかかり、また高価な抗体タンパクが必要であることから分析コストがかかるという問題がある(引用文献4)。
このように、従来の培養細胞の重層化又は分化の程度を判定する方法を医療用細胞の生産プロセスに用いるには、上述したような問題があった。
本発明は、簡便かつ非侵襲的に培養細胞の重層化及び/又は分化の程度を判定する方法並びに培養細胞の重層化及び/又は分化の程度を判定する装置を提供することを課題とする。
本発明者らは、上述した実情に鑑み、細胞の代謝するペントースリン酸経路代謝物及び/又はTCA回路(クエン酸回路)代謝物を計測することにより、簡便かつ非侵襲的に培養細胞の重層化及び/又は分化の程度を判定することができることを見出した。
すなわち、本発明は以下の発明を包含する。
(1)培養細胞の重層化及び/又は分化の程度を判定する方法であって、
(a)培養細胞の培養液を採取する採取工程、
(b)培養液中のペントースリン酸経路及び/又はTCA回路の少なくとも1種の代謝物を分析する分析工程、及び
(c)分析工程で得られた分析結果を、予め求めた培養細胞の重層化及び/又は分化の程度と代謝物の分析結果との相関データベースと照会して、培養細胞の重層化及び/又は分化の程度を判定する判定工程
を含む、上記方法。
(2)ペントースリン酸経路の代謝物が、グルコース-6-リン酸、6-ホスホグルコノ-1,5-ラクトン、6-ホスホグルコン酸、リブロース-5-リン酸、キシルロース-5-リン酸、リボース-5-リン酸、グリセルアルデヒド-3-リン酸、セドヘプツロース-7-リン酸、エリトロース-4-リン酸及びフルクトース-6-リン酸からなる群から選択される少なくとも1種である、上記(1)に記載の方法。
(3)TCA回路の代謝物が、アセチルCoA、クエン酸、cis-アコニット酸、イソクエン酸、オキサロコハク酸、α-ケトグルタル酸、スクシニルCoA、コハク酸、ユビキノン、フマル酸、ユビキノール、L-リンゴ酸及びオキサロ酢酸からなる群から選択される少なくとも1種である、上記(1)又は(2)に記載の方法。
(4)相関データベースが、重層化及び/又は分化の程度と代謝物の生成速度及び/又は消費速度との相関に基づくものである、上記(1)~(3)のいずれかに記載の方法。
(5)相関データベースが、細胞内代謝フラックス解析による解析結果に基づくものである、上記(1)~(4)のいずれかに記載の方法。
(6)工程(b)において分析する代謝物が、細胞内代謝フラックス解析による解析結果により選択される、上記(1)~(5)のいずれかに記載の方法。
(7)工程(c)において、工程(b)の分析結果と相関データベースとを統計学的に比較する、上記(1)~(6)のいずれかに記載の方法。
(8)培養細胞の培養液を採取する採取手段、
採取手段により採取された培養液中のペントースリン酸経路及び/又はTCA回路の少なくとも1種の代謝物を分析する分析手段、及び
分析手段により得られた分析結果を、予め求めた培養細胞の重層化及び/又は分化の程度と代謝物の分析結果との相関データベースと照会して、培養細胞の重層化及び/又は分化の程度を判定する判定手段
を備える、上記培養細胞の重層化及び/又は分化の程度を判定する装置。
(9)分析手段がHPLCである、上記(8)に記載の装置。
(1)培養細胞の重層化及び/又は分化の程度を判定する方法であって、
(a)培養細胞の培養液を採取する採取工程、
(b)培養液中のペントースリン酸経路及び/又はTCA回路の少なくとも1種の代謝物を分析する分析工程、及び
(c)分析工程で得られた分析結果を、予め求めた培養細胞の重層化及び/又は分化の程度と代謝物の分析結果との相関データベースと照会して、培養細胞の重層化及び/又は分化の程度を判定する判定工程
を含む、上記方法。
(2)ペントースリン酸経路の代謝物が、グルコース-6-リン酸、6-ホスホグルコノ-1,5-ラクトン、6-ホスホグルコン酸、リブロース-5-リン酸、キシルロース-5-リン酸、リボース-5-リン酸、グリセルアルデヒド-3-リン酸、セドヘプツロース-7-リン酸、エリトロース-4-リン酸及びフルクトース-6-リン酸からなる群から選択される少なくとも1種である、上記(1)に記載の方法。
(3)TCA回路の代謝物が、アセチルCoA、クエン酸、cis-アコニット酸、イソクエン酸、オキサロコハク酸、α-ケトグルタル酸、スクシニルCoA、コハク酸、ユビキノン、フマル酸、ユビキノール、L-リンゴ酸及びオキサロ酢酸からなる群から選択される少なくとも1種である、上記(1)又は(2)に記載の方法。
(4)相関データベースが、重層化及び/又は分化の程度と代謝物の生成速度及び/又は消費速度との相関に基づくものである、上記(1)~(3)のいずれかに記載の方法。
(5)相関データベースが、細胞内代謝フラックス解析による解析結果に基づくものである、上記(1)~(4)のいずれかに記載の方法。
(6)工程(b)において分析する代謝物が、細胞内代謝フラックス解析による解析結果により選択される、上記(1)~(5)のいずれかに記載の方法。
(7)工程(c)において、工程(b)の分析結果と相関データベースとを統計学的に比較する、上記(1)~(6)のいずれかに記載の方法。
(8)培養細胞の培養液を採取する採取手段、
採取手段により採取された培養液中のペントースリン酸経路及び/又はTCA回路の少なくとも1種の代謝物を分析する分析手段、及び
分析手段により得られた分析結果を、予め求めた培養細胞の重層化及び/又は分化の程度と代謝物の分析結果との相関データベースと照会して、培養細胞の重層化及び/又は分化の程度を判定する判定手段
を備える、上記培養細胞の重層化及び/又は分化の程度を判定する装置。
(9)分析手段がHPLCである、上記(8)に記載の装置。
本発明の重層化及び/又は分化の程度を判定する方法並びに装置によれば、細胞に対して簡便かつ非侵襲的に細胞の重層化及び/又は分化の程度を計測することができる。
上記した以外の、課題、構成及び効果は、以下の実施形態の説明により明らかにされる。
上記した以外の、課題、構成及び効果は、以下の実施形態の説明により明らかにされる。
本発明は、培養細胞の重層化及び/又は分化の程度を判定する方法であって、
(a)培養細胞の培養液を採取する採取工程、
(b)培養液中のペントースリン酸経路及び/又はTCA回路の少なくとも1種の代謝物を分析する分析工程、及び
(c)分析工程で得られた分析結果を、予め求めた培養細胞の重層化及び/又は分化の程度と代謝物の分析結果との相関データベースと照会して、培養細胞の重層化及び/又は分化の程度を判定する判定工程
を含むことを特徴とする。本発明の重層化及び/又は分化の程度を判定する方法(以下、本発明の方法という)は、上記工程(a)、(b)及び(c)を含むことにより、簡便かつ非侵襲的に培養細胞の重層化及び/又は分化の程度を判定することができる。
(a)培養細胞の培養液を採取する採取工程、
(b)培養液中のペントースリン酸経路及び/又はTCA回路の少なくとも1種の代謝物を分析する分析工程、及び
(c)分析工程で得られた分析結果を、予め求めた培養細胞の重層化及び/又は分化の程度と代謝物の分析結果との相関データベースと照会して、培養細胞の重層化及び/又は分化の程度を判定する判定工程
を含むことを特徴とする。本発明の重層化及び/又は分化の程度を判定する方法(以下、本発明の方法という)は、上記工程(a)、(b)及び(c)を含むことにより、簡便かつ非侵襲的に培養細胞の重層化及び/又は分化の程度を判定することができる。
本発明において、「分化」とは、個々の細胞が構造機能的に変化することを意味する。本発明において、「重層化」とは、細胞が何層か重なって肥厚した平面を形成していることを意味する。「重層化」は細胞が分化することにより形成される場合も含み、この場合、重層化と分化は同時に生じている。
本発明の方法は、工程(a)として、培養細胞の培養液を採取する採取工程を含む。
本発明の方法は、工程(a)として、培養細胞の培養液を採取する採取工程を含む。
上記細胞としては、重層化又は分化する細胞であれば特に制限されないが、接着依存性細胞(培養面に直接又は間接的に接着したあとその接着面積を広げていき、その後細胞分裂する細胞、足場依存性細胞ともいう)が好ましい。上記細胞としては、ヒト、マウス、ラット、モルモット、ハムスター、ニワトリ、ウサギ、ブタ、ヒツジ、ウシ、ウマ、イヌ、ネコ、サル等の温血動物、好ましくはヒトから採取された種々の細胞が好ましい。上記細胞としては、例えば、角化細胞(ケラチノサイト)、上皮細胞、粘膜細胞、内皮細胞、線維芽細胞、口腔細胞、角膜細胞等が挙げられ、これらの中で、ヒト口腔細胞及びヒト角膜細胞が好ましい。これらの細胞は、組織や器官から直接採取した初代細胞でもよく、あるいは、それらを何代か継代させたものでもよい。特には、体性幹細胞、ES細胞及びiPS細胞等の幹細胞が好ましい。さらにこれらの細胞は、未分化細胞である胚性幹細胞、多分化能を有する間葉系幹細胞などの多能性幹細胞、単分化能を有する血管内皮前駆細胞などの単能性幹細胞、分化が終了した細胞の何れであってもよい。また、細胞は単一種を培養してもよいし二種以上の細胞を共培養したものであってもよい。
工程(a)を行う採取手段としては、例えば、安全キャビネット内で手作業により培養容器から培養液を採取すること、及び培養容器に設けたサンプリング口に無菌接続した流路を通してポンプもしくは圧送によりサンプリングする装置等が挙げられ、無菌を確実にする点で、培養容器に設けたサンプリング口に無菌接続した流路を通してポンプもしくは圧送によりサンプリングする装置等を用いることが好ましい。
本発明の方法は、工程(b)として、培養液中のペントースリン酸経路及び/又はTCA回路の少なくとも1種の代謝物を分析する分析工程を含む。
細胞の重層化及び細胞の分化では細胞の状態に応じて細胞内の代謝に変化が生じる。各培養状態での細胞内の代謝の変化を観測し、細胞状態の変化に伴う代謝物濃度の変化の大きい代謝物を指標として選択することが、より正確に細胞の重層化・分化の程度を判別することができる観点から好ましい。また、通常、培養液中には不純物が多く、大きな測定誤差を含む可能性があるため、複数の代謝物を指標として用いて判定精度を高めることが好ましい。指標となる代謝物の選択は、細胞内の代謝反応経路を一度に解析することができ、指標となりうる候補成分を一度に見出すことが可能である点で、細胞内代謝フラックス解析を用いることが好ましい。例えば、(1)未分化細胞の増殖期、(2)分化誘導初期、(3)分化誘導中期(通常この時点で移植に使用される)、(4)分化誘導晩期、それぞれにおいて代謝フラックス解析を実施し、代謝経路中の各代謝物の代謝物消費速度もしくは生成速度を求め、各細胞状態(1)-(4)で生成もしくは消費速度の変わる代謝物を指標とすることができる。分析工程においては、指標として選択された代謝物の培養液中の濃度等を分析する。
工程(b)を行う分析手段としては、例えば、固定化酵素法を利用したバイオセンサー、MALDI法等の質量分析、及び液体クロマトグラフィー等が挙げられ、培養液中の多成分を同時に測定できる点で、HPLC等を用いることが好ましい。
上記ペントースリン酸経路の代謝物としては、例えば、グルコース-6-リン酸、6-ホスホグルコノ-1,5-ラクトン、6-ホスホグルコン酸、リブロース-5-リン酸、キシルロース-5-リン酸、リボース-5-リン酸、グリセルアルデヒド-3-リン酸、セドヘプツロース-7-リン酸、エリトロース-4-リン酸及びフルクトース-6-リン酸を挙げることができる。これらは、単独で又は2種以上組み合わせて使用できる。これらの中では、グルコース-6-リン酸、リブロース-5-リン酸、キシルロース-5-リン酸、リボース-5-リン酸、グリセルアルデヒド-3-リン酸、セドヘプツロース-7-リン酸、フルクトース-6-リン酸、エリトロース-4-リン酸が好ましく、グルコース-6-リン酸、グリセルアルデヒド-3-リン酸、セドヘプツロース-7-リン酸、フルクトース-6-リン酸、エリトロース-4-リン酸が特に好ましい。
上記TCA回路の代謝物としては、例えば、アセチルCoA、クエン酸、cis-アコニット酸、イソクエン酸、オキサロコハク酸、α-ケトグルタル酸、スクシニルCoA、コハク酸、ユビキノン、フマル酸、ユビキノール、L-リンゴ酸及びオキサロ酢酸を挙げることができる。これらは、単独で又は2種以上組み合わせて使用できる。これらの中では、オキサロ酢酸、アセチルCoA、クエン酸、α-ケトグルタル酸、スクシニルCoA、コハク酸、フマル酸、L-リンゴ酸が好ましく、クエン酸、α-ケトグルタル酸、スクシニルCoA、コハク酸、フマル酸が特に好ましい。
本発明の方法は、工程(c)として、分析工程で得られた分析結果を、予め求めた培養細胞の重層化及び/又は分化の程度と代謝物の分析結果との相関データベースと照会して、培養細胞の重層化及び/又は分化の程度を判定する判定工程を含む。
相関データベースは、重層化及び/又は分化の程度と代謝物の生成速度及び/又は消費速度との相関に基づくものであることが好ましい。生成速度及び/又は消費速度は、例えば、同位体標識したグルコースを含む培地で培養した細胞の培養液中の各代謝物の同位体比率に基づき決定することができる。
相関データベースは、重層化及び分化の進行と細胞内中間代謝物の生成速度及び/又は消費速度をより詳細に調べることができる点で、細胞内代謝フラックス解析による解析結果に基づくものであることが特に好ましい。以下、細胞内代謝フラックス解析の原理を述べる。
細胞内代謝解析は、シミュレーションと培養実験から構成される(図1参照)。シミュレーションでは解析対象となる細胞の細胞内代謝経路を想定する必要がある。本発明の方法では図2に示す動物細胞で一般に利用される代謝経路モデルを使用することができる。ただし、使用する細胞や精度に応じて代謝経路モデルを修正することもできる。代謝フラックスの推定方法の概念を図1に示す。シミュレーションでは最初にランダムな代謝フラックスの値(図2中R1からR29)を与え、図2の代謝経路を基に、定常状態での細胞内の各代謝物質に含まれる同位体炭素の数の比を計算する。この計算値と実験で測定した細胞内代謝物質の同位体炭素数比との比較を行い、統計学的に有意に差がある場合(異なっている場合)は、シミュレーションによる代謝物質中の同位体数炭素比の値を実験による代謝物質中の同位体炭素数比の値との平均自乗誤差が最小となるようにシミュレーションによる代謝フラックスの値を修正し、同位体炭素比を計算する。そして、統計学的な有意差がなくなるまで、以上のような実験による代謝物質中の同位体炭素数比の値を比較するという操作を繰り返す。通常は2、3回の繰り返し計算で推定できるが、何度繰り返しても統計学的な有意差が生じる場合は、代謝経路モデルが間違っているか、実験データが適切に測定されていないと判断する。また、本発明の方法では、統計学的な考え方より推定値の信頼区間も求めることができる。推定値の信頼区間の算出については、Maciek R.ら、Metabolic Engineering 8 (2006) 324-337, Determination of confidence intervals of metabolic fluxes estimated from stable isotope measurementsを参照することができる。まず、推定代謝フラックスを求め、その推定代謝フラックス(R1からR29)の内1つの代謝フラックス(例えばR3)に着目し、少しずつその代謝フラックスの値を大きくしていく。そして、実験値との比較で統計学的に有意差が出たところで、その代謝フラックスの上限値となる。下限は推定フラックスの値から少しずつ値を下げていき、統計学的に有意差が出たところで下限値となる。順次この操作を他の代謝フラックスに行うことで、すべての代謝フラックスで信頼区間を求めることができる。
尚、本明細書において使用される略語の意味を以下に列挙する。
AcCoA:Acetyl-CoA(アセチルコエンザイムエー)
AKG:α-Ketoglutarate(α-ケトグルタル酸)
Ala:Alanine(アラニン)
Asp:Aspartic acid(アスパラギン酸)
Cit:Citric acid(クエン酸)
DHAP:Dihydroxyacetone phosphate(ジヒドロキシアセトンリン酸)
E4P:Erythrose-4-phosphate(エリトロース-4-リン酸)
Fum:Fumarate(フマル酸)
F6P:Fructose-6-phosphate(フルクトース-6-リン酸)
GAP:Glyceraldehyde-3-phosphate(グリセルアルデヒド-3-リン酸)
Gln:Glutamine(グルタミン)
Glnext:Extracellular Glutamine(細胞外グルタミン)
Gluc:Glucose(グルコース)
Glucext:Extracellular Glucose(細胞外グルコース)
Glu:Glutamic acid(グルタミン酸)
Gly:Glycine(グリシン)
G6P:Glucose-6-phosphate(グルコース-6-リン酸)
Lac:Lactic acid(乳酸)
Lacext:Extracellular Lactic acid(細胞外乳酸)
Mal:Malate(リンゴ酸)
Oac:Oxaloacetate(オキサロ酢酸)
PEP:Phosphoenolpyruvic acid(ホスホエノールピルビン酸)
Pyr:Pyruvate(ピルビン酸)
R5P:Ribose-5-phosphate(リボース-5-リン酸)
Ser:Serine(セリン)
Suc:Succinate(コハク酸)
SucCoA:Succinyl-CoA(サクシニルCoA)
S7P:Sedoheptulose-7-phosphate(セドヘプツロース-7-リン酸)
Thr:Threonine(トレオニン)
3PG:3-phosphoglycerate(3-ホスホグリセリン酸)
AcCoA:Acetyl-CoA(アセチルコエンザイムエー)
AKG:α-Ketoglutarate(α-ケトグルタル酸)
Ala:Alanine(アラニン)
Asp:Aspartic acid(アスパラギン酸)
Cit:Citric acid(クエン酸)
DHAP:Dihydroxyacetone phosphate(ジヒドロキシアセトンリン酸)
E4P:Erythrose-4-phosphate(エリトロース-4-リン酸)
Fum:Fumarate(フマル酸)
F6P:Fructose-6-phosphate(フルクトース-6-リン酸)
GAP:Glyceraldehyde-3-phosphate(グリセルアルデヒド-3-リン酸)
Gln:Glutamine(グルタミン)
Glnext:Extracellular Glutamine(細胞外グルタミン)
Gluc:Glucose(グルコース)
Glucext:Extracellular Glucose(細胞外グルコース)
Glu:Glutamic acid(グルタミン酸)
Gly:Glycine(グリシン)
G6P:Glucose-6-phosphate(グルコース-6-リン酸)
Lac:Lactic acid(乳酸)
Lacext:Extracellular Lactic acid(細胞外乳酸)
Mal:Malate(リンゴ酸)
Oac:Oxaloacetate(オキサロ酢酸)
PEP:Phosphoenolpyruvic acid(ホスホエノールピルビン酸)
Pyr:Pyruvate(ピルビン酸)
R5P:Ribose-5-phosphate(リボース-5-リン酸)
Ser:Serine(セリン)
Suc:Succinate(コハク酸)
SucCoA:Succinyl-CoA(サクシニルCoA)
S7P:Sedoheptulose-7-phosphate(セドヘプツロース-7-リン酸)
Thr:Threonine(トレオニン)
3PG:3-phosphoglycerate(3-ホスホグリセリン酸)
上記シミュレーションでは実験による観測パラメータ(細胞内の各代謝物質の同位体炭素数比及び細胞外代謝フラックス)を必要とするが、通常、対象細胞あるいは使用する培地等によって、必要とする観測パラメータは異なる。本発明の方法では、Pyr、Lac、Ala、Gly、Suc、Fum、Ser、AKG、Mal、Asp、Glu、Gln、Citの13種類を測定パラメータとし、これらの値は同位体比率の測定によって得られた値を用いることができる。
工程(c)を行う判定手段としては、例えば、細胞内の代謝物濃度をデータベースと比較する手段、培養液へ分泌された代謝物濃度をデータベースと比較する手段、培養液中の栄養濃度の変化より細胞で消費された栄養消費速度とデータベースとを比較する手段等が挙げられる。特に、判定精度を高める点で、細胞一個あたりの代謝速度に演算しデータベースと比較する判定手段等を用いることが好ましい。
本発明の方法をより高精度で行う例としては、図3に示すような方法が挙げられる。図3に示すように、当該方法においては、工程(b)の分析結果と相関データベースとを統計学的に比較するため、工程(c)の判定工程をより高精度で行うことができる。図3に示す方法を以下に具体的に説明する。
事前に重層化及び/又は分化の程度と指標物質の経時変化を記録しておく。指標物質の経時変化は代謝フラックスの経時変化でもよく、その場合は、指標物質の代謝に該当する代謝フラックスから指標物質の代謝速度が推定できる。対象とする培養細胞の培養液を採取し、その培養液中の指標成分の濃度を計測する。これを経時的に測定して変化量を算出する。変化量と事前に取得している相関データベースを比較して統計的に一致する場合に、培養細胞がその一致したデータベースでの細胞状態であると判定することができる。
本発明はさらに、培養細胞の培養液を採取する採取手段、
採取手段により採取された培養液中のペントースリン酸経路及び/又はTCA回路の少なくとも1種の代謝物を分析する分析手段、及び
分析手段により得られた分析結果を、予め求めた培養細胞の重層化及び/又は分化の程度と代謝物の分析結果との相関データベースと照会して、培養細胞の重層化及び/又は分化の程度を判定する判定手段
を備える、上記培養細胞の重層化及び/又は分化の程度を判定する装置(以下、本発明の装置という)に関する。本発明の装置は本発明の方法を実施するために好適である。つまり、本発明の装置によれば、細胞に対して簡便かつ非侵襲的に細胞の重層化及び/又は分化の程度を計測することができる。
採取手段により採取された培養液中のペントースリン酸経路及び/又はTCA回路の少なくとも1種の代謝物を分析する分析手段、及び
分析手段により得られた分析結果を、予め求めた培養細胞の重層化及び/又は分化の程度と代謝物の分析結果との相関データベースと照会して、培養細胞の重層化及び/又は分化の程度を判定する判定手段
を備える、上記培養細胞の重層化及び/又は分化の程度を判定する装置(以下、本発明の装置という)に関する。本発明の装置は本発明の方法を実施するために好適である。つまり、本発明の装置によれば、細胞に対して簡便かつ非侵襲的に細胞の重層化及び/又は分化の程度を計測することができる。
本発明の装置において、培養液の採取から分析までの経路は外部からの雑菌混入の防止のため閉鎖系で構成されていることが好ましい。
本発明の装置の一実施態様を図4に示す。本実施態様は、培養装置、採取装置、分析装置、解析装置、記録装置、相関データベース及び制御装置を備える。本実施態様の装置を用いて、例えば以下のように培養細胞の重層化・分化を判定することができる。自動培養装置により細胞シート化培養を行い、培地交換の際に、培養液の一部を採取装置で採取する。採取した培養液を分析装置にて分析し、結果を解析装置により必要に応じて計算を行い記録装置に記録する。相関データベースと測定結果を照合し、現状の細胞状態を判定する。
1.重層化及び/又は分化の程度判別のための指標決定 ヒト口腔細胞又はヒト角膜細胞を用いて、細胞シート化培養を行い、(1)未分化増殖期
、(2)分化誘導初期、(3)分化誘導中期及び(4)分化誘導晩期それぞれの細胞サンプルを準備し、細胞内代謝フラックス解析を行った。
、(2)分化誘導初期、(3)分化誘導中期及び(4)分化誘導晩期それぞれの細胞サンプルを準備し、細胞内代謝フラックス解析を行った。
1.1細胞のシート化培養(1)細胞及び培地
実験にはヒト口腔細胞又はヒト角膜細胞を使用した。増殖培養ではDulbecco's Modified Eagle Medium(DMEM)培地とF12培地を1:1に混合し、10%ウシ血清を添加した培地を用いた。ただし、グルコースに関しては、天然グルコース50%、炭素骨格の1位を同位体標識した1-13Cグルコースを25%、炭素骨格中の6つの炭素をすべての同位体標識したU-13Cグルコース25%の割合になるように調製した。一方、重層化及び分化誘導の際には、KCM培地(ケラチノサイト培地)を用いて培養した。グルコースに関しては、増殖培養と同様に、天然グルコース50%、1-13Cグルコースを25%、U-13Cグルコース25%の割合になるように調製した。
実験にはヒト口腔細胞又はヒト角膜細胞を使用した。増殖培養ではDulbecco's Modified Eagle Medium(DMEM)培地とF12培地を1:1に混合し、10%ウシ血清を添加した培地を用いた。ただし、グルコースに関しては、天然グルコース50%、炭素骨格の1位を同位体標識した1-13Cグルコースを25%、炭素骨格中の6つの炭素をすべての同位体標識したU-13Cグルコース25%の割合になるように調製した。一方、重層化及び分化誘導の際には、KCM培地(ケラチノサイト培地)を用いて培養した。グルコースに関しては、増殖培養と同様に、天然グルコース50%、1-13Cグルコースを25%、U-13Cグルコース25%の割合になるように調製した。
(2)培養方法
ヒト口腔細胞又はヒト角膜細胞を、温度応答性膜を有した6ウェルプレートに播き、上記同位体グルコースを含むDMEM/F12培地にてインキュベータ内(37℃、5%CO2、>95%湿度)で培養し、3日もしくは4日に1度培地交換を行い、コンフレントまで増殖した時点で分化誘導用培地(KCM培地)に交換して分化させた。分化誘導用培地に交換後3日もしくは4日に1度KCM培地にて培地交換を行うことで細胞を重層化させ、細胞シートを形成した。
ヒト口腔細胞又はヒト角膜細胞を、温度応答性膜を有した6ウェルプレートに播き、上記同位体グルコースを含むDMEM/F12培地にてインキュベータ内(37℃、5%CO2、>95%湿度)で培養し、3日もしくは4日に1度培地交換を行い、コンフレントまで増殖した時点で分化誘導用培地(KCM培地)に交換して分化させた。分化誘導用培地に交換後3日もしくは4日に1度KCM培地にて培地交換を行うことで細胞を重層化させ、細胞シートを形成した。
1.2細胞内中間代謝物の同位体比率の測定(1)分析方法
同位体標識した細胞を、6ウェルプレートをインキュベータから取り出し、PBS溶液で1回洗浄し、洗浄液を取り除いた後、-20℃に冷やしておいたメタノールを200μLずつ添加し、ウェル一面へ広げた。プレートを氷上に移し、各ウェルに蒸留水を600μLずつ加えた。ピペットマンのチップの先端でウェル表面をこするようにして細胞を剥離し、氷冷してあるマイクロチューブに移した。1分間超音波処理を行った後、更にクロロホルムを800μL加えた。4℃にてボルテックスミキサにて30分間混合し、遠心器(MicrofugeR;Beckman Coulter社)にて遠心分離(11,500rpm、4℃、30分)し、2層に分かれた上層を別のマイクロチューブに移した。一晩エバポレーションにより乾燥させた。
同位体標識した細胞を、6ウェルプレートをインキュベータから取り出し、PBS溶液で1回洗浄し、洗浄液を取り除いた後、-20℃に冷やしておいたメタノールを200μLずつ添加し、ウェル一面へ広げた。プレートを氷上に移し、各ウェルに蒸留水を600μLずつ加えた。ピペットマンのチップの先端でウェル表面をこするようにして細胞を剥離し、氷冷してあるマイクロチューブに移した。1分間超音波処理を行った後、更にクロロホルムを800μL加えた。4℃にてボルテックスミキサにて30分間混合し、遠心器(MicrofugeR;Beckman Coulter社)にて遠心分離(11,500rpm、4℃、30分)し、2層に分かれた上層を別のマイクロチューブに移した。一晩エバポレーションにより乾燥させた。
乾燥したサンプルに2% methoxyamine hydrochloride(O-メチルヒドロキシルアミン塩酸塩)(Pierce社)を30μLずつ加え、軽くボルテックスにより混合し、卓上遠心で溶液を中部下部に集めた後、ヒートブロック上で37℃、2時間反応させた。MTBSTFA(N-メチル-N-t-ブチルジメチルシリルトリフルオロアセトアミド)+1% TBDMCS(t-ブチルジメチルシリル)溶液(Pierce社)を45μLずつ加え、軽くボルテックスにより混合し、卓上遠心で溶液を中部下部に集めた後、ヒートブロック上で55℃、1時間反応させた。反応溶液をGC/MS分析用容器に入れ替え、分析まで常温で保管した。
GC/MS分析では、Agilent 7890A(Agilent社)、カラム種類30m DB-35MS capillary columnを使用し、測定条件はカラム温度勾配が3.5℃/minで100℃から300℃までの温度制御で、注入口温度270℃、キャリアガスはヘリウムガスで流量1mL/minで分析を行った。
(2)分析結果
ヒト口腔細胞の場合の分析結果を図5に、ヒト角膜細胞の場合の分析結果を図6に示す。尚、図5及び図6中の(m+X)との記載中のXは、細胞内代謝物中の同位体標識された炭素数を示す。
ヒト口腔細胞の場合の分析結果を図5に、ヒト角膜細胞の場合の分析結果を図6に示す。尚、図5及び図6中の(m+X)との記載中のXは、細胞内代謝物中の同位体標識された炭素数を示す。
ピルビン酸(Pyr)に関し、同位体非標識ピルビン酸(m+0)の割合は、(1)未分化増殖期で最も多く、(2)分化誘導の際には減少した。ただし、(4)分化誘導晩期には同位体非標識ピルビン酸(m+0)の割合は若干増加した。
図7に、各細胞内代謝物の炭素骨格中の炭素原子の位置の移動を表すマップを示す。同位体グルコースは細胞内で代謝されピルビン酸になるが、この過程でペントースリン酸経路に流れる経路(G6P⇒P5P)では1位の炭素原子が二酸化炭素として放出されてしまう(図7、図2参照)。一方、その他の経路では1位の炭素原子を放出することはない。本実験では、1-13Cグルコースを25%混ぜてあるため、ペントースリン酸経路への流れが大きいと1-13Cグルコース由来の代謝物は同位体標識を失い、ピルビン酸への代謝に影響する。その結果、ペントースリン酸経路への流れが大きくなった場合は同位体非標識ピルビン酸(m+0)の割合が増加する。この検討より、(1)未分化増殖期⇒(3)分化誘導中期でペントースリン酸経路活性が減少し、(4)分化誘導晩期で若干ペントースリン酸経路活性が回復することがわかった。このことは、ペントースリン酸経路中の代謝物の増減を調べることで重層化・分化の進行程度を判定することが可能であることを示す。
フマル酸に関し、同位体非標識フマル酸(m+0)の割合は(1)未分化増殖期から(4)分化誘導晩期に至るまで順次増加を示した。これは無標識のグルタミンを基質としてTCA回路に流れ込む経路があり、その経路(AKG⇔Glu、AKG⇔Suc、Suc⇔Fum)が重層化・分化とともに増加することを示す。
一方、マレイン酸(Mal)に関してみると、(1)未分化増殖から(3)分化誘導中期まで同位体非標識マレイン酸(m+0)の割合は減少し、その後、(4)分化誘導晩期では増加した。これは、(1)未分化増殖から(3)分化誘導中期ではMal⇔Fumのフラックス以上に同位体標識物質が流れ込むPyr⇔Oac、Oac⇔Mal、Pyr⇔Malのフラックスが増加し、(3)分化誘導中期から(4)分化誘導晩期では同代謝経路のフラックスが減少することを示している。
このことは、TCA回路中の代謝物の増減を調べることで重層化・分化の進行程度を判定することが可能であることを示す。
図5及び図6からわかるように、ヒト口腔細胞とヒト角膜細胞は、由来は異なるものの重層化・分化における同位体比率の傾向が同様であった。よって、重層化・分化に伴う代謝物生成もしくは消費速度の変化の傾向は同じになると考えられる。
1.3細胞内代謝解析 1.2(2)での分析結果を用いて、図1に示すシミュレーションを行った。ヒト口腔細胞での解析結果を図8に示す。分化誘導初期で、誘導体化が始まるとペントースリン酸経路のフラックス全体が減少した。一方、TCA回路全体のフラックスが増大し、特にMal⇔OacとOac⇔Citでのフラックスが増加した。分化誘導中期では上記の増加傾向が強まった。分化誘導晩期ではTCA回路中のMal⇔OacとOac⇔Citでのフラックスが減少し、その他のTCA回路中のフラックスは未分化状態のフラックスと同等になった。ヒト角膜細胞においても代謝フラックスの増減の傾向は一致した。
ヒト角膜細胞での解析結果を図9に示す。Pyr⇒Malが小さくなる点を除いては、ヒト口腔細胞と同様の傾向を示した。
本結果より、ペントースリン酸経路及びTCA回路のすべての代謝成分においてそれぞれの増減を指標とすることで重層化・分化の判定に用いることができることがわかった。
図8に示すヒト口腔細胞の場合の分析結果及び図9に示すヒト角膜細胞の場合の分析結果より、特にグルコース-6-リン酸、グリセルアルデヒド-3-リン酸、セドヘプツロース-7-リン酸、フルクトース-6-リン酸、エリトロース-4-リン酸、クエン酸、α-ケトグルタル酸、スクシニルCoA、コハク酸、フマル酸を指標として重層化・分化の判定を行うことが好適であることがわかった。
2.重層化及び分化程度の判定 対象とする細胞シート化培養での培養液をサンプリングし、その培養液中の指標成分を分析する。これを経時的に測定し、解析装置により変化量を算出する。現状の培養がどの細胞状態に相当するかを、解析装置で算出した変化量と事前に取得しているデータベースと比較し判定する。
尚、本発明は上記した実施例に限定されるものではなく、様々な変形例が含まれる。例えば、上記した実施例は本発明をわかりやすく説明するために詳細に説明したものであり、必ずしも説明した全ての構成を備えるものに限定されるものではない。また、実施例の構成の一部を他の実施例の構成に置き換えることが可能であり、また、ある実施例の構成に他の実施例の構成を加えることも可能である。また、各実施例の構成の一部について、他の構成の追加・削除・置換をすることが可能である。
本発明の重層化及び/又は分化の程度を判定する方法及び装置は、特に再生医療に使用する細胞に関し、培養工程での品質管理や、適切な移植時期の確認に使用することができる。例えば、再生医療に使用する細胞を培養する際に適用される細胞モニタリングに使用することができる。
1:分析装置
2:記録装置
3:解析装置
4:制御装置
5:培養装置
6:採取装置
7:相関データベース
8:培養実験及び代謝解析
2:記録装置
3:解析装置
4:制御装置
5:培養装置
6:採取装置
7:相関データベース
8:培養実験及び代謝解析
Claims (9)
- 培養細胞の重層化及び/又は分化の程度を判定する方法であって、
(a)培養細胞の培養液を採取する採取工程、
(b)培養液中のペントースリン酸経路及び/又はTCA回路の少なくとも1種の代謝物を分析する分析工程、及び
(c)分析工程で得られた分析結果を、予め求めた培養細胞の重層化及び/又は分化の程度と代謝物の分析結果との相関データベースと照会して、培養細胞の重層化及び/又は分化の程度を判定する判定工程
を含む、上記方法。 - ペントースリン酸経路の代謝物が、グルコース-6-リン酸、6-ホスホグルコノ-1,5-ラクトン、6-ホスホグルコン酸、リブロース-5-リン酸、キシルロース-5-リン酸、リボース-5-リン酸、グリセルアルデヒド-3-リン酸、セドヘプツロース-7-リン酸、エリトロース-4-リン酸及びフルクトース-6-リン酸からなる群から選択される少なくとも1種である、請求項1に記載の方法。
- TCA回路の代謝物が、アセチルCoA、クエン酸、cis-アコニット酸、イソクエン酸、オキサロコハク酸、α-ケトグルタル酸、スクシニルCoA、コハク酸、ユビキノン、フマル酸、ユビキノール、L-リンゴ酸及びオキサロ酢酸からなる群から選択される少なくとも1種である、請求項1又は2に記載の方法。
- 相関データベースが、重層化及び/又は分化の程度と代謝物の生成速度及び/又は消費速度との相関に基づくものである、請求項1~3のいずれか1項に記載の方法。
- 相関データベースが、細胞内代謝フラックス解析による解析結果に基づくものである、請求項1~4のいずれか1項に記載の方法。
- 工程(b)において分析する代謝物が、細胞内代謝フラックス解析による解析結果により選択される、請求項1~5のいずれか1項に記載の方法。
- 工程(c)において、工程(b)の分析結果と相関データベースとを統計学的に比較する、請求項1~6のいずれか1項に記載の方法。
- 培養細胞の培養液を採取する採取手段、
採取手段により採取された培養液中のペントースリン酸経路及び/又はTCA回路の少なくとも1種の代謝物を分析する分析手段、及び
分析手段により得られた分析結果を、予め求めた培養細胞の重層化及び/又は分化の程度と代謝物の分析結果との相関データベースと照会して、培養細胞の重層化及び/又は分化の程度を判定する判定手段
を備える、上記培養細胞の重層化及び/又は分化の程度を判定する装置。 - 分析手段がHPLCである、請求項8に記載の装置。
Priority Applications (1)
| Application Number | Priority Date | Filing Date | Title |
|---|---|---|---|
| US14/419,185 US20150192568A1 (en) | 2012-08-29 | 2013-07-17 | Method and apparatus for determining degree of stratification and/or differentiation |
Applications Claiming Priority (2)
| Application Number | Priority Date | Filing Date | Title |
|---|---|---|---|
| JP2012188823A JP2014045663A (ja) | 2012-08-29 | 2012-08-29 | 重層化及び/又は分化の程度を判定する方法並びに装置 |
| JP2012-188823 | 2012-08-29 |
Publications (1)
| Publication Number | Publication Date |
|---|---|
| WO2014034307A1 true WO2014034307A1 (ja) | 2014-03-06 |
Family
ID=50183127
Family Applications (1)
| Application Number | Title | Priority Date | Filing Date |
|---|---|---|---|
| PCT/JP2013/069336 Ceased WO2014034307A1 (ja) | 2012-08-29 | 2013-07-17 | 重層化及び/又は分化の程度を判定する方法並びに装置 |
Country Status (3)
| Country | Link |
|---|---|
| US (1) | US20150192568A1 (ja) |
| JP (1) | JP2014045663A (ja) |
| WO (1) | WO2014034307A1 (ja) |
Families Citing this family (5)
| Publication number | Priority date | Publication date | Assignee | Title |
|---|---|---|---|---|
| JP6116400B2 (ja) | 2013-06-24 | 2017-04-19 | 株式会社日立ハイテクノロジーズ | 細胞状態判定方法、及びそれを用いた自動分析装置 |
| WO2016052558A1 (ja) | 2014-09-29 | 2016-04-07 | 東京エレクトロン株式会社 | 培養培地分析による多能性幹細胞の未分化状態の判定方法 |
| JP6934418B2 (ja) * | 2015-03-18 | 2021-09-15 | ロート製薬株式会社 | 培養細胞製品の製造装置及び製造方法 |
| JP2016212092A (ja) * | 2015-05-13 | 2016-12-15 | 御木本製薬株式会社 | 角層細胞標本の解析方法 |
| EP3859008B1 (en) | 2018-11-02 | 2022-11-16 | PHC Holdings Corporation | Method for estimating cell count, and device for estimating cell count |
Citations (3)
| Publication number | Priority date | Publication date | Assignee | Title |
|---|---|---|---|---|
| JPH0227977A (ja) * | 1988-07-18 | 1990-01-30 | Hitachi Ltd | 動物細胞の培養装置、培養方法及び活性診断装置 |
| JP2005245440A (ja) * | 2004-02-05 | 2005-09-15 | Ajinomoto Co Inc | 同位体で標識された基質を用いた細胞内代謝フラックスの解析方法 |
| JP2010081809A (ja) * | 2008-09-29 | 2010-04-15 | Hitachi Plant Technologies Ltd | 培養装置及び培養方法 |
-
2012
- 2012-08-29 JP JP2012188823A patent/JP2014045663A/ja active Pending
-
2013
- 2013-07-17 US US14/419,185 patent/US20150192568A1/en not_active Abandoned
- 2013-07-17 WO PCT/JP2013/069336 patent/WO2014034307A1/ja not_active Ceased
Patent Citations (3)
| Publication number | Priority date | Publication date | Assignee | Title |
|---|---|---|---|---|
| JPH0227977A (ja) * | 1988-07-18 | 1990-01-30 | Hitachi Ltd | 動物細胞の培養装置、培養方法及び活性診断装置 |
| JP2005245440A (ja) * | 2004-02-05 | 2005-09-15 | Ajinomoto Co Inc | 同位体で標識された基質を用いた細胞内代謝フラックスの解析方法 |
| JP2010081809A (ja) * | 2008-09-29 | 2010-04-15 | Hitachi Plant Technologies Ltd | 培養装置及び培養方法 |
Non-Patent Citations (3)
| Title |
|---|
| SI, Y. ET AL.: "Flux Profile and Modularity Analysis of Time-dependent Metabolic Changes of de novo Adipocyte Formation.", AM. J. PHYSIOL. ENDOCRINOL. METAB., vol. 292, no. 6, 2007, pages E1637 - 1646 * |
| VARUM, S. ET AL.: "Energy Metabolism in Human Pluripotent Stem Cells and Their Differentiated Counterparts.", PLOS ONE, vol. 6, no. 6, 2011, pages 1 - 15 * |
| WANG, J. ET AL.: "Metabolic Specialization of Mouse Embryonic Stem Cells.", COLD SPRING HARB. SYMP. QUANT. BIOL., vol. 76, 2011, pages 183 - 193 * |
Also Published As
| Publication number | Publication date |
|---|---|
| JP2014045663A (ja) | 2014-03-17 |
| US20150192568A1 (en) | 2015-07-09 |
Similar Documents
| Publication | Publication Date | Title |
|---|---|---|
| US20240302355A1 (en) | Method and system for determining integrated metabolic baseline and potential of living cells | |
| Chen et al. | Induced pluripotent stem cells: at the heart of cardiovascular precision medicine | |
| Walls et al. | Metabolic mapping of astrocytes and neurons in culture using stable isotopes and gas chromatography-mass spectrometry (GC-MS) | |
| WO2014034307A1 (ja) | 重層化及び/又は分化の程度を判定する方法並びに装置 | |
| Pilato et al. | Isolation and characterization of cardiac mesenchymal stromal cells from endomyocardial bioptic samples of arrhythmogenic cardiomyopathy patients | |
| Brewington et al. | Generation of human nasal epithelial cell spheroids for individualized cystic fibrosis transmembrane conductance regulator study | |
| DE602005023552D1 (de) | Verfahren zur Analyse des intrazellulären metabolischen Flusses unter Verwendung eines mit Isotop markierten Substrates | |
| Goßmann et al. | Integration of mechanical conditioning into a high throughput contractility assay for cardiac safety assessment | |
| Pesl et al. | Phenotypic assays for analyses of pluripotent stem cell–derived cardiomyocytes | |
| Djouadi et al. | Characterization of fatty acid oxidation in human muscle mitochondria and myoblasts | |
| Geraets et al. | Human embryonic stem cell-derived cardiomyocytes as an in vitro model to study cardiac insulin resistance | |
| Natali et al. | Scoring human sperm morphology using Testsimplets and Diff-Quik slides | |
| JP7355853B2 (ja) | 細胞の分化状態の評価方法及び細胞培養システム | |
| Keilhoff et al. | The differentiation of spinal cord motor neurons is associated with changes of the mitochondrial phospholipid cardiolipin | |
| Bolteus et al. | Assays for measuring extracellular GABA levels and cell migration rate in acute slices | |
| Biendarra‐Tiegs et al. | An iPS‐derived in vitro model of human atrial conduction | |
| Park et al. | Human induced pluripotent stem cell-cardiomyocytes for cardiotoxicity assessment: a comparative study of arrhythmia-inducing drugs with multi-electrode array analysis | |
| JPWO2021144956A5 (ja) | ||
| Burboa et al. | Impact of matrix gel variations on primary culture of microvascular endothelial cell function | |
| Klingler et al. | Detection of proton release from cultured human myotubes to identify malignant hyperthermia susceptibility | |
| Davis et al. | Age dependent expression and distribution of nitric oxide (NO) synthase isoforms in the ovine kidney | |
| JP2017127288A (ja) | 測定装置 | |
| US20220017870A1 (en) | Methods of identifying therapeutic targets for treating angiogenesis | |
| CN112813021A (zh) | 评估药物心血管安全性的细胞模型及方法 | |
| Perkins | Response of Pulmonary Artery Endothelial Cells to Altered Stress Conditions |
Legal Events
| Date | Code | Title | Description |
|---|---|---|---|
| 121 | Ep: the epo has been informed by wipo that ep was designated in this application |
Ref document number: 13834188 Country of ref document: EP Kind code of ref document: A1 |
|
| WWE | Wipo information: entry into national phase |
Ref document number: 14419185 Country of ref document: US |
|
| NENP | Non-entry into the national phase |
Ref country code: DE |
|
| 122 | Ep: pct application non-entry in european phase |
Ref document number: 13834188 Country of ref document: EP Kind code of ref document: A1 |