WO2014013603A1 - 監視システム及び監視プログラム - Google Patents
監視システム及び監視プログラム Download PDFInfo
- Publication number
- WO2014013603A1 WO2014013603A1 PCT/JP2012/068431 JP2012068431W WO2014013603A1 WO 2014013603 A1 WO2014013603 A1 WO 2014013603A1 JP 2012068431 W JP2012068431 W JP 2012068431W WO 2014013603 A1 WO2014013603 A1 WO 2014013603A1
- Authority
- WO
- WIPO (PCT)
- Prior art keywords
- event
- condition
- conclusion
- performance
- value
- Prior art date
- Legal status (The legal status is an assumption and is not a legal conclusion. Google has not performed a legal analysis and makes no representation as to the accuracy of the status listed.)
- Ceased
Links
Images









Classifications
-
- H—ELECTRICITY
- H04—ELECTRIC COMMUNICATION TECHNIQUE
- H04L—TRANSMISSION OF DIGITAL INFORMATION, e.g. TELEGRAPHIC COMMUNICATION
- H04L43/00—Arrangements for monitoring or testing data switching networks
- H04L43/10—Active monitoring, e.g. heartbeat, ping or trace-route
-
- H—ELECTRICITY
- H04—ELECTRIC COMMUNICATION TECHNIQUE
- H04L—TRANSMISSION OF DIGITAL INFORMATION, e.g. TELEGRAPHIC COMMUNICATION
- H04L41/00—Arrangements for maintenance, administration or management of data switching networks, e.g. of packet switching networks
- H04L41/16—Arrangements for maintenance, administration or management of data switching networks, e.g. of packet switching networks using machine learning or artificial intelligence
-
- H—ELECTRICITY
- H04—ELECTRIC COMMUNICATION TECHNIQUE
- H04L—TRANSMISSION OF DIGITAL INFORMATION, e.g. TELEGRAPHIC COMMUNICATION
- H04L41/00—Arrangements for maintenance, administration or management of data switching networks, e.g. of packet switching networks
- H04L41/06—Management of faults, events, alarms or notifications
- H04L41/0631—Management of faults, events, alarms or notifications using root cause analysis; using analysis of correlation between notifications, alarms or events based on decision criteria, e.g. hierarchy, tree or time analysis
- H04L41/065—Management of faults, events, alarms or notifications using root cause analysis; using analysis of correlation between notifications, alarms or events based on decision criteria, e.g. hierarchy, tree or time analysis involving logical or physical relationship, e.g. grouping and hierarchies
Definitions
- the present invention relates to a monitoring system and a monitoring program for analyzing a root cause of an event (event) occurring in a monitored node device.
- Monitoring systems that monitor node devices such as servers, storage, and network devices, detect events such as failures and status changes that occur in monitored node devices, and analyze the root cause of the detected events are known (for example, see Patent Document 1).
- the monitoring system has a plurality of rules indicating a correspondence relationship between one or more condition events related to any of a plurality of node devices and a conclusion that is caused when the one or more condition events occur. (Hereinafter referred to as “event cause information”) and a certainty factor indicating the certainty that each conclusion is a cause is calculated based on whether or not a condition event is detected.
- the certainty factor for a certain conclusion is the ratio of the number of condition events detected by the monitoring system among the condition events associated with the conclusion to the total number of condition events associated with the conclusion. Is done.
- the monitoring system extracts the cause candidates based on the calculated certainty factor, and displays the result of the cause analysis including them.
- the administrator estimates the root cause by referring to the result of the cause analysis displayed on the monitoring system.
- the monitoring system cannot detect the event that is expected to occur because the situation that can generate the event or the situation that can notify the occurrence of the event is not prepared.
- a “Port Link Down” event related to IP switch 1 hereinafter referred to as “event 1”
- a “logical disk failure” event related to VM (virtual machine) 1 hereinafter referred to as “event” is affected by the event.
- Event 3 a “logical disk failure” event related to VM2 (hereinafter referred to as “event 3”), for example, if VM1 is shutting down, even if event 1 occurs , VM1 is not in a situation where event 2 can be generated, so the monitoring system cannot detect event 2 that is expected to occur.
- the monitoring system when the monitoring system cannot detect an event that is expected to occur, the certainty about the conclusion associated with the event that cannot be detected is calculated to be lower than the original value. End up. For example, when the above causal relationship exists, the monitoring system holds rules in which event 1 is a conclusion and event 1, event 2, and event 3 are conditional events. Then, the monitoring system determines the certainty that the event 1 is a cause based on the detection of the rule and the event 1, the event 2, and the event 3, and the conditional event (the event 1, the event 2, and the event It is calculated as a ratio of the number of condition events that have occurred among event 1, event 2, and event 3 to the number of 3) (3 in this example).
- event 1 occurs, event 2 and event 3 occur under the influence of the event 1, and these events (event 1, event 2, and event 3) are detected by the monitoring system. Become. When the monitoring system detects all of event 1, event 2, and event 3, the certainty about event 1 being the cause is calculated as (3/3 ⁇ 100)%.
- the certainty that the event 1 is the cause is at most (2/3 ⁇ 100)%. Then, the more conditional events that the monitoring system cannot detect, the lower the certainty factor is calculated.
- the monitoring system that extracts the cause candidate or the administrator who estimates the cause extracts or estimates the conclusion that the certainty factor is calculated low. There is a risk that it will be overlooked.
- the monitoring system analyzes the cause of an event that occurred in any of multiple node devices.
- the storage device of the monitoring system stores a plurality of rules indicating a correspondence relationship between one or more condition events related to any of the plurality of node devices and a conclusion that is a cause when the one or more condition events occur.
- the control device of the monitoring system detects any one or more condition events among a plurality of condition events included in the plurality of rules, and the first conclusion associated with the detected condition event based on the rules And for each of any one or more of the plurality of condition events included in the plurality of rules, whether or not the monitoring system can detect the condition event is determined.
- the first index value indicating the probability that the first conclusion is the cause is calculated on the basis of the presence / absence of detection of one or more condition events associated with the conclusion and the result of the detection possibility determination To do.
- FIG. 1 is a configuration diagram of an example of a computer system according to the first embodiment.
- FIG. 2 is a configuration diagram of an example of an event cause information repository according to the first embodiment.
- FIG. 3 is a configuration diagram of an example of an event message according to the first embodiment.
- FIG. 4 is a configuration diagram of an example of an event queue table according to the first embodiment.
- FIG. 5 is a configuration diagram of an example of a performance information table according to the first embodiment.
- FIG. 6 is a configuration diagram of an example of the event occurrence rule repository according to the first embodiment.
- FIG. 7 is a configuration diagram of an example of rule memory data according to the first embodiment.
- FIG. 8 is a configuration diagram of an example of an event deletion setting table according to the first embodiment.
- FIG. 1 is a configuration diagram of an example of a computer system according to the first embodiment.
- FIG. 2 is a configuration diagram of an example of an event cause information repository according to the first embodiment.
- FIG. 3 is a configuration diagram of an
- FIG. 9 is a configuration diagram of an example of an event deletion task table according to the first embodiment.
- FIG. 10 is a flowchart of the rule memory data generation process according to the first embodiment.
- FIG. 11 is a flowchart of event reception processing and event writing processing according to the first embodiment.
- FIG. 12 is a flowchart of the performance information reception process according to the first embodiment.
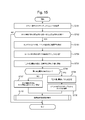
- FIG. 13 is a flowchart of the certainty factor evaluation process according to the first embodiment.
- FIG. 14 is a flowchart of event occurrence condition investigation processing according to the first embodiment.
- FIG. 15 is a flowchart of event deletion processing according to the first embodiment.
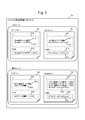
- FIG. 16 is a configuration diagram of an example of a first survey result display screen according to the first embodiment.
- FIG. 17 is a configuration diagram of an example of a second survey result display screen according to the first embodiment.
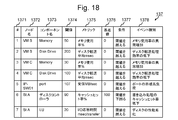
- FIG. 18 is a configuration diagram of an example of a performance event definition table according to the second embodiment.
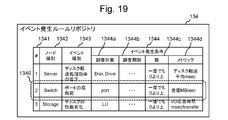
- FIG. 19 is a configuration diagram of an example of an event occurrence rule repository according to the second embodiment.
- FIG. 20 is a configuration diagram of an example of rule memory data according to the second embodiment.
- FIG. 21 is a flowchart of the performance information monitoring process according to the second embodiment.
- FIG. 22 is a flowchart of event occurrence condition investigation processing according to the second embodiment.
- the information of the present invention may be described by an expression such as “aaa table”.
- the information may be expressed by other than a data structure such as a table. Therefore, the “aaa table” or the like may be referred to as “aaa information” to indicate that it does not depend on the data structure.
- program performs processing determined by being executed by the processor while using the memory and the communication port (network I / F).
- the subject may be an explanation.
- the processing disclosed with the program as the subject may be processing performed by a computer such as a monitoring system.
- part or all of the program may be realized by dedicated hardware.
- Various programs may be installed in each computer by a program distribution server or a computer-readable storage medium.
- a set of one or more computers that monitor a computer system and display information for display may be referred to as a monitoring system.
- the monitoring computer displays display information
- the monitoring computer is a monitoring system
- a combination of the monitoring computer and a display device is also a monitoring system.
- a plurality of computers may realize processing equivalent to that of the monitoring computer.
- the plurality of computers (the display device when the display device performs display) Is also a monitoring system.
- FIG. 1 is a configuration diagram of an example of a computer system according to the first embodiment.
- the computer system includes a monitoring computer 1, one or more servers 2 (in the figure, server A and server B), one or more storages 3, one or more network devices 4, and a LAN (Local Area Network). And a communication network 5.
- the network device 4 is an IP (Internet Protocol) switch, a router, or the like.
- the monitoring computer 1, the server 2, and the storage 3 are connected to each other via a communication network 5 and a network device 4.
- node devices devices (server 2, storage 3, network device 4, etc.) constituting the computer system may be referred to as “node devices”.
- the computer system may have, for example, a host computer, NAS (Network Attached Storage), file server, printer, etc. as node devices.
- NAS Network Attached Storage
- a logical or physical component such as a device included in the node apparatus may be referred to as a “component”. Examples of components include a CPU (Central Processing Unit), a memory, a network I / F (interface), a disk, a program, a volume defined by the storage 3, a RAID (Redundant Arrays of Inexpensive Disks) group, and the like.
- a node device to be monitored by the monitoring computer 1 may be referred to as a “monitoring target device”.
- the server 2 is a computer that executes a server program or the like and provides a predetermined service to a user.
- the server 2 includes a CPU 21, a memory 22, a network I / F 23, an iSCSI (Internet Small Computer System). Interface) initiator 24.
- an iSCSI disk 25 which is a virtual volume to which the storage area of the storage 3 is allocated, is formed.
- the server 2 can use the iSCSI disk 25 like a local hard disk through the iSCSI initiator 24.
- the network I / F 23 is an interface device for connecting to the communication network 5. For example, when an event occurs in the server 2, the server 2 transmits an event message indicating the occurrence of the event to the monitoring computer 1.
- the server 2 may be a physical server or a virtual server that operates one or more VMs. In the present embodiment, when the server 2 is a virtual server, each VM operated by the virtual server becomes a node device.
- the storage 3 is a device that provides a storage area to the server 2 or the like.
- the storage 3 includes a storage controller 31, a disk 32, and a network I / F 33.
- the storage 3 may have another type of storage medium such as a solid storage medium or an optical storage medium instead of or in addition to the disk 32.
- the network I / F 33 is an interface device for connecting to the communication network 5.
- the storage 3 provides a storage area for forming the iSCSI disk 25 to the server 2.
- the storage 3 transmits an event message indicating the occurrence of the event to the monitoring computer 1.
- the server 2 may be configured to detect an event that has occurred in the storage 3, and the server 2 may transmit an event message of the event that has occurred in the storage 3 to the monitoring computer 1.
- the monitoring computer 1 is a computer that manages the monitoring target device.
- the monitoring computer 1 is, for example, a general-purpose computer, and includes a CPU 11, a memory 12, a disk 13, a video I / F 14, a network I / F 15, and a bus 16.
- the CPU 11, memory 12, disk 13, video I / F 14, and network I / F 15 are connected to each other via a bus 16.
- the memory 12 includes a rule loader program 121, an event reception program 122, an event writing program 123, a performance information reception program 124, a certainty factor evaluation program 125, an event occurrence condition investigation program 126, and an event deletion program 127.
- the rule memory 128 is stored. Various programs 121 to 127 stored in the memory 12 are executed by the CPU 11.
- the rule memory 128 stores rule memory data used for the certainty factor evaluation process for calculating the certainty factor.
- the disk 13 stores an event cause information repository 131, an event queue table 132, a performance information table 133, an event occurrence rule repository 134, an event deletion setting table 135, and an event deletion task table 136.
- the event cause information repository 131 stores one or more event cause information (rules).
- the event cause information includes a general rule described in a format that does not depend on the actual configuration of the computer system, and an expanded rule that expands the general rule into a format that depends on the actual configuration of the computer system.
- the event occurrence rule repository 134 stores one or more event occurrence rules.
- the event occurrence rule is a rule for determining whether a situation in which the event can be generated or a situation in which the occurrence of the event can be notified is prepared in a node device related to the target event, that is, A rule for determining whether or not the monitoring computer 1 can detect the event.
- the network I / F 15 is an interface device for connecting to the communication network 5.
- the video I / F 14 is an interface device for connecting to the display 17.
- the monitoring computer 1 can present the result of cause analysis to the administrator by displaying the result of cause analysis and other information on the display 17. Note that the monitoring computer 1 may have a display 17 inside.
- the monitoring computer 1 receives various information such as an event message indicating that an event has occurred in the monitoring target device, performance information about the monitoring target device, and the like from the monitoring target device. Based on various information received from the monitoring target device, the monitoring computer 1 performs various processes such as a process of analyzing the cause of the event (confidence level evaluation process) and outputs the processing result.
- various processes such as a process of analyzing the cause of the event (confidence level evaluation process) and outputs the processing result.
- FIG. 2 is a configuration diagram of an example of an event cause information repository according to the first embodiment.
- the event cause information repository 131 stores one or more general rules 61 and one or more expansion rules 62.
- the general rule 61 describes a correspondence relationship between one or more condition events related to any of the node devices and a conclusion that is caused when the one or more condition events occur in a format independent of the actual configuration of the computer system. Information.
- the general rule 61 may include a plurality of conclusions. In this embodiment, the conclusion is an event, and the conclusion may be called a conclusion event.
- the General rule 61 has IF section 611 and THEN section 612.
- the IF unit 611 includes one or more condition event data elements 613.
- the condition event data element 613 indicates a condition event related to the node device abstracted by the type, and includes, for example, data indicating the type of the node device related to the condition event and data indicating the type of the condition event.
- the THEN unit 612 includes a conclusion event data element 614.
- the conclusion event data element 614 indicates a conclusion event regarding the node device abstracted by the type, and includes, for example, data indicating the type of the node device related to the conclusion event and data indicating the type of the conclusion event.
- the general rule “GenRule1” in FIG. 4 includes two condition event data elements 613 and one conclusion event data element 614. That is, the general rule “GenRule1” represents that the conclusion event indicated by the conclusion event data element 614 is identified as the cause when two condition events indicated by the two condition event data elements 613 are detected. ing. Specifically, two condition event data elements 613 included in the general rule “GenRule1” indicate a “logical disk failure” event related to the VM and a “disk failure” event related to the storage 3, respectively. Further, the conclusion event data element 614 included in the general rule “GenRule 1” indicates a “disk failure” event related to the storage 3.
- the general rule “GenRule 1” is caused by the “disk failure” event related to the storage 3 when the “logical disk failure” event related to the VM and the “disk failure” event related to the storage 3 are detected. It represents that it is specified.
- the general rule “GenRule 2” when a “logical disk failure” event related to a VM and a “Port Link Down” event related to an IP switch are detected, an “Port Link Down” event related to the IP switch is detected. Indicates that the cause is identified.
- the expansion rule 62 is information obtained by expanding the general rule 61 into a format depending on the actual configuration of the computer system.
- the expansion rule 62 may include a plurality of conclusions. Similar to the general rule 61, the expansion rule 62 includes an IF unit 621 and a THEN unit 622.
- the IF unit 621 includes one or more condition event data elements 623.
- the condition event data element 623 indicates a condition event related to a specific node device, and includes, for example, the name of the node device related to the condition event and data indicating the type of the condition event.
- the THEN unit 622 includes a conclusion event data element 624.
- the conclusion event data element 624 indicates a conclusion event related to a specific node device, and includes, for example, data indicating the name of the node device related to the conclusion event and the type of the conclusion event.
- the expansion rule “ExpRule1” in the figure includes two condition event data elements 623 and one conclusion event data element 624. That is, the expansion rule “ExpRule1” represents that the conclusion event indicated by the conclusion event data element 624 is identified as the cause when two condition events indicated by the two condition event data elements 623 are detected. ing. Specifically, the two condition event data elements 623 included in the expansion rule “ExpRule1” are “logical disk failure” event related to VM A and “disk” related to storage A (denoted as “StA” in the figure). "Fault” event. The conclusion event data element 624 included in the expansion rule “ExpRule1” indicates a “disk failure” event related to the storage A.
- the expansion rule “ExpRule1” is caused by a “disk failure” event related to storage A when a “logical disk failure” event related to VM A and a “disk failure” event related to storage A are detected. This means that it is identified as being.
- the expansion rule “ExpRule2” includes a “logical disk failure” event related to VM A, a “logical disk failure” event related to VM B, a “logical disk failure” event related to VM C, and an IP switch 1 ( In the figure, when a “Port Link Down” event related to “IP-SW01” is detected, it indicates that the “Port Link Down” event related to IP switch 1 is identified as the cause. .
- FIG. 3 is a configuration diagram of an example of an event message according to the first embodiment.
- the event message 7 is information transmitted to notify the monitoring computer 1 that an event has occurred in the monitoring target device.
- the event message 7 includes fields of a node type 71, a node name 72, and an event type 73.
- the node type 71 stores data indicating the type of the node device related to the event that has occurred.
- the node name 72 stores the name of the node device related to the event that has occurred.
- the event type 73 stores data indicating the type of event that has occurred.
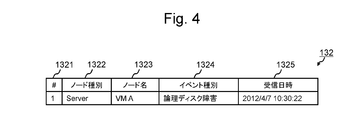
- FIG. 4 is a configuration diagram of an example of an event queue table according to the first embodiment.
- the event queue table 132 is a table for managing information related to events detected by the monitoring computer 1.
- the event reception program 122 creates an entry related to the event notified by the received event message 7 and stores it in this table 132.
- the event queue table 132 includes fields of a number (represented as “#” in the figure) 1321, a node type 1322, a node name 1323, an event type 1324, and a reception date 1325.
- the number 1321 stores the number of the entry registered in the event queue table 132.
- the node type 1322 stores data indicating the type of node device related to the event.
- the node name 1323 stores the name of the node device related to the event.
- the event type 1324 stores data indicating the type of event.
- the reception date and time 1325 stores data indicating the reception date and time of the event message 7 indicating the occurrence of the event.
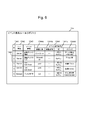
- FIG. 5 is a configuration diagram of an example of the performance information table according to the first embodiment.
- the performance information table 133 is data for managing performance values related to the monitoring target device.
- the performance information table 133 includes fields of a number 1331, a node name 1332, a component name 1333, a collection start date and time 1334, a collection period 1335, a value 1336, and a metric 1337.
- the number 1331 stores the number of the entry registered in the performance information table 133.
- the node name 1332 stores the name of the monitoring target device related to the performance value.
- the component name 1333 stores the name of the component related to the performance value in the node device.
- the collection start date and time 1334 stores data indicating the date and time when performance value collection is started.
- the collection period 1335 stores data indicating the performance value collection period.
- the value 1336 stores a performance value.
- the metric 1337 stores data indicating the type of performance value.
- the performance value related to the disk drive of VM A from the entry whose number 1331 in the figure is “1” to 10:00:00 on April 7, 2012 to 10:05:00 specifically It can be seen that the average disk transfer time (average time required to transfer a predetermined amount of data) is 60 [msec]. Also, for example, the VM B network I / F 23 between the entry having the number 1331 of “10” in the figure and the time from 10:10:00 on April 7, 2012 to 10:15:00 It can be seen that has transmitted a Ping response (response message to the ping command) once.
- FIG. 6 is a configuration diagram of an example of the event occurrence rule repository according to the first embodiment.
- the event occurrence rule repository 134 stores one or more event occurrence rules 1340.
- the event occurrence rule repository 134 is configured by a table, for example, and includes fields of a number 1341, a node type 1342, an event type 1343, and an event occurrence condition 1344.
- the event occurrence condition 1344 includes fields of a survey target 1344a, a survey period 1344b, a value 1344c, and a metric 1344d. Each entry registered in the event occurrence rule repository 134 corresponds to the event occurrence rule 1340.
- an entry registered in the event occurrence rule repository 134 that is, the number of the event occurrence rule 1340 is stored.
- the node type 1342 stores data indicating the type of node device related to the event to which the event occurrence rule 1340 is applied.
- the event type 1343 stores data indicating the type of event to which the event occurrence rule 1340 is applied.
- the event occurrence condition 1344 stores data indicating a condition for determining that the monitoring computer 1 can detect the event (hereinafter referred to as “event occurrence condition”) for the event to which the event occurrence rule 1340 is applied. .
- the investigation target 1344a stores the name of the component related to the performance value indicating the event occurrence condition.
- the investigation period 1344b stores the target period of the event occurrence condition.
- the target period of the event generation condition is, for example, a date and time when determination based on the event generation rule 1340 (that is, determination whether the monitoring computer 1 can detect the target event, hereinafter referred to as “detection determination”) is performed.
- the reference date and time is a period from the date and time that is a predetermined period later than the reference date and time to the reference date and time. Note that how to determine a date and time that is a predetermined period later than the reference date and time will be described later.
- the value 1344c stores a performance value indicating an event occurrence condition and data indicating a determination method based on the performance value.
- the metric 1344d stores data indicating the type of performance value indicating the event occurrence condition.
- an entry whose number 1341 is “1” in the figure indicates an event occurrence rule 1340 for a “logical disk failure” event related to the server 2.
- the event generation condition defined by the event generation rule 1340 is that the average disk transfer time for the disk drive is higher than 0 [msec] even once in the period indicated by the investigation period 1344b.
- this event occurrence rule 1340 indicates that the average disk transfer time related to the disk drive of the server 2 is higher than 0 [msec] even within the period indicated by the investigation period 1344b for the event of “logical disk failure” related to the server 2. This indicates that the monitoring computer 1 determines that the event can be detected.
- the reason for this determination is that an access request to the disk drive (logical disk) of the server 2 needs to be generated in order for the “logical disk failure” related to the server 2 to occur. This is because whether or not an access request to the disk drive is generated can be estimated by the presence or absence of data input / output to / from the disk drive of the server 2.
- an entry whose number 1341 is “2” in the figure indicates an event occurrence rule 1340 for a “logical disk failure” event related to the server 2.
- the event occurrence condition defined by the event occurrence rule 1340 is that the network I / F 23 transmits a Ping response even once within the period indicated by the investigation period 1344b.
- this event occurrence rule 1340 is generated when the network I / F 23 of the server 2 transmits a Ping response even once within the period indicated by the investigation period 1344b for the event of “logical disk failure” related to the server 2.
- the reason for this determination is that when the network I / F 23 of the server 2 transmits a Ping response, the server 2 is not being shut down and the server 2 is in a state where data communication is possible. Because it can be said.
- an entry whose number 1341 in the figure is “3” indicates an event occurrence rule 1340 for an event of “Port Link Down” regarding the IP switch.
- the event generation condition defined by the event generation rule 1340 is that the port reception speed is even higher than 0 [MB (megabytes) / sec] even once within the period indicated by the investigation period 1344b.
- this event generation rule 1340 indicates that the IP switch port reception speed is at least once higher than 0 [MB / sec] within the period indicated by the investigation period 1344b for the “Port Link Down” event related to the IP switch.
- the monitoring computer 1 determines that the event can be detected.
- the reason for such determination is that when data is input to the port of the IP switch, it can be said that the IP switch is in a state where data communication is possible.
- an entry whose number 1341 in the figure is “4” indicates an event occurrence rule 1340 for an event of “Port Link Down” regarding the IP switch.
- the event generation condition defined by the event generation rule 1340 is that the port transmission speed is even higher than 0 [MB / sec] even once within the period indicated by the investigation period 1344b.
- this event occurrence rule 1340 indicates that the IP switch port transmission rate is at least once higher than 0 [MB / sec] within the period indicated by the investigation period 1344b for the “Port Link Down” event related to the IP switch.
- the monitoring computer 1 determines that the event can be detected.
- the reason for this determination is that when the port of the IP switch is outputting data, it can be said that the IP switch is in a state where data communication is possible.
- an entry whose number 1341 is “5” in the figure indicates an event occurrence rule 1340 for a “disk failure” event related to the storage 3.
- the event occurrence condition defined by the event occurrence rule 1340 is such that the I / O (input / output) response time for the LU (logical unit) is at least once above 0 [msec] within the period indicated by the investigation period 1344b. It is to become.
- this event occurrence rule 1340 indicates that the I / O response time for the LU of the storage 3 is at least once higher than 0 [msec] within the period indicated by the investigation period 1344b for the “disk failure” event for the storage 3.
- the monitoring computer 1 determines that the event can be detected.
- the reason for this determination is that when data is being input / output to / from the LU of the storage 3, the storage 3 is not being shut down, and the storage 3 is in a state where data communication is possible. Because it can be said.
- FIG. 7 is a configuration diagram of an example of rule memory data according to the first embodiment.
- the rule memory data 8 is caused by at least a plurality of expansion rules 62 used for event cause analysis, data indicating the presence / absence of detection of a condition event of the expansion rule 62, and a conclusion event of the expansion rule 62 This is data expressing the certainty level indicating the certainty by a plurality of objects and their association.
- the rule memory data 8 may be generated based on the expansion rule 62, or may be generated based on the general rule 61 and configuration information indicating the system configuration of the computer system. When the rule memory data 8 is generated based on the general rule 61 and the configuration information, the expansion rule 62 may not be stored in the event cause information repository 131.
- the rule memory data 8 includes a plurality of condition objects 81, a plurality of conclusion objects 82, and respective connection information.
- the condition object 81 corresponds to the condition event of the expansion rule 62
- the conclusion object 82 corresponds to the conclusion event of the expansion rule 62.
- the connection relationship between the condition object 81 and the conclusion object 82 indicates a correspondence relationship between the condition event and the conclusion event in the expansion rule 62.
- Each object is data (object data) that is implemented as a structure or a class in a computer language and stored in the memory 12 during a program operation.
- the condition object 81 is an object that manages data related to the condition event.
- the condition object 81 includes fields of a node type 811, a node name 812, an event 813, a reception date and time 814, an occurrence 815, and a weight value 816.
- the node type 811 stores data indicating the type of node device related to the condition event corresponding to the condition object 81.
- the node name 812 stores the name of the node device related to the condition event corresponding to the condition object 81.
- In the event 813 data indicating the type of the condition event corresponding to the condition object 81 is stored.
- the reception date and time 814 includes the reception date and time of the event message 7 indicating the occurrence of the condition event corresponding to the condition object 81, that is, the date and time when the condition event corresponding to the condition object 81 was detected by the monitoring computer 1 (detection date and time). Is stored.
- the monitoring computer 1 detects a condition event corresponding to the condition object 81, that is, the event message 7 indicating the occurrence of the condition event corresponding to the condition object 81 is received. If there is, data indicating that, for example, “Occurred” is stored. On the other hand, if the monitoring computer 1 has not detected the corresponding condition event, the following data is stored in the occurrence 815. In other words, when the determination on whether or not the condition event is detected has not been performed yet, data indicating that, for example, “Uncheck” is stored. In addition, when it is determined whether or not the condition event can be detected and the determination result that the monitoring computer 1 can detect the event is obtained, data indicating that is stored, for example, “will occurred” is stored. . In addition, when it is determined whether or not the condition event can be detected and a determination result indicating that the monitoring computer 1 cannot detect the event is obtained, data indicating that is stored, for example, “will not accumulated” is stored. Is done.
- the weight value set in the condition event corresponding to the condition object 81 is stored.
- the weight value is data that the monitoring computer 1 refers to when calculating the certainty factor (first certainty factor described later).
- the weight value takes a value within the range of “0.0” or more and “1.0” or less.
- the monitoring computer 1 sets a weight value for the condition event as follows. That is, when the monitoring computer 1 detects a condition event, the monitoring computer 1 sets a weight value “1.0” for the condition event. Thereafter, the weight value of the condition event is kept at “1.0” until the valid period set in advance for the condition event elapses.
- the monitoring computer 1 After the validity period preset for the condition event has elapsed, the monitoring computer 1 decreases the weight value of the condition event to “0.0” according to the attenuation rate preset for the condition event. Let More specifically, the monitoring computer 1 sets a value obtained by subtracting the attenuation rate from the previously set weight value as a new weight value every predetermined time (for example, 1 minute). Repeat until “0” or less. Thereafter, the weight value of the condition event is kept at “0.0” until the condition event is detected again.
- the first condition object 81 from the top of the figure manages data related to the “logical disk failure” condition event related to VM A.
- the reception date 814 of the first condition object “April 7, 2012, 10:30:22” is stored. Therefore, the first condition object indicates that the condition event “logical disk failure” related to the VMA was detected by the monitoring computer 1 at 10:30:22 on April 7, 2012.
- the second condition object 81 from the top in the figure (hereinafter referred to as “second condition object”) manages data related to the “logical disk failure” condition event related to VM B.
- the reception date / time 814 of the second condition object does not store data indicating the reception date / time.
- the second condition object indicates that the condition event “logical disk failure” related to VM B has not been detected by the monitoring computer 1. Also, “will occurred” is stored in the right condition 815 of the generation of the second condition object. Accordingly, the second condition object indicates that a detection result is obtained for the “logical disk failure” condition event related to VM B, and the determination result that the monitoring computer 1 can detect the event is obtained. Yes.
- the conclusion object 82 is an object that manages data related to the conclusion event.
- the conclusion object 82 includes fields for a rule 821, a node 822, a cause 823, and a certainty factor 824.
- the rule 821 stores the name of the expansion rule 62 including the conclusion event corresponding to the conclusion object 82.
- the node 822 stores the name of the node device related to the conclusion event corresponding to the conclusion object 82.
- the cause 823 stores data indicating the type of conclusion event corresponding to the conclusion object 82.
- the certainty factor 824 stores the certainty factor (first certainty factor) for the conclusion event corresponding to the conclusion object 82. The certainty factor is calculated in a certainty factor evaluation process described later.
- rule memory data 8 is not limited to the structure described with reference to FIG. 7.
- the correspondence relationship between the condition event and the conclusion event, the presence / absence of the detection of the condition event, the determination result of the condition event, and the conclusion event It may be another data structure that can express the certainty about.
- FIG. 8 is a configuration diagram of an example of an event deletion setting table according to the first embodiment.
- the event deletion setting table 135 is data for managing an effective period and an attenuation rate that are set in advance for each event that can occur in the computer system.
- the event deletion setting table 135 includes fields for a node type 1351, an event type 1352, a validity period 1353, and an attenuation rate 1354.
- the node type 1351 stores data indicating the type of node device related to the event.
- the event type 1352 stores data indicating the type of event.
- the effective period 1353 stores data indicating the effective period set for the event, that is, the period from when the weight value is set to “1.0” until the attenuation starts.
- the attenuation rate 1354 stores data indicating an attenuation rate set for an event, that is, a value to be decreased every predetermined time (1 minute in this embodiment) when the weight value is decreased. For example, from the first entry from the top in the figure, the “logical disk failure” event related to the server 2 is set with the validity period “10 (minutes)” and the attenuation rate “0.3 (points / minute)”. You can see that
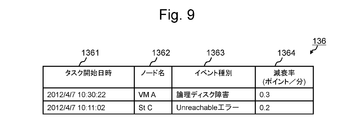
- FIG. 9 is a configuration diagram of an example of an event deletion task table according to the first embodiment.
- the event deletion task table 136 is data for managing information related to the event deletion task for the event detected by the monitoring computer 1.
- the event deletion task is a task for performing a process of reducing the weight value set for the detected event based on the attenuation rate set for the event.
- the event deletion task table 136 includes fields for a task start date and time 1361, a node name 1362, an event type 1363, and an attenuation rate 1364.
- the task start date and time 1361 includes the date and time when the execution of the event deletion task is started, that is, the date and time when the attenuation of the weight value set for the event targeted by the event deletion task is started (hereinafter referred to as “task start date and time”). The data shown is stored.
- the task start date / time is, for example, the date / time obtained by adding the effective period set for the event to the date / time when the event that is the target of the event deletion task is detected (the reception date / time of the event message 7).
- the node name 1362 stores the name of the node device related to the event that is the target of the event deletion task.
- the event type 1363 stores data indicating the type of event that is the target of the event deletion task.
- the attenuation rate 1364 stores the attenuation rate set for the event that is the target of the event deletion task.
- an event deletion task for a “logical disk failure” event related to VM A is started at 10:30:22 on April 7, 2012, and the event deletion task It can be seen that the attenuation rate adopted by is “0.3 (points / minute)”.
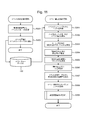
- FIG. 10 is a flowchart of the rule memory data generation process according to the first embodiment.
- the rule memory data generation process is a process for generating the rule memory data 8 based on the expansion rule 62.
- the rule loader program 121 generates an expansion rule 62 based on the general rule 61 and the computer system configuration information, and stores the generated expansion rule 62 in the event cause information repository 131 (step S101).
- the rule loader program 121 acquires the expansion rule 62 from the event cause information repository 131, and parses the acquired expansion rule 62 (step S102).
- the rule loader program 121 acquires the condition event data element 623 from the IF unit 621 of the expansion rule 62 acquired in step S102 (step S103).
- the rule loader program 121 checks whether or not the condition object 81 corresponding to the condition event indicated by the condition event data element 623 acquired in step S103 exists in the rule memory data 8 of the rule memory 128 (step S104). .
- step S105 If the corresponding condition object 81 exists in the rule memory data 8 (step S105: YES), the rule loader program 121 advances the process to step S107.
- step S105 NO
- the rule loader program 121 causes the condition object 81 corresponding to the condition event indicated by the condition event data element 623 acquired in step S103. Is generated in the rule memory data 8 (step S106). Thereafter, the rule loader program 121 advances the process to step S107.
- step S107 the rule loader program 121 determines whether or not the processing has been completed for all the condition event data elements 623 in the IF unit 621.
- step S107: NO the condition event data element 623 that has not yet been processed remains (step S107: NO)
- the rule loader program 121 advances the process to step S103.
- step S107 when the processing has been completed for all the condition event data elements 623 (step S107: YES), the rule loader program 121 acquires the conclusion event data element 624 from the THEN part 622 of the expansion rule 62 acquired in step S102. (Step S108).
- the rule loader program 121 generates a conclusion object 82 corresponding to the conclusion event indicated by the conclusion event data element 624 acquired in step S108 in the rule memory data 8. Then, the rule loader program 121 connects the generated conclusion object 82 and all related condition objects 81 (step S109).
- the related condition object 81 is a condition object 81 corresponding to a condition event associated in the expansion rule 62 with a conclusion event corresponding to the generated conclusion object 82.
- the rule loader program 121 determines whether or not the processing has been completed for all the expansion rules 62 in the event cause information repository 131 (step S110).
- the rule loader program 121 advances the processing to step S102.
- the rule loader program 121 ends the rule memory data generation processing.
- FIG. 11 is a flowchart of event reception processing and event writing processing according to the first embodiment.
- the event reception process is a process performed when the monitoring computer 1 receives the event message 7.
- the event reception program 122 When the monitoring computer 1 receives the event message 7 from the monitoring target device (step S201), the event reception program 122 creates an entry in the event queue table 132 related to the event indicated by the received event message 7, and creates the created entry. It adds to the event queue table 132 (step S202). In the created entry, each data acquired from the node type 71, the node name 72, and the event type 73 of the received event message 7 and data indicating the reception date and time of the received event message 7 are stored. Thereafter, the event reception program 122 ends the event reception process.
- the event writing process is a process of storing information related to the detected condition event in the corresponding condition object 81 and registering information related to the event deletion task regarding the detected condition event in the event deletion task table 136.
- the event writing program 123 acquires one entry from the event queue table 132 (step S301).
- the event writing program 123 acquires each data of the node type 1322, the node name 1323, and the event type 1324 from the entry acquired in step S301 (step S302).
- the event writing program 123 specifies the condition event 81 corresponding to the event indicated by the entry acquired in step S301 (referred to as “target event” in the description of FIG. 11) from the rule memory data 8 (step S303). Specifically, the event writing program 123 searches the rule memory data 8 using the node device name and event type indicated by the node name 1323 and event type 1324 acquired in step S302 as a key, and the node name 812 and event The condition object 81 whose node device name and event type indicated by 813 match the key is specified.
- the event writing program 123 stores data indicating the current date and time in the reception date and time 814 of the condition object 81 specified in step S303 (step S304). Further, the event writing program 123 stores “Occurred” in the occurrence 815 of the condition object 81 specified in step S303 (step S305). Further, the event writing program 123 stores “1.0” in the weight value 816 of the condition object 81 specified in step S303 (step S306).
- the event writing program 123 acquires the effective period and attenuation rate set for the target event from the event deletion setting table 135 (step S307).
- the event writing program 123 creates an entry in the event deletion task table 136 related to the target event, and adds the created entry to the event deletion task table 136 (step S308).
- the created entry indicates each data acquired from the node name 1323 and event type 1324 of the entry acquired in step S301, the task start date and time, that is, the current date and time plus the effective period set for the target event. Data and the attenuation rate set for the target event are stored.
- the event writing program 123 causes the certainty factor evaluation program 125 to execute a certainty factor evaluation process (see FIG. 13) (step S309).
- the event writing program 123 inputs, to the certainty factor evaluation program 125, a parameter that specifies the condition object 81 specified in step S303.
- the certainty factor is calculated for each conclusion event associated with the target event.
- the event writing program 123 ends the event writing process.
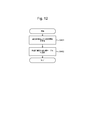
- FIG. 12 is a flowchart of the performance information receiving process according to the first embodiment.
- the performance information reception process is a process performed when the monitoring computer 1 receives performance information related to the monitoring target device.
- the performance information receiving program 124 creates an entry in the performance information table 133 regarding the received performance information.
- the created entry is added to the performance information table 133 (step S402).
- the created entry includes an entry number, a performance value included in the received performance information, names of node devices and components related to the performance value, date and time when collection of the performance value is started, and data indicating a collection period, In addition, data indicating the type of the performance value is stored. Thereafter, the performance information receiving program 124 ends the performance information receiving process.
- the monitoring computer 1 receives performance information repeatedly or irregularly, and the performance information receiving program 124 executes a performance information reception process every time the monitoring computer 1 receives performance information.
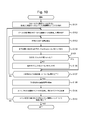
- FIG. 13 is a flowchart of the certainty factor evaluation process according to the first embodiment.
- the certainty factor evaluation process is a process of calculating the certainty factor of the conclusion event for each conclusion object 82 connected to the input condition object 81 based on the rule memory data 8.
- the certainty level evaluation process corresponds to the process of step S309 in FIG. 11 or the process of step S710 in FIG.
- the certainty factor evaluation program 125 receives parameters input by the event writing program 123 or the event erasure program 127 that has executed the certainty factor evaluation process (step S501).
- the certainty evaluation program 125 acquires from the rule memory data 8 a conclusion object 82 (referred to as “target conclusion object” in the description of FIG. 13) connected to the condition object 81 specified by the input parameter. (Step S502).
- the conclusion event corresponding to the target conclusion object is referred to as “target conclusion event”.
- the certainty evaluation program 125 acquires all the condition objects 81 connected to the target conclusion object from the rule memory data 8 (step S503).
- each of the condition objects 81 connected to the target conclusion object is referred to as a “target condition object”, and a condition event corresponding to the target condition object is referred to as a “target condition event”.
- the certainty factor evaluation program 125 calculates the certainty factor (second certainty factor) that is the certainty factor for the target conclusion event and does not consider the result of the detection possibility determination for the target condition event (step S504). Specifically, the certainty evaluation program 125 determines the number of target condition objects in which “Occurred” is stored in the right or wrong occurrence 815, that is, the target condition objects whose corresponding condition events are detected by the monitoring computer 1. The second certainty factor is calculated by dividing the number by the total number of target condition objects and multiplying the value obtained by the division by 100.
- the conclusion event corresponding to the second conclusion object 82 from the top (hereinafter referred to as “second conclusion object”), that is, the conclusion of “Port1 Link Down” related to the IP switch 1
- the second confidence for the event is calculated as follows: That is, the total number of condition objects 81 connected to the second conclusion object is 4. Of the condition objects 81 connected to the second conclusion object, the condition object 81 in which “Occurred” is stored in the occurrence 815 is only the first condition object, and the number thereof is one. Therefore, the second certainty factor for the conclusion event corresponding to the second conclusion object is calculated as 25% (1/4 ⁇ 100).
- the certainty factor evaluation program 125 determines whether or not the second certainty factor calculated in step S504 is a predetermined value (for example, 20%) or more (step S505).
- step S505 If the second certainty factor is smaller than the predetermined value (step S505: NO), the certainty factor evaluation program 125 advances the process to step S509. That is, the certainty factor evaluation program 125 excludes the conclusion event having the second certainty factor smaller than the predetermined value from the cause candidates so as not to perform the processing of steps S506 to S508. By doing in this way, the certainty factor evaluation program 125 is the event occurrence condition investigation process and the first certainty factor for the condition event associated with the conclusion event for the conclusion event that is very unlikely to be the cause. This calculation processing (the processing from step S506 to step S508) can be prevented from being performed, thereby reducing the processing load.
- the certainty factor evaluation program 125 causes the event occurrence condition investigation program 126 to execute the event occurrence condition investigation process (see FIG. 14) (step S1). S506).
- the certainty evaluation program 125 reads the target condition object in which “Occurred” is not stored in the occurrence probability 815, that is, the target for which the corresponding condition event has not been detected by the monitoring computer 1.
- a parameter designating the condition object is input to the event occurrence condition investigation program 126.
- the certainty factor evaluation program 125 calculates the sum of the weight values (values of the weight value 816) set for each of the target condition objects (step S507).
- the certainty factor evaluation program 125 calculates a certainty factor (first certainty factor) that is a certainty factor for the target conclusion event and that considers the result of the detection feasibility determination for the target condition event (step S508). Specifically, the certainty factor evaluation program 125 divides the sum of the weight values calculated in step S507 by the total number of target condition objects, and multiplies the value obtained by the division by 100 to obtain the first value. Calculate confidence.
- first certainty factor a certainty factor for the target conclusion event and that considers the result of the detection feasibility determination for the target condition event
- the first certainty factor for the second conclusion object is calculated as follows. That is, the total number of condition objects 81 connected to the second conclusion object is 4. Further, the sum of the weight values 816 of the condition object 81 connected to the second conclusion object is 3. Therefore, the second certainty factor for the conclusion event corresponding to the second conclusion object is calculated as 75% (3/4 ⁇ 100).
- the certainty factor evaluation program 125 stores the calculated first certainty factor in the certainty factor 824 of the target conclusion object.
- the certainty evaluation program 125 determines whether or not the processing has been completed for all the conclusion objects 82 connected to the condition object specified by the input parameter (step S509). When there is a conclusion object 82 that has not been processed yet (step S509: NO), the certainty factor evaluation program 125 advances the process to step S502.
- the certainty factor evaluation program 125 displays the result of the cause analysis.
- a first survey result display screen (see FIG. 16) for this is displayed on the display 17 (step S510). Thereafter, the certainty factor evaluation program 125 ends the certainty factor evaluation process.
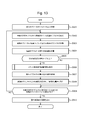
- FIG. 14 is a flowchart of event occurrence condition investigation processing according to the first embodiment.
- the event occurrence condition investigation process is a process for determining whether or not a condition event (undetected condition event) corresponding to the input condition object 81 can be detected and setting a weight value for the condition event based on the determination result. It is.
- the event occurrence condition investigation process corresponds to the process of step S506 in FIG.
- the event occurrence condition investigation program 126 receives a parameter input by the certainty factor evaluation program 125 that has executed the event occurrence condition investigation process (step S601).
- the condition object 81 specified by the input parameter is referred to as “target condition object”, and the condition event corresponding to the target condition object is referred to as “target condition event”.
- the target condition event is an undetected event.
- the event occurrence condition investigation program 126 acquires one event occurrence rule 1340 to be applied to the target condition event from the event occurrence rule repository 134 (step S602). Specifically, the event occurrence condition investigation program 126 determines that the node device type and event type indicated by the node type 1342 and event type 1343 are the node type and event type indicated by the node type 811 and event 813 of the target condition object. An event occurrence rule 1340 that matches the type of the event is acquired. For example, if the target condition event is a “logical disk failure” event related to VM B, the data (“Server”) indicating the server 2 that is the type of the node device (VM B) related to the event is the node type.
- the target condition event is a “logical disk failure” event related to VM B
- the data (“Server”) indicating the server 2 that is the type of the node device (VM B) related to the event is the node type.
- the event occurrence rule 1340 stored in the event type 1343 is stored in the event type 1343 and the data indicating the “logical disk failure” that is the type of the event, that is, the number 1341 is “1” in the example of FIG.
- the event occurrence rule 1340 or the event occurrence rule 1340 whose number 1341 is “2” is acquired.
- the event occurrence condition investigation program 126 refers to the performance value related to the node device related to the target condition event in the performance information table 133, and determines whether the event occurrence condition defined by the event occurrence rule 1340 acquired in step S602 is satisfied. By determining whether or not, it is determined whether or not the monitoring computer 1 can detect the target condition event (step S603).
- the target period is from 00: 00: 00: 00 on April 7, 2012 to the present.
- the entries indicating the performance value (disk transfer average time) for the VM B disk drive within the target period are the three entries with numbers 1331 to “7” to “9”.
- the performance values indicated by them are 80 [msec], 70 [msec], and 75 [msec], respectively. That is, the performance value (disk transfer average time) related to the disk drive of VM B within the target period is above 0 even once. Therefore, the event occurrence condition investigation program 126 determines that the event occurrence condition is satisfied, and determines that the monitoring computer 1 can detect the target condition event (event of “logical disk failure” related to VM B).
- the period indicated by the survey period 1344b is, for example, a period from the date and time that is a predetermined period later than the reference date and time (the date and time when detection is determined, that is, the current date and time) to the reference date and time.
- the date and time (hereinafter referred to as “past reference date and time”) that is a predetermined period later than the reference date and time is determined as follows. That is, the monitoring computer 1 acquires the detection date and time of the conclusion event corresponding to the conclusion object 82 connected to the target condition object. Then, the monitoring computer 1 determines the latest start date and time of performance information collection in the performance information receiving program 124 among the dates and times before the acquired conclusion event detection date and time as the past reference date and time.
- the monitoring computer 1 when the monitoring computer 1 has not detected the conclusion event corresponding to the conclusion object 82 connected to the target condition object, the monitoring computer 1 cannot acquire the detection date and time of the conclusion event. In this case, the monitoring computer 1 acquires the oldest date and time among the detection dates and times of each condition event of one or more condition objects 81 connected to the conclusion object 82 connected to the target condition object. Then, the monitoring computer 1 sets the latest start date / time of performance information collection in the performance information reception program 124 among the dates / times before the date / time before the acquired date / time of the detected conditional event as the past reference date / time. And decide.
- step S604 If the event occurrence condition is satisfied (step S604: YES), the event occurrence condition investigation program 126 indicates “will accumulated” indicating that the monitoring computer 1 can detect the target condition event at the right occurrence 815 of the target condition object 81. Is stored (step S607). Thereafter, the event occurrence condition investigation program 126 advances the process to step S608.
- step S604 if the event occurrence condition is not satisfied (step S604: NO), the event occurrence condition investigation program 126 confirms that the monitoring computer 1 cannot detect the target condition event at every occurrence 815 of the target condition object 81. “Will not occurred” to be stored is stored (step S605).
- the event occurrence condition investigation program 126 determines whether or not the processing has been completed for all the event occurrence rules 1340 applied to the target condition event (step S606).
- the event occurrence rule 1340 that has not yet been processed remains (step S606: NO)
- the event occurrence condition investigation program 126 advances the process to step S602.
- the event occurrence condition investigation program 126 advances the processing to step S608.
- step S 608 the event occurrence condition investigation program 126 determines whether “will not occurred” is stored in the right or wrong occurrence 815 of the target condition object.
- the event occurrence condition investigation program 126 stores “1.0” in the weight value 816 of the target condition object. (Step S609). That is, when the monitoring computer 1 cannot detect the target condition event, the target condition event is set to the same weight value “1.0” as the weight value set when the target condition event is detected. Is done. As a result, the monitoring computer 1 can treat the undetected condition event determined to be undetectable in step S508 of FIG. 13 as detected and calculate the certainty factor. Thereafter, the event occurrence condition investigation program 126 ends the event occurrence condition investigation process.
- step S608 if “will not occurred” is not stored in the right or wrong occurrence 815 of the target condition object (step S608: NO), the event occurrence condition investigation program 126 sets “0.0” in the weight value 816 of the target condition object. Is stored (step S610). Thereafter, the event occurrence condition investigation program 126 ends the event occurrence condition investigation process.
- the monitoring computer 1 determines whether or not a target undetected condition event can be detected based on the performance value related to the node device related to the condition event and the event occurrence rule 1340. Do. If the monitoring computer 1 determines that the target condition event can be detected, the monitoring computer 1 sets a weight value “0.0” for the condition event and determines that the target condition event cannot be detected. In such a case, a weight value “1.0” is set for the condition event. By setting the weight value in this way, the monitoring computer 1 can calculate the certainty factor by treating the undetected condition event determined to be undetectable in the certainty factor evaluation process as detected. become. Thereby, even when there is a condition event determined to be undetectable, it is possible to calculate so that the certainty factor for the conclusion event associated with the condition event does not become too low.
- the monitoring computer 1 treats the undetected condition event determined to be undetectable as being detected and calculates the first certainty factor, but determines that it cannot be detected.
- the detected undetected condition event may be excluded from the target when the first certainty factor is calculated. That is, the monitoring computer 1 ignores the weight values set in the undetected condition event determined not to be detected in S507 in FIG. calculate. Then, the monitoring computer 1 ignores the condition object 81 corresponding to the undetected condition event determined not to be detected in S508 in FIG. 13 (does not count), and calculates the total number of target condition objects. And the first certainty factor may be calculated.
- FIG. 15 is a flowchart of the event deletion process according to the first embodiment.
- the event erasure process is a process for reducing the weight value set for the detected event based on the attenuation rate set for the event.
- the event deletion program 127 acquires one entry from the event deletion task table 136 (step S701).
- the acquired entry is referred to as a “target entry”
- an event deletion task corresponding to the target entry that is, an event deletion task whose information is managed by the target entry is referred to as a “target event deletion task”.
- the event deletion program 127 determines whether or not the date and time indicated by the task start date and time 1361 of the target entry, that is, whether or not the task start date and time of the target event deletion task is the same as or before the current date and time. Determination is made (step S702). If the task start date and time of the target event deletion task is not the same as the current date and time and is not earlier than the current date and time (step S702: NO), the event deletion program 127 ends the event deletion processing.
- step S702 when the task start date / time of the target event deletion task is the same as or earlier than the current date / time (step S702: YES), the event deletion program 127 executes the target entry node name 1362, event type 1363. And the attenuation rate 1364, the name of the node device related to the event (referred to as “target event” in the description of FIG. 15) that is the target of the target event deletion task, the data indicating the type of the target event, and the target event. Is obtained (step S703).
- the event deletion program 127 acquires the condition object 81 (referred to as “target condition object” in the description of FIG. 15) corresponding to the target event from the rule memory data 8 (step S704). Specifically, the event deletion program 127 searches the rule memory data 8 using the name of the node device related to the target event acquired in step S703 and the type of the target event as keys, and the node indicated by the node name 812 and the event 813 A condition object 81 whose device name and event type match the key is specified as a target condition object.
- the event deletion program 127 updates the value of the weight value 816 of the target condition object to a value obtained by subtracting the attenuation rate set for the target event (step S705). Specifically, the event deletion program 127 acquires the weight value currently set for the target event (the weight value before update) from the weight value 816 of the target condition object. Then, the event deletion program 127 overwrites and stores the value obtained by subtracting the attenuation rate acquired in step S703 from the acquired pre-update weight value as the post-update weight value 816 of the target condition object weight value 816. .
- the event deletion program 127 determines whether or not the weight value 816 (updated weight value) of the target condition object is “0.0” or less (step S706).
- step S706 the event deletion program 127 updates the task start date and time of the target event deletion task to the date and time advanced by 1 minute.
- Step S707 the event deletion program 127 acquires the current task start date and time (task start date and time before update) of the target event deletion task from the task start date and time 1361 of the target entry. Then, the event deletion program 127 overwrites the task start date 1361 of the target entry with the date and time obtained by advancing the acquired task start date and time before update by 1 minute as the updated task start date and time. Thereafter, the event deletion program 127 advances the processing to step S710.
- step S706 when the value of the weight value 816 of the target condition object is equal to or smaller than “0.0” (step S706: YES), the event deletion program 127 stores “0.0” in the weight value 816 of the target condition object. (Step S708).
- step S709 the event deletion program 127 deletes the target entry from the event deletion task table 136. Thereafter, the event deletion program 127 advances the processing to step S710.
- step S710 the event deletion program 127 causes the certainty factor evaluation program 125 to execute a certainty factor evaluation process (see FIG. 13).
- the event deletion program 127 inputs a parameter for designating the target condition object to the certainty factor evaluation program 125.
- the certainty factor is recalculated for each conclusion event associated with the target event whose weight value has been updated. Thereafter, the event erase program 127 ends the event erase process.
- FIG. 16 is a configuration diagram of an example of a first survey result display screen according to the first embodiment.
- the first investigation result display screen 91 is a screen displayed in step S510 of FIG. 13 and is a screen for notifying the administrator of the result of the cause analysis.
- a conclusion event in which the first certainty factor is equal to or higher than a predetermined value (for example, 50%), that is, a conclusion event determined to be likely to be a cause (hereinafter, “candidate conclusion event”). ”) is displayed.
- the information element 911 related to the candidate conclusion event includes, for example, information indicating the candidate conclusion event (data indicating the name of the node device and the type of the candidate conclusion event related to the candidate conclusion event) 912, the first certainty factor regarding the candidate conclusion event 913 etc. are included.
- the information element 911 regarding the candidate conclusion event is displayed by sorting by the value of the first certainty factor 913 about the candidate conclusion event.
- the monitoring computer 1 details the cause analysis regarding the designated candidate conclusion event.
- a second survey result display screen (see FIG. 17) for displaying information is displayed on the display 17.
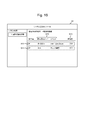
- FIG. 17 is a configuration diagram of an example of a second survey result display screen according to the first embodiment.
- the second survey result display screen 92 is a screen for displaying detailed information of cause analysis related to the candidate conclusion event specified in the first survey result display screen 91.
- the detailed information of the cause analysis related to the designated candidate conclusion event for example, the detected condition event among the condition events associated with the designated candidate conclusion event is displayed.
- Information 922 to be displayed, information 923 relating to an undetected condition event associated with the designated candidate conclusion event, check progress 921 indicating the progress of detection feasibility determination performed for the undetected condition event, and the like are displayed. .
- the information 923 relating to the undetected condition event associated with the designated candidate conclusion event includes, for example, information indicating each undetected condition event (the name of the node device related to the undetected condition event and the undetected condition event).
- the check progress level 921 is, for example, a ratio of the number of undetected condition events for which detection feasibility determination is performed to the number of undetected condition events associated with the designated candidate conclusion event. .
- the administrator can know one or more candidate conclusion events whose first certainty factor is equal to or greater than a predetermined value. It can be estimated whether the candidate conclusion event is the cause.
- the certainty factor used as a criterion for determining whether or not it is a candidate conclusion event, and the certainty factor notified to the administrator in the first survey result display screen 91 and the second survey result display screen 92 are as follows:
- the first certainty factor that is, the certainty factor calculated not to be too low even when there is a condition event that the monitoring computer 1 cannot detect.
- the conclusion event is included in one or more condition events associated with the conclusion event, that is, if the conclusion event is also a condition event, the condition event that is also the conclusion event is detected. If it is, the administrator can specify the detected event (the conclusion event that is also the condition event) as the cause without referring to the certainty factor. That is, it can be said that the estimation of the cause based on the certainty factor is an effective method when a condition event that is also a conclusion event is not detected or cannot be detected. On the other hand, when there is a condition event that the monitoring computer 1 cannot detect, there is a problem that the calculated certainty is too low. According to the present embodiment, it is possible to calculate a certainty factor with high reliability particularly when the certainty factor is regarded as important, that is, when a conditional event that is also a conclusion event is not detected or cannot be detected. Become.
- Example 2 is an example when the event is an event related to a performance failure of the monitoring target device (hereinafter referred to as “performance event”).
- the configuration of the computer system according to the second embodiment is substantially the same as the configuration of the computer system according to the first embodiment except for the following points. That is, the monitoring computer 1 according to the second embodiment stores the performance information monitoring program 129 in the memory 12 and stores the performance event definition table 137 in the disk 13.
- the configuration of the monitoring computer 1 according to the second embodiment will be described with respect to differences from the first embodiment.
- FIG. 18 is a configuration diagram of an example of a performance event definition table according to the second embodiment.
- the performance event definition table 137 is data defining performance events that can occur in the computer system.
- the performance event definition table 137 includes fields of a number 1371, a node name 1372, a component name 1373, a threshold 1374, a metric 1375, a base value 1376, a condition 1377, and an event type 1378.
- the number 1331 stores a performance event number.
- the node name 1372 stores the name of the node device related to the performance event.
- the component name 1373 stores the name of the component related to the performance event.
- the threshold value 1374 stores a reference value (hereinafter referred to as “performance threshold value”) when determining whether or not a performance event has occurred.
- the metric 1375 stores data indicating the type of performance value corresponding to the performance event.
- the base value 1376 stores a value (hereinafter referred to as “base value”) used when calculating a weight value set for a performance event that is a condition event.
- the condition 1377 stores data indicating a condition for determining that a performance event has occurred (hereinafter, “performance event condition”).
- the event type 1378 stores data indicating the type of performance event.
- a performance event “abnormal increase in memory usage rate” related to the VM B memory 22 occurs when the usage rate of the VM B memory 22 exceeds 50% It can be seen that this occurs.
- the performance event “decrease in disk transfer processing efficiency” for the VM C disk drive indicates that the average disk transfer time for the VM C disk drive is 100 [ It can be seen that the error occurs when [msec] is exceeded.
- FIG. 19 is a configuration diagram of an example of an event occurrence rule repository according to the second embodiment.
- the field configuration of the event occurrence rule repository 134 according to the second embodiment is substantially the same as the field configuration of the event occurrence rule repository 134 according to the first embodiment.
- the event occurrence rule repository 134 according to the second embodiment stores one or more event occurrence rules 1340 applied to performance events.
- an entry whose number 1341 is “1” in the figure indicates the event occurrence rule 1340 for the performance event “decrease in disk transfer processing efficiency” related to the server 2.
- the event generation condition defined by the event generation rule 1340 is that the average disk transfer time for the disk drive is higher than 0 [msec] even once in the period indicated by the investigation period 1344b.
- this event occurrence rule 1340 has the disk transfer average time related to the disk drive of the server 2 within the period indicated by the investigation period 1344b for the performance event “decrease in disk transfer processing efficiency” related to the server 2 even if it is 0 [ msec] indicates that the monitoring computer 1 determines that the event can be detected.
- an entry whose number 1341 is “2” in the figure indicates an event occurrence rule 1340 for a performance event of “port high load” related to the IP switch.
- the event generation condition defined by the event generation rule 1340 is that the port reception speed is once higher than 0 [MB / sec] within the period indicated by the investigation period 1344b.
- this event occurrence rule 1340 indicates that the IP switch port reception speed is 0 [MB / sec] or less in the period indicated by the investigation period 1344b for the performance event of “port high load” related to the IP switch.
- the monitoring computer 1 determines with the said event being detectable.
- an entry whose number 1341 is “3” in the figure indicates an event occurrence rule 1340 for the performance event “disk performance degradation” regarding the storage 3.
- the event generation condition defined by the event generation rule 1340 is that the I / O response time for the LU is at least once higher than 0 [msec] within the period indicated by the investigation period 1344b.
- this event occurrence rule 1340 is 0 [msec] for the I / O response time for the LU of the storage 3 within the period indicated by the investigation period 1344b for the performance event of “disk performance degradation” for the storage 3. This indicates that the monitoring computer 1 determines that the event can be detected when the value is higher.
- FIG. 20 is a configuration diagram of an example of rule memory data according to the second embodiment.
- the field configurations of the condition objects 81 and the conclusion objects 82 of the rule memory data 8 according to the second embodiment are substantially the same as the field configurations of the condition objects 81 and the conclusion objects 82 of the rule memory data 8 according to the first embodiment. The same.
- whether or not the condition object 81 is generated is determined whether or not the condition event corresponding to the condition object 81 is detected, and a determination result that the monitoring computer 1 can detect the event is obtained. If the condition event is a performance event, data indicating that the monitoring computer 1 can detect the performance event, for example, “May be affected” is stored. In other cases, that is, when the condition event is detected, when the condition event has not been detected and the detection possibility determination has not yet been performed, and the detection possibility determination for the condition event is performed, In the case where a determination result indicating that the monitoring computer 1 cannot detect the event is obtained, the same data as in the first embodiment is stored.
- FIG. 21 is a flowchart of the performance information monitoring process according to the second embodiment.
- the performance information monitoring process is a process of determining whether or not a performance event has occurred in the monitoring target device based on the received performance value regarding the monitoring target device. If it is determined that a performance event has occurred, the corresponding event message 7 is generated and transmitted.
- the performance information monitoring program 129 receives a performance value related to the monitoring target device (step S801). For example, the performance information monitoring program 129 may transmit a performance value acquisition request to the monitoring target device periodically or irregularly, and cause the monitoring target device to transmit the performance value.
- the performance information monitoring program 129 acquires an entry corresponding to the performance value received in step S801 from the performance event definition table 137 (step S802). Specifically, in the performance information monitoring program 129, the name of the node device indicated by the node name 1371 matches the name of the node device related to the performance value received in step S801, and the type of performance value indicated by the metric 1375 is the same. An entry that matches the type of the performance value received in step S801 is acquired. For example, if the performance value received in step S801 is the memory usage rate related to VM B, an entry with the number 1371 of “1” is acquired in the example of FIG.
- the performance information monitoring program 129 determines whether or not the performance value acquired in step S801 satisfies the performance event condition indicated by the entry condition 1377 acquired in step S802 (step S803). If the performance event condition is not satisfied (step S803: NO), the performance information monitoring program 129 advances the process to step S806.
- step S803 YES
- the performance information monitoring program 129 generates an event message 7 indicating that the performance event indicated by the entry acquired in step S802 has occurred (step S804).
- the performance value received in step S801 is the memory usage rate related to VM B and the performance event condition indicated by the condition 1377 of the entry 1371 in FIG. Is stored in the node type 71
- the name of the VM B is stored in the node name 72
- the event message 7 is generated.
- the performance information monitoring program 129 transmits the event message 7 generated in step S804 to the event reception processing program 122 (step S805).
- the event reception processing program 122 that has received the event message 7 indicating the occurrence of the performance event starts the event reception processing described in the first embodiment. Thereafter, the performance information monitoring program 129 advances the process to step S806.
- step S806 the performance information monitoring program 129 determines whether or not the processing has been completed for all entries corresponding to the performance value received in step S801 in the performance event definition table 137. If there are still unprocessed entries (step S806: NO), the performance information monitoring program 129 advances the process to step S802. On the other hand, when the processing has been completed for all entries corresponding to the performance value received in step S801 in the performance event definition table 137 (step S806: YES), the performance information monitoring program 129 ends the performance information monitoring processing. .
- FIG. 22 is a flowchart of event occurrence condition investigation processing according to the second embodiment.
- the event occurrence condition investigation program 126 receives a parameter input by the certainty factor evaluation program 125 that has executed the event occurrence condition investigation process (step S901).
- the condition object 81 specified by the input parameter is referred to as “target condition object”, and the condition event corresponding to the target condition object is referred to as “target condition event”.
- the target condition event is an undetected performance event.
- the event occurrence condition investigation program 126 stores “will not occurred” indicating that the monitoring computer 1 cannot detect the target condition event in the right or wrong 815 of occurrence of the target condition object (step S902).
- the event occurrence condition investigation program 126 acquires one event occurrence rule 1340 to be applied to the target condition event from the event occurrence rule repository 134 (step S903).
- the target condition event is a performance event “decrease in disk transfer processing efficiency” related to VM B
- the event occurrence rule 1340 in which the data indicating the “decrease in disk transfer processing efficiency” that is the type of the performance event is stored in the event type 1343, that is, in FIG.
- the event occurrence rule 1340 with the number 1341 of “1” is acquired.
- the event occurrence condition investigation program 126 refers to the performance value related to the node device related to the target condition event in the performance information table 133, and determines whether the event occurrence condition defined by the event occurrence rule 1340 acquired in step S903 is satisfied. By determining whether or not, it is determined whether or not the monitoring computer 1 can detect the target condition event (step S904).
- the event occurrence condition is a performance event “decrease in disk transfer processing efficiency” related to VMB
- the event occurrence rule 1340 having the number 1341 of “1” in FIG. 19 is acquired in step S903
- the event occurrence condition The investigation program 126 determines as follows. That is, the event occurrence condition defined by the event occurrence rule 1340 with the number 1341 of “1” is that the average disk transfer time for the disk drive is higher than 0 [msec] even once. In this example, the target period is from 00: 00: 00: 00 on April 7, 2012 to the present.
- the entries indicating the performance values (disk transfer average time) for the VM B disk drive within the target period are three entries whose ID 1331 is “7” to “9”.
- the performance values indicated by them are 80 [msec], 70 [msec], and 75 [msec], respectively. That is, the performance value (disk transfer average time) related to the disk drive of VM B within the target period is above 0 even once. Therefore, the event occurrence condition investigation program 126 determines that the event occurrence condition is satisfied, and determines that the monitoring computer 1 can detect the target condition event (performance event “decrease in disk transfer processing efficiency” related to VM B). To do.
- step S905 NO
- the event occurrence condition investigation program 126 advances the process to step S908.
- step S905 when the event occurrence condition is satisfied (step S905: YES), the event occurrence condition investigation program 126 confirms that the target condition event is a performance event and the monitoring computer 1 determines that the target condition event occurs in 815 of the occurrence of the target condition object. “May be affected” is stored (step S906).
- the event occurrence condition investigation program 126 calculates a value (hereinafter referred to as “temporary weight value”) that is a candidate for the weight value set for the target condition event (step S907).
- the event occurrence condition investigation program 126 calculates a temporary weight value as follows, for example. That is, the event occurrence condition investigation program 126 first displays one or more performance values that are collected within the target period of the event occurrence rule 1340 acquired in step S903 and correspond to the target condition event, in the performance information table. From 133.
- the performance value corresponding to the target condition event is a performance value whose type matches the type of the performance value indicated by the metric 1375 of the entry defining the target condition event in the performance event definition table 137.
- the event occurrence condition investigation program 126 determines, for each acquired performance value, the base value of the target condition event, that is, the base value 1376 of the entry defining the target condition event in the performance event definition table 137 from the performance value.
- the absolute value of the value obtained by subtracting the value (hereinafter referred to as “first difference value”) is calculated. Further, the event occurrence condition investigation program 126 subtracts the base value of the target condition event from the performance threshold of the target condition event, that is, the threshold value 1374 of the entry defining the target condition event in the performance event definition table 137. Is calculated (hereinafter referred to as “second difference value”).
- the event occurrence condition investigation program 126 sets a value obtained by dividing the maximum value of the first difference value calculated for each performance value by the second difference value as a temporary weight value.
- the first difference value is a difference between the collected performance value and the base value
- the second difference value is a difference between the performance threshold value and the base value. That is, the temporary weight value becomes closer to “1.0” as the collected performance value is closer to the performance threshold, and conversely, becomes “0.0” as the collected performance value is farther from the performance threshold.
- a close value is
- the target condition event is a performance event “decrease in disk transfer processing efficiency” related to VM B
- the target period of the event occurrence rule 1340 acquired in step S903 is 0:00:00 on April 7, 2012.
- the event occurrence condition investigation program 126 calculates a temporary weight value as follows. That is, in the performance information table 133 of FIG. 5, an entry indicating the performance value (disk transfer average time) corresponding to the target condition event, which is the performance value collected within the target period, is “7”. These are three entries “9”, and the performance values indicated by them are 80 [msec], 70 [msec], and 75 [msec], respectively. Also, in the performance event definition table 137 of FIG.
- the entry defining the target condition event is an entry having the number 1371 of “2”, its base value is 0, and its performance threshold is 200. Therefore, the event occurrence condition investigation program 126 is obtained by dividing 80 (
- step S908 the event occurrence condition investigation program 126 determines whether or not the processing has been completed for all the event occurrence rules 1340 applied to the target condition event.
- step S908: NO the event occurrence condition investigation program 126 advances the process to step S903.
- step S908 when the processing has been completed for all of the event occurrence rules 1340 applied to the target condition event (step S908: YES), the event occurrence condition investigation program 126 displays “will not” in the right or wrong 815 of the occurrence of the target condition object. It is determined whether or not “occurred” is stored (step S909).
- the event occurrence condition investigation program 126 stores “1.0” in the weight value 816 of the target condition object. (Step S910). That is, when the monitoring computer 1 cannot detect the target condition event, the target condition event is set to the same weight value “1.0” as the weight value set when the target condition event is detected. Is done. As a result, the monitoring computer 1 can treat the undetected condition event determined to be undetectable in step S508 of FIG. 13 as detected and calculate the certainty factor. Thereafter, the event occurrence condition investigation program 126 ends the event occurrence condition investigation process.
- step S909 NO
- the event occurrence condition investigation program 126 The maximum value of the temporary weight value calculated in step S907 is stored in the weight value 816 of the target condition object (step S911). Thereafter, the event occurrence condition investigation program 126 ends the event occurrence condition investigation process.
- the weight value “0.0” is set to the condition event. Instead, the maximum value of the temporary weight value calculated in step S907 is stored. The temporary weight value becomes closer to “1.0” as the collected performance value is closer to the performance threshold, and conversely becomes “0.0” as the collected performance value is farther from the performance threshold. A close value.
- the monitoring computer 1 sets the weight value in this way, and in addition to whether or not the condition event is detected in the certainty evaluation process, the undetected condition event determined to be detectable
- the certainty factor can be calculated in consideration of the magnitude of the difference between the performance value collected within a certain period corresponding to the condition event and the performance threshold of the condition event.
- the monitoring computer 1 does not calculate the certainty factor by treating the condition event that does not satisfy the performance event condition as undetected uniformly, but differs depending on the magnitude of the difference between the collected performance value and the performance threshold value. Specifically, the certainty factor is calculated so that the collected performance value becomes higher as it gets closer to the performance threshold, and the collected performance value becomes lower as the value gets farther from the performance threshold. become able to.
Landscapes
- Engineering & Computer Science (AREA)
- Computer Networks & Wireless Communication (AREA)
- Signal Processing (AREA)
- Evolutionary Computation (AREA)
- Artificial Intelligence (AREA)
- Computer Vision & Pattern Recognition (AREA)
- Databases & Information Systems (AREA)
- Medical Informatics (AREA)
- Software Systems (AREA)
- Cardiology (AREA)
- General Health & Medical Sciences (AREA)
- Health & Medical Sciences (AREA)
- Debugging And Monitoring (AREA)
Description
本発明は、監視対象のノード装置において発生した事象(イベント)の根本原因を解析する監視システム及び監視プログラムに関する。
サーバ、ストレージ、ネットワーク装置等のノード装置を監視し、監視対象のノード装置において発生した障害やステータス変更等のイベントを検知し、検知したイベントの根本原因を解析する監視システムが知られている(例えば、特許文献1参照)。
例えば、監視システムは、根本原因の解析において、複数のノード装置のいずれかに関する1以上の条件イベントと当該1以上の条件イベントが発生した場合に原因となる結論との対応関係を示す複数のルール(以下「イベント原因情報」という)、及び、条件イベントの検知の有無に基づいて、各結論が原因であることの確からしさを示す確信度を計算する。例えば、或る結論についての確信度は、当該結論に対応付けられている条件イベントの総数に対する、当該結論に対応付けられている条件イベントのうちの監視システムが検知した条件イベントの数の割合とされる。監視システムは、計算した確信度に基づいて原因の候補を抽出し、それらを含む原因解析の結果を表示する。管理者は、監視システムに表示された原因解析の結果を参照して、根本原因を推定する。
監視対象のノード装置において、イベントを発生し得る状況或いはイベントの発生を通知し得る状況が整っていないために、監視システムが、本来発生が予想されるイベントを検知し得ない場合がある。例えば、IPスイッチ1に関する「Port Link Down」のイベント(以下「イベント1」という)が発生した場合に、その影響を受けてVM(仮想マシン)1に関する「論理ディスク障害」のイベント(以下「イベント2」という)及びVM2に関する「論理ディスク障害」のイベント(以下「イベント3」という)が発生するという因果関係が存在する場合において、例えばVM1がシャットダウン中である場合、イベント1が発生したとしても、VM1はイベント2を発生させ得る状況下にないため、監視システムは、本来発生が予想されるイベント2を検知し得ない。
このように、監視システムが、本来発生が予想されるイベントを検知し得ない場合、当該検知し得ないイベントに対応付けられている結論についての確信度は、本来の値よりも低く計算されてしまう。例えば、上記因果関係が存在する場合、監視システムは、イベント1を結論とし、イベント1、イベント2、及びイベント3をそれぞれ条件イベントとするルールを保持している。そして、監視システムは、このルール及びイベント1、イベント2、及びイベント3の検知の有無に基づいて、イベント1が原因となることについての確信度を、条件イベント(イベント1、イベント2、及びイベント3)の数(この例では、3)に対する、イベント1、イベント2、及びイベント3のうちの発生した条件イベントの数の割合として計算する。イベント1が発生すると、本来であれば、その影響を受けてイベント2及びイベント3が発生し、これら発生したイベント(イベント1、イベント2、及びイベント3)が、監視システムによって検知されることとなる。そして、監視システムが、イベント1、イベント2、及びイベント3の全てを検知した場合は、イベント1が原因となることについての確信度は、(3/3×100)%と計算される。
しかしながら、例えばVM1がシャットダウン中であり、監視システムがイベント2を検知し得ない場合、イベント1が原因となることについての確信度は、最大でも(2/3×100)%となる。そして、監視システムが検知し得ない条件イベントが多くなるほど、確信度は、より低く計算されてしまう。
このように、確信度が本来の値よりも低く計算されてしまうと、原因の候補を抽出する監視システム又は原因を推定する管理者が、確信度が低く計算されてしまった結論を抽出又は推定の対象から見落としてしまうというおそれが生じる。
監視システムは、複数のノード装置のいずれかで発生したイベントの原因解析を行う。監視システムの記憶デバイスは、複数のノード装置のいずれかに関する1以上の条件イベントと、当該1以上の条件イベントが発生した場合に原因となる結論との対応関係を示す複数のルールを記憶する。監視システムの制御デバイスは、複数のルールに含まれる複数の条件イベントのうちのいずれか1以上の条件イベントを検知し、ルールに基づいて、検知した条件イベントに対応付けられている第1の結論を特定し、複数のルールに含まれる複数の条件イベントのうちのいずれか1以上の条件イベントのそれぞれについて、監視システムが当該条件イベントを検知し得るか否かの検知可否判定を行い、第1の結論に対応付けられている1以上の条件イベントの検知の有無、及び、検知可否判定の結果に基づいて、第1の結論が原因であることの確からしさを示す第1の指標値を計算する。
図面を参照して幾つかの実施例を説明する。なお、以下に説明する実施例は特許請求の範囲にかかる発明を限定するものではなく、また実施例の中で説明されている諸要素及びその組み合わせの全てが発明の解決手段に必須であるとは限らない。これらの図面において、複数の図を通じて同一の符号は同一の構成要素を示している。
なお、以後の説明では、「aaaテーブル」等の表現にて本発明の情報を説明することがあるが、これら情報はテーブル等のデータ構造以外で表現されていてもよい。そのため、データ構造に依存しないことを示すために「aaaテーブル」等について「aaa情報」と呼ぶことがある。
また、各情報の内容を説明する際に、「識別情報」、「識別子」、「名」、「名称」、「ID」という表現を用いるが、これらについては互いに置換が可能である。
以後の説明では「プログラム」を主語として説明を行う場合があるが、プログラムは、プロセッサによって実行されることで定められた処理をメモリ及び通信ポート(ネットワークI/F)を用いながら行うため、プロセッサを主語とした説明としてもよい。また、プログラムを主語として開示された処理は監視システム等の計算機が行う処理としてもよい。また、プログラムの一部または全ては専用ハードウェアによって実現されてもよい。また、各種プログラムはプログラム配布サーバや、計算機が読み取り可能な記憶メディアによって各計算機にインストールされてもよい。
以後、計算機システムを監視し、表示用情報を表示する一つ以上の計算機の集合を監視システムと呼ぶことがある。監視コンピュータが表示用情報を表示する場合は監視コンピュータが監視システムである、また、監視コンピュータと表示用装置の組み合わせも監視システムである。また、処理の高速化や高信頼化のために複数の計算機で監視コンピュータと同等の処理を実現してもよく、この場合は当該複数の計算機(表示を表示用装置が行う場合は表示用装置も含め)が監視システムである。
図1は、実施例1に係る計算機システムの一例の構成図である。
計算機システムは、監視コンピュータ1と、1以上のサーバ2(同図では、サーバA及びサーバB)と、1以上のストレージ3と、1以上のネットワーク装置4と、LAN(Local Area Network)等の通信ネットワーク5とを有する。ネットワーク装置4は、IP(Internet Protocol)スイッチやルータ等である。監視コンピュータ1、サーバ2、及びストレージ3は、通信ネットワーク5及びネットワーク装置4を介して相互に接続される。
以下、計算機システムを構成する装置(サーバ2、ストレージ3、ネットワーク装置4等)を「ノード装置」と呼ぶことがある。計算機システムは、例えば、ホストコンピュータ、NAS(Network Attached Storage)、ファイルサーバ、プリンタ等をノード装置として有していてもよい。また、ノード装置が有するデバイス等の論理的又は物理的な構成物を「コンポーネント」と呼ぶことがある。コンポーネントの例としては、CPU(Central Processing Unit)、メモリ、ネットワークI/F(インターフェース)、ディスク、プログラム、ストレージ3で定義されるボリューム、RAID(Redundant Arrays of Inexpensive Disks)グループ等がある。以下、監視コンピュータ1が監視の対象とするノード装置を「監視対象装置」と呼ぶ場合がある。
サーバ2は、サーバプログラム等を実行し、ユーザに対して所定のサービスを提供する計算機である。サーバ2は、CPU21と、メモリ22と、ネットワークI/F23と、iSCSI(Internet Small Computer System
Interface)イニシエータ24とを有する。サーバ2には、ストレージ3の記憶領域が割り当てられた仮想的なボリュームであるiSCSIディスク25が形成される。サーバ2は、iSCSIイニシエータ24を介すことで、iSCSIディスク25をローカルハードディスクのように利用できる。ネットワークI/F23は、通信ネットワーク5に接続するためのインターフェースデバイスである。サーバ2は、例えば、当該サーバ2において何らかのイベントが発生した場合に、そのイベントの発生を示すイベントメッセージを監視コンピュータ1に送信する。なお、サーバ2は、物理サーバであってもよいし、1以上のVMを稼働させる仮想サーバであってもよい。本実施例において、サーバ2が仮想サーバである場合、仮想サーバが稼働させている各VMがノード装置となる。
Interface)イニシエータ24とを有する。サーバ2には、ストレージ3の記憶領域が割り当てられた仮想的なボリュームであるiSCSIディスク25が形成される。サーバ2は、iSCSIイニシエータ24を介すことで、iSCSIディスク25をローカルハードディスクのように利用できる。ネットワークI/F23は、通信ネットワーク5に接続するためのインターフェースデバイスである。サーバ2は、例えば、当該サーバ2において何らかのイベントが発生した場合に、そのイベントの発生を示すイベントメッセージを監視コンピュータ1に送信する。なお、サーバ2は、物理サーバであってもよいし、1以上のVMを稼働させる仮想サーバであってもよい。本実施例において、サーバ2が仮想サーバである場合、仮想サーバが稼働させている各VMがノード装置となる。
ストレージ3は、サーバ2等に記憶領域を提供する装置である。ストレージ3は、ストレージコントローラ31と、ディスク32と、ネットワークI/F33とを有する。ストレージ3は、ディスク32に代えて又はディスク32に加えて、固体記憶媒体、光記憶媒体等の他の種類の記憶媒体を有していてもよい。ネットワークI/F33は、通信ネットワーク5に接続するためのインターフェースデバイスである。ストレージ3は、例えば、サーバ2に対して、iSCSIディスク25を形成するための記憶領域を提供する。ストレージ3は、例えば、当該ストレージ3において何らかのイベントが発生した場合に、そのイベントの発生を示すイベントメッセージを監視コンピュータ1に送信する。なお、サーバ2をストレージ3で発生したイベントを検知できるように構成し、サーバ2がストレージ3で発生したイベントのイベントメッセージを監視コンピュータ1に送信するようにしてもよい。
監視コンピュータ1は、監視対象装置を管理する計算機である。監視コンピュータ1は、例えば、汎用的な計算機であり、CPU11と、メモリ12と、ディスク13と、ビデオI/F14と、ネットワークI/F15と、バス16とを有する。CPU11、メモリ12、ディスク13、ビデオI/F14、及びネットワークI/F15は、バス16を介して相互に接続される。
メモリ12は、ルールローダプログラム121と、イベント受信プログラム122と、イベント書込プログラム123と、性能情報受信プログラム124と、確信度評価プログラム125と、イベント発生条件調査プログラム126と、イベント消去プログラム127と、ルールメモリ128とを記憶する。メモリ12に記憶された各種プログラム121~127は、CPU11によって実行される。ルールメモリ128には、確信度の計算を行う確信度評価処理に利用されるルールメモリデータが格納される。ディスク13は、イベント原因情報リポジトリ131と、イベントキューテーブル132と、性能情報テーブル133と、イベント発生ルールリポジトリ134と、イベント消去設定テーブル135と、イベント消去タスクテーブル136とを記憶する。イベント原因情報リポジトリ131には、1以上のイベント原因情報(ルール)が格納される。本実施例では、イベント原因情報として、計算機システムの実構成に依存しない形式で記述した一般ルールと、一般ルールを計算機システムの実構成に依存する形式に展開した展開ルールとがある。イベント発生ルールリポジトリ134には、1以上のイベント発生ルールが格納される。ここで、イベント発生ルールとは、対象のイベントに関係するノード装置において当該イベントを発生し得る状況或いは当該イベントの発生を通知し得る状況が整っているか否かを判定するためのルール、すなわち、監視コンピュータ1が当該イベントを検知し得るか否かを判定するためのルールのことをいう。
ネットワークI/F15は、通信ネットワーク5に接続するためのインターフェースデバイスである。ビデオI/F14は、ディスプレイ17に接続するためのインターフェースデバイスである。監視コンピュータ1は、原因解析の結果や他の情報をディスプレイ17に表示させることで、原因解析の結果等を管理者に提示することができる。なお、監視コンピュータ1が、内部にディスプレイ17を有していてもよい。
監視コンピュータ1は、監視対象装置から、例えば、監視対象装置でイベントが発生したことを示すイベントメッセージ、監視対象装置に関する性能情報等の種々の情報を受信する。監視コンピュータ1は、監視対象装置から受信した種々の情報に基づいて、例えば、イベントの原因を解析する処理(確信度評価処理)等の種々の処理を行い、その処理結果を出力する。
図2は、実施例1に係るイベント原因情報リポジトリの一例の構成図である。
イベント原因情報リポジトリ131には、1以上の一般ルール61と、1以上の展開ルール62とが格納される。一般ルール61は、ノード装置のいずれかに関する1以上の条件イベントと当該1以上の条件イベントが発生した場合に原因となる結論との対応関係を、計算機システムの実構成に依存しない形式で記述した情報である。一般ルール61は、複数の結論を含んでいてもよい。本実施例において、結論はイベントであり、結論を結論イベントと呼ぶ場合がある。
一般ルール61は、IF部611とTHEN部612とを有する。IF部611は、1以上の条件イベントデータ要素613を含む。条件イベントデータ要素613は、種別によって抽象化されたノード装置に関する条件イベントを示し、例えば、条件イベントに関係するノード装置の種別を示すデータと、条件イベントの種別を示すデータとを含む。また、THEN部612は、結論イベントデータ要素614を含む。結論イベントデータ要素614は、種別によって抽象化されたノード装置に関する結論イベントを示し、例えば、結論イベントに関係するノード装置の種別を示すデータと、結論イベントの種別を示すデータとを含む。
例えば、同図の一般ルール「GenRule1」は、2つの条件イベントデータ要素613と1つの結論イベントデータ要素614とを含む。すなわち、一般ルール「GenRule1」は、2つの条件イベントデータ要素613がそれぞれ示す2つの条件イベントが検知された場合に、結論イベントデータ要素614が示す結論イベントが原因であると特定されることを表している。具体的には、一般ルール「GenRule1」に含まれる2つの条件イベントデータ要素613は、それぞれ、VMに関する「論理ディスク障害」のイベントと、ストレージ3に関する「ディスク障害」のイベントとを示している。また、一般ルール「GenRule1」に含まれる結論イベントデータ要素614は、ストレージ3に関する「ディスク障害」のイベントを示している。従って、一般ルール「GenRule1」は、VMに関する「論理ディスク障害」のイベントと、ストレージ3に関する「ディスク障害」のイベントとが検知された場合に、ストレージ3に関する「ディスク障害」のイベントが原因であると特定されることを表している。同様に、一般ルール「GenRule2」は、VMに関する「論理ディスク障害」のイベントと、IPスイッチに関する「Port Link Down」のイベントとが検知された場合に、IPスイッチに関する「Port Link Down」のイベントが原因であると特定されることを表している。
展開ルール62は、一般ルール61を計算機システムの実構成に依存する形式に展開した情報である。展開ルール62は、複数の結論を含んでいてもよい。一般ルール61と同様に、展開ルール62は、IF部621とTHEN部622とを有する。IF部621は、1以上の条件イベントデータ要素623を含む。条件イベントデータ要素623は、具体的なノード装置に関する条件イベントを示し、例えば、条件イベントに関係するノード装置の名称と、条件イベントの種別を示すデータとを含む。また、THEN部622は、結論イベントデータ要素624を含む。結論イベントデータ要素624は、具体的なノード装置に関する結論イベントを示し、例えば、結論イベントに関係するノード装置の名称と、結論イベントの種別を示すデータとを含む。
例えば、同図の展開ルール「ExpRule1」は、2つの条件イベントデータ要素623と1つの結論イベントデータ要素624とを含む。すなわち、展開ルール「ExpRule1」は、2つの条件イベントデータ要素623がそれぞれ示す2つの条件イベントが検知された場合に、結論イベントデータ要素624が示す結論イベントが原因であると特定されることを表している。具体的には、展開ルール「ExpRule1」に含まれる2つの条件イベントデータ要素623は、それぞれ、VM Aに関する「論理ディスク障害」のイベントと、ストレージA(図では「StA」と表記)に関する「ディスク障害」のイベントとを示している。また、展開ルール「ExpRule1」に含まれる結論イベントデータ要素624は、ストレージAに関する「ディスク障害」のイベントを示している。従って、展開ルール「ExpRule1」は、VM Aに関する「論理ディスク障害」のイベントと、ストレージAに関する「ディスク障害」のイベントとが検知された場合に、ストレージAに関する「ディスク障害」のイベントが原因であると特定されることを表している。同様に、展開ルール「ExpRule2」は、VM Aに関する「論理ディスク障害」のイベントと、VM Bに関する「論理ディスク障害」のイベントと、VM Cに関する「論理ディスク障害」のイベントと、IPスイッチ1(図では「IP-SW01」と表記)に関する「Port Link Down」のイベントとが検知された場合に、IPスイッチ1に関する「Port Link Down」のイベントが原因であると特定されることを表している。
図3は、実施例1に係るイベントメッセージの一例の構成図である。
イベントメッセージ7は、監視対象装置でイベントが発生したことを監視コンピュータ1に通知するために送信される情報である。イベントメッセージ7は、ノード種別71、ノード名72、及びイベント種別73のフィールドを含む。ノード種別71には、発生したイベントに関係するノード装置の種別を示すデータが格納される。ノード名72には、発生したイベントに関係するノード装置の名称が格納される。イベント種別73には、発生したイベントの種別を示すデータが格納される。
図4は、実施例1に係るイベントキューテーブルの一例の構成図である。
イベントキューテーブル132は、監視コンピュータ1が検知したイベントに関する情報を管理するためのテーブルである。イベント受信プログラム122は、イベントメッセージ7を受信した場合に、受信したイベントメッセージ7により通知されたイベントに関するエントリを作成し、このテーブル132に格納する。
イベントキューテーブル132は、番号(図では「#」と表記する)1321、ノード種別1322、ノード名1323、イベント種別1324及び受信日時1325のフィールドを含む。番号1321には、イベントキューテーブル132に登録されるエントリの番号が格納される。ノード種別1322には、イベントに関係するノード装置の種別を示すデータが格納される。ノード名1323には、イベントに関係するノード装置の名称が格納される。イベント種別1324には、イベントの種別を示すデータが格納される。受信日時1325には、イベントの発生を示すイベントメッセージ7の受信日時を示すデータが格納される。
図5は、実施例1に係る性能情報テーブルの一例の構成図である。
性能情報テーブル133は、監視対象装置に関する性能値を管理するためのデータである。性能情報テーブル133は、番号1331、ノード名1332、コンポーネント名1333、収集開始日時1334、収集期間1335、値1336及びメトリック1337のフィールドを含む。番号1331には、性能情報テーブル133に登録されるエントリの番号が格納される。ノード名1332には、性能値に関係する監視対象装置の名称が格納される。コンポーネント名1333には、ノード装置における性能値に関係するコンポーネントの名称が格納される。収集開始日時1334には、性能値の収集を開始した日時を示すデータが格納される。収集期間1335には、性能値の収集期間を示すデータが格納される。値1336には、性能値が格納される。メトリック1337には、性能値の種別を示すデータが格納される。
例えば、同図の番号1331が「1」であるエントリから、2012年4月7日の10時00分00秒から10時05分00秒までにおける、VM Aのディスクドライブに関する性能値、具体的にはディスク転送平均時間(所定量のデータを転送するために要する時間の平均値)が60[msec]であることがわかる。また、例えば、同図の番号1331が「10」であるエントリから、2012年4月7日の10時10分00秒から10時15分00秒までの間に、VM BのネットワークI/F23がPing応答(ピングコマンドに対する応答メッセージ)を1度送信していたことがわかる。
図6は、実施例1に係るイベント発生ルールリポジトリの一例の構成図である。
イベント発生ルールリポジトリ134には、1以上のイベント発生ルール1340が格納される。イベント発生ルールリポジトリ134は、例えばテーブルで構成され、番号1341、ノード種別1342、イベント種別1343、及びイベント発生条件1344のフィールドを含む。イベント発生条件1344は、調査対象1344a、調査期間1344b、値1344c、及びメトリック1344dのフィールドを含む。イベント発生ルールリポジトリ134に登録されたエントリのそれぞれが、イベント発生ルール1340に対応する。
番号1341には、イベント発生ルールリポジトリ134に登録されるエントリ、すなわちイベント発生ルール1340の番号が格納される。ノード種別1342には、イベント発生ルール1340が適用されるイベントに関係するノード装置の種別を示すデータが格納される。イベント種別1343には、イベント発生ルール1340が適用されるイベントの種別を示すデータが格納される。イベント発生条件1344には、イベント発生ルール1340が適用されるイベントについて、監視コンピュータ1が当該イベントを検知し得ると判定するための条件(以下「イベント発生条件」という)を示すデータが格納される。
調査対象1344aには、イベント発生条件を示す性能値に関係するコンポーネントの名称が格納される。調査期間1344bには、イベント発生条件の対象期間が格納される。イベント発生条件の対象期間は、例えば、イベント発生ルール1340に基づく判定(すなわち、監視コンピュータ1が対象のイベントを検知し得るか否かの判定、以下「検知可否判定」という)が行われる日時を基準日時として、基準日時よりも所定期間遡った日時から基準日時までの期間とされる。なお、基準日時よりも所定期間遡った日時をどのように決定するかについては、後述する。値1344cには、イベント発生条件を示す性能値及びその性能値に基づく判定方法を示すデータが格納される。メトリック1344dには、イベント発生条件を示す性能値の種別を示すデータが格納される。
例えば、同図の番号1341が「1」であるエントリは、サーバ2に関する「論理ディスク障害」のイベントについてのイベント発生ルール1340を示している。そして、このイベント発生ルール1340が規定するイベント発生条件は、調査期間1344bが示す期間内において、ディスクドライブに関するディスク転送平均時間が1度でも0[msec]より上となることである。すなわち、このイベント発生ルール1340は、サーバ2に関する「論理ディスク障害」のイベントについて、調査期間1344bが示す期間内において、サーバ2のディスクドライブに関するディスク転送平均時間が1度でも0[msec]より上となった場合に、監視コンピュータ1が当該イベントを検知し得ると判定することを示している。このように判定する理由は、サーバ2に関する「論理ディスク障害」が発生するためには、サーバ2のディスクドライブ(論理ディスク)に対するアクセス要求が発生している必要があるからであり、サーバ2のディスクドライブに対するアクセス要求が発生しているか否かは、サーバ2のディスクドライブに対するデータの入出力の有無により推測できるからである。
また、例えば、同図の番号1341が「2」であるエントリは、サーバ2に関する「論理ディスク障害」のイベントについてのイベント発生ルール1340を示している。そして、このイベント発生ルール1340が規定するイベント発生条件は、調査期間1344bが示す期間内に、ネットワークI/F23がPing応答を1度でも送信していることである。すなわち、このイベント発生ルール1340は、サーバ2に関する「論理ディスク障害」のイベントについて、調査期間1344bが示す期間内に、サーバ2のネットワークI/F23がPing応答を1度でも送信していた場合に、監視コンピュータ1が当該イベントを検知し得ると判定することを示している。このように判定する理由は、サーバ2のネットワークI/F23がPing応答を送信している場合、当該サーバ2がシャットダウン中であることはなく、当該サーバ2はデータ通信が可能な状況にあると言えるからである。
また、例えば、同図の番号1341が「3」であるエントリは、IPスイッチに関する「Port Link Down」のイベントについてのイベント発生ルール1340を示している。そして、このイベント発生ルール1340が規定するイベント発生条件は、調査期間1344bが示す期間内において、ポートの受信速度が1度でも0[MB(メガバイト)/sec]より上となることである。すなわち、このイベント発生ルール1340は、IPスイッチに関する「Port Link Down」のイベントについて、調査期間1344bが示す期間内において、IPスイッチのポートの受信速度が1度でも0[MB/sec]より上となった場合に、監視コンピュータ1が当該イベントを検知し得ると判定することを示している。このように判定する理由は、IPスイッチのポートに対してデータの入力が行われている場合、当該IPスイッチはデータ通信が可能な状況にあると言えるからである。
また、例えば、同図の番号1341が「4」であるエントリは、IPスイッチに関する「Port Link Down」のイベントについてのイベント発生ルール1340を示している。そして、このイベント発生ルール1340が規定するイベント発生条件は、調査期間1344bが示す期間内において、ポートの送信速度が1度でも0[MB/sec]より上となることである。すなわち、このイベント発生ルール1340は、IPスイッチに関する「Port Link Down」のイベントについて、調査期間1344bが示す期間内において、IPスイッチのポートの送信速度が1度でも0[MB/sec]より上となった場合に、監視コンピュータ1が当該イベントを検知し得ると判定することを示している。このように判定する理由は、IPスイッチのポートがデータを出力している場合、当該IPスイッチはデータ通信が可能な状況にあると言えるからである。
また、例えば、同図の番号1341が「5」であるエントリは、ストレージ3に関する「ディスク障害」のイベントについてのイベント発生ルール1340を示している。そして、このイベント発生ルール1340が規定するイベント発生条件は、調査期間1344bが示す期間内において、LU(論理ユニット)に関するI/O(入出力)応答時間が1度でも0[msec]より上となることである。すなわち、このイベント発生ルール1340は、ストレージ3に関する「ディスク障害」のイベントについて、調査期間1344bが示す期間内において、ストレージ3のLUに関するI/O応答時間が1度でも0[msec]より上となった場合に、監視コンピュータ1が当該イベントを検知し得ると判定することを示している。このように判定する理由は、ストレージ3のLUに対してデータの入出力が行われている場合、当該ストレージ3がシャットダウン中であることはなく、当該ストレージ3はデータ通信が可能な状況にあると言えるからである。
図7は、実施例1に係るルールメモリデータの一例の構成図である。
ルールメモリデータ8は、少なくとも、イベントの原因解析に用いられる複数の展開ルール62と、その展開ルール62の条件イベントに関する検知の有無を示すデータと、その展開ルール62の結論イベントが原因であることの確からしさを示す確信度とを、複数のオブジェクト及びそれらの関連付けにより表現したデータである。ルールメモリデータ8は、展開ルール62に基づいて生成されてもよいし、一般ルール61及び計算機システムのシステム構成を示す構成情報に基づいて生成されてもよい。ルールメモリデータ8が一般ルール61及び構成情報に基づいて生成される場合は、展開ルール62をイベント原因情報リポジトリ131に格納していなくてもよい。
ルールメモリデータ8は、複数の条件オブジェクト81と、複数の結論オブジェクト82と、それぞれの接続情報とを含む。条件オブジェクト81は、展開ルール62の条件イベントに対応し、結論オブジェクト82は、展開ルール62の結論イベントに対応する。条件オブジェクト81と結論オブジェクト82との接続関係は、展開ルール62における条件イベントと結論イベントとの対応関係を示している。なお、各オブジェクトは、コンピュータ言語では例えば構造体やクラスとして実装され、プログラム動作中はメモリ12に格納されるデータ(オブジェクトデータ)である。
条件オブジェクト81は、条件イベントに関するデータを管理するオブジェクトである。条件オブジェクト81は、ノード種別811、ノード名812、イベント813、受信日時814、発生の是非815、及び重み値816のフィールドを含む。ノード種別811には、この条件オブジェクト81に対応する条件イベントに関係するノード装置の種別を示すデータが格納される。ノード名812には、この条件オブジェクト81に対応する条件イベントに関係するノード装置の名称が格納される。イベント813には、この条件オブジェクト81に対応する条件イベントの種別を示すデータが格納される。受信日時814には、この条件オブジェクト81に対応する条件イベントの発生を示すイベントメッセージ7の受信日時、すなわち、この条件オブジェクト81に対応する条件イベントが監視コンピュータ1によって検知された日時(検知日時)を示すデータが格納される。
発生の是非815には、監視コンピュータ1が、この条件オブジェクト81に対応する条件イベントを検知している場合、すなわち、この条件オブジェクト81に対応する条件イベントの発生を示すイベントメッセージ7を受信している場合は、そのことを示すデータ、例えば「Occurred」が格納される。一方、監視コンピュータ1が、対応する条件イベントを検知していない場合は、発生の是非815には、以下のデータが格納される。すなわち、この条件イベントについての検知可否判定が未だ行われていない場合は、そのことを示すデータ、例えば「Uncheck」が格納される。また、この条件イベントについての検知可否判定が行われ、監視コンピュータ1が当該イベントを検知し得るという判定結果が得られている場合は、そのことを示すデータ、例えば「will occurred」が格納される。また、この条件イベントについての検知可否判定が行われ、監視コンピュータ1が当該イベントを検知し得ないという判定結果が得られている場合は、そのことを示すデータ、例えば「will not occurred」が格納される。
重み値816には、この条件オブジェクト81に対応する条件イベントに設定された重み値が格納される。重み値は、監視コンピュータ1が確信度(後述する第1の確信度)を計算する際に参照するデータである。本実施例において、重み値は、「0.0」以上「1.0」以下の範囲内の値をとる。本実施例において、監視コンピュータ1は、以下のように条件イベントに重み値を設定する。すなわち、監視コンピュータ1は、条件イベントを検知すると、当該条件イベントに重み値「1.0」を設定する。その後、当該条件イベントに予め設定されている有効期間が経過するまで、当該条件イベントの重み値は、「1.0」に保たれる。そして、当該条件イベントに予め設定されている有効期間が経過した後、監視コンピュータ1は、当該条件イベントに予め設定されている減衰率に従って、当該条件イベントの重み値を「0.0」まで減少させる。より具体的には、監視コンピュータ1は、所定時間(例えば1分)おきに、前回設定した重み値から減衰率分減じた値を新たな重み値として設定することを、重み値が「0.0」以下になるまで繰り返して行う。その後、当該条件イベントが再度検知されるまで、当該条件イベントの重み値は、「0.0」に保たれる。
例えば、同図の上から1番目の条件オブジェクト81(以下「第1条件オブジェクト」という)は、VM Aに関する「論理ディスク障害」の条件イベントに関するデータを管理する。第1条件オブジェクトの受信日時814には、「2012年4月7日 10時30分22秒」が格納されている。従って、第1条件オブジェクトは、VMAに関する「論理ディスク障害」の条件イベントが、2012年4月7日の10時30分22秒に、監視コンピュータ1によって検知されたことを示している。また、例えば、同図の上から2番目の条件オブジェクト81(以下「第2条件オブジェクト」という)は、VM Bに関する「論理ディスク障害」の条件イベントに関するデータを管理する。第2条件オブジェクトの受信日時814には、受信日時を示すデータが格納されていない。従って、第2条件オブジェクトは、VM Bに関する「論理ディスク障害」の条件イベントが、監視コンピュータ1によって検知されていないことを示している。また、第2条件オブジェクトの発生の是非815には、「will occurred」が格納されている。従って、第2条件オブジェクトは、VM Bに関する「論理ディスク障害」の条件イベントについて、検知可否判定が行われ、監視コンピュータ1が当該イベントを検知し得るという判定結果が得られていることを示している。
結論オブジェクト82は、結論イベントに関するデータを管理するオブジェクトである。結論オブジェクト82は、ルール821、ノード822、原因823、及び確信度824のフィールドを含む。ルール821には、この結論オブジェクト82に対応する結論イベントを含む展開ルール62の名称が格納される。ノード822には、この結論オブジェクト82に対応する結論イベントに関係するノード装置の名称が格納される。原因823には、この結論オブジェクト82に対応する結論イベントの種別を示すデータが格納される。確信度824には、この結論オブジェクト82に対応する結論イベントについての確信度(第1の確信度)が格納される。確信度は、後述する確信度評価処理において計算される。
なお、ルールメモリデータ8は、図7で説明した構造に限られるものではなく、条件イベント及び結論イベントの対応関係、条件イベントの検知の有無、条件イベントについての検知可否判定の結果、及び結論イベントについての確信度を表現し得る他のデータ構造であってもよい。
図8は、実施例1に係るイベント消去設定テーブルの一例の構成図である。
イベント消去設定テーブル135は、計算機システム内で発生し得る各イベントに予め設定された有効期間及び減衰率を管理するためのデータである。イベント消去設定テーブル135は、ノード種別1351、イベント種別1352、有効期間1353、及び減衰率1354のフィールドを含む。ノード種別1351には、イベントに関係するノード装置の種別を示すデータが格納される。イベント種別1352には、イベントの種別を示すデータが格納される。有効期間1353には、イベントに設定された有効期間、すなわち、重み値が「1.0」に設定されてからその減衰が開始されるまでの期間を示すデータが格納される。減衰率1354には、イベントに設定された減衰率、すなわち、重み値を減少させる場合における所定時間(本実施例では1分)おきに減少させる値を示すデータが格納される。例えば、同図の上から1番目のエントリから、サーバ2に関する「論理ディスク障害」のイベントには、有効期間「10(分)」及び減衰率「0.3(ポイント/分)」が設定されていることがわかる。
図9は、実施例1に係るイベント消去タスクテーブルの一例の構成図である。
イベント消去タスクテーブル136は、監視コンピュータ1によって検知されたイベントについてのイベント消去タスクに関する情報を管理するためのデータである。イベント消去タスクは、検知されたイベントに設定された重み値を、当該イベントに設定されている減衰率に基づいて減少させる処理を行うタスクである。イベント消去タスクテーブル136は、タスク開始日時1361、ノード名1362、イベント種別1363、及び減衰率1364のフィールドを含む。タスク開始日時1361には、イベント消去タスクの実行が開始される日時、すなわちイベント消去タスクの対象となるイベントに設定された重み値の減衰が開始される日時(以下「タスク開始日時」という)を示すデータが格納される。タスク開始日時は、例えば、イベント消去タスクの対象となるイベントが検知された日時(イベントメッセージ7の受信日時)に当該イベントに設定されている有効期間を加えた日時とされる。ノード名1362には、イベント消去タスクの対象となるイベントに関係するノード装置の名称が格納される。イベント種別1363には、イベント消去タスクの対象となるイベントの種別を示すデータが格納される。減衰率1364には、イベント消去タスクの対象となるイベントに設定されている減衰率が格納される。例えば、同図の上から1番目のエントリから、VM Aに関する「論理ディスク障害」のイベントについてのイベント消去タスクが2012年4月7日の10時30分22秒に開始され、当該イベント消去タスクが採用する減衰率が「0.3(ポイント/分)」であることがわかる。
次に、監視コンピュータ1の動作について説明する。
図10は、実施例1に係るルールメモリデータ生成処理のフローチャートである。
ルールメモリデータ生成処理は、展開ルール62に基づいてルールメモリデータ8を生成する処理である。
まず、ルールローダプログラム121は、一般ルール61及び計算機システムの構成情報に基づいて展開ルール62を生成し、生成した展開ルール62をイベント原因情報リポジトリ131に保存する(ステップS101)。
次に、ルールローダプログラム121は、イベント原因情報リポジトリ131から展開ルール62を取得し、取得した展開ルール62を構文解析する(ステップS102)。
次に、ルールローダプログラム121は、ステップS102で取得した展開ルール62のIF部621から条件イベントデータ要素623を取得する(ステップS103)。
その後、ルールローダプログラム121は、ステップS103で取得した条件イベントデータ要素623が示す条件イベントに対応する条件オブジェクト81がルールメモリ128のルールメモリデータ8内に存在するか否かを調べる(ステップS104)。
対応する条件オブジェクト81がルールメモリデータ8内に存在する場合(ステップS105:YES)、ルールローダプログラム121は、処理をステップS107へ進める。
一方、対応する条件オブジェクト81がルールメモリデータ8内に存在しない場合(ステップS105:NO)、ルールローダプログラム121は、ステップS103で取得した条件イベントデータ要素623が示す条件イベントに対応する条件オブジェクト81をルールメモリデータ8内に生成する(ステップS106)。その後、ルールローダプログラム121は、処理をステップS107へ進める。
ステップS107において、ルールローダプログラム121は、IF部621内の全ての条件イベントデータ要素623について処理が完了したか否かを判定する。未だ処理されていない条件イベントデータ要素623が残っている場合(ステップS107:NO)、ルールローダプログラム121は、処理をステップS103へ進める。
一方、全ての条件イベントデータ要素623について処理が完了している場合(ステップS107:YES)、ルールローダプログラム121は、ステップS102で取得した展開ルール62のTHEN部622から結論イベントデータ要素624を取得する(ステップS108)。
その後、ルールローダプログラム121は、ステップS108で取得した結論イベントデータ要素624が示す結論イベントに対応する結論オブジェクト82をルールメモリデータ8内に生成する。そして、ルールローダプログラム121は、生成した結論オブジェクト82と、関連する全ての条件オブジェクト81とを接続する(ステップS109)。なお、関連する条件オブジェクト81とは、生成した結論オブジェクト82に対応する結論イベントに展開ルール62において対応付けられている条件イベントに対応する条件オブジェクト81のことである。
その後、ルールローダプログラム121は、イベント原因情報リポジトリ131内の全ての展開ルール62について処理が完了したか否かを判定する(ステップS110)。未だ処理されていない展開ルール62が残っている場合(ステップS110:NO)、ルールローダプログラム121は、処理をステップS102へ進める。一方、全ての展開ルール62について処理が完了している場合(ステップS110:YES)、ルールローダプログラム121は、ルールメモリデータ生成処理を終了する。
図11は、実施例1に係るイベント受信処理及びイベント書込処理のフローチャートである。
まず、イベント受信処理について説明する。イベント受信処理は、監視コンピュータ1がイベントメッセージ7を受信した際に行われる処理である。
監視コンピュータ1が、監視対象装置からイベントメッセージ7を受信すると(ステップS201)、イベント受信プログラム122は、受信したイベントメッセージ7が示すイベントに関する、イベントキューテーブル132のエントリを作成し、作成したエントリをイベントキューテーブル132に追加する(ステップS202)。作成したエントリには、受信したイベントメッセージ7のノード種別71、ノード名72、及びイベント種別73から取得された各データ、及び、受信したイベントメッセージ7の受信日時を示すデータが格納される。その後、イベント受信プログラム122は、イベント受信処理を終了する。
次に、イベント書込処理について説明する。イベント書込処理は、検知された条件イベントに関する情報を、対応する条件オブジェクト81に格納し、検知された条件イベントについてのイベント消去タスクに関する情報をイベント消去タスクテーブル136に登録する処理である。
イベント書込プログラム123は、イベントキューテーブル132からエントリを1つ取得する(ステップS301)。
次に、イベント書込プログラム123は、ステップS301で取得したエントリからノード種別1322、ノード名1323、及びイベント種別1324の各データを取得する(ステップS302)。
その後、イベント書込プログラム123は、ルールメモリデータ8から、ステップS301で取得したエントリが示すイベント(図11の説明において「対象イベント」という)に対応する条件イベント81を特定する(ステップS303)。具体的には、イベント書込プログラム123は、ステップS302で取得したノード名1323及びイベント種別1324が示すノード装置の名称及びイベントの種別をキーにルールメモリデータ8を検索し、ノード名812及びイベント813が示すノード装置の名称及びイベントの種別がキーと一致する条件オブジェクト81を特定する。
その後、イベント書込プログラム123は、ステップS303で特定した条件オブジェクト81の受信日時814に、現在日時を示すデータを格納する(ステップS304)。また、イベント書込プログラム123は、ステップS303で特定した条件オブジェクト81の発生の是非815に、「Occurred」を格納する(ステップS305)。また、イベント書込プログラム123は、ステップS303で特定した条件オブジェクト81の重み値816に、「1.0」を格納する(ステップS306)。
その後、イベント書込プログラム123は、イベント消去設定テーブル135から、対象イベントに設定されている有効期間及び減衰率を取得する(ステップS307)。
その後、イベント書込プログラム123は、対象イベントに関する、イベント消去タスクテーブル136のエントリを作成し、作成したエントリをイベント消去タスクテーブル136に追加する(ステップS308)。作成したエントリには、ステップS301で取得したエントリのノード名1323及びイベント種別1324から取得された各データ、タスク開始日時、すなわち現在日時に対象イベントに設定されている有効期間を加えた日時を示すデータ、及び、対象イベントに設定されている減衰率が格納される。
その後、イベント書込プログラム123は、確信度評価プログラム125に確信度評価処理(図13参照)を実行させる(ステップS309)。確信度評価処理を実行させる際、イベント書込プログラム123は、ステップS303で特定した条件オブジェクト81を指定するパラメータを、確信度評価プログラム125に入力する。この確信度評価処理により、対象イベントに対応付けられている各結論イベントについて、確信度が計算される。その後、イベント書込プログラム123は、イベント書込処理を終了する。
図12は、実施例1に係る性能情報受信処理のフローチャートである。
性能情報受信処理は、監視コンピュータ1が監視対象装置に関する性能情報を受信した際に行われる処理である。
監視コンピュータ1が、監視対象装置に関する性能値を含む性能情報を、監視対象装置から受信すると(ステップS401)、性能情報受信プログラム124は、受信した性能情報に関する、性能情報テーブル133のエントリを作成し、作成したエントリを性能情報テーブル133に追加する(ステップS402)。作成したエントリには、エントリの番号、受信した性能情報に含まれる性能値、その性能値に関係するノード装置及びコンポーネントの名称、その性能値の収集が開始された日時及び収集期間を示すデータ、並びに、その性能値の種別を示すデータが格納される。その後、性能情報受信プログラム124は、性能情報受信処理を終了する。
なお、監視コンピュータ1は、定期的又は不定期的に性能情報を繰り返して受信し、性能情報受信プログラム124は、監視コンピュータ1が性能情報を受信する度に、性能情報受信処理を実行する。
図13は、実施例1に係る確信度評価処理のフローチャートである。
確信度評価処理は、ルールメモリデータ8に基づいて、入力された条件オブジェクト81に接続されている各結論オブジェクト82について、その結論イベントの確信度を計算する処理である。確信度評価処理は、図11におけるステップS309の処理又は図15におけるステップS710の処理に対応する。
まず、確信度評価プログラム125は、確信度評価処理を実行させたイベント書込プログラム123又はイベント消去プログラム127によって入力されたパラメータを受信する(ステップS501)。
次に、確信度評価プログラム125は、入力されたパラメータによって指定される条件オブジェクト81に接続されている結論オブジェクト82(図13の説明において「対象結論オブジェクト」という)を、ルールメモリデータ8から取得する(ステップS502)。図13の説明において、対象結論オブジェクトに対応する結論イベントを「対象結論イベント」という。
次に、確信度評価プログラム125は、対象結論オブジェクトに接続されている全ての条件オブジェクト81を、ルールメモリデータ8から取得する(ステップS503)。図13の説明において、対象結論オブジェクトに接続されている条件オブジェクト81のそれぞれを「対象条件オブジェクト」といい、対象条件オブジェクトに対応する条件イベントを「対象条件イベント」という。
その後、確信度評価プログラム125は、対象結論イベントについての確信度であって、対象条件イベントについての検知可否判定の結果を考慮しない確信度(第2の確信度)を計算する(ステップS504)。具体的には、確信度評価プログラム125は、発生の是非815に「Occurred」が格納されている対象条件オブジェクトの数、すなわち、対応する条件イベントが監視コンピュータ1によって検知されている対象条件オブジェクトの数を、対象条件オブジェクトの総数で除算し、除算して得られた値に100を乗算することにより、第2の確信度を計算する。
例えば、図7に示すルールメモリデータ8の場合、上から2番目の結論オブジェクト82(以下「第2結論オブジェクト」という)に対応する結論イベント、すなわち、IPスイッチ1に関する「Port1 Link Down」の結論イベントについての第2の確信度は、次のように計算される。すなわち、第2結論オブジェクトに接続されている条件オブジェクト81の総数は、4である。また、第2結論オブジェクトに接続されている条件オブジェクト81のうち、発生の是非815に「Occurred」が格納されている条件オブジェクト81は、第1条件オブジェクトだけであり、その数は1である。従って、第2結論オブジェクトに対応する結論イベントについての第2の確信度は、25%(1/4×100)と計算される。
その後、確信度評価プログラム125は、ステップS504で計算された第2の確信度が所定値(例えば、20%)以上か否かを判定する(ステップS505)。
第2の確信度が所定値より小さい場合(ステップS505:NO)、確信度評価プログラム125は、処理をステップS509へ進める。すなわち、確信度評価プログラム125は、第2の確信度が所定値より小さい結論イベントについては、原因の候補から除外して、ステップS506~SステップS508の処理を行わないようにする。このようにすることで、確信度評価プログラム125は、原因となる可能性が極めて低い結論イベントについて、その結論イベントに対応付けられている条件イベントについてのイベント発生条件調査処理及び第1の確信度の計算処理(ステップS506~SステップS508の処理)を行わないようにすることができ、それにより、処理負荷の軽減を図ることができる。
一方、第2の確信度が所定値以上である場合(ステップS505:YES)、確信度評価プログラム125は、イベント発生条件調査プログラム126にイベント発生条件調査処理(図14参照)を実行させる(ステップS506)。イベント発生条件調査処理を実行させる際、確信度評価プログラム125は、発生の是非815に「Occurred」が格納されていない対象条件オブジェクト、すなわち、対応する条件イベントが監視コンピュータ1によって検知されていない対象条件オブジェクトを指定するパラメータを、イベント発生条件調査プログラム126に入力する。このイベント発生条件調査処理により、未検知の対象条件イベントについて検知可否判定が行われ、未検知の対象条件イベントへの重み値の設定が行われる。
その後、確信度評価プログラム125は、対象条件オブジェクトのそれぞれに設定されている重み値(重み値816の値)の合計を計算する(ステップS507)。
その後、確信度評価プログラム125は、対象結論イベントについての確信度であって、対象条件イベントについての検知可否判定の結果を考慮した確信度(第1の確信度)を計算する(ステップS508)。具体的には、確信度評価プログラム125は、ステップS507で計算した重み値の合計を、対象条件オブジェクトの総数で除算し、除算して得られた値に100を乗算することにより、第1の確信度を計算する。
例えば、図7に示すルールメモリデータ8の場合、第2結論オブジェクトについての第1の確信度は、次のように計算される。すなわち、第2結論オブジェクトに接続されている条件オブジェクト81の総数は、4である。また、第2結論オブジェクトに接続されている条件オブジェクト81の重み値816の値の合計は、3である。従って、第2結論オブジェクトに対応する結論イベントについての第2の確信度は、75%(3/4×100)と計算される。
その後、確信度評価プログラム125は、計算した第1の確信度を対象結論オブジェクトの確信度824に格納する。
その後、確信度評価プログラム125は、入力されたパラメータによって指定される条件オブジェクトに接続されている全ての結論オブジェクト82について処理が完了したか否かを判定する(ステップS509)。未だ処理されていない結論オブジェクト82が残っている場合(ステップS509:NO)、確信度評価プログラム125は、処理をステップS502へ進める。
一方、入力されたパラメータによって指定される条件オブジェクトに接続されている全ての結論オブジェクト82について処理が完了している場合(ステップS509:YES)、確信度評価プログラム125は、原因解析の結果を表示するための第1の調査結果表示画面(図16参照)をディスプレイ17に表示させる(ステップS510)。その後、確信度評価プログラム125は、確信度評価処理を終了する。
図14は、実施例1に係るイベント発生条件調査処理のフローチャートである。
イベント発生条件調査処理は、入力された条件オブジェクト81に対応する条件イベント(未検知の条件イベント)について検知可否判定を行い、その判定結果に基づいて当該条件イベントへの重み値の設定を行う処理である。イベント発生条件調査処理は、図13におけるステップS506の処理に対応する。
まず、イベント発生条件調査プログラム126は、イベント発生条件調査処理を実行させた確信度評価プログラム125によって入力されたパラメータを受信する(ステップS601)。図14の説明において、入力されたパラメータによって指定される条件オブジェクト81を「対象条件オブジェクト」といい、対象条件オブジェクトに対応する条件イベントを「対象条件イベント」という。なお、対象条件イベントは、未検知のイベントである。
次に、イベント発生条件調査プログラム126は、イベント発生ルールリポジトリ134から、対象条件イベントに適用されるイベント発生ルール1340を1つ取得する(ステップS602)。具体的には、イベント発生条件調査プログラム126は、ノード種別1342及びイベント種別1343が示すノード装置の種別及びイベントの種別が、対象条件オブジェクトのノード種別811及びイベント813が示すノード装置の種別及びイベントの種別と一致するイベント発生ルール1340を取得する。例えば、対象条件イベントが、VM Bに関する「論理ディスク障害」のイベントである場合は、当該イベントに関係するノード装置(VM B)の種別であるサーバ2を示すデータ(「Server」)がノード種別1342に格納されており、且つ当該イベントの種別である「論理ディスク障害」を示すデータがイベント種別1343に格納されているイベント発生ルール1340、すなわち、図6の例では番号1341が「1」のイベント発生ルール1340又は番号1341が「2」のイベント発生ルール1340が取得される。
次に、イベント発生条件調査プログラム126は、性能情報テーブル133における対象条件イベントに関係するノード装置に関する性能値を参照して、ステップS602で取得したイベント発生ルール1340が規定するイベント発生条件を満たすか否かを判定することにより、監視コンピュータ1が対象条件イベントを検知し得るか否かを判定する(ステップS603)。
例えば、対象条件イベントが、VM Bに関する「論理ディスク障害」のイベントであり、ステップS602において、図6の番号1341が「1」のイベント発生ルール1340が取得された場合、イベント発生条件調査プログラム126は、次のように判定する。すなわち、番号1341が「1」のイベント発生ルール1340が規定するイベント発生条件は、調査期間1344bが示す期間(対象期間)内において、ディスクドライブに関するディスク転送平均時間が1度でも0[msec]より上となることである。なお、この例では、対象期間を2012年4月7日の0時0分0秒から現在までとする。図5の性能情報テーブル133において、対象期間内におけるVM Bのディスクドライブに関する性能値(ディスク転送平均時間)を示しているエントリは、番号1331が「7」~「9」の3つのエントリであり、それらが示す性能値は、それぞれ80[msec]、70[msec]、75[msec]である。すなわち、対象期間内におけるVM Bのディスクドライブに関する性能値(ディスク転送平均時間)は、1度でも0より上となっている。従って、イベント発生条件調査プログラム126は、イベント発生条件を満たしていると判定し、監視コンピュータ1が対象条件イベント(VM Bに関する「論理ディスク障害」のイベント)を検知し得ると判定する。
なお、調査期間1344bが示す期間は、例えば、基準日時(検知可否判定が行われる日時、つまり現在日時)よりも所定期間遡った日時から基準日時までの期間とされるが、監視コンピュータ1は、基準日時よりも所定期間遡った日時(以下「過去基準日時」という)を、例えば、次のように決定する。すなわち、監視コンピュータ1は、対象条件オブジェクトに接続されている結論オブジェクト82に対応する結論イベントの検知日時を取得する。そして、監視コンピュータ1は、取得した結論イベントの検知日時より前までの日時のうち、性能情報受信プログラム124における性能情報収集の最新の開始日時を、過去基準日時と決定する。なお、監視コンピュータ1は、対象条件オブジェクトに接続されている結論オブジェクト82に対応する結論イベントを検知していない場合は、当該結論イベントの検知日時を取得することができない。この場合、監視コンピュータ1は、対象条件オブジェクトに接続されている結論オブジェクト82に接続されている1以上の条件オブジェクト81のそれぞれの条件イベントの検知日時のうち、最も古い日時を取得する。そして、監視コンピュータ1は、取得した条件イベントの検知日時のうち最も古い日時において、その日時より前までの日時のうち、性能情報受信プログラム124における性能情報収集の最新の開始日時を、過去基準日時と決定する。
イベント発生条件を満たす場合(ステップS604:YES)、イベント発生条件調査プログラム126は、対象条件オブジェクト81の発生の是非815に、監視コンピュータ1が対象条件イベントを検知し得ることを示す「will occurred」を格納する(ステップS607)。その後、イベント発生条件調査プログラム126は、処理をステップS608へ進める。
一方、イベント発生条件を満たさない場合(ステップS604:NO)、イベント発生条件調査プログラム126は、対象条件オブジェクト81の発生の是非815に、監視コンピュータ1が対象条件イベントを検知し得えないことを示す「will not occurred」を格納する(ステップS605)。
その後、イベント発生条件調査プログラム126は、対象条件イベントに適用されるイベント発生ルール1340の全てについて処理が完了したか否かを判定する(ステップS606)。未だ処理されていないイベント発生ルール1340が残っている場合(ステップS606:NO)、イベント発生条件調査プログラム126は、処理をステップS602へ進める。一方、対象条件イベントに適用されるイベント発生ルール1340の全てについて処理が完了している場合(ステップS606:YES)、イベント発生条件調査プログラム126は、処理をステップS608へ進める。
ステップS608において、イベント発生条件調査プログラム126は、対象条件オブジェクトの発生の是非815に「will not occurred」が格納されているか否かを判定する。
対象条件オブジェクトの発生の是非815に「will not occurred」が格納されている場合(ステップS608:YES)、イベント発生条件調査プログラム126は、対象条件オブジェクトの重み値816に「1.0」を格納する(ステップS609)。すなわち、監視コンピュータ1が対象条件イベントを検知し得えない場合は、対象条件イベントには、対象条件イベントが検知された場合に設定される重み値と同一の重み値「1.0」が設定される。これにより、監視コンピュータ1は、図13のステップS508において、検知し得えないと判定された未検知の条件イベントについては検知したものと取り扱って確信度を計算できるようになる。その後、イベント発生条件調査プログラム126は、イベント発生条件調査処理を終了する。
一方、対象条件オブジェクトの発生の是非815に「will not occurred」が格納されていない場合(ステップS608:NO)、イベント発生条件調査プログラム126は、対象条件オブジェクトの重み値816に「0.0」を格納する(ステップS610)。その後、イベント発生条件調査プログラム126は、イベント発生条件調査処理を終了する。
このように、イベント発生条件調査処理において、監視コンピュータ1は、対象となる未検知の条件イベントについて、当該条件イベントに関係するノード装置に関する性能値とイベント発生ルール1340とに基づいて検知可否判定を行う。そして、監視コンピュータ1は、対象となる条件イベントを検知し得ると判定した場合は、当該条件イベントに重み値「0.0」を設定し、対象となる条件イベントを検知し得えないと判定した場合は、当該条件イベントに重み値「1.0」を設定する。監視コンピュータ1は、このように重み値を設定することで、確信度評価処理において、検知し得えないと判定された未検知の条件イベントについては検知したものと取り扱って確信度を計算できるようになる。これにより、検知し得えないと判定された条件イベントが存在する場合でも、当該条件イベントに対応付けられている結論イベントについての確信度が低くなり過ぎないように計算することができる。
なお、本実施例では、監視コンピュータ1は、検知し得えないと判定された未検知の条件イベントを検知したものと取り扱って第1の確信度を計算するが、検知し得えないと判定された未検知の条件イベントを、第1の確信度を計算する際の対象から除外するようにしてもよい。すなわち、監視コンピュータ1は、図13のS507において、検知し得えないと判定された未検知の条件イベントに設定されている重み値を無視して(加算しないようにして)重み値の合計を計算する。そして、監視コンピュータ1は、図13のS508において、検知し得えないと判定された未検知の条件イベントに対応する条件オブジェクト81を無視して(カウントしないようにして)対象条件オブジェクトの総数を計算し、第1の確信度を計算してもよい。このような計算方法(検知し得えないと判定された未検知の条件イベントを対象から除外する計算方法)によっても、本実施例の計算方法と同様の効果、すなわち、検知し得えないと判定された条件イベントが存在する場合でも、当該条件イベントに対応付けられている結論イベントについての確信度が低くなり過ぎないように計算することができるという効果が得られる。
図15は、実施例1に係るイベント消去処理のフローチャートである。
イベント消去処理は、検知されたイベントに設定された重み値を、当該イベントに設定されている減衰率に基づいて減少させる処理である。
まず、イベント消去プログラム127は、イベント消去タスクテーブル136からエントリを1つ取得する(ステップS701)。図15の説明において、取得したエントリを「対象エントリ」といい、対象エントリに対応するイベント消去タスク、すなわち対象エントリによって情報が管理されるイベント消去タスクを「対象イベント消去タスク」という。
次に、イベント消去プログラム127は、対象エントリのタスク開始日時1361が示す日時、すなわち対象イベント消去タスクのタスク開始日時が、現在日時と同一であるか、又は現在日時より前であるか否かを判定する(ステップS702)。対象イベント消去タスクのタスク開始日時が現在日時と同一でなく、且つ現在日時より前でない場合(ステップS702:NO)、イベント消去プログラム127は、イベント消去処理を終了する。
一方、対象イベント消去タスクのタスク開始日時が現在日時と同一であるか、又は現在日時より前である場合(ステップS702:YES)、イベント消去プログラム127は、対象エントリのノード名1362、イベント種別1363、及び減衰率1364から、対象イベント消去タスクの対象となるイベント(図15の説明において「対象イベント」という)に関係するノード装置の名称、対象イベントの種別を示すデータ、及び対象イベントに設定されている減衰率を取得する(ステップS703)。
次に、イベント消去プログラム127は、ルールメモリデータ8から、対象イベントに対応する条件オブジェクト81(図15の説明において「対象条件オブジェクト」という)を取得する(ステップS704)。具体的には、イベント消去プログラム127は、ステップS703で取得した対象イベントに関係するノード装置の名称及び対象イベントの種別をキーにルールメモリデータ8を検索し、ノード名812及びイベント813が示すノード装置の名称及びイベントの種別がキーと一致する条件オブジェクト81を、対象条件オブジェクトとして特定する。
次に、イベント消去プログラム127は、対象条件オブジェクトの重み値816の値を、対象イベントに設定されている減衰率を減算した値に更新する(ステップS705)。具体的には、イベント消去プログラム127は、対象条件オブジェクトの重み値816から、対象イベントに現在設定されている重み値(更新前の重み値)を取得する。そして、イベント消去プログラム127は、取得した更新前の重み値から、ステップS703で取得した減衰率を減算した値を、更新後の重み値として、対象条件オブジェクトの重み値816に上書きして格納する。
その後、イベント消去プログラム127は、対象条件オブジェクトの重み値816の値(更新後の重み値)が「0.0」以下であるか否かを判定する(ステップS706)。
対象条件オブジェクトの重み値816の値が「0.0」よりも大きい場合(ステップS706:NO)、イベント消去プログラム127は、対象イベント消去タスクのタスク開始日時を、1分進めた日時に更新する(ステップS707)。具体的には、イベント消去プログラム127は、対象エントリのタスク開始日時1361から、対象イベント消去タスクの現在のタスク開始日時(更新前のタスク開始日時)を取得する。そして、イベント消去プログラム127は、取得した更新前のタスク開始日時を1分進めた日時を、更新後のタスク開始日時として、対象エントリのタスク開始日時1361に上書きして格納する。その後、イベント消去プログラム127は、処理をステップS710へ進める。
一方、対象条件オブジェクトの重み値816の値が「0.0」以下である場合(ステップS706:YES)、イベント消去プログラム127は、対象条件オブジェクトの重み値816に「0.0」を格納する(ステップS708)。
その後、イベント消去プログラム127は、イベント消去タスクテーブル136から対象エントリを削除する(ステップS709)。その後、イベント消去プログラム127は、処理をステップS710へ進める。
ステップS710において、イベント消去プログラム127は、確信度評価プログラム125に確信度評価処理(図13参照)を実行させる。確信度評価処理を実行させる際、イベント消去プログラム127は、対象条件オブジェクトを指定するパラメータを、確信度評価プログラム125に入力する。この確信度評価処理により、重み値が更新された対象イベントに対応付けられている各結論イベントについて、確信度が再計算される。その後、イベント消去プログラム127は、イベント消去処理を終了する。
図16は、実施例1に係る第1の調査結果表示画面の一例の構成図である。
第1の調査結果表示画面91は、図13のステップS510で表示される画面であり、原因解析の結果を管理者に通知するための画面である。第1の調査結果表示画面91には、第1の確信度が所定値(例えば、50%)以上の結論イベント、すなわち原因となる可能性が高いと判定された結論イベント(以下「候補結論イベント」という)のそれぞれに関する情報要素911が表示される。候補結論イベントに関する情報要素911は、例えば、候補結論イベントを示す情報(候補結論イベントに関係するノード装置の名称及び候補結論イベントの種別を示すデータ)912、候補結論イベントについての第1の確信度913等を含む。例えば、候補結論イベントに関する情報要素911は、候補結論イベントについての第1の確信度913の値でソートして表示される。
第1の調査結果表示画面91において、管理者が、図示しない入力デバイスを用いて候補結論イベントのうちのいずれかを指定すると、監視コンピュータ1は、その指定された候補結論イベントに関する原因解析の詳細情報を表示するための第2の調査結果表示画面(図17参照)をディスプレイ17に表示させる。
図17は、実施例1に係る第2の調査結果表示画面の一例の構成図である。
第2の調査結果表示画面92は、第1の調査結果表示画面91において指定された候補結論イベントに関する原因解析の詳細情報を表示するための画面である。第2の調査結果表示画面92には、指定された候補結論イベントに関する原因解析の詳細情報として、例えば、指定された候補結論イベントに対応付けられている条件イベントのうちの検知された条件イベントを示す情報922、指定された候補結論イベントに対応付けられている未検知の条件イベントに関する情報923、未検知の条件イベントについて行われる検知可否判定の進捗度合いを示すチェック進捗度921等が表示される。
指定された候補結論イベントに対応付けられている未検知の条件イベントに関する情報923は、例えば、各未検知の条件イベントを示す情報(未検知の条件イベントに関係するノード装置の名称及び未検知の条件イベントの種別を示すデータ)924と、各未検知の条件イベントについて行われた検知可否判定の結果、すなわち、監視コンピュータ1が当該条件イベントを検知し得るか否かを示す情報925とを含む。また、チェック進捗度921は、例えば、指定された候補結論イベントに対応付けられている未検知の条件イベントの数に対する、検知可否判定が行われた未検知の条件イベントの数の割合とされる。
管理者は、第1の調査結果表示画面91及び第2の調査結果表示画面92を参照することにより、第1の確信度が所定値以上の1以上の候補結論イベントを知ることができ、どの候補結論イベントが原因であるかを推定することができる。本実施例において、候補結論イベントか否かの判定の基準となる確信度、並びに、第1の調査結果表示画面91及び第2の調査結果表示画面92において管理者に通知される確信度は、第1の確信度、すなわち、監視コンピュータ1が検知し得えない条件イベントが存在する場合でも低くなりすぎないように計算された確信度である。このように、第1の確信度に基づいて、監視コンピュータ1による候補結論イベントか否かの判定と管理者による原因の推定とが行われることにより、検知し得えない条件イベントが存在するために確信度が低くなりすぎてしまい、本来原因であるはずの結論イベントが監視コンピュータ1又は管理者によって見落とされてしまうというリスクを低減することができる。
また、結論イベントに対応付けられている1以上の条件イベントに当該結論イベントが含まれている場合、すなわち、結論イベントが条件イベントにもなっている場合において、その結論イベントでもある条件イベントが検知されている場合、管理者は、確信度を参照するまでもなく、その検知されたイベント(条件イベントでもある結論イベント)を原因と特定することができる。すなわち、確信度に基づく原因の推定は、結論イベントでもある条件イベントが検知されていない場合或いは検知し得ない場合に有効な方法であるといえる。一方で、監視コンピュータ1が検知し得ない条件イベントが存在する場合は、計算される確信度が低くなり過ぎてしまうという問題があった。本実施例によれば、特に確信度が重要視される場合、すなわち、結論イベントでもある条件イベントが検知されていない場合或いは検知し得ない場合において、信頼性の高い確信度を計算できるようになる。
実施例2は、イベントが監視対象装置の性能障害に関するイベント(以下「性能イベント」という)である場合の実施例である。実施例2に係る計算機システムの構成は、以下の点を除いて、実施例1に係る計算機システムの構成と実質的に同じである。すなわち、実施例2に係る監視コンピュータ1は、メモリ12に性能情報監視プログラム129を記憶し、ディスク13に性能イベント定義テーブル137を記憶する。以下、実施例2に係る監視コンピュータ1の構成について、実施例1と異なる点について説明する。
図18は、実施例2に係る性能イベント定義テーブルの一例の構成図である。
性能イベント定義テーブル137は、計算機システム内で発生し得る性能イベントを定義したデータである。性能イベント定義テーブル137は、番号1371、ノード名1372、コンポーネント名1373、閾値1374、メトリック1375、基底値1376、条件1377、及びイベント種別1378のフィールドを含む。番号1331には、性能イベントの番号が格納される。ノード名1372には、性能イベントに関係するノード装置の名称が格納される。コンポーネント名1373には、性能イベントに関係するコンポーネントの名称が格納される。閾値1374には、性能イベントの発生の有無を判定する際の基準となる値(以下「性能閾値」という)が格納される。メトリック1375には、性能イベントに対応する性能値の種別を示すデータが格納される。基底値1376には、条件イベントである性能イベントに設定される重み値を計算する際に用いられる値(以下「基底値」という)が格納される。条件1377には、性能イベントが発生したと判定されるための条件(以下「性能イベント条件」)を示すデータが格納される。イベント種別1378には、性能イベントの種別を示すデータが格納される。
例えば、同図の番号1371が「1」であるエントリから、VM Bのメモリ22に関する「メモリ使用率の異常増加」という性能イベントは、VM Bのメモリ22の使用率が50%を超えた場合に発生するということがわかる。また、例えば、同図の番号1371が「4」であるエントリから、VM Cのディスクドライブに関する「ディスク転送処理効率の低下」という性能イベントは、VM Cのディスクドライブに関するディスク転送平均時間が100[msec]を超えた場合に発生するということがわかる。
図19は、実施例2に係るイベント発生ルールリポジトリの一例の構成図である。
実施例2に係るイベント発生ルールリポジトリ134のフィールド構成は、実施例1に係るイベント発生ルールリポジトリ134のフィールド構成と実質的に同じである。実施例2に係るイベント発生ルールリポジトリ134には、性能イベントに適用される1以上のイベント発生ルール1340が格納される。
例えば、同図の番号1341が「1」であるエントリは、サーバ2に関する「ディスク転送処理効率の低下」の性能イベントについてのイベント発生ルール1340を示している。そして、このイベント発生ルール1340が規定するイベント発生条件は、調査期間1344bが示す期間内において、ディスクドライブに関するディスク転送平均時間が1度でも0[msec]より上となることである。すなわち、このイベント発生ルール1340は、サーバ2に関する「ディスク転送処理効率の低下」の性能イベントについて、調査期間1344bが示す期間内において、サーバ2のディスクドライブに関するディスク転送平均時間が1度でも0[msec]より上となった場合に、監視コンピュータ1が当該イベントを検知し得ると判定することを示している。
また、例えば、同図の番号1341が「2」であるエントリは、IPスイッチに関する「ポートの高負荷」の性能イベントについてのイベント発生ルール1340を示している。そして、このイベント発生ルール1340が規定するイベント発生条件は、調査期間1344bが示す期間内において、ポートの受信速度が1度でも0[MB/sec]より上となることである。すなわち、このイベント発生ルール1340は、IPスイッチに関する「ポートの高負荷」の性能イベントについて、調査期間1344bが示す期間内において、IPスイッチのポートの受信速度が1度でも0[MB/sec]より上となった場合に、監視コンピュータ1が当該イベントを検知し得ると判定することを示している。
また、例えば、同図の番号1341が「3」であるエントリは、ストレージ3に関する「ディスクの性能劣化」の性能イベントについてのイベント発生ルール1340を示している。そして、このイベント発生ルール1340が規定するイベント発生条件は、調査期間1344bが示す期間内において、LUに関するI/O応答時間が1度でも0[msec]より上となることである。すなわち、このイベント発生ルール1340は、ストレージ3に関する「ディスクの性能劣化」の性能イベントについて、調査期間1344bが示す期間内において、ストレージ3のLUに関するI/O応答時間が1度でも0[msec]より上となった場合に、監視コンピュータ1が当該イベントを検知し得ると判定することを示している。
図20は、実施例2に係るルールメモリデータの一例の構成図である。
実施例2に係るルールメモリデータ8の各条件オブジェクト81及び各結論オブジェクト82のフィールド構成は、実施例1に係るルールメモリデータ8の各条件オブジェクト81及び各結論オブジェクト82のフィールド構成と実質的に同じである。
実施例2では、条件オブジェクト81の発生の是非815には、条件オブジェクト81に対応する条件イベントについての検知可否判定が行われ、監視コンピュータ1が当該イベントを検知し得るという判定結果が得られている場合は、その条件イベントが性能イベントであること及び監視コンピュータ1が当該性能イベントを検知し得ることを示すデータ、例えば「May be affected」が格納される。その他のケース、すなわち、その条件イベントが検知されている場合、その条件イベントが検知されておらず検知可否判定が未だ行われていない場合、及び、その条件イベントについての検知可否判定が行われ、監視コンピュータ1が当該イベントを検知し得ないという判定結果が得られている場合については、実施例1と同様のデータが格納される。
以下、実施例2に係る監視コンピュータ1の動作について、実施例1と異なる点について説明する。
図21は、実施例2に係る性能情報監視処理のフローチャートである。
性能情報監視処理は、受信した監視対象装置に関する性能値に基づいて、監視対象装置において性能イベントが発生しているか否かを判定する処理である。性能イベントが発生していると判定された場合は、対応するイベントメッセージ7の生成及び送信が行われる。
まず、性能情報監視プログラム129は、監視対象装置に関する性能値を受信する(ステップS801)。例えば、性能情報監視プログラム129は、定期的に又は不定期的に、監視対象装置に対して性能値の取得要求を送信し、監視対象装置に性能値を送信させるようにしてもよい。
次に、性能情報監視プログラム129は、性能イベント定義テーブル137から、ステップS801で受信した性能値に対応するエントリを取得する(ステップS802)。具体的には、性能情報監視プログラム129は、ノード名1371が示すノード装置の名称がステップS801で受信した性能値に関係するノード装置の名称と一致し、且つメトリック1375が示す性能値の種別がステップS801で受信した性能値の種別と一致するエントリを取得する。例えば、ステップS801で受信した性能値が、VM Bに関するメモリ利用率であった場合は、図18の例では番号1371が「1」のエントリが取得される。
その後、性能情報監視プログラム129は、ステップS801で取得した性能値が、ステップS802で取得したエントリの条件1377が示す性能イベント条件を満たしているか否かを判定する(ステップS803)。性能イベント条件を満たしていない場合(ステップS803:NO)、性能情報監視プログラム129は、処理をステップS806へ進める。
一方、性能イベント条件を満たしている場合(ステップS803:YES)、性能情報監視プログラム129は、ステップS802で取得したエントリが示す性能イベントが発生したことを示すイベントメッセージ7を生成する(ステップS804)。例えば、ステップS801で受信した性能値が、VM Bに関するメモリ利用率であり、図18の番号1371が「1」のエントリの条件1377が示す性能イベント条件を満たしている場合は、サーバ2の種別を示すデータがノード種別71に格納され、VM Bの名称がノード名72に格納され、図18の番号1371が「1」のエントリのイベント種別1378が示すデータ、すなわち「メモリ使用率の異常増加」がイベント種別73に格納されたイベントメッセージ7が生成される。
その後、性能情報監視プログラム129は、ステップS804で生成したイベントメッセージ7をイベント受信処理プログラム122に送信する(ステップS805)。性能イベントの発生を示すイベントメッセージ7を受信したイベント受信処理プログラム122は、実施例1で説明したイベント受信処理を開始する。その後、性能情報監視プログラム129は、処理をステップS806へ進める。
ステップS806において、性能情報監視プログラム129は、性能イベント定義テーブル137におけるステップS801で受信した性能値に対応する全てのエントリについて処理が完了したか否かを判定する。未だ処理されていないエントリが残っている場合(ステップS806:NO)、性能情報監視プログラム129は、処理をステップS802へ進める。一方、性能イベント定義テーブル137におけるステップS801で受信した性能値に対応する全てのエントリについて処理が完了している場合(ステップS806:YES)、性能情報監視プログラム129は、性能情報監視処理を終了する。
図22は、実施例2に係るイベント発生条件調査処理のフローチャートである。
まず、イベント発生条件調査プログラム126は、イベント発生条件調査処理を実行させた確信度評価プログラム125によって入力されたパラメータを受信する(ステップS901)。図22の説明において、入力されたパラメータによって指定される条件オブジェクト81を「対象条件オブジェクト」といい、対象条件オブジェクトに対応する条件イベントを「対象条件イベント」という。なお、対象条件イベントは、未検知の性能イベントである。
次に、イベント発生条件調査プログラム126は、対象条件オブジェクトの発生の是非815に、監視コンピュータ1が対象条件イベントを検知し得えないことを示す「will not occurred」を格納する(ステップS902)。
次に、イベント発生条件調査プログラム126は、イベント発生ルールリポジトリ134から、対象条件イベントに適用されるイベント発生ルール1340を1つ取得する(ステップS903)。例えば、対象条件イベントが、VM Bに関する「ディスク転送処理効率の低下」の性能イベントである場合は、当該性能イベントに関係するノード装置(VM B)の種別であるサーバ2を示すデータ(「Server」)がノード種別1342に格納されており、且つ当該性能イベントの種別である「ディスク転送処理効率の低下」を示すデータがイベント種別1343に格納されているイベント発生ルール1340、すなわち、図19の例では番号1341が「1」のイベント発生ルール1340が取得される。
次に、イベント発生条件調査プログラム126は、性能情報テーブル133における対象条件イベントに関係するノード装置に関する性能値を参照して、ステップS903で取得したイベント発生ルール1340が規定するイベント発生条件を満たすか否かを判定することにより、監視コンピュータ1が対象条件イベントを検知し得るか否かを判定する(ステップS904)。
例えば、対象条件イベントが、VMBに関する「ディスク転送処理効率の低下」の性能イベントであり、ステップS903において、図19の番号1341が「1」のイベント発生ルール1340が取得された場合、イベント発生条件調査プログラム126は、次のように判定する。すなわち、番号1341が「1」のイベント発生ルール1340が規定するイベント発生条件は、対象期間内において、ディスクドライブに関するディスク転送平均時間が1度でも0[msec]より上となることである。なお、この例では、対象期間を2012年4月7日の0時0分0秒から現在までとする。図5の性能情報テーブル133において、対象期間内におけるVM Bのディスクドライブに関する性能値(ディスク転送平均時間)を示しているエントリは、ID1331が「7」~「9」の3つのエントリであり、それらが示す性能値は、それぞれ80[msec]、70[msec]、75[msec]である。すなわち、対象期間内におけるVM Bのディスクドライブに関する性能値(ディスク転送平均時間)は、1度でも0より上となっている。従って、イベント発生条件調査プログラム126は、イベント発生条件を満たしていると判定し、監視コンピュータ1が対象条件イベント(VM Bに関する「ディスク転送処理効率の低下」の性能イベント)を検知し得ると判定する。
イベント発生条件を満たさない場合(ステップS905:NO)、イベント発生条件調査プログラム126は、処理をステップS908へ進める。
一方、イベント発生条件を満たす場合(ステップS905:YES)、イベント発生条件調査プログラム126は、対象条件オブジェクトの発生の是非815に、対象条件イベントが性能イベントであること及び監視コンピュータ1が対象条件イベントを検知し得ることを示す「May be affected」を格納する(ステップS906)。
その後、イベント発生条件調査プログラム126は、対象条件イベントに設定する重み値の候補となる値(以下「仮重み値」という)を計算する(ステップS907)。
イベント発生条件調査プログラム126は、例えば、次のように仮重み値を計算する。すなわち、イベント発生条件調査プログラム126は、まず、ステップS903で取得したイベント発生ルール1340の対象期間内に収集された性能値であって対象条件イベントに対応する1以上の性能値を、性能情報テーブル133から取得する。ここで、対象条件イベントに対応する性能値とは、その種別が、性能イベント定義テーブル137における対象条件イベントを定義しているエントリのメトリック1375が示す性能値の種別と一致する性能値のことをいう。そして、イベント発生条件調査プログラム126は、取得した各性能値について、当該性能値から、対象条件イベントの基底値、すなわち性能イベント定義テーブル137における対象条件イベントを定義しているエントリの基底値1376の値を減算した値の絶対値(以下「第1差分値」という)を計算する。また、イベント発生条件調査プログラム126は、対象条件イベントの性能閾値、すなわち性能イベント定義テーブル137における対象条件イベントを定義しているエントリの閾値1374の値から、対象条件イベントの基底値を減算した値の絶対値(以下「第2差分値」という)を計算する。イベント発生条件調査プログラム126は、各性能値について計算された第1差分値の最大値を、第2差分値で除算した値を、仮重み値とする。ここで、第1差分値は、収集された性能値と基底値との差分であり、第2差分値は、性能閾値と基底値との差分である。すなわち、仮重み値は、収集された性能値が性能閾値に近いほど「1.0」に近い値となり、逆に収集された性能値が性能閾値から離れた値になるほど「0.0」に近い値となる。
例えば、対象条件イベントが、VM Bに関する「ディスク転送処理効率の低下」の性能イベントであり、ステップS903で取得したイベント発生ルール1340の対象期間が、2012年4月7日の0時0分0秒から現在までである場合、イベント発生条件調査プログラム126は、次のように仮重み値を計算する。すなわち、図5の性能情報テーブル133において、対象期間内に収集された性能値であって対象条件イベントに対応する性能値(ディスク転送平均時間)を示しているエントリは、番号1331が「7」~「9」の3つのエントリであり、それらが示す性能値は、それぞれ80[msec]、70[msec]、75[msec]である。また、図18の性能イベント定義テーブル137において、対象条件イベントを定義しているエントリは、番号1371が「2」のエントリであり、その基底値は0であり、その性能閾値は200である。従って、イベント発生条件調査プログラム126は、第1差分値の最大値である80(|80-0|)を、第2差分値である200(|200-0|)で除算して得られた値、すなわち0.4を仮重み値とする。その後、イベント発生条件調査プログラム126は、処理をステップS908へ進める。
ステップS908において、イベント発生条件調査プログラム126は、対象条件イベントに適用されるイベント発生ルール1340の全てについて処理が完了したか否かを判定する。未だ処理されていないイベント発生ルール1340が残っている場合(ステップS908:NO)、イベント発生条件調査プログラム126は、処理をステップS903へ進める。
一方、対象条件イベントに適用されるイベント発生ルール1340の全てについて処理が完了している場合(ステップS908:YES)、イベント発生条件調査プログラム126は、対象条件オブジェクトの発生の是非815に「will not occurred」が格納されているか否かを判定する(ステップS909)。
対象条件オブジェクトの発生の是非815に「will not occurred」が格納されている場合(ステップS909:YES)、イベント発生条件調査プログラム126は、対象条件オブジェクトの重み値816に「1.0」を格納する(ステップS910)。すなわち、監視コンピュータ1が対象条件イベントを検知し得えない場合は、対象条件イベントには、対象条件イベントが検知された場合に設定される重み値と同一の重み値「1.0」が設定される。これにより、監視コンピュータ1は、図13のステップS508において、検知し得えないと判定された未検知の条件イベントについては検知したものと取り扱って確信度を計算できるようになる。その後、イベント発生条件調査プログラム126は、イベント発生条件調査処理を終了する。
一方、対象条件オブジェクトの発生の是非815に「will not occurred」が格納されていない場合、すなわち「May be affected」が格納されている場合(ステップS909:NO)、イベント発生条件調査プログラム126は、対象条件オブジェクトの重み値816に、ステップS907で計算された仮重み値の最大値を格納する(ステップS911)。その後、イベント発生条件調査プログラム126は、イベント発生条件調査処理を終了する。
このように、実施例2に係るイベント発生条件調査処理において、監視コンピュータ1は、対象となる条件イベントを検知し得ると判定した場合は、当該条件イベントに、重み値「0.0」を設定するのではなく、ステップS907で計算された仮重み値の最大値を格納する。なお、仮重み値は、収集された性能値が性能閾値に近いほど「1.0」に近い値となり、逆に収集された性能値が性能閾値から離れた値になるほど「0.0」に近い値となる。監視コンピュータ1は、このように重み値を設定することで、確信度評価処理において、条件イベントを検知したか否かに加えて、検知し得ると判定された未検知の条件イベントについては、当該条件イベントに対応する或る期間内に収集された性能値と当該条件イベントの性能閾値との差の大きさをも考慮して、確信度を計算できるようになる。すなわち、監視コンピュータ1は、性能イベント条件を満たさない条件イベントを一律に未検知として取り扱って確信度を計算するのではなく、収集された性能値と性能閾値との差の大きさに応じて異なる値となるように、具体的には、収集された性能値が性能閾値に近いほど高くなるように、収集された性能値が性能閾値から離れた値になるほど低くなるように、確信度を計算できるようになる。
なお、本発明は、以上説明した実施例に限定されるものでなく、その趣旨を逸脱しない範囲で種々変更可能であることはいうまでもない。
1…監視コンピュータ、2…サーバ、3…ストレージ、4…ネットワーク装置、5…通信ネットワーク。
Claims (15)
- 複数のノード装置のいずれかで発生したイベントの原因解析を行う監視システムであって、
記憶デバイスと、
前記記憶デバイスに接続された制御デバイスと
を有し、
前記記憶デバイスは、
前記複数のノード装置のいずれかに関する1以上の条件イベントと、前記1以上の条件イベントが発生した場合に原因となる結論との対応関係を示す複数のルール
を記憶し、
前記制御デバイスは、
(A)複数の前記ルールに含まれる複数の条件イベントのうちのいずれか1以上の条件イベントを検知し、
(B)前記ルールに基づいて、前記検知した条件イベントに対応付けられている第1の結論を特定し、
(C)複数の前記ルールに含まれる複数の条件イベントのうちのいずれか1以上の条件イベントのそれぞれについて、前記監視システムが当該条件イベントを検知し得るか否かの検知可否判定を行い、
(D)前記第1の結論に対応付けられている1以上の条件イベントの検知の有無、及び、前記検知可否判定の結果に基づいて、前記第1の結論が原因であることの確からしさを示す第1の指標値を計算する
監視システム。 - 前記制御デバイスは、
前記(C)において、前記第1の結論に対応付けられている1以上の条件イベントのうちの未検知の条件イベントについて、前記検知可否判定を行う
請求項1に記載の監視システム。 - 前記制御デバイスは、
前記第1の結論の内容と、前記第1の結論についての前記第1の指標値と、前記検知可否判定の結果とを表示する
請求項2に記載の監視システム。 - 前記制御デバイスは、
前記第1の結論に対応付けられている1以上の条件イベントの検知の有無に基づいて、前記第1の結論が原因であることの確からしさを示す指標値であって前記検知可否判定の結果を考慮しない第2の指標値を計算し、
前記第2の指標値が所定値以上である場合に、前記(C)及び(D)を行う
請求項3に記載の監視システム。 - 前記制御デバイスは、
定期的又は不定期的に、前記複数のノード装置のそれぞれに関する性能値を取得し、取得した性能値を、当該性能値を取得した日時を示す情報とともに前記記憶デバイスに記憶し、
前記(C)において、所定の第1期間内に取得した性能値に基づいて前記検知可否判定を行う
請求項4に記載の監視システム。 - 前記性能値は、対象のノード装置が他のノード装置とデータ通信を行ったか否かを判定し得る性能値であり、
前記制御デバイスは、
前記(C)において、前記検知可否判定の対象となる第1の条件イベントについて、前記第1の条件イベントに関係するノード装置に関する性能値に基づいて、前記第1の条件イベントに関係するノード装置が前記第1期間内に他のノード装置とデータ通信を行ったか否かを判定し、データ通信を行ったとの判定結果が得られた場合に前記第1の条件イベントを検知し得ると判定し、データ通信を行っていないとの判定結果が得られた場合に前記第1の条件イベントを検知し得ないと判定する
請求項5に記載の監視システム。 - 前記条件イベントは、前記ノード装置のいずれかの性能障害に関するイベントであり、
前記記憶デバイスは、
前記複数のノード装置のいずれかに関する1以上の条件イベントのそれぞれについて、当該条件イベントの発生の有無を判定する際の基準となる性能閾値を示すイベント定義情報
をさらに記憶し、
前記制御デバイスは、
前記(D)において、前記第1の結論に対応付けられている1以上の条件イベントの検知の有無、及び、前記検知可否判定の結果に加えて、前記検知可否判定において検知し得ると判定した条件イベントのそれぞれについての、当該条件イベントに関係するノード装置に関する性能値と、当該条件イベントに関する前記性能閾値との差の大きさに基づいて、前記第1の指標値を計算する
請求項6に記載の監視システム。 - 複数のノード装置のいずれかで発生したイベントの原因解析を行う監視システムを構成するコンピュータに実行させる監視プログラムであって、
前記コンピュータに、
(A)前記複数のノード装置のいずれかに関する1以上の条件イベントと、前記1以上の条件イベントが発生した場合に原因となる結論との対応関係を示す複数のルールに含まれる複数の条件イベントのうちのいずれか1以上の条件イベントを検知させ、
(B)前記ルールに基づいて、前記検知した条件イベントに対応付けられている第1の結論を特定させ、
(C)複数の前記ルールに含まれる複数の条件イベントのうちのいずれか1以上の条件イベントのそれぞれについて、前記監視システムが当該条件イベントを検知し得るか否かの検知可否判定を行わせ、
(D)前記第1の結論に対応付けられている1以上の条件イベントの検知の有無、及び、前記検知可否判定の結果に基づいて、前記第1の結論が原因であることの確からしさを示す第1の指標値を計算させる
監視プログラム。 - 前記コンピュータに、
前記(C)において、前記第1の結論に対応付けられている1以上の条件イベントのうちの未検知の条件イベントについて、前記検知可否判定を行わせる
請求項8に記載の監視プログラム。 - 前記コンピュータに、
前記第1の結論の内容と、前記第1の結論についての前記第1の指標値と、前記検知可否判定の結果とを表示させる
請求項8に記載の監視プログラム。 - 前記コンピュータに、
前記第1の結論に対応付けられている1以上の条件イベントの検知の有無に基づいて、前記第1の結論が原因であることの確からしさを示す指標値であって前記検知可否判定の結果を考慮しない第2の指標値を計算させ、
前記第2の指標値が所定値以上である場合に、前記(C)及び(D)を行わせる
請求項9に記載の監視プログラム。 - 前記コンピュータに、
前記複数のノード装置のそれぞれに関する性能値を取得させ、
前記(C)において、前記取得した性能値に基づいて前記検知可否判定を行わせる
請求項8に記載の監視プログラム。 - 前記コンピュータに、
定期的又は不定期的に、前記複数のノード装置のそれぞれに関する性能値を取得させ、取得した性能値を、当該性能値を取得した日時を示す情報とともに前記記憶デバイスに記憶させ、
前記(C)において、所定の第1期間内に取得した性能値に基づいて前記検知可否判定を行わせる
請求項8に記載の監視プログラム。 - 前記性能値は、対象のノード装置が他のノード装置とデータ通信を行ったか否かを判定し得る性能値であり、
前記コンピュータに、
前記(C)において、前記検知可否判定の対象となる第1の条件イベントについて、前記第1の条件イベントに関係するノード装置に関する性能値に基づいて、前記第1の条件イベントに関係するノード装置が前記第1期間内に他のノード装置とデータ通信を行ったか否かを判定させ、データ通信を行ったとの判定結果が得られた場合に前記第1の条件イベントを検知し得ると判定させ、データ通信を行っていないとの判定結果が得られた場合に前記第1の条件イベントを検知し得ないと判定させる
請求項13に記載の監視プログラム。 - 前記条件イベントは、前記ノード装置のいずれかの性能障害に関するイベントであり、
前記コンピュータに、
前記(D)において、前記第1の結論に対応付けられている1以上の条件イベントの検知の有無、及び、前記検知可否判定の結果に加えて、前記検知可否判定において検知し得ると判定した条件イベントのそれぞれについての、当該条件イベントに関係するノード装置に関する性能値と、当該条件イベントの発生の有無を判定する際の基準となる性能閾値との差の大きさに基づいて、前記第1の指標値を計算させる
請求項8に記載の監視プログラム。
Priority Applications (2)
| Application Number | Priority Date | Filing Date | Title |
|---|---|---|---|
| US13/701,624 US9130850B2 (en) | 2012-07-20 | 2012-07-20 | Monitoring system and monitoring program with detection probability judgment for condition event |
| PCT/JP2012/068431 WO2014013603A1 (ja) | 2012-07-20 | 2012-07-20 | 監視システム及び監視プログラム |
Applications Claiming Priority (1)
| Application Number | Priority Date | Filing Date | Title |
|---|---|---|---|
| PCT/JP2012/068431 WO2014013603A1 (ja) | 2012-07-20 | 2012-07-20 | 監視システム及び監視プログラム |
Publications (1)
| Publication Number | Publication Date |
|---|---|
| WO2014013603A1 true WO2014013603A1 (ja) | 2014-01-23 |
Family
ID=49947505
Family Applications (1)
| Application Number | Title | Priority Date | Filing Date |
|---|---|---|---|
| PCT/JP2012/068431 Ceased WO2014013603A1 (ja) | 2012-07-20 | 2012-07-20 | 監視システム及び監視プログラム |
Country Status (2)
| Country | Link |
|---|---|
| US (1) | US9130850B2 (ja) |
| WO (1) | WO2014013603A1 (ja) |
Cited By (2)
| Publication number | Priority date | Publication date | Assignee | Title |
|---|---|---|---|---|
| JP2018028778A (ja) * | 2016-08-17 | 2018-02-22 | 日本電信電話株式会社 | パターン抽出及びルール生成装置、及びその方法 |
| JPWO2021059400A1 (ja) * | 2019-09-25 | 2021-04-01 |
Families Citing this family (13)
| Publication number | Priority date | Publication date | Assignee | Title |
|---|---|---|---|---|
| WO2013186640A2 (en) | 2012-05-24 | 2013-12-19 | Lundy Douglas H | Threat detection system and method |
| WO2014068705A1 (ja) * | 2012-10-31 | 2014-05-08 | 株式会社日立製作所 | 監視システム及び監視プログラム |
| JP6089884B2 (ja) * | 2013-03-29 | 2017-03-08 | 富士通株式会社 | 情報処理システム,情報処理装置,情報処理装置の制御プログラム,及び情報処理システムの制御方法 |
| CN110267237A (zh) * | 2013-04-17 | 2019-09-20 | 希斯泰克公司 | 用于利用双重蜂窝接口的机器对机器的通信的网关设备 |
| JP6262088B2 (ja) * | 2014-07-14 | 2018-01-17 | アズビル株式会社 | 異常判定装置 |
| US20170277887A1 (en) * | 2014-11-14 | 2017-09-28 | Mitsubishi Electric Corporation | Information processing apparatus, information processing method, and computer readable medium |
| US10140170B2 (en) * | 2015-10-26 | 2018-11-27 | International Business Machines Corporation | Reporting errors to a data storage device |
| EP3430767B1 (en) * | 2016-03-16 | 2020-09-23 | Telefonaktiebolaget LM Ericsson (PUBL) | Method and device for real-time network event processing |
| US10411946B2 (en) * | 2016-06-14 | 2019-09-10 | TUPL, Inc. | Fixed line resource management |
| JP7036106B2 (ja) * | 2017-02-22 | 2022-03-15 | 日本電気株式会社 | 情報処理装置、情報処理システム、監視方法、及び、プログラム |
| CN108173672B (zh) * | 2017-12-04 | 2021-06-08 | 华为技术有限公司 | 检测故障的方法和装置 |
| US11979947B2 (en) | 2020-05-04 | 2024-05-07 | Systech Corporation | Dual channel gateway device for machine-to-machine communication |
| CN116192602B (zh) * | 2022-12-28 | 2025-09-23 | 奇安信科技集团股份有限公司 | 设备巡检方法、装置、控制设备和计算机可读存储介质 |
Citations (2)
| Publication number | Priority date | Publication date | Assignee | Title |
|---|---|---|---|---|
| JP2012059063A (ja) * | 2010-09-09 | 2012-03-22 | Hitachi Ltd | 計算機システムの管理方法、及び管理システム |
| WO2012053104A1 (ja) * | 2010-10-22 | 2012-04-26 | 株式会社日立製作所 | 管理システム、及び管理方法 |
Family Cites Families (5)
| Publication number | Priority date | Publication date | Assignee | Title |
|---|---|---|---|---|
| US7107185B1 (en) | 1994-05-25 | 2006-09-12 | Emc Corporation | Apparatus and method for event correlation and problem reporting |
| US8086905B2 (en) | 2008-05-27 | 2011-12-27 | Hitachi, Ltd. | Method of collecting information in system network |
| US8112378B2 (en) | 2008-06-17 | 2012-02-07 | Hitachi, Ltd. | Methods and systems for performing root cause analysis |
| JP5542398B2 (ja) | 2009-09-30 | 2014-07-09 | 株式会社日立製作所 | 障害の根本原因解析結果表示方法、装置、及びシステム |
| US8819220B2 (en) | 2010-09-09 | 2014-08-26 | Hitachi, Ltd. | Management method of computer system and management system |
-
2012
- 2012-07-20 US US13/701,624 patent/US9130850B2/en active Active
- 2012-07-20 WO PCT/JP2012/068431 patent/WO2014013603A1/ja not_active Ceased
Patent Citations (2)
| Publication number | Priority date | Publication date | Assignee | Title |
|---|---|---|---|---|
| JP2012059063A (ja) * | 2010-09-09 | 2012-03-22 | Hitachi Ltd | 計算機システムの管理方法、及び管理システム |
| WO2012053104A1 (ja) * | 2010-10-22 | 2012-04-26 | 株式会社日立製作所 | 管理システム、及び管理方法 |
Cited By (3)
| Publication number | Priority date | Publication date | Assignee | Title |
|---|---|---|---|---|
| JP2018028778A (ja) * | 2016-08-17 | 2018-02-22 | 日本電信電話株式会社 | パターン抽出及びルール生成装置、及びその方法 |
| JPWO2021059400A1 (ja) * | 2019-09-25 | 2021-04-01 | ||
| JP7322958B2 (ja) | 2019-09-25 | 2023-08-08 | 日本電信電話株式会社 | 異常箇所推定装置、方法およびプログラム |
Also Published As
| Publication number | Publication date |
|---|---|
| US20140025808A1 (en) | 2014-01-23 |
| US9130850B2 (en) | 2015-09-08 |
Similar Documents
| Publication | Publication Date | Title |
|---|---|---|
| WO2014013603A1 (ja) | 監視システム及び監視プログラム | |
| JP5658417B2 (ja) | 監視システム及び監視プログラム | |
| JP5428934B2 (ja) | 障害パターン生成プログラムおよび障害パターン生成装置 | |
| JP6114818B2 (ja) | 管理システム及び管理プログラム | |
| US10797971B2 (en) | Diagnostic framework in computing systems | |
| JP5385982B2 (ja) | 障害の根本原因に対応した復旧方法を表す情報を出力する管理システム | |
| WO2012014305A1 (ja) | システム障害における構成変更事象の影響度推定方法 | |
| JPWO2014033945A1 (ja) | 複数の監視対象デバイスを有する計算機システムの管理を行う管理システム | |
| US20110113429A1 (en) | Incident management method and operation management server | |
| JP5768983B2 (ja) | 契約違反予測システム、契約違反予測方法および契約違反予測プログラム | |
| US9852007B2 (en) | System management method, management computer, and non-transitory computer-readable storage medium | |
| JP6009089B2 (ja) | 計算機システムを管理する管理システム及びその管理方法 | |
| JP6280862B2 (ja) | イベント分析システムおよび方法 | |
| WO2014068705A1 (ja) | 監視システム及び監視プログラム | |
| US9461879B2 (en) | Apparatus and method for system error monitoring | |
| US20130311646A1 (en) | Management method and management system | |
| JPWO2013114911A1 (ja) | リスク評価システム、リスク評価方法、及びプログラム | |
| US20190129781A1 (en) | Event investigation assist method and event investigation assist device | |
| US10503577B2 (en) | Management system for managing computer system | |
| US20160004584A1 (en) | Method and computer system to allocate actual memory area from storage pool to virtual volume | |
| US8798982B2 (en) | Information processing device, information processing method, and program |
Legal Events
| Date | Code | Title | Description |
|---|---|---|---|
| WWE | Wipo information: entry into national phase |
Ref document number: 13701624 Country of ref document: US |
|
| 121 | Ep: the epo has been informed by wipo that ep was designated in this application |
Ref document number: 12881401 Country of ref document: EP Kind code of ref document: A1 |
|
| NENP | Non-entry into the national phase |
Ref country code: DE |
|
| 122 | Ep: pct application non-entry in european phase |
Ref document number: 12881401 Country of ref document: EP Kind code of ref document: A1 |
|
| NENP | Non-entry into the national phase |
Ref country code: JP |