WO2014002645A1 - 負荷量予測装置および負荷量予測方法 - Google Patents
負荷量予測装置および負荷量予測方法 Download PDFInfo
- Publication number
- WO2014002645A1 WO2014002645A1 PCT/JP2013/063844 JP2013063844W WO2014002645A1 WO 2014002645 A1 WO2014002645 A1 WO 2014002645A1 JP 2013063844 W JP2013063844 W JP 2013063844W WO 2014002645 A1 WO2014002645 A1 WO 2014002645A1
- Authority
- WO
- WIPO (PCT)
- Prior art keywords
- prediction
- load amount
- time
- history data
- date
- Prior art date
- Legal status (The legal status is an assumption and is not a legal conclusion. Google has not performed a legal analysis and makes no representation as to the accuracy of the status listed.)
- Ceased
Links
Images



Classifications
-
- G—PHYSICS
- G06—COMPUTING OR CALCULATING; COUNTING
- G06Q—INFORMATION AND COMMUNICATION TECHNOLOGY [ICT] SPECIALLY ADAPTED FOR ADMINISTRATIVE, COMMERCIAL, FINANCIAL, MANAGERIAL OR SUPERVISORY PURPOSES; SYSTEMS OR METHODS SPECIALLY ADAPTED FOR ADMINISTRATIVE, COMMERCIAL, FINANCIAL, MANAGERIAL OR SUPERVISORY PURPOSES, NOT OTHERWISE PROVIDED FOR
- G06Q50/00—Information and communication technology [ICT] specially adapted for implementation of business processes of specific business sectors, e.g. utilities or tourism
- G06Q50/06—Energy or water supply
-
- H—ELECTRICITY
- H02—GENERATION; CONVERSION OR DISTRIBUTION OF ELECTRIC POWER
- H02J—ELECTRIC POWER NETWORKS; CIRCUIT ARRANGEMENTS OR SYSTEMS FOR SUPPLYING OR DISTRIBUTING ELECTRIC POWER; SYSTEMS FOR STORING ELECTRIC ENERGY
- H02J3/00—Circuit arrangements for AC mains or AC distribution networks
- H02J3/003—Load forecast, e.g. methods or systems for forecasting future load demand
-
- Y—GENERAL TAGGING OF NEW TECHNOLOGICAL DEVELOPMENTS; GENERAL TAGGING OF CROSS-SECTIONAL TECHNOLOGIES SPANNING OVER SEVERAL SECTIONS OF THE IPC; TECHNICAL SUBJECTS COVERED BY FORMER USPC CROSS-REFERENCE ART COLLECTIONS [XRACs] AND DIGESTS
- Y04—INFORMATION OR COMMUNICATION TECHNOLOGIES HAVING AN IMPACT ON OTHER TECHNOLOGY AREAS
- Y04S—SYSTEMS INTEGRATING TECHNOLOGIES RELATED TO POWER NETWORK OPERATION, COMMUNICATION OR INFORMATION TECHNOLOGIES FOR IMPROVING THE ELECTRICAL POWER GENERATION, TRANSMISSION, DISTRIBUTION, MANAGEMENT OR USAGE, i.e. SMART GRIDS
- Y04S10/00—Systems supporting electrical power generation, transmission or distribution
- Y04S10/50—Systems or methods supporting the power network operation or management, involving a certain degree of interaction with the load-side end user applications
Definitions
- the present invention relates to a load amount prediction apparatus and a load amount prediction method.
- Patent Document 1 discloses a system that predicts the turbidity of treated water after a predetermined time based on prediction variable data measured at a water purification plant.
- the calculation is performed by applying the following case-based reasoning model.
- a historical model obtained in the past is converted into a case and a case model is generated.
- new input data is obtained, the case closest to the input data is selected from the case model.
- an output value corresponding to new input data is calculated.
- An object of the present invention is to provide a load amount prediction apparatus and a load amount prediction method capable of accurately predicting a load amount represented by power consumption and the like.
- a load amount prediction device is a load amount prediction device that predicts a load amount at a prediction time, and is the same time as the measurement time of the first load amount that is the measured load amount and is past the measurement date.
- a registration unit for registering data; a fourth load amount and a fifth load amount which are load amounts measured at two days different from the prediction date and at the same time as the prediction time; and at the prediction time
- An acquisition unit that acquires an expected enthalpy that is an expected enthalpy as a prediction parameter; and the history data registered by the registration unit based on the prediction parameter acquired by the acquisition unit.
- a selection unit that selects one or a plurality of the history data similar to the prediction parameter, and the history data selected by the selection unit, to calculate the representative history data,
- a prediction unit configured to set a load amount corresponding to the first load amount included in the representative history data as a load amount at the prediction time.
- the load amount prediction method is a load amount prediction method for predicting a load amount at a prediction time, which is the same time as the measurement time of the first load amount that is the measured load amount and is earlier than the measurement date.
- the actually measured first load amount and enthalpy correspond to the second load amount and the third load amount measured at the same time as the actually measured time on two days different from the actually measured date. They can be stored as history data. Similar to the combination of the fourth load amount and the fifth load amount measured at the same time as the predicted time on two days different from the predicted date and the predicted enthalpy at the predicted time when the prediction parameter is acquired.
- the history data to be selected is selected from the accumulated history data, and the load amount corresponding to the first load amount included in the representative history data calculated using the selected history data is determined as the load amount at the predicted time. can do.
- the two different days in the past may be the day before the measurement date or the prediction date, and the day seven days before the measurement date or the prediction date.
- the present invention it is possible to provide a load amount prediction device and a load amount prediction method capable of accurately predicting a load amount represented by power consumption and the like.
- FIG. 1 It is a figure which illustrates the composition of the load amount prediction device in an embodiment. It is a figure for demonstrating the quantization process of input space.
- A is a diagram illustrating history data
- B is a diagram illustrating a three-dimensional input / output space x1-x2-y
- C is a graph showing the output range width and output error of the output variable y. It is a figure which illustrates the relationship with allowable width
- (D) is a figure which illustrates the input space x1-x2 divided by the mesh.
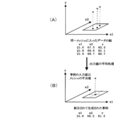
- (A) is a diagram schematically showing a state in which a group of history data is selected
- (B) is a diagram schematically showing a state in which one representative value is calculated from a group of history data. It is a figure which illustrates the transition graph of the power consumption displayed on a display.
- the load amount predicted by the load amount prediction apparatus is a power consumption amount.
- the present invention is not limited to this, and the predicted load amount is, for example, steam consumption amount, cold water heat amount, hot water heat amount. The same can be applied to the case.
- the load amount prediction device 1 functionally includes, for example, a registration unit 11, an acquisition unit 12, a selection unit 13, and a prediction unit 14.
- the case model DB 3 is a database that stores case models to be described later.
- the registration unit 11 realizes a learning function described later
- the acquisition unit 12, the selection unit 13, and the prediction unit 14 realize a prediction function described later.
- the load amount prediction apparatus 1 is physically configured to include, for example, a CPU (Central Processing Unit), a memory, and an input / output interface.
- the memory includes, for example, a ROM (Read Only Memory) and HDD (Hard Disk Drive) that store programs and data processed by the CPU, and a RAM (Random Access Memory) mainly used as various work areas for control processing. Etc. are included. These elements are connected to each other via a bus.
- the CPU can execute the program stored in the ROM and process the data received via the input / output interface and the data developed in the RAM, thereby realizing the functions of each unit of the load amount prediction apparatus 1. .
- the registration unit 11 has a learning function of generating a case model using the measurement data and then updating the case model using the measurement data obtained continuously at a predetermined interval.
- the learning function will be described below.
- the registration unit 11 registers history data in the case model DB 3.
- the historical data includes, for example, the power consumption (first load amount) and enthalpy measured at a certain measurement time, and the power consumption measured at the same time (24 hours before the measurement time) on the day before the measurement date (The second load amount) and the power consumption (third load amount) measured at the same time as the measurement time 7 days before the measurement date (168 hours before the measurement time) constitute one set of data. .
- the registration unit 11 includes a case generation registration unit that generates a case model using history data and registers the generated case model in the case model DB 3.
- the case model generated by the case generation registration unit will be described below.
- This case model can be applied by incorporating the theory and method of the case-based reasoning model described in Patent Document 1.
- the case model is a model created by introducing the concept of topology (Topology).
- the input space is quantized according to the desired output tolerance, and input for each unit input space (hereinafter referred to as “mesh”). It defines the relationship between outputs.
- Quantization of the input space can be performed as follows.
- the input variable is two of x1 and x2, and the output variable is one of y.
- the quantization of the input space can be explained relatively easily.
- the input / output space is four-dimensional. Even if the input / output space becomes four-dimensional, it can be performed based on the same principle as in the three-dimensional case.
- the history data is composed of a set of input variables x1, x2 and output variable y measured in the past.
- this history data is represented on the three-dimensional input / output space x1-x2-y, it is distributed as shown in FIG.
- FIG. 2B is a diagram showing the x1-x2 plane arranged on the paper surface.
- the output axis y orthogonal to the x1-x2 plane is the back side of the paper surface at the origin position of the x1-x2 plane. It is expressed in a state where it is arranged from the front side.
- the mesh size (input) is set so that the output range width of the output variable y within the same mesh is within the output error allowable width ⁇ .
- Quantization number is determined.
- the size of the mesh is determined by a size that divides the input variable x1 into 10 and divides the input variable x2 into 6.
- the input space x1-x2 is partitioned by 60 meshes.
- FIG. 2D is a diagram showing a state in which the x1-x2 plane is arranged on the paper surface, as in FIG. 2B.
- the output error tolerance ⁇ is a value indicating how much an error between the predicted value output using the case model and the actual value is allowed, and is set in advance as a modeling condition.
- the acquisition unit 12, the selection unit 13, and the prediction unit 14 illustrated in FIG. 1 have a prediction function of referring to the case model registered in the case model DB 3 and predicting the power consumption at the prediction time.
- the prediction function will be described below.
- the acquisition unit 12 acquires a prediction parameter used when predicting the power consumption at the prediction time.
- the prediction parameter includes, for example, the power consumption (fourth load amount) measured at the same time as the prediction time on the day before the prediction date (24 hours before the prediction time), and the same time as the prediction time seven days before the prediction date.
- the power consumption (the fifth load amount) measured at 168 hours before the predicted time and the enthalpy expected at the predicted time (hereinafter referred to as “expected enthalpy”) are included.
- the selection unit 13 refers to the case model DB 3 based on the prediction parameter acquired by the acquisition unit 12, and one or more similar to the prediction parameter from the history data registered in the case model DB 3. Select historical data. This will be specifically described below.
- the selection unit 13 assigns the power consumption of the previous day, the power consumption of 7 days ago, and the predicted enthalpy, which are prediction parameters, to the input / output space of the case model.
- Three elements included in the prediction parameters (the power consumption of the previous day, the power consumption of 7 days ago and the predicted enthalpy) match the three input variables when the case model is created. Therefore, the selection unit 13 can specify the mesh of the input space corresponding to the three elements by assigning these three elements to the input / output space of the case model.
- the selection unit 13 selects the history data included in the identified mesh as history data similar to the prediction parameter.
- history data included in the identified mesh may be added to the history data similar to the prediction parameter.
- the prediction unit 14 uses the history data selected by the selection unit 13 to calculate representative history data.
- the prediction unit 14 sets the power consumption corresponding to the power consumption at the measurement time included in the representative history data as the power consumption at the prediction time.
- FIG. 3 shows an example in which the input variable is two of x1 and x2 and the output variable is one of y, as in FIG.
- the prediction unit 14 calculates an average value of each element (x1, x2, y) included in these three history data. Calculate each. As shown in FIG. 3B, the prediction unit 14 sets history data having the calculated average values as the values of the respective elements as representative history data. The prediction unit 14 sets the average value (81.9) of the power consumption (y) at the measurement time included in the representative history data as the power consumption at the prediction time. Note that the method for obtaining representative history data is not limited to calculating and obtaining an average value.
- the power consumption predicted by the prediction unit 14 can be graphed and displayed on the display 5, for example.
- FIG. 4 illustrates a transition graph of the power consumption displayed on the display 5.
- a transition graph P of power consumption and a transition graph E of enthalpy are displayed.
- the right side of the current time is the transition of the predicted value up to 24 hours ahead, and the left side of the current time is the transition of the actual value up to 7 days before.
- p1 is the power consumption 7 days before the prediction date
- p2 is the power consumption the day before the prediction date (current time)
- p3 is the power consumption at the prediction time.
- e1 is the enthalpy of the day before the prediction date (current time)
- e2 is the enthalpy of the prediction time.
- the reason for including enthalpy in historical data and forecast parameters is as follows.
- the amount of power in a certain facility is considered to be the sum of the amount of power related to the operation of the facility, the amount of power affected by the outside air temperature, and the amount of other power.
- the amount of power affected by the outside air temperature is so-called load heat, which is affected by the outside air temperature and the outside air humidity. Therefore, the prediction accuracy can be improved by using the outside air temperature or the outside air humidity as an input variable when predicting the power consumption.
- the outside air temperature or the outside air humidity is added to the input variable, the variable increases and the dimension of the input / output space increases. Therefore, the prediction method using the case model may decrease accuracy.
- the discomfort index obtained from the outside temperature and outside humidity is used as an input variable.
- the enthalpy is more heat load of air conditioning than the discomfort index. It was found that the range width for the quantity can be set large. That is, by using enthalpy as an input variable, it is possible to improve the power consumption prediction performance, compared with the case where the discomfort index is used.
- the absolute humidity [kg / kg (DA)] of the above formula (1) can be obtained by the following formula (2).
- Absolute humidity 18.015 x water vapor pressure ⁇ (29.064 x (atmospheric pressure-water vapor pressure)) (2)
- the water vapor pressure [hPa] of the above formula (2) can be obtained by the following formula (3).
- Water vapor pressure saturated water vapor pressure x relative humidity (3)
- the saturated water vapor pressure [hPa] of the above formula (3) can be obtained by the following formula (4).
- Saturated water vapor pressure 6.11 ⁇ 10 (7.5 ⁇ T / (T + 237.3)) (4) T in the above formula (4) is the dry bulb temperature.
- the actually measured power consumption and enthalpy are converted into the power consumption measured at the same time as the actual measurement time the day before the actual measurement date and seven days before the actual measurement date.
- the correspondence can be accumulated as history data.
- the prediction parameters are acquired, the history data similar to the combination of the power consumption measured at the same time as the prediction time on the day before and 7 days before the prediction date and the prediction enthalpy at the prediction time are stored.
- the power consumption corresponding to the power consumption measured at the actual measurement time included in the representative history data calculated using the selected history data is set as the power consumption at the predicted time. be able to.
- the power consumption at the predicted time can be calculated in consideration of the power consumption at the time.
- the load amount prediction apparatus 1 in the present embodiment by including enthalpy in the history data and the prediction parameter, for example, compared to the case where a factor representing another weather state such as an uncomfortable index is used, the heat of the air conditioning The range width with respect to the load amount can be increased.
- the load amount prediction apparatus 1 in the present embodiment it is possible to improve the power consumption prediction accuracy.
- the power consumption at the same time on the previous day and 7 days ago is used, but the present invention is not limited to this.
- the power consumption at which time point is used as the power consumption on two different days in the past It may be determined.
- two different past days may be determined according to the following eight patterns according to the forecast date, the day before the forecast date, and the calendar information seven days before the forecast date.
- the day before the forecast date, and 7 days before the forecast date are all weekdays, the power consumption at the same time on the previous day and 7 days before is used.
- the day before the forecast date, and the day seven days before the forecast date are holidays, weekdays, and weekdays, the power consumption at the same time on the previous day and the nearest Saturday is used.
- the forecast date, the day before the forecast date, and the seven days before the forecast date are weekdays, holidays, and weekdays, the power consumption at the same time on the previous day and the nearest Monday is used.
- the predicted date, the day before the predicted date, and the seven days before the predicted date are holidays, holidays, and weekdays, the power consumption at the same time on the most recent Saturday and the most recent Sunday is used.
- the forecast date When the forecast date, the day before the forecast date, and the seven days before the forecast date are weekdays, weekdays, and holidays, the power consumption at the same time on the previous day and 14 days ago is used.
- the day before the forecast date, and the day seven days before the forecast date are holidays, weekdays, and holidays
- the power consumption at the same time on the previous day and the nearest Saturday is used.
- the day before the forecast date, and the day seven days before the forecast date are weekdays, holidays, and holidays
- the power consumption at the same time on the previous day and the nearest Monday is used.
- the forecast date When the forecast date, the day before the forecast date, and the seven days before the forecast date are holidays, the power consumption at the same time on the most recent Saturday and the most recent Sunday is used.
- the power consumption at the predicted time is calculated.
- the present invention is not limited to calculating only the power consumption at the predicted time.
- the power consumption from the current time to 24 hours or 48 hours ahead may be sequentially calculated at 30 minute intervals by the same method.
- the power consumption up to 24 hours or 48 hours ahead every time the latest measured value is obtained, the predicted value from the time to which the latest measured value belongs to a predetermined time later is corrected. It is good.
- the difference between the actual measurement value and the predicted value at the time of the latest actual measurement value is calculated, and the range for correcting the prediction value is gradually smaller than the difference as the time from the latest actual measurement value becomes a future time. It is only necessary to correct by weighting.
- the load amount prediction apparatus and the load amount prediction method according to the present invention are suitable for accurately predicting a load amount represented by power consumption and the like.
Landscapes
- Business, Economics & Management (AREA)
- Engineering & Computer Science (AREA)
- Economics (AREA)
- Health & Medical Sciences (AREA)
- Human Resources & Organizations (AREA)
- General Business, Economics & Management (AREA)
- Water Supply & Treatment (AREA)
- General Health & Medical Sciences (AREA)
- Theoretical Computer Science (AREA)
- Marketing (AREA)
- Primary Health Care (AREA)
- Strategic Management (AREA)
- Tourism & Hospitality (AREA)
- Physics & Mathematics (AREA)
- Public Health (AREA)
- General Physics & Mathematics (AREA)
- Power Engineering (AREA)
- Management, Administration, Business Operations System, And Electronic Commerce (AREA)
- Supply And Distribution Of Alternating Current (AREA)
Abstract
電力消費量等に代表される負荷量を的確に予測する。測定した負荷量の測定時刻と同時刻であり測定日よりも過去の異なる二つの日に測定された負荷量、測定時刻に測定されたエンタルピおよび負荷量を一組にして一つのデータを構成する履歴データを登録する登録部と、予測時刻と同時刻であり予測日よりも過去の異なる二つの日に測定された負荷量、および予測時刻に予想されるエンタルピである予想エンタルピを、予測用パラメータとして取得する取得部と、取得された予測用パラメータに基づいて、登録された履歴データから、予測用パラメータに類似する履歴データを選定する選定部と、選定された履歴データを用い、代表となる履歴データを算出し、代表となる履歴データに含まれる、測定時刻に測定された負荷量に対応する負荷量を、予測時刻における負荷量とする予測部と、を備える。
Description
本発明は、負荷量予測装置および負荷量予測方法に関する。
下記特許文献1には、浄水場で計測された予測変数データに基づいて所定時間後の処理水の濁度を予測するシステムが開示されている。このシステムでは、所定時間後の処理水濁度を予測する際に、次のような事例ベース推論モデルを適用して演算している。まず、過去に得られた履歴データを事例化して事例モデルを生成しておく。新たな入力データが得られたときに、その入力データに最も近い事例を事例モデルから選定する。選定した事例を平均化することで新たな入力データに対応する出力値を算出する。このような事例モデルを用いることで、複雑なモデルを用いることなく過去の実績に基づいた予測を行うことを可能としている。
ところで、昨今騒がれている電力の供給不足に対し、需要家は、課された電力削減目標を実現するために、節電に努めることが要求される。その一方、工場等では、節電に努めつつも、電力使用の可能な範囲でできる限り効率良く操業することが必要となる。それには、現時点における電力の使用状況に加え、数時間先における電力の使用状況を予測しながら対応することが重要となる。特に、気象条件が厳しくなる夏季や冬季には、電力需要が気象条件によっても大きく左右されるため、需要変動をいち早く捉え、的確な措置を迅速にとることが求められる。上述した特許文献1に記載のシステムでは、事例モデルを利用して処理水の濁度を予測しており、このような事例モデルを適用することで、電力消費量が今後どのように推移していくのかを効率良く把握できる可能性がある。
本発明は、電力消費量等に代表される負荷量を的確に予測することができる負荷量予測装置および負荷量予測方法を提供することを目的とする。
本発明に係る負荷量予測装置は、予測時刻における負荷量を予測する負荷量予測装置であって、測定した負荷量である第1負荷量の測定時刻と同時刻であり測定日よりも過去の異なる二つの日に測定された負荷量である第2負荷量および第3負荷量、ならびに、前記測定時刻に測定されたエンタルピおよび前記第1負荷量を一組にして一つのデータを構成する履歴データを登録する登録部と、前記予測時刻と同時刻であり予測日よりも過去の異なる二つの日に測定された負荷量である第4負荷量および第5負荷量、ならびに、前記予測時刻に予想されるエンタルピである予想エンタルピを、予測用パラメータとして取得する取得部と、前記取得部により取得された前記予測用パラメータに基づいて、前記登録部により登録された前記履歴データの中から、前記予測用パラメータに類似する一つまたは複数の前記履歴データを選定する選定部と、前記選定部により選定された前記履歴データを用い、代表となる前記履歴データを算出し、当該代表となる前記履歴データに含まれる前記第1負荷量に対応する負荷量を、前記予測時刻における負荷量とする予測部と、を備える。
本発明に係る負荷量予測方法は、予測時刻における負荷量を予測する負荷量予測方法であって、測定した負荷量である第1負荷量の測定時刻と同時刻であり測定日よりも過去の異なる二つの日に測定された負荷量である第2負荷量および第3負荷量、ならびに、前記測定時刻に測定されたエンタルピおよび前記第1負荷量を一組にして一つのデータを構成する履歴データを登録する登録ステップと、前記予測時刻と同時刻であり予測日よりも過去の異なる二つの日に測定された負荷量である第4負荷量および第5負荷量、ならびに、前記予測時刻に予想されるエンタルピである予想エンタルピを、予測用パラメータとして取得する取得ステップと、前記取得ステップにおいて取得された前記予測用パラメータに基づいて、前記登録ステップにおいて登録された前記履歴データの中から、前記予測用パラメータに類似する一つまたは複数の前記履歴データを選定する選定ステップと、前記選定ステップにおいて選定された前記履歴データを用い、代表となる前記履歴データを算出し、当該代表となる前記履歴データに含まれる前記第1負荷量に対応する負荷量を、前記予測時刻における負荷量とする予測ステップと、を含む。
かかる構成を採用することにより、実測した第1負荷量およびエンタルピを、その実測日よりも過去の異なる二つの日における実測時刻と同時刻に測定された第2負荷量および第3負荷量に対応付け、それらを履歴データとして蓄積していくことができる。そして、予測用パラメータを取得したときに、予測日よりも過去の異なる二つの日における予測時刻と同時刻に測定された第4負荷量および第5負荷量ならびに予測時刻における予想エンタルピの組み合わせに類似する履歴データを、蓄積した履歴データの中から選定し、その選定した履歴データを用いて算出した代表となる履歴データに含まれる第1負荷量に対応する負荷量を、予測時刻における負荷量とすることができる。
また、上記過去の異なる二つの日は、前記測定日または前記予測日の前日、および前記測定日または前記予測日の7日前の日である、こととしてもよい。
本発明によれば、電力消費量等に代表される負荷量を的確に予測することができる負荷量予測装置および負荷量予測方法を提供することができる。
以下、図面を参照して本発明に係る実施形態について説明する。ただし、以下に説明する実施形態は、あくまでも例示であり、以下に明示しない種々の変形や技術の適用を排除するものではない。すなわち、本発明は、その趣旨を逸脱しない範囲で種々変形して実施することができる。
本実施形態では、負荷量予測装置で予測する負荷量が電力消費量である場合について説明するが、これに限定されず、予測する負荷量が、例えば、蒸気消費量や、冷水熱量、温水熱量である場合についても同様に適用することができる。
図1を参照して、実施形態における負荷量予測装置の構成について説明する。図1に示すように、負荷量予測装置1は、機能的には、例えば、登録部11と、取得部12と、選定部13と、予測部14とを有する。事例モデルDB3は、後述する事例モデルを蓄積するデータベースである。本実施形態では、登録部11が、後述する学習機能を実現し、取得部12、選定部13および予測部14が、後述する予測機能を実現する。
ここで、負荷量予測装置1は、物理的には、例えば、CPU(Central Processing Unit)と、メモリと、入出力インターフェースとを含んで構成される。メモリには、例えば、CPUで処理されるプログラムやデータを記憶するROM(Read Only Memory)やHDD(Hard Disk Drive)、主として制御処理のための各種作業領域として使用されるRAM(Random Access Memory)等の要素が含まれる。これらの要素は、互いにバスを介して接続される。CPUが、ROMに記憶されたプログラムを実行し、入出力インターフェースを介して受信されるデータや、RAMに展開されるデータを処理することで、負荷量予測装置1の各部が有する機能を実現できる。
登録部11は、測定データを用いて事例モデルを生成し、その後、所定間隔で継続的に得られる測定データを用いて事例モデルを更新する学習機能を有する。以下に、学習機能について説明する。
登録部11は、履歴データを事例モデルDB3に登録する。履歴データは、例えば、ある測定時刻に測定した電力消費量(第1負荷量)およびエンタルピ、その測定日の前日における測定時刻と同時刻(測定時刻の24時間前)に測定した電力消費量(第2負荷量)、ならびにその測定日の7日前における測定時刻と同時刻(測定時刻の168時間前)に測定した電力消費量(第3負荷量)を一組にして一つのデータを構成する。
登録部11は、履歴データを用いて事例モデルを生成し、その生成した事例モデルを事例モデルDB3に登録する事例生成登録部を含む。事例生成登録部が生成する事例モデルについて、以下に説明する。なお、この事例モデルは、上記特許文献1に記載されている事例ベース推論モデルの理論や手法を取り込んで適用することができる。
事例モデルは、位相(Topology)の概念を導入して作成するモデルであり、所望の出力許容誤差に応じて入力空間を量子化し、単位入力空間(以下、「メッシュ」という。)ごとに、入出力間の関係を定義したものである。
入力空間の量子化は、以下のように行うことができる。ここでは、説明の便宜のために、入力変数をx1とx2との二つにし、出力変数をyの一つにした場合について説明する。入力変数を二つにし、出力変数を一つにすることで、三次元の入出力空間を用いて説明することができ、入力空間の量子化を比較的わかりやすく説明することができるためである。一方、本実施形態では、履歴データのうち、測定時刻のエンタルピ、前日の電力消費量および7日前の電力消費量の三つが、上記入力変数に該当し、測定時刻の電力消費量が上記出力変数に該当することになり、入出力空間は四次元となる。入出力空間が四次元になっても、三次元の場合と同様の原理に基づいて行うことができる。
図2(A)に示すように、履歴データは、過去に測定された入力変数x1、x2と出力変数yとの組により一つのデータが構成される。この履歴データを、三次元の入出力空間x1-x2-y上に表すと、図2(B)に示すように分布する。なお、図2(B)は、x1-x2平面を紙面上に配置した状態で表した図であり、x1-x2平面に直交する出力軸yは、x1-x2平面の原点位置において紙面の裏側から表側に向けて配置された状態で表されている。
入力空間x1-x2のメッシュを決める際、図2(C)に示すように、同一メッシュ内における出力変数yの出力レンジ幅が出力誤差の許容幅εに収まるように、メッシュの大きさ(入力量子化数)を決定する。この例示では、図2(D)に示すように、入力変数x1を10分割し、入力変数x2を6分割するサイズでメッシュの大きさが決定されている。その結果、入力空間x1-x2は、60個のメッシュで区画されている。なお、図2(D)は、上記図2(B)と同様に、x1-x2平面を紙面上に配置した状態で表した図である。
出力誤差の許容幅εは、事例モデルを用いて出力される予測値と、実際の値との間の誤差をどの程度まで許容するかを示す値であり、モデリング条件として予め設定される。このような許容幅εを用いてメッシュの大きさを決定し、事例モデルを作成することで、その事例モデルに属する入力データを用いて予測する出力データの誤差を、許容幅εの範囲内に収めることが可能となる。
図1に示す取得部12、選定部13および予測部14は、事例モデルDB3に登録された事例モデルを参照し、予測時刻における電力消費量を予測する予測機能を有する。以下に、予測機能について説明する。
取得部12は、予測時刻における電力消費量を予測する際に用いる予測用パラメータを取得する。予測用パラメータには、例えば、予測日の前日における予測時刻と同時刻(予測時刻の24時間前)に測定した電力消費量(第4負荷量)、予測日の7日前における予測時刻と同時刻(予測時刻の168時間前)に測定した電力消費量(第5負荷量)、および予測時刻に予想されるエンタルピ(以下、「予想エンタルピ」という。)が含まれる。
選定部13は、取得部12により取得された予測用パラメータに基づいて事例モデルDB3を参照し、事例モデルDB3に登録されている履歴データの中から、予測用パラメータに類似する一つまたは複数の履歴データを選定する。以下に具体的に説明する。
選定部13は、予測用パラメータである、前日の電力消費量、7日前の電力消費量および予想エンタルピを、事例モデルの入出力空間に割り当てる。予測用パラメータに含まれる三つの要素(前日の電力消費量、7日前の電力消費量および予想エンタルピ)は、事例モデルを作成した時の三つの入力変数と合致する。したがって、選定部13は、これら三つの要素を、事例モデルの入出力空間に割り当てることで、三つの要素に対応する入力空間のメッシュを特定することができる。選定部13は、特定したメッシュに含まれる履歴データを、予測用パラメータに類似する履歴データとして選定する。
なお、特定したメッシュに含まれる履歴データに加え、その特定したメッシュの周辺に存在するメッシュに含まれる履歴データを、予測用パラメータに類似する履歴データに加えることとしてもよい。
予測部14は、選定部13により選定された履歴データを用い、代表となる履歴データを算出する。予測部14は、代表となる履歴データに含まれる、測定時刻の電力消費量に対応する電力消費量を、予測時刻における電力消費量とする。図3を参照して、具体的に説明する。図3は、上記図2と同様に、入力変数をx1とx2との二つにし、出力変数をyの一つにした場合における例示である。
図3(A)に示すように、選定部13により三つの履歴データが選定された場合、予測部14は、これら三つの履歴データに含まれる各要素(x1、x2、y)の平均値をそれぞれ算出する。予測部14は、図3(B)に示すように、算出したそれぞれの平均値を各要素の値とする履歴データを、代表となる履歴データとする。予測部14は、代表となる履歴データに含まれる、測定時刻の電力消費量(y)の平均値(81.9)を、予測時刻における電力消費量とする。なお、代表となる履歴データを求める方法は、平均値を算出して求めることには限定されない。
予測部14により予測された電力消費量は、例えば、グラフ化してディスプレイ5上に表示することができる。図4に、ディスプレイ5上に表示する電力消費量の推移グラフを例示する。図4には、電力消費量の推移グラフPとエンタルピの推移グラフEとが表示されている。現在時刻よりも右側が24時間先までの予測値の推移であり、現在時刻よりも左側が7日前までの実績値の推移となる。p1が予測日の7日前の電力消費量であり、p2が予測日の前日(現在時刻)の電力消費量であり、p3が予測時刻の電力消費量である。e1が予測日の前日(現在時刻)のエンタルピであり、e2が予測時刻のエンタルピである。
ここで、履歴データや予測用パラメータの中にエンタルピを含めることとしたのは、以下の理由による。ある施設における電力量は、設備の運用に関わる電力量と、外気温に影響を受ける電力量と、それ以外の電力量との総和になると考えられる。外気温に影響を受ける電力量は、いわゆる負荷熱量であり、これは外気温や外気湿度に影響を受ける。そのため、電力消費量を予測する際の入力変数として、外気温や外気湿度を利用することで、予測精度を向上させることが可能となる。しかしながら、外気温や外気湿度を入力変数に加えると変数が増加し、入出力空間の次元が増加するため、事例モデルを用いる予測手法では、精度が低下するおそれがある。
外気温と外気湿度とから求まる不快指数を入力変数として用いることも考えられる。しかしながら、本願発明者が、不快指数と同様に外気温と外気湿度とから求まるエンタルピについて、不快指数と比較しながら、実験を重ねたところ、エンタルピの方が、不快指数よりも、空調の熱負荷量に対するレンジ幅を大きく設定できることがわかった。つまり、入力変数としてエンタルピを用いることで、不快指数を用いる場合よりも、電力消費量の予測性能を向上させることが可能となる。
エンタルピ[kJ/kg(DA)]は、気象要素を用いて下記式(1)で求めることができる。
外気エンタルピ=1.006×乾球温度+(1.805×乾球温度+2501)×絶対温度 … (1)
上記式(1)の絶対湿度[kg/kg(DA)]は、下記式(2)で求めることができる。
絶対湿度=18.015×水蒸気圧÷(29.064×(大気圧-水蒸気圧)) … (2)
上記式(2)の水蒸気圧[hPa]は、下記式(3)で求めることができる。
水蒸気圧=飽和水蒸気圧×相対湿度 … (3)
上記式(3)の飽和水蒸気圧[hPa]は、下記式(4)で求めることができる。
飽和水蒸気圧=6.11×10(7.5×T/(T+237.3)) … (4)
上記式(4)のTは乾球温度である。
外気エンタルピ=1.006×乾球温度+(1.805×乾球温度+2501)×絶対温度 … (1)
上記式(1)の絶対湿度[kg/kg(DA)]は、下記式(2)で求めることができる。
絶対湿度=18.015×水蒸気圧÷(29.064×(大気圧-水蒸気圧)) … (2)
上記式(2)の水蒸気圧[hPa]は、下記式(3)で求めることができる。
水蒸気圧=飽和水蒸気圧×相対湿度 … (3)
上記式(3)の飽和水蒸気圧[hPa]は、下記式(4)で求めることができる。
飽和水蒸気圧=6.11×10(7.5×T/(T+237.3)) … (4)
上記式(4)のTは乾球温度である。
上述してきたように、本実施形態における負荷量予測装置1によれば、実測した電力消費量およびエンタルピを、その実測日の前日および7日前における実測時刻と同時刻に測定された電力消費量に対応付け、それらを履歴データとして蓄積していくことができる。そして、予測用パラメータを取得したときに、予測日の前日および7日前における予測時刻と同時刻に測定された電力消費量ならびに予測時刻における予想エンタルピの組み合わせに類似する履歴データを、蓄積した履歴データの中から選定し、その選定した履歴データを用いて算出した代表となる履歴データに含まれる、実測時刻に測定された電力消費量に対応する電力消費量を、予測時刻における電力消費量とすることができる。
これにより、7日間隔で同じような電力消費量の推移が繰り返される傾向にあり、前日との間でエンタルピの較差が生じにくい傾向にある、工場の電力消費量を、前日および7日前の同時刻における電力消費量を考慮して、予測時刻における電力消費量を算出することが可能となる。
また、本実施形態における負荷量予測装置1によれば、履歴データや予測用パラメータに、エンタルピを含めることによって、例えば不快指数等の他の気象状態を表す因子を用いる場合に比べ、空調の熱負荷量に対するレンジ幅を大きくすることができる。
それゆえに、本実施形態における負荷量予測装置1によれば、電力消費量の予測精度を向上させることができる。
[変形例]
なお、上述した実施形態では、学習および予測を行う際に、前日および7日前の同時刻における電力消費量を用いているが、これに限定されない。例えば、予測日と予測日の前日と予測日の7日前とが、平日であるか休日であるかによって、過去の異なる二つの日における電力消費量として、どの時点の電力消費量を用いるのかを決定することとしてもよい。例えば、予測日、予測日の前日および予測日の7日前のカレンダー情報に応じて、過去の異なる二つの日を、以下の8パターンで決定することとしてもよい。
なお、上述した実施形態では、学習および予測を行う際に、前日および7日前の同時刻における電力消費量を用いているが、これに限定されない。例えば、予測日と予測日の前日と予測日の7日前とが、平日であるか休日であるかによって、過去の異なる二つの日における電力消費量として、どの時点の電力消費量を用いるのかを決定することとしてもよい。例えば、予測日、予測日の前日および予測日の7日前のカレンダー情報に応じて、過去の異なる二つの日を、以下の8パターンで決定することとしてもよい。
(1)予測日、予測日の前日、予測日の7日前が、ともに平日である場合、前日および7日前の同時刻における電力消費量を用いる。
(2)予測日、予測日の前日、予測日の7日前が、休日、平日、平日である場合、前日および直近の土曜日の同時刻における電力消費量を用いる。
(3)予測日、予測日の前日、予測日の7日前が、平日、休日、平日である場合、前日および直近の月曜日の同時刻における電力消費量を用いる。
(4)予測日、予測日の前日、予測日の7日前が、休日、休日、平日である場合、直近の土曜日および直近の日曜日の同時刻における電力消費量を用いる。
(2)予測日、予測日の前日、予測日の7日前が、休日、平日、平日である場合、前日および直近の土曜日の同時刻における電力消費量を用いる。
(3)予測日、予測日の前日、予測日の7日前が、平日、休日、平日である場合、前日および直近の月曜日の同時刻における電力消費量を用いる。
(4)予測日、予測日の前日、予測日の7日前が、休日、休日、平日である場合、直近の土曜日および直近の日曜日の同時刻における電力消費量を用いる。
(5)予測日、予測日の前日、予測日の7日前が、平日、平日、休日である場合、前日および14日前の同時刻における電力消費量を用いる。
(6)予測日、予測日の前日、予測日の7日前が、休日、平日、休日である場合、前日および直近の土曜日の同時刻における電力消費量を用いる。
(7)予測日、予測日の前日、予測日の7日前が、平日、休日、休日である場合、前日および直近の月曜日の同時刻における電力消費量を用いる。
(8)予測日、予測日の前日、予測日の7日前が、ともに休日である場合、直近の土曜日および直近の日曜日の同時刻における電力消費量を用いる。
(6)予測日、予測日の前日、予測日の7日前が、休日、平日、休日である場合、前日および直近の土曜日の同時刻における電力消費量を用いる。
(7)予測日、予測日の前日、予測日の7日前が、平日、休日、休日である場合、前日および直近の月曜日の同時刻における電力消費量を用いる。
(8)予測日、予測日の前日、予測日の7日前が、ともに休日である場合、直近の土曜日および直近の日曜日の同時刻における電力消費量を用いる。
また、上述した実施形態では、予測時刻の電力消費量を算出しているが、本発明を、予測時刻の電力消費量のみを算出することに限定するものではない。例えば、同様の方法により、現在時刻から24時間先や48時間先までの電力消費量を、30分間隔で順次算出していくこととしてもよい。また、24時間先や48時間先までの電力消費量を算出する場合には、最新の実測値が得られるたびに、最新の実測値が属する時刻から所定時間後までの予測値を補正することとしてもよい。この場合、最新実測値の時刻における実測値と予測値との間の差分を算出し、最新実測値の時刻から未来の時刻になるほど、予測値を補正する幅が差分よりも徐々に小さくなるように重み付けをして、補正していくこととすればよい。
本発明に係る負荷量予測装置および負荷量予測方法は、電力消費量等に代表される負荷量を的確に予測することに適している。
1 負荷量予測装置
3 事例モデルDB
11 登録部
12 取得部
13 選定部
14 予測部
3 事例モデルDB
11 登録部
12 取得部
13 選定部
14 予測部
Claims (4)
- 予測時刻における負荷量を予測する負荷量予測装置であって、
測定した負荷量である第1負荷量の測定時刻と同時刻であり測定日よりも過去の異なる二つの日に測定された負荷量である第2負荷量および第3負荷量、ならびに、前記測定時刻に測定されたエンタルピおよび前記第1負荷量を一組にして一つのデータを構成する履歴データを登録する登録部と、
前記予測時刻と同時刻であり予測日よりも過去の異なる二つの日に測定された負荷量である第4負荷量および第5負荷量、ならびに、前記予測時刻に予想されるエンタルピである予想エンタルピを、予測用パラメータとして取得する取得部と、
前記取得部により取得された前記予測用パラメータに基づいて、前記登録部により登録された前記履歴データの中から、前記予測用パラメータに類似する一つまたは複数の前記履歴データを選定する選定部と、
前記選定部により選定された前記履歴データを用い、代表となる前記履歴データを算出し、当該代表となる前記履歴データに含まれる前記第1負荷量に対応する負荷量を、前記予測時刻における負荷量とする予測部と、
を備えることを特徴とする負荷量予測装置。 - 前記過去の異なる二つの日は、前記測定日または前記予測日の前日、および前記測定日または前記予測日の7日前の日である、
ことを特徴とする請求項1記載の負荷量予測装置。 - 予測時刻における負荷量を予測する負荷量予測方法であって、
測定した負荷量である第1負荷量の測定時刻と同時刻であり測定日よりも過去の異なる二つの日に測定された負荷量である第2負荷量および第3負荷量、ならびに、前記測定時刻に測定されたエンタルピおよび前記第1負荷量を一組にして一つのデータを構成する履歴データを登録する登録ステップと、
前記予測時刻と同時刻であり予測日よりも過去の異なる二つの日に測定された負荷量である第4負荷量および第5負荷量、ならびに、前記予測時刻に予想されるエンタルピである予想エンタルピを、予測用パラメータとして取得する取得ステップと、
前記取得ステップにおいて取得された前記予測用パラメータに基づいて、前記登録ステップにおいて登録された前記履歴データの中から、前記予測用パラメータに類似する一つまたは複数の前記履歴データを選定する選定ステップと、
前記選定ステップにおいて選定された前記履歴データを用い、代表となる前記履歴データを算出し、当該代表となる前記履歴データに含まれる前記第1負荷量に対応する負荷量を、前記予測時刻における負荷量とする予測ステップと、
を含むことを特徴とする負荷量予測方法。 - 前記過去の異なる二つの日は、前記測定日または前記予測日の前日、および前記測定日または前記予測日の7日前の日である、
ことを特徴とする請求項3記載の負荷量予測方法。
Applications Claiming Priority (2)
| Application Number | Priority Date | Filing Date | Title |
|---|---|---|---|
| JP2012-147518 | 2012-06-29 | ||
| JP2012147518A JP5902055B2 (ja) | 2012-06-29 | 2012-06-29 | 負荷量予測装置および負荷量予測方法 |
Publications (1)
| Publication Number | Publication Date |
|---|---|
| WO2014002645A1 true WO2014002645A1 (ja) | 2014-01-03 |
Family
ID=49782816
Family Applications (1)
| Application Number | Title | Priority Date | Filing Date |
|---|---|---|---|
| PCT/JP2013/063844 Ceased WO2014002645A1 (ja) | 2012-06-29 | 2013-05-17 | 負荷量予測装置および負荷量予測方法 |
Country Status (3)
| Country | Link |
|---|---|
| JP (1) | JP5902055B2 (ja) |
| TW (1) | TW201407530A (ja) |
| WO (1) | WO2014002645A1 (ja) |
Cited By (4)
| Publication number | Priority date | Publication date | Assignee | Title |
|---|---|---|---|---|
| JP2014057473A (ja) * | 2012-09-13 | 2014-03-27 | Azbil Corp | 負荷量予測装置および負荷量予測方法 |
| CN108090663A (zh) * | 2017-12-11 | 2018-05-29 | 囯网河北省电力有限公司电力科学研究院 | 供热机组深度调峰最低出力的评估方法及系统 |
| CN111553529A (zh) * | 2020-04-27 | 2020-08-18 | 新奥数能科技有限公司 | 负荷预测方法、装置、计算机可读存储介质及电子设备 |
| CN114330902A (zh) * | 2021-12-31 | 2022-04-12 | 河北工业大学 | 一种基于解耦机制的配电线路负荷预测方法 |
Families Citing this family (4)
| Publication number | Priority date | Publication date | Assignee | Title |
|---|---|---|---|---|
| JP6103323B1 (ja) * | 2015-10-20 | 2017-03-29 | 国際航業株式会社 | 電気料金情報予測システム |
| JP6841231B2 (ja) * | 2015-12-14 | 2021-03-10 | 日本電気株式会社 | 情報処理装置、その情報処理方法、およびプログラム |
| JP6782606B2 (ja) * | 2016-10-13 | 2020-11-11 | アズビル株式会社 | トレンド予測装置および負荷予測装置 |
| JP7286428B2 (ja) * | 2019-06-17 | 2023-06-05 | 大和ハウス工業株式会社 | 電力需要予測システム |
Citations (3)
| Publication number | Priority date | Publication date | Assignee | Title |
|---|---|---|---|---|
| JPH0695880A (ja) * | 1992-09-14 | 1994-04-08 | Yamatake Honeywell Co Ltd | 事例ベース推論装置 |
| JP2002119956A (ja) * | 2000-10-17 | 2002-04-23 | Yamatake Corp | 濁度予測システム、濁度制御システムおよび濁度管理システム |
| JP2009189085A (ja) * | 2008-02-04 | 2009-08-20 | Meidensha Corp | 電力・熱負荷の予測システム |
-
2012
- 2012-06-29 JP JP2012147518A patent/JP5902055B2/ja active Active
-
2013
- 2013-05-17 WO PCT/JP2013/063844 patent/WO2014002645A1/ja not_active Ceased
- 2013-06-28 TW TW102123150A patent/TW201407530A/zh unknown
Patent Citations (3)
| Publication number | Priority date | Publication date | Assignee | Title |
|---|---|---|---|---|
| JPH0695880A (ja) * | 1992-09-14 | 1994-04-08 | Yamatake Honeywell Co Ltd | 事例ベース推論装置 |
| JP2002119956A (ja) * | 2000-10-17 | 2002-04-23 | Yamatake Corp | 濁度予測システム、濁度制御システムおよび濁度管理システム |
| JP2009189085A (ja) * | 2008-02-04 | 2009-08-20 | Meidensha Corp | 電力・熱負荷の予測システム |
Cited By (6)
| Publication number | Priority date | Publication date | Assignee | Title |
|---|---|---|---|---|
| JP2014057473A (ja) * | 2012-09-13 | 2014-03-27 | Azbil Corp | 負荷量予測装置および負荷量予測方法 |
| CN108090663A (zh) * | 2017-12-11 | 2018-05-29 | 囯网河北省电力有限公司电力科学研究院 | 供热机组深度调峰最低出力的评估方法及系统 |
| CN108090663B (zh) * | 2017-12-11 | 2020-06-26 | 囯网河北省电力有限公司电力科学研究院 | 供热机组深度调峰最低出力的评估方法及系统 |
| CN111553529A (zh) * | 2020-04-27 | 2020-08-18 | 新奥数能科技有限公司 | 负荷预测方法、装置、计算机可读存储介质及电子设备 |
| CN111553529B (zh) * | 2020-04-27 | 2023-02-17 | 新奥数能科技有限公司 | 负荷预测方法、装置、计算机可读存储介质及电子设备 |
| CN114330902A (zh) * | 2021-12-31 | 2022-04-12 | 河北工业大学 | 一种基于解耦机制的配电线路负荷预测方法 |
Also Published As
| Publication number | Publication date |
|---|---|
| JP2014010683A (ja) | 2014-01-20 |
| TW201407530A (zh) | 2014-02-16 |
| JP5902055B2 (ja) | 2016-04-13 |
Similar Documents
| Publication | Publication Date | Title |
|---|---|---|
| JP5902055B2 (ja) | 負荷量予測装置および負荷量予測方法 | |
| Jain et al. | Data-driven model predictive control with regression trees—an application to building energy management | |
| JP5789421B2 (ja) | 負荷量予測装置、負荷量予測方法および負荷量予測プログラム | |
| US9559549B2 (en) | Energy management server, energy management method, and program | |
| US9753477B2 (en) | Load forecasting for residential sector demand response | |
| EP2469676A1 (en) | Demand-prediction device, program, and recording medium | |
| KR101875329B1 (ko) | 전력 사용량 예측 장치 및 방법 | |
| CN114219185A (zh) | 一种基于不确定集的城市规模工业碳排放量预测方法 | |
| US9810443B2 (en) | Devices, methods, and systems for data-driven acceleration of deployed services | |
| JP5734325B2 (ja) | 電力予測装置、設備制御システム、電力予測方法、及びプログラム | |
| US20140278699A1 (en) | Modeling energy conversion in systems | |
| CN113225994B (zh) | 一种面向数据中心的智能空调控制方法 | |
| JP2014157457A (ja) | 予測装置および予測方法 | |
| JP2018106431A (ja) | 設備機器運転計画生成装置および方法 | |
| JP2009225613A (ja) | 電力需要予測装置及び電力需要予測方法 | |
| JP5622698B2 (ja) | 目標電力設定システム、目標電力設定方法及びプログラム | |
| US20140365023A1 (en) | Systems and Methods for Computer Implemented Energy Management | |
| JP6029901B2 (ja) | 負荷量予測装置および負荷量予測方法 | |
| CN112379766A (zh) | 数据处理方法、装置、非易失性存储介质和处理器 | |
| JP2015041315A (ja) | 制御装置および制御方法 | |
| JP2008086147A (ja) | エネルギー需要予測方法、予測装置、プログラム及び記録媒体 | |
| CN115954951A (zh) | 一种新能源可靠出力水平的计算方法和装置 | |
| JP7684615B2 (ja) | 制御装置、空調制御方法及びプログラム | |
| WO2015159652A1 (ja) | エネルギー管理システム、エネルギー管理方法、およびプログラム | |
| JP2016127622A (ja) | 電力需要予測システム |
Legal Events
| Date | Code | Title | Description |
|---|---|---|---|
| 121 | Ep: the epo has been informed by wipo that ep was designated in this application |
Ref document number: 13809542 Country of ref document: EP Kind code of ref document: A1 |
|
| NENP | Non-entry into the national phase |
Ref country code: DE |
|
| 122 | Ep: pct application non-entry in european phase |
Ref document number: 13809542 Country of ref document: EP Kind code of ref document: A1 |