WO2012124162A1 - デバッグ装置 - Google Patents
デバッグ装置 Download PDFInfo
- Publication number
- WO2012124162A1 WO2012124162A1 PCT/JP2011/057021 JP2011057021W WO2012124162A1 WO 2012124162 A1 WO2012124162 A1 WO 2012124162A1 JP 2011057021 W JP2011057021 W JP 2011057021W WO 2012124162 A1 WO2012124162 A1 WO 2012124162A1
- Authority
- WO
- WIPO (PCT)
- Prior art keywords
- program
- debugging
- function
- thread
- controller
- Prior art date
- Legal status (The legal status is an assumption and is not a legal conclusion. Google has not performed a legal analysis and makes no representation as to the accuracy of the status listed.)
- Ceased
Links
Images



Classifications
-
- G—PHYSICS
- G06—COMPUTING OR CALCULATING; COUNTING
- G06F—ELECTRIC DIGITAL DATA PROCESSING
- G06F11/00—Error detection; Error correction; Monitoring
- G06F11/36—Prevention of errors by analysis, debugging or testing of software
- G06F11/362—Debugging of software
Definitions
- the present invention relates to a debugging device.
- FA Regenery Automation
- various slave devices that collect and control data of production facilities installed in a factory and a master device (programmable controller (PLC)) that centrally manages a plurality of slave devices communicate with each other.
- Production facilities are controlled by a field network connected via a bus.
- the master device for example, controls a plurality of connected slave devices or acquires information from each slave device by executing a control program.
- the master device has a function of communicating with an external device.
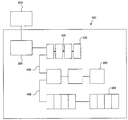
- FIG. 7 is a diagram showing a configuration example of a field network.
- a field network 100 is formed by connecting a master device 200 and a plurality of slave devices 300 directly or indirectly via a cable 400 or an I / O unit 500 provided in the device.
- the slave device 300 includes a power supply unit, a motor unit, a counter unit, an image unit, a communication unit, an I / O unit, and the like.
- the topology of the communication bus can take various topologies such as lines, daisy chains, trees, and stars, depending on the field network standard.
- the master device 200 is configured so that the user can set the operation of the master device 200, display the operation status of the field network 100, design the network system (for example, determine the connection configuration between the master device and the slave device, and execute the master device 200)
- a management apparatus 600 for performing control program creation may be connected.
- the management apparatus 600 is configured by a personal computer installed with a setting tool.
- the general procedure for creating a control program to be executed by the master device is as follows. (1) First, using a development environment (programming tool) installed in the management device 600 or the like, a program code of a control program to be executed by the master device is created. The program is described in, for example, a ladder language, SFC language, structured text, or the like. Recently, multiple languages are often mixed. (2) An executable file is created by compiling and building the created control program. (3) Execute (simulate) the created executable file using the simulator software installed in the management device 600, etc., and confirm that the control program is not defective (that is, the master device performs the intended operation). To do. (4) If a defect is found, return to (2) to correct the program and execute the simulation of (3). (5) Install the completed executable file in the memory of the master device.
- a development environment programming tool
- An object of the present invention is to provide a technique for easily realizing a debugger for a control program of a controller.
- the present invention adopts the following configuration.
- the debugging device of the present invention A debugging device for debugging a control program for a controller, It is realized by running the simulation program and the debug program on the OS (Operating System) of the computer,
- the simulation program is Emulates the function of the controller, It operates on the OS as one process including a task thread that emulates the function of the controller executing the control program and a communication thread that emulates the function of the controller communicating with an external device.
- the debug program causes the computer to An operating means for giving a control program to be debugged to the simulation program and operating the simulation program; Stop means for temporarily stopping the process of the simulation program at a breakpoint of the control program using a debugging instruction provided by the OS; and After the suspension of the process by the stop unit, the function is functioned as a restart unit that resumes the operation of the communication thread in the process. It is characterized by that.
- the simulation program is very simple to emulate the function of a controller (for example, PLC) and does not have a debugging function.
- the debugging function is provided by the debugging program, and the debugging is realized by a method in which the debugging program temporarily stops the process of the simulation program by using an OS service (debugging instruction).
- OS service debugging instruction
- the debug program when the debug program simply pauses the process of the simulation program, not only the operation of the control program executed by the task thread is stopped, but also an external device such as a communication thread.
- the function to communicate with will also stop.
- the state of the PLC emulated by the simulation program hereinafter referred to as “virtual PLC”
- internal variables, and the like cannot be confirmed from the outside, and the control program cannot be debugged.
- the present invention employs a structural contrivance that the operation of the communication thread is forcibly resumed after the process of the simulation program is temporarily stopped.
- an external process such as a debug program can acquire information such as the state of the virtual PLC and internal variables through the communication thread, so that the control program can be debugged.
- the basic functions of the PLC itself are generally realized by a program operating on the PLC microprocessor (hereinafter, the PLC itself).
- the program that realizes the basic function is referred to as “firmware” in order to distinguish it from a control program that is executed by the PLC for controlling the slave device or the like.
- a simple function that only emulates the PLC function such as the simulation program of the present invention, uses the PLC firmware source code as it is (or with some modifications), and the OS of the debugging device computer. It is also possible to create it by simply recompiling for use.
- the development of the simulation program portion is substantially unnecessary, the development man-hours and development costs can be significantly reduced as compared with the conventional case.
- the PLC firmware source code there is an advantage that the function of the PLC (actual machine) can be faithfully reproduced in the virtual PLC. Since the present invention is for debugging the control program, it is preferable to use at least the firmware source code corresponding to the task thread. Of course, it is also preferable to use the source code of a part other than the task thread (such as a communication thread).
- the present invention may be regarded as a debugging device having at least a part of the above means, or a debugging method including at least a part of the above processing, or a program for realizing such a method and a program thereof are recorded. It can also be regarded as a recording medium.
- a debugging device having at least a part of the above means, or a debugging method including at least a part of the above processing, or a program for realizing such a method and a program thereof are recorded. It can also be regarded as a recording medium.
- a debugger for the control program of the controller can be easily realized.
- FIG. 1 is a block diagram illustrating an example of a functional configuration of the debugging device according to the present embodiment.
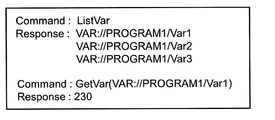
- FIG. 2 is a diagram illustrating an example of a communication command output from the display control unit to the communication thread and a response from the communication thread.
- FIG. 3 is a diagram illustrating an example of a processing flow when executing a simulation of the debugging device according to the present embodiment.
- FIG. 4 is a diagram illustrating a problem in the configuration of FIG. 1, and is a diagram illustrating an example of a process flow when the process is temporarily stopped.
- FIG. 5 is a diagram illustrating an example of a processing flow of the debugging device according to the present embodiment.
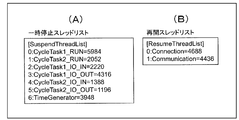
- FIG. 6 is a diagram illustrating an example of thread information.
- FIG. 7 is a diagram illustrating a configuration example of a field network.
- FIG. 1 is a block diagram showing a functional configuration of the debugging device according to the present embodiment.
- the debug device 1000 is a device for debugging the control program of the controller.
- the controller is a programmable controller (PLC) 130
- PLC 130 is used as a master device (reference numeral 200 in FIG. 7) in the industrial network system illustrated in FIG.
- the debug apparatus 1000 of this embodiment can be applied to any of them.
- the debugging device 1000 can be configured by a general-purpose computer including a CPU, a main storage device (memory, etc.), an auxiliary storage device (hard disk, etc.), various input / output interfaces, an input device (keyboard, mouse, etc.), a display device, and the like.
- a computer that operates on a general-purpose OS (operation system) such as Microsoft's Windows (registered trademark) series or Apple's MacOS series can be preferably used.
- a simulation program and a debug program for realizing the functions of the debug device 1000 are stored in an auxiliary storage device, and the CPU loads these programs into the main storage device and executes them on the OS, whereby the debug device 1000 described later is executed.
- Various functions are realized.
- FIG. 1 shows an actual PLC 130 for comparison.
- the basic function of the actual PLC 130 is also realized by a program that operates on a real-time OS for PLC.
- the task thread 132 has a function of executing a control program and controlling various slave devices. Various information such as internal variables of the control program, error codes, and the status of the PLC 130 and the slave device are communicated with the external device.
- a communication thread 133 is responsible for the function of transmitting and receiving data.
- the simulator 110 is a virtual PLC that emulates the functions of the PLC 130.
- the program of the simulator 110 is a multi-thread program that is executed on the OS as one process 111 and includes a plurality of threads such as a task thread 112 and a communication thread 113.
- the task thread 112 emulates the function of the PLC 130 executing the control program. That is, the execution result of the control program of the simulator 110 and the execution result of the control program of the PLC 130 basically match.
- the communication thread 113 emulates a function for the PLC 130 to communicate with an external device.
- the program of the simulator 110 uses the firmware source code developed for the actual PLC 130 as it is (or with some modifications). Has been created.
- the execution file of the simulator 110 is created by recompiling and building the firmware source code for the OS of the debugging device 1000. If the OS has compatibility, the firmware (execution file) of the PLC 130 can be used as the simulator 110 as it is.
- the programming tool 120 includes a debug function unit 121 and a display control unit 122.
- the debug function unit 121 performs a debug function by using a debugging API (Application Program Interface) provided by the OS. For example, the process of the simulation program is temporarily stopped at the break point of the control program of the PLC 130 using the debug instruction provided by the OS (stop means).
- a debugging API Application Program Interface
- the display control unit 122 displays a communication result with the communication thread 113 (and the communication thread 133 of the PLC 130) on a display device (not shown).
- a communication command output to the communication thread from the display control unit 122 and a response from the communication thread are shown in FIG.
- the display control unit 122 when it is desired to obtain a list of variables in the control program being executed, the display control unit 122 outputs a command “ListVar”. As a result, a list of variables such as “Var1 to Var3” is returned from the communication thread.
- the variable is, for example, the execution result or a variable used when calculating the execution result.
- the display control unit 122 outputs a command “GetVar”.
- the current value of the variable is returned from the communication thread (in the example of FIG. 2, “GetVar” is output with the variable Var1 specified, so the current value “230” of the variable Var1 is returned).
- FIG. 3 is a diagram illustrating an example of a processing flow when executing a simulation of the debugging device according to the present embodiment.
- the user creates a source file 301 (source program) of a control program using the editor 123 of the programming tool 120 (step S301).
- the compiler 124 of the programming tool 120 compiles the source file 301 in accordance with an instruction from the user (step S302). Thereby, an execution file 302 and debug information 303 of the control program are created.
- the debug information 303 is information that associates a position in the source file 301 with an address on a memory where the execution file 302 is expanded when the task thread 112 executes the control program.
- the task setting unit 125 of the programming tool 120 performs task setting (setting of execution procedures of the plurality of execution files 302 created in step S302) in accordance with an instruction from the user, and task setting information as a setting result. 304 is generated (step S303).
- the programming tool 120 activates the simulator 110 in response to an instruction from the user.
- the programming tool 120 gives the control program to be debugged to the simulator 110 and operates the simulator (operation means).
- the scheduler 114 of the simulator 110 reads the task setting information 304 generated in step S303 and generates a task thread 112 (step S305). In addition, the scheduler 114 reads the plurality of execution files 302 created in step S302 (step S306).
- the debug function unit 121 attaches to the process 111 (step S307). This enables debugging.
- the programming tool 120 connects to the simulator 110 (step S308).
- “connecting” means, for example, making the programming tool 120 and the simulator 110 communicable with each other.
- the programming tool 120 issues a simulation execution command to the communication thread 113 (step S309).
- the communication thread 113 instructs the scheduler 114 to start executing the simulation (step S310).
- the scheduler 114 instructs the task thread 112 to execute (step S311). Thereby, the task thread 112 operates and simulation is started.
- the display control unit 122 issues a communication command to the communication thread 113 (step S312), and the communication thread 113 responds to it (step S313), so that desired information is displayed on the display device.
- the above is the flow of processing when executing the simulation of the debugging device according to the present embodiment.
- a PLC control program debugger can be easily realized.
- the simulator 110 operates as one process 111, and the debugging function unit 121 performs a debugging function using a debugging API provided by the OS. For this reason, not only the task thread 112 but also the entire process 111 is temporarily stopped at a breakpoint, and communication with the communication thread 113 is interrupted. In this case, it is impossible to check the internal variables and status of the virtual PLC by the simulator 110 from the programming tool 120, and it is not possible to check whether the control program is operating normally. That is, the debugging device does not function as a debugger.
- FIG. 4 is a diagram illustrating a problem in the configuration of FIG. 1, and is a diagram illustrating an example of a processing flow when the process 111 is temporarily stopped.
- step S401 the user sets a breakpoint using the editor 123 (step S401). Thereby, breakpoint position information 401 on the source file is generated.
- the debug function unit 121 obtains the memory address 402 corresponding to the breakpoint using the position information 401 and the debug information 303 generated in step S401 (step S402).
- the debug function unit 121 writes a debug break instruction (stop instruction) provided by the OS to the address obtained in step S402 (step S403). Thereby, the entire process 111 is temporarily stopped at the breakpoint set by the user (step S404).
- the display control unit 122 may obtain a response to the communication command from the communication thread 113. It becomes impossible.
- a process of automatically restarting the operation of the communication thread 113 is performed (resuming unit).
- the process is performed by the debug function unit 121, but may be performed by a function other than the debug function unit 121.
- the thread to be resumed is not limited to the communication thread 113 alone.
- the operations of a plurality of threads other than the task thread 112 may be automatically resumed.
- threads other than those necessary for causing the debugging device to function as a debugger may be automatically resumed.
- FIG. 5 is a diagram illustrating an example of a processing flow of the debugging apparatus 1000 according to the present embodiment.
- the thread information output thread 115 of the simulator 110 outputs thread information 501 (step S501). Then, the debug function unit 121 acquires the output thread information 501 (step S502).
- Thread information 501 is information indicating a thread to be suspended, for example. Specifically, an identifier is set for each thread, and a list of threads to be temporarily suspended as shown in FIG.
- the thread information 501 is output before a breakpoint hits (for example, immediately after the start of simulation execution or immediately after the connection between the programming tool 120 and the simulator 110 (step S308)).
- the debug function unit 121 sets a breakpoint in the task thread 112 using a debugging API provided by the OS (step S503). That is, the same process as step S403 in FIG. 4 is performed. Thereby, the entire process 111 is temporarily stopped at the breakpoint set by the user (step S504).
- the debug function unit 121 interprets a thread that needs to be restarted based on the thread information acquired in step S502, and instructs the simulator 110 to restart the operation of the thread. (Step S505). In the present embodiment, it is instructed to resume the operation of a thread that is not included in the list of FIG. As a result, the operation of the communication thread 113 is resumed. Note that the debug function unit 121 may acquire the thread information 501 at this time.
- the display control unit 122 can obtain a response to the communication command from the communication thread 113 in step S507, and displays desired information on the display device. Can be displayed. That is, the debugging device can function as a debugger.
- the simulator 110 is very simple that only emulates the function of the PLC 130 and does not have a debugging function. Then, debugging is realized by a method in which the debugging function unit 121 of the programming tool 120 temporarily stops the process 111 of the simulator 110 using an OS service (debugging instruction).
- OS service debugging instruction
- the simulator 110 of the debugging apparatus 1000 is created using the source code of the PLC 130 firmware.
- development of the program portion of the simulator 110 is substantially unnecessary, so that the number of development steps and development costs can be significantly reduced as compared with the conventional case.
- firmware source code of the PLC 130 there is an advantage that the function of the actual PLC 130 can be faithfully reproduced in the virtual PLC of the simulator 110.
- the thread for restarting the operation is determined based on the thread information.
- the thread information may not be used.
- the thread for resuming the operation may be previously known by the debug function unit 121 or the like that instructs the resumption of the operation of the thread.
- the thread information is information indicating a thread to be suspended
- the thread information may be information indicating a thread whose operation is resumed.
- the thread information 501 a list of threads for restarting operations as shown in FIG. 6B may be used.
- the thread information in (B) of FIG. 6 indicates that the communication threads “Connection” and “Communication” are resumed threads. If the thread information is a list of threads whose operations are to be resumed, in step S505, it may be instructed to resume the operations of the threads included in the list.
- Design support system 2 Display 3 CPU 4 input device 31 storage unit 32 acquisition unit 33 input unit 34 generation unit 35 image output unit 100 field network 110 simulator 111 process 112 task thread 113 communication thread 114 scheduler 115 thread information output thread 120 programming tool 121 debug function unit 122 display control unit 123 Editor 124 Compiler 125 Task setting unit 130 Master device 133 Communication thread 200 Master device 300 Slave device 301 Source file 302 Execution file 303 Debug information 304 Task setting information 400 Cable 401 Position information 402 Address 500 Unit 501 Thread information 600 Management device 1000 Debug apparatus
Landscapes
- Engineering & Computer Science (AREA)
- Theoretical Computer Science (AREA)
- Computer Hardware Design (AREA)
- Quality & Reliability (AREA)
- Physics & Mathematics (AREA)
- General Engineering & Computer Science (AREA)
- General Physics & Mathematics (AREA)
- Debugging And Monitoring (AREA)
- Programmable Controllers (AREA)
Abstract
本発明のデバッグ装置は、シミュレーションプログラムとデバッグプログラムをコンピュータのOS上で実行させることで実現され、シミュレーションプログラムは、コントローラの機能をエミュレートするものであって、タスクスレッドと通信スレッドを含む1つのプロセスとして、上記OS上で動作するものであり、デバッグプログラムは、コンピュータを、デバッグ対象とする制御プログラムをシミュレーションプログラムに与えて、シミュレーションプログラムを動作させる動作手段、制御プログラムのブレークポイントでシミュレーションプログラムのプロセスを一時停止する停止手段、および、停止手段によるプロセスの一時停止後に、通信スレッドの動作を再開する再開手段、として機能させるものである。これにより、コントローラの制御プログラムのデバッガを簡単に実現するための技術を提供することができる。
Description
本発明は、デバッグ装置に関する。
FA(Factory Automation)においては、工場内に設置される生産設備のデータ収集及び制御を行う各種のスレーブ装置と、複数のスレーブ装置を集中管理するマスター装置(プログラマブルコントローラ(PLC))と、を通信バスを介して接続したフィールドネットワークにより生産設備の制御が行われる。マスター装置は、制御プログラムを実行することで、例えば、接続された複数のスレーブ装置を制御したり、各スレーブ装置から情報を取得したりする。また、マスター装置は、外部装置と通信を行う機能を有する。
図7は、フィールドネットワークの構成例を示す図である。図7において、フィールドネットワーク100は、マスター装置200と複数のスレーブ装置300とがケーブル400や装置に備わるI/Oユニット500を介して直接的又は間接的に接続されることにより形成される。スレーブ装置300には、電源ユニット,モータユニット,カウンタユニット,画像ユニット,通信ユニット,I/Oユニット等がある。通信バスのトポロジーは、フィールドネットワークの規格により、ライン、デイジーチェーン、ツリー、スターなど種々のトポロジーをとり得る。
また、マスター装置200には、ユーザがマスター装置200の動作設定、フィールドネットワーク100の動作状態の表示、ネットワークシステムの設計(例えば、マスター装置とスレーブ装置の接続構成の決定や、マスター装置で実行する制御プログラムの作成)などを行うための管理装置600が接続されることもある。管理装置600は設定ツールがインストールされたパーソナルコンピュータなどにより構成される。
マスター装置で実行する制御プログラムの一般的な作成手順は以下のとおりである。
(1)まず、管理装置600等に実装されている開発環境(プログラミングツール)を用いて、マスター装置で実行させる制御プログラムのプログラムコードを作成する。プログラムは、例えば、ラダー言語、SFC言語、ストラクチャードテキスト等で記述される。最近では、複数の言語が混在していることも多い。
(2)作成した制御プログラムをコンパイル・ビルドすることにより、実行ファイルを作成する。
(3)作成した実行ファイルを管理装置600等に実装されているシミュレータソフトを用いて実行(シミュレーション)し、制御プログラムに不具合が無いこと(即ち、マスター装置が意図した動作を行うこと)を確認する。
(4)不具合が発見されたら(2)に戻りプログラムを修正し、(3)のシミュレーションを実行する。
(5)完成した実行ファイルをマスター装置のメモリにインストールする。
(1)まず、管理装置600等に実装されている開発環境(プログラミングツール)を用いて、マスター装置で実行させる制御プログラムのプログラムコードを作成する。プログラムは、例えば、ラダー言語、SFC言語、ストラクチャードテキスト等で記述される。最近では、複数の言語が混在していることも多い。
(2)作成した制御プログラムをコンパイル・ビルドすることにより、実行ファイルを作成する。
(3)作成した実行ファイルを管理装置600等に実装されているシミュレータソフトを用いて実行(シミュレーション)し、制御プログラムに不具合が無いこと(即ち、マスター装置が意図した動作を行うこと)を確認する。
(4)不具合が発見されたら(2)に戻りプログラムを修正し、(3)のシミュレーションを実行する。
(5)完成した実行ファイルをマスター装置のメモリにインストールする。
従来、(2)~(4)の作業は、デバッグ機能をもつ専用のPLCシミュレータソフトを用いて、制御プログラムをステップ実行したり、ブレークポイントで一時停止して変数の状態を確認したりするのが一般的であった。
しかしながら、このようなデバッグ機能をもつシミュレータソフトは、PLCの新製品が出たり、PLCの仕様(ファームウェア)が変更されるたびに、新たに作成しなおさなければならないため、シミュレータソフト自体の開発工数や開発コストが問題となっていた。尚、デバッガに関する先行技術としては、例えば、特許文献1~5に開示されたものが知られている。
本発明は、コントローラの制御プログラムのデバッガを簡単に実現するための技術を提供することを目的とする。
上記目的を達成するために、本発明は以下の構成を採用する。
本発明のデバッグ装置は、
コントローラ用の制御プログラムをデバッグするためのデバッグ装置であって、
シミュレーションプログラムとデバッグプログラムをコンピュータのOS(Operating System)上で実行させることで実現され、
前記シミュレーションプログラムは、
前記コントローラの機能をエミュレートするものであって、
前記コントローラが制御プログラムを実行する機能をエミュレートするタスクスレッドと、前記コントローラが外部装置との通信を行う機能をエミュレートする通信スレッドとを含む1つのプロセスとして、前記OS上で動作するものであり、
前記デバッグプログラムは、前記コンピュータを、
デバッグ対象とする制御プログラムを前記シミュレーションプログラムに与えて、前記シミュレーションプログラムを動作させる動作手段、
前記OSが提供するデバッグ用の命令を使って、前記制御プログラムのブレークポイントで前記シミュレーションプログラムのプロセスを一時停止する停止手段、および、
前記停止手段による前記プロセスの一時停止後に、前記プロセスにおける前記通信スレッドの動作を再開する再開手段、として機能させるものである、
ことを特徴とする。
コントローラ用の制御プログラムをデバッグするためのデバッグ装置であって、
シミュレーションプログラムとデバッグプログラムをコンピュータのOS(Operating System)上で実行させることで実現され、
前記シミュレーションプログラムは、
前記コントローラの機能をエミュレートするものであって、
前記コントローラが制御プログラムを実行する機能をエミュレートするタスクスレッドと、前記コントローラが外部装置との通信を行う機能をエミュレートする通信スレッドとを含む1つのプロセスとして、前記OS上で動作するものであり、
前記デバッグプログラムは、前記コンピュータを、
デバッグ対象とする制御プログラムを前記シミュレーションプログラムに与えて、前記シミュレーションプログラムを動作させる動作手段、
前記OSが提供するデバッグ用の命令を使って、前記制御プログラムのブレークポイントで前記シミュレーションプログラムのプロセスを一時停止する停止手段、および、
前記停止手段による前記プロセスの一時停止後に、前記プロセスにおける前記通信スレッドの動作を再開する再開手段、として機能させるものである、
ことを特徴とする。
本発明のデバッグ装置では、シミュレーションプログラムはコントローラ(例えばPLC)の機能をエミュレートするだけの非常にシンプルなものであり、デバッグ機能は有していない。本発明のデバッグ装置では、デバッグ機能はデバッグプログラムが有しており、デバッグプログラムがOSのサービス(デバッグ用の命令)を使ってシミュレーションプログラムのプロセスを一時停止するという方法により、デバッグを実現する。このようなプログラム構成を採用することにより、PLCの新製品が出たり、PLCの仕様が変更されたりしても、シミュレーションプログラムの部分を入れ替えるだけで済み、デバッグプログラムの部分は流用可能であるため、デバッグ装置の開発工数や開発工数を従来に比べて低減することが期待できる。
ただし、上記のようなプログラム構成においては、デバッグプログラムがシミュレーションプログラムのプロセスを単純に一時停止すると、タスクスレッドにより実行されている制御プログラムの動作が停止するだけでなく、通信スレッドのように外部装置との通信を行う機能も停止してしまう。これでは、シミュレーションプログラムによりエミュレートされているPLC(以下、「仮想PLC」と称する。)の状態や内部変数などを外部から確認することができず、制御プログラムのデバッグを行うことができない。そこで、本発明では、シミュレーションプログラムのプロセスを一時停止した後に、通信スレッドの動作を強制的に再開させるという構成上の工夫を採用している。これにより、デバッグプログラムなどの外部のプロセスが、通信スレッドを通じて仮想PLCの状態や内部変数などの情報を取得することが可能となるため、制御プログラムのデバッグ作業を遂行することができる。
ところで、PLC自体の基本機能(制御プログラムを実行する機能、外部装置と通信する機能など)も、PLCのマイクロプロセッサ上で動作するプログラムで実現されているのが一般的である(以下、PLC自体の基本機能を実現するプログラムを、スレーブ装置等の制御のためにPLCに実行させる制御プログラムと区別するため、「ファームウェア」と称する。)。したがって、本発明のシミュレーションプログラムのようにPLCの機能をエミュレートするだけのシンプルな機能のものは、PLCのファームウェアのソースコードをそのまま(若しくは若干の修正を加えて)、デバッグ装置のコンピュータのOS用にリコンパイルするだけで、作成することも可能である。この場合は、シミュレーションプログラムの部分の開発は実質的に必要無くなるため、従来に比べて開発工数や開発コストを格段に低減することができる。また、PLCのファームウェアのソースコードを利用することにより、仮想PLCにおいてPLC(実機)の機能を忠実に再現することができるという利点もある。なお、本発明は、制御プログラムのデバッグを行うためのものであるため、少なくともタスクスレッドに相当する部分のファームウェアのソースコードを利用するとよい。もちろん、タスクスレッド以外の部分(通信スレッドなど)のソースコードを利用することも好ましい。
また、本発明は、上記手段の少なくとも一部を有するデバッグ装置として捉えてもよいし、上記処理の少なくとも一部を含むデバッグ方法、または、かかる方法を実現するためのプログラムやそのプログラムを記録した記録媒体として捉えることもできる。なお、上記手段及び処理の各々は可能な限り互いに組み合わせて本発明を構成することができる。
本発明によれば、コントローラの制御プログラムのデバッガを簡単に実現することができる。
(システム構成)
図1は、本実施形態に係るデバッグ装置の機能構成を示すブロック図である。このデバッグ装置1000は、コントローラの制御プログラムをデバッグするための装置である。
本実施形態では、コントローラがプログラマブルコントローラ(PLC)130である場合を例に説明する。PLC130は、図7に例示したような産業用のネットワークシステムにおけるマスター装置(図7では符号200)として利用されるものである。産業用ネットワークには様々な規格が存在し、またPLC製品についても様々な仕様のものが存在するが、本実施形態のデバッグ装置1000はそのいずれにも適用可能である。
図1は、本実施形態に係るデバッグ装置の機能構成を示すブロック図である。このデバッグ装置1000は、コントローラの制御プログラムをデバッグするための装置である。
本実施形態では、コントローラがプログラマブルコントローラ(PLC)130である場合を例に説明する。PLC130は、図7に例示したような産業用のネットワークシステムにおけるマスター装置(図7では符号200)として利用されるものである。産業用ネットワークには様々な規格が存在し、またPLC製品についても様々な仕様のものが存在するが、本実施形態のデバッグ装置1000はそのいずれにも適用可能である。
デバッグ装置1000は、CPU、主記憶装置(メモリなど)、補助記憶装置(ハードディスクなど)、各種入出力インターフェース、入力装置(キーボード、マウスなど)、表示装置等を備える汎用のコンピュータにより構成可能である。例えば、マイクロソフト社のWindows(登録商標)シリーズ、アップル社のMacOSシリーズなどの汎用のOS(オペレーションシステム)で動作するコンピュータを好ましく利用できる。デバッグ装置1000の機能を実現するシミュレーションプログラム及びデバッグプログラムは補助記憶装置に格納されており、CPUがこれらのプログラムを主記憶装置にロードし、OS上で実行することにより、後述するデバッグ装置1000の各種の機能が実現される。
(プログラム構成)
図1において、シミュレータ110は、シミュレーションプログラムにより実現される機能を示し、プログラミングツール120は、デバッグプログラムにより実現される機能を示す。なお、図1には、比較のために実機のPLC130も示している。実機のPLC130においても、その基本機能は、PLC用のリアルタイムOS上で動作するプログラムで実現されている。図1の例では、制御プログラムを実行して各種スレーブ装置を制御する機能をタスクスレッド132が担い、制御プログラムの内部変数、エラーコード、PLC130やスレーブ装置のステイタスなどの各種情報を外部装置との間で送受する機能を通信スレッド133が担っている。
図1において、シミュレータ110は、シミュレーションプログラムにより実現される機能を示し、プログラミングツール120は、デバッグプログラムにより実現される機能を示す。なお、図1には、比較のために実機のPLC130も示している。実機のPLC130においても、その基本機能は、PLC用のリアルタイムOS上で動作するプログラムで実現されている。図1の例では、制御プログラムを実行して各種スレーブ装置を制御する機能をタスクスレッド132が担い、制御プログラムの内部変数、エラーコード、PLC130やスレーブ装置のステイタスなどの各種情報を外部装置との間で送受する機能を通信スレッド133が担っている。
シミュレータ110は、PLC130の機能をエミュレートする仮想PLCである。シミュレータ110のプログラムは、1つのプロセス111としてOS上で実行され、タスクスレッド112、通信スレッド113など複数のスレッドを含むマルチスレッドプログラムである。タスクスレッド112は、PLC130が制御プログラムを実行する機能をエミュレートするものである。即ち、シミュレータ110の制御プログラムの実行結果と、PLC130の制御プログラムの実行結果は基本的に一致する。通信スレッド113は、PLC130が外部装置との通信を行う機能をエミュレートするものである。
本実施形態では、シミュレータ110のプログラム(タスクスレッド112の部分と通信スレッド113の部分)は、実機のPLC130用に開発されたファームウェアのソースコードをそのまま(若しくは若干の修正を加えたもの)を利用して作成されている。通常、デバッグ装置1000のOSと、PLC130のOSとは異なるため、シミュレータ110の実行ファイルは、ファームウェアのソースコードをデバッグ装置1000のOS用にリコンパイル・ビルドして作成されるが、もし両者のOSが互換性を有しているような場合は、PLC130のファームウェア(実行ファイル)をそのままシミュレータ110として利用することも可能である。
プログラミングツール120は、デバッグ機能部121と表示制御部122を有する。デバッグ機能部121は、上記OSが提供するデバッグ用のAPI(Application Program Interface)を使って、デバッグ機能を果たす。例えば、上記OSが提供するデバッグ用の命令を使って、PLC130の制御プログラムのブレークポイントでシミュレーションプログラムのプロセスを一時停止する(停止手段)。
表示制御部122は、通信スレッド113(及び、PLC130の通信スレッド133)との通信結果を不図示の表示装置に表示する。表示制御部122から通信スレッドに出力する通信コマンド、及び、通信スレッドからの応答の一例を図2に示す。例えば、実行中の制御プログラム内の変数のリストを取得したい場合には、表示制御部122は、「ListVar」というコマンドを出力する。それにより、通信スレッドから「Var1~Var3」といった変数のリストが返される。変数は、例えば、上記実行結果や該実行結果を算出する際に使用される変数などである。また、実行中の制御プログラム内の変数の現在値を取得したい場合には、表示制御部122は「GetVar」というコマンドを出力する。それにより、通信スレッドから変数の現在値が返される(図2の例では、変数Var1を指定して「GetVar」が出力されたため、変数Var1の現在値「230」が返される)。
(シミュレーション実行時の処理の流れ)
図3は、本実施形態に係るデバッグ装置のシミュレーション実行時の処理の流れの一例を示す図である。
図3は、本実施形態に係るデバッグ装置のシミュレーション実行時の処理の流れの一例を示す図である。
まず、ユーザは、プログラミングツール120のエディタ123を用いて、制御プログラムのソースファイル301(ソースプログラム)を作成する(ステップS301)。
そして、プログラミングツール120のコンパイラ124が、ユーザからの指示に応じて、ソースファイル301をコンパイルする(ステップS302)。それにより、制御プログラムの実行ファイル302とデバッグ情報303とが作成される。デバッグ情報303は、ソースファイル301内の位置と、タスクスレッド112が制御プログラムを実行する際に実行ファイル302が展開されるメモリ上のアドレスとを対応付ける情報である。
次に、プログラミングツール120のタスク設定部125が、ユーザからの指示に応じて、タスク設定(ステップS302で作成された複数の実行ファイル302の実行手順の設定)を行い、設定結果としてタスク設定情報304を生成する(ステップS303)。
そして、プログラミングツール120が、ユーザからの指示に応じてシミュレータ110を起動する。
次に、ステップS305~S311において、プログラミングツール120が、デバッグ対象とする制御プログラムをシミュレータ110に与え、シミュレータを動作させる(動作手段)。
具体的には、シミュレータ110のスケジューラ114が、ステップS303で生成されたタスク設定情報304を読み込み、タスクスレッド112を生成する(ステップS305)。また、スケジューラ114が、ステップS302で作成された複数の実行ファイル302を読み込む(ステップS306)。
次に、デバッグ機能部121が、プロセス111にアタッチする(ステップS307)。これにより、デバッグ可能となる。
そして、プログラミングツール120が、シミュレータ110に接続する(ステップS308)。ここで、“接続する”とは、例えば、プログラミングツール120とシミュレータ110とを互いに通信可能な状態にすることを意味する。
次に、プログラミングツール120が、通信スレッド113にシミュレーションの実行コマンドを発行する(ステップS309)。
通信スレッド113は、実行コマンドが発行されると、スケジューラ114に対してシミュレーションの実行開始を指示する(ステップS310)。
スケジューラ114は、シミュレーションの実行開始が指示されると、タスクスレッド112に実行を指示する(ステップS311)。それにより、タスクスレッド112が動作し、シミュレーションが開始される。
そして、表示制御部122は、通信スレッド113に通信コマンドを発行し(ステップS312)、通信スレッド113がそれに応答することにより(ステップS313)、所望の情報が表示装置で表示される。
以上が、本実施形態に係るデバッグ装置のシミュレーション実行時の処理の流れである。
(図1の構成における課題)
上述したように、図1に示すようなデバッグ装置を用いることにより、PLCの制御プログラムのデバッガを簡単に実現することが可能となる。しかしながら、本実施形態に係るデバッグ装置では、シミュレータ110は1つのプロセス111として動作しており、デバッグ機能部121はOSが提供するデバッグ用のAPIを用いてデバッグ機能を果たしている。そのため、ブレークポイントで、タスクスレッド112のみではなく、プロセス111全体が一時停止してしまい、通信スレッド113との通信が途絶してしまう。これでは、プログラミングツール120から、シミュレータ110による仮想PLCの内部変数やステイタスなどを確認することができず、制御プログラムが正常に動作しているか否かを確認することができない。即ち、デバッグ装置がデバッガとして機能しなくなってしまう。
上述したように、図1に示すようなデバッグ装置を用いることにより、PLCの制御プログラムのデバッガを簡単に実現することが可能となる。しかしながら、本実施形態に係るデバッグ装置では、シミュレータ110は1つのプロセス111として動作しており、デバッグ機能部121はOSが提供するデバッグ用のAPIを用いてデバッグ機能を果たしている。そのため、ブレークポイントで、タスクスレッド112のみではなく、プロセス111全体が一時停止してしまい、通信スレッド113との通信が途絶してしまう。これでは、プログラミングツール120から、シミュレータ110による仮想PLCの内部変数やステイタスなどを確認することができず、制御プログラムが正常に動作しているか否かを確認することができない。即ち、デバッグ装置がデバッガとして機能しなくなってしまう。
以下、上記課題について、図4を用いて説明する。図4は、図1の構成における課題を示す図であり、プロセス111の一時停止時の処理の流れの一例を示す図である。
まず、ユーザが、エディタ123を用いて、ブレークポイントを設定する(ステップS401)。それにより、ソースファイル上のブレークポイントの位置情報401が生成される。
次に、デバッグ機能部121が、ステップS401で生成された位置情報401とデバッグ情報303を用いて、ブレークポイントに対応するメモリ上のアドレス402を求める(ステップS402)。
そして、デバッグ機能部121は、ステップS402で求めたアドレスに、OSが提供するデバッグ用のブレーク命令(停止命令)を書き込む(ステップS403)。それにより、ユーザが設定したブレークポイントでプロセス111全体が一時停止する(ステップS404)。
その結果、通信スレッド113は一時停止するため、ステップS405で表示制御部122が通信スレッドに通信コマンドを発行したとしても、表示制御部122は、通信スレッド113から該通信コマンドに対する応答を得ることができなくなってしまう。
なお、このような課題は、シミュレータ110の機能をシンプルなものにし、かつ、OSのサービスであるデバッグ用APIを利用してプロセスの一時停止を行う構成を採用したために、生じるものである。言い換えると、ステップ実行などのデバッグ機能を備える高機能なシミュレータを用いれば、発生しない課題である。しかしながら、このような高機能なシミュレータを作成するには前述のように多大な開発工数と開発コストが必要となるため好ましくない。そこで本実施形態では、別の工夫を加えることにより、上記課題を解決することとした。
(上記課題を解決するための構成)
上記課題を解決するために、本実施形態では、デバッグ機能部121によるプロセス111の一時停止後に、通信スレッド113の動作を自動で再開する処理を行う(再開手段)。なお、本実施形態では、当該処理はデバッグ機能部121により行われるものとするが、デバッグ機能部121以外の機能により行われてもよい。なお、再開するスレッドは通信スレッド113のみに限らない。タスクスレッド112以外の複数のスレッドの動作が自動で再開されてもよい。また、デバッグ装置をデバッガとして機能させるために必要なスレッド以外のスレッドが自動で再開されてもよい。
上記課題を解決するために、本実施形態では、デバッグ機能部121によるプロセス111の一時停止後に、通信スレッド113の動作を自動で再開する処理を行う(再開手段)。なお、本実施形態では、当該処理はデバッグ機能部121により行われるものとするが、デバッグ機能部121以外の機能により行われてもよい。なお、再開するスレッドは通信スレッド113のみに限らない。タスクスレッド112以外の複数のスレッドの動作が自動で再開されてもよい。また、デバッグ装置をデバッガとして機能させるために必要なスレッド以外のスレッドが自動で再開されてもよい。
以下、上記処理を含めた本実施形態に係るデバッグ装置1000の処理の流れについて図5を用いて説明する。図5は、本実施形態に係るデバッグ装置1000の処理の流れの一例を示す図である。
まず、シミュレータ110のスレッド情報出力スレッド115が、スレッド情報501を出力する(ステップS501)。そして、デバッグ機能部121が、出力されたスレッド情報501を取得する(ステップS502)。
スレッド情報501は、例えば、一時停止するスレッドを示す情報である。具体的には、各スレッドには識別子が設定されており、スレッド情報501として、図6の(A)に示すような、一時停止するスレッドのリストが用いられる。図6の(A)のスレッド情報は、「CycleTask1_RUN」、「CycleTask1_IO_IN」、「CycleTask1_IO_OUT」、「CycleTask2_RUN」、「CycleTask2_IO_IN」、「CycleTask2_IO_OUT」、「TimeGenerator」の6つのタスクスレッドが一時停止するスレッドであることを示す。図中、「=」の後に付加されている数値は、各スレッドの識別子である。スレッド情報501は、ブレークポイントがヒットする前(例えば、シミュレーションの実行開始直後や、プログラミングツール120とシミュレータ110の接続(ステップS308)直後)に出力される。
次に、デバッグ機能部121が、OSが提供するデバッグ用のAPIを用いて、タスクスレッド112にブレークポイントを設定する(ステップS503)。即ち、図4のステップS403と同様の処理が行われる。それにより、ユーザが設定したブレークポイントでプロセス111全体が一時停止する(ステップS504)。
プロセス111全体が一時停止すると、デバッグ機能部121は、ステップS502で取得したスレッド情報に基づいて、動作の再開が必要なスレッドを解釈し、シミュレータ110に対して当該スレッドの動作の再開を指示する(ステップS505)。本実施形態では、図6の(A)のリストに含まれないスレッドの動作の再開が指示される。それにより、通信スレッド113の動作が再開される。なお、デバッグ機能部121は、この時点でスレッド情報501を取得してもよい。
その結果、表示制御部122は、ステップS506で通信スレッド113に通信コマンドを発行した場合に、ステップS507で通信スレッド113から該通信コマンドに対するして応答を得ることができ、所望の情報を表示装置に表示することができる。即ち、デバッグ装置をデバッガとして機能させることができる。
以上述べたように本実施形態のデバッグ装置1000では、シミュレータ110はPLC130の機能をエミュレートするだけの非常にシンプルなものであり、デバッグ機能は有していない。そして、プログラミングツール120のデバッグ機能部121がOSのサービス(デバッグ用の命令)を使ってシミュレータ110のプロセス111を一時停止するという方法により、デバッグを実現する。このようなプログラム構成を採用することにより、PLCの新製品が出たり、PLCの仕様が変更されたりしても、シミュレータ110のプログラムの部分を入れ替えるだけで済み、プログラミングツール120の部分は流用可能であるため、デバッグ装置全体の開発工数や開発工数を従来に比べて低減することが期待できる。
また本実施形態では、PLC130のファームウェアのソースコードを利用して、デバッグ装置1000のシミュレータ110を作成している。これにより、シミュレータ110のプログラムの部分の開発は実質的に必要無くなるため、従来に比べて開発工数や開発コストを格段に低減することができる。また、PLC130のファームウェアのソースコードを利用することにより、シミュレータ110の仮想PLCにおいて実機のPLC130の機能を忠実に再現することができるという利点もある。
なお、本実施形態では、スレッド情報に基づいて動作を再開するスレッドが決定される構成としたが、スレッド情報は用いなくてもよい。スレッドの動作の再開を指示するデバッグ機能部121等に動作を再開するスレッドを予め把握させておいてもよい。
なお、本実施形態では、スレッド情報が一時停止するスレッドを示す情報である場合について説明したが、スレッド情報はこれに限らない。例えば、スレッド情報は動作を再開するスレッドを示す情報であってもよい。具体的には、スレッド情報501として、図6の(B)に示すような、動作を再開するスレッドのリストを用いてもよい。図6の(B)のスレッド情報は、通信スレッドである「Connection」と「Communication」が再開するスレッドであることを示す。スレッド情報が動作を再開するスレッドのリストである場合、ステップS505では、リストに含まれるスレッドの動作の再開を指示すればよい。
1 設計支援システム
2 ディスプレイ
3 CPU
4 入力装置
31 記憶手段
32 取得手段
33 入力手段
34 生成手段
35 画像出力手段
100 フィールドネットワーク
110 シミュレータ
111 プロセス
112 タスクスレッド
113 通信スレッド
114 スケジューラ
115 スレッド情報出力スレッド
120 プログラミングツール
121 デバッグ機能部
122 表示制御部
123 エディタ
124 コンパイラ
125 タスク設定部
130 マスター装置
133 通信スレッド
200 マスター装置
300 スレーブ装置
301 ソースファイル
302 実行ファイル
303 デバッグ情報
304 タスク設定情報
400 ケーブル
401 位置情報
402 アドレス
500 ユニット
501 スレッド情報
600 管理装置
1000 デバッグ装置
2 ディスプレイ
3 CPU
4 入力装置
31 記憶手段
32 取得手段
33 入力手段
34 生成手段
35 画像出力手段
100 フィールドネットワーク
110 シミュレータ
111 プロセス
112 タスクスレッド
113 通信スレッド
114 スケジューラ
115 スレッド情報出力スレッド
120 プログラミングツール
121 デバッグ機能部
122 表示制御部
123 エディタ
124 コンパイラ
125 タスク設定部
130 マスター装置
133 通信スレッド
200 マスター装置
300 スレーブ装置
301 ソースファイル
302 実行ファイル
303 デバッグ情報
304 タスク設定情報
400 ケーブル
401 位置情報
402 アドレス
500 ユニット
501 スレッド情報
600 管理装置
1000 デバッグ装置
Claims (5)
- コントローラ用の制御プログラムをデバッグするためのデバッグ装置であって、
シミュレーションプログラムとデバッグプログラムをコンピュータのOS上で実行させることで実現され、
前記シミュレーションプログラムは、
前記コントローラの機能をエミュレートするものであって、
前記コントローラが制御プログラムを実行する機能をエミュレートするタスクスレッドと、前記コントローラが外部装置との通信を行う機能をエミュレートする通信スレッドとを含む1つのプロセスとして、前記OS上で動作するものであり、
前記デバッグプログラムは、前記コンピュータを、
デバッグ対象とする制御プログラムを前記シミュレーションプログラムに与えて、前記シミュレーションプログラムを動作させる動作手段、
前記OSが提供するデバッグ用の命令を使って、前記制御プログラムのブレークポイントで前記シミュレーションプログラムのプロセスを一時停止する停止手段、および、
前記停止手段による前記プロセスの一時停止後に、前記プロセスにおける前記通信スレッドの動作を再開する再開手段、として機能させるものである、
ことを特徴とするデバッグ装置。 - 前記シミュレーションプログラムの少なくともタスクスレッドの部分は、前記コントローラのファームウェアのソースコードを利用して作成されたものであることを特徴とする請求項1に記載のデバッグ装置。
- コントローラ用の制御プログラムをデバッグするためのプログラムであって、
コンピュータのOS上で実行されるシミュレーションプログラムとデバッグプログラムを含み、
前記シミュレーションプログラムは、
前記コントローラの機能をエミュレートするものであって、
前記コントローラが制御プログラムを実行する機能をエミュレートするタスクスレッドと、前記コントローラが外部装置との通信を行う機能をエミュレートする通信スレッドとを含む1つのプロセスとして、前記OS上で動作するものであり、
前記デバッグプログラムは、前記コンピュータに、
デバッグ対象とする制御プログラムを前記シミュレーションプログラムに与えて、前記シミュレーションプログラムを動作させる動作ステップと、
前記OSが提供するデバッグ用の命令を使って、前記制御プログラムのブレークポイントで前記シミュレーションプログラムのプロセスを一時停止する停止ステップと、
前記停止ステップによる前記プロセスの一時停止後に、前記プロセスにおける前記通信スレッドの動作を再開する再開ステップと、
を実行させる
ことを特徴とするプログラム。 - 請求項3に記載のプログラムを記録していることを特徴とするコンピュータ読取可能な記録媒体。
- コントローラ用の制御プログラムをデバッグするためのデバッグ方法であって、
コンピュータが、シミュレーションプログラムとデバッグプログラムを前記コンピュータのOS上で実行することで実現され、
前記シミュレーションプログラムは、
前記コントローラの機能をエミュレートするものであって、
前記コントローラが制御プログラムを実行する機能をエミュレートするタスクスレッドと、前記コントローラが外部装置との通信を行う機能をエミュレートする通信スレッドとを含む1つのプロセスとして、前記OS上で動作するものであり、
前記コンピュータが、前記デバッグプログラムを実行することにより、デバッグ対象とする制御プログラムを前記シミュレーションプログラムに与えて、前記シミュレーションプログラムを動作させる動作ステップと、
前記コンピュータが、前記デバッグプログラムを実行することにより、前記OSが提供するデバッグ用の命令を使って、前記制御プログラムのブレークポイントで前記シミュレーションプログラムのプロセスを一時停止する停止ステップと、
前記コンピュータが、前記デバッグプログラムを実行することにより、前記停止ステップによる前記プロセスの一時停止後に、前記プロセスにおける前記通信スレッドの動作を再開する再開ステップと、
を有することを特徴とするデバッグ方法。
Applications Claiming Priority (2)
| Application Number | Priority Date | Filing Date | Title |
|---|---|---|---|
| JP2011-056383 | 2011-03-15 | ||
| JP2011056383A JP5212508B2 (ja) | 2011-03-15 | 2011-03-15 | デバッグ装置 |
Publications (1)
| Publication Number | Publication Date |
|---|---|
| WO2012124162A1 true WO2012124162A1 (ja) | 2012-09-20 |
Family
ID=46830270
Family Applications (1)
| Application Number | Title | Priority Date | Filing Date |
|---|---|---|---|
| PCT/JP2011/057021 Ceased WO2012124162A1 (ja) | 2011-03-15 | 2011-03-23 | デバッグ装置 |
Country Status (2)
| Country | Link |
|---|---|
| JP (1) | JP5212508B2 (ja) |
| WO (1) | WO2012124162A1 (ja) |
Cited By (1)
| Publication number | Priority date | Publication date | Assignee | Title |
|---|---|---|---|---|
| JP2023504958A (ja) * | 2020-11-16 | 2023-02-08 | バイドゥ オンライン ネットワーク テクノロジー(ペキン) カンパニー リミテッド | ミニプログラムをデバッグする方法、装置、電子機器、記憶媒体及びコンピュータプログラム |
Families Citing this family (2)
| Publication number | Priority date | Publication date | Assignee | Title |
|---|---|---|---|---|
| JP6919338B2 (ja) | 2017-05-30 | 2021-08-18 | オムロン株式会社 | プログラム開発支援装置、プログラム開発支援システム、プログラム開発支援方法、および、プログラム開発支援プログラム |
| CN109508981A (zh) * | 2017-09-15 | 2019-03-22 | 富士通株式会社 | 用于测试智能合约的方法和装置 |
Citations (4)
| Publication number | Priority date | Publication date | Assignee | Title |
|---|---|---|---|---|
| JPH05274177A (ja) * | 1992-03-26 | 1993-10-22 | Yokogawa Electric Corp | リアルタイム・システム・デバッグ装置 |
| JPH06161817A (ja) * | 1992-11-18 | 1994-06-10 | Yokogawa Electric Corp | スレッドオンラインデバッグ装置 |
| JP2000250777A (ja) * | 1999-02-25 | 2000-09-14 | Canon Inc | 情報処理装置と情報処理方法、及び記憶媒体 |
| JP2009193109A (ja) * | 2008-02-12 | 2009-08-27 | Advantest Corp | デバッグ中にツールを使用可能な試験システム及び方法 |
-
2011
- 2011-03-15 JP JP2011056383A patent/JP5212508B2/ja not_active Expired - Fee Related
- 2011-03-23 WO PCT/JP2011/057021 patent/WO2012124162A1/ja not_active Ceased
Patent Citations (4)
| Publication number | Priority date | Publication date | Assignee | Title |
|---|---|---|---|---|
| JPH05274177A (ja) * | 1992-03-26 | 1993-10-22 | Yokogawa Electric Corp | リアルタイム・システム・デバッグ装置 |
| JPH06161817A (ja) * | 1992-11-18 | 1994-06-10 | Yokogawa Electric Corp | スレッドオンラインデバッグ装置 |
| JP2000250777A (ja) * | 1999-02-25 | 2000-09-14 | Canon Inc | 情報処理装置と情報処理方法、及び記憶媒体 |
| JP2009193109A (ja) * | 2008-02-12 | 2009-08-27 | Advantest Corp | デバッグ中にツールを使用可能な試験システム及び方法 |
Non-Patent Citations (1)
| Title |
|---|
| KAZUYA KURIYAMA ET AL.: "Simulation Development Environment for Real-Time System", JOURNAL OF THE SOCIETY OF INSTRUMENT AND CONTROL ENGINEERS, vol. 31, no. 7, July 1992 (1992-07-01), pages 811 - 815 * |
Cited By (2)
| Publication number | Priority date | Publication date | Assignee | Title |
|---|---|---|---|---|
| JP2023504958A (ja) * | 2020-11-16 | 2023-02-08 | バイドゥ オンライン ネットワーク テクノロジー(ペキン) カンパニー リミテッド | ミニプログラムをデバッグする方法、装置、電子機器、記憶媒体及びコンピュータプログラム |
| JP7241931B2 (ja) | 2020-11-16 | 2023-03-17 | バイドゥ オンライン ネットワーク テクノロジー(ペキン) カンパニー リミテッド | ミニプログラムをデバッグする方法、装置、電子機器、記憶媒体及びコンピュータプログラム |
Also Published As
| Publication number | Publication date |
|---|---|
| JP5212508B2 (ja) | 2013-06-19 |
| JP2012194632A (ja) | 2012-10-11 |
Similar Documents
| Publication | Publication Date | Title |
|---|---|---|
| CN108594746B (zh) | 可视化编程控制系统及方法、装置 | |
| CN104756086B (zh) | 用于调试依领域而定的语言的系统和方法 | |
| CN104898546B (zh) | 一种基于soc的plc在线调试系统和方法 | |
| CN103995499B (zh) | 控制器、信息处理装置 | |
| CN101572026A (zh) | 用于工程项目的训练仿真器 | |
| JP2015060600A (ja) | 仮想制御装置をリアルタイムテストするためのテスト装置 | |
| KR20100041447A (ko) | 테스트 자동화 장치 및 테스트 자동화 방법 | |
| JP5891891B2 (ja) | 情報処理装置、情報処理方法、およびプログラム | |
| CN103218293A (zh) | 一种plc在线调试系统和方法 | |
| CN105740139A (zh) | 一种基于虚拟环境的嵌入式软件调试方法 | |
| US20220297731A1 (en) | Train signal system and linkage method therefor | |
| JP5212508B2 (ja) | デバッグ装置 | |
| CN106094750A (zh) | 分布式控制系统的模拟调试方法 | |
| JP6362821B2 (ja) | 制御装置、制御方法および命令セット | |
| CN109144849B (zh) | 一种嵌入式软件调测方法 | |
| CN110554861A (zh) | 具有编译和读取-评估-打印-循环操作的软件开发环境 | |
| EP3633471B1 (en) | Program development support device, program development support system, program development support method, and program development support program | |
| CN114518734B (zh) | 一种控制模型集成方法、装置及其介质 | |
| CN113238491B (zh) | 执行机构的仿真测试方法、装置、智能臂架及工程车辆 | |
| JP2019179284A (ja) | シミュレーションシステム、及びシミュレーションプログラム | |
| CN112272820B (zh) | 支持装置以及支持程序的记录介质 | |
| JP3464417B2 (ja) | 制御装置用画面データのテスト表示方法 | |
| CN101236507A (zh) | 安装或升级方法和装置 | |
| CN112099906A (zh) | 一种Java代码远程调试方法、装置、系统、设备和介质 | |
| CN111025166A (zh) | 用于电池检测系统的调试器 |
Legal Events
| Date | Code | Title | Description |
|---|---|---|---|
| 121 | Ep: the epo has been informed by wipo that ep was designated in this application |
Ref document number: 11860838 Country of ref document: EP Kind code of ref document: A1 |
|
| DPE2 | Request for preliminary examination filed before expiration of 19th month from priority date (pct application filed from 20040101) | ||
| NENP | Non-entry into the national phase |
Ref country code: DE |
|
| 122 | Ep: pct application non-entry in european phase |
Ref document number: 11860838 Country of ref document: EP Kind code of ref document: A1 |