WO2012063185A1 - Method and device for estimating a pattern in a signal - Google Patents
Method and device for estimating a pattern in a signal Download PDFInfo
- Publication number
- WO2012063185A1 WO2012063185A1 PCT/IB2011/054951 IB2011054951W WO2012063185A1 WO 2012063185 A1 WO2012063185 A1 WO 2012063185A1 IB 2011054951 W IB2011054951 W IB 2011054951W WO 2012063185 A1 WO2012063185 A1 WO 2012063185A1
- Authority
- WO
- WIPO (PCT)
- Prior art keywords
- signal
- spectrum
- domain
- combined
- pitch
- Prior art date
Links
Classifications
-
- G—PHYSICS
- G10—MUSICAL INSTRUMENTS; ACOUSTICS
- G10L—SPEECH ANALYSIS OR SYNTHESIS; SPEECH RECOGNITION; SPEECH OR VOICE PROCESSING; SPEECH OR AUDIO CODING OR DECODING
- G10L25/00—Speech or voice analysis techniques not restricted to a single one of groups G10L15/00 - G10L21/00
- G10L25/90—Pitch determination of speech signals
-
- G—PHYSICS
- G10—MUSICAL INSTRUMENTS; ACOUSTICS
- G10L—SPEECH ANALYSIS OR SYNTHESIS; SPEECH RECOGNITION; SPEECH OR VOICE PROCESSING; SPEECH OR AUDIO CODING OR DECODING
- G10L19/00—Speech or audio signals analysis-synthesis techniques for redundancy reduction, e.g. in vocoders; Coding or decoding of speech or audio signals, using source filter models or psychoacoustic analysis
- G10L19/02—Speech or audio signals analysis-synthesis techniques for redundancy reduction, e.g. in vocoders; Coding or decoding of speech or audio signals, using source filter models or psychoacoustic analysis using spectral analysis, e.g. transform vocoders or subband vocoders
-
- G—PHYSICS
- G10—MUSICAL INSTRUMENTS; ACOUSTICS
- G10L—SPEECH ANALYSIS OR SYNTHESIS; SPEECH RECOGNITION; SPEECH OR VOICE PROCESSING; SPEECH OR AUDIO CODING OR DECODING
- G10L19/00—Speech or audio signals analysis-synthesis techniques for redundancy reduction, e.g. in vocoders; Coding or decoding of speech or audio signals, using source filter models or psychoacoustic analysis
- G10L19/04—Speech or audio signals analysis-synthesis techniques for redundancy reduction, e.g. in vocoders; Coding or decoding of speech or audio signals, using source filter models or psychoacoustic analysis using predictive techniques
- G10L19/16—Vocoder architecture
- G10L19/18—Vocoders using multiple modes
Definitions
- the present invention relates to a method, a corresponding device and a corresponding computer program for estimating a pattern, in particular a pitch and/or a fundamental frequency, in a signal having a periodic, a quasiperiodic or virtually periodic component.
- Pitch detection can be used for different applications like voice modification, text-to-speech transformation, speech coding, music information retrieval, musical performance systems, biometric measurements, astrophysical measurements etc.
- time domain and frequency domain approaches are well known.
- the time domain approaches can be implemented cheap and easily e.g. by measuring the zero-crossing rate as described by C.H. Chen, Signal Processing Handbook, New York: Dekker, p. 531, 1988 or by a variation of autocorrelation by exploiting the similarity of successive pitch periods as described by R. Bracewell, The Autocorrelation Function, in The Fourier Transform and Its Applications, New York: MacGraw-Hill, pp. 40-45, 1965.
- the frequency-domain approaches are usually more complex and include the steps of a Fast Fourier Transformation (FFT) to transform the time-domain signal to a frequency-domain signal, removing of the influence of the phase by only considering the power of the frequency components, compressing the values to reduce the influence of spectral envelope, producing pitch candidates by correlation of the underlying harmonics like subharmonic summation and finding the candidate by selecting the highest peak.
- FFT Fast Fourier Transformation
- Such methods are known e.g. from D.J. Hermes, Measurement of pitch by subharmonic summation, in Journal of the Acoustic Society of America, 83, pp. 257- 264, 1988.
- Another possibility to get the pitch candidates is the transformation of the frequency-domain signal back to the time-domain by Inverse Fourier Transformation (IFFT).
- IFFT Inverse Fourier Transformation
- a strong compression like a log function amplifies the influence of noise and forms wrong pitch candidates.
- a small compression like the magnitude operation is too low to suppress the influence of spectral envelopes and, therefore, producing wrong candidates from higher harmonics.
- a compromise is applying a square-root operation on magnitude values as used in a harmony speech coder which is known from R. Taori et al., Harmony- 1 : A Versatile Low Bit Rate Speech Coding System, Nat. Lab. Technical Note 157/97.
- the pitch detection methods are provided to determine the right candidate out of multiple candidates, however, if the candidates are close to each other, a wrong candidate may be chosen. Further, if higher and/or lower octaves of a pitch are strongly represented, false candidates may be selected by the pitch detection methods known from the prior art.
- a method for estimating a pattern, in particular a pitch and/or a fundamental frequency, in a signal having a periodic, quasiperiodic or virtually periodic component comprising:
- a corresponding device e.g. comprising a processing unit to perform the steps of the above-mentioned method.
- a corresponding computer program is presented comprising program code means for causing a computer to carry out the steps of the proposed method when said computer program is carried out on the computer.
- the present invention is based upon the idea that in an additional step the frequency domain spectrum is combined with its time-domain transformation such that the resulting spectrum has a distinct peak at the pitch location and strong attenuation at higher and lower octaves.
- This method can be used to estimate the pitch and/or the fundamental frequency of a signal. Since the resulting spectrum has just a distinct peak at the pitch location and/or the fundamental frequency, the pitch and/or the fundamental frequency can be detected easily with a high reliability.
- the step of transforming the signal from a time-domain to a frequency-domain comprises a Fourier Transformation, in particular a Fast Fourier Transformation. This provides a possibility to implement a transformation from the time-domain to the frequency-domain with low effort.
- the signal is processed by means of a DC- notch filter.
- the DC-notch filter removes low frequency signals to prevent false detection.
- the DC filtered signal is preferably multiplied by a window function. This window operation limits the spectrum to a region that contains at least two pitch periods.
- the spectrum of the signal is processed to obtain a magnitude spectrum of the signal.
- the magnitude calculation of the signal provides a compression operation, which is easily implementable and results in a zero-phase signal after backward transformation.
- the spectrum of the signal is compressed to a compressed spectrum, in particular by means of a square-root operation.
- the compression function may be a root - function in general using e.g. 0.6 as exponent. This operation emphasizes the harmonics of the pitch and attenuates the influence of the spectral envelopes.
- the spectrum of the signal is windowed by means of a window function, in particular by using the right half of a Hanning window or other window functions, which have a similar effect.
- This window operation attenuates noisy high frequency components.
- the transformation of the zero-phase spectrum, in particular of a compressed magnitude spectrum of the signal, to the time-domain comprises an Inverse Fourier Transformation. Since the phase of the spectrum, in particular of a compressed spectrum is zero, just the positive axis of the real part of the spectrum need to be computed. This provides a possibility to obtain a correlation signal having peaks at multiples of the pitch period.
- the correlation signals is attenuated by means of a window function.
- This window operation attenuates the effect of the spectral envelope on the correlation signal.
- the combination of the spectrum and the correlation signal comprises resampling of at least one of the spectrum or the correlation signal.
- the resampling provides a possibility to combine the spectrum and the correlation signal having inversely proportional axes.
- the estimating of the pattern comprises searching for an absolute maximum of the combined signal. This provides a reliable and simple possibility to find the pitch and/or the fundamental frequency of the signal.
- the signal is rectified, in particular by means of a full-wave rectification function. This provides a possibility to determine the pitch and/or the fundamental frequency of a signal when the fundamental frequency is missing without degrading the performance for non-filtered signals.
- the zero-phase spectrum of the rectified signal is compared with the zero-phase spectrum of the non-rectified signal and wherein the maximum of these signals is selected and combined with the correlation signal to form the combined signal.
- the reason for taking the maximum of the spectra is that in case of pure sinusoidal signals, the rectification removes the fundamental frequency and produces only higher harmonics.
- the spectra of the rectified and the non-rectified signal are combined by selecting the maximum of these spectra.
- Fig. 1 shows a schematic flow diagram of a pitch detection method according to the present invention
- Fig. 2 shows a diagram of the source signal to be processed and the compressed spectrum, the correlation signal, the combined spectrum and the measured pitch derived from the source si nal by the pitch detection method
- Fig. 7 shows a schematic block diagram of a processing unit performing the method according to Fig. 5, and
- Fig. 8 shows a schematic block diagram of a processing unit performing the method according to Fig. 1.
- Fig. 1 shows a flow diagram of a method to detect a pitch and/or a fundamental frequency of a signal having a periodic, a quasiperiodic or a virtual periodic component generally denoted by 10. Examples for those signals are recordings of voiced speech, musical tone of an instrument, body signals like heart beat, radio signals from stars, activity monitoring signals.
- An input signal s which is a quasiperiodic or virtually periodic signal like a voice signal, is transformed in step SI from a time-domain signal to a frequency- domain spectrum.
- the transformation preferably comprises a Fast Fourier Transformation (FFT).
- Step SI provides a spectrum S of the signal s.
- the spectrum S is processed in step S2 to remove the phase information of the spectrum and to obtain a zero-phase spectrum (S m ).
- FFT Fast Fourier Transformation
- the processing comprises computing the magnitude of the spectrum S and optionally a spectral compression of the spectrum S, e.g. by means of a square-root operation.
- the processing and/or compression step S2 emphasizes the harmonics of the pitch and attenuates the influence of the spectral envelope.
- Step S2 provides a zero-phase spectrum S m .
- the zero-phase spectrum S m is transformed in step S3 from the frequency- domain to the time-domain preferably using an Inverse Fourier Transformation.
- Transformation step S3 provides a correlation signal c, which comprises peaks at multiples of the pitch period.
- the combined spectrum b comprises a distinct peak at the pitch, wherein the higher harmonics in the frequency spectrum and the multiples of the pitch period are attenuated leaving the pitch and/or the fundamental frequency as a predominant peak.
- the combination S4 is performed by multiplying the zero-phase spectrum S m with the correlation signal c.
- a peak detection S5 is performed to estimate the pitch and/or the fundamental frequency of the signal.
- the peak detection S5 comprises searching for the maximum in the combined spectrum b and provides the output signal p, which corresponds to the pitch and/or the fundamental frequency of the source signal s.
- the step S4 of combining the zero-phase spectrum S m with its time-domain transformation c results in the combined spectrum b, which has a distinct peak at the pitch location and/or the fundamental frequency and strong attenuation and higher and lower octaves.
- the peak detection is reliable, since the pitch location and/or the fundamental frequency correspond to highest peak in the combined spectrum b.
- Fig. 2 shows five diagrams Fig. 2A-E showing the amplitude of the source signal s, the frequency of a compressed spectrum S c , the frequency of the correlation signal c, the frequency of the combined spectrum b ⁇ and the output signal, the pitch p of the source signal s versus time.
- the source signal s shown in Fig. 2A is the time-domain of the English sentence "do they take the car when they go aboard".
- the frequency of the correlation signal c derived from the compressed spectrum S c by means of the transformation step S3 is shown in Fig. 2C.
- the frequency of the combined spectrum b derived from the combination of the compressed spectrum S c and the correlation signal c by means of step S4 is shown in Fig. 2D.
- FIG. 2 shows the signals or spectra provided by the certain method steps SI to S5 versus time.
- Fig. 3 shows a schematic block diagram of an apparatus to perform the pitch detection, which is generally denoted by 20.
- the apparatus 20 comprises a signal input 22 and a signal output 24 to receive the source signal s and to provide the output signal p, respectively.
- the apparatus 20 comprises a processing unit 26 for processing the input signal s and to estimate the pitch and/or the fundamental frequency of the input signal s.
- the processing unit 26 provides the output signal p to the output 24 of the apparatus 20.
- the processing unit 26 comprises a memory 28 to store program codes for causing the processing unit 26 to carry out method steps to process the input signal s.
- the processing unit 26 can be implemented by an integrated circuit or a computer or may be implemented by means of discrete elements and/or devices which perform the necessary processing steps.
- Fig. 4 shows a flow diagram of a pitch detection method generally denoted by 30 and the corresponding signals or spectra provided by the certain method steps.
- the source signal s is preferably filtered by means of a DC-notch filter in a first step S6.
- Low frequencies of the input signal s can distort the pitch detection process due to the windowing step before the Fourier Transformation from the time-domain to the frequency-domain.
- the windowing step smears the energy of a dominant DC signal to higher frequencies, and can emphasize weak low frequencies of the source signal s. To prevent false detection, the low frequencies of the source signal s need to be removed before the following windowing process.
- the DC-notch filter of step S6 is used to remove the low-frequencies of the source signal s.
- the DC-notch filter according to S6 comprises the transfer function:
- fi + fi and f s is the sampling frequency and f c the cut-off frequency in Hz, at which an output power of the DC-notch filter is reduced to 50% of the input power (-3dB).
- the filter implementation in time-domain is:
- Sf [n] s[n] - s [n-1] + a ⁇ Sf[n-1] including the source signal s, the DC-filtered signal Sf as an output signal of step S6 and n as the n th input sample.
- a sampling frequency of 8 kHz and a cut-off frequency of 500 Hz a is approximately 0.94.
- the output signal of the DC-notch filter Sf does not comprise low frequency components as shown in Fig. 4.
- step S7 is a window function.
- the DC filtered signal Sf is multiplied by a window function 32.
- the window function 32 attenuates possible
- the window duration needs to be at least 50 msec.
- a Harming window function is used:
- L depends on the sampling frequency, wherein L is 400 for a sampling frequency of 8 kHz and 50 msec duration.
- the signal s w is transformed from the time-domain to the frequency-domain in step S8.
- This transformation comprises a Discrete Fourier Transformation (DFT) to provide a spectrum S of the signal s w .
- DFT Discrete Fourier Transformation
- the transformation function of the Discrete Fourier Transformation is given by:
- a radix-2 FFT is used.
- the size M of the DFT has the power of 2 and is closest to, but not smaller than L.
- M is set to 512.
- step S9 the magnitude spectrum of the frequency spectrum S is calculated. Since s w is a real value signal and S is symmetric around zero, only the positive axis is used for the calculation of the magnitude.
- the formula of the Fourier Transformation mentioned above can be rewritten as:
- step S9 The magnitude is calculated in step S9 by the formula:
- the square-root operation emphasizes the harmonics of the pitch and attenuates the influence of the spectral envelope, e.g. like the formants in a speech signal.
- the output signal of the compression of S10 is a compressed magnitude spectrum S c .
- step SI 1 the compressed magnitude spectrum S c is windowed in the frequency-domain to attenuate noisy high frequency components preferably by using the right half of a Harming window:
- N determines the size of the pass-band.
- the window function of S 10 is shown at 34.
- the output signal of step SI 1 is the windowed compressed magnitude spectrum S w as shown in Fig. 4.
- the windowed compressed magnitude spectrum S w is transformed in step S12 to the time-domain using an Inverse Fourier Transformation (IFT).
- IFT Inverse Fourier Transformation
- This transformation to the time-domain is used to obtain the correlation signal c, that comprises peaks at multiples of the pitch period as shown in Fig. 4.
- step S13 the correlation signal c is windowed to further attenuate the effect of spectral envelope.
- the output signal of step S 13 is a windowed correlation signal c w .
- a combined spectrum b is formed by multiplying the compressed magnitude spectrum S c and the attenuated correlation signal c w .
- This combined spectrum b has a distinct peak at the fundamental frequency.
- the higher harmonics in the frequency spectra and the multiples of the pitch periods are attenuated, wherein the fundamental frequency and/or the pitch remains as a predominant peak.
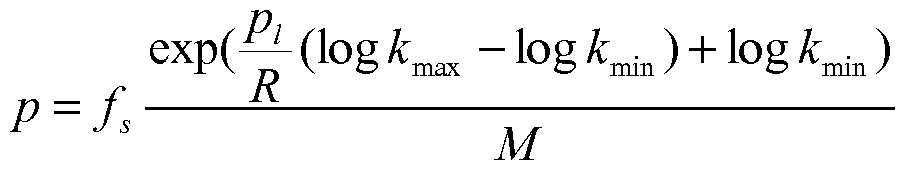
- resampling of at least one of the spectra may be used, since the axes are inversely proportional, wherein:
- n — .
- the resampling operation is preferably performed by using spline- interpolation:
- n [nj , and [n t ] denotes the quantization operation that removes the fractional part.
- S w the quantized index of !3 ⁇ 4.
- quantized indices as well as the spline coefficients can be pre-calculated and stored in an array to avoid lengthy calculations for the complex log- and exp-operations.
- the resampled spectra, which are combined in S14 are shown in Fig. 4 and denoted by 38, 40.
- a further embodiment of the method for pitch detection is generally denoted by 50.
- the method 50 is similar to the method 30 shown in Fig. 4. Identical steps and signals are denoted by identical reference signs, wherein just the differences are explained in detail.
- the method 50 is preferably used to find the pitch of the source signal s when the fundamental frequency is missing. In cases when high-pass filters are applied to the signal prior to the pitch detection, e.g. like telephone speech, the fundamental frequency is lost. The method 50 is provided to bring back the fundamental frequency without degrading the performance for non- filtered signals.
- the method 50 comprises a separate path 52 to provide a rectified spectrum of the DC-filtered signal Sf.
- the DC-filter signal Sf is rectified in step S16 to provide the rectified signal r.
- the DC-filtered signal Sf is full-wave rectified by means of a full-wave rectifier.
- the rectifying step S16 is followed by the steps S6' to S10' to provide a rectified compressed magnitude spectrum R c of the rectified signal.
- the steps S6' to S10' are identical with steps S6 to S10 as described above.
- step S 17 the compressed magnitude spectrum S c of the non-rectified signal Sf and the rectified compressed magnitude spectrum R ⁇ are combined.
- the rectified compressed magnitude spectrum of the rectified signal r and the non-rectified signal s are combined, wherein the maximum of these spectra is selected according to the formula:
- the output signal of S17 is R c ', the maximum of the compressed magnitude spectrum of the rectified signal and the non-rectified signal.
- the output signal of S 17 is combined with the attenuated correlation signal c w in step S14 as described above.
- Fig. 6 shows a schematic block diagram of an embodiment of the processing unit 26 as shown in Fig. 3.
- the processing unit 26 according to Fig. 6 comprises certain discrete elements or devices, which are provided to perform the steps of the method according to Fig. 4.
- the input 22 is connected to a DC-notch filter 54 performing step S6.
- the DC- notch filter 54 is connected to a windowing element 56 performing step S7.
- the windowing element 56 is connected to a Fourier Transformation element 58 performing step S8.
- the Fourier Transformation element 58 is connected to a magnitude element 60 provided to calculate the magnitude according to step S9.
- the magnitude element 60 is connected to a root operation element 62, which performs step S10.
- the root operation element 62 is connected to a windowing element 64, which is provided to perform step SI 1.
- the windowing element 64 is connected to an Inverse Fourier Transformation element 66, which is provided to perform S12.
- the Inverse Fourier Transformation element is connected to a windowing element 68, which is provided to perform S13.
- the windowing element 68 is connected to the combination element 70, which is provided to perform S14.
- the root operation element 62 is also connected to the combination element 70 to provide the compressed magnitude spectrum S c to the combination element 70.
- the combination element 70 is connected to a peak position detector element 72, which is provided to perform step SI 5.
- the peak position detection element 72 is connected to the output of the processing unit 26 to provide the pitch p to the output 24.
- Fig. 7 shows a schematic block diagram of an embodiment of the processing unit 26 as shown in Fig. 6. Reference is made to Fig. 6, wherein identical steps, elements and signals are denoted by identical reference signs and just the differences are explained in detail.
- the processing unit 26 according to Fig. 7 comprises certain discrete elements or devices, which are provided to perform the steps of the method according to Fig. 5.
- the processing unit 26 of Fig. 7 comprises an additional parallel path 74 to provide a rectified compressed magnitude spectrum of the source signal s.
- the path 74 performs the steps of path 52 shown in Fig. 5.
- Path 74 comprises a rectifier 76, which is connected to the DC notch filter 54, to perform step SI 6.
- the rectifier 76 is connected to a cascade of the elements 54', 56', 58', 60' and 62' which are identical with elements 54, 56, 58, 60 and 62, respectively, to perform the steps S6', ST, S8', S9' and S10'.
- the root operation elements 62 and 62' are connected to a maximum determining element 78 performing step SI 7.
- the maximum determining element 78 is connected to the combination element 70 performing step S14.
- Fig. 8 shows a schematic block diagram of an embodiment of the processing unit 26 as shown in Fig. 3 to perform the method according to Fig. 1.
- the processing unit 26 is also called “device” or "system”.
- the processing unit 26 comprises a first transformation unit 80 to perform step SI, a processing unit 82 to perform step S2, a second transformation unit 84 to perform step S3, a combination unit 86 to perform step S4 and an estimation unit 88 to perform step S5.
- the steps of the methods 10, 30 and 50 can be carried out by discrete elements in the processing unit 26 as mentioned above.
- the steps of the methods 10, 30 and 50 can be carried out by the processing unit 26, which can be implemented by an integrated circuit, like a FPGA or an ASIC or the like or which can be implemented by software running on a computer or control unit.
- a computer program may be stored/distributed on a suitable medium, such as an optical storage medium or a solid-state medium supplied together with or as part of other hardware, but may also be distributed in other forms, such as via the Internet or other wired or wireless telecommunication systems.
- a suitable medium such as an optical storage medium or a solid-state medium supplied together with or as part of other hardware, but may also be distributed in other forms, such as via the Internet or other wired or wireless telecommunication systems.
Abstract
Description


Claims
Priority Applications (6)
| Application Number | Priority Date | Filing Date | Title |
|---|---|---|---|
| EP11785135.2A EP2638541A1 (en) | 2010-11-10 | 2011-11-07 | Method and device for estimating a pattern in a signal |
| CN201180054354.9A CN103189916B (en) | 2010-11-10 | 2011-11-07 | The method and apparatus of estimated signal pattern |
| JP2013538309A JP5992427B2 (en) | 2010-11-10 | 2011-11-07 | Method and apparatus for estimating a pattern related to pitch and / or fundamental frequency in a signal |
| US13/883,647 US9208799B2 (en) | 2010-11-10 | 2011-11-07 | Method and device for estimating a pattern in a signal |
| RU2013126409/08A RU2587652C2 (en) | 2010-11-10 | 2011-11-07 | Method and apparatus for evaluation of structure in signal |
| BR112013011312A BR112013011312A2 (en) | 2010-11-10 | 2011-11-07 | method for estimating a pattern in a signal (s) having a periodic, semiperiodic or virtually periodic component, device for estimating a pattern in a signal (s) having a periodic, semiperiodic or virtually periodic component and computer program |
Applications Claiming Priority (2)
| Application Number | Priority Date | Filing Date | Title |
|---|---|---|---|
| EP10190709.5 | 2010-11-10 | ||
| EP10190709 | 2010-11-10 |
Publications (1)
| Publication Number | Publication Date |
|---|---|
| WO2012063185A1 true WO2012063185A1 (en) | 2012-05-18 |
Family
ID=44999842
Family Applications (1)
| Application Number | Title | Priority Date | Filing Date |
|---|---|---|---|
| PCT/IB2011/054951 WO2012063185A1 (en) | 2010-11-10 | 2011-11-07 | Method and device for estimating a pattern in a signal |
Country Status (7)
| Country | Link |
|---|---|
| US (1) | US9208799B2 (en) |
| EP (1) | EP2638541A1 (en) |
| JP (1) | JP5992427B2 (en) |
| CN (1) | CN103189916B (en) |
| BR (1) | BR112013011312A2 (en) |
| RU (1) | RU2587652C2 (en) |
| WO (1) | WO2012063185A1 (en) |
Cited By (2)
| Publication number | Priority date | Publication date | Assignee | Title |
|---|---|---|---|---|
| JP2014157261A (en) * | 2013-02-15 | 2014-08-28 | Nippon Telegr & Teleph Corp <Ntt> | Sound source separating device, sound source separating method, and program |
| EP3888542A1 (en) | 2020-04-01 | 2021-10-06 | Koninklijke Philips N.V. | Inductive sensing system and method |
Families Citing this family (8)
| Publication number | Priority date | Publication date | Assignee | Title |
|---|---|---|---|---|
| WO2012103686A1 (en) * | 2011-02-01 | 2012-08-09 | Huawei Technologies Co., Ltd. | Method and apparatus for providing signal processing coefficients |
| CN110491401B (en) | 2014-05-01 | 2022-10-21 | 日本电信电话株式会社 | Periodic synthetic envelope sequence generating apparatus, method, and recording medium |
| EP3121814A1 (en) * | 2015-07-24 | 2017-01-25 | Sound object techology S.A. in organization | A method and a system for decomposition of acoustic signal into sound objects, a sound object and its use |
| US9717424B2 (en) | 2015-10-19 | 2017-08-01 | Garmin Switzerland Gmbh | System and method for generating a PPG signal |
| CN109493880A (en) * | 2016-01-22 | 2019-03-19 | 大连民族大学 | A kind of method of harmonic signal fundamental frequency preliminary screening |
| EP3396670B1 (en) * | 2017-04-28 | 2020-11-25 | Nxp B.V. | Speech signal processing |
| KR101944429B1 (en) * | 2018-11-15 | 2019-01-30 | 엘아이지넥스원 주식회사 | Method for frequency analysis and apparatus supporting the same |
| CN110197666B (en) * | 2019-05-30 | 2022-05-10 | 广东工业大学 | Voice recognition method and device based on neural network |
Citations (1)
| Publication number | Priority date | Publication date | Assignee | Title |
|---|---|---|---|---|
| US6018706A (en) * | 1996-01-26 | 2000-01-25 | Motorola, Inc. | Pitch determiner for a speech analyzer |
Family Cites Families (29)
| Publication number | Priority date | Publication date | Assignee | Title |
|---|---|---|---|---|
| US3617636A (en) | 1968-09-24 | 1971-11-02 | Nippon Electric Co | Pitch detection apparatus |
| US3622966A (en) * | 1970-07-17 | 1971-11-23 | Atlantic Richfield Co | Wavelet standardization |
| US4720802A (en) * | 1983-07-26 | 1988-01-19 | Lear Siegler | Noise compensation arrangement |
| NL8400552A (en) | 1984-02-22 | 1985-09-16 | Philips Nv | SYSTEM FOR ANALYZING HUMAN SPEECH. |
| GB2165654B (en) * | 1984-10-12 | 1988-05-25 | Yue Lin Thomas Hong | Method and apparatus for evaluating auditory distortions of an audio system |
| US5781880A (en) | 1994-11-21 | 1998-07-14 | Rockwell International Corporation | Pitch lag estimation using frequency-domain lowpass filtering of the linear predictive coding (LPC) residual |
| US5864795A (en) * | 1996-02-20 | 1999-01-26 | Advanced Micro Devices, Inc. | System and method for error correction in a correlation-based pitch estimator |
| US5946650A (en) * | 1997-06-19 | 1999-08-31 | Tritech Microelectronics, Ltd. | Efficient pitch estimation method |
| JP2001500285A (en) * | 1997-07-11 | 2001-01-09 | コーニンクレッカ フィリップス エレクトロニクス エヌ ヴィ | Transmitter and decoder with improved speech encoder |
| KR100269216B1 (en) * | 1998-04-16 | 2000-10-16 | 윤종용 | Pitch determination method with spectro-temporal auto correlation |
| US6459914B1 (en) * | 1998-05-27 | 2002-10-01 | Telefonaktiebolaget Lm Ericsson (Publ) | Signal noise reduction by spectral subtraction using spectrum dependent exponential gain function averaging |
| US6067511A (en) * | 1998-07-13 | 2000-05-23 | Lockheed Martin Corp. | LPC speech synthesis using harmonic excitation generator with phase modulator for voiced speech |
| US6470311B1 (en) * | 1999-10-15 | 2002-10-22 | Fonix Corporation | Method and apparatus for determining pitch synchronous frames |
| AU2001294974A1 (en) * | 2000-10-02 | 2002-04-15 | The Regents Of The University Of California | Perceptual harmonic cepstral coefficients as the front-end for speech recognition |
| RU2234746C2 (en) * | 2002-10-30 | 2004-08-20 | Пермский государственный университет | Method for narrator-independent recognition of speech sounds |
| US7272551B2 (en) * | 2003-02-24 | 2007-09-18 | International Business Machines Corporation | Computational effectiveness enhancement of frequency domain pitch estimators |
| WO2005031704A1 (en) * | 2003-09-29 | 2005-04-07 | Koninklijke Philips Electronics N.V. | Encoding audio signals |
| KR100653643B1 (en) * | 2006-01-26 | 2006-12-05 | 삼성전자주식회사 | Method and apparatus for detecting pitch by subharmonic-to-harmonic ratio |
| US20090018824A1 (en) * | 2006-01-31 | 2009-01-15 | Matsushita Electric Industrial Co., Ltd. | Audio encoding device, audio decoding device, audio encoding system, audio encoding method, and audio decoding method |
| US7778831B2 (en) * | 2006-02-21 | 2010-08-17 | Sony Computer Entertainment Inc. | Voice recognition with dynamic filter bank adjustment based on speaker categorization determined from runtime pitch |
| BRPI0712625B1 (en) * | 2006-06-30 | 2023-10-10 | Fraunhofer - Gesellschaft Zur Forderung Der Angewandten Forschung E.V | AUDIO CODER, AUDIO DECODER, AND AUDIO PROCESSOR HAVING A DYNAMICALLY VARIABLE DISTORTION ("WARPING") CHARACTERISTICS |
| CN100541609C (en) * | 2006-09-18 | 2009-09-16 | 华为技术有限公司 | A kind of method and apparatus of realizing open-loop pitch search |
| WO2008072737A1 (en) * | 2006-12-15 | 2008-06-19 | Panasonic Corporation | Encoding device, decoding device, and method thereof |
| EP1944754B1 (en) * | 2007-01-12 | 2016-08-31 | Nuance Communications, Inc. | Speech fundamental frequency estimator and method for estimating a speech fundamental frequency |
| JP5133401B2 (en) * | 2007-04-26 | 2013-01-30 | ドルビー・インターナショナル・アクチボラゲット | Output signal synthesis apparatus and synthesis method |
| CN101599272B (en) * | 2008-12-30 | 2011-06-08 | 华为技术有限公司 | Keynote searching method and device thereof |
| US20100223061A1 (en) * | 2009-02-27 | 2010-09-02 | Nokia Corporation | Method and Apparatus for Audio Coding |
| CN101853240B (en) | 2009-03-31 | 2012-07-04 | 华为技术有限公司 | Signal period estimation method and device |
| EP2249333B1 (en) * | 2009-05-06 | 2014-08-27 | Nuance Communications, Inc. | Method and apparatus for estimating a fundamental frequency of a speech signal |
-
2011
- 2011-11-07 BR BR112013011312A patent/BR112013011312A2/en not_active IP Right Cessation
- 2011-11-07 US US13/883,647 patent/US9208799B2/en active Active
- 2011-11-07 EP EP11785135.2A patent/EP2638541A1/en not_active Withdrawn
- 2011-11-07 JP JP2013538309A patent/JP5992427B2/en active Active
- 2011-11-07 RU RU2013126409/08A patent/RU2587652C2/en not_active IP Right Cessation
- 2011-11-07 CN CN201180054354.9A patent/CN103189916B/en active Active
- 2011-11-07 WO PCT/IB2011/054951 patent/WO2012063185A1/en active Application Filing
Patent Citations (1)
| Publication number | Priority date | Publication date | Assignee | Title |
|---|---|---|---|---|
| US6018706A (en) * | 1996-01-26 | 2000-01-25 | Motorola, Inc. | Pitch determiner for a speech analyzer |
Non-Patent Citations (5)
| Title |
|---|
| B.E. BONGART ET AL.: "Proceedings of the Symposium on Time Series Analysis", 1963, WILEY, article "The Frequency Analysis of Time Series for Echos: Cepstrum, Pseudoautocovariants, Cross-Cepstrum and Saphe Cracking", pages: 209 - 243 |
| C.H. CHEN: "Signal Processing Handbook", 1988, DEKKER, pages: 531 |
| D.J. HERMES: "Measurement of pitch by subharmonic summation", JOURNAL OF THE ACOUSTIC SOCIETY OF AMERICA, vol. 83, 1988, pages 257 - 264, XP002027082, DOI: doi:10.1121/1.396427 |
| R. BRACEWELL: "The Fourier Transform and Its Applications", 1965, MACGRAW-HILL, article "The Autocorrelation Function", pages: 40 - 45 |
| R. TAORI ET AL.: "Harmony-1: A Versatile Low Bit Rate Speech Coding System", NAT. LAB. TECHNICAL NOTE 157/97 |
Cited By (3)
| Publication number | Priority date | Publication date | Assignee | Title |
|---|---|---|---|---|
| JP2014157261A (en) * | 2013-02-15 | 2014-08-28 | Nippon Telegr & Teleph Corp <Ntt> | Sound source separating device, sound source separating method, and program |
| EP3888542A1 (en) | 2020-04-01 | 2021-10-06 | Koninklijke Philips N.V. | Inductive sensing system and method |
| WO2021197855A1 (en) | 2020-04-01 | 2021-10-07 | Koninklijke Philips N.V. | Inductive sensing system and method |
Also Published As
| Publication number | Publication date |
|---|---|
| RU2013126409A (en) | 2014-12-20 |
| EP2638541A1 (en) | 2013-09-18 |
| RU2587652C2 (en) | 2016-06-20 |
| BR112013011312A2 (en) | 2019-09-24 |
| JP5992427B2 (en) | 2016-09-14 |
| JP2013542469A (en) | 2013-11-21 |
| US9208799B2 (en) | 2015-12-08 |
| US20130231926A1 (en) | 2013-09-05 |
| CN103189916A (en) | 2013-07-03 |
| CN103189916B (en) | 2015-11-25 |
Similar Documents
| Publication | Publication Date | Title |
|---|---|---|
| US9208799B2 (en) | Method and device for estimating a pattern in a signal | |
| US10510363B2 (en) | Pitch detection algorithm based on PWVT | |
| CN102054480B (en) | Method for separating monaural overlapping speeches based on fractional Fourier transform (FrFT) | |
| JP2002527785A (en) | Method and system for updating a noise estimate during a pause in an information signal | |
| KR20130057668A (en) | Voice recognition apparatus based on cepstrum feature vector and method thereof | |
| Tan et al. | Noise-robust F0 estimation using SNR-weighted summary correlograms from multi-band comb filters | |
| BRPI0208584B1 (en) | method for forming speech recognition parameters | |
| Gowda et al. | AM-FM based filter bank analysis for estimation of spectro-temporal envelopes and its application for speaker recognition in noisy reverberant environments. | |
| Nasr et al. | Efficient implementation of adaptive wiener filter for pitch detection from noisy speech signals | |
| JP2880683B2 (en) | Noise suppression device | |
| Rao et al. | A comparative study of various pitch detection algorithms | |
| JP7461192B2 (en) | Fundamental frequency estimation device, active noise control device, fundamental frequency estimation method, and fundamental frequency estimation program | |
| Rahman et al. | Pitch determination using autocorrelation function in spectral domain. | |
| CN110189765B (en) | Speech feature estimation method based on spectrum shape | |
| CN109346106B (en) | Cepstrum domain pitch period estimation method based on sub-band signal-to-noise ratio weighting | |
| Cui | Pitch extraction based on weighted autocorrelation function in speech signal processing | |
| Wiriyarattanakul et al. | Accuracy Improvement of MFCC Based Speech Recognition by Preventing DFT Leakage Using Pitch Segmentation | |
| Hamid et al. | A Collelogram based Pitch and Voiced/Unvoiced Classification Method for Real-Time Speech Analysis in Noisy Environment | |
| JP2898637B2 (en) | Audio signal analysis method | |
| Shimamura et al. | Noise estimation with an inverse comb filter in non-stationary noise environments | |
| Reju et al. | A computationally efficient noise estimation algorithm for speech enhancement | |
| Skariah et al. | Single channel speech segregation using cepstrum method | |
| JP2002258893A (en) | Noise-estimating device, noise eliminating device and storage medium | |
| JP2003044068A (en) | Voice analyzing method | |
| JP2011180417A (en) | Device and method for estimating pitch of music acoustic signal |
Legal Events
| Date | Code | Title | Description |
|---|---|---|---|
| 121 | Ep: the epo has been informed by wipo that ep was designated in this application |
Ref document number: 11785135 Country of ref document: EP Kind code of ref document: A1 |
|
| WWE | Wipo information: entry into national phase |
Ref document number: 2011785135 Country of ref document: EP |
|
| WWE | Wipo information: entry into national phase |
Ref document number: 13883647 Country of ref document: US |
|
| ENP | Entry into the national phase |
Ref document number: 2013538309 Country of ref document: JP Kind code of ref document: A |
|
| NENP | Non-entry into the national phase |
Ref country code: DE |
|
| ENP | Entry into the national phase |
Ref document number: 2013126409 Country of ref document: RU Kind code of ref document: A |
|
| REG | Reference to national code |
Ref country code: BR Ref legal event code: B01A Ref document number: 112013011312 Country of ref document: BR |
|
| ENP | Entry into the national phase |
Ref document number: 112013011312 Country of ref document: BR Kind code of ref document: A2 Effective date: 20130508 |