WO2010044385A1 - 超音波診断装置、及び超音波画像表示方法 - Google Patents
超音波診断装置、及び超音波画像表示方法 Download PDFInfo
- Publication number
- WO2010044385A1 WO2010044385A1 PCT/JP2009/067696 JP2009067696W WO2010044385A1 WO 2010044385 A1 WO2010044385 A1 WO 2010044385A1 JP 2009067696 W JP2009067696 W JP 2009067696W WO 2010044385 A1 WO2010044385 A1 WO 2010044385A1
- Authority
- WO
- WIPO (PCT)
- Prior art keywords
- frame data
- unit
- boundary
- elastic
- image
- Prior art date
- Legal status (The legal status is an assumption and is not a legal conclusion. Google has not performed a legal analysis and makes no representation as to the accuracy of the status listed.)
- Ceased
Links
Images





Classifications
-
- A—HUMAN NECESSITIES
- A61—MEDICAL OR VETERINARY SCIENCE; HYGIENE
- A61B—DIAGNOSIS; SURGERY; IDENTIFICATION
- A61B8/00—Diagnosis using ultrasonic, sonic or infrasonic waves
- A61B8/08—Clinical applications
-
- A—HUMAN NECESSITIES
- A61—MEDICAL OR VETERINARY SCIENCE; HYGIENE
- A61B—DIAGNOSIS; SURGERY; IDENTIFICATION
- A61B5/00—Measuring for diagnostic purposes; Identification of persons
- A61B5/0048—Detecting, measuring or recording by applying mechanical forces or stimuli
-
- A—HUMAN NECESSITIES
- A61—MEDICAL OR VETERINARY SCIENCE; HYGIENE
- A61B—DIAGNOSIS; SURGERY; IDENTIFICATION
- A61B8/00—Diagnosis using ultrasonic, sonic or infrasonic waves
- A61B8/46—Ultrasonic, sonic or infrasonic diagnostic devices with special arrangements for interfacing with the operator or the patient
- A61B8/461—Displaying means of special interest
- A61B8/463—Displaying means of special interest characterised by displaying multiple images or images and diagnostic data on one display
-
- A—HUMAN NECESSITIES
- A61—MEDICAL OR VETERINARY SCIENCE; HYGIENE
- A61B—DIAGNOSIS; SURGERY; IDENTIFICATION
- A61B8/00—Diagnosis using ultrasonic, sonic or infrasonic waves
- A61B8/48—Diagnostic techniques
- A61B8/485—Diagnostic techniques involving measuring strain or elastic properties
-
- G—PHYSICS
- G01—MEASURING; TESTING
- G01S—RADIO DIRECTION-FINDING; RADIO NAVIGATION; DETERMINING DISTANCE OR VELOCITY BY USE OF RADIO WAVES; LOCATING OR PRESENCE-DETECTING BY USE OF THE REFLECTION OR RERADIATION OF RADIO WAVES; ANALOGOUS ARRANGEMENTS USING OTHER WAVES
- G01S7/00—Details of systems according to groups G01S13/00, G01S15/00, G01S17/00
- G01S7/52—Details of systems according to groups G01S13/00, G01S15/00, G01S17/00 of systems according to group G01S15/00
- G01S7/52017—Details of systems according to groups G01S13/00, G01S15/00, G01S17/00 of systems according to group G01S15/00 particularly adapted to short-range imaging
- G01S7/52023—Details of receivers
- G01S7/52036—Details of receivers using analysis of echo signal for target characterisation
-
- G—PHYSICS
- G01—MEASURING; TESTING
- G01S—RADIO DIRECTION-FINDING; RADIO NAVIGATION; DETERMINING DISTANCE OR VELOCITY BY USE OF RADIO WAVES; LOCATING OR PRESENCE-DETECTING BY USE OF THE REFLECTION OR RERADIATION OF RADIO WAVES; ANALOGOUS ARRANGEMENTS USING OTHER WAVES
- G01S7/00—Details of systems according to groups G01S13/00, G01S15/00, G01S17/00
- G01S7/52—Details of systems according to groups G01S13/00, G01S15/00, G01S17/00 of systems according to group G01S15/00
- G01S7/52017—Details of systems according to groups G01S13/00, G01S15/00, G01S17/00 of systems according to group G01S15/00 particularly adapted to short-range imaging
- G01S7/52023—Details of receivers
- G01S7/52036—Details of receivers using analysis of echo signal for target characterisation
- G01S7/52042—Details of receivers using analysis of echo signal for target characterisation determining elastic properties of the propagation medium or of the reflective target
-
- G—PHYSICS
- G01—MEASURING; TESTING
- G01S—RADIO DIRECTION-FINDING; RADIO NAVIGATION; DETERMINING DISTANCE OR VELOCITY BY USE OF RADIO WAVES; LOCATING OR PRESENCE-DETECTING BY USE OF THE REFLECTION OR RERADIATION OF RADIO WAVES; ANALOGOUS ARRANGEMENTS USING OTHER WAVES
- G01S7/00—Details of systems according to groups G01S13/00, G01S15/00, G01S17/00
- G01S7/52—Details of systems according to groups G01S13/00, G01S15/00, G01S17/00 of systems according to group G01S15/00
- G01S7/52017—Details of systems according to groups G01S13/00, G01S15/00, G01S17/00 of systems according to group G01S15/00 particularly adapted to short-range imaging
- G01S7/52053—Display arrangements
- G01S7/52057—Cathode ray tube displays
- G01S7/52074—Composite displays, e.g. split-screen displays; Combination of multiple images or of images and alphanumeric tabular information
-
- G—PHYSICS
- G06—COMPUTING OR CALCULATING; COUNTING
- G06T—IMAGE DATA PROCESSING OR GENERATION, IN GENERAL
- G06T7/00—Image analysis
- G06T7/10—Segmentation; Edge detection
- G06T7/13—Edge detection
-
- G—PHYSICS
- G06—COMPUTING OR CALCULATING; COUNTING
- G06T—IMAGE DATA PROCESSING OR GENERATION, IN GENERAL
- G06T2207/00—Indexing scheme for image analysis or image enhancement
- G06T2207/10—Image acquisition modality
- G06T2207/10132—Ultrasound image
-
- G—PHYSICS
- G06—COMPUTING OR CALCULATING; COUNTING
- G06T—IMAGE DATA PROCESSING OR GENERATION, IN GENERAL
- G06T2207/00—Indexing scheme for image analysis or image enhancement
- G06T2207/30—Subject of image; Context of image processing
- G06T2207/30004—Biomedical image processing
Definitions
- the present invention relates to an ultrasonic diagnostic apparatus and an ultrasonic image display method for obtaining a tomographic image of a diagnostic site in a subject using ultrasonic waves, and more particularly to calculating strain and / or elastic modulus from RF signal frame data,
- the present invention relates to an ultrasonic diagnostic apparatus and an ultrasonic image display method for displaying an elastic image indicating the hardness or softness of a tissue.
- the ultrasonic diagnostic apparatus transmits ultrasonic waves inside the subject using an ultrasonic probe, and constructs and displays, for example, a tomographic image based on a received signal received from a living tissue inside the subject.
- the reception signal received from the living tissue inside the subject is measured by the ultrasonic probe, and the displacement of each part of the living body is obtained from two RF signal frame data having different measurement times.
- an elastic image indicating the elastic modulus of the living tissue is constructed from elastic frame data based on the displacement data.
- Elastic images are suitable for detecting harder and softer parts of living tissue than surrounding tissues.
- the tomographic image is an image of the difference in acoustic impedance of the living tissue, and is suitable for observing the structure and form of the tissue from the difference in luminance value and the roughness of speckle.
- an object of the present invention is to provide an ultrasonic diagnostic apparatus and an ultrasonic image display method capable of recognizing a region (boundary portion) having elastic information to be noticed.
- the present invention is configured as follows.
- a histogram based on the frequency of elastic information strain, elastic modulus, viscosity, Poisson's ratio, etc.
- strain, elastic modulus, viscosity, Poisson's ratio, etc. is obtained, the boundary portion of the periphery of the region of interest set based on a predetermined range of elastic information is detected, and the boundary portion is displayed. Therefore, the examiner can observe in detail the speckle state and the shading state in the boundary portion.
- the image display unit displays the boundary portion on a tomographic image or an elastic image.
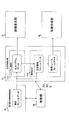
- FIG. 1 is a block diagram showing the overall configuration of an ultrasonic diagnostic apparatus according to each embodiment of the present invention.
- the figure which shows embodiment of the attention area detection part which concerns on this invention. The figure which shows the display form which concerns on this invention.
- the figure which shows the display form which concerns on this invention The figure which shows the form which selects the area
- the figure which shows attention area frame data based on this invention.
- the figure which shows 3rd Embodiment which concerns on this invention. The figure which shows 3rd Embodiment which concerns on this invention.
- the figure which shows 4th Embodiment which concerns on this invention. The figure which shows 4th Embodiment which concerns on this invention.
- FIG. 1 is a block diagram of an ultrasonic diagnostic apparatus according to the present invention.
- An ultrasonic diagnostic apparatus obtains a tomographic image of a diagnostic region of a subject using ultrasonic waves and displays an elastic image representing the hardness or softness of a living tissue.
- the ultrasonic diagnostic apparatus includes an ultrasonic probe 1 that is used in contact with a subject, a transmission unit 2 that repeatedly transmits ultrasonic waves to the subject via the ultrasonic probe 1 at time intervals, Received by the receiving unit 3 that receives a time-series reflected echo signal generated from the subject, an ultrasonic transmission / reception control unit 4 that performs control to switch between transmission and reception of the transmitting unit 2 and the receiving unit 3, and received by the receiving unit 3
- a phasing addition unit 5 that performs phasing addition of the reflected echo signal
- a tomographic image configuration unit 6 that obtains tomographic image frame data from the RF signal frame data from the phasing addition unit 5, and a coordinate system conversion of the tomographic image frame data
- the ultrasonic diagnostic apparatus includes an RF signal frame data selection unit 8 that selects at least two RF signal frame data, and a displacement measurement that measures the displacement of the living tissue of the subject from the selected at least two RF signal frame data.
- Unit 9 an elastic information calculation unit 10 that obtains elastic information such as strain or elastic modulus from the displacement information measured by the displacement measuring unit 9, and an elastic image configuration unit 12 that constitutes elastic image frame data from the strain or elastic modulus
- an attention area detection unit 11 for detecting an attention area using histogram data of elasticity information such as strain or elastic modulus
- tomographic image frame data A switching composition unit 14 that synthesizes elastic image frame data, etc., displays in parallel, or performs switching, and a tomographic image, elastic image, tomographic image
- An image display unit 15 for displaying a composite image which the elastic images are synthesized, and a control unit 16 for controlling the respective constituent elements, and an operation unit 17 sends the instruction of the
- the ultrasonic probe 1 is formed by arranging a large number of transducers that receive reflected echoes in a strip shape as well as an ultrasonic generation source.
- the transducer is mechanically or electronically beam scanned, and the transducer transmits and receives ultrasonic waves to the subject.
- a transducer converts the input pulse wave or continuous wave transmission signal into an ultrasonic wave and emits it, and receives the ultrasonic wave emitted from the inside of the subject and converts it into an electrical signal. And has a function of outputting.
- the compression operation of the subject using elasticity using ultrasonic waves gives a stress distribution to the diagnosis site of the subject while performing ultrasonic transmission / reception with the ultrasonic probe 1.
- a compression plate is attached to the ultrasonic transmission / reception surface of the ultrasonic probe 1, and the compression surface composed of the ultrasonic transmission / reception surface and the compression plate of the ultrasonic probe 1 is used manually.
- the subject is moved up and down to press the subject.
- the ultrasonic transmission / reception control unit 4 controls the timing for transmitting and receiving ultrasonic waves.
- the transmitting unit 2 drives the ultrasonic probe 1 to generate a transmission pulse for generating an ultrasonic wave, and sets a convergence point of the transmitted ultrasonic wave to a certain depth.
- the receiving unit 3 amplifies the reception signal received by the ultrasonic probe 1 with a predetermined gain. A number of received signals corresponding to the number of amplified transducers are input to the phasing adder 5 as independent received signals.
- the phasing / adding unit 5 controls the phase of the reception signal amplified by the receiving unit 3 to form an ultrasonic beam at one point or a plurality of convergence points.
- the tomographic image construction unit 6 inputs the received signal from the phasing addition unit 5 and performs various signal processing such as gain correction, log correction, detection, contour enhancement, filter processing, etc. to construct the tomographic image frame data It is.
- the black-and-white scan converter 7 controls to read out the tomographic image frame data output from the tomographic image construction unit 6 on the image display unit 15 in a television system cycle.
- the RF signal frame data selection unit 8 stores the RF signal frame data output from the phasing addition unit 5 one after another at the frame rate of the ultrasonic diagnostic apparatus in the frame memory provided in the RF signal frame data selection unit 8.
- the currently reserved RF signal frame data is designated as RF signal frame data N
- Select one RF signal frame data from NM this is RF signal frame data X
- the displacement measuring unit 9 will receive one set of RF signal frame data N and RF signal frame data X. It plays a role to output.
- the signal output from the phasing addition unit 5 is described as RF signal frame data, this may be, for example, a signal in the form of I and Q signals obtained by complex demodulation of the RF signal.
- the displacement measurement unit 9 performs one-dimensional or two-dimensional correlation processing based on a set of RF signal frame data selected by the RF signal frame data selection unit 8, and the displacement or movement vector of each measurement point on the tomographic image (Displacement direction and size) is measured, and displacement frame data is generated.
- a method for detecting this movement vector for example, there is a block matching method described in JP-A-5-317313.
- the block matching method divides the image into blocks consisting of N ⁇ N pixels, for example, searches the previous frame for the block closest to the target block in the current frame, and refers to these to predictive coding Is to do.
- the elasticity information calculation unit 10 calculates the distortion or elastic modulus (elastic information) of each measurement point on the tomographic image from the displacement frame data output from the displacement measurement unit 9, and generates the numerical data (elastic frame data). These are output to the attention area detection unit 11 and the color scan converter 12.
- Elastic information includes viscosity, Poisson's ratio, etc. in addition to strain or elastic modulus.
- the strain calculation performed in the elasticity information calculation unit 10 is obtained by calculation, for example, by spatially differentiating the displacement.
- the Young's modulus Ym which is one of the elastic moduli, is obtained by dividing the stress (pressure) at each calculation point by the strain at each calculation point, as shown in the following equation.
- the indices i and j represent the coordinates of the frame data.
- the pressure applied to the body surface is directly measured by a pressure sensor (not shown) interposed between contact surfaces of the body surface and the compression mechanism.
- a pressure measuring deformable body (not shown) is provided so as to cover the ultrasonic wave transmission / reception surface, and the pressure applied to the body surface of the diagnostic region compressed by the ultrasonic probe 1 from the deformed state is applied. It can also be measured.
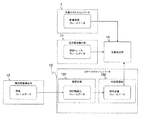
- the attention area detection unit 11 includes a histogram calculation unit 111 and a boundary detection unit 112.
- the histogram calculation unit 111 counts the numerical value of the elasticity information of strain or elastic modulus at each coordinate of the elastic frame data output from the elastic information calculation unit 10, and calculates histogram data based on the frequency with respect to the numerical value.
- the histogram data calculated by the histogram calculation unit 111 is displayed on the image display unit 15.
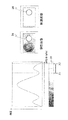
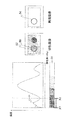
- the display form of the histogram data displayed on the image display unit 15 is shown in FIGS.
- the vertical axis of the histogram data shown in FIGS. 3 and 4 is frequency, and the horizontal axis is elastic modulus.
- the horizontal axis is shown as the elastic modulus, but the horizontal axis may be strain, viscosity, Poisson's ratio, or the like.
- the color bar 20 serves as an index for associating strain or elastic modulus (elastic information) with the hue of the elastic image, and is linked to the color scan converter 13.
- a part having a small strain or a large elastic modulus (for example, 300 kPa or more) compared to the surroundings is colored blue, or a part having a large strain or a small elastic modulus (for example, 100 kPa or less) compared to the surroundings is colored red.
- the hue is set using the color bar 20.
- the examiner arbitrarily designates the lower limit value X1 and the upper limit value X2 of the range in which the boundary trace is performed on the histogram data with the operation unit 17. For example, if it is desired to extract a soft part, the lower limit value X1 and the upper limit value X2 are set on the smaller elastic modulus side as shown in FIG. 3, and if it is desired to extract a hard part, the lower limit value X1 and The upper limit value X2 is set on the side where the elastic modulus is larger.
- the lower limit value X1 and the upper limit value X2 can be designated by selecting the region on the elastic image having the strain or elastic modulus (elastic information) to be noticed. Specifically, as shown in FIG. 5, a region 40 on the elastic image displayed on the image display unit 15 by the operation unit 17 is selected. The region 40 can be arbitrarily deformed in the arrow direction by the operation unit 17. Based on the minimum and maximum values of strain or elastic modulus (elastic information) at each coordinate 42 in the selected region 40 in the elastic frame data output from the elastic information calculation unit 10, the control unit 16 Set X1 and upper limit X2. In this case, the minimum value corresponds to the lower limit value X1, and the maximum value corresponds to the upper limit value X2. Then, the control unit 16 sets the lower limit value X1 and the upper limit value X2 for the histogram data calculated by the histogram calculation unit 111.
- the boundary detection unit 112 creates attention area frame data and boundary trace frame data for tracing the corresponding area using the lower limit value X1 and the upper limit value X2 specified as described above.
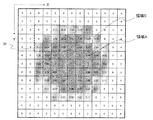
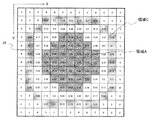
- the boundary detection unit 112 first extracts an area of strain or elastic modulus (elastic information) corresponding to the range from the lower limit value X1 to the upper limit value X2 from the elastic frame data output from the elastic information calculation unit 10, and the attention area frame data Create The created attention area frame data is shown in FIG. Strain or elastic modulus (elastic information) area (area A) corresponding to the range from the lower limit X1 to the upper limit X2 is "1", and the area not corresponding to the range from the lower limit X1 to the upper limit X2 (except area A) “0” is input to, and attention area frame data is created.
- the boundary detection unit 112 creates boundary trace frame data obtained by extracting the boundary part of the periphery of the region A extracted by the attention region frame data.
- FIG. 7 shows the created boundary trace frame data.
- the boundary detection unit 112 extracts the boundary part of the periphery of “1”, which is a strain or elastic modulus (elastic information) region (region A) corresponding to the range of the lower limit value X1 to the upper limit value X2 of the attention region frame data. . “1” is input to the extracted boundary, and “0” is input to the other regions, and boundary trace frame data is created.
- “1” is input to the extracted boundary, and “0” is input to the other regions, and boundary trace frame data is created.
- the boundary detection unit 112 is not a method of creating the region of interest frame data by specifying the lower limit value X1 and the upper limit value X2, but the contour extraction method using the elastic frame data output from the elastic information calculation unit 10, for example, a primary
- the boundary trace frame data may be created by extracting the boundary portion by differentiation, secondary differentiation, or the like.
- the boundary detection unit 112 can also set all the boundary trace frame data to “0” when the trace of the boundary part is unnecessary.
- the elastic image construction unit 12 performs various image processing such as smoothing processing in the coordinate plane and time axis direction smoothing processing between frames on the calculated elastic frame data, and outputs the processed elastic frame data. .
- the color scan converter 13 includes a gradation unit 131 and a hue conversion unit 132 as shown in FIG.
- the operation unit 17 designates a lower limit value Y1 and an upper limit value Y2 as the gradation selection range in the elastic frame data output from the elastic image construction unit 12. Then, the gradation unit 131 gradations the elastic frame data in the range of the designated lower limit value Y1 and upper limit value Y2, and creates elastic gradation frame data.
- the hue conversion unit 132 converts a corresponding region into a red code for a portion having a smaller distortion or a larger elastic modulus than the surroundings.
- the hue conversion unit 132 converts the corresponding region into a blue code for a portion having a larger strain or a smaller elastic modulus than the surroundings. Further, the hue conversion unit 132 converts the area other than the above into black.
- the color scan converter 13 also performs control to read the elastic image frame data whose hue has been converted by the hue converter 132 at a television system cycle.
- the color scan converter 13 may be a black and white scan converter 7.
- the black-and-white scan converter 7 for example, brightens the luminance of the area in the elastic image frame data where the distortion is small or the elastic modulus is large compared to the surroundings, and conversely, the distortion is large or the elastic modulus is large compared to the surroundings. Small portions may be made darker in the area of the elastic image frame data.
- the switching composition unit 14 is tomographic image frame data output from the black and white scan converter 7, elastic image frame data output from the color scan converter 13, and composite image frame data in which the tomographic image frame data and the elastic image frame data are combined.
- the image to be displayed on the image display unit 15 is selected from among them. Further, the switching composition unit 14 superimposes the position of the boundary portion specified by the boundary trace frame data output from the attention area detection unit 11 on the tomographic image frame data, the elastic image frame data, and the composite image frame data. To do. Note that the switching composition unit 14 may display only the boundary part.
- the tomographic image frame data and the elastic image frame data may be arranged in parallel, or the elastic image frame data may be semitransparently superimposed on the tomographic image frame data.
- the tomographic image frame data may be a tissue harmonic tomographic image obtained by imaging the harmonic component of the received signal or a tissue plastic tomographic image.
- the image display unit 15 displays time-series tomographic image frame data obtained by the monochrome scan converter 7, that is, a tomographic image, time-series elastic image frame data obtained by the color scan converter 13, that is, an elastic image, and the like.
- a D / A converter that converts tomographic image frame data, elastic image frame data, and the like into analog signals, and a color television monitor that receives analog video signals from the D / A converter and displays them as images.
- the display form of the image display unit 15 will be described.
- the lower limit value X1 and the upper limit value X2 are designated by the operation unit 17 in the histogram data, and boundary trace frame data is created by extracting the peripheral boundary portion of the attention area frame data.
- the image display unit 15 displays the boundary portion 30 and the boundary portion 34 of the boundary trace frame data on the elastic image via the switching composition unit 14, or displays the boundary portion 32 and the boundary portion 36 of the boundary trace frame data on the tomographic image. Or display above. Therefore, since the region of the strain or elastic modulus of interest is displayed as the boundary portion, the examiner can grasp the inside of the elastic image or tomographic image corresponding to the boundary portion. By displaying the boundary portion, the examiner can observe the shape of the boundary portion, and can determine benign or malignant based on the shape of the boundary portion.
- the examiner can observe in detail the speckle state and the light and dark state in the tomographic image in the boundary portion. Further, if the position of the boundary portion is superimposed on the elastic image frame data and synthesized, the hue state in the elastic image can be observed.
- the lower limit value X1 and the upper limit value X2 are designated in the histogram data by the operation unit 17, and the boundary trace frame data in which the boundary portion of the periphery of the attention area frame data is extracted is created. Further, the boundary trace frame data may be created by setting a lower limit value and extracting a plurality of boundary portions.
- FIG. 1 (Second embodiment: outside small area) A second embodiment will be described with reference to FIGS. 1, 2, and 6.
- FIG. 1 The difference from the first embodiment is that when the extracted attention area (area A) is smaller than the threshold, it is excluded from the boundary trace frame data.
- the boundary detection unit 112 outputs an elastic frame in which an area of strain or elastic modulus (elastic information) corresponding to the range between the lower limit value X1 and the upper limit value X2 is output from the elastic information calculation unit 10. Extract from the data and create attention area frame data. “1” is input to the area of strain or elastic modulus (elastic information) corresponding to the range of the lower limit value X1 to the upper limit value X2, and “0” is input to the area not corresponding to the range of the lower limit value X1 to the upper limit value X2. Attention area frame data is created.
- the boundary detection unit 112 determines that the area or the number of pixels of the region “1” (region A) of the strain or elastic modulus (elastic information) corresponding to the range of the lower limit value X1 to the upper limit value X2 of the attention region frame data is When it is smaller than a threshold S (for example, 10 points) set in advance by the examiner, the attention area (area A) of the corresponding attention area frame data is set to “0”. As described above, when the attention area to be extracted is small, the attention area frame data in the attention area is set to “0” and excluded from the boundary trace frame data. That is, the boundary detection unit 112 does not detect the boundary part of the periphery of the attention region (region A) when the area or the number of pixels of the attention region (region A) is smaller than a preset threshold value.
- a threshold S for example, 10 points
- the boundary trace frame data is not created when the attention area to be extracted is small, the boundary portion that is extracted due to noise or the like can be excluded.
- a third embodiment will be described with reference to FIGS.
- the difference from the first embodiment and the second embodiment is that a boundary is set using a leveling filter.
- the boundary detection unit 112 is “1” in the strain (elasticity information) region (region A) corresponding to the range from the lower limit value X1 to the upper limit value X2, and the lower limit value X1 to “0” is input to an area (other than the area A) that does not fall within the range of the upper limit value X2, and attention area frame data is created. Then, the boundary detection unit 112 creates boundary trace frame data by applying a smoothing filter to the attention area frame data. Specifically, the boundary detection unit 112 includes the number of pixels of “1” included in the 3 ⁇ 3 kernel size two-dimensional area 24 centered on each pixel of the attention area frame data illustrated in FIG. Area), and the number of pixels is divided by the kernel size “9”. Note that the leftmost pixel in the first row of the attention area frame data shown in FIG. 6 is defined as a pixel (1, 1).
- Figure 9 shows the values calculated as above.
- the boundary detection unit 112 performs the calculation for all the pixels of the attention area frame data.
- the boundary detection unit 112 extracts the boundary part of the periphery of the region formed by the region of interest frame data larger than “0”, that is, other than “0”. “1” is input to the extracted boundary, and “0” is input to the other regions, and boundary trace frame data is created. As a result, a region B adjacent to the region A is extracted, and boundary trace frame data in which the annular region B serves as a boundary part is created.
- the boundary detection unit 112 counts the number of “1” included in the two-dimensional area 26 of 5 ⁇ 5 kernel size installed around each pixel of the attention area frame data shown in FIG. Divide the number of pixels by the kernel size of “25”.
- Figure 10 shows the values calculated as above.
- the boundary detection unit 112 performs an operation on all the pixels of the attention area frame data.
- the boundary detection unit 112 extracts the boundary part of the periphery of the region formed by the region of interest frame data larger than “0”, that is, other than “0”. “1” is input to the extracted boundary, and “0” is input to the other regions, and boundary trace frame data is created. As a result, boundary trace frame data in which the annular region C is the boundary is created.
- the boundary part of the area B or the area C of the boundary trace frame data is set outside the boundary part of the periphery of the area A obtained in the first embodiment. Therefore, the tomographic image on the boundary set in the first embodiment can be displayed on the image display unit 15.
- the examiner can observe in detail the speckle state, the light and shade state, etc., in the tomographic image on the boundary set in the first embodiment.
- the black and white scan converter 7 creates tomographic image frame data
- the color scan converter 13 creates elastic image frame data
- the boundary detection unit 112 uses the attention area (area) of the attention area frame data.
- Boundary trace frame data is created by extracting the peripheral edge of A).
- the inspector operates to display only the tomographic image frame data inside the boundary part of the tomographic image frame data, or to display the elastic image frame data in a translucent manner inside the boundary part of the tomographic image frame data. Select in part 17.
- the control unit 16 sends the boundary portions 32 and 36 of the boundary trace frame data to the tomographic image frame data to the switching composition unit 14. And the tomographic image frame data and the elastic image frame data inside the boundary portions 32 and 36 of the tomographic image frame data are instructed to be translucently superimposed. Therefore, the image display unit 15 can display an elastic image inside the boundary portion of the tomographic image.
- the image display unit 15 can also display an elastic image outside the boundary portion of the tomographic image.
- the switching composition unit 14 superimposes the boundary portions 32 and 36 of the boundary trace frame data on the tomographic image frame data, and superimposes the tomographic image frame data and the elastic image frame data on the outside of the boundary portion of the tomographic image frame data. Match.
- the examiner can observe in detail the speckle state, the state of shading, etc. in the tomographic image inside or outside the boundary set in the first embodiment, and the hardness in the elastic image This state can also be observed.
- the histogram calculation unit 111 counts the strain or elastic modulus (elastic information) at each coordinate of the elastic frame data output from the elastic information calculation unit 10 to calculate histogram data.
- the histogram data calculated by the histogram calculation unit 111 is displayed on the image display unit 15.
- the display form of the histogram data displayed on the image display unit 15 is shown in FIGS.
- the boundary detection unit 112 detects the peak of the histogram output from the histogram calculation unit 111. For example, the boundary detection unit 112 differentiates the curve of the histogram, and detects a point (inflection point) where the differential value is “0” and the slope changes from positive to negative as a peak.
- the control unit 16 sets a range of a predetermined width (for example, 50 kPa) around the detected peak 1, for example. Then, the control unit 16 sets the minimum value in the set range as the lower limit value X1, and sets the minimum value in the set range as the upper limit value X2.
- the peak and range can be arbitrarily selected on the console 17.
- the boundary detection unit 112 creates attention area frame data for tracing the corresponding area using the lower limit value X1 and the upper limit value X2 specified as described above, Create boundary trace frame data.
- the image display unit 15 may display the boundary part 50 of the boundary trace frame data on the elastic image or display the boundary part 54 of the boundary trace frame data on the tomographic image via the switching composition unit 14. it can.
- the region of interest 52 is locally included in the boundary 50.
- the attention area 52 has a lower elastic modulus than the surrounding area.
- the control unit 16 has a width smaller than the predetermined width set above (for example, 20 kPa) around the peak 2 smaller than the peak 1. Set the range. Then, the control unit 16 sets the minimum value in the set range as the lower limit value X1 ′ and sets the minimum value in the set range as the upper limit value X2 ′.
- the boundary detection unit 112 creates attention area frame data for tracing the corresponding area using the lower limit value X1 ′ and the upper limit value X2 ′ specified as described above. Boundary trace frame data is created.
- the image display unit 15 may display the boundary part 56 of the boundary trace frame data on the elastic image or display the boundary part 58 of the boundary trace frame data on the tomographic image via the switching composition unit 14. it can. Therefore, the examiner can also observe the minute area of the attention area 52.
- 1 ultrasonic probe 1 transmission unit, 3 reception unit, 4 ultrasonic transmission / reception control unit, 5 phasing addition unit, 6 tomographic image configuration unit, 7 monochrome scan converter, 8 RF signal frame data selection unit, 9 displacement measurement Unit, 10 elasticity information calculation unit, 11 attention area detection unit, 111 histogram calculation unit, 112 boundary detection unit, 12 elastic image configuration unit, 13 color scan converter, 131 gradation unit, 132 hue conversion unit, 14 switching composition unit , 15 Image display unit, 16 control unit, 17 operation unit
Landscapes
- Health & Medical Sciences (AREA)
- Engineering & Computer Science (AREA)
- Life Sciences & Earth Sciences (AREA)
- Physics & Mathematics (AREA)
- Biomedical Technology (AREA)
- Animal Behavior & Ethology (AREA)
- Veterinary Medicine (AREA)
- General Physics & Mathematics (AREA)
- Biophysics (AREA)
- Public Health (AREA)
- Pathology (AREA)
- General Health & Medical Sciences (AREA)
- Surgery (AREA)
- Heart & Thoracic Surgery (AREA)
- Medical Informatics (AREA)
- Molecular Biology (AREA)
- Computer Networks & Wireless Communication (AREA)
- Remote Sensing (AREA)
- Radiology & Medical Imaging (AREA)
- Nuclear Medicine, Radiotherapy & Molecular Imaging (AREA)
- Radar, Positioning & Navigation (AREA)
- Computer Vision & Pattern Recognition (AREA)
- Theoretical Computer Science (AREA)
- Ultra Sonic Daignosis Equipment (AREA)
Abstract
Description
弾性情報(歪み、弾性率、粘性、ポアソン比等)の頻度に基づくヒストグラムを求め、弾性情報の所定範囲に基づいて設定される注目領域の周縁の境界部を検出し、境界部を表示する。よって、検者は、境界部内のスペックルの状態や濃淡の状態等を詳細に観察することができる。また、画像表示部は、境界部を断層画像又は弾性画像上に表示する。
以下、本発明の実施形態を図面に基づいて説明する。図1は、本発明による超音波診断装置のブロック図である。超音波診断装置は、超音波を利用して被検体の診断部位について断層画像を得ると共に生体組織の硬さ又は軟らかさを表す弾性画像を表示するものである。
{数1}
Ymi,j=圧力(応力)i,j/(歪みi,j) (i,j=1,2,3,…)
ここで、体表に与えられた圧力は、体表と圧迫機構との接触面に圧力センサ(図示しない。)を介在させ、この圧力センサによって直接的に計測される。また、超音波の送受信面を覆うように圧計測用変形体(図示しない。)を設け、その変形の状態から超音波探触子1によって圧迫された診断部位の体表に与えられた圧力を計測することもできる。
{数2}
複雑度=(周囲長)2/面積
次に、境界検出部112は、注目領域フレームデータで抽出された領域Aの周縁の境界部を抽出した境界トレースフレームデータを作成する。作成された境界トレースフレームデータを図7に示す。境界検出部112は、注目領域フレームデータの下限値X1~上限値X2の範囲に該当する歪み又は弾性率(弾性情報)の領域(領域A)である「1」の周縁の境界部を抽出する。抽出された境界には「1」、それ以外の領域には「0」が入力され、境界トレースフレームデータが作成される。
また、境界部の位置を断層画像フレームデータに重ね合わせて合成すれば、検者は、境界部内の断層画像におけるスペックルの状態や濃淡の状態等を詳細に観察することができる。また、境界部の位置を弾性画像フレームデータに重ね合わせて合成すれば、弾性画像における色相の状態を観察することができる。
第2の実施形態について図1、図2、図6を用いて説明する。第1の実施形態と異なる点は、抽出される注目領域(領域A)が閾値よりも小さい場合、境界トレースフレームデータの
対象外とする点である。
第3の実施形態について図1~図10を用いて説明する。第1の実施形態、第2の実施形態と異なる点は、平準化フィルタを用いて境界部を設定する点である。
そして、境界検出部112は、注目領域フレームデータに平滑化フィルタを適用して、境界トレースフレームデータを作成する。具体的には、境界検出部112は、図6に示される注目領域フレームデータの各画素を中心として設置された3×3カーネルサイズの2次元領域24内に含まれる「1」の画素数(面積)をカウントし、その画素数をカーネルサイズの「9」で割る。なお、図6に示される注目領域フレームデータの1行目の左端の画素を画素(1,1)としている。
第4の実施形態について図1~図8を用いて説明する。第1の実施形態~第3の実施形態と異なる点は、断層画像の境界部の内部若しくは境界部の外部に弾性画像を表示する点である。
第5の実施形態について図1~図12を用いて説明する。第1の実施形態~第4の実施形態と異なる点は、ヒストグラムのピーク情報に基づいて下限値X1及び上限値X2を設定する点である。
Claims (12)
- 被検体に超音波を送受信する超音波探触子と、前記超音波探触子を介して超音波を送信する送信部と、前記被検体からの反射エコー信号を受信する受信部と、該受信部により受信された反射エコー信号に基づくRF信号フレームデータによって、歪み又は弾性率を含む弾性情報を演算する弾性情報演算部と、前記弾性情報演算部により求めた弾性情報に基づいて弾性画像を構成する弾性画像構成部と、前記RF信号フレームデータに基づいて断層画像を構成する断層画像構成部と、前記断層画像と前記弾性画像の一方又は両方を表示する画像表示部と、各構成要素を制御する制御部とを備える超音波診断装置において、
前記弾性情報の頻度に基づくヒストグラムデータを作成するヒストグラム演算部と、前記ヒストグラムデータの前記弾性情報の所定範囲に基づいて設定される注目領域の周縁の境界部を検出する境界検出部とを備え、前記画像表示部は前記境界部を表示することを特徴とする超音波診断装置。 - 前記画像表示部は、前記境界部を前記断層画像又は前記弾性画像上に表示することを特徴とする請求項1記載の超音波診断装置。
- 前記ヒストグラム演算部は、前記弾性情報演算部から出力される弾性フレームデータの各座標における弾性情報の数値をカウントし、前記数値の頻度に基づいて前記ヒストグラムデータを算出することを特徴とする請求項1記載の超音波診断装置。
- 前記境界検出部は、前記ヒストグラムデータにおける所定範囲に該当する弾性情報の注目領域を弾性情報演算部から出力される弾性フレームデータから抽出し、該注目領域を含む注目領域フレームデータを作成することを特徴とする請求項1記載の超音波診断装置。
- 前記境界検出部は、前記注目領域フレームデータの前記注目領域の周縁の境界部を抽出した境界トレースフレームデータを作成することを特徴とする請求項4記載の超音波診断装置。
- 前記境界トレースフレームデータにて抽出された前記境界部の位置を前記断層画像構成部で構成された断層画像フレームデータ、若しくは前記弾性画像構成部にて構成された弾性画像フレームデータに重ね合わせて合成する切替合成部を備えることを特徴とする請求項5記載の超音波診断装置。
- 前記弾性情報は、歪み、弾性率、粘性、ポアソン比のいずれか1つであることを特徴とする請求項1記載の超音波診断装置。
- 前記境界検出部は、前記注目領域の面積若しくは画素数が予め設定した閾値よりも小さい場合、前記注目領域の周縁の境界部を検出しないことを特徴とする請求項1記載の超音波診断装置。
- 前記境界検出部は、前記注目領域のフレームデータの各画素を中心として設置された2次元領域内に含まれる前記注目領域の画素数をカウントし、前記境界部を検出することを特徴とする請求項1記載の超音波診断装置。
- 前記画像表示部は、前記境界部の内部若しくは外部に前記弾性画像を表示することを特徴とする請求項1記載の超音波診断装置。
- 前記境界検出部は、前記ヒストグラム演算部から出力されるヒストグラムのピークを検出し、前記制御部は、検出された前記ピークを中心にして、前記弾性情報の所定範囲を設定することを特徴とする請求項1記載の超音波診断装置。
- 超音波探触子を介して超音波を送信する送信し、被検体からの反射エコー信号を受信する受信するステップと、前記反射エコー信号に基づくRF信号フレームデータによって、弾性情報を演算するステップと、前記弾性情報に基づいて弾性画像を構成するステップと、前記RF信号フレームデータに基づいて断層画像を構成するステップと、前記断層画像と前記弾性画像の一方又は両方を表示するステップと、前記弾性情報の頻度に基づくヒストグラムデータを作成するステップと、前記ヒストグラムデータの前記弾性情報の所定範囲に基づいて設定される注目領域の周縁の境界部を検出するステップと、前記境界部を表示するステップとを含む超音波画像表示方法。
Priority Applications (2)
| Application Number | Priority Date | Filing Date | Title |
|---|---|---|---|
| US13/123,289 US20110194748A1 (en) | 2008-10-14 | 2009-10-13 | Ultrasonic diagnostic apparatus and ultrasonic image display method |
| JP2010533890A JP5479353B2 (ja) | 2008-10-14 | 2009-10-13 | 超音波診断装置 |
Applications Claiming Priority (2)
| Application Number | Priority Date | Filing Date | Title |
|---|---|---|---|
| JP2008264719 | 2008-10-14 | ||
| JP2008-264719 | 2008-10-14 |
Publications (1)
| Publication Number | Publication Date |
|---|---|
| WO2010044385A1 true WO2010044385A1 (ja) | 2010-04-22 |
Family
ID=42106548
Family Applications (1)
| Application Number | Title | Priority Date | Filing Date |
|---|---|---|---|
| PCT/JP2009/067696 Ceased WO2010044385A1 (ja) | 2008-10-14 | 2009-10-13 | 超音波診断装置、及び超音波画像表示方法 |
Country Status (3)
| Country | Link |
|---|---|
| US (1) | US20110194748A1 (ja) |
| JP (1) | JP5479353B2 (ja) |
| WO (1) | WO2010044385A1 (ja) |
Cited By (22)
| Publication number | Priority date | Publication date | Assignee | Title |
|---|---|---|---|---|
| JP2011245006A (ja) * | 2010-05-26 | 2011-12-08 | Ge Medical Systems Global Technology Co Llc | 超音波診断装置及びその制御プログラム |
| US8150128B2 (en) | 2006-08-30 | 2012-04-03 | The Trustees Of Columbia University In The City Of New York | Systems and method for composite elastography and wave imaging |
| US8428687B2 (en) | 2008-08-01 | 2013-04-23 | The Trustees Of Columbia University In The City Of New York | Systems and methods for matching and imaging tissue characteristics |
| JP2013158531A (ja) * | 2012-02-07 | 2013-08-19 | Canon Inc | 被検体情報取得装置及び被検体情報取得方法 |
| JP2015522367A (ja) * | 2012-07-18 | 2015-08-06 | コーニンクレッカ フィリップス エヌ ヴェ | 超音波イメージングデータを処理する方法及びシステム |
| US9247921B2 (en) | 2013-06-07 | 2016-02-02 | The Trustees Of Columbia University In The City Of New York | Systems and methods of high frame rate streaming for treatment monitoring |
| US9265483B2 (en) | 2010-08-06 | 2016-02-23 | The Trustees Of Columbia University In The City Of New York | Medical imaging contrast devices, methods, and systems |
| US9302124B2 (en) | 2008-09-10 | 2016-04-05 | The Trustees Of Columbia University In The City Of New York | Systems and methods for opening a tissue |
| US9320491B2 (en) | 2011-04-18 | 2016-04-26 | The Trustees Of Columbia University In The City Of New York | Ultrasound devices methods and systems |
| US9358023B2 (en) | 2008-03-19 | 2016-06-07 | The Trustees Of Columbia University In The City Of New York | Systems and methods for opening of a tissue barrier |
| US9506027B2 (en) | 2009-09-01 | 2016-11-29 | The Trustees Of Columbia University In The City Of New York | Microbubble devices, methods and systems |
| EP2620102A4 (en) * | 2010-09-21 | 2016-12-07 | Hitachi Ltd | ULTRASONIC DIAGNOSIS DEVICE AND METHOD FOR DISPLAYING ULTRASONIC IMAGES |
| US9585631B2 (en) | 2010-06-01 | 2017-03-07 | The Trustees Of Columbia University In The City Of New York | Devices, methods, and systems for measuring elastic properties of biological tissues using acoustic force |
| KR20170041879A (ko) * | 2014-10-21 | 2017-04-17 | 우시 히스키 메디칼 테크놀로지스 컴퍼니., 리미티드. | 검출영역을 선택하는 방법 및 장치 및 탄성 검출 시스템 |
| US10010709B2 (en) | 2009-12-16 | 2018-07-03 | The Trustees Of Columbia University In The City Of New York | Composition for on-demand ultrasound-triggered drug delivery |
| US10028723B2 (en) | 2013-09-03 | 2018-07-24 | The Trustees Of Columbia University In The City Of New York | Systems and methods for real-time, transcranial monitoring of blood-brain barrier opening |
| US10058837B2 (en) | 2009-08-28 | 2018-08-28 | The Trustees Of Columbia University In The City Of New York | Systems, methods, and devices for production of gas-filled microbubbles |
| US10322178B2 (en) | 2013-08-09 | 2019-06-18 | The Trustees Of Columbia University In The City Of New York | Systems and methods for targeted drug delivery |
| US10441820B2 (en) | 2011-05-26 | 2019-10-15 | The Trustees Of Columbia University In The City Of New York | Systems and methods for opening of a tissue barrier in primates |
| US10517564B2 (en) | 2012-10-10 | 2019-12-31 | The Trustees Of Columbia University In The City Of New York | Systems and methods for mechanical mapping of cardiac rhythm |
| US10660614B2 (en) | 2013-06-26 | 2020-05-26 | Sony Corporation | Ultrasonic processing apparatus and method |
| US10687785B2 (en) | 2005-05-12 | 2020-06-23 | The Trustees Of Columbia Univeristy In The City Of New York | System and method for electromechanical activation of arrhythmias |
Families Citing this family (11)
| Publication number | Priority date | Publication date | Assignee | Title |
|---|---|---|---|---|
| EP2598907B1 (en) * | 2010-07-29 | 2017-03-01 | B-K Medical ApS | Motion-compensated processing |
| JP5950619B2 (ja) * | 2011-04-06 | 2016-07-13 | キヤノン株式会社 | 情報処理装置 |
| KR20130080306A (ko) * | 2012-01-04 | 2013-07-12 | 삼성전자주식회사 | 탄성 영상 생성 방법 및 장치 |
| JP2014029380A (ja) * | 2012-07-31 | 2014-02-13 | Sony Corp | 情報処理装置、情報処理方法、プログラム及び画像表示装置 |
| WO2014185197A1 (ja) * | 2013-05-16 | 2014-11-20 | コニカミノルタ株式会社 | 画像処理装置及びプログラム |
| USD776710S1 (en) * | 2014-04-08 | 2017-01-17 | Samsung Electronics Co., Ltd. | Display screen or portion thereof with graphical user interface |
| US10646201B2 (en) | 2014-11-18 | 2020-05-12 | C. R. Bard, Inc. | Ultrasound imaging system having automatic image presentation |
| EP3220828B1 (en) | 2014-11-18 | 2021-12-22 | C.R. Bard, Inc. | Ultrasound imaging system having automatic image presentation |
| CN106456108A (zh) * | 2015-08-10 | 2017-02-22 | 深圳迈瑞生物医疗电子股份有限公司 | 超声弹性成像系统和方法 |
| WO2017138454A1 (ja) * | 2016-02-12 | 2017-08-17 | オリンパス株式会社 | 超音波観測装置、超音波観測装置の作動方法、及び超音波観測装置の作動プログラム |
| US11281926B2 (en) * | 2018-06-04 | 2022-03-22 | Denso Corporation | Feature extraction method and apparatus |
Citations (3)
| Publication number | Priority date | Publication date | Assignee | Title |
|---|---|---|---|---|
| JP2004135929A (ja) * | 2002-10-18 | 2004-05-13 | Hitachi Medical Corp | 超音波診断装置 |
| WO2006121031A1 (ja) * | 2005-05-09 | 2006-11-16 | Hitachi Medical Corporation | 超音波診断装置及び超音波画像表示方法 |
| WO2007046272A1 (ja) * | 2005-10-19 | 2007-04-26 | Hitachi Medical Corporation | 弾性画像を生成する超音波診断装置 |
Family Cites Families (18)
| Publication number | Priority date | Publication date | Assignee | Title |
|---|---|---|---|---|
| US8639009B2 (en) * | 2000-10-11 | 2014-01-28 | Imatx, Inc. | Methods and devices for evaluating and treating a bone condition based on x-ray image analysis |
| US6558324B1 (en) * | 2000-11-22 | 2003-05-06 | Siemens Medical Solutions, Inc., Usa | System and method for strain image display |
| US6939301B2 (en) * | 2001-03-16 | 2005-09-06 | Yaakov Abdelhak | Automatic volume measurements: an application for 3D ultrasound |
| US7245746B2 (en) * | 2001-06-12 | 2007-07-17 | Ge Medical Systems Global Technology Company, Llc | Ultrasound color characteristic mapping |
| EP2374413B1 (en) * | 2002-07-31 | 2017-06-21 | Hitachi, Ltd. | Ultrasonic diagnosis system and strain distribution display method |
| JP4314035B2 (ja) * | 2003-01-15 | 2009-08-12 | 株式会社日立メディコ | 超音波診断装置 |
| US7257244B2 (en) * | 2003-02-24 | 2007-08-14 | Vanderbilt University | Elastography imaging modalities for characterizing properties of tissue |
| TWI304835B (en) * | 2003-06-10 | 2009-01-01 | Hitachi Chemical Co Ltd | Film adhesive and manufacturing method thereof,adhesive sheet and semiconductor device |
| JP4685633B2 (ja) * | 2003-09-12 | 2011-05-18 | 株式会社日立メディコ | 超音波診断装置 |
| US7871380B2 (en) * | 2004-08-25 | 2011-01-18 | Hitachi Medical Corporation | Ultrasonic diagnostic apparatus |
| US7365859B2 (en) * | 2004-09-10 | 2008-04-29 | The General Hospital Corporation | System and method for optical coherence imaging |
| WO2007027684A2 (en) * | 2005-08-30 | 2007-03-08 | University Of Maryland Baltimore | Techniques for 3-d elastic spatial registration of multiple modes of measuring a body |
| US7620205B2 (en) * | 2005-08-31 | 2009-11-17 | Siemens Medical Solutions Usa, Inc. | Method for characterizing shape, appearance and motion of an object that is being tracked |
| US8172754B2 (en) * | 2006-04-18 | 2012-05-08 | Panasonic Corporation | Ultrasonograph |
| EP2081494B1 (en) * | 2006-11-16 | 2018-07-11 | Vanderbilt University | System and method of compensating for organ deformation |
| WO2008110013A1 (en) * | 2007-03-15 | 2008-09-18 | Centre Hospitalier De L'universite De Montreal | Image segmentation |
| JP5304986B2 (ja) * | 2008-03-31 | 2013-10-02 | 株式会社日立メディコ | 超音波診断装置 |
| JP5342210B2 (ja) * | 2008-10-30 | 2013-11-13 | 三菱重工業株式会社 | アライメント装置制御装置およびアライメント方法 |
-
2009
- 2009-10-13 WO PCT/JP2009/067696 patent/WO2010044385A1/ja not_active Ceased
- 2009-10-13 US US13/123,289 patent/US20110194748A1/en not_active Abandoned
- 2009-10-13 JP JP2010533890A patent/JP5479353B2/ja not_active Expired - Fee Related
Patent Citations (3)
| Publication number | Priority date | Publication date | Assignee | Title |
|---|---|---|---|---|
| JP2004135929A (ja) * | 2002-10-18 | 2004-05-13 | Hitachi Medical Corp | 超音波診断装置 |
| WO2006121031A1 (ja) * | 2005-05-09 | 2006-11-16 | Hitachi Medical Corporation | 超音波診断装置及び超音波画像表示方法 |
| WO2007046272A1 (ja) * | 2005-10-19 | 2007-04-26 | Hitachi Medical Corporation | 弾性画像を生成する超音波診断装置 |
Cited By (30)
| Publication number | Priority date | Publication date | Assignee | Title |
|---|---|---|---|---|
| US10687785B2 (en) | 2005-05-12 | 2020-06-23 | The Trustees Of Columbia Univeristy In The City Of New York | System and method for electromechanical activation of arrhythmias |
| US8150128B2 (en) | 2006-08-30 | 2012-04-03 | The Trustees Of Columbia University In The City Of New York | Systems and method for composite elastography and wave imaging |
| US10166379B2 (en) | 2008-03-19 | 2019-01-01 | The Trustees Of Columbia University In The City Of New York | Systems and methods for opening of a tissue barrier |
| US9358023B2 (en) | 2008-03-19 | 2016-06-07 | The Trustees Of Columbia University In The City Of New York | Systems and methods for opening of a tissue barrier |
| US8428687B2 (en) | 2008-08-01 | 2013-04-23 | The Trustees Of Columbia University In The City Of New York | Systems and methods for matching and imaging tissue characteristics |
| US9514358B2 (en) | 2008-08-01 | 2016-12-06 | The Trustees Of Columbia University In The City Of New York | Systems and methods for matching and imaging tissue characteristics |
| US9302124B2 (en) | 2008-09-10 | 2016-04-05 | The Trustees Of Columbia University In The City Of New York | Systems and methods for opening a tissue |
| US10058837B2 (en) | 2009-08-28 | 2018-08-28 | The Trustees Of Columbia University In The City Of New York | Systems, methods, and devices for production of gas-filled microbubbles |
| US9506027B2 (en) | 2009-09-01 | 2016-11-29 | The Trustees Of Columbia University In The City Of New York | Microbubble devices, methods and systems |
| US10010709B2 (en) | 2009-12-16 | 2018-07-03 | The Trustees Of Columbia University In The City Of New York | Composition for on-demand ultrasound-triggered drug delivery |
| JP2011245006A (ja) * | 2010-05-26 | 2011-12-08 | Ge Medical Systems Global Technology Co Llc | 超音波診断装置及びその制御プログラム |
| US9585631B2 (en) | 2010-06-01 | 2017-03-07 | The Trustees Of Columbia University In The City Of New York | Devices, methods, and systems for measuring elastic properties of biological tissues using acoustic force |
| US9265483B2 (en) | 2010-08-06 | 2016-02-23 | The Trustees Of Columbia University In The City Of New York | Medical imaging contrast devices, methods, and systems |
| EP2620102A4 (en) * | 2010-09-21 | 2016-12-07 | Hitachi Ltd | ULTRASONIC DIAGNOSIS DEVICE AND METHOD FOR DISPLAYING ULTRASONIC IMAGES |
| US9320491B2 (en) | 2011-04-18 | 2016-04-26 | The Trustees Of Columbia University In The City Of New York | Ultrasound devices methods and systems |
| US11096660B2 (en) | 2011-04-18 | 2021-08-24 | The Trustees Of Columbia University In The City Of New York | Ultrasound devices methods and systems |
| US12076590B2 (en) | 2011-05-26 | 2024-09-03 | The Trustees Of Columbia University In The City Of New York | Systems and methods for opening of a tissue barrier in primates |
| US11273329B2 (en) | 2011-05-26 | 2022-03-15 | The Trustees Of Columbia University In The City Of New York | Systems and methods for opening of a tissue barrier in primates |
| US10441820B2 (en) | 2011-05-26 | 2019-10-15 | The Trustees Of Columbia University In The City Of New York | Systems and methods for opening of a tissue barrier in primates |
| JP2013158531A (ja) * | 2012-02-07 | 2013-08-19 | Canon Inc | 被検体情報取得装置及び被検体情報取得方法 |
| JP2015522367A (ja) * | 2012-07-18 | 2015-08-06 | コーニンクレッカ フィリップス エヌ ヴェ | 超音波イメージングデータを処理する方法及びシステム |
| US10517564B2 (en) | 2012-10-10 | 2019-12-31 | The Trustees Of Columbia University In The City Of New York | Systems and methods for mechanical mapping of cardiac rhythm |
| US9247921B2 (en) | 2013-06-07 | 2016-02-02 | The Trustees Of Columbia University In The City Of New York | Systems and methods of high frame rate streaming for treatment monitoring |
| US10660614B2 (en) | 2013-06-26 | 2020-05-26 | Sony Corporation | Ultrasonic processing apparatus and method |
| US10322178B2 (en) | 2013-08-09 | 2019-06-18 | The Trustees Of Columbia University In The City Of New York | Systems and methods for targeted drug delivery |
| US10028723B2 (en) | 2013-09-03 | 2018-07-24 | The Trustees Of Columbia University In The City Of New York | Systems and methods for real-time, transcranial monitoring of blood-brain barrier opening |
| KR101913976B1 (ko) | 2014-10-21 | 2018-10-31 | 우시 히스키 메디칼 테크놀로지스 컴퍼니., 리미티드. | 검출영역을 선택하는 방법 및 장치 및 탄성 검출 시스템 |
| US10925582B2 (en) | 2014-10-21 | 2021-02-23 | Wuxi Hisky Medical Technologies Co., Ltd. | Method and device for selecting detection area, and elasticity detection system |
| JP2017536856A (ja) * | 2014-10-21 | 2017-12-14 | 无錫海斯凱尓医学技術有限公司Wuxi Hisky Medical Technologies Co.,Ltd. | 検出領域を選択する方法と装置及び弾性検出システム |
| KR20170041879A (ko) * | 2014-10-21 | 2017-04-17 | 우시 히스키 메디칼 테크놀로지스 컴퍼니., 리미티드. | 검출영역을 선택하는 방법 및 장치 및 탄성 검출 시스템 |
Also Published As
| Publication number | Publication date |
|---|---|
| US20110194748A1 (en) | 2011-08-11 |
| JP5479353B2 (ja) | 2014-04-23 |
| JPWO2010044385A1 (ja) | 2012-03-15 |
Similar Documents
| Publication | Publication Date | Title |
|---|---|---|
| JP5479353B2 (ja) | 超音波診断装置 | |
| JP4455003B2 (ja) | 超音波診断装置 | |
| JP5264097B2 (ja) | 超音波診断装置 | |
| JP4657106B2 (ja) | 超音波診断装置 | |
| JP5203605B2 (ja) | 超音波診断装置 | |
| JP5199690B2 (ja) | 超音波診断装置 | |
| JP5437820B2 (ja) | 超音波診断装置、超音波画像処理方法 | |
| JP4966578B2 (ja) | 弾性画像生成方法及び超音波診断装置 | |
| JP2004135929A (ja) | 超音波診断装置 | |
| CN103124523B (zh) | 超声波诊断装置、超声波图像显示方法 | |
| WO2006040967A1 (ja) | 超音波診断装置 | |
| JPWO2010026823A1 (ja) | 超音波診断装置及び超音波画像表示方法 | |
| KR101629541B1 (ko) | 초음파 진단 장치 및 그 제어 프로그램 | |
| JP6358954B2 (ja) | 超音波診断装置 | |
| JP5473527B2 (ja) | 超音波診断装置 | |
| JP2007105400A (ja) | 超音波診断装置及び画像処理装置 | |
| JP5113322B2 (ja) | 超音波診断装置 | |
| JP5789599B2 (ja) | 超音波診断装置 | |
| JP5623609B2 (ja) | 超音波診断装置 | |
| KR101574851B1 (ko) | 초음파 진단 장치 및 그 제어 프로그램 | |
| JP5638641B2 (ja) | 超音波診断装置 | |
| JP5128149B2 (ja) | 超音波診断装置 | |
| JP4368185B2 (ja) | 超音波診断装置 | |
| JP2008154626A (ja) | 超音波診断装置 | |
| JP6230801B2 (ja) | 超音波撮像装置及び超音波画像表示方法 |
Legal Events
| Date | Code | Title | Description |
|---|---|---|---|
| 121 | Ep: the epo has been informed by wipo that ep was designated in this application |
Ref document number: 09820563 Country of ref document: EP Kind code of ref document: A1 |
|
| WWE | Wipo information: entry into national phase |
Ref document number: 2010533890 Country of ref document: JP |
|
| WWE | Wipo information: entry into national phase |
Ref document number: 13123289 Country of ref document: US |
|
| NENP | Non-entry into the national phase |
Ref country code: DE |
|
| 122 | Ep: pct application non-entry in european phase |
Ref document number: 09820563 Country of ref document: EP Kind code of ref document: A1 |