WO2010001925A1 - 降下粉塵量推定方法、降下粉塵量推定装置、及び降下粉塵量推定プログラム - Google Patents
降下粉塵量推定方法、降下粉塵量推定装置、及び降下粉塵量推定プログラム Download PDFInfo
- Publication number
- WO2010001925A1 WO2010001925A1 PCT/JP2009/062035 JP2009062035W WO2010001925A1 WO 2010001925 A1 WO2010001925 A1 WO 2010001925A1 JP 2009062035 W JP2009062035 W JP 2009062035W WO 2010001925 A1 WO2010001925 A1 WO 2010001925A1
- Authority
- WO
- WIPO (PCT)
- Prior art keywords
- dust
- wind speed
- wind
- wind direction
- amount
- Prior art date
- Legal status (The legal status is an assumption and is not a legal conclusion. Google has not performed a legal analysis and makes no representation as to the accuracy of the status listed.)
- Ceased
Links
Images







Classifications
-
- G—PHYSICS
- G01—MEASURING; TESTING
- G01N—INVESTIGATING OR ANALYSING MATERIALS BY DETERMINING THEIR CHEMICAL OR PHYSICAL PROPERTIES
- G01N15/00—Investigating characteristics of particles; Investigating permeability, pore-volume or surface-area of porous materials
- G01N15/06—Investigating concentration of particle suspensions
Definitions
- the present invention relates to a method, an apparatus, and a computer program for estimating the amount of falling dust based on the calculation results of the advection and diffusion behavior of dust in the atmosphere.
- Non-Patent Document 1 the following method is proposed: It is assumed that the amount of falling dust depends on the one-dimensional distance between the dust source and the falling point; the distance between the dust source and the falling point, the dust generation rate The following equation (4) is calculated using the particle size distribution of dust, density of dust, effective dust height, and frequency distribution of wind direction and wind speed as follows; ⁇ Multiply the frequency distribution of wind speed to estimate the amount of falling dust. Moreover, the apparatus and method of estimating the amount of falling dust based on an empirical formula or an empirical formula are proposed (refer patent document 1).
- x is an arbitrary point on the coordinate axis (x axis) in the downwind direction from the dust source
- y is an arbitrary point on the coordinate axis (y axis) perpendicular to the x axis on the horizontal plane
- z is the x axis
- An arbitrary point c (x, y, z) on the coordinate axis (z-axis) in the vertical direction with respect to the horizontal plane formed by the axes is the dust concentration at any coordinate point (x, y, z)
- u Wind speed
- Q is dust intensity
- ⁇ y , ⁇ z are the spread of visible smoke in the y-axis and z-axis directions
- He is the effective dust height
- y 0 is on the y-axis where the dust source exists Indicates a coordinate point.
- the coordinate point on the x axis where the dust source is present is 0.
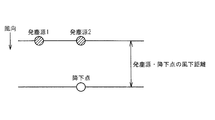
- Non-Patent Document 1 it is assumed that the amount of falling dust depends on the one-dimensional distance in the downwind direction between the dust source and the falling point. For this reason, as shown in FIG. 1, the dust generation distance between the dust source and the drop point, dust generation strength, dust particle size distribution and dust density, and effective dust generation height are all equal to one descent point.
- the source 1 and the dust source 2 are present, the contributions of the dust source 1 and the dust source 2 are estimated to be the same.
- dust particles diffuse in three dimensions. For this reason, there is a problem that the fact that the contribution of the dust source 2 whose distance from the falling point is short is larger than that of the dust source 1 can not be described.
- the present invention has been made in view of the above-described points, and it is an object of the present invention to provide a method capable of performing estimation faithfully and accurately to the principle of a real phenomenon as compared with the conventional experimental formula. Do.
- each mode of the present invention adopted the following means.
- the present invention acquires time series measurement values in a predetermined period of wind direction and wind speed, and divides the range of wind direction and wind speed into m and n divided ranges respectively based on the time series measurement values.
- a drop dust amount estimating method
- the dust concentration calculation step may calculate the dust concentration c by further using the reflectance ⁇ of the dust on the ground surface.
- the dust source information input step coordinates of the dust source in a three-dimensional space and a dust intensity Q of the dust source The particle size of the dust, the density of the dust, and the effective dust generation height He from the dust source may be input.
- the dust concentration calculating step is performed by calculating the dust concentration c (x, y, z) at a point (x, y, z) on a three-dimensional coordinate axis.
- u is the wind speed
- K y and K z are turbulent diffusion coefficients in the y- and z-axis directions
- w is the terminal sedimentation velocity of particles
- the x-coordinate of the dust source is 0
- the y coordinate of the dust source may be y0.
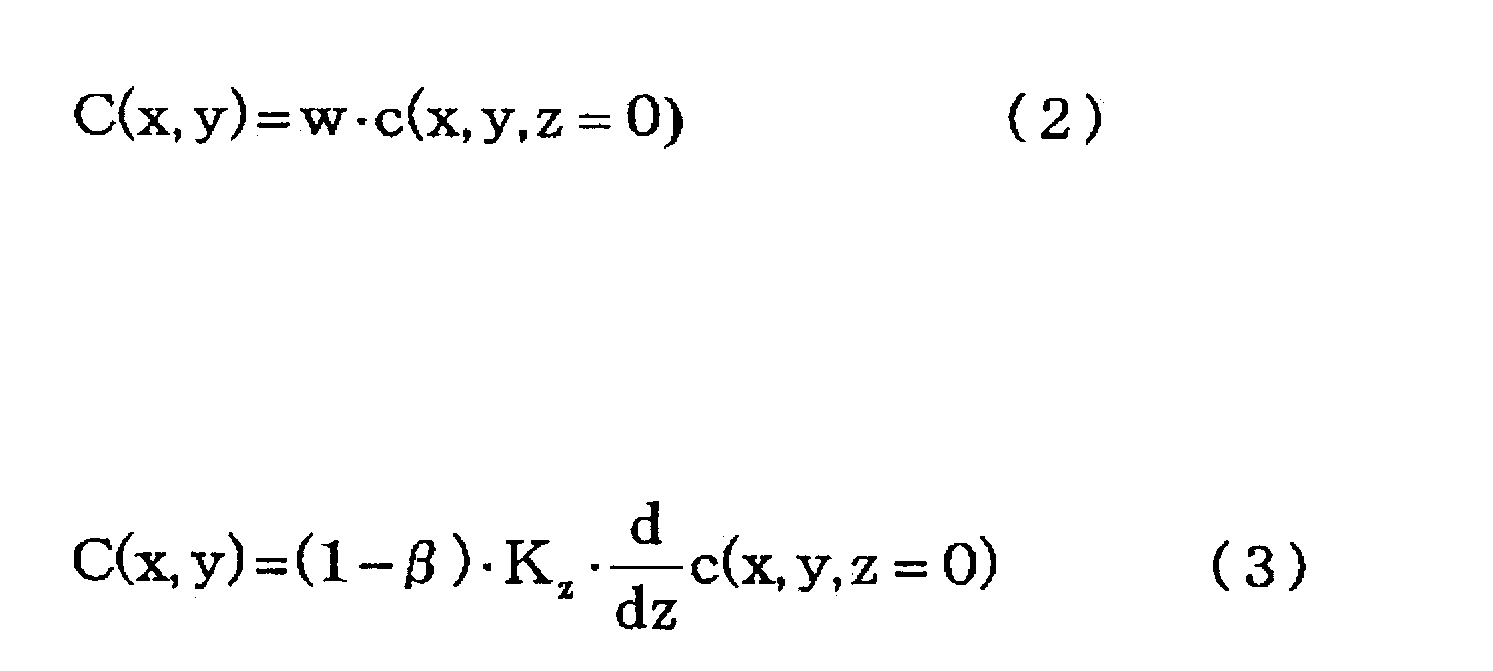
- the step of calculating the amount of fallen dust calculates the amount of fallen dust using formula (2) or (3); c (x, y, z) is the dust concentration at the point (x, y, z) on the three-dimensional coordinate axis; C is the falling dust amount, and K z is the turbulent diffusion coefficient in the z-axis direction May be (6) Further, the present invention acquires time-series measurement values in a predetermined period of wind direction and wind speed, and based on the time-series measurement values, the wind direction and wind speed range is divided into m and n divided ranges, respectively.
- the wind direction / wind speed frequency of the m ⁇ n matrix is obtained by dividing and setting a wind speed representative value for each divided range of wind speed, and determining the frequency of the time series measurement values included in each divided range in the predetermined period.
- a wind direction and wind speed information input unit that creates a distribution and uses the wind speed representative value and the wind direction and wind speed distribution as wind direction and wind speed information; and a dust source information input unit to which dust dust source information is input;
- a dust concentration calculation unit that calculates dust concentration c at an arbitrary coordinate point using the wind direction and wind speed information and information of the dust source; and descent at an arbitrary descent point based on the dust concentration c Equipped with a falling dust amount calculator to calculate the dust amount;
- a drop dust quantity estimation apparatus that calculates dust concentration c at an arbitrary coordinate point using the wind direction and wind speed information and information of the dust source.
- the present invention acquires time-series measurement values in a predetermined period of wind direction and wind speed, and based on the time-series measurement values, the wind direction and wind speed range is divided into m and n divided ranges, respectively.
- the wind direction / wind speed frequency of the m ⁇ n matrix is obtained by dividing and setting a wind speed representative value for each divided range of wind speed, and determining the frequency of the time series measurement values included in each divided range in the predetermined period.
- a wind direction / speed information input procedure for creating a distribution and using the wind speed representative value and the wind direction / wind frequency distribution as wind direction / wind speed information; dust source information input procedure for inputting information of dust source of dust; Dust concentration calculation procedure for calculating dust concentration c at an arbitrary coordinate point using wind direction and wind speed information and information of the dust source; and falling dust at an arbitrary descent point based on the dust concentration c Falling dust amount calculation procedure to calculate the amount;
- the present invention is a computer readable recording medium recording the program according to the above (7).
- the dust behavior can be estimated faithfully and accurately to the principle of the real phenomenon as compared with the conventional experimental formula.
- an equipment design index can be obtained when estimating the optimum scale of dust control equipment such as a dust collector.
- the dust behavior can be estimated accurately according to the measured wind direction / speed.
- the amount of calculation can be saved. For this reason, calculations can be realized even for complex systems, and significant estimation results can be obtained.
- the dust behavior can be accurately estimated.
- the dust behavior can be accurately estimated according to the characteristics.
- the dust behavior can be accurately estimated according to the measured wind speed, turbulent diffusion coefficient, terminal sedimentation velocity of dust particles, etc., using a three-dimensional turbulent diffusion model. .
- the dust behavior can be accurately estimated even when sedimentation by gravity can not be ignored, such as when the particle size of the dust is large or when the density of the dust is high.
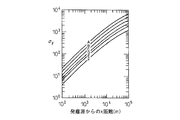
- FIG. 5 is a diagram for determining the spread of smoke by Pascoll-Gifford.
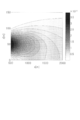
- FIG. 5 is a diagram for determining the spread of smoke by Pascoll-Gifford. It is a figure showing an example of concentration distribution of dust scattering computed by a method concerning an embodiment of the present invention. It is a figure which shows an example of the density
- FIG. It is a figure which shows an example of the falling dust amount distribution calculated by the method which concerns on embodiment of this invention. It is a figure which shows an example of the falling dust concentration distribution calculated by the Bosanquet formula of a nonpatent literature 1.
- FIG. It is a figure which shows an example of the actual measurement value by the deposit gauge of the amount of fallen dust. It is a figure showing the outline of the device composition concerning the embodiment of the present invention. It is a figure showing an example of hardware constitutions of a computer system which functions as dust concentration and a falling dust amount estimating device.
- the scattering behavior by advection and diffusion in the three-dimensional direction by the wind from the dust source to the falling point is theoretically determined based on the mass balance of the dust, and the falling dust amount is estimated.
- c (x, y, z) be the concentration of dust particles scattered from the dust source by the wind.
- concentration c (x, y, z) the mass balance can be described by the following equation (6).
- u represents the wind speed, and it is assumed that the x axis is set at the center of the wind direction as described above, and the wind blows only in the x axis direction.
- the first term on the left side of the equation (6) indicates the amount of dust particles scattered by advection of the wind.
- the first term on the right side of the equation (6) indicates the amount of dust particles scattering in the y-axis direction due to turbulent diffusion.
- the second term on the right side of the equation (6) indicates the amount of dust particles scattering in the z-axis direction due to turbulent diffusion.
- the third term on the right side of the equation (6) indicates the amount of dust particles settling by gravity.
- K y and K z represent turbulent diffusion coefficients in the y-axis direction and the z-axis direction, respectively.
- the lower equation (7) is an equation relating to setting of boundary conditions of dust particles in the dust source.
- ⁇ is a delta function.
- the delta function is a real superfunction satisfying the condition of equation (8).
- the dust generation intensity Q can be determined by means of a low volume sampler or the like.
- the lower equation (9) is an equation relating to setting of boundary conditions of dust particles on the ground surface.
- Equation (1) can be derived by analytically solving Equation (6) under the boundary conditions of Equations (7) and (9).
- the calculated value can be calculated by the following equation (2) obtained by multiplying the terminal sedimentation velocity w of the dust particles.
- S S is the density of dust particles
- ⁇ a is the density of the atmosphere
- d k is the diameter of dust particles corresponding to the frequency of runoff k
- ⁇ is the viscosity coefficient of the atmosphere.
- K y represents the turbulent diffusion coefficient in the z-axis direction
- ⁇ represents the surface reflectance of particles
- the steps of inputting wind speed and wind power information will be described.
- the wind direction and the frequency distribution of the wind speed are calculated. Based on the measured wind direction and wind speed for a given period, the wind direction and wind speed data are classified into m categories for wind direction and n categories for wind speed.
- the frequency b ij of data belonging to the categories of wind speed i and wind direction j is calculated to create a matrix of n rows and m columns. At this time, the sum of each element b ij of this matrix is adjusted to be 100%.
- the classification of wind direction data can be calculated in any direction of one or more directions, and may be set in consideration of available direction data.
- the classification of wind speed data can be calculated using the measured wind speed directly.
- a representative value of the wind speed is selected.
- the wind speed value having the highest occurrence frequency may be adopted, or the average value of the wind speed data belonging to the divided section may be adopted.
- JMA observation data such as AMeDAS may be used.
- the setting of the period for measuring the wind direction and the wind speed is set to be the same as the calculation period for the amount of fallen dust.
- step S02 the initial value of the fallen dust is set to zero.
- step S04 information on the descent point is input. Specifically, the coordinates (x, y) of the falling point for estimating the amount of falling dust are input.
- the above-described wind direction and wind speed information input step, dust generation information input step, and descent point information input step may be switched in any order of input.
- the dust concentration calculation step S100 shown in FIG. 4 is entered.
- the dust concentration at the falling point is calculated using the information input in each of the above steps.
- step S05 the wind speed ui (representative wind speed value) in each frequency distribution b ij of wind direction and wind speed is defined as the wind speed u used for calculation in the subsequent steps.
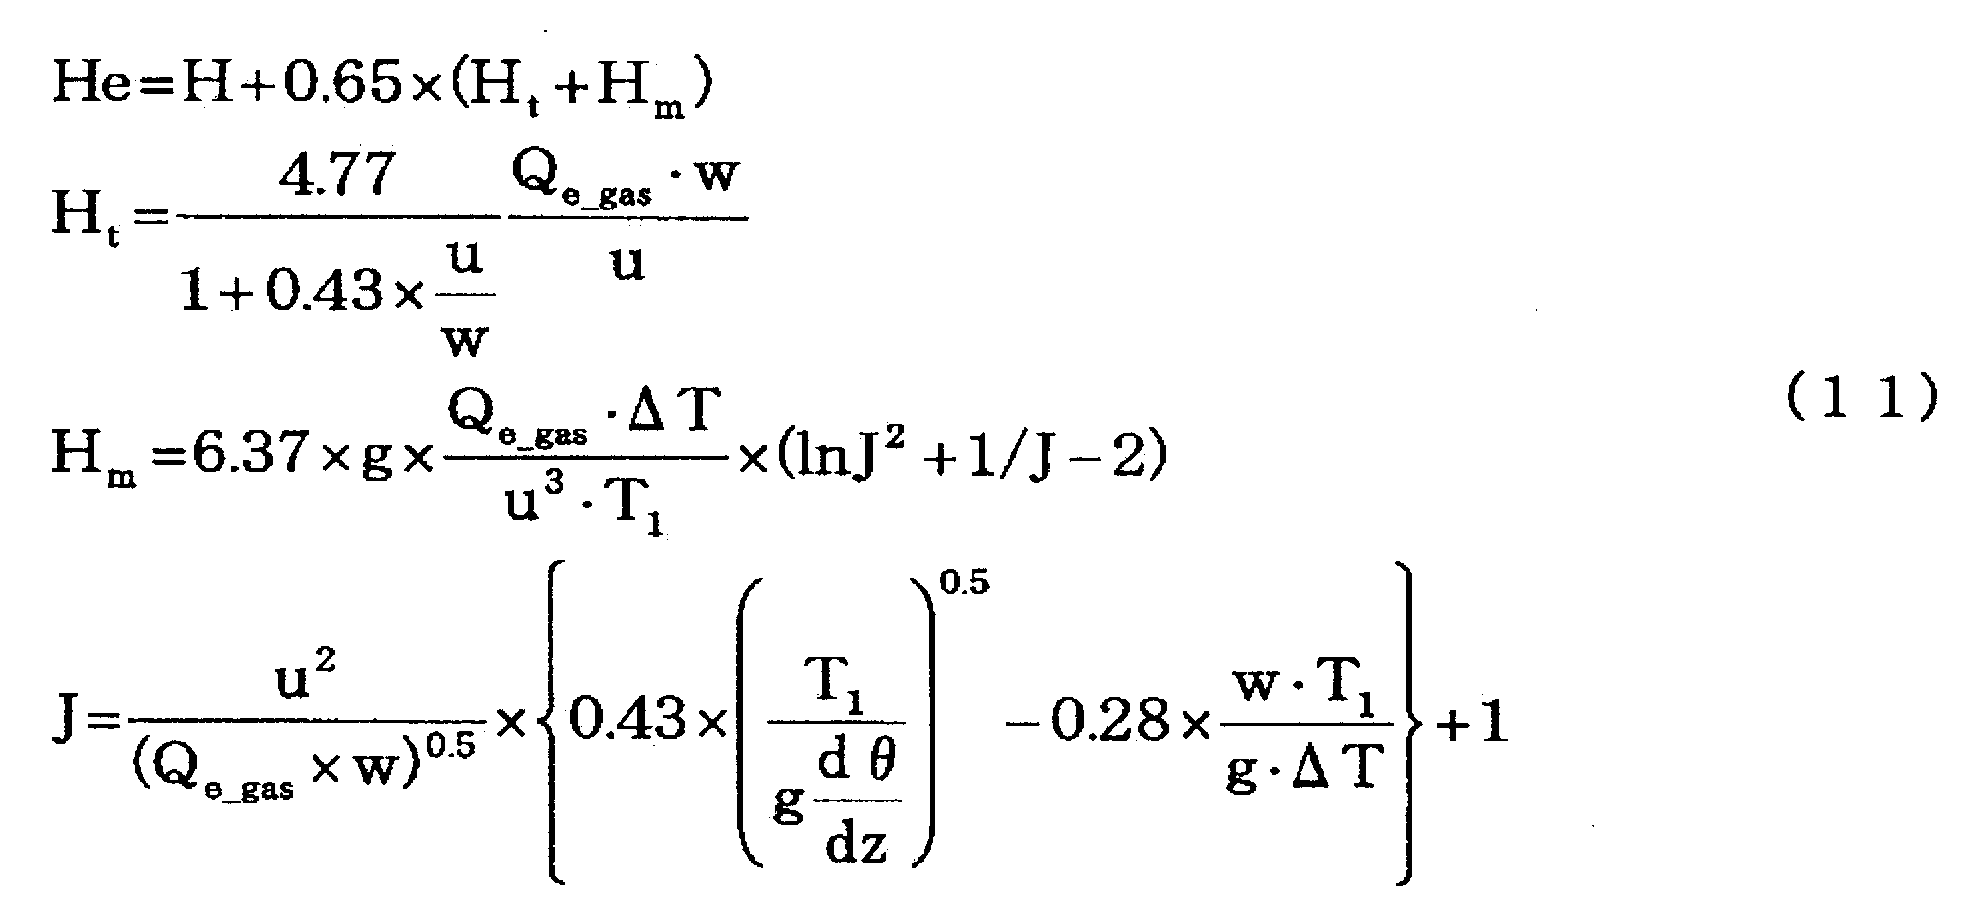
- the wind velocity u is used to calculate the effective dust height using equation (11) described later, and to calculate the dust concentration at the falling point using equation (1).
- step S06 if dust is discharged at a higher temperature than the surrounding air, such as a factory chimney, the effective dust height He based on the chimney height H, exhaust gas air volume W, and exhaust gas wind speed V input in step S03. Is calculated by, for example, equation (11).
- H is the chimney height
- Q e_gas is the exhaust gas flow rate
- T 1 is the ambient temperature
- ⁇ T is the difference between the exhaust gas temperature and T 1
- g is the gravitational acceleration
- d ⁇ / dz is the temperature gradient of the atmosphere (usually 0.03 Is used
- w is the terminal sedimentation velocity of particles
- u is the wind speed.
- the state of dust generation is recorded by an apparatus such as a camera, and the height at which the dust is the maximum concentration is identified and judged from the color density to determine the dust generation height.
- the dust generation height is set as the effective dust generation height He.
- the dust particle sample collected by the low volume sampler is put into a particle size distribution measuring device, and the particle size distribution is measured. Based on the measured particle size distribution, the representative particle diameter is determined using the definition such as the maximum frequency diameter. In addition, the measurement range of the particle size may be divided, and the representative particle size in each divided range may be used as the dust particle size. In this case, the weight ratio of dust particles present in the divided particle diameter range is determined in advance. Then, the frequency distribution is calculated for each average particle diameter so that the total weight becomes 100%. Then, the amount of fallen dust for each average particle diameter is multiplied by the frequency distribution calculated for each of the average particle diameters to obtain the total amount of fallen dust.
- the particle size distribution measuring apparatus may be a sedimentation method, a light transmission method or the like.
- the terminal sedimentation velocity w is calculated by the above-mentioned equation (10).
- step S08 the turbulent diffusion coefficients K y and K z are determined.
- K y and K z are based on FIG. 5A, Pasquill-Gifford shown in 5B performs tracer experiments in US meadow observed smoke spread .sigma.y, the experimental values of Shigumaz, translated in accordance with the following equation (12) Set the value. (For example, see Non-Patent Document 4)
- symbols A, B, C, D, E and F in FIGS. 5A and 5B indicate atmospheric stability, A is very unstable, B is unstable, C is somewhat unstable, D is neutral, E Is stable, and F is very stable.
- the atmospheric stability relates to the magnitudes of the turbulent diffusion coefficients K y and K z , and as the atmospheric stability becomes stable from FIGS. 5A and 5B, the turbulent diffusion coefficients K y and K z decrease.
- step S09 the reflectance ⁇ is input.
- the amount of fallen dust is defined as ⁇ C (x, y).
- step S012 the calculated value ⁇ C (x, y) of the fallen dust amount corresponding to the frequency distribution b ij of each wind direction and wind speed calculated in step S011 is added to the fallen dust amount C (x, y).
- step S013 if the conditions of i ⁇ n and j ⁇ m are satisfied, the loop of step S014 is executed, and the calculation of steps S05 to S012 is repeated to obtain the amount of dropped dust C (x, y). Can.
- the above-mentioned method describes the behavior of dust when it is scattered by the wind, in line with the principle of the physical phenomenon, and dust in the plant exhausts from factories, etc., in automobile exhaust gas It can be applied to dust included, pollen that causes hay fever, yellow sand, and scattering phenomena such as desert sand.
- the number of dust sources such as chimneys, the installation position, dust strength, etc. can be designed appropriately before installing the dust sources .
- dust control equipment such as dust collectors can be optimally arranged. By this, the influence on the environment by scattering of dust etc. can be controlled appropriately.
- the particle diameter of the dust to be analyzed is distributed in the range of 30 ⁇ m to 90 ⁇ m, and the average value of 60 ⁇ m was adopted.
- turbulent diffusion coefficient Ky respectively Kz, 1004.7 / in x (m 2 /sec),3909.6/x(m 2 / sec ) is there.
- FIG. 7 shows the calculation result under the same conditions as the above, which is calculated by the equation (13) known as a goose amplifier room model. Unlike the case of FIG. 6, the downward attenuation effect of the contour line of the dust concentration can not be observed unlike the case of FIG. In addition, since it is assumed that the particles are completely reflected, it can be seen that the concentration gradient of dust particles on the ground is different from the result of FIG.
- FIG. 8 to FIG. 10 are contour diagrams of the dust fall amount distribution on the ground surface, and are drawn based on the actual measurement values by the method of the present embodiment, the method of the Bosanquet equation, and the deposit gauge, respectively.
- the vertical axis is the x axis
- the horizontal axis is the y axis.
- FIG. 8 shows the calculation results of the amount of fallen dust calculated using the present method.
- the wind direction and wind speed data were calculated using the AMeDAS data of the Japan Meteorological Agency, and the frequency distribution of the wind direction and wind speed was calculated from the data for 1 month between observation data intervals.
- Table 1 shows the frequency distribution of the wind direction and the wind speed used in the calculation.
- FIG. 9 shows, as a comparative example, the calculation result of the amount of fallen dust calculated by the equation (1) in the document 1.
- FIG. 10 is a contour diagram drawn based on the actual measurement value of the amount of fallen dust. The area was divided approximately equally into 80, and one deposit gauge was installed at the center of each divided area. The weight of the dust accumulated for 10 days was measured on a total of 80 deposit gauges to determine the amount of fallen dust. As compared with FIG. 9, FIG. 8 shows that the contour shape matches the measured value of FIG. 10 better.
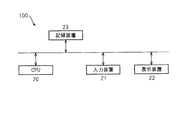
- FIG. 11 shows an outline of the dust concentration and dustfall estimation device 100 according to the present invention.
- the apparatus 100 includes dust concentration calculating means 14 and dust and dust amount calculating means 15, and estimates the amount of dust falling and depositing on the ground at a predetermined falling point as the dust and dust amount.
- Information from the wind direction / speed information input means 11, the dust source information input means 12, and the descent point information input means 13 is input to the dust concentration calculation means 14, and the dust surface reflectance ⁇ is further input. .
- the wind direction and wind speed information input unit 11 divides the ranges of the wind direction and the wind speed into m and n divided ranges, respectively, based on time series measurement values in a predetermined period of the wind direction and the wind speed. Further, a representative value is set for each of the divided ranges of the n wind speeds divided. Furthermore, the frequency of the number of time-series measurement values included in each wind speed / speed division range occupies the total number of measurement values in the predetermined period, and the m ⁇ n frequency distribution matrix is set. Further, the values of the wind direction and the frequency distribution of the wind speed are input to the dust concentration calculating means 14 as wind direction and wind speed information.
- the coordinates of the dust source in the three-dimensional space are designated in the dust source information input means 12, and the dust intensity of the dust source (dust generation speed), the particle diameter of the dust, and the dust density Enter Also, the effective dust generation height from the dust source calculated by calculation or measurement is input to the dust concentration calculation means 14.
- the descent point information input means 13 designates coordinates in a two-dimensional space of the descent point for evaluating dust concentration on the ground surface, and inputs the coordinates to the dust concentration calculation means 14.
- the dust concentration calculation means 14 is a wind direction / speed information input means 11, a dust source information input means 12, and all input information input by the descent point information input means 13 and reflection of dust input on the ground surface.
- the dust concentration c (x, y) at an arbitrary coordinate point (x, y, z) in a three-dimensional space with respect to dust which is advected and diffused from the dust source to the surroundings based on input values such as the rate ⁇ , Z) are calculated by equation (1).
- the K y a turbulent diffusion coefficient of the z-axis direction, a ⁇ as reflectance at the surface of the particles (3) may be used expressions.
- FIG. 12 shows an example of the hardware configuration of a computer system that functions as the dust concentration and dust falloff amount estimation apparatus 100.
- the dropped dust amount estimation apparatus 100 includes a CPU 20, an input device 21, a display device 22, and a recording device 23. Each part is connected via a bus 24.
- the wind direction / speed information, dust generation information, falling point information, and reflectance ⁇ necessary for estimation of the amount of fallen dust are input to the input device 21.
- the CPU 20 determines the effective dust deposition height He, the terminal sedimentation velocity of the dust particles, and the turbulent diffusion coefficients K y and K z based on the information input to the input device 21 and determines the amount of dust deposition at the descent point. calculate.
- the display device 22 displays a contour map of the amount of fallen dust based on the calculated values of the amount of fallen dust at the plurality of falling points calculated by the CPU 20.
- the recording device 23 records all the information input to the input device 21 and the amount of fallen dust at each falling point calculated by the CPU 20.
- the recording device 23 is configured by a ROM, a RAM, an HD, and the like.
- the recording device 23 also stores a computer program for controlling the operation of the dustfall amount estimation apparatus 100 described above.
- the CPU 20 implements the computer program to realize the function or processing of the dust and dirt amount estimating apparatus 100.
- a database is stored in the recording device 23.
- the apparatus for estimating the amount of fallen dust of the present invention may be applied to a system constituted by a plurality of devices or to an apparatus comprising a single device.
- the object of the present invention can also be achieved by supplying a computer program for realizing the functions described above to a system or apparatus, and being executed by a computer (CPU or MPU) of the system or apparatus.
- the computer program itself Will constitute the present invention.
- the dust behavior can be estimated faithfully and accurately to the principle of the real phenomenon as compared with the conventional experimental formula.
- an equipment design index can be obtained when estimating the optimum scale of dust control equipment such as a dust collector.
Landscapes
- Chemical & Material Sciences (AREA)
- Dispersion Chemistry (AREA)
- Physics & Mathematics (AREA)
- Health & Medical Sciences (AREA)
- Life Sciences & Earth Sciences (AREA)
- Analytical Chemistry (AREA)
- Biochemistry (AREA)
- General Health & Medical Sciences (AREA)
- General Physics & Mathematics (AREA)
- Immunology (AREA)
- Pathology (AREA)
- Investigating Or Analysing Materials By Optical Means (AREA)
Abstract
Description
本願は、2008年7月1日に、日本に出願された特願2008-172501号に基づき優先権を主張し、その内容をここに援用する。
また、実験式または経験式に基づき降下粉塵量を推定する装置及び方法が提案されている(特許文献1参照)。
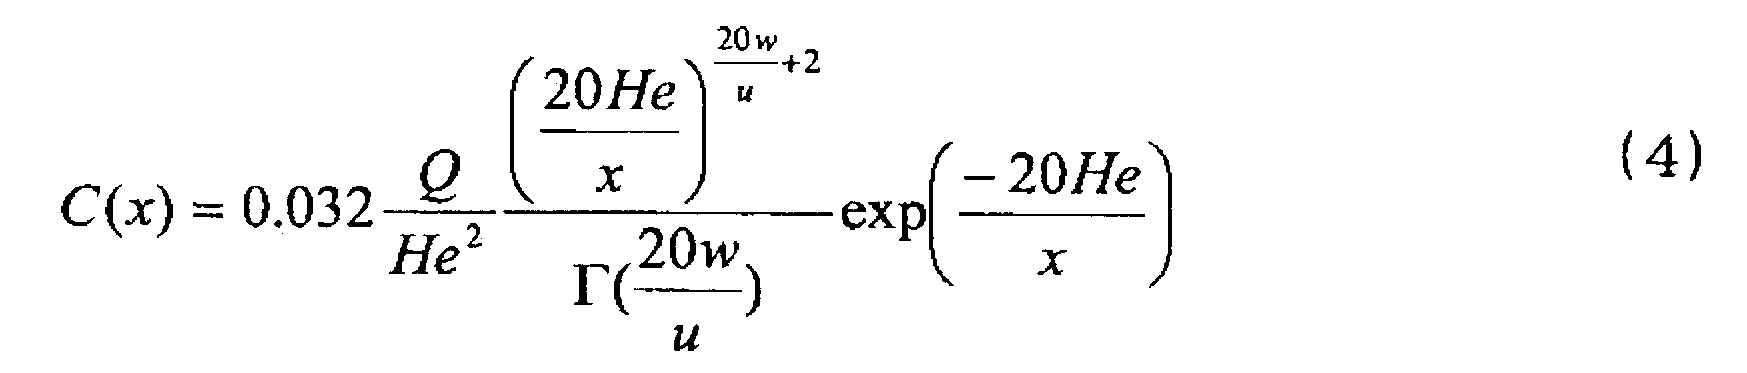
一方、飛散物質が搬送気体の密度と同一とみなして良い場合には、3次元のガウシアンプルームモデルが提案されている。この場合、下の(5)式により、任意の空間位置(x,y,z)における飛散物質濃度を計算することができる(非特許文献2参照)。

一方、非特許文献2に開示されている推定方法では、飛散物質が搬送気体の密度と同一であるという仮定が必要であった。粉塵粒子の場合は、この仮定が満足されないため、この推定方法は、粉塵粒子の挙動を精度良く推定することができない。
(1)本発明は、風向及び風速の所定期間における時系列計測値を取得し、前記時系列計測値をもとに、風向及び風速の範囲を、各々m、n個の分割範囲に分割し、風速の前記分割範囲毎に風速代表値を設定し、それぞれの前記分割範囲に含まれる前記時系列計測値の前記所定期間での頻度を求めることによってm×n行列の風向・風速頻度分布を作成し、前記風速代表値及び前記風向・風速頻度分布を風向・風速情報とする風向・風速情報入力工程と;粉塵の発塵源の情報を入力する発塵源情報入力工程と;前記風向・風速情報と、前記発塵源の情報と、を用いて、任意の座標点における粉塵濃度cを計算する粉塵濃度計算工程と;前記粉塵濃度cに基づいて、任意の降下地点における降下粉塵量を計算する降下粉塵量計算工程と;を備える降下粉塵量推定方法である。
(2)前記(1)に記載の降下粉塵量推定方法において、前記粉塵濃度計算工程は、前記粉塵の地表での反射率βを更に用いて粉塵濃度cを計算してもよい。
(3)前記(2)に記載の降下粉塵量推定方法において、前記発塵源情報入力工程では、前記発塵源の3次元空間上での座標と、前記発塵源の発塵強度Qと、前記粉塵の粒子径と、前記粉塵の密度と、前記発塵源からの有効発塵高さHeと、が入力されてもよい。
(4)前記(3)に記載の降下粉塵量推定方法において、前記粉塵濃度計算工程は、3次元座標軸上の点(x,y,z)における粉塵濃度c(x,y,z)を(1)式を用いて計算し;

(5)前記(2)に記載の降下粉塵量推定方法において、前記降下粉塵量計算工程は、(2)式又は(3)式を用いて降下粉塵量を計算し;
(6)また、本発明は、風向及び風速の所定期間における時系列計測値を取得し、前記時系列計測値をもとに、風向及び風速の範囲を、各々m、n個の分割範囲に分割し、風速の前記分割範囲毎に風速代表値を設定し、それぞれの前記分割範囲に含まれる前記時系列計測値の前記所定期間での頻度を求めることによってm×n行列の風向・風速頻度分布を作成し、前記風速代表値及び前記風向・風速頻度分布を風向・風速情報とする風向・風速情報入力部と;粉塵の発塵源の情報が入力される発塵源情報入力部と;前記風向・風速情報と、前記発塵源の情報と、を用いて、任意の座標点における粉塵濃度cを計算する粉塵濃度計算部と;前記粉塵濃度cに基づいて、任意の降下地点における降下粉塵量を計算する降下粉塵量計算部と;を備える降下粉塵量推定装置である。
(7)また、本発明は、風向及び風速の所定期間における時系列計測値を取得し、前記時系列計測値をもとに、風向及び風速の範囲を、各々m、n個の分割範囲に分割し、風速の前記分割範囲毎に風速代表値を設定し、それぞれの前記分割範囲に含まれる前記時系列計測値の前記所定期間での頻度を求めることによってm×n行列の風向・風速頻度分布を作成し、前記風速代表値及び前記風向・風速頻度分布を風向・風速情報とする風向・風速情報入力手順と;粉塵の発塵源の情報を入力する発塵源情報入力手順と;前記風向・風速情報と、前記発塵源の情報と、を用いて、任意の座標点における粉塵濃度cを計算する粉塵濃度計算手順と;前記粉塵濃度cに基づいて、任意の降下地点における降下粉塵量を計算する降下粉塵量計算手順と;をコンピューターに実行させる降下粉塵量推定プログラムである。
(8)また、本発明は、上記(7)に記載のプログラムを記録したコンピューター読み取り可能な記録媒体である。
上記(2)の発明によれば、粉塵の粒径等の条件に拠って、前記粉塵の地表での反射及び沈着の効果が無視できない場合でも、正確に粉塵挙動の推定ができる。
上記(3)の発明によれば、発塵源の詳細な特性が測定できる場合、この特性に従って、正確に粉塵挙動の推定ができる。
上記(4)の発明によれば、3次元的な乱流拡散係モデルを用い、測定した風速、乱流拡散係数、粉塵粒子の終末沈降速度などの特性に従って、正確に粉塵挙動の推定ができる。
上記(5)の発明によれば、粉塵の粒径が大きい場合や、粉塵の密度が高い場合など、重力による沈降が無視できない場合でも、正確に粉塵挙動の推定ができる。
以下、添付図面を参照して、本発明の好適な実施形態について説明する。
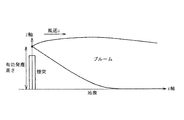
本実施形態では、図2に示すように、発塵源の一例として、工場の煙突からの粉塵粒子の飛散を考える。粉塵粒子は、Heの有効発塵高さから風下方向に設定したx軸を中心軸として飛散する。発塵源はx=0の位置に存在するとして、鉛直方向をz軸に、x軸と交差する水平面の軸をy軸とする。

(6)式の左辺第1項は、粉塵粒子が風の移流によって飛散する量を示す。(6)式の右辺第1項は、粉塵粒子が乱流拡散によってy軸方向に飛散する量を示す。(6)式の右辺第2項は、粉塵粒子が乱流拡散によってz軸方向に飛散する量を示す。(6)式の右辺第3項は、粉塵粒子が重力によって沈降する量を示す。ここで、粉塵粒子が乱流拡散でx軸方向に飛散する量は、風の移流によりx軸方向に飛散する量と比較して小さいため、無視できると仮定した。Ky、Kzは、各々、y軸方向とz軸方向の乱流拡散係数を表す。





通常、風向データの分類は、1方位以上の何方位でも計算でき、入手できる方位データに鑑みて設定すればよい。好ましくは気象庁のアメダスデータに対応させ、16方位を採用し、m=16とする。
風速データの分類は、風速の実測値を直接使用して計算できる。好ましくは、設定期間の最小風速と最大風速との間の区間を、(微風、弱風、通常風、強風)、又は、(微風、弱風、通常風、強風、超強風)等の分類に4または5分割し、n=4またはn=5とすればよい。nが6以上でも計算できるが、場合によっては計算が煩雑になる。分割した風速の範囲のそれぞれにおいて、風速の代表値を選定する。代表値の選定に当たっては、各分割区間に属する風速データのうち、発生頻度の最も大きい風速値を採用してもよいし、分割区間に属する風速データの平均値を採用してもよい。
また、風向計と風速計は、周囲にある建物等の障害物の影響を受けない位置に設置することが好ましい。気象庁が近傍にある場合は、アメダス等の気象庁観測データを使用してもよい。
また、風向と風速を計測する期間の設定は、降下煤塵量の計算期間と同一に設定する。そして、設定した期間において、風速、風向の頻度分布の統計量を決定できるように、風速、風向のサンプリング周期を決定する。例えば、m=16、n=4の場合において、1ヶ月間の期間を設定する場合は、1時間周期の風速、風向データを採取すれば十分である。
なお、上述した、風向、風速情報の入力ステップ、発塵情報の入力ステップ、降下地点情報の入力ステップは、入力の順番は問わず、入れ替わっても構わない。
ステップS06において、粉塵が工場煙突等、周囲の空気より高温で排出される場合は、ステップS03で入力した煙突高さH、排ガス風量W、排ガス風速Vをもとに、有効発塵高さHeを、例えば(11)式により計算する。
また、粒子径の計測範囲を分割し、分割した各々の範囲における代表粒子径を、粉塵粒子径として用いてもよい。この場合は、分割した粒子径の範囲に存在する粉塵粒子の重量比をあらかじめ求めておく。そして、重量の総和が100%になるように、各平均粒子径毎に頻度分布を計算する。そして、各平均粒子径毎の降下煤塵量に、前記の各平均粒子径毎に計算した頻度分布を乗じて、降下煤塵量の総量を求める。粒子径分布測定装置は、沈降法、光透過式等の方法がある。(例えば、非特許文献4、参照)
ステップS07において、ステップS03で入力した粉塵粒子の粒子径d、密度ρをもとに、終末沈降速度wを、前述の(10)式により計算する。

上述の手法によって得られた粉塵の挙動の推定結果に基づき、例えば、煙突等の発塵源の数や設置位置、発塵強度等を適切に設計した上で発塵源を設置することができる。また、集塵機等の発塵抑制対策設備を最適に配置することができる。これによって、粉塵の飛散による環境への影響等を適切に制御することができる。

図8は、本手法を使用して計算した降下煤塵量の計算結果を示す。風向は16方位を採用し、m=16とした。風速は、1年間の最小風速0.1m/s、最大風速9m/sの間を、微風、弱風、通常風、強風の分類に対応させるべく4分割し、n=4とした。具体的には、当該領域での過去の風速の発生頻度をもとに、各々、0.1~1.5m/s、1.5~3m/s、3~6m/s、6~9m/sの区間に分割した。各区間の代表風速として、1m/s、2m/s、4.5m/s、7m/sを計算に採用した。
風向、風速データは、気象庁のアメダスデータを使用し、観測データ間隔1時間の1ヶ月間のデータから風向、風速の頻度分布を算出した。表1に、計算に使用した風向、風速の頻度分布を示す。

図9は、比較例として、文献1にある(1)式で計算した降下煤塵量の計算結果を示す。
図10は、降下煤塵量の実測値をもとに描いたコンター図である。当該領域をほぼ均等に80分割し、各々の分割領域の中心に1台のデポジットゲージを設置した。総計80台のデポジットゲージに10日間堆積した煤塵の重量を計測して、降下煤塵量を求めた。図8は、図9と比較し、実測値である図10とコンター形状がより良く一致しているのが判る。
21 入力装置
22 表示装置
23 記録装置
100 降下煤塵量推定装置
Claims (8)
- 風向及び風速の所定期間における時系列計測値を取得し、前記時系列計測値をもとに、風向及び風速の範囲を、各々m、n個の分割範囲に分割し、風速の前記分割範囲毎に風速代表値を設定し、それぞれの前記分割範囲に含まれる前記時系列計測値の前記所定期間での頻度を求めることによってm×n行列の風向・風速頻度分布を作成し、前記風速代表値及び前記風向・風速頻度分布を風向・風速情報とする風向・風速情報入力工程と;
粉塵の発塵源の情報を入力する発塵源情報入力工程と;
前記風向・風速情報と、前記発塵源の情報と、を用いて、任意の座標点における粉塵濃度cを計算する粉塵濃度計算工程と;
前記粉塵濃度cに基づいて、任意の降下地点における降下粉塵量を計算する降下粉塵量計算工程と;
を備えることを特徴とする降下粉塵量推定方法。 - 前記粉塵濃度計算工程は、前記粉塵の地表での反射率βを更に用いて前記粉塵濃度cを計算することを特徴とする請求項1に記載の降下粉塵量推定方法。
- 前記発塵源情報入力工程では、前記発塵源の3次元空間上での座標と、前記発塵源の発塵強度Qと、前記粉塵の粒子径と、前記粉塵の密度と、前記発塵源からの有効発塵高さHeと、が入力されることを特徴とする請求項2に記載の降下粉塵量推定方法。
- 前記粉塵濃度計算工程は、3次元座標軸上の点(x,y,z)における粉塵濃度c(x,y,z)を(1)式を用いて計算し;
uは風速であり、Ky、Kzは、各々、y軸、z軸方向の乱流拡散係数であり、wは粒子の終末沈降速度であり、前記発塵源のx座標は0であり、前記発塵源のy座標はy0である;
ことを特徴とする請求項3に記載の降下粉塵量推定方法。 - 前記降下粉塵量計算工程は、(2)式又は(3)式を用いて降下粉塵量を計算し;
 c(x,y,z)は、3次元座標軸上の点(x,y,z)における粉塵濃度であり;
Cは降下粉塵量であり、
Kzはz軸方向の乱流拡散係数である;
ことを特徴とする請求項2に記載の降下粉塵量推定方法。 - 風向及び風速の所定期間における時系列計測値を取得し、前記時系列計測値をもとに、風向及び風速の範囲を、各々m、n個の分割範囲に分割し、風速の前記分割範囲毎に風速代表値を設定し、それぞれの前記分割範囲に含まれる前記時系列計測値の前記所定期間での頻度を求めることによってm×n行列の風向・風速頻度分布を作成し、前記風速代表値及び前記風向・風速頻度分布を風向・風速情報とする風向・風速情報入力部と;
粉塵の発塵源の情報が入力される発塵源情報入力部と;
前記風向・風速情報と、前記発塵源の情報と、を用いて、任意の座標点における粉塵濃度cを計算する粉塵濃度計算部と;
前記粉塵濃度cに基づいて、任意の降下地点における降下粉塵量を計算する降下粉塵量計算部と;
を備えることを特徴とする降下粉塵量推定装置。 - 風向及び風速の所定期間における時系列計測値を取得し、前記時系列計測値をもとに、風向及び風速の範囲を、各々m、n個の分割範囲に分割し、風速の前記分割範囲毎に風速代表値を設定し、それぞれの前記分割範囲に含まれる前記時系列計測値の前記所定期間での頻度を求めることによってm×n行列の風向・風速頻度分布を作成し、前記風速代表値及び前記風向・風速頻度分布を風向・風速情報とする風向・風速情報入力手順と;
粉塵の発塵源の情報を入力する発塵源情報入力手順と;
前記風向・風速情報と、前記発塵源の情報と、を用いて、任意の座標点における粉塵濃度cを計算する粉塵濃度計算手順と;
前記粉塵濃度cに基づいて、任意の降下地点における降下粉塵量を計算する降下粉塵量計算手順と;
を備えることを特徴とする降下粉塵量推定プログラム。 - 請求項7に記載の降下粉塵量推定プログラムを記録したコンピューター読み取り可能な記録媒体。
Priority Applications (4)
| Application Number | Priority Date | Filing Date | Title |
|---|---|---|---|
| BRPI0915402A BRPI0915402A2 (pt) | 2008-07-01 | 2009-07-01 | método para estimar a quantidade de queda de poeira, dispositivo para estimar a quantidade de queda de poeira, e programa para estimar a quantidade de queda de poeira |
| CN200980124375.6A CN102077076B (zh) | 2008-07-01 | 2009-07-01 | 下落粉尘量推测方法、下落粉尘量推测装置 |
| KR1020107029518A KR101180167B1 (ko) | 2008-07-01 | 2009-07-01 | 강하 분진량 추정 방법, 강하 분진량 추정 장치 및 컴퓨터 판독 가능한 기록 매체 |
| JP2010519089A JP5026593B2 (ja) | 2008-07-01 | 2009-07-01 | 降下粉塵量推定方法、降下粉塵量推定装置、及び降下粉塵量推定プログラム |
Applications Claiming Priority (2)
| Application Number | Priority Date | Filing Date | Title |
|---|---|---|---|
| JP2008172501 | 2008-07-01 | ||
| JP2008-172501 | 2008-07-01 |
Publications (1)
| Publication Number | Publication Date |
|---|---|
| WO2010001925A1 true WO2010001925A1 (ja) | 2010-01-07 |
Family
ID=41466017
Family Applications (1)
| Application Number | Title | Priority Date | Filing Date |
|---|---|---|---|
| PCT/JP2009/062035 Ceased WO2010001925A1 (ja) | 2008-07-01 | 2009-07-01 | 降下粉塵量推定方法、降下粉塵量推定装置、及び降下粉塵量推定プログラム |
Country Status (5)
| Country | Link |
|---|---|
| JP (1) | JP5026593B2 (ja) |
| KR (1) | KR101180167B1 (ja) |
| CN (1) | CN102077076B (ja) |
| BR (1) | BRPI0915402A2 (ja) |
| WO (1) | WO2010001925A1 (ja) |
Cited By (12)
| Publication number | Priority date | Publication date | Assignee | Title |
|---|---|---|---|---|
| WO2012157508A1 (ja) * | 2011-05-13 | 2012-11-22 | 新日鐵住金株式会社 | 降下煤塵の非定常発塵源位置の探索方法 |
| WO2013024875A1 (ja) * | 2011-08-16 | 2013-02-21 | 新日鐵住金株式会社 | 降下煤塵の非定常発塵源位置の探索方法 |
| JP2013137293A (ja) * | 2011-11-28 | 2013-07-11 | Nippon Steel & Sumitomo Metal | 降下煤塵の非定常発塵源の探索方法 |
| US20140335771A1 (en) * | 2011-12-09 | 2014-11-13 | Toyota Jidosha Kabushiki Kaisha | Cooling device for power storage device and cooling control method for power storage device |
| JP2015031636A (ja) * | 2013-08-05 | 2015-02-16 | 新日鐵住金株式会社 | 降下煤塵量の推定方法、装置、プログラム及び記憶媒体 |
| CN106404624A (zh) * | 2016-08-30 | 2017-02-15 | 深圳益杉创新科技有限公司 | 基于压力检测的空气颗粒物浓度检测方法及装置 |
| CN114034614A (zh) * | 2021-11-16 | 2022-02-11 | 中国矿业大学 | 一种粉尘浓度均匀性检测装置及控制系统 |
| JPWO2023047507A1 (ja) * | 2021-09-24 | 2023-03-30 | ||
| CN116399773A (zh) * | 2023-06-08 | 2023-07-07 | 德州华恒环保科技有限公司 | 一种建筑施工环境粉尘监测系统 |
| CN116651617A (zh) * | 2023-05-06 | 2023-08-29 | 浙江佳环电子有限公司 | 电除尘变频调幅高压电源及其高压输出控制方法 |
| CN116884513A (zh) * | 2023-06-15 | 2023-10-13 | 北京科技大学 | 隧道施工区域人员粉尘暴露水平监测方法、系统及设备 |
| CN117514315A (zh) * | 2023-11-10 | 2024-02-06 | 新疆鼎飞益机械设备有限公司 | 一种矿井智能除尘方法及系统 |
Families Citing this family (4)
| Publication number | Priority date | Publication date | Assignee | Title |
|---|---|---|---|---|
| CN103874937B (zh) * | 2011-08-16 | 2016-01-20 | 新日铁住金株式会社 | 降尘的不稳定尘源位置的探察方法 |
| WO2016198321A1 (en) * | 2015-06-12 | 2016-12-15 | Koninklijke Philips N.V. | Particle sensor and particle sensing method |
| CN106442240A (zh) * | 2016-08-30 | 2017-02-22 | 深圳益杉创新科技有限公司 | 用于空气处理装置的外设颗粒物浓度检测方法及装置 |
| CN118424987A (zh) * | 2024-04-23 | 2024-08-02 | 金华市计量质量科学研究院 | 一种大流量尘埃粒子的计数方法 |
Citations (2)
| Publication number | Priority date | Publication date | Assignee | Title |
|---|---|---|---|---|
| JP2001042052A (ja) * | 1999-07-30 | 2001-02-16 | Weather Information System Co Ltd | ダイオキシン類等の化学物質、微粒状降下物等に対する地域環境モニタリングシステム |
| JP2008089418A (ja) * | 2006-10-02 | 2008-04-17 | Mitsubishi Heavy Ind Ltd | 拡散予測システム、方法、及びプログラム |
Family Cites Families (2)
| Publication number | Priority date | Publication date | Assignee | Title |
|---|---|---|---|---|
| CN2234615Y (zh) * | 1995-05-29 | 1996-09-04 | 南京理工大学 | 便携式激光尘埃粒子计数器光学传感器 |
| JP2005128691A (ja) * | 2003-10-22 | 2005-05-19 | Hitachi Eng Co Ltd | 粉塵拡散シミュレーション装置及び方法 |
-
2009
- 2009-07-01 CN CN200980124375.6A patent/CN102077076B/zh not_active Expired - Fee Related
- 2009-07-01 WO PCT/JP2009/062035 patent/WO2010001925A1/ja not_active Ceased
- 2009-07-01 KR KR1020107029518A patent/KR101180167B1/ko not_active Expired - Fee Related
- 2009-07-01 BR BRPI0915402A patent/BRPI0915402A2/pt active Search and Examination
- 2009-07-01 JP JP2010519089A patent/JP5026593B2/ja active Active
Patent Citations (2)
| Publication number | Priority date | Publication date | Assignee | Title |
|---|---|---|---|---|
| JP2001042052A (ja) * | 1999-07-30 | 2001-02-16 | Weather Information System Co Ltd | ダイオキシン類等の化学物質、微粒状降下物等に対する地域環境モニタリングシステム |
| JP2008089418A (ja) * | 2006-10-02 | 2008-04-17 | Mitsubishi Heavy Ind Ltd | 拡散予測システム、方法、及びプログラム |
Non-Patent Citations (1)
| Title |
|---|
| KUNIHIKO OTSUKA ET AL.: "Koka Baijin Simulation Model no Kaihatsu to sono Tekiyo", SUMITOMO KINZOKU, vol. 46, no. 2, April 1994 (1994-04-01), pages 82 - 88 * |
Cited By (21)
| Publication number | Priority date | Publication date | Assignee | Title |
|---|---|---|---|---|
| CN103460076B (zh) * | 2011-05-13 | 2015-09-16 | 新日铁住金株式会社 | 降尘的不稳定发尘源位置的搜索方法 |
| JP2012255767A (ja) * | 2011-05-13 | 2012-12-27 | Nippon Steel & Sumitomo Metal | 降下煤塵の非定常発塵源位置の探索方法 |
| CN103460076A (zh) * | 2011-05-13 | 2013-12-18 | 新日铁住金株式会社 | 降尘的不稳定发尘源位置的搜索方法 |
| WO2012157508A1 (ja) * | 2011-05-13 | 2012-11-22 | 新日鐵住金株式会社 | 降下煤塵の非定常発塵源位置の探索方法 |
| KR101498411B1 (ko) * | 2011-05-13 | 2015-03-03 | 신닛테츠스미킨 카부시키카이샤 | 강하 매진의 비정상 발진원 위치의 탐색 방법 |
| WO2013024875A1 (ja) * | 2011-08-16 | 2013-02-21 | 新日鐵住金株式会社 | 降下煤塵の非定常発塵源位置の探索方法 |
| JP2013137293A (ja) * | 2011-11-28 | 2013-07-11 | Nippon Steel & Sumitomo Metal | 降下煤塵の非定常発塵源の探索方法 |
| US20140335771A1 (en) * | 2011-12-09 | 2014-11-13 | Toyota Jidosha Kabushiki Kaisha | Cooling device for power storage device and cooling control method for power storage device |
| JP2015031636A (ja) * | 2013-08-05 | 2015-02-16 | 新日鐵住金株式会社 | 降下煤塵量の推定方法、装置、プログラム及び記憶媒体 |
| CN106404624A (zh) * | 2016-08-30 | 2017-02-15 | 深圳益杉创新科技有限公司 | 基于压力检测的空气颗粒物浓度检测方法及装置 |
| WO2023047507A1 (ja) * | 2021-09-24 | 2023-03-30 | 日本電気株式会社 | 領域特定システム、領域特定方法及び領域特定プログラム |
| JP7816364B2 (ja) | 2021-09-24 | 2026-02-18 | 日本電気株式会社 | 領域特定システム、領域特定方法及び領域特定プログラム |
| JPWO2023047507A1 (ja) * | 2021-09-24 | 2023-03-30 | ||
| CN114034614A (zh) * | 2021-11-16 | 2022-02-11 | 中国矿业大学 | 一种粉尘浓度均匀性检测装置及控制系统 |
| CN114034614B (zh) * | 2021-11-16 | 2022-07-29 | 中国矿业大学 | 一种粉尘浓度均匀性检测装置及控制系统 |
| CN116651617A (zh) * | 2023-05-06 | 2023-08-29 | 浙江佳环电子有限公司 | 电除尘变频调幅高压电源及其高压输出控制方法 |
| CN116651617B (zh) * | 2023-05-06 | 2023-11-14 | 浙江佳环电子有限公司 | 电除尘变频调幅高压电源及其高压输出控制方法 |
| CN116399773A (zh) * | 2023-06-08 | 2023-07-07 | 德州华恒环保科技有限公司 | 一种建筑施工环境粉尘监测系统 |
| CN116399773B (zh) * | 2023-06-08 | 2023-08-18 | 德州华恒环保科技有限公司 | 一种建筑施工环境粉尘监测系统 |
| CN116884513A (zh) * | 2023-06-15 | 2023-10-13 | 北京科技大学 | 隧道施工区域人员粉尘暴露水平监测方法、系统及设备 |
| CN117514315A (zh) * | 2023-11-10 | 2024-02-06 | 新疆鼎飞益机械设备有限公司 | 一种矿井智能除尘方法及系统 |
Also Published As
| Publication number | Publication date |
|---|---|
| KR101180167B1 (ko) | 2012-09-05 |
| CN102077076B (zh) | 2013-06-19 |
| JPWO2010001925A1 (ja) | 2011-12-22 |
| JP5026593B2 (ja) | 2012-09-12 |
| CN102077076A (zh) | 2011-05-25 |
| KR20110022640A (ko) | 2011-03-07 |
| BRPI0915402A2 (pt) | 2015-11-03 |
Similar Documents
| Publication | Publication Date | Title |
|---|---|---|
| JP5026593B2 (ja) | 降下粉塵量推定方法、降下粉塵量推定装置、及び降下粉塵量推定プログラム | |
| Brandt | Simulation of the size distribution and erosivity of raindrops and throughfall drops | |
| Roney et al. | Estimating fugitive dust emission rates using an environmental boundary layer wind tunnel | |
| Arritt et al. | Lagrangian numerical simulations of canopy air flow effects on maize pollen dispersal | |
| Hicks et al. | Dry deposition of particles to canopies—A look back and the road forward | |
| JP4404220B2 (ja) | 気体状況予測装置、方法、プログラム、および拡散状況予測システム | |
| Hosseini et al. | Bayesian estimation of airborne fugitive emissions using a Gaussian plume model | |
| JP6136729B2 (ja) | 降下煤塵量の推定方法、装置、プログラム及び記憶媒体 | |
| Erpul et al. | The effect of wind on raindrop impact and rainsplash detachment | |
| Hagen et al. | Analytical solutions and sensitivity analyses for sediment transport in WEPS | |
| Shao et al. | Heterogeneous saltation: Theory, observation and comparison | |
| Hong et al. | Measurement and prediction of soil erosion in dry field using portable wind erosion tunnel | |
| Ha et al. | Development of a micro-scale CFD model to predict wind environment on mountainous terrain | |
| Dare et al. | Modelling wet deposition in simulations of volcanic ash dispersion from hypothetical eruptions of Merapi, Indonesia | |
| Xu et al. | Analysis of dust diffusion from a self-propelled peanut combine using computational fluid dynamics | |
| Reddy et al. | Data assimilation in variable dimension dispersion models using particle filters | |
| Wang et al. | Real-time data driven simulation of air contaminant dispersion using particle filter and UAV sensory system | |
| Isard et al. | A physically based theoretical model of spore deposition for predicting spread of plant diseases | |
| CN117272866A (zh) | 一种粒径分段沙尘质量浓度的变网格模拟方法以及设备 | |
| Noll et al. | Changes in large particle size distribution due to dry deposition processes | |
| TWI698760B (zh) | 汙染源追蹤系統及其方法 | |
| Etyemezian et al. | Field testing and evaluation of dust deposition and removal mechanisms | |
| Reck et al. | Particle deposition in low-speed, high-turbulence flows | |
| CN121562464A (zh) | 一种城市近场的大气污染物溯源方法、系统、设备与介质 | |
| Shao | Dust transport and deposition |
Legal Events
| Date | Code | Title | Description |
|---|---|---|---|
| WWE | Wipo information: entry into national phase |
Ref document number: 200980124375.6 Country of ref document: CN |
|
| 121 | Ep: the epo has been informed by wipo that ep was designated in this application |
Ref document number: 09773503 Country of ref document: EP Kind code of ref document: A1 |
|
| WWE | Wipo information: entry into national phase |
Ref document number: 2010519089 Country of ref document: JP |
|
| WWE | Wipo information: entry into national phase |
Ref document number: 8298/CHENP/2010 Country of ref document: IN |
|
| ENP | Entry into the national phase |
Ref document number: 20107029518 Country of ref document: KR Kind code of ref document: A |
|
| NENP | Non-entry into the national phase |
Ref country code: DE |
|
| 122 | Ep: pct application non-entry in european phase |
Ref document number: 09773503 Country of ref document: EP Kind code of ref document: A1 |
|
| ENP | Entry into the national phase |
Ref document number: PI0915402 Country of ref document: BR Kind code of ref document: A2 Effective date: 20101224 |