WO2009123208A1 - 超音波診断装置 - Google Patents
超音波診断装置 Download PDFInfo
- Publication number
- WO2009123208A1 WO2009123208A1 PCT/JP2009/056703 JP2009056703W WO2009123208A1 WO 2009123208 A1 WO2009123208 A1 WO 2009123208A1 JP 2009056703 W JP2009056703 W JP 2009056703W WO 2009123208 A1 WO2009123208 A1 WO 2009123208A1
- Authority
- WO
- WIPO (PCT)
- Prior art keywords
- data
- image
- elastic
- elasticity
- evaluation data
- Prior art date
Links
Images


Classifications
-
- A—HUMAN NECESSITIES
- A61—MEDICAL OR VETERINARY SCIENCE; HYGIENE
- A61B—DIAGNOSIS; SURGERY; IDENTIFICATION
- A61B5/00—Measuring for diagnostic purposes; Identification of persons
- A61B5/72—Signal processing specially adapted for physiological signals or for diagnostic purposes
- A61B5/7235—Details of waveform analysis
- A61B5/7264—Classification of physiological signals or data, e.g. using neural networks, statistical classifiers, expert systems or fuzzy systems
-
- A—HUMAN NECESSITIES
- A61—MEDICAL OR VETERINARY SCIENCE; HYGIENE
- A61B—DIAGNOSIS; SURGERY; IDENTIFICATION
- A61B5/00—Measuring for diagnostic purposes; Identification of persons
- A61B5/0048—Detecting, measuring or recording by applying mechanical forces or stimuli
- A61B5/0053—Detecting, measuring or recording by applying mechanical forces or stimuli by applying pressure, e.g. compression, indentation, palpation, grasping, gauging
-
- A—HUMAN NECESSITIES
- A61—MEDICAL OR VETERINARY SCIENCE; HYGIENE
- A61B—DIAGNOSIS; SURGERY; IDENTIFICATION
- A61B8/00—Diagnosis using ultrasonic, sonic or infrasonic waves
- A61B8/08—Detecting organic movements or changes, e.g. tumours, cysts, swellings
- A61B8/0833—Detecting organic movements or changes, e.g. tumours, cysts, swellings involving detecting or locating foreign bodies or organic structures
-
- A—HUMAN NECESSITIES
- A61—MEDICAL OR VETERINARY SCIENCE; HYGIENE
- A61B—DIAGNOSIS; SURGERY; IDENTIFICATION
- A61B8/00—Diagnosis using ultrasonic, sonic or infrasonic waves
- A61B8/48—Diagnostic techniques
- A61B8/485—Diagnostic techniques involving measuring strain or elastic properties
-
- G—PHYSICS
- G01—MEASURING; TESTING
- G01S—RADIO DIRECTION-FINDING; RADIO NAVIGATION; DETERMINING DISTANCE OR VELOCITY BY USE OF RADIO WAVES; LOCATING OR PRESENCE-DETECTING BY USE OF THE REFLECTION OR RERADIATION OF RADIO WAVES; ANALOGOUS ARRANGEMENTS USING OTHER WAVES
- G01S7/00—Details of systems according to groups G01S13/00, G01S15/00, G01S17/00
- G01S7/52—Details of systems according to groups G01S13/00, G01S15/00, G01S17/00 of systems according to group G01S15/00
- G01S7/52017—Details of systems according to groups G01S13/00, G01S15/00, G01S17/00 of systems according to group G01S15/00 particularly adapted to short-range imaging
- G01S7/52023—Details of receivers
- G01S7/52036—Details of receivers using analysis of echo signal for target characterisation
- G01S7/52042—Details of receivers using analysis of echo signal for target characterisation determining elastic properties of the propagation medium or of the reflective target
-
- A—HUMAN NECESSITIES
- A61—MEDICAL OR VETERINARY SCIENCE; HYGIENE
- A61B—DIAGNOSIS; SURGERY; IDENTIFICATION
- A61B5/00—Measuring for diagnostic purposes; Identification of persons
- A61B5/72—Signal processing specially adapted for physiological signals or for diagnostic purposes
- A61B5/7235—Details of waveform analysis
- A61B5/7264—Classification of physiological signals or data, e.g. using neural networks, statistical classifiers, expert systems or fuzzy systems
- A61B5/7267—Classification of physiological signals or data, e.g. using neural networks, statistical classifiers, expert systems or fuzzy systems involving training the classification device
-
- G—PHYSICS
- G01—MEASURING; TESTING
- G01S—RADIO DIRECTION-FINDING; RADIO NAVIGATION; DETERMINING DISTANCE OR VELOCITY BY USE OF RADIO WAVES; LOCATING OR PRESENCE-DETECTING BY USE OF THE REFLECTION OR RERADIATION OF RADIO WAVES; ANALOGOUS ARRANGEMENTS USING OTHER WAVES
- G01S15/00—Systems using the reflection or reradiation of acoustic waves, e.g. sonar systems
- G01S15/88—Sonar systems specially adapted for specific applications
- G01S15/89—Sonar systems specially adapted for specific applications for mapping or imaging
- G01S15/8906—Short-range imaging systems; Acoustic microscope systems using pulse-echo techniques
- G01S15/8977—Short-range imaging systems; Acoustic microscope systems using pulse-echo techniques using special techniques for image reconstruction, e.g. FFT, geometrical transformations, spatial deconvolution, time deconvolution
-
- G—PHYSICS
- G16—INFORMATION AND COMMUNICATION TECHNOLOGY [ICT] SPECIALLY ADAPTED FOR SPECIFIC APPLICATION FIELDS
- G16H—HEALTHCARE INFORMATICS, i.e. INFORMATION AND COMMUNICATION TECHNOLOGY [ICT] SPECIALLY ADAPTED FOR THE HANDLING OR PROCESSING OF MEDICAL OR HEALTHCARE DATA
- G16H50/00—ICT specially adapted for medical diagnosis, medical simulation or medical data mining; ICT specially adapted for detecting, monitoring or modelling epidemics or pandemics
- G16H50/20—ICT specially adapted for medical diagnosis, medical simulation or medical data mining; ICT specially adapted for detecting, monitoring or modelling epidemics or pandemics for computer-aided diagnosis, e.g. based on medical expert systems
-
- Y—GENERAL TAGGING OF NEW TECHNOLOGICAL DEVELOPMENTS; GENERAL TAGGING OF CROSS-SECTIONAL TECHNOLOGIES SPANNING OVER SEVERAL SECTIONS OF THE IPC; TECHNICAL SUBJECTS COVERED BY FORMER USPC CROSS-REFERENCE ART COLLECTIONS [XRACs] AND DIGESTS
- Y02—TECHNOLOGIES OR APPLICATIONS FOR MITIGATION OR ADAPTATION AGAINST CLIMATE CHANGE
- Y02A—TECHNOLOGIES FOR ADAPTATION TO CLIMATE CHANGE
- Y02A90/00—Technologies having an indirect contribution to adaptation to climate change
- Y02A90/10—Information and communication technologies [ICT] supporting adaptation to climate change, e.g. for weather forecasting or climate simulation
Definitions
- the present invention relates to an ultrasonic diagnostic apparatus that obtains a tomographic image of a diagnostic region in a subject using ultrasonic waves, and in particular, distortion and / or elasticity of each point on an image from RF signal frame data arranged in time series.
- the present invention relates to an ultrasonic diagnostic apparatus capable of calculating a rate and displaying it as an elastic image indicating the hardness or softness of a living tissue.
- a conventional general ultrasonic diagnostic apparatus includes an ultrasonic transmission / reception unit that transmits and receives ultrasonic waves to a subject, an ultrasonic transmission / reception control unit that controls ultrasonic transmission / reception, and a reflected echo signal from the ultrasonic reception unit. It comprises a tomographic scanning means for repeatedly obtaining tomographic image data in a subject including a moving tissue at a predetermined cycle, and an image display means for displaying time-series tomographic data obtained by the tomographic scanning means. The structure of the living tissue inside the subject is displayed as a B-mode image, for example.
- an ultrasonic diagnostic apparatus capable of acquiring and displaying elasticity data of a subject tissue has been developed (for example, Patent Document 1).
- an external force is applied from the body surface of the subject by a manual method, compresses the living tissue, and is adjacent in time series.
- the displacement at each point is obtained using the correlation calculation of the ultrasonic reception signals of 2 frames (2 continuous frames).
- the distortion is measured by spatially differentiating the displacement, and the distortion data is imaged.
- the elastic modulus data represented by the Young's modulus of the living tissue is imaged from the stress distribution and strain data due to the external force.
- the hardness and softness of the living tissue can be displayed by an elastic image based on such strain data and elastic modulus data (hereinafter referred to as elastic frame data).
- the above-described technique for obtaining elastic images is expected to be applied not only to the diagnosis of mass lesions such as cancer but also to the diagnosis of diffuse diseases.
- a diffuse disease when a local sclerotic tissue such as a nodule is scattered in the surrounding soft tissue, an elastic image obtained by applying the above technique also exhibits a mottled pattern reflecting the non-uniform structure.
- the nodule spreads into the liver parenchyma, and the mottled pattern of the elastic image becomes complicated.
- the examiner can evaluate the progress of the disease based on the state of the mottled pattern.
- the examiner visually observes the displayed elasticity image and evaluates the progress of the disease. Therefore, a method for objectively evaluating the progress of a disease from image information of an elastic image is desired.
- the present invention provides an ultrasonic diagnostic apparatus capable of presenting objective evaluation information based on an elasticity image, specifically using elasticity data and image information of the elasticity image. It is an object of the present invention to provide an ultrasonic diagnostic apparatus capable of classifying elastic images and presenting information that evaluates the progress of disease.
- An ultrasonic diagnostic apparatus of the present invention that solves the above problems includes an ultrasonic transmission / reception unit that transmits / receives ultrasonic waves in a subject, and a tomogram based on RF signal frame data received from the subject by the ultrasonic transmission / reception unit Based on the tomographic image construction means for generating an image, the elasticity information calculation means for calculating the elasticity data of the biological tissue of the subject using the RF signal frame data, and the elasticity data calculated by the elasticity information calculation means Evaluation data generation for generating evaluation data for evaluating the structure of the living tissue based on the elasticity image, comprising elasticity image construction means for generating an elasticity image and display means for displaying the tomographic image and / or the elasticity image And classification means for classifying the elasticity image using the evaluation data generated by the evaluation data generation means and displaying the classification result on the display means. It is characterized by that.
- the tissue analysis tool of the present invention is an analysis tool for analyzing lesion information of the tissue of the subject using RF signal frame data acquired from within the subject, and two or more RFs obtained in time series Displacement data calculation means for calculating displacement data using signal frame data, and elasticity data calculation for calculating elasticity data consisting of strain and / or elastic modulus at each point of the cross section of the object to be examined using the displacement data Means, elasticity image generating means for generating elasticity image data of the object cross section from the elasticity data, analyzing the elasticity data and elasticity image, and including a histogram of elasticity data, statistical processing data, and complexity of the diseased tissue Evaluation data generating means for generating a plurality of evaluation data, evaluation data selecting means for selecting at least one of the plurality of evaluation data, and the evaluation data Using the evaluation data data selecting means has selected, characterized in that a classifying means for classifying the elasticity image into any one of a plurality of groups.
- the ultrasonic diagnostic apparatus of the present invention can objectively evaluate the progress of disease.
- the figure which shows the whole structure of one Embodiment of the ultrasonic diagnosing device of this invention. 1 is a diagram showing the configuration of a color scan converter of the ultrasonic diagnostic apparatus in FIG.
- the figure which shows the example of analysis by the elasticity image evaluation part The figure which shows the structure of the image classification part of the ultrasound diagnosing device of FIG.
- the figure which shows the example of the evaluation data stored in the memory of an image classification part The figure which shows an example of the image classification part (multivariate analysis part) Obtained in the examples
- 1 ultrasonic transmission / reception control unit 2 transmission unit, 3 probe, 4 reception unit, 5 phasing addition unit, 6 signal processing unit, 7 monochrome scan converter, 8 RF frame data selection unit, 9 displacement measurement unit, 10 elasticity Data calculation unit, 11 Elastic image evaluation unit, 12 Image classification unit, 13 Color scan converter, 14 Switching adder, 15 Image display, 16 Control unit, 17 Input device, 111 Histogram calculation unit, 112 Statistical processing unit, 113 Detection Area evaluation unit, 121 evaluation data selection unit, 122 memory, 123 multivariate analysis unit.
- FIG. 1 is a block diagram showing an embodiment of an ultrasonic diagnostic apparatus according to the present invention.
- this ultrasonic diagnostic apparatus includes an ultrasonic transmission / reception control unit 1, a transmission unit 2, an ultrasonic probe 3, a reception unit 4, and a phasing addition unit 5 as main components.
- a scan converter 13, a switching adder 14, an image display 15, a control unit 16, and an input device 17 such as a keyboard are provided.
- the ultrasonic diagnostic apparatus is appropriately operated by an external operator via the input device 17 and the control unit 16.
- the signal processing unit 6 and the black and white scan converter 7 constitute a tomographic image forming unit that generates a tomographic image, and create a tomographic image such as a B mode.
- the RF signal frame data selection unit 8, the displacement measurement unit 9, the elasticity data calculation unit 10, and the color scan converter 13 constitute an elasticity image configuration unit that generates an elasticity image, and the elasticity image evaluation unit 11 and the image classification unit 12 have elasticity.
- the image analysis unit is configured.
- This ultrasonic diagnostic apparatus has a function of automatically analyzing an elastic image and displaying the result by an elastic image analysis unit.
- the function of the elastic image analysis unit is realized by a program in a computer incorporated in the ultrasonic diagnostic apparatus.
- a computer that realizes the function of the elastic image analysis unit can be provided independently of the ultrasonic diagnostic apparatus.
- the ultrasonic transmission / reception control unit 1 controls the transmission unit 2 and the reception unit 4, and controls the timing of transmitting the ultrasonic wave to the inspection target via the ultrasonic probe 3 and receiving the ultrasonic wave reflected from the inspection target. To do.
- the ultrasonic probe 3 is formed by arranging a large number of transducers in a strip shape, and transmits and receives ultrasonic waves to a subject by performing beam scanning mechanically or electronically. Although not shown, the ultrasonic probe 3 incorporates a transducer that is a source of ultrasonic waves and receives reflected echoes. Each transducer converts the input pulse wave or continuous wave transmission signal into an ultrasonic wave and emits it, and receives the ultrasonic wave emitted from the inside of the subject and converts it into an electric signal. And has a function of outputting.
- the ultrasonic probe 3 constitutes a compression surface for applying a compression operation to the subject when receiving / transmitting ultrasonic waves.
- a compression plate is attached to the ultrasonic transmission / reception surface of the ultrasonic probe 3, and this compression plate is brought into contact with the body surface of the subject, and the compression surface is manually moved up and down to be covered. Compress the specimen. This effectively gives a stress distribution in the body cavity of the diagnosis site of the subject.
- the compression plate may include a pressure sensor. It is also possible to use compression by heartbeat or arterial pulsation instead of manual compression, and in this case, the compression plate can be omitted.
- the transmission unit 2 generates a transmission pulse for generating an ultrasonic wave by driving the ultrasonic probe 3, and has a convergence point of the ultrasonic wave transmitted by the built-in transmission phasing / adding unit.
- the depth is set.
- the receiving unit 4 amplifies the reflected echo signal received by the ultrasonic probe 3 with a predetermined gain.
- a number of received signals corresponding to the number of amplified transducers are input to the phasing adder 5 as independent received signals.
- the phasing / adding unit 5 adjusts the phases of the received signals amplified by the receiving unit 4 and then adds them, and outputs RF signal frame data at a predetermined frame rate.
- the signal processor 6 receives the received signal (RF signal frame data) from the phasing adder 5 and performs various signal processing such as gain correction, log correction, detection, contour enhancement, and filter processing.
- ultrasonic probe 3 ultrasonic transmission / reception control unit 1, transmission unit 2, reception unit 4, phasing addition unit 5 and signal processing unit 6 constitute ultrasonic transmission / reception means, and an ultrasonic transducer A tomographic image is obtained by scanning the ultrasonic beam in a certain direction in the body of the subject using 3.
- the monochrome scan converter 7 has tomographic scanning means for reading out RF signal frame data output from the signal processing unit 6 of the above-described ultrasonic transmission / reception means at a television system cycle and means for controlling the system. ing. Specifically, an A / D converter that converts a reflected echo signal from the signal processing unit 6 into a digital signal, and a plurality of sheets that store tomographic image data digitized by the A / D converter in time series A frame memory and a controller for controlling these operations are included.
- the RF signal frame data selection unit 8, the displacement measurement unit 9, the elasticity data calculation unit 10, and the color scan converter 13 constituting the elasticity image configuration unit are branched from the output side of the phasing addition unit 5.
- a switching adder 14 is provided on the output side of the monochrome scan converter 7 and the color scan converter 13.
- the RF signal frame data selection unit 8 includes a frame memory that sequentially secures RF signal frame data sequentially output over time at the frame rate of the ultrasonic diagnostic apparatus from the phasing addition unit 5, and a plurality of frames secured in the past.
- One RF signal frame data is selected from the RF signal frame data, and is output to the displacement measuring unit 9 as one set with the RF signal frame data newly secured in the frame memory.
- a reference for selecting one from the past RF signal frame data is given by a command from the control unit 16. For example, the operator may specify a specific time before the start of the compression operation and select the RF signal frame data acquired at that time, or when the compression operation is automatically performed according to the pulsation, etc. It is also possible to automatically determine a state in which there is no pressure from the pulsation, and to select the RF signal frame data obtained in that state.
- the signal output from the phasing addition part 5 was described as RF signal frame data, this may be a signal in the form of I and Q signals obtained by complex demodulation of the RF signal, for example.
- the displacement measurement unit 9 performs one-dimensional or two-dimensional correlation processing on the set of RF signal frame data output from the RF signal frame data selection unit 8, and the displacement or movement vector ( The displacement direction and magnitude) are measured, and displacement frame data and correlation frame data are generated.
- a method for detecting the movement vector for example, there are a block matching method and a gradient method as described in Patent Document 1.
- the block matching method divides the image into blocks consisting of N ⁇ N pixels, for example, searches the previous frame for the block closest to the target block in the current frame, and refers to these to predictive coding Is to do.
- the elasticity data calculation unit 10 calculates the strain amount and elastic modulus of each measurement point on the tomogram from the displacement frame data output from the displacement measurement unit 9, and numerical data on the amount of elasticity or elastic modulus (elastic frame data) And output to the color scan converter 13.
- the amount of strain is an index indicating the hardness of the tissue, and is expressed by ⁇ d / D where D is the thickness of a predetermined region in the initial stage (without compression), and ⁇ d is the compression amount due to compression.
- the displacement can be obtained by spatial differentiation.
- Elastic modulus is expressed by Young's modulus, rigidity modulus, bulk modulus, etc.For example, Young's modulus Ym is the stress (pressure) at each calculation point, as shown in Equation (1). Calculate by dividing by.
- Ym (i, j) Pressure (i, j) / Strain (i, j) (1)
- the pressure applied to the body surface is measured directly with a pressure sensor interposed between the contact surface of the body surface and the compression mechanism, or a method described in JP 2005-66041 A As described above, the deformation of the pressure measuring deformable body can be measured by a method of detecting by signal processing.
- the elasticity data calculation unit 10 performs various image processing such as smoothing processing in the coordinate plane, contrast optimization processing, and smoothing processing in the time axis direction between frames on the calculated elasticity frame data, and after processing Elastic frame data may be output as a strain amount.
- the color scan converter 13 reads the elastic frame data sent from the elastic data calculation unit 10 in a television system cycle, and gives a predetermined color and gradation according to the value of the elastic data to obtain image data. Displayed on the display 15 via 14.
- the color scan converter 13 includes a gradation circuit 131 and a hue conversion circuit 132.
- the gradation circuit 131 gradations the elastic frame data output from the elastic data calculation unit 10.
- the range to be gradation and the upper limit value and the lower limit value of the elastic frame data are input, and the element data of the elastic frame data within the selected range is input.
- the element data of the selection range is converted into a plurality of levels (for example, 255 levels) to generate elastic gradation frame data.
- An area to be gradationized that is, a selection range is set in a region of interest (ROI) set by the control unit 16, and can be arbitrarily changed by an operator.
- the upper limit value and the lower limit value of the gradation are output from the elasticity data calculation unit 10 or determined by a command from the control unit 16.
- the hue conversion circuit 132 converts the corresponding area in the elasticity image frame data into a red code for an area where the distortion is greatly measured in the elasticity gradation frame data, On the other hand, for the area where the distortion is measured to be small, the corresponding area in the elastic image frame data is converted into a blue code.
- the color scan converter 13 may be a black and white scan converter, and an area where a large distortion is measured brightens the luminance of the area in the elastic image data, and conversely, an area where a small distortion is measured is the elastic image data. You may make it make the brightness
- the switching adder 14 inputs the black and white tomographic image data from the black and white scan converter 7 and the elastic image data output from the color scan converter 13, and adds or switches both images. Thereby, only one of black and white tomographic image data and color elastic image data can be output, or both image data can be added and combined and output. Further, for example, as described in Japanese Patent Application Laid-Open No. 2004-135929, a color tomographic image may be displayed in a translucent manner on a monochrome tomographic image.
- the image display 15 displays time-series tomographic image data obtained by the black and white scan converter 7, that is, the B-mode tomographic image and the elastic image obtained by the color scan converter 13, via the switching adder 14.
- a D / A converter that converts the image data output from the monochrome scan converter 7 and / or the color scan converter 13 into an analog signal, and a color television that receives the analog video signal from the D / A converter and displays it as an image It consists of a monitor.
- the image display 15 displays the analysis result by the elastic image analysis unit.
- the signal processing unit 6 has a function of extracting a harmonic component of a received signal or a function of extracting a Doppler component, as a black and white tomogram, in addition to a general B-mode image, a harmonic of the received signal
- a tissue harmonic tomogram or a tissue plastic image in which components are imaged is displayed.
- the elastic image evaluation unit (evaluation data generation means) 11 and the image classification unit 12 constituting the elastic image analysis unit input the elastic frame data output from the elastic data calculation unit 10, and objectively evaluate the elastic frame data. ⁇ Classify. Details of the elastic image evaluation unit 11 and the image classification unit 12 will be described in detail with reference to FIGS.
- the elastic image evaluation unit 11 includes a histogram calculation unit 111, a statistical processing unit 112, and a drawing area evaluation unit 113, and displays an elastic image drawn by the elastic frame data in the image classification unit 12. Evaluation data serving as an index for classification into any of a plurality of groups is calculated.
- the histogram calculation unit 111 counts the number of strains or the number of appearances of the elastic modulus from the elastic frame data output from the elastic data calculation circuit 10, and creates histogram data.
- the histogram corresponds to the distribution of tissue having different hardness in the elastic image, and itself serves as an index for image classification, but in this embodiment, the digitized data used for automatic classification by the image classification unit 12 Therefore, the degree of distortion (skewness) and kurtosis of the histogram are calculated.
- FIG. 4 shows an analysis example by the elastic image evaluation unit 11 using a phantom.
- Figures 4 (a) to 4 (c) are diagrams showing a histogram of the amount of strain obtained from elastic frame data measured by an ultrasound diagnostic device using a phantom, and (a) uses a phantom that simulates a homogeneous tissue.
- FIG. 4 (b) shows an example using a phantom with scattered inclusions
- FIG. 4 (c) shows an example using a phantom with star-shaped inclusions.
- the shape of the histogram is symmetric, but when there is an inclusion, the symmetry is poor.
- Such distortion degree and kurtosis of the histogram can be converted into numerical data as evaluation data by, for example, the following equations (2), (3) ((Equation 1), (Equation 2)).
- n is the number of samples
- x (with an overline) is the average
- ⁇ is the standard deviation.
- the statistical processing unit 112 calculates statistical processing data such as the average value and standard deviation of the elastic frame data (strain or elastic modulus) described above, and digitizes the strain amount or the elastic modulus distribution.
- Elastic frame data is data consisting of elastic data (strain or elastic modulus) at each point of frame data coordinates (i, j), and the average value is obtained by dividing the total elastic data of each point by the number of points. can get.
- the drawing area evaluation unit 113 first binarizes the elastic frame data with the binarization threshold Bth to create detection frame data.
- FIGS. 4D to 4F are diagrams showing examples of images drawn by the detection frame data generated by the drawing area evaluation unit 113 using the elastic frame data of the phantom described above.
- a region drawn in white is a region to be evaluated (for example, a region having a lesion).
- the number of areas drawn in white, the area, the complexity of the shape, and the like are calculated.
- the ratio (area ratio) of the area of the region (drawing region) where the amount of distortion is greater than or equal to the threshold in the binarized image to the other region area is calculated.
- the simplest shape is a circle, and the longer the perimeter, the more complex the region of the same area.
- the complexity can be defined by the following equation (4).
- Complexity (perimeter) 2 / area (4)
- the extent and shape of the target strain amount or elastic modulus region i.e., a region having a strain amount or elastic modulus greater than or less than the threshold Bth
- evaluation data used by the image classification unit 12 described later is obtained. It is done.
- the threshold value Bth can be arbitrarily set by the operator via the control unit 16, but a threshold value that maximizes the complexity is obtained so that a binarized image in which the rendering area is emphasized is obtained. It is also possible to use it.
- a feature amount using a co-occurrence matrix which is a general method for statistically calculating textures, for example, homogeneity, heterogeneity, etc. , Contrast, angular second moment, entropy, and inverse difference moment can be used as evaluation data.
- the various evaluation data calculated by the elastic image evaluation unit 11 serve as a classification index in the image classification unit. Further, the operator inputs the result of the test, for example, the result of the blood test, via the control unit 16. It is also possible to add to the evaluation index.
- the image classification unit 12 uses at least one evaluation data among the histogram data, statistical processing data, and rendering area evaluation data calculated by the elastic image evaluation unit 11 described above, to generate at least two elastic images. As shown in FIG. 5, an evaluation data selection unit 121, a memory 122, and a multivariate analysis unit 123 are provided.
- the memory 122 stores elasticity image data and evaluation data of each group whose diagnosis is confirmed by pathological diagnosis or the like. New object diagnostic information and evaluation data generated by the ultrasonic diagnostic apparatus are stored in the memory 122 as needed.
- An example of evaluation data stored in the memory is shown in FIG. In FIG. 6, the average value of the distortion amount, the area ratio, the complexity, and the distortion degree of the histogram of the elastic image data classified into each group are shown in a graph for each parameter. In the figure, the value indicated by r indicates the correlation coefficient between the parameter and the classification, and the larger r, the higher the correlation. The calculated correlation coefficient is also stored in the memory 122 for each parameter.
- Evaluation data selection unit 121 selects parameters used for evaluation.
- the parameter selection method is an evaluation parameter having a high correlation when classifying the elastic images of each group stored in the memory 122 in the image classification unit 12.
- There is a way to choose For example, by default, a predetermined number of parameters having a high correlation with the classification are selected in order from the top, and the selected parameters are displayed on the display 14. The operator arbitrarily deletes or adds the selected parameter, and determines the parameter used for classification.
- the multivariate analysis unit 123 inputs the evaluation data of at least one parameter selected by the evaluation data selection unit 121, and the classification result, that is, the elastic image having the evaluation data belongs to which group among the plurality of groups. The result indicating whether or not
- the multivariate analysis methods adopted by the multivariate analysis unit 123 include, for example, multiple regression analysis, discriminant analysis, principal component analysis, quantification method, factor analysis, cluster analysis, multidimensional scaling, neural network, etc. However, a classification method using a perceptron of a neural network will be described here.
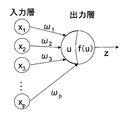
- Fig. 7 shows the structure of a simple perceptron as an example of a neural network.
- a simple perceptron consists of an input layer and an output layer consisting of a single unit (neuron).
- Evaluation data of the parameter selected by the evaluation data selection unit 121 is input to the input layer. For example, if four parameters are selected as parameters, the average value of the distortion amount, the standard deviation, the area ratio of the region where the distortion amount is greater than or equal to the threshold value in the binarized image (drawing region), and the complexity, the elasticity image evaluation
- the values of the parameters calculated by the unit 11, that is, the evaluation data x1, x2, x3, x4 are input.
- Equation 3 the sum u obtained by weighting the input load xi with the coupling load ⁇ i is converted by a predetermined function f (u), and the value is output.
- a threshold function or a linear function is used as the function f (u) used in the output layer.
- f (u) 1 when u is larger than the threshold value h
- f (u) 0 when u is smaller
- a simple perceptron using a threshold function is used as the output layer conversion function, a plurality of simple perceptrons having different output layer threshold values are arranged in parallel and classified into a plurality of groups.
- threshold values are set in multiple stages according to the number of groups, and the output values are classified into a plurality of groups.
- the perceptron is characterized in that the output signal is compared with a teacher signal (correct answer), and when it is different, the coupling weight ⁇ i and the threshold value h are changed, that is, learning is performed. Specifically, when the difference between the teacher signal z * and the output value z is ⁇ , as shown in Equation (6) (Equation 4), ⁇ 2 is corrected so as to be the minimum combined load ⁇ i. To do.
- ⁇ is a learning coefficient.
- the teacher signal for example, a result (any one of the first to Nth groups) diagnosed by the pathological diagnosis for the evaluation target is used.
- Such perceptron learning can be performed using a plurality of elastic image data whose diagnosis has been determined in advance and evaluation data thereof. Moreover, it can be performed each time a correct answer (confirmed diagnosis result) is obtained for a new classification result, thereby improving the accuracy of the result.
- the classification result is output using the latest connection weight ⁇ i and threshold h.
- the classification result by the multivariate analysis unit 123 is sent to the switching adder 14 and displayed on the image display 15 together with the tomographic image and the elasticity image.
- a display method any method such as displaying the classified group name or plotting on a graph with the group as the horizontal axis and the vertical axis as the output value (u) can be employed.
- the ultrasonic diagnostic apparatus of the present embodiment using the elasticity data obtained from the RF frame data, creation of evaluation data such as a histogram, statistical processing data, binarized frame data, etc., and at least of these evaluation data By selecting one and analyzing by multivariate analysis, it is possible to provide information that objectively indicates the progress of the disease.
- evaluation data such as a histogram, statistical processing data, binarized frame data, etc.
- the function of the image analysis unit including the image evaluation unit 11 and the image classification unit 12 has been described as an internal function of the ultrasonic diagnostic apparatus. However, these functions are independent of the ultrasonic diagnostic apparatus. It can also be constructed as an image analysis tool on a computer. In this case, it is possible to transfer the elastic frame data from the ultrasonic diagnostic apparatus to the image analysis tool and perform image diagnosis remotely.
- a liver region was selected from an elastic image obtained by an ultrasonic diagnostic apparatus, and image analysis according to the present invention was performed.
- image analysis according to the present invention was performed.
- the average value, standard deviation, and area ratio and complexity of the region depicted in the binarized image are calculated for the selected region, and these are used as evaluation data for no fibrosis (stage 0), portal vein Fibrosis expansion (stage 1), fibrous bridge formation (stage 2), fibrous bridge formation with lobular distortion (stage 3), and cirrhosis (stage 4) were classified.
- the horizontal axis indicates the stage
- the vertical axis indicates the output (arbitrary unit) of the image classification unit
- the output value of the patient whose stage is determined by pathological diagnosis is plotted for each stage.
- a range indicated by an arrow indicates a range classified by the image classification unit. The correlation between this classification result and the stage was 0.71, confirming that the correlation was very good compared to the correlation of individual parameters (Fig. 6).
Landscapes
- Health & Medical Sciences (AREA)
- Life Sciences & Earth Sciences (AREA)
- Engineering & Computer Science (AREA)
- Physics & Mathematics (AREA)
- Medical Informatics (AREA)
- Molecular Biology (AREA)
- Veterinary Medicine (AREA)
- Public Health (AREA)
- Biophysics (AREA)
- General Health & Medical Sciences (AREA)
- Pathology (AREA)
- Animal Behavior & Ethology (AREA)
- Biomedical Technology (AREA)
- Heart & Thoracic Surgery (AREA)
- Surgery (AREA)
- Radiology & Medical Imaging (AREA)
- Computer Networks & Wireless Communication (AREA)
- Remote Sensing (AREA)
- Nuclear Medicine, Radiotherapy & Molecular Imaging (AREA)
- General Physics & Mathematics (AREA)
- Radar, Positioning & Navigation (AREA)
- Artificial Intelligence (AREA)
- Evolutionary Computation (AREA)
- Fuzzy Systems (AREA)
- Mathematical Physics (AREA)
- Computer Vision & Pattern Recognition (AREA)
- Physiology (AREA)
- Psychiatry (AREA)
- Signal Processing (AREA)
- Ultra Sonic Daignosis Equipment (AREA)
Abstract
Description
式中、i,jは、フレームデータの座標を表し、i,j=1,2,3,・・・である。
また、体表に与えられた圧力は、体表と圧迫機構との接触面に圧力センサーを介在させ、この圧力センサーによって直接的に計測したり、特開2005-66041号公報に記載された方法のように、圧計測用変形体の変形を信号処理によって検出する方法などで計測することができる。


式(2)、(3)において、nはサンプル数、x(上線付)は平均、σは標準偏差である。
統計処理部112は、前述の弾性フレームデータ(歪みあるいは弾性率)の平均値、標準偏差など統計処理データを算出し、歪み量もしくは弾性率の分布を数値化する。弾性フレームデータは、フレームデータの座標(i,j)の各点における弾性データ(歪み量あるいは弾性率)からなるデータであり、平均値は各点の弾性データの合計を点数で除することにより得られる。
形状は、最も単純な形状は円であり、同一面積の領域でも周囲長が長いほど複雑となる。
複雑度=(周囲長)2/面積 (4)
こうして、目的とする歪み量もしくは弾性率の領域(すなわち閾値Bth以上あるいは以下の歪み量もしくは弾性率を持つ領域)の拡がりや形状が数値化され、後述する画像分類部12で用いる評価データが得られる。

出力層で用いる関数f(u)は、しきい関数やリニア関数が用いられる。例えば、しきい関数の場合には、uが閾値hよりも大きい場合はf(u)=1、小さい場合はf(u)=0とし、出力値zをz=f(u)とする。また出力が入力に対し直線的に増減するリニア関数の場合には、入力値uがそのまま出力値となる。
式中、εは学習係数である。教師信号としては、評価対象について、例えば病理診断によって診断された結果(第1~第Nのグループのいずれか)が用いられる。このようなパーセプトロンの学習は、予め診断が確定された複数の弾性画像データとその評価データを用いて行なうことができる。また新たな分類結果について正解(確定した診断結果)が得られるたびに行なうことができ、それにより結果の正確性を高めることができる。
病理診断によって診断が確定した肝疾患61例について、超音波診断装置で得られた弾性画像から肝臓領域を選択し、本発明による画像解析を行なった。即ち選択された領域について歪み量の平均値、標準偏差、二値化画像で描出された領域の面積比および複雑度を算出し、これらを評価データとして、線維化なし(ステージ0)、門脈域の線維性拡大(ステージ1)、線維性架橋形成(ステージ2)、小葉のひずみを伴う線維性架橋形成(ステージ3)、肝硬変(ステージ4)の各ステージへの分類を行なった。
Claims (8)
- 被検体内に超音波を送受信する超音波送受信手段と、前記超音波送受信手段が受信した被検体内からのRF信号フレームデータに基づいて断層画像を生成する断層画像構成手段と、前記RF信号フレームデータを用いて前記被検体の生体組織の弾性データを算出する弾性情報演算手段と、前記弾性情報演算手段で算出された弾性データに基づいて弾性画像を生成する弾性画像構成手段と、前記断層画像及び/又は前記弾性画像を表示する表示手段とを備えた超音波診断装置において、
前記弾性画像に基き前記生体組織の特性を評価する評価データを生成する評価データ生成手段と、前記評価データ生成手段が生成した評価データを用いて前記弾性画像を分類し、分類結果を前記表示手段に表示させる分類手段とをさらに備えたことを特徴とする超音波診断装置。 - 請求項1に記載の超音波診断装置であって、
前記評価データ生成手段が生成する評価データは、前記弾性画像における弾性データの頻度を表すヒストグラム、弾性データを統計処理した統計データ、特定の弾性データを持つ領域の形態を数値化した領域評価データ、及びこれらから派生したデータの少なくとも一つを含み、
前記分類手段は、前記評価データの少なくとも一つを選択する評価データ選択手段を備え、前記評価データ選択手段が選択した評価データを用いて、前記弾性画像を2以上のグループに分類することを特徴とする超音波診断装置。 - 請求項2に記載の超音波診断装置であって、
前記分類手段は、予め2以上のグループに分類された複数の弾性画像の評価データをデータベースとして記憶する記憶手段を備え、前記評価データ選択手段は、前記データベースに蓄積された弾性画像の評価データとグループとの相関を算出し、相関が高い評価データを選択することを特徴とする超音波診断装置。 - 請求項1に記載の超音波診断装置であって、
前記分類手段は、少なくとも入力層および出力層を含み、複数の評価データを入力とし、分類結果を出力とし、入力から出力への結合荷重および閾値は、前記出力と既知のデータから得られた教師信号との差が最小となるように変更されることを特徴とする超音波診断装置。 - 請求項1に記載の超音波診断装置であって、
少なくとも一つ以上のパラメータの評価データが入力され、前記評価データを持つ弾性画像が複数のグループのうちどのグループに属しているかを示す結果を出力する多変量解析手段を備えることを特徴とする超音波診断装置。 - 請求項5に記載の超音波診断装置であって、
パラメータは、歪み量の平均値、標準偏差、二値化画像において歪み量が閾値以上の領域(描出領域)の面積比、および複雑度を含むことを特徴とする超音波診断装置。 - 請求項1に記載の超音波診断装置であって、
前記分類手段は、重回帰分析、判別分析、主成分分析、数量化法、因子分析、クラスター分析、多次元尺度法、ニューラルネットワークのいずれか1つを用いて分類することを特徴とする超音波診断装置。 - 被検体内から取得されたRF信号フレームデータを用いて、前記被検体の組織の病変情報を解析する解析ツールを備えた超音波診断装置であって、前記解析ツールは、時系列で得られるRF信号フレームデータを用いて変位データを算出する変位データ算出手段と、
前記変位データを用いて検査対象である被検体断面の各点における歪み及び/又は弾性率からなる弾性データを算出する弾性データ算出手段と、
前記弾性データから前記被検体断面の弾性画像を生成する弾性画像生成手段と、
前記弾性データ及び弾性画像を解析し、弾性データのヒストグラム、統計処理データおよび病変組織の複雑度を含む複数の評価データを生成する評価データ生成手段と、
前記複数の評価データの少なくとも一つを選択する評価データ選択手段と、
前記評価データ選択手段が選択した評価データを用いて、前記弾性画像を複数のグループのいずれかに分類する分類手段とを備えたことを特徴とする超音波診断装置。
Priority Applications (4)
| Application Number | Priority Date | Filing Date | Title |
|---|---|---|---|
| CN2009801112092A CN101980664B (zh) | 2008-03-31 | 2009-03-31 | 超声波诊断装置 |
| EP09727909.5A EP2263545B1 (en) | 2008-03-31 | 2009-03-31 | Ultrasonograph |
| US12/935,694 US8718339B2 (en) | 2008-03-31 | 2009-03-31 | Ultrasonic diagnostic arrangements selecting parameters for selecting relevant estimation data for classifying an elasticity image |
| US14/220,689 US9301732B2 (en) | 2008-03-31 | 2014-03-20 | Ultrasonic diagnostic arrangements selecting parameters for selecting relevant estimation data for classifying an elasticity image |
Applications Claiming Priority (2)
| Application Number | Priority Date | Filing Date | Title |
|---|---|---|---|
| JP2008089328A JP5304986B2 (ja) | 2008-03-31 | 2008-03-31 | 超音波診断装置 |
| JP2008-089328 | 2008-03-31 |
Related Child Applications (2)
| Application Number | Title | Priority Date | Filing Date |
|---|---|---|---|
| US12/935,694 A-371-Of-International US8718339B2 (en) | 2008-03-31 | 2009-03-31 | Ultrasonic diagnostic arrangements selecting parameters for selecting relevant estimation data for classifying an elasticity image |
| US14/220,689 Division US9301732B2 (en) | 2008-03-31 | 2014-03-20 | Ultrasonic diagnostic arrangements selecting parameters for selecting relevant estimation data for classifying an elasticity image |
Publications (1)
| Publication Number | Publication Date |
|---|---|
| WO2009123208A1 true WO2009123208A1 (ja) | 2009-10-08 |
Family
ID=41135576
Family Applications (1)
| Application Number | Title | Priority Date | Filing Date |
|---|---|---|---|
| PCT/JP2009/056703 WO2009123208A1 (ja) | 2008-03-31 | 2009-03-31 | 超音波診断装置 |
Country Status (5)
| Country | Link |
|---|---|
| US (1) | US8718339B2 (ja) |
| EP (1) | EP2263545B1 (ja) |
| JP (1) | JP5304986B2 (ja) |
| CN (2) | CN103349557B (ja) |
| WO (1) | WO2009123208A1 (ja) |
Cited By (1)
| Publication number | Priority date | Publication date | Assignee | Title |
|---|---|---|---|---|
| CN107392893A (zh) * | 2017-06-30 | 2017-11-24 | 上海联影医疗科技有限公司 | 组织密度分析方法及系统 |
Families Citing this family (35)
| Publication number | Priority date | Publication date | Assignee | Title |
|---|---|---|---|---|
| US7918795B2 (en) | 2005-02-02 | 2011-04-05 | Gynesonics, Inc. | Method and device for uterine fibroid treatment |
| US11259825B2 (en) | 2006-01-12 | 2022-03-01 | Gynesonics, Inc. | Devices and methods for treatment of tissue |
| US8088072B2 (en) | 2007-10-12 | 2012-01-03 | Gynesonics, Inc. | Methods and systems for controlled deployment of needles in tissue |
| US9301732B2 (en) | 2008-03-31 | 2016-04-05 | Hitachi Medical Corporation | Ultrasonic diagnostic arrangements selecting parameters for selecting relevant estimation data for classifying an elasticity image |
| JP5304986B2 (ja) * | 2008-03-31 | 2013-10-02 | 株式会社日立メディコ | 超音波診断装置 |
| US20110194748A1 (en) * | 2008-10-14 | 2011-08-11 | Akiko Tonomura | Ultrasonic diagnostic apparatus and ultrasonic image display method |
| US8262574B2 (en) | 2009-02-27 | 2012-09-11 | Gynesonics, Inc. | Needle and tine deployment mechanism |
| CN102458255B (zh) * | 2009-06-10 | 2015-04-01 | 株式会社日立医疗器械 | 超声波诊断装置、超声波图像处理装置、超声波图像处理程序、以及超声波图像生成方法 |
| JP5726081B2 (ja) * | 2009-09-16 | 2015-05-27 | 株式会社日立メディコ | 超音波診断装置及び弾性画像の分類プログラム |
| US20120209115A1 (en) * | 2009-10-30 | 2012-08-16 | Hitachi Medical Corporation | Ultrasonic diagnostic device, method for generating image for evaluating disorder of part to be diagnosed of object, and program for generating image for evaluating disorder of part to be diagnosed of object |
| US8879816B2 (en) | 2010-09-21 | 2014-11-04 | Hitachi Medical Corporation | Ultrasonic diagnostic apparatus and ultrasonic image display method |
| JP5925438B2 (ja) * | 2011-06-23 | 2016-05-25 | 株式会社東芝 | 超音波診断装置 |
| CN102940510B (zh) * | 2012-08-31 | 2014-10-08 | 华南理工大学 | 一种超声弹性成像的自动对焦方法 |
| US8992427B2 (en) | 2012-09-07 | 2015-03-31 | Gynesonics, Inc. | Methods and systems for controlled deployment of needle structures in tissue |
| WO2014112168A1 (ja) | 2013-01-18 | 2014-07-24 | オリンパスメディカルシステムズ株式会社 | 超音波観測システム |
| CA2912791C (en) * | 2013-05-24 | 2023-08-01 | Sunnybrook Research Institute | System and method for classifying and characterizing tissues using first-order and second-order statistics of quantitative ultrasound parametric maps |
| EP3027115B1 (en) * | 2013-08-02 | 2023-09-06 | Echosens | Non-invasive system for calculating a human or animal, reliable, standardized and complete score |
| JP5730979B2 (ja) | 2013-11-08 | 2015-06-10 | 日立アロカメディカル株式会社 | 超音波診断装置、及び弾性評価方法 |
| CN103720489B (zh) * | 2013-12-30 | 2015-10-28 | 中国科学院深圳先进技术研究院 | 病变组织生长监测方法和系统 |
| KR101630763B1 (ko) * | 2014-08-29 | 2016-06-15 | 삼성메디슨 주식회사 | 초음파 영상 표시 장치 및 초음파 영상의 표시 방법 |
| JP5936734B1 (ja) * | 2015-03-11 | 2016-06-22 | 日立アロカメディカル株式会社 | 超音波診断装置 |
| US10034653B2 (en) * | 2016-01-11 | 2018-07-31 | Biosense Webster (Israel) Ltd. | Tissue depth estimation using gated ultrasound and force measurements |
| US11138723B2 (en) * | 2016-07-22 | 2021-10-05 | Canon Medical Systems Corporation | Analyzing apparatus and analyzing method |
| EP3537982B1 (en) | 2016-11-11 | 2022-09-07 | Gynesonics, Inc. | Controlled treatment of tissue and dynamic interaction with tissue and/or treatment data and comparison of tissue and/or treatment data |
| EP4275636A3 (en) | 2016-11-14 | 2023-12-20 | Gynesonics, Inc. | Systems for real-time planning and monitoring of ablation needle deployment in tissue |
| CN106725609A (zh) * | 2016-11-18 | 2017-05-31 | 乐普(北京)医疗器械股份有限公司 | 一种弹性检测方法和装置 |
| AU2018261726A1 (en) | 2017-05-04 | 2020-01-02 | Gynesonics Inc. | Methods for monitoring ablation progress with doppler ultrasound |
| WO2019000418A1 (zh) | 2017-06-30 | 2019-01-03 | 上海联影医疗科技有限公司 | 组织密度分析方法及系统 |
| JP7170000B2 (ja) * | 2018-01-24 | 2022-11-11 | 富士フイルム株式会社 | 学習システム、方法及びプログラム |
| US10682098B2 (en) | 2018-03-22 | 2020-06-16 | Shenzhen Mindray Bio-Medical Electronics Co., Ltd. | Predictive use of quantitative imaging |
| CN109065150A (zh) * | 2018-07-02 | 2018-12-21 | 江苏省中医院 | 一种基于多特征提取和Linear SVM的超声乳腺肿瘤分级方法 |
| CN110477954B (zh) * | 2019-07-08 | 2021-07-27 | 无锡海斯凯尔医学技术有限公司 | 基于弹性成像的检测设备 |
| CN111007871B (zh) * | 2019-11-29 | 2022-04-29 | 厦门大学 | 无人机动态特征识别方法、介质、设备及装置 |
| CN114983477A (zh) * | 2022-06-30 | 2022-09-02 | 无锡海斯凯尔医学技术有限公司 | 用于评估肝脏病变状况的计算装置、肝脏弹性测量装置、远程工作站和介质 |
| CN116026682B (zh) * | 2023-03-30 | 2023-07-04 | 浙江大学 | 基于qme的快速弹性成像计算方法 |
Citations (2)
| Publication number | Priority date | Publication date | Assignee | Title |
|---|---|---|---|---|
| WO2003015635A1 (fr) * | 2001-08-20 | 2003-02-27 | Japan Science And Technology Corporation | Procede echographique d'identification de tissus et echographe associe |
| WO2005025425A1 (ja) * | 2003-09-12 | 2005-03-24 | Hitachi Medical Corporation | 超音波診断装置 |
Family Cites Families (5)
| Publication number | Priority date | Publication date | Assignee | Title |
|---|---|---|---|---|
| JP3268396B2 (ja) | 1992-05-15 | 2002-03-25 | 石原 謙 | 超音波診断装置 |
| CN1559345A (zh) * | 2004-02-20 | 2005-01-05 | 无锡贝尔森影像技术有限公司 | 脑血管血液动力学检测方法和仪器 |
| EP1942806A2 (en) * | 2005-10-26 | 2008-07-16 | Aloka Co. Ltd. | Method and apparatus for elasticity imaging |
| JP2007251354A (ja) * | 2006-03-14 | 2007-09-27 | Saitama Univ | マイクロホン、音声生成方法 |
| JP5304986B2 (ja) * | 2008-03-31 | 2013-10-02 | 株式会社日立メディコ | 超音波診断装置 |
-
2008
- 2008-03-31 JP JP2008089328A patent/JP5304986B2/ja active Active
-
2009
- 2009-03-31 WO PCT/JP2009/056703 patent/WO2009123208A1/ja active Application Filing
- 2009-03-31 EP EP09727909.5A patent/EP2263545B1/en active Active
- 2009-03-31 CN CN201310240594.9A patent/CN103349557B/zh active Active
- 2009-03-31 US US12/935,694 patent/US8718339B2/en active Active
- 2009-03-31 CN CN2009801112092A patent/CN101980664B/zh active Active
Patent Citations (2)
| Publication number | Priority date | Publication date | Assignee | Title |
|---|---|---|---|---|
| WO2003015635A1 (fr) * | 2001-08-20 | 2003-02-27 | Japan Science And Technology Corporation | Procede echographique d'identification de tissus et echographe associe |
| WO2005025425A1 (ja) * | 2003-09-12 | 2005-03-24 | Hitachi Medical Corporation | 超音波診断装置 |
Cited By (1)
| Publication number | Priority date | Publication date | Assignee | Title |
|---|---|---|---|---|
| CN107392893A (zh) * | 2017-06-30 | 2017-11-24 | 上海联影医疗科技有限公司 | 组织密度分析方法及系统 |
Also Published As
| Publication number | Publication date |
|---|---|
| JP2009240464A (ja) | 2009-10-22 |
| EP2263545B1 (en) | 2016-12-14 |
| CN103349557B (zh) | 2015-07-08 |
| CN101980664B (zh) | 2013-06-05 |
| US20110026800A1 (en) | 2011-02-03 |
| CN101980664A (zh) | 2011-02-23 |
| US8718339B2 (en) | 2014-05-06 |
| EP2263545A1 (en) | 2010-12-22 |
| JP5304986B2 (ja) | 2013-10-02 |
| EP2263545A4 (en) | 2011-05-04 |
| CN103349557A (zh) | 2013-10-16 |
Similar Documents
| Publication | Publication Date | Title |
|---|---|---|
| JP5304986B2 (ja) | 超音波診断装置 | |
| JP4966578B2 (ja) | 弾性画像生成方法及び超音波診断装置 | |
| JP5726081B2 (ja) | 超音波診断装置及び弾性画像の分類プログラム | |
| JP4455003B2 (ja) | 超音波診断装置 | |
| JP5560283B2 (ja) | 超音波診断装置、被検体の診断対象部位の疾患の評価用画像生成方法、及び被検体の診断対象部位の疾患の評価用画像生成プログラム | |
| JP5028416B2 (ja) | 超音波診断装置 | |
| US8118746B2 (en) | Ultrasonic diagnostic apparatus | |
| JPWO2005122906A1 (ja) | 超音波診断装置 | |
| JP5113322B2 (ja) | 超音波診断装置 | |
| US9301732B2 (en) | Ultrasonic diagnostic arrangements selecting parameters for selecting relevant estimation data for classifying an elasticity image | |
| JP5473527B2 (ja) | 超音波診断装置 | |
| JP5680703B2 (ja) | 超音波診断装置 | |
| JP4515799B2 (ja) | 超音波診断装置 | |
| JP5623609B2 (ja) | 超音波診断装置 | |
| JP5128149B2 (ja) | 超音波診断装置 | |
| KR102539922B1 (ko) | 탄성초음파영상에 대한 변형률 계산 및 변형량의 자동 측정을 위한 방법 및 시스템 | |
| JP5638641B2 (ja) | 超音波診断装置 | |
| JP2012055742A (ja) | 超音波診断装置 | |
| JP4708839B2 (ja) | 生体情報解析装置 | |
| JP4708839B6 (ja) | 生体情報解析装置 |
Legal Events
| Date | Code | Title | Description |
|---|---|---|---|
| WWE | Wipo information: entry into national phase |
Ref document number: 200980111209.2 Country of ref document: CN |
|
| 121 | Ep: the epo has been informed by wipo that ep was designated in this application |
Ref document number: 09727909 Country of ref document: EP Kind code of ref document: A1 |
|
| REEP | Request for entry into the european phase |
Ref document number: 2009727909 Country of ref document: EP |
|
| WWE | Wipo information: entry into national phase |
Ref document number: 2009727909 Country of ref document: EP |
|
| WWE | Wipo information: entry into national phase |
Ref document number: 12935694 Country of ref document: US |
|
| NENP | Non-entry into the national phase |
Ref country code: DE |