US9804943B2 - Estimating service resource consumption based on response time - Google Patents
Estimating service resource consumption based on response time Download PDFInfo
- Publication number
- US9804943B2 US9804943B2 US12/580,901 US58090109A US9804943B2 US 9804943 B2 US9804943 B2 US 9804943B2 US 58090109 A US58090109 A US 58090109A US 9804943 B2 US9804943 B2 US 9804943B2
- Authority
- US
- United States
- Prior art keywords
- mean
- service
- computer system
- workload
- request
- Prior art date
- Legal status (The legal status is an assumption and is not a legal conclusion. Google has not performed a legal analysis and makes no representation as to the accuracy of the status listed.)
- Active, expires
Links
Images


Classifications
-
- G—PHYSICS
- G06—COMPUTING; CALCULATING OR COUNTING
- G06F—ELECTRIC DIGITAL DATA PROCESSING
- G06F11/00—Error detection; Error correction; Monitoring
- G06F11/30—Monitoring
- G06F11/34—Recording or statistical evaluation of computer activity, e.g. of down time, of input/output operation ; Recording or statistical evaluation of user activity, e.g. usability assessment
- G06F11/3447—Performance evaluation by modeling
-
- G—PHYSICS
- G06—COMPUTING; CALCULATING OR COUNTING
- G06F—ELECTRIC DIGITAL DATA PROCESSING
- G06F11/00—Error detection; Error correction; Monitoring
- G06F11/30—Monitoring
- G06F11/34—Recording or statistical evaluation of computer activity, e.g. of down time, of input/output operation ; Recording or statistical evaluation of user activity, e.g. usability assessment
- G06F11/3409—Recording or statistical evaluation of computer activity, e.g. of down time, of input/output operation ; Recording or statistical evaluation of user activity, e.g. usability assessment for performance assessment
- G06F11/3419—Recording or statistical evaluation of computer activity, e.g. of down time, of input/output operation ; Recording or statistical evaluation of user activity, e.g. usability assessment for performance assessment by assessing time
-
- G—PHYSICS
- G06—COMPUTING; CALCULATING OR COUNTING
- G06F—ELECTRIC DIGITAL DATA PROCESSING
- G06F11/00—Error detection; Error correction; Monitoring
- G06F11/30—Monitoring
- G06F11/34—Recording or statistical evaluation of computer activity, e.g. of down time, of input/output operation ; Recording or statistical evaluation of user activity, e.g. usability assessment
- G06F11/3457—Performance evaluation by simulation
- G06F11/3461—Trace driven simulation
Definitions
- Performance models can be implemented to predict the scalability of software and hardware systems, either by analytical methods or by simulation. More specifically, requests to software and hardware systems place demands on system resources that are employed to respond to the requests. Although modeling and evaluation techniques exist to obtain performance predictions of such systems, there are few resource consumption estimation methods that can provide good estimates of the service demands. Service demands are important parameters in specifying performance models. Consequently, the accurate estimation of service demands is desired for defining models that are both representative and robust.
- CPU utilization has been implemented to estimate service demands of software and hardware systems.
- CPU utilization measurement requires access to an operating system executed on the hardware, and also requires specialized CPU sampling instrumentation.
- the CPU sampling instrumentation can interfere with normal system activities and can provide inaccurate CPU utilization measurements.
- accurate CPU utilization sampling is more difficult, because filtering of hypervisor overheads is required, for example.
- to be modeled systems are owned by third parties, such as web service providers, which do not provide CPU utilization data for their servers.
- Implementations of the present disclosure provide computer-implemented methods for generating a queuing model of a computer system.
- the method includes defining a workload comprising a plurality of service requests, each service request corresponding to a class of a plurality of classes, applying the workload to a computer system that receives and processes service requests, measuring a response time of the computer system for each request of the workload, estimating a mean service demand for each class based on the response times and a base queuing model that represents the computer system, and generating the queuing model based on the mean service demands and characteristics of the workload.
- Characteristics of the workload can include, but are not limited to, an inter-arrival time distribution of requests arriving into the queue such as exponential inter-arrival times having mean of 5 requests per second.
- the method further includes determining a plurality of arrival queue-lengths corresponding to each request of the workload, wherein estimating a mean service demand is further based on the plurality of arrival queue-lengths.
- Each arrival queue-length of the plurality of arrival queue-lengths can be determined from log files that report a time of arrival and departure of requests.
- the method further includes determining a plurality of residual times corresponding to each request of the workload, wherein estimating a mean service demand is further based on the plurality of residual times.
- Each residual time can correspond to a time remaining to complete processing of an in-process request upon arrival of a to-be-processed request.
- estimating a mean service demand includes estimating mean service demands in the base queuing model using one of linear regression and maximum likelihood method analyses based on the measured response times.
- generating the queuing model includes parameterizing the base queuing model using the mean service demands.
- the base queuing model includes assumptions on characteristics of the queuing model, the characteristics comprising at least one of scheduling and a service demand distribution.
- the computer system includes an application server that executes an application, and one or more client systems that generate the requests.
- the method further includes evaluating a performance of a computer system by processing the queuing model.
- the present disclosure also provides a computer-readable storage medium coupled to one or more processors and having instructions stored thereon which, when executed by the one or more processors, cause the one or more processors to perform operations in accordance with implementations of the methods provided herein.
- the present disclosure further provides a system for implementing the methods provided herein.
- the system includes a computer system that receives and processes service requests, one or more processors, and a computer-readable storage medium coupled to the one or more processors and having instructions stored thereon which, when executed by the one or more processors, cause the one or more processors to perform operations in accordance with implementations of the methods provided herein.
- FIG. 1 is a schematic illustration of an exemplar system architecture in accordance with implementations of the present disclosure.
- FIG. 2 is a functional block diagram of an exemplar enterprise resource planning (ERP) system.
- ERP enterprise resource planning
- FIG. 3 is a functional block diagram of an exemplar queuing model corresponding to an exemplar ERP application.
- FIG. 4 summarizes a response time based approach in accordance with implementations of the present disclosure.
- FIG. 5 is a graph illustrating a linear relation between measured response times and measured queue-lengths.
- FIGS. 6A and 6B are graphs illustrating a comparison of response time predictions based on a response time approach in accordance with implementations of the present disclosure, and a traditional utilization based approach, respectively.
- FIGS. 7A-7C are graphs illustrating exemplar mean relative errors at different server utilization levels.
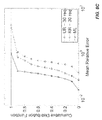
- FIGS. 8A-8C illustrate exemplar cumulative distribution functions (CDFs) corresponding to the mean relative errors of FIGS. 7A-7C .
- FIG. 9 is a flowchart illustrating exemplar steps that can be executed in accordance with implementations of the present disclosure.
- FIG. 10 is a schematic illustration of exemplar computer systems that can be used to execute implementations of the present disclosure.
- the exemplar system 100 of FIG. 1 can be provided as an enterprise resource planning (ERP) system including a plurality of client computers 102 that communicate with one or more back-end server systems 106 over a network 110 .
- the network can be provided as a large computer network, such as a local area network (LAN), wide area network (WAN), the Internet, a cellular network, or a combination thereof connecting any number of mobile clients and servers.
- the clients 102 may be directly connected to the server system 106 (without connecting through the network, for example).
- the client computers 102 represent various forms of processing devices including, but not limited to, a desktop computer, a laptop computer, a handheld computer, a personal digital assistant (PDA), a cellular telephone, a network appliance, a camera, a smart phone, an enhanced general packet radio service (EGPRS) mobile phone, a media player, a navigation device, an email device, a game console, or a combination of any two or more of these data processing devices or other data processing devices.
- the server system 106 includes an application server 112 and a database 114 , and is intended to represent various forms of servers including, but not limited to a web server, an application server, a proxy server, a network server, and/or a server farm.
- the server system 106 accepts user requests for application services and provides such services to any number of client devices 102 over the network 110 .
- the server system 106 can provide a central point through which service-providers can manage and access data related to web services.
- multiple clients 102 can communicate with server system 106 through the network 110 .
- each client 102 can establish a corresponding session with the server system 106 .
- Each session can involve two-way information exchange between the server system 106 and each individual client 102 .
- This two-way information exchange can include requests generated at the client 102 that are communicated to the server system 106 .
- the server system 106 receives the requests, queues multiple requests, executes processes based on the requests, and provides a response to the requesting client 102 .
- Implementations of the present disclosure are directed to the accurate estimation of service demands on computer software and hardware systems, such as the system 100 discussed above with reference to FIG. 1 .
- ERP systems are used to illustrate implementations of the present disclosure
- applicability of the present disclosure is not limited to ERP systems. More specifically, the present disclosure is applicable to any computer software and hardware system including, but not limited to any type of multi-tier program application, modeling of hardware (e.g., a disk drive, or memory), and/or network links.
- Implementation of the present disclosure provide estimation methods that use measured response times of requests to estimate service demands for a multi-class workload.
- the response time is provided as the end-to-end time for completing a request, and includes both the service time (e.g., the time the request is being attended to or service) and delays due to resource contention (e.g., waiting time due to buffering).
- the workload i.e., a body of requests
- can include several classes (i.e., transactions types). Implementations of the present disclosure address the estimation of service time, also referred to as service demand, for each class based on response time measurements.
- a real-world industrial ERP application is used to illustrate implementations of the present disclosure showing that the disclosed response time based approach results in improved performance predictions.
- the response time based approach of the present disclosure is more widely applicable, because response times are often directly logged by executing applications, and/or can be obtained by an external observer.
- response times may be easily available for systems that are owned by third parties, such as web service providers, which do not publicly expose utilization data for their servers.
- the service demand estimation methods of the present disclosure can be implemented with, but are not limited to, systems with first-come first-served (FCFS) scheduling, and are based on linear regression and maximum likelihood estimation approaches.
- the response time based linear regression uses exact equations that relate the mean response time of requests to a queue length seen on arrival of a request to the system, both of which can be easily obtained from application logs.
- the maximum likelihood approach considers the entire distribution of the measured response times, and can achieve increased estimation accuracy.
- phase-type distributions the present disclosure provides a computational method to evaluate likelihood values and to estimate resource consumption.
- This information is used to parameterize a queuing model that models the underlying system.
- parameterizing includes a process of determining and defining the parameters necessary for a complete or relevant specification of a model, a queuing model in the present case.
- a queuing model is a model that approximates a real queuing system so the queuing behavior can be analyzed using steady-state performance measures.
- Queuing models can be represented using Kendall's notation which is provided as: A/B/S/K/N/Disc; where A is the inter-arrival time distribution, B is the service time distribution, S is the number of servers, for example, K is the system capacity, N is the calling population, and Disc is the service discipline assumed.
- Standard notation for distributions A and/or B include M for a Markovian (exponential) distribution, E ⁇ for an Erlang distribution with ⁇ phases, D for Degenerate (or Deterministic) distribution (constant), G for General distribution (arbitrary), and PH for a Phase-type distribution.
- the simplified architecture of FIG. 2 is presented as a non-limiting example that is used to illustrate implementations of the present.
- the system 200 includes an application server system 202 and a workload generator 204 .
- the workload generator 204 functions as a plurality of client devices (e.g., clients 102 ) that transmit requests to the application server system 202 , placing service demands on resources of the application server system 202 .
- the system 200 can include an ERP application of one or more application programs, such as those included in the SAP Business Suite, provided by SAP AG of Walldorf, Germany.
- the exemplar system 200 of FIG. 2 is provided in a two-tier configuration and includes an application server and a database server installed on a common virtual machine. In the example of FIG. 2 , and for purposes of the present illustration, no other virtual machines run on the physical machine. It is appreciated, however, that the present disclosure is not limited to such arrangements.
- the system 200 is stress-tested using a workload of operations (e.g., sales and distribution), which can include, but are not limited to standard business transactions (e.g., the creation and/or listing of sales orders and invoices).
- the workload generator 204 can be of a closed-type where requests are issued by a fixed group of N users 206 . Upon the completion of a request submitted by a user, an exponentially-distributed think time (e.g., with mean time Z equal to 10 s) expires before submitting a new request to the system. All users 206 can cyclically submit the same sequence of requests to the ERP application. After submission of the requests, the application server processes the requests from the multiple, concurrent users 206 .
- a workload of operations e.g., sales and distribution
- standard business transactions e.g., the creation and/or listing of sales orders and invoices.
- the workload generator 204 can be of a closed-type where requests are issued by a fixed group of N users 206 . Upon the
- This processing can be achieved using information extracted from a database 208 .
- the application server uses a dispatcher 210 that buffers the requests in a queue and transfers the requests to work processes 212 .
- the work processes 212 can be provided as independent operating system threads serving the requests in parallel.
- the work processes 212 can be executed as either dialog processes, which execute interactive programs, or update processes, which perform database changes.
- the parameterization of a basic queuing model that describes the performance of an ERP application can be significantly improved if the measured response times (R MEAS ) are used to estimate resource consumption of requests.
- the performance model considered for this task includes, but is not limited to, a basic M/M/1//N model 300 , an exemplar structure of which is illustrated in FIG. 3 .
- the exemplar model 300 of FIG. 3 includes a delay server 302 and an ERP system 304 that includes a waiting buffer 306 and a work processes and database system 308 .
- the M/M/1//N model 300 is an M/M/1 queue with requests generated by a finite population of N users.
- the waiting buffer 306 represents an admission control in the ERP system 304 , and the server models the resource consumption of the requests when executed in the work process.
- a base queuing model is initially determined.
- the base queuing model is a stochastic model that represents the arrival and departure of requests from resources of the computer system (e.g., CPU).
- the base queuing model is provided as an abstraction of the analyst in order to capture the phenomena that affect performance of requests served by the resource modeled. Characteristics that are defined for such a queuing model to describe the computer system include the resource scheduling disciplines and their service time distributions, as well as interconnections with other resources and/or the statistical characteristics of request arrivals at each resource. Based on this information, the base queuing model can be provided using standard Markov chain theory, for example.
- a final or target queuing model can be subsequently parameterized based on estimated mean service demands that can be determined by processing the base queuing model and measured response times.
- the estimation of the mean service demand provided in the present disclosure enables the parameterization of the service time distribution for one or more resources modeled in the base queuing model.
- the mean service demand (E[D]) of the requests at the server is determined such that the response times predicted by the model accurately match accurately the measured response times (R MEAS ) of the real system for all possible numbers of users N. Due to the large role of caching, which affects the behavior of the ERP system very differently at light and heavy loads, the service demands are specified as a function of the number of users N in the model, (i.e., E[D] ⁇ E[D](N)). This estimation approach is routinely used in modeling complex software systems.
- the present disclosure provides direct parameterization of queuing models based on the response time measurements (R MEAS ). More specifically, service demands are estimated to best match the distribution or moments of the measured response times. This requires an important paradigm shift in the modeling methodology as illustrated in FIG. 4 .
- the modeling methodology of FIG. 4 includes data collection 400 , modeling assumptions (e.g., scheduling and service distribution) 402 , demand estimation 402 , and model generation and solution 406 .
- a solution of the model can be provided by values for the mean response times, the mean throughput, and the probability of observing a certain number of requests in the queue at a random instant.
- the response times depend on several system properties related to scheduling or service demand distribution, assumptions on scheduling or general form of the distribution are taken prior to starting the service demand estimation activity.
- the assumptions can include, but are not limited to, the type of scheduling (e.g., FCFS scheduling), the number of workload classes to be modeled, and the distribution of the service demands of each request (e.g., exponential distribution). Consequently, the returned service demands depend on the characteristics of the model in which they will be used.
- Preliminary assumptions on the characteristics of the final model are provided to determine the best possible service demand estimates relative to the target model. Because the goal of the modeling activity is to obtain good agreement between experimental observations and model predictions, the response time based approach of the present disclosure has a stronger focus on achieving this goal by returning the best parameters under model assumptions.
- the illustrative ERP system can be modeled as a FCFS queue with exponentially distributed service demands.
- an exponential distribution can describe the times between events in a process in which events occur continuously and independently at a constant average rate.
- T is the residual time before completion of the request in service
- D i for 1 ⁇ i ⁇ n is the service demand of the ith queued request
- D n+1 is the service demand of the newly arrived request.
- T is equal to D and thus the distribution of the random variable R is the convolution of n+1 exponential random variables.
- Equation 2 can be used to estimate the mean service demand of the requests given the knowledge of the mean number of requests in the ERP system at the time of arrival of a new request.
- the value A can be obtained from the log files of experiments that have been performed, which report the time of arrival and departure of requests.
- An exemplar graphical illustration of a measured linear relation between E[R] and E[A] in an ERP system is provided in FIG. 5 .
- the present disclosure provides service demand estimation algorithms for multi-class requests based on linear regression and maximum likelihood techniques, each of which is described in further detail herein using an exemplar queuing scenario. Solely for purposes of exemplar illustration, it is assumed that a user has provided an input trace with a total of I samples to the service demand estimation algorithms. This can include, but is not limited to a sequence of measured response times (R c ) for requests of class c, and the corresponding queue-length (A k c ) of class-k requests seen upon arrival by each class c request.
- the number of workload classes is denoted by K.
- Equation 3 the linear relation given in Equation 3 does not change if the assumptions on exponential service are dropped, or multiple classes are considered. Accordingly, a variant of the expression developed for approximating FCFS queues in non-product-form queuing networks with multiple classes can be provided as:
- T c is the residual time before completion of the request in execution at the instant of arrival of the class c request
- K is the number of request classes
- E[Dk] is the mean service demand of class k
- E[A k c ] is the mean number of requests of class k queuing in the system excluding both the newly arrived request and the request currently in service.
- Equation 4 can provide the mean request time of a request of class c in a GI/GI/1/FCFS queue, for example.
- GI indicates general independent distribution, which is a specific type of general distribution where requests are independent of each other.
- T c is the residual time before completion of the current request in service
- D i for 1 ⁇ i ⁇ n is the service demand of the ith queued request
- D c is the service demand of the newly arrived request.
- the service demands as a function of the request class can be expressed as:
- Equation 7 Substituting Equation 7 into Equation 6 provides:
- the mean response time can subsequently be determined based on:
- Equation 4 can be used in linear regression for estimating the mean service demands E[D k ], if the per-class response times R c and the arrival queue-lengths A c are known.
- E[T c ] can be difficult to directly measure. Consequently, approximations are needed to estimate this quantity.
- Equation 4 E ⁇ [ D c ] 2 ⁇ ( 1 + CV c 2 ) ( 10 )
- CV c is the coefficient of variation of the service demand distribution of class c. This is clearly an approximation in GI/GI/1/FCFS queues, which becomes an exact expression when the arrival stream is a Poisson process. If the CV c value is not known a priori, it is still possible to evaluate Equation 4 for different CV c values that are assumed feasible for the system under study. The set that produces the minimum mean residual error in the least-squares solution of Equation 4, which is thus the group of coefficient of variations that best fits the observations, is selected as the best estimate of the CV c values. This outlines a general schema for possible application of Equation 4 to non-exponential service distributions.
- maximum likelihood estimation can be used for inferring statistics of random variables based on analytical expressions of the probability of observing a certain sample path.
- maximum likelihood can be formulated by letting R i denote the ith observed, or measured response time, for all 1 ⁇ i ⁇ I, where I is the total number of measured response times.
- the mean service demand E[D k ] for each class 1 ⁇ k ⁇ K is sought, such that the probability of observing the sequence of measured response times R 1 , . . . , R i , . . . , R 1 is maximal.
- this can be expressed as finding the set of mean service demands E[D 1 ], . . . , E[D K ]. This solves the following maximization problem:
- the challenge is to obtain an expression for the likelihood function that is representative of the problem under study, and for which the maximum can be computed efficiently. It is also important that this expression is analytically tractable, since optimization can be otherwise too expensive. In particular, the focus here is on the estimation of the mean service demand, because this is a significant parameter for the specification of standard capacity planning models based on product-form queuing models.
- one method for deriving the likelihood function characterizes both the service and response times of the subject system by phase-type distributions, which enjoy efficient analytical expressions for their evaluation.
- phase-type distributions which enjoy efficient analytical expressions for their evaluation.
- an approach for the case of exponentially-distributed service demands is set forth, and an extension of this to the case of general service demands is provided.
- n 1 , . . . , n K requests are queued for each class, including the request currently in service, is considered.
- the time to absorption can be provided by the phase-type distribution with the following (D 0 , D 1 ) representation:
- the D 0 matrix has off-diagonal elements in position (i, j) representing a transition from state i to state j that does not lead to absorption, while D 1 elements are transitions associated to absorption.
- the diagonal of D 0 is such that D 0 plus D 1 is an infinitesimal generator of a Markov chain describing the evolution of the active state over time.
- the (D 0 , D 1 ) representation enables the probability that a request receives a response time R i to be efficiently determined.
- the time to absorption is described by the probability density of the phase-type distribution (D 0 , D 1 ). From the basic theory of absorbing Markov chains this is readily provided as: P[R i
- Equation 17 the main cost of evaluating Equation 17 is the computation of the matrix exponential function. This can be approximated in an efficient manner using a uniformization technique, or by Padé expansion (e.g., provided in MATLAB). The above-described approach can be generalized to non-exponential service demands that can be approximated as phase-type.
- the response time spent in the queue can be expressed as:
- the ⁇ right arrow over (e) ⁇ right arrow over ( ⁇ ) ⁇ e k terms ensure proper initialization of the phase-type distribution, because, in general, the state space sizes of (S 0 1 ,S 1 1 ) and (S 0 2 , S 1 2 ) are different.
- the above-described expression can be immediately evaluated for computing the likelihood function using Equation 17. The only difference is that this involves larger matrices.
- the above-described approach requires either all moments be fixed except the mean a priori (e.g., by guessing the variability of the service process), or to integrate these additional parameters as unknown variables in the maximum likelihood processing.
- the hyper-exponential distribution can be fully determined by three parameters. Consequently, the first three moments E[D k M ] are sufficient to completely specify the distribution.
- the service distribution of each class can be approximated by an exponential.
- This enables the focus to be on the mean service demand estimation under simpler exponential assumptions. Accordingly, a point of interest of the service demand analysis is to be able to reliably estimate exponentially-distributed service demands in a multi-class setting.
- FIGS. 6A and 6B the accuracy of the response time based approach is highlighted as compared to a traditional CPU utilization based approach.
- FIG. 6A provides estimates and model prediction accuracy results for the exemplar M/M/1//N queuing models parameterized respectively using the response time based approach of the present disclosure.
- FIG. 6B provides estimates and model prediction accuracy results for the exemplar M/M/1//N queuing models parameterized respectively using the CPU utilization based approach.
- FIG. 6B illustrates that the model parameterized in accordance with a CPU utilization based approach provides a response time estimate (E CPU ) that grossly underestimates the measured response time (R MEAS ) of the underlying ERP system.
- E CPU response time estimate
- R MEAS measured response time
- R CPU values are determined based on the exemplar queuing model being parameterized with E[D] being equal to D EST CPU , which is determined by linear regression of the sum of the total CPU consumption of each request (T MEAS CPU ) and the total time to provision data from the database (T MEAS DB ) against the number of completed requests.
- FIG. 6B also illustrates that the model parameterized in accordance with a CPU utilization based approach provides a response time estimate (R TWP ) that grossly overestimates the measured response time (R MEAS ) of the underlying ERP system.
- R TWP values are determined based on the exemplar queuing model being parameterized with E[D] being equal to D EST TWP , which is determined by linear regression of the total time spent in the work process (T MEAS TWP ) against the number of completed requests.
- the response time based approach of the present disclosure is more effective in producing high-quality predictions, as compared to the utilization based service demand estimation considered in FIG. 6B .
- the accuracy of the response time based service demand estimation in accordance with the present disclosure can also be illustrated with reference to utilization and response time traces generated by a queuing system simulator using simulation periods of 60, 600 and 3600 seconds, for example.
- a queuing system simulator can been written using a numerical computing environment and programming language (e.g., MATLAB provided by The Mathworks, Inc.) and can programmed to log standard performance measures, as well as the queue-length seen upon arrival by requests.
- Inter-arrival times and mean service demands can be generated from exponential distributions and their means are assigned to match utilization levels that are fixed for the simulations:
- the simulations are based on system utilization and response time measurements over an exemplar period of 600 seconds, and have been run with low, medium and high server utilization levels (e.g., ⁇ 0.1, 0.5, 0.9 ⁇ ), as well as with request classes K ⁇ 1, 2, 5 ⁇ .
- Response time measurements can be collected on a per-request basis, while utilization is sampled every second. This is the typical situation in modern systems that easily log response times of individual requests, but cannot probe utilization with fine-grain or even per-request resolution.
- the demand estimation accuracy is compared for the traditional, CPU utilization-based approach (UR), and the methods in accordance with the present disclosure including response-time based regression (RR) and maximum likelihood (ML).
- the estimation accuracy can be evaluated based on an error function provided by:
- FIGS. 7A-7C include exemplar graphs illustrating the mean value E[ ⁇ ] determined by averaging ⁇ over 100 simulations with random service demands and having the same number of classes K and server utilization ⁇ .
- FIG. 7A is a graph corresponding to a single request class and illustrates the mean relative error values for server utilization levels of 0.1, 0.5 and 0.9.
- FIG. 7B is a graph corresponding to two request classes and illustrates the mean relative error values for server utilization levels of 0.1, 0.5 and 0.9
- FIG. 7C is a graph corresponding to five request classes and also illustrates the mean relative error values for server utilization levels of 0.1, 0.5 and 0.9.
- FIGS. 7A-7C include exemplar graphs illustrating the mean value E[ ⁇ ] determined by averaging ⁇ over 100 simulations with random service demands and having the same number of classes K and server utilization ⁇ .
- FIG. 7A is a graph corresponding to a single request class and illustrates the mean relative error values for server utilization levels of 0.1, 0.5
- UR- 1 s indicates the mean relative error value for CPU utilization based regression on all available samples
- UR- 50 s indicates the mean relative error value for CPU utilization based regression averaging measurements over 50 consecutive examples
- UR- 30 req indicates the mean relative error value for CPU utilization based regression using averages on partitions formed by 30 consecutive samples such that 30 requests fall into each partition.
- RR- 1 req indicates the mean relative error value for response time based regression using all available samples
- RR- 30 req uses averages over partitions of 30 requests of the same class.
- ML indicates the mean relative error value for response time based maximum likelihood using all available samples.
- FIGS. 8A-8C only include the CDF's for UR- 30 req, RR- 30 req and ML for ease of plotting, and because the curves not shown lead to qualitative conclusions in line with FIGS. 7A-7C .
- a cardinality e.g., even 1, 2 or 3 requests.
- the aggregations used in UR- 30 req and UR- 50 s have a remarkably positive effect on removing the UR- 1 s errors, lowering E[ ⁇ ] to below 5% for UR- 30 req.
- the RR methods provide high quality results for all utilization levels.
- ML also provides similar high-quality results for all utilization levels.
- the observations of FIG. 7A are confirmed by the error distribution. More specifically, FIG. 8A provides low probabilities of high errors for most of the methods, approximately with a 95th-percentile of 12% for all techniques. Accordingly, for the single class case, the techniques, except UR- 1 s , provide accurate results.
- FIG. 7C shows the fact that the quality of the results significantly changes when moving to a five class scenario. More specifically, the general accuracy decreases (note that the vertical scale is different for all figures) and especially in high load. This is expected as a result of the larger number of service demands to be estimated.
- RR- 1 req delivers similar results in medium utilization levels, while RR- 30 req deteriorates the error value.
- FIGS. 7A-7C and 8A-8C indicate that multi-class estimation within medium sized data sets, corresponding to sets of events in 600 seconds for different utilization values, is a challenging problem.
- ML robustly performs such estimations in almost all cases.
- the ML results are extremely good with limited information (e.g., low utilization).
- RR- 1 req appears more effective than RR- 30 req in all experiments, and is generally competitive with the UR methods at low and medium load.
- a workload is generated, the workload including a plurality of service requests including a plurality of classes that can be processed by a computer system.
- the computer system can include an application server that executes an application, and one or more client systems that generate the requests.
- the workload is applied to the computer system in step 904 , and a response time is measured for each request of the workload in step 906 .
- a mean service demand is estimated for each class based on the response times and a base queuing model.
- the base queuing model can include assumptions on characteristics of a final queuing model, the characteristics comprising at least one of scheduling and a service demand distribution.
- Estimating a mean service demand can include estimating mean service demands in the base queuing model using one of linear regression and maximum likelihood method analyses based on the measured response times. Estimating a mean service demand can be further based on a plurality of arrival queue-lengths, the plurality of arrival queue-lengths corresponding to each request of the workload. Each arrival queue-length of the plurality of arrival queue-lengths can be determined from log files that report a time of arrival and departure of requests. Estimating a mean service demand can be further based on a plurality of residual times. The plurality of residual times can correspond to each request of the workload. Each residual time can correspond to a time remaining to complete processing of an in-process request upon arrival of a to-be-processed request
- a queuing model is generated in step 910 based on the mean service demands and characteristics of the workload. Characteristics of the workload can include, but are not limited to, an inter-arrival time distribution of requests arriving into the queue such as exponential inter-arrival times having mean of 5 requests per second. Generating the queuing model can include parameterizing the base queuing model using the mean service demands.
- a performance of a computer system is evaluated by processing the queuing model using a plurality of inputs.
- the system 1000 can be used for the operations described in association with the methods described herein.
- the system 1000 may be included in the application server system 106 .
- the system 1000 includes a processor 1010 , a memory 1020 , a storage device 1030 , and an input/output device 1040 .
- Each of the components 1010 , 1020 , 1030 and 1040 are interconnected using a system bus 1050 .
- the processor 1010 is capable of processing instructions for execution within the system 1000 .
- the processor 1010 is a single-threaded processor.
- the processor 1010 is a multi-threaded processor.
- the processor 1010 is capable of processing instructions stored in the memory 1020 or on the storage device 1030 to display graphical information for a user interface on the input/output device 1040 .
- the memory 1020 stores information within the system 1000 .
- the memory 1020 is a computer-readable medium.
- the memory 1020 is a volatile memory unit.
- the memory 1020 is a non-volatile memory unit.
- the storage device 1030 is capable of providing mass storage for the system 1000 .
- the storage device 1030 is a computer-readable medium.
- the storage device 1030 may be a floppy disk device, a hard disk device, an optical disk device, or a tape device.
- the input/output device 1040 provides input/output operations for the system 1000 .
- the input/output device 1040 includes a keyboard and/or pointing device.
- the input/output device 1040 includes a display unit for displaying graphical user interfaces.
- the features described can be implemented in digital electronic circuitry, or in computer hardware, firmware, software, or in combinations of them.
- the apparatus can be implemented in a computer program product tangibly embodied in an information carrier, e.g., in a machine-readable storage device, for execution by a programmable processor; and method steps can be performed by a programmable processor executing a program of instructions to perform functions of the described implementations by operating on input data and generating output.
- the described features can be implemented advantageously in one or more computer programs that are executable on a programmable system including at least one programmable processor coupled to receive data and instructions from, and to transmit data and instructions to, a data storage system, at least one input device, and at least one output device.
- a computer program is a set of instructions that can be used, directly or indirectly, in a computer to perform a certain activity or bring about a certain result.
- a computer program can be written in any form of programming language, including compiled or interpreted languages, and it can be deployed in any form, including as a stand-alone program or as a module, component, subroutine, or other unit suitable for use in a computing environment.
- Suitable processors for the execution of a program of instructions include, by way of example, both general and special purpose microprocessors, and the sole processor or one of multiple processors of any kind of computer.
- a processor will receive instructions and data from a read-only memory or a random access memory or both.
- the essential elements of a computer are a processor for executing instructions and one or more memories for storing instructions and data.
- a computer will also include, or be operatively coupled to communicate with, one or more mass storage devices for storing data files; such devices include magnetic disks, such as internal hard disks and removable disks; magneto-optical disks; and optical disks.
- Storage devices suitable for tangibly embodying computer program instructions and data include all forms of non-volatile memory, including by way of example semiconductor memory devices, such as EPROM, EEPROM, and flash memory devices; magnetic disks such as internal hard disks and removable disks; magneto-optical disks; and CD-ROM and DVD-ROM disks.
- semiconductor memory devices such as EPROM, EEPROM, and flash memory devices
- magnetic disks such as internal hard disks and removable disks
- magneto-optical disks and CD-ROM and DVD-ROM disks.
- the processor and the memory can be supplemented by, or incorporated in, ASICs (application-specific integrated circuits).
- ASICs application-specific integrated circuits
- the features can be implemented on a computer having a display device such as a CRT (cathode ray tube) or LCD (liquid crystal display) monitor for displaying information to the user and a keyboard and a pointing device such as a mouse or a trackball by which the user can provide input to the computer.
- a display device such as a CRT (cathode ray tube) or LCD (liquid crystal display) monitor for displaying information to the user and a keyboard and a pointing device such as a mouse or a trackball by which the user can provide input to the computer.
- the features can be implemented in a computer system that includes a back-end component, such as a data server, or that includes a middleware component, such as an application server or an Internet server, or that includes a front-end component, such as a client computer having a graphical user interface or an Internet browser, or any combination of them.
- the components of the system can be connected by any form or medium of digital data communication such as a communication network. Examples of communication networks include, e.g., a LAN, a WAN, and the computers and networks forming the Internet.
- the computer system can include clients and servers.
- a client and server are generally remote from each other and typically interact through a network, such as the described one.
- the relationship of client and server arises by virtue of computer programs running on the respective computers and having a client-server relationship to each other.
Abstract
Description
R=T+D 1 +D 2 + . . . +D n +D n+1 (1)
where T is the residual time before completion of the request in service, Di for 1≦i≦n is the service demand of the ith queued request, and Dn+1 is the service demand of the newly arrived request. Note that, by definition of exponential distribution, T is equal to D and thus the distribution of the random variable R is the convolution of n+1 exponential random variables.
E[R]=E[D](1+E[A]) (2)
where E[D] is the mean service demand and E[A] is the mean queue length observed by a request upon time of arrival.
E[R MEAS i ]=E[D](1+E[A MEAS i]) (3)
where the index i stands for the ith value collected in the measurement activity and E[DMEAS i] and E[AMEAS i] are the response time and arrival queue-length, respectively, averaged on X consecutive i samples (e.g., X=20).
where lk,c is equal to 1 when k=c and is equal to 0 when k≠c. Tc is the residual time before completion of the request in execution at the instant of arrival of the class c request, K is the number of request classes, E[Dk] is the mean service demand of class k, and E[Ak c] is the mean number of requests of class k queuing in the system excluding both the newly arrived request and the request currently in service.
R c =T c +D 1 +D 2 + . . . +D n +D c (5)
where Tc is the residual time before completion of the current request in service, Di for 1≦i≦n is the service demand of the ith queued request, and Dc is the service demand of the newly arrived request.
where C(i) is the class of the request in position i (1≦i≦n).
is the mean number E[Ak c|Ac=n] of class k requests waiting in the queue upon arrival by a request of class c.
where CVc is the coefficient of variation of the service demand distribution of class c. This is clearly an approximation in GI/GI/1/FCFS queues, which becomes an exact expression when the arrival stream is a Poisson process. If the CVc value is not known a priori, it is still possible to evaluate Equation 4 for different CVc values that are assumed feasible for the system under study. The set that produces the minimum mean residual error in the least-squares solution of Equation 4, which is thus the group of coefficient of variations that best fits the observations, is selected as the best estimate of the CVc values. This outlines a general schema for possible application of Equation 4 to non-exponential service distributions.
subject to E[Dk]≦0, for all classes k. Assuming the response time as independent random variables, the joint probability expression in Equation 11 is simplified into the product:
and taking the logarithm to equivalently express the products as a summation provides:
where the argument is now the likelihood function provided as:
P[R i |E[D 1 ], . . . , E[D k ]]={right arrow over (π)} e e D
where {right arrow over (e)}=(1, 1, . . . , 1)T, {right arrow over (π)}e={right arrow over (π)}e (−D0)−1D1 is a row vector with elements ({right arrow over (π)}e)j representing the initial state of a request immediately after absorption, and knowledge of E[D1], . . . , E[Dk] is equivalent to knowing the rates μ1, . . . , μK. Because there is a single transition in D1 leading to absorption, it is immediately concluded that, in Equation 17, it is always it, {right arrow over (π)}e=(1, 0, . . . , 0) and the main cost of evaluating Equation 17 is the computation of the matrix exponential function. This can be approximated in an efficient manner using a uniformization technique, or by Padé expansion (e.g., provided in MATLAB). The above-described approach can be generalized to non-exponential service demands that can be approximated as phase-type.
which implies a probability vector {right arrow over (π)}e k=(1, 0).
where {right arrow over (π)}e k={right arrow over (π)}e k(−S0 k)−1S1 k. The {right arrow over (e)}{right arrow over (π)}e k terms ensure proper initialization of the phase-type distribution, because, in general, the state space sizes of (S0 1,S1 1) and (S0 2, S1 2) are different. The above-described expression can be immediately evaluated for computing the likelihood function using Equation 17. The only difference is that this involves larger matrices.
log P[R i |E[D k ], E[D k 2 ], . . . , E[D k M], 1≦k≦K] (20)
if the phase-type distributions are uniquely specified by their first M moments E[Dk M], 1≦m≦M. For example, the hyper-exponential distribution can be fully determined by three parameters. Consequently, the first three moments E[Dk M] are sufficient to completely specify the distribution.
which is the mean relative error over all classes of the estimated service demands E[DEST,k] with respect to the exact value E[DEXACT,k] used in the simulations. For each simulation, the E[DEXACT,k] value of each class is randomly drawn with uniform distribution ranging in [0, 1].
Claims (20)
Priority Applications (4)
| Application Number | Priority Date | Filing Date | Title |
|---|---|---|---|
| US12/580,901 US9804943B2 (en) | 2009-10-16 | 2009-10-16 | Estimating service resource consumption based on response time |
| EP20100013643 EP2312445A1 (en) | 2009-10-16 | 2010-10-14 | Estimating service resource consumption based on response time |
| JP2010232543A JP5313990B2 (en) | 2009-10-16 | 2010-10-15 | Estimating service resource consumption based on response time |
| CN201010509831.3A CN102043674B (en) | 2009-10-16 | 2010-10-18 | Service Source consumption is estimated based on the response time |
Applications Claiming Priority (1)
| Application Number | Priority Date | Filing Date | Title |
|---|---|---|---|
| US12/580,901 US9804943B2 (en) | 2009-10-16 | 2009-10-16 | Estimating service resource consumption based on response time |
Publications (2)
| Publication Number | Publication Date |
|---|---|
| US20110093253A1 US20110093253A1 (en) | 2011-04-21 |
| US9804943B2 true US9804943B2 (en) | 2017-10-31 |
Family
ID=43384419
Family Applications (1)
| Application Number | Title | Priority Date | Filing Date |
|---|---|---|---|
| US12/580,901 Active 2030-11-27 US9804943B2 (en) | 2009-10-16 | 2009-10-16 | Estimating service resource consumption based on response time |
Country Status (4)
| Country | Link |
|---|---|
| US (1) | US9804943B2 (en) |
| EP (1) | EP2312445A1 (en) |
| JP (1) | JP5313990B2 (en) |
| CN (1) | CN102043674B (en) |
Cited By (6)
| Publication number | Priority date | Publication date | Assignee | Title |
|---|---|---|---|---|
| US20100332650A1 (en) * | 2009-12-10 | 2010-12-30 | Royal Bank Of Canada | Synchronized processing of data by networked computing resources |
| US10796038B2 (en) * | 2014-04-07 | 2020-10-06 | Vmware, Inc. | Estimating think times |
| CN112084018A (en) * | 2020-08-11 | 2020-12-15 | 河海大学 | Method for rapidly evaluating average time delay of non-uniform access users in edge computing network |
| US11153260B2 (en) * | 2019-05-31 | 2021-10-19 | Nike, Inc. | Multi-channel communication platform with dynamic response goals |
| US11308554B2 (en) | 2009-12-10 | 2022-04-19 | Royal Bank Of Canada | Synchronized processing of data by networked computing resources |
| US11711274B2 (en) | 2020-02-11 | 2023-07-25 | International Business Machines Corporation | Request response based on a performance value of a server |
Families Citing this family (26)
| Publication number | Priority date | Publication date | Assignee | Title |
|---|---|---|---|---|
| US8812674B2 (en) * | 2010-03-03 | 2014-08-19 | Microsoft Corporation | Controlling state transitions in a system |
| WO2012041397A1 (en) * | 2010-09-27 | 2012-04-05 | Telefonaktiebolaget Lm Ericsson (Publ) | Performance calculation, admission control, and supervisory control for a load dependent data processing system |
| US20130326249A1 (en) * | 2011-06-09 | 2013-12-05 | Guillermo Navarro | Regulating power consumption of a mass storage system |
| US8578023B2 (en) | 2011-07-29 | 2013-11-05 | Hewlett-Packard Development Company, L.P. | Computer resource utilization modeling for multiple workloads |
| CN102253883B (en) * | 2011-07-29 | 2014-06-25 | 国家电网公司 | Method and system for evaluating performance of server |
| US9111022B2 (en) * | 2012-06-22 | 2015-08-18 | Sap Se | Simulation techniques for predicting in-memory database systems performance |
| US8984125B2 (en) * | 2012-08-16 | 2015-03-17 | Fujitsu Limited | Computer program, method, and information processing apparatus for analyzing performance of computer system |
| US9660891B2 (en) * | 2013-01-17 | 2017-05-23 | TravelClick, Inc. | Methods and systems for computer monitoring |
| JP6063801B2 (en) * | 2013-04-09 | 2017-01-18 | 日本電信電話株式会社 | Quality evaluation apparatus, quality evaluation method and program |
| CN104283934B (en) * | 2013-07-12 | 2018-05-22 | 中国移动通信集团重庆有限公司 | A kind of WEB service method for pushing, device and server based on reliability prediction |
| US9699032B2 (en) * | 2013-10-29 | 2017-07-04 | Virtual Instruments Corporation | Storage area network queue depth profiler |
| CN103903070B (en) * | 2014-04-15 | 2017-03-15 | 广东电网有限责任公司信息中心 | Application system resource requirement calculating system |
| CN105446896B (en) * | 2014-08-29 | 2018-05-04 | 国际商业机器公司 | The buffer memory management method and device of MapReduce application |
| US10044786B2 (en) * | 2014-11-16 | 2018-08-07 | International Business Machines Corporation | Predicting performance by analytically solving a queueing network model |
| US9984044B2 (en) | 2014-11-16 | 2018-05-29 | International Business Machines Corporation | Predicting performance regression of a computer system with a complex queuing network model |
| KR20160070636A (en) * | 2014-12-10 | 2016-06-20 | 경희대학교 산학협력단 | Device for controlling migration in a distributed cloud environment and method for controlling migration using the same |
| US9544403B2 (en) * | 2015-02-02 | 2017-01-10 | Linkedin Corporation | Estimating latency of an application |
| US9774654B2 (en) | 2015-02-02 | 2017-09-26 | Linkedin Corporation | Service call graphs for website performance |
| US11010833B2 (en) * | 2015-10-09 | 2021-05-18 | Chicago Mercantile Exchange Inc. | Systems and methods for calculating a latency of a transaction processing system |
| US10733526B2 (en) * | 2015-12-09 | 2020-08-04 | International Business Machines Corporation | Estimation of latent waiting and service times from incomplete event logs |
| US10423500B2 (en) * | 2016-06-01 | 2019-09-24 | Seagate Technology Llc | Technologies for limiting performance variation in a storage device |
| JP2018022305A (en) * | 2016-08-03 | 2018-02-08 | 富士通株式会社 | Boundary value determination program, boundary value determination method, and boundary value determination device |
| CN106407007B (en) * | 2016-08-31 | 2020-06-12 | 上海交通大学 | Cloud resource configuration optimization method for elastic analysis process |
| US10338967B2 (en) * | 2016-09-20 | 2019-07-02 | Tata Consultancy Services Limited | Systems and methods for predicting performance of applications on an internet of things (IoT) platform |
| CN106649471A (en) * | 2016-09-28 | 2017-05-10 | 新华三技术有限公司 | Access control method and apparatus |
| CN109902262B (en) * | 2019-03-19 | 2022-06-21 | 福建工程学院 | Steady state probability matrix calculation method for queuing line with two heterogeneous service types |
Citations (3)
| Publication number | Priority date | Publication date | Assignee | Title |
|---|---|---|---|---|
| US20050086335A1 (en) | 2003-10-20 | 2005-04-21 | International Business Machines Corporation | Method and apparatus for automatic modeling building using inference for IT systems |
| JP2005148799A (en) | 2003-11-11 | 2005-06-09 | Fujitsu Ltd | Method for processing information, method for deriving service time and method for adjusting number of processing unit |
| US20070168494A1 (en) | 2005-12-22 | 2007-07-19 | Zhen Liu | Method and system for on-line performance modeling using inference for real production it systems |
-
2009
- 2009-10-16 US US12/580,901 patent/US9804943B2/en active Active
-
2010
- 2010-10-14 EP EP20100013643 patent/EP2312445A1/en not_active Ceased
- 2010-10-15 JP JP2010232543A patent/JP5313990B2/en active Active
- 2010-10-18 CN CN201010509831.3A patent/CN102043674B/en active Active
Patent Citations (3)
| Publication number | Priority date | Publication date | Assignee | Title |
|---|---|---|---|---|
| US20050086335A1 (en) | 2003-10-20 | 2005-04-21 | International Business Machines Corporation | Method and apparatus for automatic modeling building using inference for IT systems |
| JP2005148799A (en) | 2003-11-11 | 2005-06-09 | Fujitsu Ltd | Method for processing information, method for deriving service time and method for adjusting number of processing unit |
| US20070168494A1 (en) | 2005-12-22 | 2007-07-19 | Zhen Liu | Method and system for on-line performance modeling using inference for real production it systems |
Non-Patent Citations (23)
| Title |
|---|
| A. B. Sharma et al., "Automatic Request Categorization in Internet Services," ACM Sigmetrics Performance Evaluation Review, vol. 36, Issue 2, Sep. 2008, pp. 16-25. |
| A. Heindl, "Traffic-Based Decomposition of General Queueing Networks with Correlated Input Processes," Ph.D. Thesis, Shaker Verlag, Aachen, 2001, 189 pages. |
| Anonymous, "Queueing model", Wikipedia, Sep. 9, 2009, 4 pages. |
| Calzarossa et al. "A Workload Model Representative of Static and Dynamic Characteristics" Acta Informatica Springer-Verlag 1986. * |
| Enterprise resource planning-software from SAP, Apr. 2009. http://www.sap.com/solutions/business-suite/erp/index.epx. |
| Enterprise resource planning—software from SAP, Apr. 2009. http://www.sap.com/solutions/business-suite/erp/index.epx. |
| European Search Report for Application EP10013643, dated Feb. 2, 2011, 8 pages. |
| First Office Action for Chinese Patent Application No. 201010509831.3, dated Dec. 23, 2013, 10 pages. |
| G. Casale et al., "Robust Workload Estimation in Queueing Network Performance Models," Proceedings of the 16th Euromicro Conference on Parallel, Distributed and Network-Based Processing (PDP 2008), 2008, pp. 183-187. |
| G. Pacifici et al., "CPU demand for web serving: Measurement analysis and dynamic estimation," Performance Evaluation, An International Journal, vol. 65, Issues 6-7, Jun. 2008, pp. 531-553. |
| J. Rolia et al., "Correlating Resource Demand Information with ARM Data for Application Services," Proceedings of the 1st international Workshop on Software and Performance, 1998, pp. 219-230. |
| J. Rolia et al., "Parameter Estimation for Performance Models of Distributed Application Systems," Proceedings of the 1995 Conference of the Centre for Advanced Studies on Collaborative Research, IBM Centre for Advanced Studies Conference, Toronto, Ontario, Canada, 1995, 10 pages. |
| L. Cherkasova et al., "Measuring CPU Overhead for I/O Processing in the Xen Virtual Machine Monitor," Proceedings of the Annual Conference on USENIX Annual Technical Conference, 2005, pp. 387-390. |
| M. Bertoli et al., "Java modeling tools: an open source suite for queueing network modelling and workload analysis," Third International Conference on the Quantitative Evaluation of Systems-(QEST'06), Sep. 2006, Riverside, California, pp. 119-120. |
| M. Bertoli et al., "Java modeling tools: an open source suite for queueing network modelling and workload analysis," Third International Conference on the Quantitative Evaluation of Systems—(QEST'06), Sep. 2006, Riverside, California, pp. 119-120. |
| P. Barham et al., "Using Magpie for request extraction and workload modeling," Proceedings of the Sixth USENIX Symposium on Operating Systems Design and Implementation (OSDI), Dec. 2004, pp. 259-272. |
| P. Buchholz et al. "A Two-step EM algorithm for MAP fitting," Lecture Notes in Computer Science: Computer and Information Sciences-ISCIS 2004, vol. 3280, 2004, pp. 217-227. |
| P. Buchholz et al. "A Two-step EM algorithm for MAP fitting," Lecture Notes in Computer Science: Computer and Information Sciences—ISCIS 2004, vol. 3280, 2004, pp. 217-227. |
| Pacific et al. "CPU Demand for Web Serving: Measurement Analysis and Dynamic Estimation", Science Direct Dec. 14, 2007. * |
| Q. Zhang et al., "A Regression-based Analytic Model for Dynamic Resource Provisioning of Multi-tier Applications," Proceedings of the Fourth International Conference on Autonomic Computing, 2007, 10 pages. |
| S. Kraft et al., "Estimating Service Resource Consumption From Response Time Measurements," Proceedings of the Fourth International ICST Conference on Performance Evaluation Methodologies and Tools, Oct. 20-22, 2009, Pisa, Italy, pp. |
| T. Zheng et al., "Tracking Time-Varying Parameters in Software Systems with Extended Kalman Filters," Proceedings of the 2005 Conference of the Centre for Advanced Studies on Collaborative Research, IBM Centre for Advanced Studies Conference, Toranto, Ontario, Canada, 2005, pp. 334-345. |
| Z. Liu et al., "Parameter inference of queueing models for IT systems using end-to-end measurements," Performance Evaluation, An International Journal, vol. 63, Issue 1, Jan. 2006, pp. 36-60. |
Cited By (13)
| Publication number | Priority date | Publication date | Assignee | Title |
|---|---|---|---|---|
| US10650450B2 (en) * | 2009-12-10 | 2020-05-12 | Royal Bank Of Canada | Synchronized processing of data by networked computing resources |
| US11823269B2 (en) | 2009-12-10 | 2023-11-21 | Royal Bank Of Canada | Synchronized processing of data by networked computing resources |
| US11308555B2 (en) | 2009-12-10 | 2022-04-19 | Royal Bank Of Canada | Synchronized processing of data by networked computing resources |
| US11308554B2 (en) | 2009-12-10 | 2022-04-19 | Royal Bank Of Canada | Synchronized processing of data by networked computing resources |
| US11776054B2 (en) | 2009-12-10 | 2023-10-03 | Royal Bank Of Canada | Synchronized processing of data by networked computing resources |
| US20100332650A1 (en) * | 2009-12-10 | 2010-12-30 | Royal Bank Of Canada | Synchronized processing of data by networked computing resources |
| US10796038B2 (en) * | 2014-04-07 | 2020-10-06 | Vmware, Inc. | Estimating think times |
| US11743228B2 (en) * | 2019-05-31 | 2023-08-29 | Nike, Inc. | Multi-channel communication platform with dynamic response goals |
| US11153260B2 (en) * | 2019-05-31 | 2021-10-19 | Nike, Inc. | Multi-channel communication platform with dynamic response goals |
| US20220038418A1 (en) * | 2019-05-31 | 2022-02-03 | Nike, Inc. | Multi-channel communication platform with dynamic response goals |
| US11711274B2 (en) | 2020-02-11 | 2023-07-25 | International Business Machines Corporation | Request response based on a performance value of a server |
| CN112084018B (en) * | 2020-08-11 | 2022-06-24 | 河海大学 | Method for rapidly evaluating average time delay of non-uniform access users in edge computing network |
| CN112084018A (en) * | 2020-08-11 | 2020-12-15 | 河海大学 | Method for rapidly evaluating average time delay of non-uniform access users in edge computing network |
Also Published As
| Publication number | Publication date |
|---|---|
| JP5313990B2 (en) | 2013-10-09 |
| US20110093253A1 (en) | 2011-04-21 |
| JP2011086295A (en) | 2011-04-28 |
| CN102043674B (en) | 2016-02-03 |
| CN102043674A (en) | 2011-05-04 |
| EP2312445A1 (en) | 2011-04-20 |
Similar Documents
| Publication | Publication Date | Title |
|---|---|---|
| US9804943B2 (en) | Estimating service resource consumption based on response time | |
| US8560618B2 (en) | Characterizing web workloads for quality of service prediction | |
| Kraft et al. | Estimating service resource consumption from response time measurements | |
| US7296256B2 (en) | Method and apparatus for automatic modeling building using inference for IT systems | |
| Zhu et al. | A performance interference model for managing consolidated workloads in QoS-aware clouds | |
| US9471375B2 (en) | Resource bottleneck identification for multi-stage workflows processing | |
| US11614978B2 (en) | Deep reinforcement learning for workflow optimization using provenance-based simulation | |
| EP2040170B1 (en) | System configuration parameter set optimizing method, program, and device | |
| Wang et al. | Bayesian service demand estimation using gibbs sampling | |
| US20120221373A1 (en) | Estimating Business Service Responsiveness | |
| Bacigalupo et al. | Managing dynamic enterprise and urgent workloads on clouds using layered queuing and historical performance models | |
| Happe et al. | Statistical inference of software performance models for parametric performance completions | |
| Pérez et al. | An offline demand estimation method for multi-threaded applications | |
| Jajoo et al. | A case for task sampling based learning for cluster job scheduling | |
| Ajila et al. | Using machine learning algorithms for cloud client prediction models in a web vm resource provisioning environment | |
| Kumar et al. | Hold'em or fold'em? aggregation queries under performance variations | |
| Mahmoudi et al. | Performance modeling of metric-based serverless computing platforms | |
| Barrameda et al. | A novel statistical cost model and an algorithm for efficient application offloading to clouds | |
| Westermann et al. | Efficient experiment selection in automated software performance evaluations | |
| Wang et al. | Estimating multiclass service demand distributions using Markovian arrival processes | |
| US20080109390A1 (en) | Method for dynamically managing a performance model for a data center | |
| Correia et al. | Response time characterization of microservice-based systems | |
| Awad et al. | On the predictive properties of performance models derived through input-output relationships | |
| Enganti et al. | ForkMV: Mean-and-variance estimation of fork-join queuing networks for datacenter applications | |
| Giannakopoulos et al. | Towards an adaptive, fully automated performance modeling methodology for cloud applications |
Legal Events
| Date | Code | Title | Description |
|---|---|---|---|
| AS | Assignment |
Owner name: SAP AG, GERMANY Free format text: ASSIGNMENT OF ASSIGNORS INTEREST;ASSIGNORS:KRAFT, STEPHAN;PACHECO-SANCHEZ, SERGIO;CASALE, GIULIANO;AND OTHERS;REEL/FRAME:023499/0718 Effective date: 20091015 |
|
| AS | Assignment |
Owner name: SAP SE, GERMANY Free format text: CHANGE OF NAME;ASSIGNOR:SAP AG;REEL/FRAME:033625/0223 Effective date: 20140707 |
|
| STCF | Information on status: patent grant |
Free format text: PATENTED CASE |
|
| MAFP | Maintenance fee payment |
Free format text: PAYMENT OF MAINTENANCE FEE, 4TH YEAR, LARGE ENTITY (ORIGINAL EVENT CODE: M1551); ENTITY STATUS OF PATENT OWNER: LARGE ENTITY Year of fee payment: 4 |