US9093077B2 - Reverberation suppression device, reverberation suppression method, and computer-readable storage medium storing a reverberation suppression program - Google Patents
Reverberation suppression device, reverberation suppression method, and computer-readable storage medium storing a reverberation suppression program Download PDFInfo
- Publication number
- US9093077B2 US9093077B2 US13/532,908 US201213532908A US9093077B2 US 9093077 B2 US9093077 B2 US 9093077B2 US 201213532908 A US201213532908 A US 201213532908A US 9093077 B2 US9093077 B2 US 9093077B2
- Authority
- US
- United States
- Prior art keywords
- audio signal
- input audio
- suppression
- reverb
- per unit
- Prior art date
- Legal status (The legal status is an assumption and is not a legal conclusion. Google has not performed a legal analysis and makes no representation as to the accuracy of the status listed.)
- Expired - Fee Related, expires
Links
- 230000001629 suppression Effects 0.000 title claims abstract description 237
- 238000000034 method Methods 0.000 title claims description 47
- 230000008859 change Effects 0.000 claims abstract description 125
- 230000007423 decrease Effects 0.000 claims abstract description 87
- 238000004458 analytical method Methods 0.000 claims abstract description 22
- 230000002238 attenuated effect Effects 0.000 claims abstract description 5
- 238000001228 spectrum Methods 0.000 claims description 129
- 230000008569 process Effects 0.000 claims description 35
- 238000012937 correction Methods 0.000 claims description 24
- 238000012935 Averaging Methods 0.000 claims description 13
- 230000004044 response Effects 0.000 claims description 10
- 230000003466 anti-cipated effect Effects 0.000 claims description 4
- 238000004364 calculation method Methods 0.000 claims description 2
- 230000005236 sound signal Effects 0.000 claims 51
- 230000001131 transforming effect Effects 0.000 claims 2
- 238000012544 monitoring process Methods 0.000 claims 1
- 230000010255 response to auditory stimulus Effects 0.000 abstract description 3
- 238000012545 processing Methods 0.000 description 43
- 230000006870 function Effects 0.000 description 27
- 230000000875 corresponding effect Effects 0.000 description 24
- 238000010586 diagram Methods 0.000 description 16
- 238000004891 communication Methods 0.000 description 8
- 238000012546 transfer Methods 0.000 description 8
- 230000008901 benefit Effects 0.000 description 3
- 230000000694 effects Effects 0.000 description 3
- 230000002079 cooperative effect Effects 0.000 description 2
- 238000005516 engineering process Methods 0.000 description 2
- 230000004075 alteration Effects 0.000 description 1
- 238000013459 approach Methods 0.000 description 1
- 230000001276 controlling effect Effects 0.000 description 1
- 230000002596 correlated effect Effects 0.000 description 1
- 230000001747 exhibiting effect Effects 0.000 description 1
- 239000004973 liquid crystal related substance Substances 0.000 description 1
- 230000008520 organization Effects 0.000 description 1
- 238000005070 sampling Methods 0.000 description 1
- 238000006467 substitution reaction Methods 0.000 description 1
- 238000012360 testing method Methods 0.000 description 1
Images
Classifications
-
- G—PHYSICS
- G10—MUSICAL INSTRUMENTS; ACOUSTICS
- G10L—SPEECH ANALYSIS TECHNIQUES OR SPEECH SYNTHESIS; SPEECH RECOGNITION; SPEECH OR VOICE PROCESSING TECHNIQUES; SPEECH OR AUDIO CODING OR DECODING
- G10L21/00—Speech or voice signal processing techniques to produce another audible or non-audible signal, e.g. visual or tactile, in order to modify its quality or its intelligibility
- G10L21/02—Speech enhancement, e.g. noise reduction or echo cancellation
- G10L21/0208—Noise filtering
- G10L2021/02082—Noise filtering the noise being echo, reverberation of the speech
Definitions
- the embodiments discussed herein are related to a reverberation suppression device, a reverberation suppression method, and a reverberation suppression program configured to suppress reverb in sound input into a microphone provided in a device such as a mobile device.
- sound emitted by the user not only reaches the microphone of the mobile device directly, but also reaches the microphone after reflecting off objects such as the surrounding walls and ceiling.
- sound that reaches a microphone directly will be designated direct sound
- sound that reaches the microphone after reflecting off objects such as the surrounding walls and ceiling will be designated reverb.
- a signal obtained by the microphone in response to the arrival of sound will be designated an input signal.
- Japanese Laid-open Patent Publication No. 2008-58900 proposes a technology that suppresses reverb components included in an input signal obtained by a microphone, in which a reverb power spectrum estimated from the power spectra of past frames is subtracted from the power spectrum of the current frame.
- This technique attempts reverberation suppression by determining filter coefficients so as to minimize a weighted sum of the residual speech power in a reverb segment at the end of an utterance and the subtracted power in an utterance segment, which are estimated on the basis of change in the input signal over time.
- a reverberation suppression device includes an analyzer configured to analyze change over time in the power of an input signal obtained from a microphone in response to sound input, and thereby compute the decrease per unit time in the power of the input signal in a reverb segment following the end of a segment in which the sound is produced; and a suppression controller configured to control a suppression gain which indicates the rate at which the input signal is attenuated, on the basis of analysis results from the analyzer.
- FIG. 1 is a diagram illustrating an embodiment of a reverberation suppression device
- FIGS. 2A and 2B are diagrams illustrating exemplary change in input signal power over time
- FIG. 3 is a flowchart of a reverberation suppression process
- FIG. 4 is a diagram explaining an exemplary process of analyzing change in an input signal over time
- FIG. 5 is a diagram explaining environment-induced differences in the decrease per unit time of an input signal in a reverb segment
- FIG. 6 is a diagram explaining reverb characteristics
- FIG. 7 is a diagram explaining an exemplary process of computing standard suppression gain
- FIG. 8 is a diagram illustrating an exemplary hardware configuration of a mobile device
- FIG. 9 is a flowchart of an exemplary process of analyzing change in an input signal over time
- FIG. 10 is an exemplary flowchart of a process of determining suppression gain
- FIG. 11 is a diagram illustrating another embodiment of a reverberation suppression device
- FIGS. 12A and 12B are diagrams explaining another example of processing by an index calculator
- FIG. 13 is a flowchart of another exemplary process of analyzing change in an input signal over time.
- FIG. 14 is another exemplary flowchart of a process of determining suppression gain.
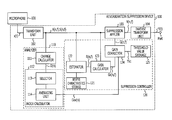
- FIG. 1 is a diagram illustrating an embodiment of a reverberation suppression device.
- the reverberation suppression device 100 illustrated by example in FIG. 1 may for example generate an output signal y(t) by suppressing a reverb component included in an input signal x(t) obtained by a microphone 101 mounted in a mobile device having telephony functions, such as a mobile phone.
- the output signal y(t) is output via an output terminal Port.
- a reverberation suppression device 100 of the present disclosure may be applied to the reverberation suppression of input signals obtained by a microphone 101 mounted in various electronic devices, including personal digital assistants equipped with communication functions, telephone handsets, and portable videogame systems.
- the reverberation suppression device 100 illustrated by example in FIG. 1 includes a transform unit 102 , an analyzer 110 , a suppression controller 120 , a suppression applier 103 , and an inverse transform unit 104 .
- the transform unit 102 may for example apply a fast Fourier transform to each frame of an input signal x(t) to obtain an input signal spectrum X(n, f) corresponding to each input signal frame x(n, t).
- the transform unit 102 may also use the input signal spectra X(n, f) to compute input power spectra S(n, f) expressed using common logarithms as in Eq. 1.
- the input power spectra S(n, f) may then be input into the analyzer 110 .
- a frame is the unit of analysis for the Fourier transform.
- the symbol n represents the frame number, while the symbol f represents the frequency number.
- S ( n,f ) 10 log 10
- the analyzer 110 analyzes characteristics of the change over time of an input signal x(t) in a reverb segment following the end of a segment in which sound is produced, on the basis of the input signal spectrum X(n, f) or the input power spectrum S(n, f) for each frame, as discussed later.
- the suppression controller 120 controls a suppression gain G(n, f) which expresses the attenuation rate applied to the input signal spectra X(n, f) by the suppression applier 103 in order to suppress the reverb component included in the input signal spectra X(n, f).
- the suppression applier 103 by applying such suppression gain G(n, f) to the input signal spectra X(n, f), the suppression applier 103 generates output signal spectra Y(n, f) in which the reverb component has been appropriately suppressed.
- the inverse transform unit 104 generates the output signal y(t) by, for example, applying an inverse Fourier transform to the output signal spectra Y(n, f) generated by the suppression applier 103 .
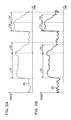
- FIGS. 2A and 2B are diagrams illustrating exemplary change in an input signal x(t) over time.
- the input signals x(t) respectively illustrated in FIGS. 2A and 2B are both obtained in the same room, but with different magnitudes of background noise.
- the average background noise level when obtaining the input signal x(t) illustrated in FIG. 2B is greater than the average background noise level when obtaining the input signal x(t) illustrated in FIG. 2A .
- the segments labeled Ta 1 and Ta 3 in FIG. 2A as well as the segments labeled Tb 1 and Tb 3 in FIG. 2B are segments in which sound is produced.
- the segments labeled Ta 2 and Ta 4 in FIG. 2A as well as the segments labeled Tb 2 and Tb 4 in FIG. 2B are reverb segments following segments in which sound is produced.
- the reverb segments Tb 2 and Tb 4 appearing in the input signal x(t) illustrated in FIG. 2B are shorter due to the reverb component becoming filled with background noise at an earlier stage.
- the decrease per unit time of the input signal x(t) in the reverb segments Ta 2 and Ta 4 illustrated in FIG. 2A is nearly equal to the decrease per unit time of the input signal x(t) in the reverb segments Tb 2 and Tb 4 illustrated in FIG. 2B .
- the reverb component is correlated with the preceding input sound and attenuates according to the reverb characteristics of the room, and thus the decrease per unit time of an input signal x(t) in a reverb segment represents the attenuation rate of the reverb component according to the reverb characteristics.
- the decrease per unit time of an input signal x(t) in a reverb segment represents the attenuation rate of the reverb component according to the reverb characteristics.
- a small decrease per unit time of the input signal x(t) in a reverb segment indicates that attenuation of the reverb component is slow in the environment where the microphone 101 is placed.
- a large decrease per unit time of the input signal x(t) in a reverb segment indicates that the reverb component rapidly attenuates in the environment where the microphone 101 is placed.
- the decrease per unit time of the input signal x(t) in a reverb segment obtained as analysis results by the analyzer 110 indicates the attenuation rate of the reverb component in the environment where the microphone 101 is placed.
- the suppression controller 120 illustrated by example in FIG. 1 to control the suppression gain G(n, f) on the basis of such analysis results, it is possible to realize reverberation suppression that applies a suppression gain G(n, f) suited to the environment in which the microphone 101 is placed.
- the suppression controller 120 may also apply control so as to reduce the suppression gain G(n, f) applied to the input signal spectra X(n, f) in the case where analysis results obtained by the analyzer 110 indicate a large decrease per unit time of an input signal x(t) in a reverb segment, for example.
- control it is possible to mitigate over-suppression of an input signal x(t) obtained by a microphone 101 placed in an environment where the reverb component attenuates rapidly.
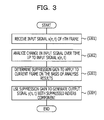
- FIG. 3 is an exemplary flowchart of a reverberation suppression process conducted by the reverberation suppression device 100 illustrated by example in FIG. 1 .
- Steps S 301 to S 304 illustrated by example in FIG. 3 are processing operations executed by the reverberation suppression device 100 in response to the input of an nth frame input signal x(n, t) obtained by sampling an input signal x(t).
- step S 301 the analyzer 110 illustrated by example in FIG. 1 receives, via the transform unit 102 , an input signal spectrum X(n, f) or an input power spectrum S(n, f) corresponding to the nth frame input signal x(n, t).
- the analyzer 110 may also compute an index indicating the decrease per unit time in a reverb segment of the input signal x(t). The analyzer 110 may then output the computed index as an analysis result.
- the suppression controller 120 illustrated by example in FIG. 1 determines a suppression gain G(n, f) to apply to the input signal spectrum X(n, f) of the current frame (step S 303 ).
- the suppression controller 120 may for example compute a suppression gain G(n, f) by correcting a standard suppression gain according to the decrease per unit time of the input signal x(t) in a reverb segment as indicated by the analysis result from the analyzer 110 .
- the suppression applier 103 and the inverse transform unit 104 illustrated by example in FIG. 1 use the suppression gain G(n, f) computed as above to generate an output signal y(n, t) in which the reverb component included in the nth frame input signal x(n, t) has been suppressed (step S 304 ).
- the suppression applier 103 may also generate an output signal spectrum Y(n, f) in which the reverb component has been suppressed by applying the suppression gain G(n, f) to the nth frame input signal spectrum X(n, f), for example.
- an output signal y(n, t) in the time domain may also be generated by having the inverse transform unit 104 apply an inverse fast Fourier transform to the output signal spectrum Y(n, f).
- analysis results from the analyzer 110 indicate how readily the reverb component attenuates in an indoor environment, regardless of the magnitude of background noise.
- the suppression gain G(n, f) determined for each frame by the suppression controller 120 on the basis of such analysis results becomes a suitable value for suppressing the reverb component included an input signal x(t), regardless of the magnitude of background noise.
- the analyzer 110 illustrated by example in FIG. 1 includes a change calculator 111 and an index calculator 112 . Also, the index calculator 112 illustrated by example in FIG. 1 includes a selector 113 and an averaging unit 114 .
- the change calculator 111 calculates a change D(n) on the basis of the difference between the input power spectrum S(n, f) of the nth frame and the input power spectrum S(n ⁇ 1, f) of the (n ⁇ 1)th frame received from the transform unit 102 .
- the change calculator 111 may also calculate the change D(n) as a sum of differences between the input power spectrum S(n, f) of the nth frame and the input power spectrum S(n ⁇ 1, f) of the (n ⁇ 1)th frame for respective frequency numbers, as in Eq. 2, for example.
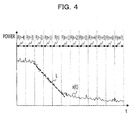
- FIG. 4 is a diagram explaining an exemplary process of analyzing change in an input signal x(t) over time.
- individual frames taken as the units of analysis for the Fourier transform by the transform unit 102 are indicated by combinations of a symbol F and frame numbers.
- the segments labeled F(n ⁇ 4) to F(n+7) respectively indicate the (n ⁇ 4)th to (n+7)th frames.
- the segment from the (n ⁇ 2)th to (n+1)th frames is a reverb segment corresponding to sound produced in a segment ending with the (n ⁇ 3)th frame.
- the change calculator 111 uses the above Eq. 1 to compute input power spectra S(j, f), which monotonically decrease in correlation with the attenuation of the input signals x(j, t).
- the change calculator 111 may also apply weights so as to suppress the effects of the background noise component included in the input signal x(t) when computing a change D(n). By suppressing such a background noise component, the change calculator 111 is able to compute a change D(n) that more faithfully reflects the slope of the change in the input signal x(t) over time in the nth frame.
- the changes D(n) computed in this way are passed to the averaging unit 114 via the selector 113 illustrated by example in FIG. 1 .
- the averaging unit 114 then conducts an averaging process discussed later on the changes D(n) received via the selector 113 to compute an average change Dav(n).
- a reverb segment is a segment in which the input signal x(t) attenuates in response to the end of an utterance produced indoors. Consequently, among the changes D(n) obtained by the change calculator 111 , changes D(n) with negative values reflect the attenuation rate of the input signal x(t) in the reverb segment.
- the selector 113 selectively pass the changes D(n) with negative values to the averaging unit 114 , it is possible to make the averaging unit 114 compute an average change Dav(n) that indicates the decrease per unit time of the input signal x(t) in the reverb segment.
- the selector 113 may, for example, selectively pass to the averaging unit 114 changes D(n) included in a range expressed by given constants d 1 and d 2 , both of which are negative values. Also, the averaging unit 114 may compute an average change Dav for the nth frame by performing a weighted sum of the change D(n) for the nth frame and the average change Dav(n ⁇ 1) for previous frames up to the (n ⁇ 1)th frame, with the applied weights being expressed using a given coefficient ⁇ . Such an average change Dav(n) computed by the averaging unit 114 may be expressed as in Eq. 3.
- Dav ⁇ ( n ) ⁇ ⁇ ⁇ Dav ⁇ ( n - 1 ) + ( 1 - ⁇ ) ⁇ D ⁇ ( n ) d ⁇ ⁇ 1 ⁇ D ⁇ ( n ) ⁇ d ⁇ ⁇ 2
- Dav ⁇ ( n ) Dav ⁇ ( n - 1 ) D ⁇ ( n ) ⁇ d ⁇ ⁇ 1 , D ⁇ ( n ) > d ⁇ ⁇ 2 ⁇ ( 3 )
- the value of the constant d 2 may be determined on the basis of the attenuation rate of an input signal x(t) in an environment where the reverb component is anticipated to be most resistant to attenuation, for example. Also, by using the constant d 1 to restrict the minimum value of the change D(n) to be used for computing an average change Dav(n), it is possible to mitigate the effects of sudden noise, for example. Furthermore, the value of the coefficient ⁇ may be set such that the value of the change D(n) and the average change Dav(n ⁇ 1) for previous frames up to the (n ⁇ 1)th frame are reflected in the value of the average change Dav(n) in respectively suitable ratios.
- the average change Dav(n) computed in this way reflects the attenuation rate of the reverb component in the environment where the input signal x(t) was obtained. Consequently, it is possible to use the average change Dav(n) as a basis for determining the desirability of applying a reverberation suppression process to an input signal x(t) in the environment where the microphone 101 is placed.
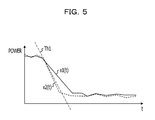
- FIG. 5 is a diagram explaining environment-induced differences in the decrease per unit time of an input signal x(t) in a reverb segment.
- the graph illustrated by a solid line is an example of change in an input signal x 1 ( t ) over time in a room with comparatively high reverb, such as a bathroom.
- the graph illustrated by a broken line is an example of change in an input signal x 2 ( t ) over time in a room with comparatively low reverb, such as a living room.
- a reverberation suppression process may be omitted for the input signal x 2 ( t ) but is desirable for the input signal x 1 ( t ), and if so, the question of whether or not to conduct a reverberation suppression process may be determined with a threshold value placed intermediately between the decreases per unit time in the reverb segment for both input signals.
- the first threshold Th 1 may be used in the process of controlling suppression gain conducted by the suppression controller 120 illustrated by example in FIG. 1 .
- the above first threshold Th 1 may also be determined on the basis of the decrease per unit time in the reverb segment of an input signal x(t) such that the reverberation suppression process is not applied to signals such as the input signal x 2 ( t ) illustrated by example in FIG. 5 .
- the first threshold Th 1 may also be set as the slope of a line that attenuates at a rate intermediate between the attenuation rate of the input signal x 1 ( t ) and the attenuation rate of the input signal x 2 ( t ) in their respective reverb segments.
- the first threshold Th 1 may be set to express a decrease per unit time that is slightly less than the decrease per unit time in the reverb segment of an input signal x(t) acquired in an environment where the effects of reverb are small, such as a living room.
- the line labeled Th 1 in FIG. 5 is a line having the first threshold Th 1 as its slope.
- the suppression controller 120 illustrated by example in FIG. 1 includes reverb characteristics storage 121 , an estimator 122 , a gain calculator 123 , a gain corrector 124 , and threshold value storage 125 .
- the threshold value storage 125 illustrated by example in FIG. 1 stores a first threshold Th 1 that has been predetermined as discussed above.
- the reverb characteristics storage 121 stores reverb characteristics ⁇ (f) that have been specified in advance such as by measuring an indoor area targeted for reverberation suppression by the reverberation suppression device 100 .
- the reverb characteristics ⁇ (f) may be, for example, a function expressing the relationship between a reverb component spectrum Xr(f) and an input signal spectrum X(f).
- a method of specifying reverb characteristics ⁇ (f) will be summarized.
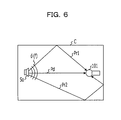
- FIG. 6 is a diagram explaining reverb characteristics ⁇ (f).
- ⁇ (f) reverb characteristics ⁇ (f)
- Pr 1 and Pr 2 paths that reach the microphone 101 after reflection.
- an input signal spectrum X(f) corresponding to an input signal x(t) observed by the microphone 101 in response to sound produced by a sound source may be expressed as the sum of a direct sound component spectrum Xd(f) and a reverb component spectrum Xr(f), as in Eq. 4.
- X ( f ) Xd ( f )+ Xr ( f ) (4)
- the direct sound component spectrum Xd(f) may be expressed using a sound spectrum ⁇ (f) that corresponds to sound produced by a sound source So, and the transfer characteristics Hd(f) of the path Pd that reaches the microphone 101 directly from the sound source So, as in Eq. 5.
- the reverb component spectrum Xr(f) may be expressed using the sound spectrum ⁇ (f) and the transfer characteristics Hr(f) of paths that reach the microphone 101 via reflection off the walls and ceiling of the room C, as in Eq. 6.
- Xd ( f ) Hd ( f ) ⁇ ( f ) (5)
- Xr ( f ) Hr ( f ) ⁇ ( f ) (6)
- Eqs. 4 to 6 may be transformed to obtain Eq. 7, which expresses the relationship between the reverb component spectrum Xr(f) and the input signal spectrum X(f).
- the reverb characteristics ⁇ (f) may be obtained as the ratio of the transfer characteristics Hr(f) regarding the transfer of reverb versus the overall transfer characteristics H(f) regarding the transfer of all paths reaching the microphone 101 from the sound source So.
- Reverb characteristics ⁇ (f) thus obtained may then be stored in the reverb characteristics storage 121 .
- the transfer characteristics H(f) and the transfer characteristics Hr(f) may be computed with established techniques, such as by measuring impulse response in a given indoor area where the application of reverberation suppression is desirable, such as a bathroom, for example.
- a specific technique of computing reverb characteristics ⁇ (f) see “Reverberation suppression device, reverberation suppression method, and reverberation suppression program”, Japanese Patent Application No. 2011-165274, previously submitted by the Inventors.
- the estimator 122 uses reverb characteristics ⁇ (f) stored in the reverb characteristics storage 121 to estimate a reverb power spectrum R(n, f) expressing the reverb component included in the input signal spectrum X(n, f) of the nth (i.e., current) frame.
- the gain calculator 123 illustrated by example in FIG. 1 computes a standard suppression gain in the form of a standard suppression gain Gs(n, f) that expresses a gain for removing the reverb power spectrum R(n, f).
- the gain calculator 123 may also, for example, compute a standard suppression gain Gs(n, f) that monotonically decreases in response to increases in the signal-to-reverb ratio SRR, which expresses the difference between the input power spectrum S(n, f) and the estimated reverb power spectrum R(n, f) of the nth frame.
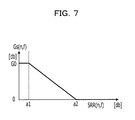
- FIG. 7 is a diagram explaining an exemplary process of computing standard suppression gain Gs(n, f).
- the horizontal axis represents the signal-to-reverb ratio SRR, while the vertical axis represents values for the standard suppression gain Gs(n, f).
- the gain calculator 123 may use a function like that illustrated by the bold line in FIG. 7 to compute a standard suppression gain Gs(n, f) that corresponds to the signal-to-reverb ratio SRR(n, f) for the frequency number f in the nth frame.
- the gain calculator 123 outputs a preset upper-limit value G 0 dB as the standard suppression gain Gs(n, f) in the case where the signal-to-reverb ratio SRR(n, f) is less than a given value a 1 .
- the gain calculator 123 outputs a given value of 0 dB as the standard suppression gain Gs(n, f) in the case where the signal-to-reverb ratio SRR(n, f) is greater than a given value a 2 .
- the gain calculator 123 outputs a value that monotonically decreases in accordance with the value of the signal-to-reverb ratio SRR(n, f) as the standard suppression gain Gs(n, f).
- the above value a 1 may be determined on the basis of the background noise level, for example.
- the value a 2 may be determined on the basis of the signal-to-reverb ratio SRR(n, f) in a segment where sound is being produced, for example.
- the gain corrector 124 computes a suppression gain G(n, f) by applying a correction based on analysis results obtained by the analyzer 110 discussed earlier to a standard suppression gain Gs(n, f) computed by the gain calculator 123 as above.
- the gain corrector 124 may also use Eq. 9 to compute a suppression gain G(n, f) on the basis of an average change Dav(n) obtained as an index indicating the decrease per unit time in a reverb segment of an input signal x(t) according to analysis by the analyzer 110 , for example.
- the gain corrector 124 takes the suppression gain G(n, f) to be the standard suppression gain Gs(n, f) in the case where the value of the average change Dav(n) is greater than the first threshold Th 1 discussed earlier.
- the gain corrector 124 takes the suppression gain G(n, f) to be a given value of 0 dB in the case where the value of the average change Dav(n) is not greater than the first threshold Th 1 discussed earlier.
- G ⁇ ( n , f ) ⁇ Gs ⁇ ( n , f ) if ⁇ ⁇ ( Dav ⁇ ( n ) > Th ⁇ ⁇ 1 ) 0 ⁇ ⁇ dB else ( 9 )
- a value of the average change Dav(n) that is greater than the first threshold Th 1 discussed earlier indicates that the attenuation rate of the input signal x(t) in the reverb segment is less than the rate corresponding to the first threshold Th 1 , similarly to the input signal x 1 ( t ) illustrated by example in FIG. 5 .
- a value of the average change Dav(n) that is less than the first threshold Th 1 discussed earlier indicates that the input signal x(t) attenuates in the reverb segment at a greater rate than the rate corresponding to the first threshold Th 1 , similarly to the input signal x 2 ( t ) illustrated by example in FIG. 5 .
- the gain corrector 124 is able to determine whether or not the reverb component readily attenuates in the environment where the input signal x(t) was acquired, or in other words, whether or not reverberation suppression is desirable.
- the suppression gain G(n, f) may be set to a given value of 0 dB in the case where the input signal x(t) attenuates sharply in the reverb segment, regardless of the value of the standard suppression gain Gs(n, f).
- the gain corrector 124 sets the suppression gain G(n, f) to a given value of 0 dB, and is thereby able to stop reverberation suppression of the input signal x(t).
- the suppression gain G(n, f) corrected by the gain corrector 124 becomes a standard suppression gain Gs(n, f) computed on the basis of the reverb characteristics ⁇ (f).
- the gain corrector 124 may also compute the suppression gain G(n, f) by subtracting a correction value depending on the value of the average change Dav(n) from the standard suppression gain Gs(n, f) in the case where the value of the average change Dav(n) is greater than the first threshold Th 1 discussed earlier.
- the gain corrector 124 may determine the above correction value such that the correction value decreases as the value of the average change Dav(n) approaches the decrease per unit time exhibited by the input signal x(t) in the reverb segment in an environment imparting reverb characteristics ⁇ (f).
- the suppression applier 103 uses a suppression gain G(n, f) computed in this way to execute a process that computes an output signal spectrum Y(n, f) in which the reverb component has been suppressed.
- An output signal y(t) may be generated by having the inverse transform unit 104 apply an inverse fast Fourier transform to the output signal spectra Y(n, f) computed for respective frames in this way.
- reverberation suppression device 100 As discussed above, according to the reverberation suppression device 100 illustrated by example in FIG. 1 , it is possible to apply reverberation suppression using a suitable suppression gain G(n, f) on the basis of the characteristics of change over time in an input signal x(t) in a reverb segment, regardless of the magnitude of background noise. In other words, according to a reverberation suppression device of the present disclosure, it is possible to accurately suppress just the reverb component without distorting the sound, regardless of the magnitude of the noise component.
- the suppression controller 120 illustrated by example in FIG. 1 computes a suppression gain G(n, f) for each frame that reflects the results of analysis of the input signal x(n, t) for that frame by the analyzer 110 . Consequently, if there is a change in the analysis results from the analyzer 110 due to a change in the environment where the input signal x(t) is acquired, that change is reflected in the suppression gain G(n, f) computed by the suppression controller 120 .
- a reverberation suppression device 100 of the present disclosure may be realized using mobile device hardware, for example.
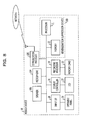
- FIG. 8 illustrates an exemplary hardware configuration of a mobile device 10 .
- like reference signs are given to components illustrated in FIG. 8 that are equivalent to components illustrated in FIG. 1 .
- the mobile device 10 includes a processor 21 , memory 22 , a microphone 101 , a communication processor 105 , and a speaker 106 .
- the mobile device 10 additionally includes a recording processor 24 , a removable memory card 25 , a display controller 26 , a liquid crystal display (LCD) 27 , an input interface (I/F) 28 , and an operable panel 29 .
- the reverberation suppression device 100 includes the processor 21 and the memory 22 .
- the processor 21 , memory 22 , communication processor 105 , microphone 101 , speaker 106 , recording processor 24 , display controller 26 , and input I/F 28 are connected to each other via a bus.
- the recording processor 24 reads data from and writes data to the memory card 25 .
- the display controller 26 controls display processing by the LCD 27 .
- the input I/F 28 relays information representing operations made on the operable panel 29 to the processor 21 .
- the memory 22 stores the operating system of the mobile device 10 , as well as an application program by which the processor 21 executes the reverberation suppression process discussed earlier.
- the application program includes programs for executing the processing that analyzes change in an input signal over time and the processing that corrects an input signal, which are included in a reverberation suppression method of the present disclosure.
- the application program for executing the above reverberation suppression process may be distributed by being recorded on the memory card 25 , for example. By loading such a memory card into the recording processor 24 and reading out data therefrom, the application program for executing the reverberation suppression process is stored in the memory 22 . Additionally, it is also possible to load an application program for executing the reverberation suppression process into the memory 22 via the communication processor 105 and a network such as the Internet.
- the reverb characteristics storage 121 illustrated by example in FIG. 1 may be realized by storing information indicating the reverb characteristics ⁇ (f) discussed earlier in the memory 22 , in addition to the above application program and other information.
- the memory 22 may also be made to store information expressing reverb characteristics ⁇ (f) computed on the basis of impulse response measured in a typical bathroom using the technique in Japanese Patent Application No. 2011-165274 previously submitted by the Inventors.
- the threshold value storage 125 illustrated by example in FIG. 1 may be realized by storing information indicating the first threshold Th 1 discussed earlier in the memory 22 .
- the processor 21 may fulfill the function of the analyzer 110 illustrated in FIG. 1 by executing the program that analyzes change in an input signal over time, which is included in the application program stored in the memory 22 .
- the processor 21 may also fulfill the functions of the suppression controller 120 and the suppression applier 103 illustrated in FIG. 1 by executing the program that corrects an input signal, which is included in the application program stored in the memory 22 .
- the application program stored in the memory 22 may also include programs by which the processor 21 executes a faster Fourier transform and an inverse fast Fourier transform.
- the processor 21 may also fulfill the respective functions of the transform unit 102 and the inverse transform unit 104 by executing such programs. In this way, the processor 21 is able to realize the respective functions included in the reverberation suppression device 100 illustrated in FIG. 1 by executing an application program stored in the memory 22 .
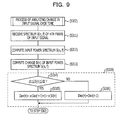
- FIG. 9 is a flowchart of an exemplary process of analyzing change in an input signal over time.
- the processing in steps S 311 to S 316 illustrated in FIG. 9 is an example of the processing in step S 302 illustrated in FIG. 3 .
- the processor 21 illustrated in FIG. 8 fulfills the function of the analyzer 110 by executing the processing in steps S 311 to S 316 included in the flowchart illustrated in FIG. 9 in cooperation with respective components.
- step S 311 the processor 21 receives an input signal spectrum X(n, f) obtained by applying a fast Fourier transform to the input signal x(n, t) of the nth frame. Subsequently, the processor 21 uses the above Eq. 1 to compute the input power spectrum S(n, f) of the input signal spectrum X(n, f) (step S 312 ).
- the processor 21 uses the input power spectra S(n, f) and S(n ⁇ 1, f) of the nth and the (n ⁇ 1)th frames as well as Eq. 2 to compute the change D(n) in the input power spectrum S(n, f) for the nth frame (step S 313 ).
- the processor 21 is able to fulfill the function of the change calculator 111 illustrated by example in FIG. 1 by executing the processing in step S 313 .
- the processor 21 uses the change D(n) computed in step S 313 and Eq. 3 to compute an average change Dav(n) that acts as an index indicating the decrease per unit time in the reverb segment of the input signal x(t).
- the processor 21 determines whether or not the change D(n) in the input power spectrum S(n, f) for the nth frame is included in a range expressed by the values d 1 and d 2 (step S 314 ).
- step S 314 the processor 21 computes the average change Dav(n) up to the nth frame by multiplying the average change Dav(n ⁇ 1) up to the (n ⁇ 1)th frame and the change D(n) by the weights ⁇ and (1 ⁇ ), respectively, and adding the results together (step S 315 ). Meanwhile, in the case of a negative determination in step S 314 , the processor 21 inherits the value of the average change Dav(n ⁇ 1) up to the (n ⁇ 1)th frame without change as the average change Dav(n) up to the nth frame (step S 316 ). In this way, the processor 21 is able to fulfill the function of the index calculator 112 illustrated by example in FIG. 1 , including the index calculator 112 and the averaging unit 114 , by executing the processing in steps S 314 to S 316 enclosed by the box labeled S 320 in FIG. 9 .
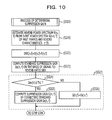
- FIG. 10 is a flowchart of an exemplary process of determining suppression gain.
- the processing in steps S 321 to S 326 illustrated in FIG. 10 is an example of the processing in step S 303 illustrated in FIG. 3 .
- the processor 21 illustrated in FIG. 8 fulfills the function of the suppression controller 120 by executing the processing in steps S 321 to S 326 included in the flowchart illustrated in FIG. 10 in cooperation with respective components.
- the processor 21 may also use the above Eq. 8 and reverb characteristics ⁇ (f) stored in the memory 22 for estimating the reverb power spectrum R(n, f), for example. In this way, the processor 21 is able to fulfill the functions of the reverb characteristics storage 121 and the estimator 122 illustrated by example in FIG. 1 by executing the processing in step S 321 in cooperation with the memory 22 .
- the processor 21 computes the signal-to-reverb ratio SRR(n, f) by subtracting the reverb power spectrum R(n, f) computed in step S 321 from the input power spectrum S(n, f) of the current frame (step S 322 ). Subsequently, the processor 21 computes a standard suppression gain Gs(n, f) on the basis of the signal-to-reverb ratio SRR(n, f) computed in step S 322 (step S 323 ). The processor 21 may also use a function like that illustrated in FIG. 7 to determine a standard suppression gain Gs(n, f) that corresponds to the value of the signal-to-reverb ratio SRR(n, f), for example. In this way, the processor 21 is able to fulfill the function of the gain calculator 123 illustrated by example in FIG. 1 by executing the processing in steps S 322 and S 323 .
- the processor 21 determines the desirability of applying a reverberation suppression process to the input signal x(t), on the basis of a comparison between the average change Dav(n) obtained by the processing in the above step S 302 and the first threshold Th 1 (step S 324 ). In the case where the average change Dav(n) is less than or equal to the first threshold Th 1 (step S 324 , Yes), the processor 21 determines that there is low desirability to suppress reverb in the environment where the microphone 101 is placed. In this case, the processor 21 computes a suppression gain G(n, f) such that the attenuation rate is lower than the case of applying the standard suppression gain Gs(n, f) (step S 325 ).
- the processor 21 may, for example, uniformly set the suppression gain G(n, f) to a lower-limit value of 0 dB, regardless of the value of the standard suppression gain Gs(n, f) obtained in step S 323 .
- the processor 21 determines that there is comparatively high reverb in the environment where the microphone 101 is placed. In this case, the processor 21 may simply take the standard suppression gain Gs(n, f) directly as the suppression gain G(n, f) (step S 326 ).
- the processor 21 is able to fulfill the function of the gain corrector 124 illustrated by example in FIG. 1 by executing the processing in steps S 324 to S 326 enclosed by the box labeled S 327 in FIG. 10 .
- the processor 21 computes a corrected power spectrum S′(n, f) in which the reverb component has been suppressed.
- the processor 21 may also, for example, compute a corrected power spectrum S′(n, f) corresponding to the output signal spectrum Y(n, f) by subtracting the suppression gain G(n, f) from the input power spectrum S(n, f) of the nth frame, as expressed in the above Eq. 10. Then, on the basis of the corrected power spectrum S′(n, f) obtained in this way, the processor 21 computes an output signal spectrum Y(n, f) according to the above Eq. 11. By executing such processes, the processor 21 is able to realize the function of the suppression applier 103 illustrated by example in FIG. 1 .
- An output signal y(t) may be generated by having the processor 21 apply an inverse fast Fourier transform to the output signal spectra Y(n, f) computed for respective frames in this way.
- the processor 21 executes processing that determines a suppression gain G(n, f) on the basis of the slope of the change over time in an input signal x(t) in a reverb segment, it is possible to obtain an output signal y(t) in which suitable reverberation suppression has been applied, regardless of the magnitude of background noise.
- the processor 21 is then able to supply the output signal y(t) obtained in this way to the communication processor 105 for signal processing.
- the communication processor 105 is able to receive an output signal y(t) in which suitable reverberation suppression has been applied according to the environment in which the mobile device 10 is placed.
- the output signal y(t) passed to the communication processor 105 is a signal in which just the reverb segment reflected in the slope of change over time in the input signal x(t) in the reverb segment has been accurately suppressed. Consequently, the output signal y(t) faithfully reproduces the sound input into the microphone 101 without distortion.
- a mobile device 10 that includes a reverberation suppression device 100 , it is possible to transmit signals expressing clear sound via the communication processor 105 and a network to a mobile device or other device being used by the person with whom the user is communicating, regardless of the environment where the user is using the mobile device 10 . Consequently, if the user of a mobile device 10 equipped with a reverberation suppression device 100 of the present disclosure has moved to or is currently in a bathroom, for example, it is possible for the user to conceal that fact from the person with whom he or she is communicating.
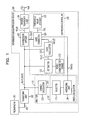
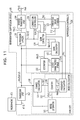
- FIG. 11 illustrates another embodiment of a reverberation suppression device 100 .
- like reference signs are given to components illustrated in FIG. 11 that are equivalent to components illustrated in FIG. 1 , and description of such components will be reduced or omitted.
- the analyzer 110 illustrated by example in FIG. 11 includes a noise estimator 115 .
- the index calculator 112 of the analyzer 110 illustrated by example in FIG. 11 includes a counter 116 and a frequency calculator 117 .
- the suppression controller 120 illustrated by example in FIG. 11 includes a correction controller 126 in addition to the components illustrated by example in FIG. 1 .
- the noise estimator 115 estimates the signal-to-noise ratio (SNR) ⁇ (n, f) of the input signal x(t) for the nth frame, on the basis of an input signal spectrum X(n, f) obtained by the transform unit 102 .
- the noise estimator 115 may also, for example, use established technology to compute a noise power spectrum N(n, f) expressing the noise component on the basis of the input signal spectrum X(n, f) or the input power spectrum S(n, f).
- the noise estimator 115 may then compute the SNR ⁇ (n, f) by subtracting the noise power spectrum N(n, f) from the input power spectrum S(n, f), as expressed in Eq. 12.
- ⁇ ( n,f ) S ( n,f ) ⁇ N ( n,f ) (12)
- the noise estimator 115 inputs SNRs ⁇ (n, f) computed for respective frames in this way into the counter 116 included in the index calculator 112 illustrated by example in FIG. 11 .
- the counter 116 conducts a counting process discussed later, in which the target being counted is the change D(n) obtained by the change calculator 111 for that frame.
- the above constant ⁇ 1 may be determined on the basis of the results of actual tests computing the SNR ⁇ (n, f) for plural frames included in a reverb segment, for example.
- the input signal spectra X(n, f) of frames with an SNR ⁇ (n, f) that is larger than such a constant ⁇ 1 faithfully reflect reverb-containing sound input into the microphone 101 .
- the counter 116 is able to count reliable changes D(n) obtained from frames that are weakly affected by the noise component.
- the counter 116 counts the number of changes D(n) respectively occurring in N classes K 1 to KN, which correspond to respective ranges obtained by splitting a range from Dmin to Dmax into N parts.
- Dmin and Dmax represent values considered to be the minimum and maximum values for the change D(n).
- the counter 116 may count the frequency of occurrence by updating the count for that class Kp.
- the frequency calculator 117 calculates an index expressing the decrease per unit time in the reverb segment of an input signal x(t), as discussed later.
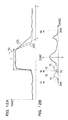
- FIGS. 12A and 12B are diagrams explaining another example of processing by the index calculator 112 .
- the graph labeled x 1 ( t ) illustrates an example of change over time in an input signal x 1 ( t ) acquired in an environment with high reverb, such as a bathroom.
- the graph labeled x 2 ( t ) illustrates an example of change over time in an input signal x 2 ( t ) acquired in an environment with low reverb, such as a living room.
- the segment labeled T indicates a segment in which sound is produced.
- the line labeled Th 1 is a line with a slope expressed by a decrease per unit time that corresponds to the first threshold Th 1 discussed earlier.
- the graph labeled H 1 illustrates a histogram H 1 obtained by the counter 116 counting changes D(n) according to the above input signal x 1 ( t ).
- the graph labeled H 2 illustrates a histogram H 2 obtained by the counter 116 counting changes D(n) according to the above input signal x 2 ( t ).
- the range labeled K 1 is a first class K 1 that takes the minimum value Dmin discussed earlier as its lower-limit value.
- the range labeled KN is a class KN that takes the maximum value Dmax discussed earlier as its upper-limit value.
- the input signal x 1 ( t ) illustrated in FIG. 12A attenuates more gently in the reverb segment following the segment T in which sound is produced compared to the line that takes the first threshold Th 1 as its slope.
- attenuation in the reverb segment of the input signal x 2 ( t ) illustrated in FIG. 12A is sharper than the attenuation indicated by the line that takes the first threshold Th 1 as its slope.
- Such differences are exhibited as different peak positions in the histograms H 1 and H 2 illustrated in FIG. 12B .
- P 1 is the count peak corresponding to the decrease per unit time in the reverb segment of the input signal x 1 ( t ).
- the peak P 1 of the histogram H 1 for changes D(n) obtained for the input signal x 1 ( t ) that attenuates gently in the reverb segment becomes positioned closer to 0 change than the first threshold Th 1 .
- P 2 is the count peak corresponding to the decrease per unit time in the reverb segment of the input signal x 2 ( t ).
- the peak P 2 of the histogram H 2 for changes D(n) obtained for the input signal x 2 ( t ) that attenuates sharply in the reverb segment appears farther from 0 change in the negative direction than the above first threshold Th 1 .
- the range that corresponds to the class containing the first threshold Th 1 is labeled Kk.
- a peak corresponding to the decrease per unit time in the reverb segment will appear in the histogram, as illustrated in FIG. 12B .
- the decrease per unit time of an input signal x(t) in the reverb segment may then be compared to the decrease corresponding to the first threshold Th 1 , on the basis of a comparison between the position of the peak in the histogram and the first threshold Th 1 . For example, if the position of the peak in the histogram is closer to 0 change than the first threshold Th 1 , this indicates that the attenuation rate of the input signal x(t) in the reverb segment is comparatively gentle. In contrast, if the peak in the histogram is positioned farther from 0 change in the negative direction than the first threshold Th 1 , this indicates that the input signal x(t) attenuates sharply in the reverb segment.
- frequencies ⁇ 1 and ⁇ 2 which express the ratios of total counts Sh 1 and Sh 2 distributed over the range to the left of the first threshold Th 1 versus the overall total for the histograms H 1 and H 2 illustrated in FIG. 12B .
- the example in FIG. 12B demonstrates that the frequency ⁇ 2 , which is obtained for the histogram H 2 corresponding to the input signal x 2 ( t ) exhibiting sharp attenuation in the reverb segment, is greater than the frequency 61 , which is obtained for the histogram H 1 corresponding to the input signal x 1 ( t ).
- a frequency ⁇ (n) of changes D(n) which indicates that the decrease per unit time is equal to or greater than a given value in the histogram Hist(n, j) (where j 1 to N). Consequently, the frequency ⁇ (n) of changes D(n) which indicates that the decrease per unit time is equal to or greater than a given value may be used as an index expressing the decrease per unit time of an input signal x(t) in a reverb segment.
- the frequency ⁇ (n) is expressed using the total count Sh(n) contained in the classes from K 1 to Kk and the total count Sha(n) contained in all classes, for example.
- the class Kk is the class to which belongs the change that indicates the decrease corresponding to the first threshold Th 1 .
- the frequency calculator 117 may also identify the class Kk containing the decrease expressed by the first threshold Th 1 on the basis of the first threshold Th 1 stored in the threshold value storage 125 illustrated by example in FIG. 11 , for example.
- ⁇ ⁇ ( n ) Sh ⁇ ( n )
- ⁇ j 1 N ⁇ ( Hist ⁇ ( n , j ) ) ( 14 )
- the index calculator 112 illustrated by example in FIG. 11 passes the frequency ⁇ (n) calculated by the frequency calculator 117 as above to the suppression controller 120 as an index that indicates the decrease per unit time in the reverb segment of an input signal x(t).
- a frequency ⁇ (n) obtained in this way indicates the probability that the decrease per unit time in the reverb segment of an input signal x(t) is equal to or greater than a decrease corresponding to the slope indicated by the first threshold Th 1 .
- the decrease per unit time in the reverb segment of an input signal x(t) is equal to or greater than a decrease corresponding to the slope indicated by the first threshold Th 1 .
- a second threshold Th 2 for determining whether or not to apply a reverberation suppression process to an input signal x(t) may be set on the basis of the frequency ⁇ (n), similarly to the average change Dav(n) discussed earlier.
- the second threshold Th 2 may also be used in processing by the suppression controller 120 .
- the value of the second threshold Th 2 may also be determined on the basis of a frequency obtained using the above Eq. 14 for a histogram whose peak corresponding to changes obtained for respective frames included in a reverb segment is within a range corresponding to the class Kk that contains the first threshold Th 1 , for example.
- the analyzer 110 that includes the noise estimator 115 , counter 116 , and frequency calculator 117 discussed above may be realized by the cooperative action of the processor 21 and the memory 22 illustrated in FIG. 8 , similarly to the analyzer 110 illustrated by example in FIG. 1 .
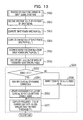
- FIG. 13 is a flowchart of another exemplary process of analyzing change over time in an input signal x(t).
- steps S 311 to S 313 and steps S 331 to S 337 illustrated in FIG. 13 is an example of the processing in step S 302 illustrated in FIG. 3 .
- the processor 21 illustrated in FIG. 8 fulfills the function of the analyzer 110 illustrated in FIG. 11 by executing the processing in the steps included in the flowchart illustrated in FIG. 13 in cooperation with respective components.
- the processor 21 computes a noise power spectrum N(n, f) on the basis of the input power spectrum S(n, f) obtained in step S 312 (step S 331 ). Subsequently, the processor 21 computes an SNR ⁇ (n) according to the above Eq. 12 using the noise power spectrum N(n, f) obtained in step S 331 and the input power spectrum S(n, f) (step S 332 ). In this way, the processor 21 is able to fulfill the function of the noise estimator 115 illustrated by example in FIG. 11 by executing the processing in steps S 331 and S 332 .
- the processor 21 is able to fulfill the function of the frequency calculator 117 illustrated by example in FIG. 11 by conducting the processing in step S 337 .
- the processor 21 is able to fulfill the function of the index calculator 112 illustrated by example in FIG. 11 , including the counter 116 and the frequency calculator 117 , by executing the processing in the steps enclosed by the box labeled S 320 in the flowchart illustrated in FIG. 13 .
- the frequency calculator 117 informs the suppression controller 120 of the frequency ⁇ (n) obtained as above as an index that indicates the decrease per unit time in the reverb segment of an input signal x(t).
- the gain corrector 124 illustrated by example in FIG. 11 computes a corrected gain G′(n, f) that reflects the decrease per unit time in the reverb segment of an input signal x(t).
- the gain corrector 124 may also set the corrected gain G′(n, f) to the standard suppression gain Gs(n, f) or a given value of 0 dB according to comparison results between the frequency ⁇ (n) and the second threshold Th 2 expressed by information stored in the threshold value storage 125 , as expressed in Eq. 15, for example.
- the gain corrector 124 takes the corrected gain G′(n, f) to be the standard suppression gain Gs(n, f) in the case where there is a low probability that the decrease per unit time of an input signal x(t) in the reverb segment is equal to or greater than a decrease corresponding to the slope indicated by the first threshold Th 1 .
- the gain corrector 124 takes the corrected gain G′(n, f) to be 0 dB in the case where there is a high probability that the decrease per unit time in reverb segment of an input signal x(t) is equal to or greater than a decrease corresponding to the slope indicated by the first threshold Th 1 .
- G ′ ⁇ ( n , f ) ⁇ Gs ⁇ ( n , f ) if ⁇ ⁇ ( ⁇ ⁇ ( n ) ⁇ Th ⁇ ⁇ 2 ) 0 ⁇ ⁇ dB else ( 15 )
- the correction controller 126 computes an index indicating the slope of the magnitude of the suppression gain G(n, f) in a period up to the nth frame.
- the correction controller 126 may compute an average gain Gav(n, f) as expressed in Eq. 16 as the index indicating the slope of the magnitude of the suppression gain G(n, f) up to the nth frame, for example.
- Gav ( n,f ) ⁇ Gav ( n ⁇ 1 ,f )+(1 ⁇ ) G ′( n,f ) (16)
- the average gain Gav(n, f) up to the nth frame is the result of weighted addition of the average gain Gav(n ⁇ 1, f) up to the (n ⁇ 1)th frame and the corrected gain G′(n, f) of the nth frame, with the weights expressed by a given weighting coefficient ⁇ .
- the correction controller 126 may then determine the desirability of applying reverberation suppression to the input signal x(n, t) of the nth frame on the basis of a comparison between the average gain Gav(n, f) computed in this way and a given third threshold Th 3 .
- the value of the third threshold Th 3 may, for example, be determined on the basis of a minimum suppression gain at which human hearing may perceive differences between sound played back from an output signal y(t) with suppression gain applied by the suppression applier 103 , and sound played back from an output signal y(t) without suppression gain applied.
- the correction controller 126 may determine that there is low desirability to apply reverberation suppression in the case where the average gain Gav(n, f) is less than or equal to the third threshold Th 3 , or in other words, in the case where the suppression effect over the past several frames is miniscule to a degree that might not be humanly perceivable. In this case, the correction controller 126 causes the gain corrector 124 to compute a suppression gain G(n, f) with a value smaller than the corrected gain G′(n, f).
- the correction controller 126 may determine that there is high desirability to apply reverberation suppression in the case where the average gain Gav(n, f) is greater than the third threshold Th 3 , or in other words, in the case where the suppression effect over the past several frames is large to a degree that may be humanly perceivable. In this case, the correction controller 126 causes the gain corrector 124 to output a corrected gain G′(n, f) computed using Eq. 15, for example, directly as the suppression gain G(n, f).
- the suppression gain G(n, f) computed by the gain corrector 124 illustrated by example in FIG. 11 becomes the corrected gain G′(n, f), but limited to the case where the average gain Gav(n, f) is greater than the third threshold Th 3 , as expressed in Eq. 17. Otherwise, the suppression gain G(n, f) computed by the gain corrector 124 becomes 0 dB.
- G ⁇ ( n , f ) ⁇ G ′ ⁇ ( n , f ) if ⁇ ⁇ ( Gav ⁇ ( n , f ) > Th ⁇ ⁇ 3 ) 0 ⁇ ⁇ dB else ( 17 )
- the correction controller 126 is able to stop reverberation suppression exercised on the input signal x(n, t) of a frame where the efficacy of reverberation suppression is anticipated to be slight, and reduce distortion in sound played back from the output signal y(n, t).
- the suppression controller 120 that includes the gain corrector 124 and the correction controller 126 illustrated by example in FIG. 11 may be realized by the cooperative action of the processor 21 and the memory 22 illustrated in FIG. 8 , similarly to the suppression controller 120 illustrated by example in FIG. 1 .
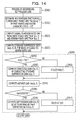
- FIG. 14 is a flowchart of another exemplary process of determining suppression gain.
- steps illustrated in FIG. 14 that are equivalent to steps illustrated in FIG. 10 , and description of such steps will be reduced or omitted.
- the processing in steps S 321 to S 323 and steps S 341 to S 347 illustrated in FIG. 14 is an example of the processing in step S 303 illustrated in FIG. 3 .
- the processor 21 illustrated in FIG. 8 fulfills the function of the suppression controller 120 illustrated in FIG. 11 by executing the processing in the steps included in the flowchart illustrated in FIG. 14 in cooperation with respective components.
- the processor 21 determines the desirability of applying the reverberation suppression process to the input signal x(t), on the basis of a comparison between the frequency ⁇ (n) obtained by the processing in the above step S 337 and the second threshold Th 2 (step S 341 ). In the case where the frequency ⁇ (n) is greater than the second threshold Th 2 (step S 341 , Yes), the processor 21 determines that there is low desirability to suppress reverb in the environment where the microphone 101 is placed.
- the processor 21 computes a corrected gain G′(n, f) with a value that is smaller than the standard suppression gain Gs(n, f) (such as a value of 0 dB, for example), similarly to step S 325 illustrated in FIG. 10 (step S 342 ).
- the processor 21 takes the standard suppression gain Gs(n, f) directly as the corrected gain G′(n, f), similarly to step S 326 illustrated in FIG. 10 (step S 343 ).
- the processor 21 is able to fulfill the function of the gain corrector 124 which computes a corrected gain G′(n, f) on the basis of comparison results between the above frequency ⁇ (n) and the second threshold Th 2 .
- the processor 21 uses the above Eq. 16 to compute an average gain Gav(n, f) as an index indicating the slope of magnitude of the suppression gain G(n, f) up to the nth frame (step S 344 ). Subsequently, the processor 21 determines whether or not the average gain Gav(n, f) obtained by the processing in step S 344 is less than or equal to the third threshold Th 3 (step S 345 ). In the case of a positive determination in step S 345 , the processor 21 determines that there is low desirability to apply reverberation suppression.
- the processor 21 computes a suppression gain G(n, f) with a value that is smaller than the above corrected gain G′(n, f) (such as a value of 0 dB, for example) (step S 346 ). In contrast, in the case of a negative determination in step S 345 , the processor 21 determines that there is high desirability to apply reverberation suppression. In this case, the processor 21 takes the above corrected gain G′(n, f) directly as the suppression gain G(n, f) (step S 347 ).
- the processor 21 is able to fulfill the function of the gain corrector 124 computing a suppression gain G(n, f) under control by the correction controller 126 illustrated by example in FIG. 11 .
- the respective units included in the analyzer 110 and the suppression controller 120 illustrated in FIGS. 1 and 11 are not limited to the combinations illustrated by example in FIGS. 1 and 11 , and may be applied in a variety of combinations.
- the correction controller 126 illustrated by example in FIG. 11 may also be applied to the suppression controller 120 illustrated in FIG. 1 .
- the index calculation process conducted by the index calculator 112 that includes the selector 113 and the averaging unit 114 illustrated in FIG. 1 may also be controlled according to whether or not an SNR ⁇ (n, f) estimated by the noise estimator 115 illustrated in FIG. 11 is equal to or greater than the constant ⁇ 1 .
Landscapes
- Engineering & Computer Science (AREA)
- Computational Linguistics (AREA)
- Quality & Reliability (AREA)
- Signal Processing (AREA)
- Health & Medical Sciences (AREA)
- Audiology, Speech & Language Pathology (AREA)
- Human Computer Interaction (AREA)
- Physics & Mathematics (AREA)
- Acoustics & Sound (AREA)
- Multimedia (AREA)
- Circuit For Audible Band Transducer (AREA)
- Control Of Amplification And Gain Control (AREA)
- Measurement Of Mechanical Vibrations Or Ultrasonic Waves (AREA)
Abstract
Description
S(n,f)=10 log10 |X(n,f)|2 (1)
X(f)=Xd(f)+Xr(f) (4)
Xd(f)=Hd(f)·φ(f) (5)
Xr(f)=Hr(f)·Φ(f) (6)
S′(n,f)=S(n,f)−G(n,f) (10)
S′(n,f)=10 log10 |Y(n,f)|2 (11)
θ(n,f)=S(n,f)−N(n,f) (12)
Gav(n,f)=βGav(n−1,f)+(1−β)G′(n,f) (16)
Claims (15)
Applications Claiming Priority (2)
| Application Number | Priority Date | Filing Date | Title |
|---|---|---|---|
| JP2011207508A JP5751110B2 (en) | 2011-09-22 | 2011-09-22 | Reverberation suppression apparatus, reverberation suppression method, and reverberation suppression program |
| JP2011-207508 | 2011-09-22 |
Publications (2)
| Publication Number | Publication Date |
|---|---|
| US20130077798A1 US20130077798A1 (en) | 2013-03-28 |
| US9093077B2 true US9093077B2 (en) | 2015-07-28 |
Family
ID=47008263
Family Applications (1)
| Application Number | Title | Priority Date | Filing Date |
|---|---|---|---|
| US13/532,908 Expired - Fee Related US9093077B2 (en) | 2011-09-22 | 2012-06-26 | Reverberation suppression device, reverberation suppression method, and computer-readable storage medium storing a reverberation suppression program |
Country Status (3)
| Country | Link |
|---|---|
| US (1) | US9093077B2 (en) |
| EP (1) | EP2573768B1 (en) |
| JP (1) | JP5751110B2 (en) |
Cited By (1)
| Publication number | Priority date | Publication date | Assignee | Title |
|---|---|---|---|---|
| US11176938B2 (en) | 2018-09-10 | 2021-11-16 | Baidu Online Network Technology (Beijing) Co., Ltd. | Method, device and storage medium for controlling game execution using voice intelligent interactive system |
Families Citing this family (14)
| Publication number | Priority date | Publication date | Assignee | Title |
|---|---|---|---|---|
| GB2546026B (en) | 2010-10-01 | 2017-08-23 | Asio Ltd | Data communication system |
| JP5923994B2 (en) * | 2012-01-23 | 2016-05-25 | 富士通株式会社 | Audio processing apparatus and audio processing method |
| CN102750956B (en) * | 2012-06-18 | 2014-07-16 | 歌尔声学股份有限公司 | Method and device for removing reverberation of single channel voice |
| JP6371167B2 (en) * | 2014-09-03 | 2018-08-08 | リオン株式会社 | Reverberation suppression device |
| GB201617409D0 (en) * | 2016-10-13 | 2016-11-30 | Asio Ltd | A method and system for acoustic communication of data |
| GB201617408D0 (en) | 2016-10-13 | 2016-11-30 | Asio Ltd | A method and system for acoustic communication of data |
| EP3337190B1 (en) * | 2016-12-13 | 2021-03-10 | Oticon A/s | A method of reducing noise in an audio processing device |
| GB201704636D0 (en) | 2017-03-23 | 2017-05-10 | Asio Ltd | A method and system for authenticating a device |
| GB2565751B (en) | 2017-06-15 | 2022-05-04 | Sonos Experience Ltd | A method and system for triggering events |
| GB2570634A (en) | 2017-12-20 | 2019-08-07 | Asio Ltd | A method and system for improved acoustic transmission of data |
| JP7264594B2 (en) * | 2018-02-23 | 2023-04-25 | リオン株式会社 | Reverberation suppression device and hearing aid |
| KR102295993B1 (en) * | 2020-03-30 | 2021-09-01 | 부산대학교 산학협력단 | Method of reverberation time estimation using statistic of speech spectral decay rates |
| US11988784B2 (en) | 2020-08-31 | 2024-05-21 | Sonos, Inc. | Detecting an audio signal with a microphone to determine presence of a playback device |
| WO2022192452A1 (en) * | 2021-03-11 | 2022-09-15 | Dolby Laboratories Licensing Corporation | Improving perceptual quality of dereverberation |
Citations (8)
| Publication number | Priority date | Publication date | Assignee | Title |
|---|---|---|---|---|
| US20030026437A1 (en) * | 2001-07-20 | 2003-02-06 | Janse Cornelis Pieter | Sound reinforcement system having an multi microphone echo suppressor as post processor |
| EP1469703A2 (en) | 2004-04-30 | 2004-10-20 | Phonak Ag | Method of processing an acoustical signal and a hearing instrument |
| WO2006011104A1 (en) | 2004-07-22 | 2006-02-02 | Koninklijke Philips Electronics N.V. | Audio signal dereverberation |
| JP2006129434A (en) | 2004-10-01 | 2006-05-18 | Nippon Telegr & Teleph Corp <Ntt> | Automatic gain control method, automatic gain control apparatus, automatic gain control program and recording medium with the program recorded thereon |
| US20060115095A1 (en) * | 2004-12-01 | 2006-06-01 | Harman Becker Automotive Systems - Wavemakers, Inc. | Reverberation estimation and suppression system |
| US20080059157A1 (en) | 2006-09-04 | 2008-03-06 | Takashi Fukuda | Method and apparatus for processing speech signal data |
| JP2008288718A (en) | 2007-05-15 | 2008-11-27 | Yamaha Corp | Sound echo canceler |
| JP2011065128A (en) | 2009-08-20 | 2011-03-31 | Mitsubishi Electric Corp | Reverberation removing device |
Family Cites Families (1)
| Publication number | Priority date | Publication date | Assignee | Title |
|---|---|---|---|---|
| JP2011165274A (en) | 2010-02-10 | 2011-08-25 | Elpida Memory Inc | Semiconductor device and data processing system |
-
2011
- 2011-09-22 JP JP2011207508A patent/JP5751110B2/en not_active Expired - Fee Related
-
2012
- 2012-06-26 US US13/532,908 patent/US9093077B2/en not_active Expired - Fee Related
- 2012-06-27 EP EP12173939.5A patent/EP2573768B1/en not_active Not-in-force
Patent Citations (11)
| Publication number | Priority date | Publication date | Assignee | Title |
|---|---|---|---|---|
| US20030026437A1 (en) * | 2001-07-20 | 2003-02-06 | Janse Cornelis Pieter | Sound reinforcement system having an multi microphone echo suppressor as post processor |
| EP1469703A2 (en) | 2004-04-30 | 2004-10-20 | Phonak Ag | Method of processing an acoustical signal and a hearing instrument |
| WO2006011104A1 (en) | 2004-07-22 | 2006-02-02 | Koninklijke Philips Electronics N.V. | Audio signal dereverberation |
| JP2006129434A (en) | 2004-10-01 | 2006-05-18 | Nippon Telegr & Teleph Corp <Ntt> | Automatic gain control method, automatic gain control apparatus, automatic gain control program and recording medium with the program recorded thereon |
| US20060115095A1 (en) * | 2004-12-01 | 2006-06-01 | Harman Becker Automotive Systems - Wavemakers, Inc. | Reverberation estimation and suppression system |
| EP1667416A2 (en) | 2004-12-01 | 2006-06-07 | Harman Becker Automotive Systems-Wavemakers, Inc. | Reverberation estimation and suppression system |
| JP2006157920A (en) | 2004-12-01 | 2006-06-15 | Herman Becker Automotive Systems-Wavemakers Inc | Reverberation estimation and suppression system |
| US20080059157A1 (en) | 2006-09-04 | 2008-03-06 | Takashi Fukuda | Method and apparatus for processing speech signal data |
| JP2008058900A (en) | 2006-09-04 | 2008-03-13 | Internatl Business Mach Corp <Ibm> | Low-cost filter coefficient determination method in reverberation removal |
| JP2008288718A (en) | 2007-05-15 | 2008-11-27 | Yamaha Corp | Sound echo canceler |
| JP2011065128A (en) | 2009-08-20 | 2011-03-31 | Mitsubishi Electric Corp | Reverberation removing device |
Non-Patent Citations (3)
| Title |
|---|
| Extended Search Report dated Aug. 2, 2013 in European Patent Application No. 12173939.5-1901/2573768. |
| James Eaton Et al, "Noise-Robust Reverberation Time Estimation using Spectral Decay Distributions with Reduced Computational Cost", Proc. IEEE Intl. Conf. on Acoustics, Speech and Signal Processing (ICASSP), Apr. 11, 2013, XP055072650, Vancouver Canada, 5 pages. |
| Japanese Office Action dated Jan. 27, 2015 in corresponding Japanese Patent Application No. 2011-207508 (3 pages) (2 pages English Translation). |
Cited By (1)
| Publication number | Priority date | Publication date | Assignee | Title |
|---|---|---|---|---|
| US11176938B2 (en) | 2018-09-10 | 2021-11-16 | Baidu Online Network Technology (Beijing) Co., Ltd. | Method, device and storage medium for controlling game execution using voice intelligent interactive system |
Also Published As
| Publication number | Publication date |
|---|---|
| JP2013068809A (en) | 2013-04-18 |
| EP2573768B1 (en) | 2016-12-14 |
| EP2573768A3 (en) | 2013-09-04 |
| EP2573768A2 (en) | 2013-03-27 |
| JP5751110B2 (en) | 2015-07-22 |
| US20130077798A1 (en) | 2013-03-28 |
Similar Documents
| Publication | Publication Date | Title |
|---|---|---|
| US9093077B2 (en) | Reverberation suppression device, reverberation suppression method, and computer-readable storage medium storing a reverberation suppression program | |
| EP3703052B1 (en) | Echo cancellation method and apparatus based on time delay estimation | |
| EP3828885B1 (en) | Voice denoising method and apparatus, computing device and computer readable storage medium | |
| US8571231B2 (en) | Suppressing noise in an audio signal | |
| Gerkmann et al. | Unbiased MMSE-based noise power estimation with low complexity and low tracking delay | |
| US7359838B2 (en) | Method of processing a noisy sound signal and device for implementing said method | |
| US8515098B2 (en) | Noise suppression device and noise suppression method | |
| KR101624652B1 (en) | Method and Apparatus for removing a noise signal from input signal in a noisy environment, Method and Apparatus for enhancing a voice signal in a noisy environment | |
| CN111149370B (en) | Howling detection in a conferencing system | |
| US11069366B2 (en) | Method and device for evaluating performance of speech enhancement algorithm, and computer-readable storage medium | |
| US10726857B2 (en) | Signal processing for speech dereverberation | |
| CN106575511B (en) | Method for estimating background noise and background noise estimator | |
| JP7325445B2 (en) | Background Noise Estimation Using Gap Confidence | |
| US20150098587A1 (en) | Processing apparatus, processing method, program, computer readable information recording medium and processing system | |
| WO2024041512A1 (en) | Audio noise reduction method and apparatus, and electronic device and readable storage medium | |
| KR20200095370A (en) | Detection of fricatives in speech signals | |
| US9210507B2 (en) | Microphone hiss mitigation | |
| CN113593604A (en) | Method, device and storage medium for detecting audio quality | |
| US10607628B2 (en) | Audio processing method, audio processing device, and computer readable storage medium | |
| EP2816818A1 (en) | Sound field spatial stabilizer with echo spectral coherence compensation | |
| WO2017106281A1 (en) | Nuisance notification | |
| EP2760221A1 (en) | Microphone hiss mitigation | |
| EP2816817A1 (en) | Sound field spatial stabilizer with spectral coherence compensation | |
| JP2018031819A (en) | Signal processor, signal processing method, and signal processing program | |
| EP2760021A1 (en) | Sound field spatial stabilizer |
Legal Events
| Date | Code | Title | Description |
|---|---|---|---|
| AS | Assignment |
Owner name: FUJITSU LIMITED, JAPAN Free format text: ASSIGNMENT OF ASSIGNORS INTEREST;ASSIGNORS:OTANI, TAKESHI;SUZUKI, MASANAO;TOGAWA, TARO;REEL/FRAME:028509/0680 Effective date: 20120618 |
|
| STCF | Information on status: patent grant |
Free format text: PATENTED CASE |
|
| CC | Certificate of correction | ||
| FEPP | Fee payment procedure |
Free format text: MAINTENANCE FEE REMINDER MAILED (ORIGINAL EVENT CODE: REM.); ENTITY STATUS OF PATENT OWNER: LARGE ENTITY |
|
| LAPS | Lapse for failure to pay maintenance fees |
Free format text: PATENT EXPIRED FOR FAILURE TO PAY MAINTENANCE FEES (ORIGINAL EVENT CODE: EXP.); ENTITY STATUS OF PATENT OWNER: LARGE ENTITY |
|
| STCH | Information on status: patent discontinuation |
Free format text: PATENT EXPIRED DUE TO NONPAYMENT OF MAINTENANCE FEES UNDER 37 CFR 1.362 |
|
| FP | Expired due to failure to pay maintenance fee |
Effective date: 20190728 |