US8708913B2 - Ultrasonic imaging apparatus - Google Patents
Ultrasonic imaging apparatus Download PDFInfo
- Publication number
- US8708913B2 US8708913B2 US12/222,888 US22288808A US8708913B2 US 8708913 B2 US8708913 B2 US 8708913B2 US 22288808 A US22288808 A US 22288808A US 8708913 B2 US8708913 B2 US 8708913B2
- Authority
- US
- United States
- Prior art keywords
- frequency
- ultrasonic
- signals
- signal
- imaging apparatus
- Prior art date
- Legal status (The legal status is an assumption and is not a legal conclusion. Google has not performed a legal analysis and makes no representation as to the accuracy of the status listed.)
- Expired - Fee Related, expires
Links
Images


Classifications
-
- G—PHYSICS
- G01—MEASURING; TESTING
- G01S—RADIO DIRECTION-FINDING; RADIO NAVIGATION; DETERMINING DISTANCE OR VELOCITY BY USE OF RADIO WAVES; LOCATING OR PRESENCE-DETECTING BY USE OF THE REFLECTION OR RERADIATION OF RADIO WAVES; ANALOGOUS ARRANGEMENTS USING OTHER WAVES
- G01S15/00—Systems using the reflection or reradiation of acoustic waves, e.g. sonar systems
- G01S15/88—Sonar systems specially adapted for specific applications
- G01S15/89—Sonar systems specially adapted for specific applications for mapping or imaging
- G01S15/8906—Short-range imaging systems; Acoustic microscope systems using pulse-echo techniques
- G01S15/895—Short-range imaging systems; Acoustic microscope systems using pulse-echo techniques characterised by the transmitted frequency spectrum
-
- G—PHYSICS
- G01—MEASURING; TESTING
- G01S—RADIO DIRECTION-FINDING; RADIO NAVIGATION; DETERMINING DISTANCE OR VELOCITY BY USE OF RADIO WAVES; LOCATING OR PRESENCE-DETECTING BY USE OF THE REFLECTION OR RERADIATION OF RADIO WAVES; ANALOGOUS ARRANGEMENTS USING OTHER WAVES
- G01S7/00—Details of systems according to groups G01S13/00, G01S15/00, G01S17/00
- G01S7/52—Details of systems according to groups G01S13/00, G01S15/00, G01S17/00 of systems according to group G01S15/00
- G01S7/52017—Details of systems according to groups G01S13/00, G01S15/00, G01S17/00 of systems according to group G01S15/00 particularly adapted to short-range imaging
- G01S7/52023—Details of receivers
- G01S7/52036—Details of receivers using analysis of echo signal for target characterisation
- G01S7/52038—Details of receivers using analysis of echo signal for target characterisation involving non-linear properties of the propagation medium or of the reflective target
- G01S7/52039—Details of receivers using analysis of echo signal for target characterisation involving non-linear properties of the propagation medium or of the reflective target exploiting the non-linear response of a contrast enhancer, e.g. a contrast agent
-
- G—PHYSICS
- G01—MEASURING; TESTING
- G01S—RADIO DIRECTION-FINDING; RADIO NAVIGATION; DETERMINING DISTANCE OR VELOCITY BY USE OF RADIO WAVES; LOCATING OR PRESENCE-DETECTING BY USE OF THE REFLECTION OR RERADIATION OF RADIO WAVES; ANALOGOUS ARRANGEMENTS USING OTHER WAVES
- G01S7/00—Details of systems according to groups G01S13/00, G01S15/00, G01S17/00
- G01S7/52—Details of systems according to groups G01S13/00, G01S15/00, G01S17/00 of systems according to group G01S15/00
- G01S7/52017—Details of systems according to groups G01S13/00, G01S15/00, G01S17/00 of systems according to group G01S15/00 particularly adapted to short-range imaging
- G01S7/52046—Techniques for image enhancement involving transmitter or receiver
-
- G—PHYSICS
- G01—MEASURING; TESTING
- G01S—RADIO DIRECTION-FINDING; RADIO NAVIGATION; DETERMINING DISTANCE OR VELOCITY BY USE OF RADIO WAVES; LOCATING OR PRESENCE-DETECTING BY USE OF THE REFLECTION OR RERADIATION OF RADIO WAVES; ANALOGOUS ARRANGEMENTS USING OTHER WAVES
- G01S7/00—Details of systems according to groups G01S13/00, G01S15/00, G01S17/00
- G01S7/52—Details of systems according to groups G01S13/00, G01S15/00, G01S17/00 of systems according to group G01S15/00
- G01S7/52017—Details of systems according to groups G01S13/00, G01S15/00, G01S17/00 of systems according to group G01S15/00 particularly adapted to short-range imaging
- G01S7/52023—Details of receivers
- G01S7/52036—Details of receivers using analysis of echo signal for target characterisation
- G01S7/52038—Details of receivers using analysis of echo signal for target characterisation involving non-linear properties of the propagation medium or of the reflective target
Definitions
- the present invention relates to a medical ultrasonic imaging apparatus, and more particularly relates to optimization of parameters for frequency compound imaging.
- Compounding smoothes speckles by averaging and adding signals in a plurality of directions to improve quality of vision of a minute contrast difference in an image.
- a low frequency component and a high frequency component are subjected to signal processing, and added to thereby improve azimuth resolution itself and uniformity of resolution over an image of interest.
- a method is disclosed in which the number of divided frequency bands is about two to five and center frequencies and coefficients are continuously changed according to their depths to keep continuity of quality (Japanese Patent Application Publication No. 2001-184677). Furthermore, a method is disclosed in which, in order to suppress a reduction in distance resolution having a tradeoff relation with an amount of speckle reduction, not only a narrowband signal but also a wideband signal containing the narrowband signal are changed to divided signals (Japanese Patent Application Publication No. 2001-170049).
- An ultrasonic imaging apparatus of the present invention includes a probe having a plurality of elements that transmits or receives an ultrasonic signal; a beam former that performs phasing and addition on the ultrasonic signal received by the plurality of elements; a frequency compound changing unit that performs frequency compound imaging on the ultrasonic signal subjected to phasing and addition; an ultrasonic image generation unit that generates an ultrasonic image from the signal subjected to the frequency compound imaging; and a display means for displaying the generated ultrasonic image, wherein the frequency compound unit includes: a frequency band division unit that divides the ultrasonic signal subjected to phasing and addition into signals corresponding to an arbitrary number of frequency bands; a separate detector that detects each of band divided signals obtained by dividing the ultrasonic signal subjected to phasing and addition into signals corresponding to the arbitrary number of frequency bands and that uses the detected signals as an arbitrary number of detected signals by bands; and an accumulator that adds the arbitrary number of detected signals by bands with
- Such an addition coefficient may be also used to accomplish the following: Signal intensity of a band-divided received signal is normalized and then multiplication is performed before addition to increase or decrease the amount of signals. Moreover, such an addition coefficient may be used to accomplish the following: Signal intensity of a band-divided received signal is normalized and signal intensities in all frequency bands are set to 1, and then an addition coefficient is multiplied and an amount of signals is increased or decreased so that signal intensity at the time of signal addition is proportional to the addition coefficient.
- an ultrasonic imaging apparatus capable of optimizing parameters for frequency compound imaging.
- FIG. 1 is a view showing a numerical simulation result proving an effect of the present invention
- FIG. 2 is a view showing a numerical simulation result proving an effect of the present invention
- FIG. 3 is a view showing a numerical simulation result proving an effect of the present invention
- FIG. 4 is a view showing a numerical simulation result proving an effect of the present invention
- FIG. 5 is a view showing a numerical simulation result proving an effect of the present invention.
- FIG. 6 is a block diagram showing an example of a configuration of an ultrasonic imaging apparatus of the present invention.
- FIG. 7 is a processing flowchart explaining processing of a frequency compound unit of an ultrasonic imaging apparatus of the present invention.
- FIG. 8 is a processing flowchart explaining processing of an optimal parameter calculation unit of an ultrasonic imaging apparatus of the present invention.
- FIG. 9 is a view showing an example of a method for dividing a frequency band indicated by a parameter outputted by an optimal parameter calculation unit of an ultrasonic imaging apparatus of the present invention.
- FIG. 10 is a view showing an example of a method for dividing a frequency band indicated by a parameter outputted by an optimal parameter calculation unit of an ultrasonic imaging apparatus of the present invention.
- FIG. 11 is a view showing an example of a method for dividing a frequency band indicated by a parameter outputted by an optimal parameter calculation unit of an ultrasonic imaging apparatus of the present invention.
- or reduce a bandwidth ratio of p ij ⁇ i / ⁇ j .
- a range for obtaining an effect of 80% or more satisfies ⁇ / ⁇ 0.5 where the following expression is given.
- SSNR Strun Signal Noise Ratio
- SSNR is defined as follows where an average of video signals is ⁇ a , and dispersion thereof is ⁇ a .
- SSNR ⁇ a / ⁇ a
- the speckle reduction effect is evaluated by a value, which is obtained when SSNR of a signal to be evaluated is divided by SSNR of a reference signal and the resultant signal is normalized.
- a center frequency of the reference signal and a bandwidth any values may be used.
- a video signal intensity distribution is a Rayleigh distribution and an average value in the Rayleigh distribution is proportional to dispersion, and therefore SSNR of a signal on which no compounding is performed is constant regardless of the way of obtaining the values of the center frequency and the bandwidth.
- Equation (1) is one in which the inventor of the present invention extends SSNR described in a case where the number of divided frequency bands is two and addition coefficients are equal to each other, to SSNR in a case where the number of divided frequency bands is n and addition coefficients are arbitrarily used.
- a scatterer is expressed by a Poisson distribution of an average frequency f s (following equation 2), a divided RF signal s i is expressed by a Gaussian pulse with a carrier frequency f ti and dispersion ⁇ ti (following equation (3)).
- a correlation R titj between RF signals is given by the following equation (4) and a correlation coefficient ⁇ titj is given by the following equation (5).
- a correlation R aiaj between the detected RF signals is expressed by the following equation (6), where a complete elliptic integral of first kind K and a complete elliptic integral of second kind E are used. Parts written by these special functions show processing in which a RF signal is multiplied by sin (f c ⁇ t) and cos (f c ⁇ t) where f c denotes a frequency shift amount, the obtained signals are frequency-shifted IQ signals, the obtained IQ signals are filtered by a lowpass filter, and thereafter a sum of squares of the resultant signals is calculated to obtain a video signal.
- ⁇ a i ⁇ a j 2 ⁇ ⁇ 2 ⁇ ⁇ ⁇ ( ⁇ x i ⁇ x j 2 ) - ( 1 - ⁇ x i ⁇ x j 2 ) ⁇ K ⁇ ( ⁇ x i ⁇ x j 2 ) ⁇ - ⁇ 4 - ⁇ ( 6 )
- the average and dispersion of the divided video signals are proportional to the square root of dispersion of the RF signal.
- ⁇ tj is an inverse of ⁇ fi as shown in the following equation (9).
- an approximation can be achieved by using the first term of Edgeworth expansion, resulting in Gaussian (equation (10)) where dispersion ⁇ si is inversely proportional to a pulse width ⁇ tj and a typical value f s of the Poisson distribution (equation (11)).
- SSNR is expressed as a function of processing parameters for signal frequency compound imaging.
- six variables are given in the case of two divided frequency bands, nine variables are given in the case of three, and therefore in the case of the arbitrary number of divided frequency bands, it is difficult to obtain an optimal value in an intuitive manner and even in a simulation manner if nothing is done.
- the present inventor derived the following equation (17) as an expression using effective variables of SSNR.
- the effective variables include a product c i ⁇ fi of a weighting coefficient and a square root of a bandwidth of a divided signal, a bandwidth ratio p ij of each of the frequency bands, a larger value f ijmax of bandwidths of two frequency bands, and a difference ⁇ f ij in a center frequency between two frequency bands.
- a numerator of SSNR expressed by the equation (17) is a sum of a square root of diagonal elements of the matrix expressed by the equation (18) and a denominator thereof is a square root of a sum of all elements. Since higher SSNR is desirable, the value of the denominator is preferably small. This means that the number of effective elements of the matrix is small.
- the matrix elements are formed by multiplying a product of (c i ⁇ 1 ) and (c j ⁇ j ) by 2p ij /(1+p ij 2 ) and exp[ ⁇ (2/(1+p ij 2 )( ⁇ f ij / ⁇ fmaxij ))].
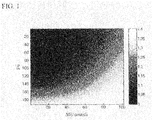
- FIG. 1 shows a calculation result of SSNR when p ij and ⁇ f ij were changed.
- the element values other than p ij and ⁇ f ij are set to optimal values to be described later. It is found that the maximum value is ⁇ 2, and that the element values are converged to the maximum value even if p ij is decreased or ⁇ f ij is increased.
- the number of matrix elements contributes to SSNR most, and the off-diagonal can be set to substantially zero by setting 2p ij /(1+P ij 2 ) or exp[ ⁇ (2/(1+p ij 2 ) ( ⁇ f ij / ⁇ fmaxij ))] (inequalities (20) (21)).
- the number of effective matrix elements is changed from n 2 to n.
- Optimal setting is achieved by setting the diagonal element (c i ⁇ i ) of the diagonal matrix (inequality (20)) thus obtained.
- the method for setting the divided signals to be independent of one another includes two methods; one method for reducing a bandwidth radio and the other method for separating the center frequency, the former affects SSNR in a series and the latter affects SSNR exponentially. Considering this from the point of view of the matrix, this corresponds to the fact that the off-diagonal element is set to substantially zero, and in this case, the number of effective elements is changed from n 2 to n.
- a variable of the SSNR is only the number of divided frequency bands (c i ⁇ i ) as shown in the following formula (22)
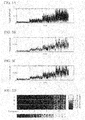
- FIGS. 2 and 3 show numeral simulation results each showing an effect obtained by satisfying the conditional equation (24).
- the numeral simulation was conducted as the following steps.
- a scatterer was expressed by a uniform random number of [0, 1] of 8192 points.
- a sampling frequency f s was taken as 32 MHz.
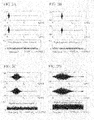
- FIG. 2A shows a low-frequency video signal a 1
- FIGS. 2B , 2 C and 2 D show high-frequency video signals a 2 , having 0.5 MHz, 2.5 MHz and 5 MHz, respectively.
- the upper stage shows a real part of the frequency distribution of RF signal
- the middle stage shows an imaginary part of the frequency distribution of the RF signal
- the lower stage shows the video signal.
- 4031 indicates a result obtained from the time series at which the video signals in FIGS. 2A and 2B were added.
- 4032 indicates a result obtained from the time series at which the video signals in FIGS. 2A and 2B were added.
- 4033 indicates a result obtained from the time series at which the video signals in FIGS. 2A and 2C were added.
- 4032 in FIG. 3B corresponds to 402 in FIG. 3A .
- the numeral result 403 goes along the curve 404 well.
- the foregoing parameter setting is a result in which a qualitative relationship between the processing parameter and the speckle reduction effect is clarified and an optimal value is obtained based on the relationship.
- contrast resolution can be enhanced to the maximum degree when the number of divided frequency bands is arbitrarily set.
- Optimal setting was obtained by setting the off-diagonal component to zero by the inequalities (20) and (21) and by equalizing the diagonal component c i ⁇ i as in the equation (24).
- a condition for minimizing contribution to SSNR from the off-diagonal component is obtained although it is significantly small as compared with the contribution from the diagonal component.
- An equation to be solved is the equation (25) shown below and it is found that the bandwidth of the divided signal and the center frequency thereof are not independently determined.
- SSNR is expressed by an average ⁇ of c i ⁇ i and dispersion ⁇ as shown in the following equation based on the definition of SSNR.
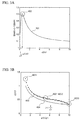
- FIG. 5 a calculation was made of a contrast difference between a case in which addition was performed using an optimal parameter and a case in which addition was performed using a parameter by which SSNR was reduced 20% theoretically.
- the number of calculation points was 8092 in time series, and scatterer intensity was set to 1, 3, 6, and 10 every 2048 points in order to observe contrast resolution as shown by the lowest stage in FIG. 4 .
- FIG. 5A showed the latter signal on a time axis.
- FIG. 5D is display of intensities of the respective cases in FIGS. 5A , 5 B and 5 C. Regarding the display on the time axis and the intensity display, it is understandable that a difference in scatterer intensity distribution is easily found out from FIG. 5B rather than FIG. 5A , and that, moreover, it is easily found out from FIG. 5C rather than FIG. 5B .
- the off-diagonal element is effectively set to zero, thereby the number of effective elements is changed from n 2 to n, and SSNR is enhanced from 1 to ⁇ n to the maximum.
- the reduction in the off-diagonal element to zero means an increase in independency of each of the divided signals from one to another.
- the more the number of signals is increased the more SN ratio is improved, and when the number of signals n, the ratio is increased to the maximum value of ⁇ n.
- the maximum value of ⁇ n is obtained when not only the adding signals are independent of one another, but also contributions of the respective signals are equal to one another. Further, the more widely the contribution of each signal varies, the more the maximum value deteriorates, and when an average of c 1 ⁇ 1 representing a contribution of each signal is ⁇ and dispersion is ⁇ , the maximum value is multiplied by 1/(1+ ⁇ / ⁇ ) 2 ) 0.5 . In a case where deterioration is 80%, ⁇ / ⁇ is 0.5.
- quality of an ultrasonic image is generally evaluated by three indexes including sensitivity, distance resolution, contrast resolution. Any two of these indexes have a tradeoff relation and three indexes are related to one another.
- the present invention relates to a method for setting image processing parameters to obtain an optimal image, and more specifically describes a method for maximizing contrast resolution.
- the number of divided frequency bands was set to three or more. It should be noted that in a case, such as high frequency imaging or the like, in which it is sufficient to improve only contrast resolution, the number of divided frequency bands may be two.
- a center frequency f i and a bandwidth ⁇ i are used as values for extracting only a frequency region where no phase characteristic is changed.
- a center frequency f i is set to contain a fractional multiple or integral multiple of a resonance frequency of the contrast medium.
- harmonic and sub-harmonic are generated, but the presence or absence of appearance of harmonic and sub-harmonic differs depending on magnitude of sound pressure.
- Harmonics are generated at a relatively low sound pressure in order of 2, 3, . . . , and sub-harmonics are next generated at a threshold sound pressure in order of 1/2, 3/2, . . . .
- the order of the harmonics and that of the sub-harmonics are substantially the same, resulting in a broad frequency distribution where a clear peak is difficult to be found out.
- tissue-derived harmonic component tissue harmonic: THI
- THI tissue harmonic
- the function described below is expressed by a linear sum where k i is an arbitrary constant.
- f 0j (1 ⁇ 0j /2) ⁇ f i ⁇ f 0j (1+ ⁇ j /2)) ⁇ ( ⁇ i ⁇ 0j ) ( i 1, 2 , . . .
- the ultrasonic imaging apparatus of the present invention has at least one of an evaluation weighting coefficient input means for setting each of coefficients k i of the image indexes I 1 (sound power), I 2 (distance resolution) and I 3 (contrast resolution) to a real number as a constant for determining importance and Lagrangian undetermined coefficients standing for imposition of a constraint condition that the image indexes are fixed; and a constraint condition input means for inputting a constraint condition upon maximizing the evaluation function J.
- an evaluation weighting coefficient input means for setting each of coefficients k i of the image indexes I 1 (sound power), I 2 (distance resolution) and I 3 (contrast resolution) to a real number as a constant for determining importance and Lagrangian undetermined coefficients standing for imposition of a constraint condition that the image indexes are fixed
- a constraint condition input means for inputting a constraint condition upon maximizing the evaluation function J.
- FIG. 6A is a block diagram showing one example of a configuration of the ultrasonic imaging apparatus of the present invention.
- a probe 1 is formed of a plurality of elements.
- An apparatus main body 2 includes a transmitting and receiving separation switch 3 , a transmission beam former 4 , an amplifying means 5 , a reception beam former 6 , a signal processor 7 , a memory 8 , a display means 9 , an input means 10 , and a control unit 11 .
- the reception beam former 6 includes a beam former 61 and a frequency compound unit 62 .
- the frequency compound unit 62 includes an optimal parameter calculation unit 621 , a band-division unit 622 , a separate detector 623 , and an accumulator 624 .
- An ultrasonic pulse generated by the transmission beam former 4 is transmitted to a living body from the probe 1 through the transmitting and receiving separation switch 3 , and the probe 1 receives an ultrasonic wave reflected from the living body.
- the received signal is input to the amplifying means 5 through the transmitting and receiving separation switch 3 so as to amplify the input signal, and the reception beam former 6 performs phasing/addition to enhance an SN ratio.
- the signal processor 7 inputs the received signal outputted from the reception beam former 6 , and performs imaging.
- a generated image is stored in the memory 8 , and thereafter is read and interpolated, and the resultant image is displayed on the display means 9 . It should be noted that these processes are controlled by the control means 11 .
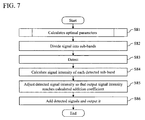
- FIG. 7 is a processing flowchart showing processing of the frequency compound unit of the ultrasonic imaging apparatus of the present invention.
- the frequency compound unit 62 inputs a signal subjected to phasing by the beam former 61 and starts processing.
- the optimal parameter calculation unit 621 calculates optimal parameters by processing to be described later (S 81 ).
- the band-division unit 622 divides the signal into n signals using a bandpass filter according to the processing parameter (S 82 ).
- the separate detector 623 detects each of n signals (S 83 ).
- the accumulator 624 calculates signal intensities of detected n signals (S 84 ), adjusts the detected signal intensities so that the output signal intensities reach a calculated addition coefficient (S 85 ), and sums up n signals and outputs it (step S 86 ).
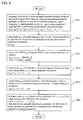
- FIG. 8 is a processing flowchart explaining processing performed by the optimal parameter calculation unit 621 .
- a signal subjected to phasing by the beam former 61 is supplied to the optimal parameter calculation unit 621 and processing is started.
- the optimal parameter calculation unit 621 sets up each processing parameter domain through five steps.
- n max of the number of divided frequency bands n is automatically determined by the specification of the apparatus or arbitrarily determined by the user.
- a fourth condition is created in the following way:
- a lower limit ⁇ min of a bandwidth ⁇ i of a divided frequency band is determined on the basis of the filter characteristic and the like of the apparatus.
- ⁇ min ⁇ i ( i 1, 2 , . . . , n ) Condition 4
- a fifth step S 815 the fifth condition is created in the following way:
- a lower limit c min of signal intensity c i of a divided frequency band at the time of addition is determined on the basis of the noise level and the like.
- c min ⁇ c i ( i 1, 2 , . . . , n ) Condition 5
- processing for setting up each processing parameter domain corresponds to steps S 811 to S 815 .
- step S 811 instead of frequency bands themselves of the received signal, among the frequency bands of the received signal, it is assumed that a region, where neither a fundamental wave component nor a harmonic component is included, and, when a transmitting pulse has frequencies included in a plurality of frequency bands, neither a sum frequency component of these frequencies nor a difference frequency component therebetween is included, is expressed by n 0Ang frequency bands, each having a center frequency-f 0Angj and a bandwidth ⁇ 0Angj . It is also assumed that a center frequency f i of an i-th sub-band is located in a j-th band. Based on these assumptions, the following condition may be created.
- step S 811 it is assumed that there is provided a means for detecting a frequency region where no phase characteristic is changed.
- the frequency region, where no phase characteristic is changed is expressed by n 0Flt bands, each having a center frequency f 0Fltj and a bandwidth ⁇ 0Fltjj .
- a center frequency f i of an i-th sub-band is located in a j-th band. Based on these assumptions, the following condition may be created.
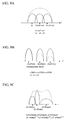
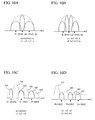
- a horizontal axis shows a frequency and a vertical axis shows signal intensity in dB where a frequency distribution of a received signal intensity are shown by a dotted line and a center frequency of a divided signal, a bandwidth thereof and signal intensity at the time of addition are shown by solid lines, respectively.
- this is an example in which a frequency band division method is performed where the center frequencies are distributed with equal intervals, the bandwidths are equal to one another, and addition coefficients are also equal to one another.
- FIG. 9B shows an example of an output result in the embodiment in which a region, where a center frequency f i includes a harmonic frequency, which is an integral multiple of a center frequency of a transmitting signal, and also includes, when a transmitting pulse has frequencies included in a plurality of frequency bands, at least one of frequencies corresponding respectively to a sum frequency of these frequencies and a difference frequency therebetween.
- a sub-harmonic frequency which is a fractional multiple of the center frequency, and In this example, triple frequencies were taken into consideration.
- the bandwidths are equal to one another, all signal intensities are equal to one another at the time of addition.
- FIG. 9C shows an example of an output result in the embodiment in which a center frequency f i includes a frequency at which the maximum value of a probe gain is given.
- FIGS. 10A and 10B are examples of an output result in the embodiment in which an addition coefficient c i is proportional to received signal intensity at a center frequency f i .
- signal intensities are first determined as c 1 to c 3 ⁇ c 2 .
- the signal intensities are first determined, and therefore ⁇ i is inversely proportional to the square of c i , resulting in ⁇ 2 ⁇ 1 to ⁇ 3 .
- FIG. 10B is an example with consideration given to ⁇ / ⁇ 0.5.
- the bandwidth of the frequency band having a high intensity is exponentially narrowed.
- the width of the filter that divides the signal is a certain fixed width or more, and therefore the bandwidth of the region having a high signal intensity is set to be wider than the theoretical value.
- the divided signal of the region having a high signal intensity has a larger contribution to SSNR, and in an extreme case, approximation is performed using only the divided signal of the region having a high signal intensity.
- FIG. 10C shows an example of an output result in the embodiment in which, as a frequency region of the divided signals, a region is set where the center frequency f i and the bandwidth ⁇ i do not include a fundamental wave component or a harmonic component, and also do not include, when a transmitting pulse has frequencies included in a plurality of frequency bands, a sum frequency component of these frequencies or a difference frequency component therebetween.
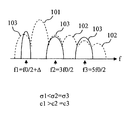
- a received signal is formed of a fundamental wave 101 , harmonics 102 and subharmonics 103 , and these components are connected to one another to form a board frequency distribution having a low locality.
- the frequency bands including the fundamental wave component and the harmonic components are removed, that is, only the frequency bands including subharmonics are extracted.
- the center frequency of the fundamental wave was described as f 0 and 1/2 subharmonic, 3/2 subharmonic and 5/2 subharmonic were set as divided frequency bands. It should be noted that a direct current component was included in the region of 1/2 subharmonic and therefore the center frequency was set close to the high frequency region and the bandwidth is narrowly set. As a result, regarding the signal intensity c i at the time of addition, c 2 and c 3 are equal to each other and c 1 is slightly higher.
- FIG. 10D shows an example of an output result of the embodiment in which a center frequency f i and a bandwidth ⁇ i are used as values for extracting only a frequency region where no phase characteristic is changed.
- a received signal is formed of a fundamental wave 101 , harmonics 102 and a region 103 where a phase and amplitude caused by a ⁇ -function like time series is flat, and these components are connected to one another to form a board frequency distribution having a low locality. In this example, it is assumed that no subharmonic is generated.
- the region having a flat phase is extracted, with a result that a region corresponding to a subharmonic frequency band is extracted, and values of 3/2 times of the basic frequency, 5/2 times thereof and 7/2 times thereof are given to f 1 , f 2 , f 3 , respectively.
- the result is outputted where the bandwidths are equal to one another and the signal intensities at the time of addition are also equal to one another.
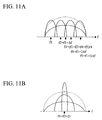
- FIG. 11A shows an example of an output result in an embodiment in which an evaluation function J of sound power, distance resolution and contact resolution, which are image indexes, is maximized.
- a wide frequency band f 3 is formed to obtain distance resolution and other relatively narrow frequency bands are equally divided in a received signal intensity distribution.
- signal intensity c 3 of the wide frequency band at the time of addition is smaller than that of each of the narrow frequency bands.
- the center frequency of the wide frequency band does not match any one of center frequencies of the narrow frequency bands.
- the former is a result obtained when products of the square roots of the addition coefficients c i of the central frequency f i and the bandwidths ⁇ i are made equal to each other.
- FIG. 11B shows a configuration in which SSNR can be improved even in a case where the center frequencies of the divided signals must be matched one another for some constraint.
- This shows an example in which a bandwidth ratio of p ij ⁇ i / ⁇ j is reduced to obtain independency of the divided signal.
Landscapes
- Physics & Mathematics (AREA)
- Engineering & Computer Science (AREA)
- Radar, Positioning & Navigation (AREA)
- Remote Sensing (AREA)
- Computer Networks & Wireless Communication (AREA)
- General Physics & Mathematics (AREA)
- Acoustics & Sound (AREA)
- Nonlinear Science (AREA)
- Ultra Sonic Daignosis Equipment (AREA)
Abstract
Description
It should be noted that explanation of derivation will be given by the following order:
- (1) Definition of SSNR
- (2) Expansion to n Divisions
- (3) Approximation of Special Function
- (4) Definition of Effective Coefficient
- (5) Consider Characteristic as Matrix
- (6) Consider Optimization of SSNR Separately as Diagonal Element and Off-diagonal Element.
- (7) Evaluation of Diagonal Component (Optimal Setting)
- (8) Evaluation of Off-diagonal Component
- (9) Estimation of Error
- (1) Definition of SSNR
SSNR=μa/σa
- (2) Expansion to n Divisions
and the SSNR of the signal is expressed by the following equation (1) where an average of the respective video signal intensities is μai and dispersion thereof is σai and a correlation coefficient thereof is ρaiaj. Here, i=1, 2, . . . , n, and n is the number of divided frequency bands. Equation (1) is one in which the inventor of the present invention extends SSNR described in a case where the number of divided frequency bands is two and addition coefficients are equal to each other, to SSNR in a case where the number of divided frequency bands is n and addition coefficients are arbitrarily used.
- (3) Approximation of Special Function
- (4) Definition of Effective Coefficient
- (5) Consider Characteristic as Matrix
- (6) Consider Optimization of SSNR Separately as Diagonal Element and Off-Diagonal Element.
- (7) Evaluation of Diagonal Component (Optimal Setting)
c 1√{square root over (σf1)}=c 2√{square root over (σf2)}= . . . =c n√{square root over (σfn)} (24)
- (8) Evaluation of Off-diagonal Component
- (9) Estimation of Error
σ/μ≦(1−p 2)/p 2)0.5
In the case of p=0.8, σ/μ≦0.5 is established. Moreover, this result is proved by the following numeral simulation.
(f 0j(1−σ0j/2)≦f i ≦f 0j(1+σj/2))Λ(σi≦σ0j) (i=1, 2, . . . , n, j=1, . . . , n)
With the above-mentioned configuration, it is possible to obtain a processing parameter that maximizes SSNR as much as possible even when input signal frequency distributions differ from each other. As a result, it is possible to obtain the best possible image quality relating to a patient of extreme obesity where the input signal frequency distribution largely deviates from the average and that of a patient who has tissue degeneration
(f 0j(1−σ0j/2)≦f i ≦f 0j(1+σ0j/2))Λ(σi≦σ0j) (i=1, 2, . . . , n, j=1, . . . , n 0)
n≦nmax
nmin≦n
nmin=[SSNRmin 2]
It should be noted that [ ] is Gauss' notation. This step may be omitted.
σmin≦σi (i=1, 2, . . . , n)
c min ≦c i (i=1, 2, . . . , n)
As mentioned above, processing for setting up each processing parameter domain corresponds to steps S811 to S815.
c 1√σ1 =c 2√σ2 = . . . =c n√σn
In a case where n, ci, σi, fi are not uniquely determined, parameters by which a sum of matrix elements in the equation (19) is minimized are selected and outputted as an optimal parameter.
c 1√σ1 =c 2√σ2 = . . . =c n√σn.
dfij≦Δfij
pij≦εpij
c 1√σ1 =c 2√σ2 = . . . =c n√σn
f1=fTHIi
f2=fTSHIi
f3=fSi
f4=fMi
c 1√σ1 =c 2√σ2 = . . . =c n√σn
fi=fGaini
σi=σGaini
c 1√σ1 =c 2√σ2 = . . . =c n√σn
c i =G(f i)
c 1√σ1 =c 2√σ2 = . . . =c n√σn
fi=fAngi
(f 0Angj(1−σ0Angj/2)≦f i ≦f 0Angj(1+σ0Angj/2))Λ(σi≦σ0Angj) (I=1, 2, . . . , n, j=1, . . . n0Ang)
(f 0Fltj(1−σ0Fltj/2)≦f i ≦f 0Fltj(1+σ0Fltj/2))Λ(i≦σ 0Fltj) (i=1, 2, . . . , n, j=1, . . . n 0Fltj)
| Explanation of |
| 1 | |
| 2 | apparatus |
| 3 | transmitting and receiving |
| 4 | transmission beam former |
| 5 | amplifying means |
| 6 | reception beam former |
| 7 | |
| 8 | |
| 9 | |
| 10 | input means |
| 11 | |
| 61 | beam former |
| 62 | |
| 621 | optimal parameter calculation unit |
Claims (13)
c 1√σ1 =c 2√σ2 =. . .=c n√σn.
(f 0j(1−σ0j/2)≦f i ≦f 0j(1+σj/2))Λ(σi≦σ0j) (i=1, 2, . . . , n, j=1, . . . , n)
Applications Claiming Priority (2)
| Application Number | Priority Date | Filing Date | Title |
|---|---|---|---|
| JP2007278021A JP5116438B2 (en) | 2007-10-25 | 2007-10-25 | Ultrasonic imaging device |
| JP2007-278021 | 2007-10-25 |
Publications (2)
| Publication Number | Publication Date |
|---|---|
| US20090112090A1 US20090112090A1 (en) | 2009-04-30 |
| US8708913B2 true US8708913B2 (en) | 2014-04-29 |
Family
ID=40583743
Family Applications (1)
| Application Number | Title | Priority Date | Filing Date |
|---|---|---|---|
| US12/222,888 Expired - Fee Related US8708913B2 (en) | 2007-10-25 | 2008-08-19 | Ultrasonic imaging apparatus |
Country Status (2)
| Country | Link |
|---|---|
| US (1) | US8708913B2 (en) |
| JP (1) | JP5116438B2 (en) |
Cited By (1)
| Publication number | Priority date | Publication date | Assignee | Title |
|---|---|---|---|---|
| US10905401B2 (en) * | 2017-07-09 | 2021-02-02 | The Board Of Trustees Of The Leland Stanford Junior University | Ultrasound imaging with spectral compounding for speckle reduction |
Families Citing this family (6)
| Publication number | Priority date | Publication date | Assignee | Title |
|---|---|---|---|---|
| JP5307453B2 (en) * | 2008-05-29 | 2013-10-02 | 株式会社日立メディコ | Ultrasonic diagnostic equipment |
| US9173629B2 (en) * | 2009-11-18 | 2015-11-03 | Kabushiki Kaisha Toshiba | Ultrasonic diagnostic apparatus and ultrasonic image processing apparatus |
| KR101287098B1 (en) * | 2011-04-28 | 2013-07-16 | 서강대학교산학협력단 | Method of synthesizing frequency images using the energy of each frequency band and apparatus thereof |
| CN105997142A (en) * | 2016-06-12 | 2016-10-12 | 飞依诺科技(苏州)有限公司 | Ultrasonic system transmitting signal compositing and imaging method and device |
| CN109408427B (en) * | 2017-08-18 | 2021-01-22 | 龙芯中科技术股份有限公司 | Cross-clock domain data processing method and system |
| JP6504297B2 (en) * | 2018-04-05 | 2019-04-24 | コニカミノルタ株式会社 | Ultrasonic diagnostic equipment |
Citations (5)
| Publication number | Priority date | Publication date | Assignee | Title |
|---|---|---|---|---|
| JPH0751270A (en) | 1993-08-13 | 1995-02-28 | Hitachi Medical Corp | Ultrasonic diagnostic device |
| US6106469A (en) * | 1998-09-30 | 2000-08-22 | Matsushita Electric Industrial Co., Ltd. | Method and apparatus for reducing undesired multiple-echo signal in ultrasound imaging |
| JP2001170049A (en) | 1999-12-17 | 2001-06-26 | Aloka Co Ltd | Ultrasonograph |
| JP2003010176A (en) | 2001-06-19 | 2003-01-14 | Ge Medical Systems Global Technology Co Llc | Method and device for ultrasonic transmitting and receiving, and ultrasonic imaging device |
| US6524252B1 (en) * | 2000-11-24 | 2003-02-25 | U-Systems, Inc. | Method and system for generating ultrasound frames with decorrelated speckle patterns and generating a compound ultrasound image therefrom |
-
2007
- 2007-10-25 JP JP2007278021A patent/JP5116438B2/en not_active Expired - Fee Related
-
2008
- 2008-08-19 US US12/222,888 patent/US8708913B2/en not_active Expired - Fee Related
Patent Citations (5)
| Publication number | Priority date | Publication date | Assignee | Title |
|---|---|---|---|---|
| JPH0751270A (en) | 1993-08-13 | 1995-02-28 | Hitachi Medical Corp | Ultrasonic diagnostic device |
| US6106469A (en) * | 1998-09-30 | 2000-08-22 | Matsushita Electric Industrial Co., Ltd. | Method and apparatus for reducing undesired multiple-echo signal in ultrasound imaging |
| JP2001170049A (en) | 1999-12-17 | 2001-06-26 | Aloka Co Ltd | Ultrasonograph |
| US6524252B1 (en) * | 2000-11-24 | 2003-02-25 | U-Systems, Inc. | Method and system for generating ultrasound frames with decorrelated speckle patterns and generating a compound ultrasound image therefrom |
| JP2003010176A (en) | 2001-06-19 | 2003-01-14 | Ge Medical Systems Global Technology Co Llc | Method and device for ultrasonic transmitting and receiving, and ultrasonic imaging device |
Non-Patent Citations (3)
| Title |
|---|
| H.E. Melton et al., A-Mode Speckle Reduction with Compound Frequencies and Compound Bandwidths, Ultrasonic Imaging (1984) pp. 158-173, Hewlett-Packard Laboratories. |
| H.E. Melton et al., A—Mode Speckle Reduction with Compound Frequencies and Compound Bandwidths, Ultrasonic Imaging (1984) pp. 158-173, Hewlett-Packard Laboratories. |
| William F. Walker et al., The Application of K-Space in Pulse Echo Ultrasound, IEE Transaction on Ultrasonic, Ferroelectrics, and Frequency Control, May 1998, pp. 541-558, vol. 45, No. 3. |
Cited By (1)
| Publication number | Priority date | Publication date | Assignee | Title |
|---|---|---|---|---|
| US10905401B2 (en) * | 2017-07-09 | 2021-02-02 | The Board Of Trustees Of The Leland Stanford Junior University | Ultrasound imaging with spectral compounding for speckle reduction |
Also Published As
| Publication number | Publication date |
|---|---|
| JP2009101083A (en) | 2009-05-14 |
| JP5116438B2 (en) | 2013-01-09 |
| US20090112090A1 (en) | 2009-04-30 |
Similar Documents
| Publication | Publication Date | Title |
|---|---|---|
| US8708913B2 (en) | Ultrasonic imaging apparatus | |
| EP3249423B1 (en) | Ultrasound imaging device | |
| US10791965B2 (en) | Method and apparatus for wirelessly monitoring repetitive bodily movements | |
| US9575178B2 (en) | Beamforming method and ultrasonic diagnostic apparatus | |
| US8979760B2 (en) | Method and apparatus for automatic optimization of doppler imaging parameters | |
| US20070018886A1 (en) | Interference determination method and fmcw radar using the same | |
| US20170296128A1 (en) | Buckle and on-vehicle system | |
| US6686874B2 (en) | Process for calibrating radar signals at subapertures of an antenna of two-channel SAR/MTI radar system | |
| US8100832B2 (en) | Ultrasound diagnostic apparatus | |
| JP2008507322A (en) | Ultrasound imaging | |
| US20020147399A1 (en) | Adaptive signal processing scheme for contrast agent imaging | |
| US20120286994A1 (en) | Method and system for locating interferences affecting a satellite-based radionavigation signal | |
| US11087466B2 (en) | Methods and system for compound ultrasound image generation | |
| US6599248B1 (en) | Method and apparatus for ultrasound diagnostic imaging | |
| JP3367462B2 (en) | Active sonar and target detection method thereof | |
| Ekroll et al. | Spectral Doppler estimation utilizing 2-D spatial information and adaptive signal processing | |
| Ponnle et al. | Suppression of grating lobe artifacts in ultrasound images formed from diverging transmitting beams by modulation of receiving beams | |
| JP2005253949A (en) | Ultrasonic diagnostic apparatus | |
| US20070038101A1 (en) | Method of forming strain images | |
| CN111466951B (en) | Method and device for generating ultrasonic attenuation image, ultrasonic equipment and storage medium | |
| EP3905962B1 (en) | Systems and methods for ultrasound attenuation coefficient estimation | |
| CN109187771B (en) | Low-complexity minimum variance ultrasonic imaging method fused with eigenvalue decomposition | |
| Hisatsu et al. | Low-complexity generalized coherence factor estimated from binarized signals in ultrasound beamforming | |
| Zheng et al. | High-Definition Plane-Wave Ultrasound Imaging Based on Subbands Phase Information Extracted From Echo Signals | |
| US20210330197A1 (en) | Biological information detection device |
Legal Events
| Date | Code | Title | Description |
|---|---|---|---|
| AS | Assignment |
Owner name: HITACHI MEDICAL CORPORATION, JAPAN Free format text: ASSIGNMENT OF ASSIGNORS INTEREST;ASSIGNOR:YAMAMOTO, MARIKO;REEL/FRAME:021473/0086 Effective date: 20080730 |
|
| AS | Assignment |
Owner name: HITACHI, LTD., JAPAN Free format text: ASSIGNMENT OF ASSIGNORS INTEREST;ASSIGNOR:HITACHI MEDICAL CORPORATION;REEL/FRAME:040545/0254 Effective date: 20160401 |
|
| FEPP | Fee payment procedure |
Free format text: MAINTENANCE FEE REMINDER MAILED (ORIGINAL EVENT CODE: REM.) |
|
| LAPS | Lapse for failure to pay maintenance fees |
Free format text: PATENT EXPIRED FOR FAILURE TO PAY MAINTENANCE FEES (ORIGINAL EVENT CODE: EXP.) |
|
| STCH | Information on status: patent discontinuation |
Free format text: PATENT EXPIRED DUE TO NONPAYMENT OF MAINTENANCE FEES UNDER 37 CFR 1.362 |
|
| FP | Lapsed due to failure to pay maintenance fee |
Effective date: 20180429 |