US8405827B2 - Time-resolved spectroscopy system and methods for multiple-species analysis in fluorescence and cavity-ringdown applications - Google Patents
Time-resolved spectroscopy system and methods for multiple-species analysis in fluorescence and cavity-ringdown applications Download PDFInfo
- Publication number
- US8405827B2 US8405827B2 US12/697,227 US69722710A US8405827B2 US 8405827 B2 US8405827 B2 US 8405827B2 US 69722710 A US69722710 A US 69722710A US 8405827 B2 US8405827 B2 US 8405827B2
- Authority
- US
- United States
- Prior art keywords
- time
- sample
- light
- optical
- fluorescence
- Prior art date
- Legal status (The legal status is an assumption and is not a legal conclusion. Google has not performed a legal analysis and makes no representation as to the accuracy of the status listed.)
- Expired - Fee Related, expires
Links
- 238000004611 spectroscopical analysis Methods 0.000 title claims abstract description 14
- 238000000034 method Methods 0.000 title abstract description 40
- 238000004458 analytical method Methods 0.000 title description 5
- 230000003287 optical effect Effects 0.000 claims abstract description 95
- 238000005259 measurement Methods 0.000 claims abstract description 54
- 150000001875 compounds Chemical class 0.000 claims description 40
- 230000005855 radiation Effects 0.000 claims description 18
- 239000000463 material Substances 0.000 claims description 6
- QVGXLLKOCUKJST-UHFFFAOYSA-N atomic oxygen Chemical compound [O] QVGXLLKOCUKJST-UHFFFAOYSA-N 0.000 claims description 2
- 229910052760 oxygen Inorganic materials 0.000 claims description 2
- 239000001301 oxygen Substances 0.000 claims description 2
- 230000004044 response Effects 0.000 claims description 2
- 150000002500 ions Chemical class 0.000 claims 2
- 238000004020 luminiscence type Methods 0.000 claims 2
- MYMOFIZGZYHOMD-UHFFFAOYSA-N Dioxygen Chemical compound O=O MYMOFIZGZYHOMD-UHFFFAOYSA-N 0.000 claims 1
- 229910001882 dioxygen Inorganic materials 0.000 claims 1
- 238000004422 calculation algorithm Methods 0.000 abstract description 29
- 238000000180 cavity ring-down spectroscopy Methods 0.000 abstract description 20
- 238000002060 fluorescence correlation spectroscopy Methods 0.000 abstract description 6
- 238000000475 fluorescence cross-correlation spectroscopy Methods 0.000 abstract description 6
- 238000012417 linear regression Methods 0.000 abstract description 5
- 239000000203 mixture Substances 0.000 abstract description 5
- 238000001506 fluorescence spectroscopy Methods 0.000 abstract description 3
- 238000004847 absorption spectroscopy Methods 0.000 abstract description 2
- 239000000523 sample Substances 0.000 description 56
- 238000010521 absorption reaction Methods 0.000 description 9
- 230000005540 biological transmission Effects 0.000 description 9
- 239000011159 matrix material Substances 0.000 description 9
- 239000000126 substance Substances 0.000 description 7
- 239000007789 gas Substances 0.000 description 6
- 241000894007 species Species 0.000 description 6
- 239000000835 fiber Substances 0.000 description 5
- 238000002310 reflectometry Methods 0.000 description 5
- 238000001069 Raman spectroscopy Methods 0.000 description 4
- 238000004364 calculation method Methods 0.000 description 4
- 238000011161 development Methods 0.000 description 4
- 230000007613 environmental effect Effects 0.000 description 4
- 230000008569 process Effects 0.000 description 4
- 238000012545 processing Methods 0.000 description 4
- 230000003595 spectral effect Effects 0.000 description 4
- 238000003491 array Methods 0.000 description 3
- 238000013461 design Methods 0.000 description 3
- 238000001514 detection method Methods 0.000 description 3
- 238000011156 evaluation Methods 0.000 description 3
- 238000001727 in vivo Methods 0.000 description 3
- 238000000691 measurement method Methods 0.000 description 3
- 230000035945 sensitivity Effects 0.000 description 3
- 238000002835 absorbance Methods 0.000 description 2
- 230000001351 cycling effect Effects 0.000 description 2
- 238000013480 data collection Methods 0.000 description 2
- 230000001419 dependent effect Effects 0.000 description 2
- 238000000295 emission spectrum Methods 0.000 description 2
- 238000001914 filtration Methods 0.000 description 2
- 230000010354 integration Effects 0.000 description 2
- 239000007788 liquid Substances 0.000 description 2
- 238000000513 principal component analysis Methods 0.000 description 2
- 230000009467 reduction Effects 0.000 description 2
- 239000007787 solid Substances 0.000 description 2
- 230000001360 synchronised effect Effects 0.000 description 2
- 239000013076 target substance Substances 0.000 description 2
- 238000001712 DNA sequencing Methods 0.000 description 1
- 240000006829 Ficus sundaica Species 0.000 description 1
- 101100070542 Podospora anserina het-s gene Proteins 0.000 description 1
- 230000000903 blocking effect Effects 0.000 description 1
- 239000008280 blood Substances 0.000 description 1
- 210000004369 blood Anatomy 0.000 description 1
- 238000009529 body temperature measurement Methods 0.000 description 1
- 230000008859 change Effects 0.000 description 1
- 229910052729 chemical element Inorganic materials 0.000 description 1
- 238000002485 combustion reaction Methods 0.000 description 1
- 229940125904 compound 1 Drugs 0.000 description 1
- 238000010276 construction Methods 0.000 description 1
- 230000008878 coupling Effects 0.000 description 1
- 238000010168 coupling process Methods 0.000 description 1
- 238000005859 coupling reaction Methods 0.000 description 1
- 238000005516 engineering process Methods 0.000 description 1
- 230000005284 excitation Effects 0.000 description 1
- 238000001857 fluorescence decay curve Methods 0.000 description 1
- 238000000799 fluorescence microscopy Methods 0.000 description 1
- 238000002189 fluorescence spectrum Methods 0.000 description 1
- 230000005484 gravity Effects 0.000 description 1
- 230000005283 ground state Effects 0.000 description 1
- 229910052736 halogen Inorganic materials 0.000 description 1
- 150000002367 halogens Chemical class 0.000 description 1
- 238000005286 illumination Methods 0.000 description 1
- 230000031700 light absorption Effects 0.000 description 1
- 238000004519 manufacturing process Methods 0.000 description 1
- QSHDDOUJBYECFT-UHFFFAOYSA-N mercury Chemical compound [Hg] QSHDDOUJBYECFT-UHFFFAOYSA-N 0.000 description 1
- 229910052753 mercury Inorganic materials 0.000 description 1
- 229910021645 metal ion Inorganic materials 0.000 description 1
- 238000000386 microscopy Methods 0.000 description 1
- 238000012544 monitoring process Methods 0.000 description 1
- 239000002086 nanomaterial Substances 0.000 description 1
- 239000013307 optical fiber Substances 0.000 description 1
- 239000004038 photonic crystal Substances 0.000 description 1
- 239000000843 powder Substances 0.000 description 1
- 238000005086 pumping Methods 0.000 description 1
- 238000004445 quantitative analysis Methods 0.000 description 1
- 238000012892 rational function Methods 0.000 description 1
- 238000005070 sampling Methods 0.000 description 1
- 239000004065 semiconductor Substances 0.000 description 1
- 238000004088 simulation Methods 0.000 description 1
- 238000012306 spectroscopic technique Methods 0.000 description 1
- 238000010561 standard procedure Methods 0.000 description 1
- 230000002123 temporal effect Effects 0.000 description 1
- 230000036962 time dependent Effects 0.000 description 1
Images


Classifications
-
- G—PHYSICS
- G01—MEASURING; TESTING
- G01N—INVESTIGATING OR ANALYSING MATERIALS BY DETERMINING THEIR CHEMICAL OR PHYSICAL PROPERTIES
- G01N21/00—Investigating or analysing materials by the use of optical means, i.e. using sub-millimetre waves, infrared, visible or ultraviolet light
- G01N21/62—Systems in which the material investigated is excited whereby it emits light or causes a change in wavelength of the incident light
- G01N21/63—Systems in which the material investigated is excited whereby it emits light or causes a change in wavelength of the incident light optically excited
- G01N21/64—Fluorescence; Phosphorescence
-
- G—PHYSICS
- G01—MEASURING; TESTING
- G01J—MEASUREMENT OF INTENSITY, VELOCITY, SPECTRAL CONTENT, POLARISATION, PHASE OR PULSE CHARACTERISTICS OF INFRARED, VISIBLE OR ULTRAVIOLET LIGHT; COLORIMETRY; RADIATION PYROMETRY
- G01J3/00—Spectrometry; Spectrophotometry; Monochromators; Measuring colours
- G01J3/02—Details
- G01J3/0205—Optical elements not provided otherwise, e.g. optical manifolds, diffusers, windows
- G01J3/0218—Optical elements not provided otherwise, e.g. optical manifolds, diffusers, windows using optical fibers
-
- G—PHYSICS
- G01—MEASURING; TESTING
- G01J—MEASUREMENT OF INTENSITY, VELOCITY, SPECTRAL CONTENT, POLARISATION, PHASE OR PULSE CHARACTERISTICS OF INFRARED, VISIBLE OR ULTRAVIOLET LIGHT; COLORIMETRY; RADIATION PYROMETRY
- G01J3/00—Spectrometry; Spectrophotometry; Monochromators; Measuring colours
- G01J3/02—Details
- G01J3/0256—Compact construction
-
- G—PHYSICS
- G01—MEASURING; TESTING
- G01J—MEASUREMENT OF INTENSITY, VELOCITY, SPECTRAL CONTENT, POLARISATION, PHASE OR PULSE CHARACTERISTICS OF INFRARED, VISIBLE OR ULTRAVIOLET LIGHT; COLORIMETRY; RADIATION PYROMETRY
- G01J3/00—Spectrometry; Spectrophotometry; Monochromators; Measuring colours
- G01J3/02—Details
- G01J3/10—Arrangements of light sources specially adapted for spectrometry or colorimetry
-
- G—PHYSICS
- G01—MEASURING; TESTING
- G01J—MEASUREMENT OF INTENSITY, VELOCITY, SPECTRAL CONTENT, POLARISATION, PHASE OR PULSE CHARACTERISTICS OF INFRARED, VISIBLE OR ULTRAVIOLET LIGHT; COLORIMETRY; RADIATION PYROMETRY
- G01J3/00—Spectrometry; Spectrophotometry; Monochromators; Measuring colours
- G01J3/28—Investigating the spectrum
- G01J3/2889—Rapid scan spectrometers; Time resolved spectrometry
-
- G—PHYSICS
- G01—MEASURING; TESTING
- G01J—MEASUREMENT OF INTENSITY, VELOCITY, SPECTRAL CONTENT, POLARISATION, PHASE OR PULSE CHARACTERISTICS OF INFRARED, VISIBLE OR ULTRAVIOLET LIGHT; COLORIMETRY; RADIATION PYROMETRY
- G01J3/00—Spectrometry; Spectrophotometry; Monochromators; Measuring colours
- G01J3/28—Investigating the spectrum
- G01J3/44—Raman spectrometry; Scattering spectrometry ; Fluorescence spectrometry
- G01J3/4406—Fluorescence spectrometry
-
- G—PHYSICS
- G01—MEASURING; TESTING
- G01N—INVESTIGATING OR ANALYSING MATERIALS BY DETERMINING THEIR CHEMICAL OR PHYSICAL PROPERTIES
- G01N21/00—Investigating or analysing materials by the use of optical means, i.e. using sub-millimetre waves, infrared, visible or ultraviolet light
- G01N21/62—Systems in which the material investigated is excited whereby it emits light or causes a change in wavelength of the incident light
- G01N21/63—Systems in which the material investigated is excited whereby it emits light or causes a change in wavelength of the incident light optically excited
- G01N21/64—Fluorescence; Phosphorescence
- G01N21/6408—Fluorescence; Phosphorescence with measurement of decay time, time resolved fluorescence
-
- G—PHYSICS
- G06—COMPUTING; CALCULATING OR COUNTING
- G06F—ELECTRIC DIGITAL DATA PROCESSING
- G06F17/00—Digital computing or data processing equipment or methods, specially adapted for specific functions
- G06F17/10—Complex mathematical operations
Definitions
- This invention relates to a time-resolved spectrometer system that is capable of measuring samples with multiple components simultaneously.
- the system is environmentally rugged, has low cost, and can be used in field applications where other spectroscopic techniques could not be implemented.
- Time-resolved spectroscopy is a widely used technique in the Biological sciences.
- fluorescence spectroscopy light at a specific frequency is absorbed by a given molecule or fluorescent entity (also called fluorophore), exciting its electronic state.
- the fluorescent entity then emits light at a slightly different frequency, as the fluorophore returns to the original ground state.
- Fluorescence spectroscopy is analogous to Raman spectroscopy in that a pump light excitation induces the emission of Stokes light, shifted to a lower frequency relative to the pump light.
- fluorescence requires the absorption of the pump light of a specific frequency, the frequency depending on the electronic system of the fluorescent entity.
- CRDS Cavity Ring-Down Spectroscopy
- time-resolved spectroscopy techniques are mostly limited to laboratory environments due to the following reasons:
- Time-resolved spectroscopy instrumentation is bulky due to the use of specially aligned optics, and high-end, photo-detector arrays.
- a device such as a RadiaLight® switch is used for the implementation of a time-resolved spectroscopy system that has the quality of being compact, rugged and fast (with measurement times of less than 1 s).
- the instrument can perform single species analysis; some embodiments may include multiple species analysis (10 to 25, or more), with the capability of measuring radiation intensity and decay lifetimes for each of the different species or compounds included in a sample.
- An embodiment of the system uses the RadiaLight® switch as a time-division multiplexing device that delivers a pulsed fluorescent pump light sequentially into one or more samples.
- the RadiaLight® device collects the fluorescence produced by each sample in a synchronized sequence of pulses, thus providing a precise temporal profile of the signal induced by the pump pulse.
- the device performs time-resolved fluorescence (TRF) of a sample with a plurality of components, each of them associated with a fluorophore that has a distinct decay time that lies within the time range detectable by the device.
- TRF time-resolved fluorescence
- the time-division multiplexing capability of the device is combined with the ability to use a plurality of optical band-pass filters for each optical channel. These embodiments may increase the number of components that the system can analyze simultaneously by using fluorophores that have different lifetimes and different emission spectra.
- the fluorescence pump light is not pulsed by the time-division optical multiplexer device, but illuminates the sample continuously.
- the fluorescence radiation is collected and passed through the time-division optical multiplexer, which directs the radiation into a sensitive photo-detector as a sequence of pulses, each of which has been spectrally filtered in order to separate the Stokes signal from different fluorophores.
- the fluorescent decay lifetime of the fluorophores has to be faster than the intra-optical channel period of measurement, also known as dwell time of the device ( ⁇ T).
- the present invention can be used to perform fluorescence correlation spectroscopy (FCS) and fluorescence cross-correlation spectroscopy (FCCS).
- Some embodiments of the present invention may use a time-division multiplexing device in combination with a light source and a detector to measure the decay times of radiation that may be emitted by some compounds in the sample, or transmitted and absorbed by some compounds in the sample. Therefore, the sample may include compounds that emit light, such as fluorescent emitters or fluorophores, and also compounds that absorb light. The absorption and emission of light by the compounds included in the sample may occur at different frequencies, or some of the emission spectral ranges and absorption spectral range may overlap.
- a device that performs time-resolved spectroscopy enabling multiple-component monitoring with environmental ruggedness and enhanced processing speed.
- the device has the following unique properties:
- Is field-deployable suitable to be used in moving vehicles and aircraft, and hostile physical environments, with no degraded performance.
- the use of optical filters is completely eliminated in the device.
- the sample can be a solid, a powder, a liquid, or a gas.
- Potential applications include the development of in-vivo blood gas sensors, based on Fluorescence life-time measurement techniques: CO 2 , O 2 , pH, the development of oxygen sensors for industrial applications such as semiconductor manufacturing and combustion diagnostics, and the development of in-vivo, time-resolved metal ion sensors such as Cu +2 , Na + , Ca + , which are relevant for physiological diagnostics.
- FIGS. 1 a and 1 b show schematically top and side views of one embodiment of the invention, respectively, using a time-division multiplexer, an optical pump source, and a photo-detecting element.
- FIG. 2 shows the theoretical time profile of an exponentially decaying optical signal, as measured by the photo-detector from FIGS. 1 a and 1 b.
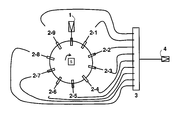
- FIG. 3 a shows an embodiment of this invention using a multiplicity of optical filters 3 - 1 to 3 - 9 in order to perform lifetime measurements of different emitting compounds (S 1 , S 2 , S 3 ).
- the filters are arranged in sequence such that three (3) consecutive optical channels correspond to the three different substances represented in the FIG. 3 a .
- the sequence of three different filters is repeated three times.
- Other numbers of optical channels can be used in this embodiment if desired.
- FIGS. 3 b , 3 c , and 3 d show the waveforms as detected by the photo-detector or photo-detectors attached to the optical channels 2 - 1 to 2 - 9 .
- FIGS. 4 a and 4 b show an embodiment of this invention using a multiplicity of optical filters 3 - 1 to 3 - 9 to perform fluorescence correlation spectroscopy (FCS) and fluorescence cross-correlation spectroscopy (FCCS).
- a blocking filter, 9 is introduced to prevent the pump light reflected off of the sample from going into the detecting device.
- FIGS. 5 a and 5 b show a determinant, ⁇ , of the matrix, ⁇ T ⁇ , defined in Eq. (2), as a function of rotational speed.
- ⁇ the matrix
- the time-resolved spectrometer is operated at the speed that maximizes the determinant.
- FIG. 6 depicts for the set of ⁇ i ⁇ and ⁇ i ⁇ shown, that the value of ⁇ which maximizes ⁇ (Y-axis on the left) also produces a Variance, ⁇ (Y-axis on the right), well below 1, as desired.
- FIG. 7 shows a plot of the variance (Eq. 7) of the signal in the device of FIGS. 1 a and 1 b as a function of the reference lifetime ⁇ R , and reference amplitude I R described in (Eq. 8).
- a smoothening residual has been added by hand, to avoid the poles of the function.
- the inherent dark signals at the photo-detector level will prevent the system from being indeterminate and act as a smoothening function.
- the net result is a surface that shows clear spikes at values of ⁇ R and I R that match the values of the sets: ⁇ i ⁇ and ⁇ i ⁇ .
- FIG. 8 shows the theoretical time-profile of the optical signal in a single optical channel of the device, as it would appear when performing the step-speed-scan algorithm for lifetime measurements.
- FIG. 10 plots variance and time resolution as a function of the number of cycles per measurement.
- the values of ⁇ ⁇ m ⁇ , ⁇ ⁇ m ⁇ , and ⁇ , are as in FIG. 9 , above. Note that even for 30 cycles, the overall time resolution is well below 100 ms.
- FIG. 11 shows the variance of all six parameters, ⁇ ⁇ m ⁇ , ⁇ ⁇ m ⁇ , as the concentration ⁇ 1 of compound 1 is varied. Most of the values lie in the 2-4% variance range.
- FIG. 12( b ) shows the theoretical time-profile of the emission signal in three different optical channels of the device.
- the measurement configuration of the device shown in FIGS. 1 a and 1 b corresponds to the continuous speed scan algorithm Number 4 described herein for emission lifetime and concentration measurements.
- FIG. 13 shows schematically the time-profile measurements of each photo-detector from different optical channels in the RadiaLight® spectrometer, and how they result in the continuous speed scan technique to apply a Laplace transform algorithm. Note also the functions A(k, t), which take into account the overlapping in time of the different signals.
- FIG. 14 shows the average variance resulting from a continuous speed-scan algorithm (Eq. 16).
- the variance is calculated using Eq. (15), and the variable parameter is the pump offset, ⁇ (see FIG. 11 ).
- FIG. 15 shows a simulated result for the lifetime width as a function of multiplexing speed in the measurement of a time-decaying signal as disclosed in some embodiments of the present invention.
- FIG. 16 shows a time-division multiplexing system used in conjunction with a cavity ring-down spectroscopy system whereby a light source is sent into a resonant cavity chamber filled with a sample gas composed by a mixture of absorbing compounds.
- a time-resolved spectroscopy system architecture that combines a high-speed time-division optical sampling engine with a unique data processing algorithm, discrete Principal Component Analysis (dPCA), in order to produce time-resolved, accurate emission and transmission measurements with low signal levels.
- dPCA discrete Principal Component Analysis
- a variety of embodiments are provided to implement the invention. Some embodiments of the invention significantly decrease sample processing time, while increasing the number of compounds that can be processed at one time for a given sample. Some embodiments of this invention improve the environmental ruggedness of the device while significantly reducing the implementation cost.
- a pump laser 1 or other light source such as a SLED (a “super-luminescent light emitting diode”—or a gas emission lamp using halogen gases or mercury or equivalent) is transmitted along a path 1 a to a rotating prism 5 containing a reflecting surface 5 a which reflects the light from laser 1 along a waveguide 7 to illuminate a material sample 6 to be interrogated.
- Sample 6 contains a light emitting compound which, in response to incident light from laser 1 , emits radiation back along waveguide 7 to rotating prism 5 .
- Light emitted from the sample called information light or in some embodiments, “Stokes radiation”—contains specific information about the chemical and physical make up of the material being interrogated.
- the term “Stokes radiation” will be used to mean the same as “information light.”
- emitted radiation is fluorescent light emitted from the sample as a result of light from source 1 impinging on sample 6 .
- Information light is emitted from sample 6 throughout a period of time comparable to the emission lifetime, ⁇ 0 .
- the information light is carried back from sample 6 into the RadiaLight® device 50 by waveguide 7 . Since there is a time delay, between the pump pulse from laser 1 and the signal carried back from sample 6 to rotating prism 5 , there is no need to have a filter or a circulator in series with waveguide 7 . In most fluorescence spectrometers, as well as in any typical Raman device and other time-resolved spectrometry systems, an optical filter is necessary in order to block the pump light from the photo-detector in the instrument.
- Some embodiments of the present invention include absorbing compounds in the sample, so that the light transmitted through the sample will have a time-decaying profile.
- the lifetime of such profile will be dependent on the rate of absorption of radiation by the compound, which is proportional to the concentration of said compound in the sample. Measurement of the decay lifetime of the transmitted signal will therefore indicate the concentration of absorbing compounds in the sample.
- Multiplexer 3 (which might be based on single mode fiber, multi-mode fiber, or a photonic crystal fiber (PCF) depending on the desired numerical aperture, bandwidth and transmission loss of the device) will pass the signal being transmitted on the corresponding fiber 2 - i when information light reflected from the rotating prism 5 impacts the corresponding waveguide, 2 - i.
- PCF photonic crystal fiber
- FIG. 2 shows the theoretical time-profile of the signal in the instrument, as measured by the photo-detector.
- the thick, continuous line shows the natural decay of light emission, with lifetime ⁇ 0 .
- the emission is transmitted in discrete time slots by adjacent waveguides 2 - 1 (corresponding to time slot t 1 in FIG. 2 ) through 2 - 9 in FIG. 1 a of the RadiaLight® switch 50 .
- Each waveguide 2 - i transmits a signal occurring at a time, t i , where the index i goes from 1 to N, the number of optical channels or waveguides 2 - i in the RadiaLight® switch 50 .
- FIG. 3 a a plurality of optical filters 3 - 1 through 3 - 9 is used in the RadiaLight® body 5 c in order to distinguish between the Stokes emissions of a plurality of fluorophores placed on the sample 6 .
- FIGS. 3 b , 3 c and 3 d show, respectively, the decay times of three different components S 1 , S 2 , and S 3 of the sample 6 being analyzed. Notice that reflected light from component S i is passed by filters 3 - 1 , 3 - 4 and 3 - 7 to optical channels 2 - 1 , 2 - 4 and 2 - 7 , respectively.
- Reflected light from component S 2 is passed by filters 3 - 3 , 3 - 6 , and 3 - 9 to optical channels 2 - 3 , 2 - 6 and 2 - 9 , respectively, while reflected light from component S 3 is passed by filters 3 - 2 , 3 - 5 , and 3 - 8 to optical channels 2 - 2 , 2 - 5 , and 2 - 8 , respectively.
- the time shifts of the reflected fluorescent light pulses shown in FIGS. 3 b , 3 c , and 3 d reflect the times for prism 5 to rotate so as to direct the reflected light to the appropriate optical channels 2 - 1 to 2 - 9 in sequence.
- Filters 3 - 1 through 3 - 9 allow only the light from the desired fluorophore to pass into the appropriate optical channel 2 - 1 through 2 - 9 .
- This configuration enables the use of correlation techniques between different emitters (FCCS), or auto-correlation techniques for each target (FCS). Also note that for this configuration additional filter 9 is needed before or after the routing element 8 (shown in FIG. 4 a as after the routing element 8 ), so as to block all light that contains the frequency of the pump light from going into the RadiaLight® switch device 50 and from there into the waveguide optical channels 2 - 1 through 2 - 9 .
- the algorithms used by the present invention to measure the signal from a sample that is composed of a plurality of emitters that have different decay lifetimes, ⁇ I will be disclosed in the following.
- a person of ordinary skill in the art will recognize that the application of the algorithms can be broader than the uses described herein.
- the following algorithms 1 through 4 can be implemented together with any time-resolved instrumentation in order to perform multiple species evaluation of exponentially decaying processes.
- the first algorithm belongs to a wider set of techniques that in accordance with this invention will be called discrete Principal Component Analysis (dPCA).
- the first algorithm involves the use of dPCA techniques to evaluate the concentrations of multiple compounds simultaneously in a given sample, each compound having determined and fixed emission lifetime decay, or attached to an emitter that has determined and fixed lifetime decay.
- the other three algorithms are concerned with the evaluation of both the concentrations and the lifetimes of multiple compounds simultaneously, in a given sample.
- the second of these algorithms makes use of a dPCA technique supplemented with an auxiliary function (see equation 8).
- the last two algorithms belong to a set that will be called “discrete Laplace Transform” techniques.
- One of these two algorithms makes use of a discrete speed scan of the time-resolved spectrometer, and the other uses a continuous speed scan of the time-resolved spectrometer and integration in discrete time-segments of the signal.
- I F ⁇ ( t ) ⁇ i K ⁇ ⁇ i ⁇ ⁇ i ⁇ ⁇ i ⁇ e - t / ⁇ i ( 1 )
- ⁇ i is the concentration of the i-th substance, ⁇ i , its absorbance, ⁇ i , its emission quantum efficiency and, ⁇ i , its emission lifetime.
- ⁇ i the concentration of the i-th substance, ⁇ i , its absorbance, ⁇ i , its emission quantum efficiency and, ⁇ i , its emission lifetime.
- a compound can be an atom, a molecule or a more complex cluster of atoms and molecules.
- a compound is sometimes called a component.
- a sample of material being analyzed will contain a plurality of components or compounds.
- the lifetimes, ⁇ i ⁇ , of the compounds are known values which remain constant during the course of the measurement and are only slightly affected by environmental conditions (such as pH, Temperature, viscosity, humidity pressure).
- the compound concentration, ⁇ i ⁇ is being measured, and the time-resolution is understood as the ability of the RadiaLight® based spectrometer system to determine ⁇ i ⁇ within a time window equal to the roundtrip time of the device.
- Eq. (2) is a convolution of the exponentially decaying function of a light emitting compound with an optical channel transmission function.
- the optical channel transmission function may be a Gaussian function, as shown in Eq. (2); however, some embodiments may include other optical channel transmission functions, like a Voigt profile, or a Lorentz profile.
- ⁇ is a diagonal matrix containing the eigenvalues of Z.
- FIG. 5 a shows a plot of ⁇ as a function of ⁇ for a given set of ⁇ i ⁇ and ⁇ i , ⁇ i ⁇ of a hypothetical sample.
- the curve has a clear maximum, and a fairly broad range of values of ⁇ for which ⁇ maintains a sizeable value (FWHM).
- the operational speed of the device, ⁇ op will be defined as that which maximizes the curve of FIG. 5 a for a given set of ⁇ i , ⁇ i ⁇ .
- 5 b shows a set of different curves ⁇ , given samples with a different range of lifetimes ⁇ i ⁇ .
- the maximum value of ⁇ remains the same as the set of values ⁇ i ⁇ changes substantially. This relaxes the computational requirements while the instrument performance is maintained uniform across a large range of lifetime values.
- An indicator of device performance is the variance introduced in the concentration measurement due to the linear regression applied. This information is contained in the rows of the matrix: Z ⁇ 1 ⁇ t .
- the variance ⁇ is defined as
- FIG. 6 shows the relation between y and ⁇ as functions of ⁇ using the definition of Eq. (7). It is seen that for the range of values that maximize ⁇ , the values of ⁇ are well below 1. This means that the operation of the device is limited only by the photo-detector noise and signal statistics rather than by cross-correlation of data in the multi-species analysis.
- I F is given by Eq. (1)
- ⁇ ref is a reference lifetime
- I ref is a reference amplitude
- ⁇ ij ⁇ ( I R , ⁇ R ) 1 N ⁇ ⁇ ⁇ ⁇ T ⁇ ⁇ 0 T ⁇ ( ⁇ j ⁇ ⁇ j ⁇ e - t / ⁇ j + I R ⁇ e - t / ⁇ R ) ⁇ e - ( t - t i ) 2 / ⁇ ⁇ ⁇ T 2 ⁇ d t . ( 8.2 )
- FIG. 7 shows the surface ⁇ (I ref , ⁇ ref ) for ⁇ ref ranging from 0 to Max ⁇ i ⁇ , and I Ref ranging from 0 to Max ⁇ i ⁇ , according to one embodiment of the present invention comprising a sample with three compounds having unknown concentrations and unknown emission decay lifetimes. It is shown that ⁇ (I ref , ⁇ ref ) has distinct poles at the points, ⁇ i , ⁇ i ⁇ .
- An operation that produces a function as described in Eq. (8.1) can be carried out electronically, at the level of the amplifier circuit, or optically, by use of a reference signal of some sort.
- FIG. 8 Another embodiment of the instrument comprises a discrete Laplace transform algorithm, used to measure the different lifetimes and concentrations, ⁇ i ⁇ and ⁇ i ⁇ in Eq. (1).
- This algorithm is illustrated in FIG. 8 .
- the method of using a Laplace transform to solve Eq. (1) in terms of ⁇ i ⁇ and ⁇ i ⁇ has been well-known for a number of years (See M. Ameloot, J. M. Beechem, L. Brand; “Simultaneous Analysis of Multiple Fluorescence Decay Curves By Laplace Transforms”, Biophysical Chemistry 23, 155171 (1986)). Equations (9.1-3) in U.S. patent application Ser. No. 11/603,939 show the three discrete functions that will be of relevance.
- Eq. (9.1) in U.S. patent application Ser. No. 11/603,939 is proportional to the intensity measured by the k-th optical channel of the RadiaLight® switch
- Eqs. (9.2) and (9.3) in U.S. patent application Ser. No. 11/603,939 are its successive time derivatives.
- FIG. 8 shows the basic principle for the step-speed scan technique. In FIG. 8 , a single optical channel signal is shown for different values of the rotational speed ⁇ of the device.
- the device is operated at a central speed ⁇ 0 for one complete cycle.
- the speed is then increased to a value ⁇ ⁇ , and a new set of measurements is collected through another cycle.
- the choice of ‘ ⁇ ’ superscript is based on the fact that, whereas, ⁇ + ⁇ 0 ⁇ ⁇ , also, t k ⁇ ⁇ t k ⁇ t k + .
- This is followed by a new cycle scan measurement, where the speed of the device is reduced to ⁇ + .
- the first and second time derivatives of the intensity can be collected for every optical channel in the device, as shown in Eq. (10) of U.S. patent application Ser. No. 11/603,939, incorporated herein by reference in its entirety.
- the optical power intensity I(t) measured by the photo-detector as the RadiaLight® switch cycles through the optical channels is a function of time to which a Laplace transform can be applied, with the result written in Eq. (11) of U.S. patent application Ser. No. 11/603,939, incorporated herein by reference in its entirety.
- Eq. (11) of U.S. patent application Ser. No. 11/603,939 includes a sum of terms that can be obtained by direct, discrete measurement with the RadiaLight® device, using the supplementary functions of the parameter s, shown above. These functions include factors that involve knowledge of t k at every point of the measurement, which is also a design parameter in the RadiaLight® architecture.
- the functions I k ′ and I k ′′ can also be obtained from measurement, as shown in FIG. 8 , and Eq. (10) in U.S. patent application Ser. No. 11/603,939; in this case, knowledge of t k is necessary at three different points for each optical channel k and measurements at three different values of ⁇ are also needed.
- Eq. (12) in U.S. patent application Ser. No. 11/603,939 is a rational function of polynomials, with parameters, ⁇ i ⁇ , and, ⁇ i ⁇ . These functions are readily suitable for nonlinear curve fitting by any standard method available, e.g. Levenberg-Marquardt routines. The procedure is to equate the right hand side of Eq. (12) in U.S. patent application Ser. No. 11/603,939 to the right hand side of Eq. (11) in U.S. patent application Ser. No. 11/603,939. Some embodiments of the present invention employ a nonlinear curve fitting to the data in the right hand side of Eq. (11) in U.S. patent application Ser. No.
- time-division multiplexer 50 creates a time-gap, ⁇ , between the optical pumping and the start of the measurement, as shown in FIG. 8 .
- the issue will be to select values of ⁇ that are convenient so that the model can accurately predict ⁇ i ⁇ and ⁇ i ⁇ for a given sample.
- the starting point is to replace the integral in Eq. (12) from U.S. patent application Ser. No. 11/603,939 by a modified Laplace transform L s ⁇ (I) as shown in Eq. (13) of U.S. patent application Ser. No. 11/603,939.
- the validity of Eq. (14) in U.S. patent application Ser. No. 11/603,939 occurs for only a given range of values of s.
- the nonlinear fit is performed in a region for small s, so that the equality of the two sides of the equation is maintained with sufficiently good precision.
- 11/603,939 is obtained assuming integration over an infinite time interval. What this means is that the longer the RadiaLight® device polls the signal optical channels after a given pump pulse, the more accurate the equation will be. Therefore, multiple measurement cycles may be needed after a pump pulse is delivered. This is in addition to the three cycles at different speeds that the discrete scheme requires, in order to obtain a measurement.
- some embodiments of the present invention may use a variance of the measurement, or goodness of fit, ⁇ , as in Eq. (15) of U.S. patent application Ser. No. 11/603,939.
- FIG. 9 shows how sensitive the value of ⁇ is with respect to the number of cycles in a measurement. Once the low-variance limit is reached, any further increase in cycling will no longer produce better results. The precise value at which this condition is met depends strongly on the specific values of the true parameters ⁇ ⁇ m ⁇ and ⁇ ⁇ m ⁇ in Eq. (15) of U.S. patent application Ser. No. 11/603,939.
- FIG. 10 also shows the time resolution of the measurement for the different cycles used, including a factor of 3, to account for the step-speed scan.
- FIG. 11 shows the correlation of the variances between the different parameters, as the concentration of compound I changes. Correlation is high, but variances are kept below 5% across a wide range of values for ⁇ 1 .
- FIG. 12 a shows the system used for the measurement. Shown in FIG. 12 a is a rotating prism 5 with seven waveguides 2 - 1 through 2 - 7 .
- Laser 1 provides a source of light to be incident on the sample (not shown in FIG. 12 a but located relative to the system in FIG.
- each optical channel has to be monitored on a separate photo-detector 4 - 1 through 4 - 7 of which only photo-detectors 4 - 1 through 4 - 5 are shown.
- FIG. 13 The process of computing the Laplace transform using the signal coming from each photo-detector and ad-hoc overlap-counting functions, A(k, t), is illustrated in more detail in FIG. 13 .
- the initial and final time-division multiplexing speed of the instrument are such that the first optical channel winds up at the time slot that the second optical channel occupied in the initial configuration.
- the end result of this process is that a continuous Laplace transform applied to the function I F (t), starting at an initial time, ⁇ 4, as will be disclosed below. From FIG. 13 :
- I F ⁇ ( t ) ⁇ k ⁇ A ⁇ ( k , t ) ⁇ I k ⁇ ( t )
- Eq. (16) of U.S. patent application Ser. No. 11/603,939 shows the calculation procedure to find the coefficients ⁇ , and ⁇ .
- the right hand side is the result of the measurement, where the coefficient A(k,t) takes care of the overlap between the integrals for the different optical channels. This overlap factor depends on the optical channel number, and also on the specific time interval considered.
- the left-hand side contains the formula and the parameters upon which the nonlinear regression is applied.
- the overlap renders an averaged value of the signal during a certain time interval; this improves the signal-to-noise ratio (SNR) of the device.
- SNR signal-to-noise ratio
- the variance is calculated as in Eq. (15) of U.S. patent application Ser. No. 11/603,939, and the variable parameter is the pump offset ⁇ .
- CRDS cavity ring-down absorption spectroscopy
- an optical system is so designed to produce a time decaying signal where the decay time has a contribution from the resonant absorption of light at certain frequency due to the presence of a compound in the sample.
- the total optical intensity as a function of time is a combination of the signal at different frequencies, ⁇ i , in a manner that parallels Eq. (1):
- I ⁇ ( t ) ⁇ i ⁇ I 0 ⁇ ( ⁇ i ) ⁇ e - t / ⁇ ⁇ ⁇ ⁇ i ( 9 )
- 1/ ⁇ ⁇ i the contribution from the molecular absorption.
- the magnitude of 1/ ⁇ ⁇ i is directly proportional to the concentration of the absorbing molecule in the sample.
- the factor 1/ ⁇ i is related to “roundtrip” losses in the optical system associated with the elements contained in the system (e.g. mirrors and reflective surfaces, diffraction elements, lenses, waveguide coupling devices).
- the value of 1/ ⁇ i which in general is dependent on the frequency of light, can be calculated from the physical construction of the optical system.
- the value of 1/ ⁇ ⁇ i can be obtained from the measurement of the decay times in Eq. (9) using any of the four different algorithms disclosed heretofore, in conjunction with the time-division multiplexer.
- ⁇ ⁇ ⁇ n lc ⁇ ( 1 / ⁇ ⁇ ⁇ ⁇ i - 1 / ⁇ i ) ( 12 )
- ⁇ is the net molecular absorption per unit length of the CRDS system.
- the decay time of a signal measured using a CRDS system is obtained by any of the four algorithms described above, and then Eqs. (11) and (12) are used to determine the substance concentration, ⁇ .
- the resolution of the decay lifetime measurement determines the absorption sensitivity of the system.
- FIG. 15 shows, for different values of detector noise level, the dependence of the lifetime width as a function of the speed of the time-division multiplexing device.
- the lifetime width is calculated from the time segment of the variance function—cf. Eq. (15) in U.S. patent application Ser. No. 11/603,939, and FIG. 5 —such that the value of the variance function is within 80% of its peak value.
- the uncertainty of the lifetime measurement is usually measured as the full-width, half maximum (FWHM) of the function peak, which is about 2.5 times smaller than the value plotted on the abscissa in FIG. 15 .
- the curve is a characteristic ‘Allan variance’ plot, demonstrating that the reduction of measurement uncertainty by the increase of time-multiplexing speed has a limit at a certain value of the time-division multiplexing speed. Beyond this maximal time-division speed, the resulting uncertainty in lifetime measurements starts drifting up to higher values.
- FIG. 16 shows an embodiment of the present invention where a CRDS system 150 is coupled to a time-division multiplexing system.
- the time-division multiplexing system 50 includes a light source 1 , which in some embodiments may be a monochromatic laser, a light emitting diode (LED), or a lamp; also included is a detector 4 , a time-division multiplexing element 5 , which in some embodiments may be a rotary switch employing a reflecting prism as switching element, as described in the RadiaLight® rotary switch of U.S. Pat. No.
- waveguides 2 - 1 , 2 - 2 , 2 - 3 , 2 - 4 , and 2 - 5 to couple light source 1 and detector 4 to switching element 5 ; multiplexer 3 to couple optical channels 2 - 2 , 2 - 3 , 2 - 4 , and 2 - 5 into detector 4 , and waveguide 7 .
- waveguide 7 acts as a probe to both deliver the light source into CRDS system 150 , and retrieve the transmitted signal as a function of time.
- the CRDS system 150 includes mirrors 151 and 152 with a selected reflectivity each R 1 (mirror 151 ) and R 2 (mirror 152 ). Inside the cavity, sample 155 is placed containing a mixture of different absorbing species. Samples can be in solid, liquid, gaseous, or plasma state, and the different absorbing species contained in the sample may be pure substances as in any of the chemical elements, or molecules, or clusters of molecules, or other types of chemical materials like nanostructures or microscopic arrays of molecules. In some embodiments of the present invention, the reflectivity of mirrors 151 and 152 is such that R 1 ⁇ R 2 , and R 2 has a value very close to 1, ideally equal to 1.
- Some embodiments may include a mirror R 2 with a reflectivity of 0.9999, or better. Other embodiments may further use a mirror 151 with reflectivity R 1 equal to 0.98, 0.90, or less.
- the lower reflectivity of mirror 151 in some embodiments is convenient in order to obtain a sizeable signal returned back to the time-division multiplexing measurement device.
- the time for a roundtrip travel of an optical pulse in CRDS system 150 is t R .
- t R is lower than dwell time, ⁇ T, so that multiple pulses coming from CRDS system 150 can be measured by a single optical channel 2 - 2 , 2 - 3 , 2 - 4 , and 2 - 5 .
- roundtrip time t R is smaller than 1/10 th of ⁇ T.
- light source 1 may be a continuous wave (CW) emitting source, and time division multiplexing 50 automatically creates a pulsed signal going into CRDS system 150 , thus reducing the cost associated with an intrinsic pulsed light source.
- the optical output from CRDS system 150 is automatically de-coupled from light source 1 , because once the initial light pulse completes a roundtrip through CRDS system 150 , switching element 5 has decoupled the CRDS system 150 from light source 1 . This eliminates the need to introduce bulky optical elements such as an isolator in front of light source 1 .
- a pulsed light source 1 before time-division multiplexer 50 may use a pulsed light source 1 before time-division multiplexer 50 . Further, some embodiments may include a light source 1 separated from time-division multiplexer 50 , directly sending light to CRDS system 150 and the light collected out of CRDS system 150 being coupled into time-division multiplexer 50 , multiplexer 3 , and detector 4 .
Abstract
A time-resolved spectroscopy system employing a time-division multiplexing optical device with no dispersive optical elements to perform lifetime and concentration measurements in multi-species samples, is disclosed. Some examples include fluorescence and cavity ring-down spectroscopy. The system is unique in its compactness and simplicity of operation. In one embodiment, the system makes use of only one photo-detector and an efficient linear regression algorithm. The system offers a measurement time for multiple species measurements of less than 1 s. The system can also be used to perform fluorescence correlation spectroscopy and fluorescence cross-correlation spectroscopy. Four methods to de-convolve a multi-component, exponentially decaying optical signal such as obtained with the system disclosed here, are presented. These methods may be applied to the measurement of fluorescence decay lifetimes and cavity ring-down times, the latter used extensively for the measurement of gas and trace-gas concentrations in complex mixtures, via absorption spectroscopy.
Description
The present application is a continuation in part of U.S. patent application Ser. No. 11/603,939, filed on Nov. 21, 2006 now U.S. Pat. No. 7,679,745, which is incorporated herein by reference in its entirety.
The following disclosure claims priority to co-pending U.S. patent application Ser. No. 11/767,458, filed on Jun. 22, 2007, and U.S. patent application Ser. No. 12/551,404, filed on Aug. 31, 2009, are incorporated herein by reference in their entirety.
This application is related to U.S. Pat. No. 7,298,538, issued on Nov. 20, 2007, and U.S. Pat. No. 7,602,488, issued on Oct. 13, 2009, which are incorporated herein by reference in their entirety.
This invention relates to a time-resolved spectrometer system that is capable of measuring samples with multiple components simultaneously. The system is environmentally rugged, has low cost, and can be used in field applications where other spectroscopic techniques could not be implemented.
Time-resolved spectroscopy is a widely used technique in the Biological sciences. In fluorescence spectroscopy, light at a specific frequency is absorbed by a given molecule or fluorescent entity (also called fluorophore), exciting its electronic state. The fluorescent entity then emits light at a slightly different frequency, as the fluorophore returns to the original ground state. Fluorescence spectroscopy is analogous to Raman spectroscopy in that a pump light excitation induces the emission of Stokes light, shifted to a lower frequency relative to the pump light. However, fluorescence requires the absorption of the pump light of a specific frequency, the frequency depending on the electronic system of the fluorescent entity. Also, contrary to Raman scattering, typical Stokes shifts for fluorescence phenomena are a few 10's of nm apart from the pump light, which complicates the cross-talk between the pump light and the Stokes signals at the detection level. Furthermore, as opposed to Raman scattering, which is essentially instantaneous, fluorescence emission takes place across a wide range of lifetimes, within a few ns or up to a few ms, depending on the fluorophore.
There are other types of time-resolved spectroscopy techniques widely used in biological applications and trace-gas sensing, such as Cavity Ring-Down Spectroscopy (CRDS).
In general, time-resolved spectroscopy techniques are mostly limited to laboratory environments due to the following reasons:
1) Short lifetime measurement techniques require the use of expensive and delicate equipment: pulsed pump lasers and state-of-the-art synchronized photo-detection schemes.
2) Time-resolved spectroscopy instrumentation is bulky due to the use of specially aligned optics, and high-end, photo-detector arrays.
3) Conventional time-resolved techniques such as fluorescence require the use of high performance optical filters to mitigate the cross-talk between pump and Stokes fluorescence signals, between the Stokes signals from different fluorophores, or the absorption signal of different molecules. This adds to the cost of the instrument and its complexity, reducing the signal collection efficiency.
4) Due to the extra complexity and cross-talk added by the optical filtering procedures, only small number of target substances can be analyzed simultaneously (3 or 4 at a time).
5) In fluorescence lifetime measurements, fluorophore concentration values are normally disregarded, as the measurement technique is only involved with relative changes of the signal in time. Also, the analytical complexity of deriving both lifetime and concentration values increases rapidly with the number of targets being analyzed. As a result, current lifetime fluorescent techniques are limited to fixed concentration measurements for a few target substances (2, 3 or 4).
6) Due to the close spectral proximity between the pump and Stokes signals in fluorescence spectra, and between Stokes signals from different fluorophores, high-performance optical filtering techniques are required. This increases cost and complexity of typical fluorescence devices.
In view of the above, there is a need for a time-resolved spectroscopy system that can be implemented in field applications under harsh environmental conditions. These applications usually require measurement of multiple targets (10 to 25) simultaneously. A complete measurement and sample assessment needs to be performed in a time frame of is or less. Such a device would not only find new applications but also enhance current technologies like DNA sequencing and fluorescence imaging microscopy.
In accordance with the present invention a device such as a RadiaLight® switch is used for the implementation of a time-resolved spectroscopy system that has the quality of being compact, rugged and fast (with measurement times of less than 1 s). In some embodiments, the instrument can perform single species analysis; some embodiments may include multiple species analysis (10 to 25, or more), with the capability of measuring radiation intensity and decay lifetimes for each of the different species or compounds included in a sample.
An embodiment of the system uses the RadiaLight® switch as a time-division multiplexing device that delivers a pulsed fluorescent pump light sequentially into one or more samples. At the same time, the RadiaLight® device collects the fluorescence produced by each sample in a synchronized sequence of pulses, thus providing a precise temporal profile of the signal induced by the pump pulse. In some embodiments, the device performs time-resolved fluorescence (TRF) of a sample with a plurality of components, each of them associated with a fluorophore that has a distinct decay time that lies within the time range detectable by the device.
In some embodiments of the present invention, the time-division multiplexing capability of the device is combined with the ability to use a plurality of optical band-pass filters for each optical channel. These embodiments may increase the number of components that the system can analyze simultaneously by using fluorophores that have different lifetimes and different emission spectra.
Another embodiment of the invention makes use of device architecture analogous to that disclosed in U.S. Pat. No. 7,602,488, assigned to Neptec Optical Solutions, Inc., incorporated herein by reference in its entirety. In this embodiment, the fluorescence pump light is not pulsed by the time-division optical multiplexer device, but illuminates the sample continuously. The fluorescence radiation is collected and passed through the time-division optical multiplexer, which directs the radiation into a sensitive photo-detector as a sequence of pulses, each of which has been spectrally filtered in order to separate the Stokes signal from different fluorophores. In this embodiment, the fluorescent decay lifetime of the fluorophores has to be faster than the intra-optical channel period of measurement, also known as dwell time of the device (ΔT). In this embodiment, the present invention can be used to perform fluorescence correlation spectroscopy (FCS) and fluorescence cross-correlation spectroscopy (FCCS).
Some embodiments of the present invention may use a time-division multiplexing device in combination with a light source and a detector to measure the decay times of radiation that may be emitted by some compounds in the sample, or transmitted and absorbed by some compounds in the sample. Therefore, the sample may include compounds that emit light, such as fluorescent emitters or fluorophores, and also compounds that absorb light. The absorption and emission of light by the compounds included in the sample may occur at different frequencies, or some of the emission spectral ranges and absorption spectral range may overlap.
In summary, in accordance with some embodiments of the present invention a device is provided that performs time-resolved spectroscopy enabling multiple-component monitoring with environmental ruggedness and enhanced processing speed. The device has the following unique properties:
Processes and analyzes multiple component samples within a total measurement time of 1 ms to 100 ms.
The ability to use a single ultra-sensitive photo-detector to enhance the sensitivity at high speed.
Provides a simple time-calibration of the optical signal, therefore improving the accuracy of data collection at a reduced cost.
Can quantitatively determine a mixture composed of multiple components (20-25+ components), simultaneously.
Is field-deployable, suitable to be used in moving vehicles and aircraft, and hostile physical environments, with no degraded performance.
Can operate in any given orientation relative to the ground, with no need for readjustments due to gravity.
Provides a wide bandwidth of detection, from 300 nm to 1.0 μm, or 900 nm to 1.5 μm, depending on the photo-detector design.
Eliminates the use of gratings, prisms, and other dispersive elements that have high loss, are expensive, and extremely sensitive to alignment.
In some embodiments of the invention, the use of optical filters is completely eliminated in the device.
Uses a single photosensitive element, replacing the need for photo-detector arrays and CCD cameras, and simplifying data collection schemes.
Uses a linear regression algorithm for data processing, reducing the number of data points to be handled by an order of magnitude.
Uses an algorithm that incorporates an auxiliary time-dependent function, to measure concentrations and emission/transmission decay lifetimes of multiple compounds, simultaneously.
Uses an algorithm that incorporates a discrete Laplace Transform technique, and a step-speed scan technique, to measure concentrations and emission/transmission decay lifetimes of multiple compounds, simultaneously.
Uses an algorithm that incorporates a discrete Laplace Transform technique, and a continuous-speed scan technique, to measure concentrations and emission/transmission decay lifetimes of multiple compounds, simultaneously.
Allows for a method to perform real-time, non-invasive temperature measurements of samples, in-vivo or for other applications, based on Fluorescence-lifetime spectroscopy.
Allows for a method to determine multi-component concentrations in a given sample, using lifetime spectroscopy and linear regression techniques. In this methodology, the sample can be a solid, a powder, a liquid, or a gas.
Potential applications include the development of in-vivo blood gas sensors, based on Fluorescence life-time measurement techniques: CO2, O2, pH, the development of oxygen sensors for industrial applications such as semiconductor manufacturing and combustion diagnostics, and the development of in-vivo, time-resolved metal ion sensors such as Cu+2, Na+, Ca+, which are relevant for physiological diagnostics.
This invention will be more fully understood in view of the following drawings taken together with the following detailed description.
The accompanying drawings, which are incorporated in, and constitute a part of this specification illustrate exemplary implementations and embodiments of the invention and, together with the description, serve to explain principles of the inventions as follows:
The following detailed description is meant to be illustrative only and not limiting. Other embodiments of this invention will be obvious to those skilled in the art in view of this description.
In accordance with this invention a time-resolved spectroscopy system architecture is provided that combines a high-speed time-division optical sampling engine with a unique data processing algorithm, discrete Principal Component Analysis (dPCA), in order to produce time-resolved, accurate emission and transmission measurements with low signal levels. A variety of embodiments are provided to implement the invention. Some embodiments of the invention significantly decrease sample processing time, while increasing the number of compounds that can be processed at one time for a given sample. Some embodiments of this invention improve the environmental ruggedness of the device while significantly reducing the implementation cost.
Referring to FIGS. 1 a and 1 b, one embodiment of this invention employs a rotary switch such as disclosed in U.S. Pat. No. 7,298,538 (RadiaLight®), hereby incorporated by reference in its entirety. The rotary switch acts as a time-division multiplexing device. In the embodiment shown in FIGS. 1 a and 1 b, light from a pump laser 1—or other light source such as a SLED (a “super-luminescent light emitting diode”—or a gas emission lamp using halogen gases or mercury or equivalent) is transmitted along a path 1 a to a rotating prism 5 containing a reflecting surface 5 a which reflects the light from laser 1 along a waveguide 7 to illuminate a material sample 6 to be interrogated. Sample 6 contains a light emitting compound which, in response to incident light from laser 1, emits radiation back along waveguide 7 to rotating prism 5. Light emitted from the sample—called information light or in some embodiments, “Stokes radiation”—contains specific information about the chemical and physical make up of the material being interrogated. Hereafter, the term “Stokes radiation” will be used to mean the same as “information light.” In some embodiments of the present invention, emitted radiation is fluorescent light emitted from the sample as a result of light from source 1 impinging on sample 6.
In the embodiment of FIGS. 1 a and 1 b, the optical delivery of the light from the illumination source and the optical collection from sample 6 of the information light are performed through the same fiber 7—in some embodiments called a “waveguide”. As shown in FIGS. 1 a and 1 b, the light from source 1 to be incident on sample 6 is transmitted to optical fiber 7, through one of the optical channels of the RadiaLight® time division multiplexer 50. In this manner, even if the light source 1 is operating in continuous mode (CW), the pump light in the delivery optical channel 7 has a pulsed time profile because prism 5 is rotating at a selected speed driven by a precision electric motor. In some embodiments of the present invention, this motor can be any of several well known commercially available motors of a type used, for example, in gyroscopes. In one embodiment, this motor can rotate speeds such as 200,000 RPM or more, if required.
Information light is emitted from sample 6 throughout a period of time comparable to the emission lifetime, τ0. The information light is carried back from sample 6 into the RadiaLight® device 50 by waveguide 7. Since there is a time delay, between the pump pulse from laser 1 and the signal carried back from sample 6 to rotating prism 5, there is no need to have a filter or a circulator in series with waveguide 7. In most fluorescence spectrometers, as well as in any typical Raman device and other time-resolved spectrometry systems, an optical filter is necessary in order to block the pump light from the photo-detector in the instrument. In multiplexing device 50 reflecting prism 5 rotates about axis 5 b which is perpendicular to the path 1 a along which light from laser 1 is sent to prism 5. Because prism 5 rotates at a selected rotational speed, the information light from sample 6 which travels back along waveguide 7 to prism 5 is reflected by the mirror 5 a in prism 5 to one or more optical channels 2-i (where ‘i’ is an integer given by 1<i<I where I is the maximum number of optical channels) located about the circumferential perimeter of stationary platform 5 c, at a different time than that at which the initial illuminating pulse from pump laser 1 hits the sample 6. Platform 5 c holds a plurality of optical channels 2-i (shown in FIG. 1 b as waveguides 2-1 to 2-9) each of which receives a portion of the signal emitted from sample 6 as prism 5 rotates. Of course, the strength of the signal emitted from sample 6 will decrease with time. The rate of decrease will depend upon the lifetime of the emitter used with sample 6 and can vary from as short as a few nanoseconds to as much as several milliseconds or even seconds.
Some embodiments of the present invention include absorbing compounds in the sample, so that the light transmitted through the sample will have a time-decaying profile. The lifetime of such profile will be dependent on the rate of absorption of radiation by the compound, which is proportional to the concentration of said compound in the sample. Measurement of the decay lifetime of the transmitted signal will therefore indicate the concentration of absorbing compounds in the sample.
In some embodiments of the present invention, the RadiaLight® optical switch includes a motor-driven, rotating prism 5 is described in detail in U.S. Pat. No. 7,298,538, incorporated herein by reference in its entirety.
Multiplexer 3 (which might be based on single mode fiber, multi-mode fiber, or a photonic crystal fiber (PCF) depending on the desired numerical aperture, bandwidth and transmission loss of the device) will pass the signal being transmitted on the corresponding fiber 2-i when information light reflected from the rotating prism 5 impacts the corresponding waveguide, 2-i.
In another embodiment of the invention, illustrated in FIG. 3 a, a plurality of optical filters 3-1 through 3-9 is used in the RadiaLight® body 5 c in order to distinguish between the Stokes emissions of a plurality of fluorophores placed on the sample 6. FIGS. 3 b, 3 c and 3 d show, respectively, the decay times of three different components S1, S2, and S3 of the sample 6 being analyzed. Notice that reflected light from component Si is passed by filters 3-1, 3-4 and 3-7 to optical channels 2-1, 2-4 and 2-7, respectively. Reflected light from component S2 is passed by filters 3-3, 3-6, and 3-9 to optical channels 2-3, 2-6 and 2-9, respectively, while reflected light from component S3 is passed by filters 3-2, 3-5, and 3-8 to optical channels 2-2, 2-5, and 2-8, respectively. The time shifts of the reflected fluorescent light pulses shown in FIGS. 3 b, 3 c, and 3 d reflect the times for prism 5 to rotate so as to direct the reflected light to the appropriate optical channels 2-1 to 2-9 in sequence. Filters 3-1 through 3-9 allow only the light from the desired fluorophore to pass into the appropriate optical channel 2-1 through 2-9.
Yet another embodiment of the present invention is illustrated in FIGS. 4 a and 4 b. Here, a plurality of optical filters 3-1 through 3-9 is also used to distinguish between the light emission of a plurality of compounds. In this case, the signals are produced and collected at different time intervals; the pump optical signal from laser 1 is continuous, and the decay lifetime of the emitting compounds can be as short as a few ns, but no longer than the ΔT (see FIG. 2 for a definition of ΔT) of the RadiaLight® device 50 at the operational speed. The pump optical signal from laser 1 is transmitted along waveguide 7 to sample 6 and the reflected radiation from sample 6 is passed back along waveguide 7 to routing element 8 and then through an additional filter 9 which blocks the light from laser 1. This configuration enables the use of correlation techniques between different emitters (FCCS), or auto-correlation techniques for each target (FCS). Also note that for this configuration additional filter 9 is needed before or after the routing element 8 (shown in FIG. 4 a as after the routing element 8), so as to block all light that contains the frequency of the pump light from going into the RadiaLight® switch device 50 and from there into the waveguide optical channels 2-1 through 2-9.
The algorithms used by the present invention to measure the signal from a sample that is composed of a plurality of emitters that have different decay lifetimes, τI, will be disclosed in the following. A person of ordinary skill in the art will recognize that the application of the algorithms can be broader than the uses described herein. In particular, the following algorithms 1 through 4 can be implemented together with any time-resolved instrumentation in order to perform multiple species evaluation of exponentially decaying processes. The first algorithm belongs to a wider set of techniques that in accordance with this invention will be called discrete Principal Component Analysis (dPCA). The first algorithm involves the use of dPCA techniques to evaluate the concentrations of multiple compounds simultaneously in a given sample, each compound having determined and fixed emission lifetime decay, or attached to an emitter that has determined and fixed lifetime decay. The other three algorithms are concerned with the evaluation of both the concentrations and the lifetimes of multiple compounds simultaneously, in a given sample. The second of these algorithms makes use of a dPCA technique supplemented with an auxiliary function (see equation 8). The last two algorithms belong to a set that will be called “discrete Laplace Transform” techniques. One of these two algorithms makes use of a discrete speed scan of the time-resolved spectrometer, and the other uses a continuous speed scan of the time-resolved spectrometer and integration in discrete time-segments of the signal.
Algorithm No. 1.
Notwithstanding the spectral composition of the light emission coming from the different compounds in the sample, the intensity of radiation produced by a number of emitting compounds (say, K), as a function of time, is simply given as the incoherent addition of each individual compound,
Where, χi is the concentration of the i-th substance, αi, its absorbance, ηi, its emission quantum efficiency and, τi, its emission lifetime. To arrive at Eq. (1), the limit of small absorbance for the compounds is assumed. Since {αi} and {αiηi} are fixed quantities, we can recombine the three factors in the coefficients of Eq. (1) as a single set of unknowns, {ζi}={αiηiχi}. A compound can be an atom, a molecule or a more complex cluster of atoms and molecules. A compound is sometimes called a component. Typically, a sample of material being analyzed will contain a plurality of components or compounds.
In one of the embodiments of the instrument, it will be assumed that the lifetimes, {τi}, of the compounds are known values which remain constant during the course of the measurement and are only slightly affected by environmental conditions (such as pH, Temperature, viscosity, humidity pressure). In this case, the compound concentration, {χi} is being measured, and the time-resolution is understood as the ability of the RadiaLight® based spectrometer system to determine {χi} within a time window equal to the roundtrip time of the device. The linearity of Eq. (1), with respect to compound concentrations, {χi}, allows for the use of linear regression techniques in de-convolving the time-domain signal at the photo-detector level, when a sample composed of a plurality of emitting or absorbing substances is being interrogated. By defining the elements of an N×K matrix, σ, as
Furthermore, defining a vector, A (a1 . . . aN), where ai is the integrated optical power received by the photo-detector after polling the i-th optical channel, divided by the dwell time, ΔT (see FIG. 2 ), it follows, then
A=σ·χ (3)
A=σ·χ (3)
Eq. (2) is a convolution of the exponentially decaying function of a light emitting compound with an optical channel transmission function. In some embodiments of the present invention, the optical channel transmission function may be a Gaussian function, as shown in Eq. (2); however, some embodiments may include other optical channel transmission functions, like a Voigt profile, or a Lorentz profile.
Once the photo-detector measurement is expressed in a linear operation as shown in Eq. (3), the algebra of regression techniques can be applied directly in a manner such as disclosed in U.S. Pat. No. 7,602,488, assigned to Neptec Optical Solutions, incorporated herein by reference in its entirety. A new matrix, Z, is defined:
Z=σ t·σ (4)
Z=σ t·σ (4)
Z is a square, symmetric matrix, and therefore it can be diagonalized and inverted by a unitary matrix, Q, as in:
Z=Q t·Λ·Q (5)
Z=Q t·Λ·Q (5)
where, Λ, is a diagonal matrix containing the eigenvalues of Z. From Eqs. (3), (4) and (5), a solution can be found for χ as
χ=Q·Λ −1 ·Q t·σt A (6)
χ=Q·Λ −1 ·Q t·σt A (6)
In some embodiments of the present invention, for the matrix inversion to allow for minimal error, and for the algorithm to take the least number of operations, the value of, γ=Det(Z), is maximized. FIG. 5 a shows a plot of γ as a function of ω for a given set of {τi} and {αi, ηi} of a hypothetical sample. The curve has a clear maximum, and a fairly broad range of values of ω for which γ maintains a sizeable value (FWHM). In some embodiments of the present invention, the operational speed of the device, ωop, will be defined as that which maximizes the curve of FIG. 5 a for a given set of {αi, ηi}. FIG. 5 b shows a set of different curves γ, given samples with a different range of lifetimes {τi}. The maximum value of γ remains the same as the set of values {τi} changes substantially. This relaxes the computational requirements while the instrument performance is maintained uniform across a large range of lifetime values.
An indicator of device performance according to some embodiments of the present invention is the variance introduced in the concentration measurement due to the linear regression applied. This information is contained in the rows of the matrix: Z−1·σt. The variance ν is defined as
Algorithm No. 2.
Using the definition of the variance given in Eq. (7), a further development can be introduced, as described in the following. A reference function FR can be defined as,
F R(t)=I F(t)+I ref e −t/τref . (8.1)
F R(t)=I F(t)+I ref e −t/τ
where IF is given by Eq. (1), τref is a reference lifetime, and Iref is a reference amplitude. With the function FR a matrix, σ(Iref, τref), is built and the variance ν(Iref, τref), is calculated following Eqs. (7-8.1), as shown below,
Algorithm No. 3.
Another embodiment of the instrument comprises a discrete Laplace transform algorithm, used to measure the different lifetimes and concentrations, {τi} and {ζi} in Eq. (1). This algorithm is illustrated in FIG. 8 . The method of using a Laplace transform to solve Eq. (1) in terms of {χi} and {τi} has been well-known for a number of years (See M. Ameloot, J. M. Beechem, L. Brand; “Simultaneous Analysis of Multiple Fluorescence Decay Curves By Laplace Transforms”, Biophysical Chemistry 23, 155171 (1986)). Equations (9.1-3) in U.S. patent application Ser. No. 11/603,939 show the three discrete functions that will be of relevance.
Eq. (9.1) in U.S. patent application Ser. No. 11/603,939 is proportional to the intensity measured by the k-th optical channel of the RadiaLight® switch, and Eqs. (9.2) and (9.3) in U.S. patent application Ser. No. 11/603,939 are its successive time derivatives. Throughout this discussion, a sample with three different species will be used for calculations and examples. A person of ordinary skill in the art will recognize that the technique can be extended to a sample with any number K of components. FIG. 8 shows the basic principle for the step-speed scan technique. In FIG. 8 , a single optical channel signal is shown for different values of the rotational speed ω of the device. Here, the device is operated at a central speed ω0 for one complete cycle. The speed is then increased to a value ω−, and a new set of measurements is collected through another cycle. The choice of ‘−’ superscript is based on the fact that, whereas, ω+<ω0<ω−, also, tk −<tk<tk +. This is followed by a new cycle scan measurement, where the speed of the device is reduced to ω+. With the measurements performed in this manner, the first and second time derivatives of the intensity can be collected for every optical channel in the device, as shown in Eq. (10) of U.S. patent application Ser. No. 11/603,939, incorporated herein by reference in its entirety.
On the other hand, the optical power intensity I(t), measured by the photo-detector as the RadiaLight® switch cycles through the optical channels, is a function of time to which a Laplace transform can be applied, with the result written in Eq. (11) of U.S. patent application Ser. No. 11/603,939, incorporated herein by reference in its entirety.
The right hand side in Eq. (11) of U.S. patent application Ser. No. 11/603,939, includes a sum of terms that can be obtained by direct, discrete measurement with the RadiaLight® device, using the supplementary functions of the parameter s, shown above. These functions include factors that involve knowledge of tk at every point of the measurement, which is also a design parameter in the RadiaLight® architecture. The functions Ik′ and Ik″ can also be obtained from measurement, as shown in FIG. 8 , and Eq. (10) in U.S. patent application Ser. No. 11/603,939; in this case, knowledge of tk is necessary at three different points for each optical channel k and measurements at three different values of ω are also needed. Overall, evaluation of the right-hand side of Eq. (11) in U.S. patent application Ser. No. 11/603,939, requires measurement of Ik at three different speeds, and the collection of (ω, ω+, and ω−), and (tk, tk +, tk −). This means that, for each measurement, at least three complete cycles of the RadiaLight® switch will be needed, for a total of 3k+6 parameters. Furthermore, in some embodiments of the present invention the number of cycles needed to complete a measurement may be larger. A calculation of the Laplace transform of a continuous emission or transmission decay function renders Eq. (12) in U.S. patent application Ser. No. 11/603,939, incorporated herein by reference in its entirety.
Eq. (12) in U.S. patent application Ser. No. 11/603,939, is a rational function of polynomials, with parameters, {ζi}, and, {τi}. These functions are readily suitable for nonlinear curve fitting by any standard method available, e.g. Levenberg-Marquardt routines. The procedure is to equate the right hand side of Eq. (12) in U.S. patent application Ser. No. 11/603,939 to the right hand side of Eq. (11) in U.S. patent application Ser. No. 11/603,939. Some embodiments of the present invention employ a nonlinear curve fitting to the data in the right hand side of Eq. (11) in U.S. patent application Ser. No. 11/603,939, in order to extract the parameters {ζi} and {τi} altogether. In some embodiments of the present invention, time-division multiplexer 50 creates a time-gap, δ, between the optical pumping and the start of the measurement, as shown in FIG. 8 . In some embodiments, the RadiaLight® device operates such that δ=t1; however, other embodiments may use δ as an independent parameter that can be adjusted by special design of the instrument. The issue will be to select values of δ that are convenient so that the model can accurately predict {ζi} and {τi} for a given sample. The starting point is to replace the integral in Eq. (12) from U.S. patent application Ser. No. 11/603,939 by a modified Laplace transform Ls δ(I) as shown in Eq. (13) of U.S. patent application Ser. No. 11/603,939.
The assumption of some embodiments of the present invention is expressed in Eq. (14) of U.S. patent application Ser. No. 11/603,939. The validity of Eq. (14) in U.S. patent application Ser. No. 11/603,939 occurs for only a given range of values of s. FIG. 9 shows a plot of the two sides of Eq. (14) in U.S. patent application Ser. No. 11/603,939, for δ=τ=1.2 μsec. In some embodiments of the method presented here the nonlinear fit is performed in a region for small s, so that the equality of the two sides of the equation is maintained with sufficiently good precision. Also, notice that the left-hand side of Eq. (14) in U.S. patent application Ser. No. 11/603,939 is obtained assuming integration over an infinite time interval. What this means is that the longer the RadiaLight® device polls the signal optical channels after a given pump pulse, the more accurate the equation will be. Therefore, multiple measurement cycles may be needed after a pump pulse is delivered. This is in addition to the three cycles at different speeds that the discrete scheme requires, in order to obtain a measurement.
For a quantitative analysis, some embodiments of the present invention may use a variance of the measurement, or goodness of fit, ν, as in Eq. (15) of U.S. patent application Ser. No. 11/603,939. FIG. 9 shows how sensitive the value of ν is with respect to the number of cycles in a measurement. Once the low-variance limit is reached, any further increase in cycling will no longer produce better results. The precise value at which this condition is met depends strongly on the specific values of the true parameters { ζ m} and { τ m} in Eq. (15) of U.S. patent application Ser. No. 11/603,939. FIG. 10 also shows the time resolution of the measurement for the different cycles used, including a factor of 3, to account for the step-speed scan. For the center speed used in the calculation (ω=5×10⁵ RPM), it is seen that cycling the instrument up to 30 times per measurement results in a time resolution of about 10 ms. FIG. 11 shows the correlation of the variances between the different parameters, as the concentration of compound I changes. Correlation is high, but variances are kept below 5% across a wide range of values for ζ1.
Algorithm No. 4.
In some embodiments of the modified Laplace transform algorithm, a continuous speed scan method is applied. A system for implementing this embodiment is illustrated in FIG. 12 a and the waveform resulting from the use of the system of FIG. 12 a is shown in FIG. 12 b. The concept in this case is to continuously change the speed of time division multiplexing device 50 between two limiting values, ω+<ω−, while the power measured on each optical channel is monitored separately. FIG. 12 a shows the system used for the measurement. Shown in FIG. 12 a is a rotating prism 5 with seven waveguides 2-1 through 2-7. Laser 1 provides a source of light to be incident on the sample (not shown in FIG. 12 a but located relative to the system in FIG. 12 a as shown in FIGS. 1 a and 1 b). Notice that in the case of a continuous reduction of rotational speed, as the signal from any given optical channel slows down, the device may end up measuring a portion of the signal that had already been measured by a previous optical channel at an earlier time. As a result, different optical channels will end up polling overlapping regions of the time-decay fluorescence signal. This is illustrated in FIG. 12 b. Because this could lead to confusion of the overall signal, each optical channel has to be monitored on a separate photo-detector 4-1 through 4-7 of which only photo-detectors 4-1 through 4-5 are shown.
One of ordinary skill in the art will recognize that other embodiments of the invention can be implemented by which the signal from each optical channel is tracked and stored separately by some other electronic means. The process of computing the Laplace transform using the signal coming from each photo-detector and ad-hoc overlap-counting functions, A(k, t), is illustrated in more detail in FIG. 13 . In the embodiment illustrated in FIG. 13 the initial and final time-division multiplexing speed of the instrument are such that the first optical channel winds up at the time slot that the second optical channel occupied in the initial configuration. The end result of this process is that a continuous Laplace transform applied to the function IF(t), starting at an initial time, δ≠4, as will be disclosed below. From FIG. 13 :
Eq. (16) of U.S. patent application Ser. No. 11/603,939 shows the calculation procedure to find the coefficients {ζ}, and {τ}. The right hand side is the result of the measurement, where the coefficient A(k,t) takes care of the overlap between the integrals for the different optical channels. This overlap factor depends on the optical channel number, and also on the specific time interval considered. The left-hand side contains the formula and the parameters upon which the nonlinear regression is applied.
In practice, the overlap renders an averaged value of the signal during a certain time interval; this improves the signal-to-noise ratio (SNR) of the device. Once the range of speeds and the number of optical channels is known (ω+, ω−, and k), the coefficients A(k, t) can be easily determined. An example is the case illustrated in FIG. 12 b. The speeds, ω+, and, ω−, are such that the first optical channel ends up being polled at time, t1 +=t2 −, so that the overlap between optical channels 1 and 2 is exactly zero. For a simple case with k=8 optical channels in the RadiaLight® switch, the values of the A(k,t) coefficients are listed in Table 1 of U.S. patent application Ser. No. 11/603,939, incorporated herein by reference in its entirety. Notice that the sum across each row is equal to 1, to ensure that the decay measurement during any given time-interval is only counted once.
The invention disclosed herein can be used in a number of applications. One example is the well known technique of cavity ring-down absorption spectroscopy, also known as cavity ring-down spectroscopy (CRDS). In CRDS, an optical system is so designed to produce a time decaying signal where the decay time has a contribution from the resonant absorption of light at certain frequency due to the presence of a compound in the sample.
The total optical intensity as a function of time is a combination of the signal at different frequencies, ωi, in a manner that parallels Eq. (1):
Wherein τωi has two main contributions:
1/τωi=1/τi+1/ταi (10)
1/τωi=1/τi+1/ταi (10)
With 1/ταi being the contribution from the molecular absorption. The magnitude of 1/ταi is directly proportional to the concentration of the absorbing molecule in the sample. The factor 1/τi is related to “roundtrip” losses in the optical system associated with the elements contained in the system (e.g. mirrors and reflective surfaces, diffraction elements, lenses, waveguide coupling devices). The value of 1/τi, which in general is dependent on the frequency of light, can be calculated from the physical construction of the optical system. The value of 1/τωi can be obtained from the measurement of the decay times in Eq. (9) using any of the four different algorithms disclosed heretofore, in conjunction with the time-division multiplexer. Thus, a concentration measurement can be directly extracted from the expression
1/ταi=1/τωi−1/τi (11)
1/ταi=1/τωi−1/τi (11)
By assuming a Beer-Lambert law of absorption for a given molecule over a certain path-length, 1, the molecular concentration, χ, is given by:
Wherein χ·α is the net molecular absorption per unit length of the CRDS system. In one embodiment of the invention disclosed herein, the decay time of a signal measured using a CRDS system is obtained by any of the four algorithms described above, and then Eqs. (11) and (12) are used to determine the substance concentration, χ. In these embodiments, the resolution of the decay lifetime measurement determines the absorption sensitivity of the system.
The CRDS system 150 includes mirrors 151 and 152 with a selected reflectivity each R1 (mirror 151) and R2 (mirror 152). Inside the cavity, sample 155 is placed containing a mixture of different absorbing species. Samples can be in solid, liquid, gaseous, or plasma state, and the different absorbing species contained in the sample may be pure substances as in any of the chemical elements, or molecules, or clusters of molecules, or other types of chemical materials like nanostructures or microscopic arrays of molecules. In some embodiments of the present invention, the reflectivity of mirrors 151 and 152 is such that R1<R2, and R2 has a value very close to 1, ideally equal to 1. Some embodiments may include a mirror R2 with a reflectivity of 0.9999, or better. Other embodiments may further use a mirror 151 with reflectivity R1 equal to 0.98, 0.90, or less. The lower reflectivity of mirror 151 in some embodiments is convenient in order to obtain a sizeable signal returned back to the time-division multiplexing measurement device.
The time for a roundtrip travel of an optical pulse in CRDS system 150 is tR. In some embodiments of the present invention, tR is lower than dwell time, ΔT, so that multiple pulses coming from CRDS system 150 can be measured by a single optical channel 2-2, 2-3, 2-4, and 2-5. In some embodiments, roundtrip time tR is smaller than 1/10th of ΔT.
Other embodiments of this invention will be obvious to those skilled in the art in view of the above descriptions. For example, some embodiments use non-fluorescent samples having fluorophores attached to them, some other embodiments use intrinsically fluorescent samples. The above descriptions are meant to be illustrative and not limiting.
In some embodiments of the present invention, such as the one depicted in FIG. 16 , light source 1 may be a continuous wave (CW) emitting source, and time division multiplexing 50 automatically creates a pulsed signal going into CRDS system 150, thus reducing the cost associated with an intrinsic pulsed light source. In some embodiments, such as the one depicted in FIG. 16 , the optical output from CRDS system 150 is automatically de-coupled from light source 1, because once the initial light pulse completes a roundtrip through CRDS system 150, switching element 5 has decoupled the CRDS system 150 from light source 1. This eliminates the need to introduce bulky optical elements such as an isolator in front of light source 1.
Other embodiments of the present invention may use a pulsed light source 1 before time-division multiplexer 50. Further, some embodiments may include a light source 1 separated from time-division multiplexer 50, directly sending light to CRDS system 150 and the light collected out of CRDS system 150 being coupled into time-division multiplexer 50, multiplexer 3, and detector 4.
Claims (4)
1. A time-resolved spectroscopy system comprising:
a light source for producing light to be directed at a sample, said sample comprising at least one light emitting or light absorbing compound:
a time-division multiplexing device for taking the radiation scattered or transmitted by the sample as a result of said light impinging on said sample and distributing that radiation to each of a plurality of optical channels; and
a detector for detecting the radiation carried by each of said optical channels; wherein
the light from the light source is directed through a waveguide and the radiation scattered or transmitted by the sample is collected from the same waveguide; and further comprising
an analyzer connected to said detector for analyzing one or more signals produced by said detector to determine the characteristics of the radiation carried by each of said optical channels; wherein the time-division multiplexing device is configured to operate at a pre-selected speed to measure a lifetime of the at least one light emitting or light absorbing compound.
2. The system as in claim 1 further comprising:
a waveguide for transmitting light from the light source to said sample;
a routing element in communication with said waveguide for transmitting to said plurality of optical channels radiation from said sample in response to light from said light source being incident on said sample;
a filter mounted in series with said routing element to prevent light from said light source from being transmitted to the detector through the optical channels; and further comprising
a filter in series with each optical channel to allow the passage of selected radiation from the sample to the corresponding optical channel.
3. The system as in claim 1 wherein said sample contains a luminescent material whose luminescence lifetime is quenched by a molecular oxygen concentration in said sample, thus enabling the measurement of said oxygen concentration.
4. The system as in claim 1 wherein said sample contains a luminescent material whose luminescence is quenched by an ion concentration in said sample, such
ions being one of H+, Na+, Ca+, Cu2+, Cl−, and H2PO4 −.
Priority Applications (2)
| Application Number | Priority Date | Filing Date | Title |
|---|---|---|---|
| US12/697,227 US8405827B2 (en) | 2006-11-21 | 2010-01-30 | Time-resolved spectroscopy system and methods for multiple-species analysis in fluorescence and cavity-ringdown applications |
| US13/848,723 US9157858B2 (en) | 2006-11-21 | 2013-03-21 | Time-resolved spectroscopy system and methods for multiple-species analysis in fluorescence and cavity-ringdown applications |
Applications Claiming Priority (2)
| Application Number | Priority Date | Filing Date | Title |
|---|---|---|---|
| US11/603,939 US7679745B2 (en) | 2006-11-21 | 2006-11-21 | Time-resolved fluorescence spectrometer for multiple-species analysis |
| US12/697,227 US8405827B2 (en) | 2006-11-21 | 2010-01-30 | Time-resolved spectroscopy system and methods for multiple-species analysis in fluorescence and cavity-ringdown applications |
Related Parent Applications (1)
| Application Number | Title | Priority Date | Filing Date |
|---|---|---|---|
| US11/603,939 Continuation-In-Part US7679745B2 (en) | 2006-11-21 | 2006-11-21 | Time-resolved fluorescence spectrometer for multiple-species analysis |
Related Child Applications (1)
| Application Number | Title | Priority Date | Filing Date |
|---|---|---|---|
| US13/848,723 Continuation US9157858B2 (en) | 2006-11-21 | 2013-03-21 | Time-resolved spectroscopy system and methods for multiple-species analysis in fluorescence and cavity-ringdown applications |
Publications (2)
| Publication Number | Publication Date |
|---|---|
| US20100165338A1 US20100165338A1 (en) | 2010-07-01 |
| US8405827B2 true US8405827B2 (en) | 2013-03-26 |
Family
ID=42284560
Family Applications (2)
| Application Number | Title | Priority Date | Filing Date |
|---|---|---|---|
| US12/697,227 Expired - Fee Related US8405827B2 (en) | 2006-11-21 | 2010-01-30 | Time-resolved spectroscopy system and methods for multiple-species analysis in fluorescence and cavity-ringdown applications |
| US13/848,723 Expired - Fee Related US9157858B2 (en) | 2006-11-21 | 2013-03-21 | Time-resolved spectroscopy system and methods for multiple-species analysis in fluorescence and cavity-ringdown applications |
Family Applications After (1)
| Application Number | Title | Priority Date | Filing Date |
|---|---|---|---|
| US13/848,723 Expired - Fee Related US9157858B2 (en) | 2006-11-21 | 2013-03-21 | Time-resolved spectroscopy system and methods for multiple-species analysis in fluorescence and cavity-ringdown applications |
Country Status (1)
| Country | Link |
|---|---|
| US (2) | US8405827B2 (en) |
Cited By (2)
| Publication number | Priority date | Publication date | Assignee | Title |
|---|---|---|---|---|
| US9404870B2 (en) | 2013-03-15 | 2016-08-02 | Cedars-Sinai Medical Center | Time-resolved laser-induced fluorescence spectroscopy systems and uses thereof |
| US10656089B2 (en) | 2016-04-01 | 2020-05-19 | Black Light Surgical, Inc. | Systems, devices, and methods for time-resolved fluorescent spectroscopy |
Families Citing this family (37)
| Publication number | Priority date | Publication date | Assignee | Title |
|---|---|---|---|---|
| DE102009010563A1 (en) | 2009-02-16 | 2010-08-26 | Matthias W. Engel | Device for the detection of analytes in body fluids |
| KR20120054932A (en) * | 2010-11-22 | 2012-05-31 | 한국전자통신연구원 | Multi-function optical measurement device |
| US8486717B2 (en) | 2011-01-18 | 2013-07-16 | Symbolics, Llc | Lateral flow assays using two dimensional features |
| DE102011086226B3 (en) * | 2011-11-11 | 2013-01-17 | Bruker Optik Gmbh | Method for receiving spectrally resolved two-dimensional image by Fourier transform spectroscopy, involves feeding light to interferometer and splitting light into two partial-beams |
| FR2985827B1 (en) * | 2012-01-17 | 2014-01-31 | St Microelectronics Sa | METHOD FOR TESTING AN INTEGRATED CIRCUIT |
| US9874556B2 (en) | 2012-07-18 | 2018-01-23 | Symbolics, Llc | Lateral flow assays using two dimensional features |
| US20140072959A1 (en) | 2012-09-12 | 2014-03-13 | Force Diagnostics, Inc. | Rapid tests for insurance underwriting |
| US10408828B2 (en) | 2013-02-26 | 2019-09-10 | Astute Medical, Inc. | Lateral flow assay with test strip retainer |
| CN105765384B (en) | 2013-09-13 | 2018-02-09 | Symbolics有限责任公司 | Detected with the lateral chromatography of two dimension experiment and control signal readout mode |
| US10140394B2 (en) | 2014-09-25 | 2018-11-27 | Applied Materials, Inc. | Method for rejecting tuning disturbances to improve lamp failure prediction quality in thermal processes |
| CA2981297A1 (en) | 2015-04-06 | 2016-10-13 | Bludiagnostics, Inc. | A test device for detecting an analyte in a saliva sample and method of use |
| US20180070830A1 (en) * | 2015-04-09 | 2018-03-15 | The General Hospital Corporation | Systems and methods for time-resolved diffuse correlation spectroscopy |
| JP6851079B2 (en) * | 2015-05-01 | 2021-03-31 | ユニバーサル・バイオ・リサーチ株式会社 | Multiple reaction parallel measuring device and its method |
| US20210278403A1 (en) | 2016-08-23 | 2021-09-09 | Qoolabs, Inc. | Lateral flow assay for assessing recombinant protein expression or reporter gene expression |
| CN108827472B (en) * | 2018-04-27 | 2020-05-12 | 山西中谱能源科技有限公司 | Combined multi-light path integrated atomic fluorescence instrument |
| US11096585B2 (en) | 2018-05-04 | 2021-08-24 | Hi Llc | Non-invasive optical measurement system and method for neural decoding |
| US10340408B1 (en) | 2018-05-17 | 2019-07-02 | Hi Llc | Non-invasive wearable brain interface systems including a headgear and a plurality of self-contained photodetector units configured to removably attach to the headgear |
| US10420498B1 (en) | 2018-06-20 | 2019-09-24 | Hi Llc | Spatial and temporal-based diffusive correlation spectroscopy systems and methods |
| US11213206B2 (en) | 2018-07-17 | 2022-01-04 | Hi Llc | Non-invasive measurement systems with single-photon counting camera |
| CA3135228A1 (en) | 2019-05-06 | 2020-11-12 | Hi Llc | Photodetector architectures for time-correlated single photon counting |
| CA3137921A1 (en) | 2019-06-06 | 2020-12-10 | Hi Llc | Photodetector systems with low-power time-to-digital converter architectures |
| CN110836865B (en) * | 2019-10-31 | 2021-03-02 | 中国人民解放军战略支援部队航天工程大学 | Absorption spectrum measurement control system for large-scale sensing array |
| WO2021167877A1 (en) | 2020-02-21 | 2021-08-26 | Hi Llc | Multimodal wearable measurement systems and methods |
| US11515014B2 (en) | 2020-02-21 | 2022-11-29 | Hi Llc | Methods and systems for initiating and conducting a customized computer-enabled brain research study |
| US11630310B2 (en) | 2020-02-21 | 2023-04-18 | Hi Llc | Wearable devices and wearable assemblies with adjustable positioning for use in an optical measurement system |
| US11771362B2 (en) | 2020-02-21 | 2023-10-03 | Hi Llc | Integrated detector assemblies for a wearable module of an optical measurement system |
| US11950879B2 (en) | 2020-02-21 | 2024-04-09 | Hi Llc | Estimation of source-detector separation in an optical measurement system |
| WO2021188487A1 (en) | 2020-03-20 | 2021-09-23 | Hi Llc | Temporal resolution control for temporal point spread function generation in an optical measurement system |
| US11864867B2 (en) | 2020-03-20 | 2024-01-09 | Hi Llc | Control circuit for a light source in an optical measurement system by applying voltage with a first polarity to start an emission of a light pulse and applying voltage with a second polarity to stop the emission of the light pulse |
| US11857348B2 (en) | 2020-03-20 | 2024-01-02 | Hi Llc | Techniques for determining a timing uncertainty of a component of an optical measurement system |
| WO2021188489A1 (en) | 2020-03-20 | 2021-09-23 | Hi Llc | High density optical measurement systems with minimal number of light sources |
| US11819311B2 (en) | 2020-03-20 | 2023-11-21 | Hi Llc | Maintaining consistent photodetector sensitivity in an optical measurement system |
| US11245404B2 (en) | 2020-03-20 | 2022-02-08 | Hi Llc | Phase lock loop circuit based signal generation in an optical measurement system |
| WO2021188496A1 (en) | 2020-03-20 | 2021-09-23 | Hi Llc | Photodetector calibration of an optical measurement system |
| US11877825B2 (en) | 2020-03-20 | 2024-01-23 | Hi Llc | Device enumeration in an optical measurement system |
| WO2021188486A1 (en) | 2020-03-20 | 2021-09-23 | Hi Llc | Phase lock loop circuit based adjustment of a measurement time window in an optical measurement system |
| KR20220025378A (en) * | 2020-08-24 | 2022-03-03 | 삼성전자주식회사 | Apparatus and method for acquring target signal spectrum |
Citations (16)
| Publication number | Priority date | Publication date | Assignee | Title |
|---|---|---|---|---|
| US4164373A (en) * | 1978-01-12 | 1979-08-14 | The United States Of America As Represented By The United States Department Of Energy | Spectrometer employing optical fiber time delays for frequency resolution |
| US5828452A (en) * | 1996-12-31 | 1998-10-27 | Dakota Technologies, Inc. | Spectroscopic system with a single converter and method for removing overlap in time of detected emissions |
| US6094267A (en) | 1999-04-21 | 2000-07-25 | The Board Of Trustees Of The Leland Stanford Jr. University | Optical heterodyne detection for cavity ring-down spectroscopy |
| US6159686A (en) | 1992-09-14 | 2000-12-12 | Sri International | Up-converting reporters for biological and other assays |
| US6377350B1 (en) | 2000-02-03 | 2002-04-23 | Informal Diagnostics, Inc | Frequency sequencing using CRDS |
| US20030116436A1 (en) | 2001-10-19 | 2003-06-26 | Varouj Amirkhanian | Multi-color multiplexed analysis in a bio-separation system |
| US20040007675A1 (en) * | 2001-04-16 | 2004-01-15 | Gregory Gillispie | Multi-dimensional fluorescence apparatus and method for rapid and highly sensitive quantitative analysis of mixtures |
| US20040114211A1 (en) * | 2002-06-03 | 2004-06-17 | Sparta, Inc. | Method and apparatus for time-division multiplexing to improve the performance of multi-channel non-linear optical systems |
| US6858852B2 (en) | 2000-08-08 | 2005-02-22 | Carl Zeiss Jena Gmbh | Method and apparatus for rapid change of fluorescence bands in the detection of dyes in fluorescence microscopy |
| US6865198B2 (en) | 2002-09-27 | 2005-03-08 | Battelle Memorial Institute | Cavity ringdown spectroscopy system and method |
| US20050260764A1 (en) | 2004-05-24 | 2005-11-24 | Grigsby John M Jr | Method and apparatus for monitoring liquid for the presence of an additive |
| US20060132778A1 (en) | 2004-12-21 | 2006-06-22 | Palo Alto Research Center Incorporated | Time-multiplexed scanning light source for multi-probe, multi-laser fluorescence detection systems |
| US20060142650A1 (en) * | 2004-07-20 | 2006-06-29 | Prescient Medical, Inc. | Systems and methods for medical interventional optical monitoring with molecular filters |
| US20060197033A1 (en) * | 2005-02-08 | 2006-09-07 | Northrop Grumman Corporation | Systems and methods for use in detecting harmful aerosol particles |
| US20070167839A1 (en) * | 2005-11-23 | 2007-07-19 | Gary Carver | Tissue Scanning apparatus and method |
| US20070285658A1 (en) * | 2006-06-12 | 2007-12-13 | Neptec Optical Solutions, Inc. | High-speed, rugged, time-resolved, raman spectrometer for sensing multiple components of a sample |
Family Cites Families (2)
| Publication number | Priority date | Publication date | Assignee | Title |
|---|---|---|---|---|
| EP1307714A4 (en) * | 2000-07-12 | 2007-04-04 | Macquarie Res Ltd | Optical heterodyne detection in optical cavity ringdown spectroscopy |
| WO2006014688A2 (en) * | 2004-07-20 | 2006-02-09 | Neptec Optical Solutions. Inc. | Optical monitoring system with molecular filters |
-
2010
- 2010-01-30 US US12/697,227 patent/US8405827B2/en not_active Expired - Fee Related
-
2013
- 2013-03-21 US US13/848,723 patent/US9157858B2/en not_active Expired - Fee Related
Patent Citations (16)
| Publication number | Priority date | Publication date | Assignee | Title |
|---|---|---|---|---|
| US4164373A (en) * | 1978-01-12 | 1979-08-14 | The United States Of America As Represented By The United States Department Of Energy | Spectrometer employing optical fiber time delays for frequency resolution |
| US6159686A (en) | 1992-09-14 | 2000-12-12 | Sri International | Up-converting reporters for biological and other assays |
| US5828452A (en) * | 1996-12-31 | 1998-10-27 | Dakota Technologies, Inc. | Spectroscopic system with a single converter and method for removing overlap in time of detected emissions |
| US6094267A (en) | 1999-04-21 | 2000-07-25 | The Board Of Trustees Of The Leland Stanford Jr. University | Optical heterodyne detection for cavity ring-down spectroscopy |
| US6377350B1 (en) | 2000-02-03 | 2002-04-23 | Informal Diagnostics, Inc | Frequency sequencing using CRDS |
| US6858852B2 (en) | 2000-08-08 | 2005-02-22 | Carl Zeiss Jena Gmbh | Method and apparatus for rapid change of fluorescence bands in the detection of dyes in fluorescence microscopy |
| US20040007675A1 (en) * | 2001-04-16 | 2004-01-15 | Gregory Gillispie | Multi-dimensional fluorescence apparatus and method for rapid and highly sensitive quantitative analysis of mixtures |
| US20030116436A1 (en) | 2001-10-19 | 2003-06-26 | Varouj Amirkhanian | Multi-color multiplexed analysis in a bio-separation system |
| US20040114211A1 (en) * | 2002-06-03 | 2004-06-17 | Sparta, Inc. | Method and apparatus for time-division multiplexing to improve the performance of multi-channel non-linear optical systems |
| US6865198B2 (en) | 2002-09-27 | 2005-03-08 | Battelle Memorial Institute | Cavity ringdown spectroscopy system and method |
| US20050260764A1 (en) | 2004-05-24 | 2005-11-24 | Grigsby John M Jr | Method and apparatus for monitoring liquid for the presence of an additive |
| US20060142650A1 (en) * | 2004-07-20 | 2006-06-29 | Prescient Medical, Inc. | Systems and methods for medical interventional optical monitoring with molecular filters |
| US20060132778A1 (en) | 2004-12-21 | 2006-06-22 | Palo Alto Research Center Incorporated | Time-multiplexed scanning light source for multi-probe, multi-laser fluorescence detection systems |
| US20060197033A1 (en) * | 2005-02-08 | 2006-09-07 | Northrop Grumman Corporation | Systems and methods for use in detecting harmful aerosol particles |
| US20070167839A1 (en) * | 2005-11-23 | 2007-07-19 | Gary Carver | Tissue Scanning apparatus and method |
| US20070285658A1 (en) * | 2006-06-12 | 2007-12-13 | Neptec Optical Solutions, Inc. | High-speed, rugged, time-resolved, raman spectrometer for sensing multiple components of a sample |
Non-Patent Citations (5)
Cited By (6)
| Publication number | Priority date | Publication date | Assignee | Title |
|---|---|---|---|---|
| US9404870B2 (en) | 2013-03-15 | 2016-08-02 | Cedars-Sinai Medical Center | Time-resolved laser-induced fluorescence spectroscopy systems and uses thereof |
| US10288567B2 (en) | 2013-03-15 | 2019-05-14 | Cedars-Sinai Medical Center | Time-resolved laser-induced fluorescence spectroscopy systems and uses thereof |
| US10983060B2 (en) | 2013-03-15 | 2021-04-20 | Cedars-Sinai Medical Center | Time-resolved laser-induced fluorescence spectroscopy systems and uses thereof |
| US11428636B2 (en) | 2013-03-15 | 2022-08-30 | Cedars-Sinai Medical Center | Time-resolved laser-induced fluorescence spectroscopy systems and uses thereof |
| US10656089B2 (en) | 2016-04-01 | 2020-05-19 | Black Light Surgical, Inc. | Systems, devices, and methods for time-resolved fluorescent spectroscopy |
| US11630061B2 (en) | 2016-04-01 | 2023-04-18 | Black Light Surgical, Inc. | Systems, devices, and methods for time-resolved fluorescent spectroscopy |
Also Published As
| Publication number | Publication date |
|---|---|
| US9157858B2 (en) | 2015-10-13 |
| US20100165338A1 (en) | 2010-07-01 |
| US20130218479A1 (en) | 2013-08-22 |
Similar Documents
| Publication | Publication Date | Title |
|---|---|---|
| US8405827B2 (en) | Time-resolved spectroscopy system and methods for multiple-species analysis in fluorescence and cavity-ringdown applications | |
| US7679745B2 (en) | Time-resolved fluorescence spectrometer for multiple-species analysis | |
| US7602488B2 (en) | High-speed, rugged, time-resolved, raman spectrometer for sensing multiple components of a sample | |
| CN110672554B (en) | Random vibration drive ring-down cavity calibration-free gas concentration measurement system | |
| US8693004B2 (en) | Dual-etalon cavity ring-down frequency-comb spectroscopy with broad band light source | |
| US4661711A (en) | Fluorometer | |
| WO2004079351A1 (en) | Integrated tunable optical sensor (itos) system and method therefor | |
| JPH09325116A (en) | Measurement device | |
| US20080023634A1 (en) | Non-invasive detection of analytes in a comples matrix | |
| US6307626B1 (en) | Dispersive atomic vapor raman filter | |
| US3897155A (en) | Atomic fluorescence spectrometer | |
| Ryder et al. | Time-domain measurement of fluorescence lifetime variation with pH | |
| KR20170057672A (en) | Raman signal measuring method and apparatus, and biometric information analyzing apparatus including the Raman signal measuring apparatus | |
| Koo et al. | Reagentless blood analysis by near-infrared Raman spectroscopy | |
| EP0241268A2 (en) | Improved pulse light system fluorometer | |
| JP2004527767A (en) | Optical detection of chemical species in enriched media | |
| FI115072B (en) | Method and spectrometer for measuring a Raman spectrum | |
| CN114384059B (en) | Gas detection device and method | |
| EP4206654A1 (en) | Method and system for raman spectroscopy | |
| JPH09145619A (en) | Method and instrument for spectroscopic measurement of scattered light and so on | |
| US20230375468A1 (en) | Multi-monochromatic light source system for slope spectroscopy | |
| SU1117460A1 (en) | Device for measuring emission spectra | |
| Austin et al. | Optoelectronic systems for addressing Ru oxygen sensors: their design optimization and calibration process | |
| Walden et al. | Comparison of ellipsoidal and parabolic mirror systems in fluorimetry and room temperature phosphorimetry | |
| JPH11218445A (en) | Optical probe |
Legal Events
| Date | Code | Title | Description |
|---|---|---|---|
| STCF | Information on status: patent grant |
Free format text: PATENTED CASE |
|
| REMI | Maintenance fee reminder mailed | ||
| FPAY | Fee payment |
Year of fee payment: 4 |
|
| SULP | Surcharge for late payment | ||
| FEPP | Fee payment procedure |
Free format text: MAINTENANCE FEE REMINDER MAILED (ORIGINAL EVENT CODE: REM.); ENTITY STATUS OF PATENT OWNER: SMALL ENTITY |
|
| LAPS | Lapse for failure to pay maintenance fees |
Free format text: PATENT EXPIRED FOR FAILURE TO PAY MAINTENANCE FEES (ORIGINAL EVENT CODE: EXP.); ENTITY STATUS OF PATENT OWNER: SMALL ENTITY |
|
| STCH | Information on status: patent discontinuation |
Free format text: PATENT EXPIRED DUE TO NONPAYMENT OF MAINTENANCE FEES UNDER 37 CFR 1.362 |
|
| FP | Lapsed due to failure to pay maintenance fee |
Effective date: 20210326 |