US8139788B2 - Apparatus and method for separating audio signals - Google Patents
Apparatus and method for separating audio signals Download PDFInfo
- Publication number
- US8139788B2 US8139788B2 US11/338,267 US33826706A US8139788B2 US 8139788 B2 US8139788 B2 US 8139788B2 US 33826706 A US33826706 A US 33826706A US 8139788 B2 US8139788 B2 US 8139788B2
- Authority
- US
- United States
- Prior art keywords
- signals
- time
- frequency domain
- separation matrix
- separation
- Prior art date
- Legal status (The legal status is an assumption and is not a legal conclusion. Google has not performed a legal analysis and makes no representation as to the accuracy of the status listed.)
- Expired - Fee Related, expires
Links
- 230000005236 sound signal Effects 0.000 title claims abstract description 36
- 238000000034 method Methods 0.000 title claims description 56
- 238000000926 separation method Methods 0.000 claims abstract description 142
- 239000011159 matrix material Substances 0.000 claims abstract description 91
- 238000012880 independent component analysis Methods 0.000 claims abstract description 25
- 239000000203 mixture Substances 0.000 claims abstract description 11
- 238000006243 chemical reaction Methods 0.000 claims description 9
- 230000006870 function Effects 0.000 description 159
- 238000009826 distribution Methods 0.000 description 43
- 239000013598 vector Substances 0.000 description 28
- 230000008569 process Effects 0.000 description 23
- 238000012545 processing Methods 0.000 description 17
- 230000009466 transformation Effects 0.000 description 17
- 241000039077 Copula Species 0.000 description 15
- 230000014509 gene expression Effects 0.000 description 13
- 238000012805 post-processing Methods 0.000 description 11
- 238000005315 distribution function Methods 0.000 description 10
- 230000001186 cumulative effect Effects 0.000 description 8
- 238000010606 normalization Methods 0.000 description 6
- 238000010923 batch production Methods 0.000 description 5
- 238000005070 sampling Methods 0.000 description 4
- 238000012935 Averaging Methods 0.000 description 3
- 238000002474 experimental method Methods 0.000 description 3
- 238000002955 isolation Methods 0.000 description 3
- 238000012795 verification Methods 0.000 description 3
- 238000004458 analytical method Methods 0.000 description 2
- 230000002238 attenuated effect Effects 0.000 description 2
- 238000010168 coupling process Methods 0.000 description 2
- 230000003247 decreasing effect Effects 0.000 description 2
- 238000010586 diagram Methods 0.000 description 2
- 230000010354 integration Effects 0.000 description 2
- 238000000513 principal component analysis Methods 0.000 description 2
- 230000002123 temporal effect Effects 0.000 description 2
- 238000012546 transfer Methods 0.000 description 2
- 230000017105 transposition Effects 0.000 description 2
- NAWXUBYGYWOOIX-SFHVURJKSA-N (2s)-2-[[4-[2-(2,4-diaminoquinazolin-6-yl)ethyl]benzoyl]amino]-4-methylidenepentanedioic acid Chemical compound C1=CC2=NC(N)=NC(N)=C2C=C1CCC1=CC=C(C(=O)N[C@@H](CC(=C)C(O)=O)C(O)=O)C=C1 NAWXUBYGYWOOIX-SFHVURJKSA-N 0.000 description 1
- 230000004913 activation Effects 0.000 description 1
- 230000004075 alteration Effects 0.000 description 1
- 239000002131 composite material Substances 0.000 description 1
- 230000008878 coupling Effects 0.000 description 1
- 238000005859 coupling reaction Methods 0.000 description 1
- 238000000354 decomposition reaction Methods 0.000 description 1
- 238000013461 design Methods 0.000 description 1
- 238000011161 development Methods 0.000 description 1
- 230000004069 differentiation Effects 0.000 description 1
- 230000008034 disappearance Effects 0.000 description 1
- 238000004090 dissolution Methods 0.000 description 1
- 238000000605 extraction Methods 0.000 description 1
- 238000012986 modification Methods 0.000 description 1
- 230000004048 modification Effects 0.000 description 1
- 238000000491 multivariate analysis Methods 0.000 description 1
- 230000001537 neural effect Effects 0.000 description 1
- 238000011160 research Methods 0.000 description 1
Images
Classifications
-
- H—ELECTRICITY
- H04—ELECTRIC COMMUNICATION TECHNIQUE
- H04R—LOUDSPEAKERS, MICROPHONES, GRAMOPHONE PICK-UPS OR LIKE ACOUSTIC ELECTROMECHANICAL TRANSDUCERS; DEAF-AID SETS; PUBLIC ADDRESS SYSTEMS
- H04R3/00—Circuits for transducers, loudspeakers or microphones
- H04R3/005—Circuits for transducers, loudspeakers or microphones for combining the signals of two or more microphones
-
- E—FIXED CONSTRUCTIONS
- E04—BUILDING
- E04G—SCAFFOLDING; FORMS; SHUTTERING; BUILDING IMPLEMENTS OR AIDS, OR THEIR USE; HANDLING BUILDING MATERIALS ON THE SITE; REPAIRING, BREAKING-UP OR OTHER WORK ON EXISTING BUILDINGS
- E04G17/00—Connecting or other auxiliary members for forms, falsework structures, or shutterings
- E04G17/14—Bracing or strutting arrangements for formwalls; Devices for aligning forms
-
- G—PHYSICS
- G10—MUSICAL INSTRUMENTS; ACOUSTICS
- G10L—SPEECH ANALYSIS TECHNIQUES OR SPEECH SYNTHESIS; SPEECH RECOGNITION; SPEECH OR VOICE PROCESSING TECHNIQUES; SPEECH OR AUDIO CODING OR DECODING
- G10L21/00—Speech or voice signal processing techniques to produce another audible or non-audible signal, e.g. visual or tactile, in order to modify its quality or its intelligibility
- G10L21/02—Speech enhancement, e.g. noise reduction or echo cancellation
- G10L21/0208—Noise filtering
- G10L21/0216—Noise filtering characterised by the method used for estimating noise
- G10L2021/02161—Number of inputs available containing the signal or the noise to be suppressed
- G10L2021/02165—Two microphones, one receiving mainly the noise signal and the other one mainly the speech signal
Definitions
- the present invention contains subject matter related to Japanese Patent Application JP 2005-018822 filed in the Japanese Patent Office on Jan. 26, 2005 and Japanese Patent Application JP 2005-269128 filed in the Japanese Patent Office on Sep. 15, 2005, the entire contents of which being incorporated herein by reference.
- This invention relates to an apparatus and a method for separating the component signals of an audio signal, which is a mixture of a plurality of component signals, by means of independent component analysis (ICA).
- ICA independent component analysis
- ICA independent component analysis
- Y( ⁇ , t) represents the column vector having elements Y k ( ⁇ , t) that are obtained by short-time Fourier transformation of y k (t) in a window with a length L and W( ⁇ ) represents a matrix (separate matrix) of n rows and n columns having elements w ij ( ⁇ ).
- FIG. 2 of the accompanying drawings schematically illustrates the prior art independent component analysis in the time-frequency domain.
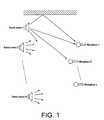
- the original signals that are emitted from n audio sources and independent from each other are s 1 through s n and the vector having them as elements is s.
- the observation signals x that are observed at respective microphones are obtained by performing convoluted/mixed operations in the above formula (2).
- FIG. 3A of the accompanying drawings shows as example observation signals that are obtained when the number of microphones n is equal to 2 and hence the number of channels is equal to 2. Then, the observation signals x are subjected to short-time Fourier transformation to obtain signals X of the time-frequency domain.
- FIG. 3B shows spectrograms as examples.
- the horizontal axis represents t (frame number) and the vertical axis represents ⁇ (frequency bin number).
- a signal itself in the time-frequency domain (a signal before being expressed by an absolute value) is also referred to as “spectrogram”.
- isolated signals Y as shown in FIG. 3C are obtained by multiplying each frequency bin of the signal X by W( ⁇ ).
- Isolated signals y in the time domain as shown in FIG. 3D are obtained by subjecting the isolated signals Y to inverse Fourier transformation.
- independency is expressed by means of a Kullback-Leibler information quantity (to be referred to as “KL information quantity” hereinafter) and the natural gradient method is used for the algorithm for maximizing independency in the following description.
- KL information quantity Kullback-Leibler information quantity
- the KL information quantity I that is the scale for expressing the isolated signals Y 1 ( ⁇ ) through Y n ( ⁇ ) is defined by formula (5) below.
- H(Y k ( ⁇ )) can be rewritten so as to read as the first term of formula (6) below because of the definition of entropy while H(Y( ⁇ )) can be expanded to read as the second and third terms in the formula (6) from the above formula (4).
- P Yk ( ⁇ )( ⁇ ) expresses the probability density function of Y k ( ⁇ , t)
- H(X( ⁇ )) expresses the simultaneous entropy of the observation signals X( ⁇ ).
- the KL information quantity I(Y( ⁇ )) becomes minimal (ideally equal to 0) when Y 1 ( ⁇ ) through Y n ( ⁇ ) are independent.
- the natural gradient method is used for the algorithm for determining the separation matrix W( ⁇ ) that minimizes the KL information quantity I (Y( ⁇ )).
- the direction for minimizing I(Y( ⁇ )) is determined by means of formula (7) below and W( ⁇ ) is gradually changed in that direction as shown by formula (9) below for convergence.
- W( ⁇ ) T shows the transposed matrix of W( ⁇ ).
- ⁇ represents a learning coefficient (a very small positive value).
- Equation (7) can be modified so as to read as formula (8) above.
- Et[ ⁇ ] represents the average in the temporal direction and ⁇ ( ⁇ ) represents the differential of the logarithm of a probability density function that is referred to as score function (or “activation function”).
- score function includes the probability density function of Y k ( ⁇ )
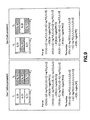
- information quantity and probability density functions of two different types as shown in Table 1 can be used in a switched manner depending on if the distribution of Y k ( ⁇ ) is super-gaussian or sub-gaussian.
- probability density functions of two different types as shown in Table 2 may be used in a switched manner as extended infomax method.
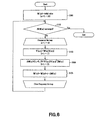
- FIG. 6 is a flowchart of a separation process using the above formula (8) and (9).
- Step S 101 a separation matrix W( ⁇ ) is prepared for each frequency bin and substituted by an initial value (e.g., unit matrix).
- Step S 102 it is determined if W( ⁇ ) converges or not for all the frequency bins and the process is terminated if it converges but made to proceed to Step S 103 if it does not converge.
- Step S 103 Y( ⁇ , t) is defined as the above formula (4) and, in Step S 104 , the direction for minimizing the KL information quantity I(Y( ⁇ )) is determined by means of the above formula (8). Then, in the next step, or Step S 105 , W( ⁇ ) is updated in the direction for minimizing the KL information quantity I(Y( ⁇ )) according to the above formula (9) and returns to Step S 102 . The processing operations in Steps S 102 through S 105 are repeated until the level of independence of Y( ⁇ ) is sufficiently raised for each frequency bin and W( ⁇ ) substantially converges.
- the problem of disunity for scaling can be dissolved by a method of estimating an observation for each audio source.
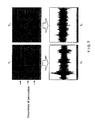
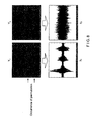
- FIG. 7 illustrates an example of occurrence of permutation. It occurs as a result of an attempt of separating two signals in the initial 32,000 samples of the file “X_rms2.wav” found in the WEB page (http://www.ism.ac.jp/ ⁇ shiro/research/blindsep.html) in the time-frequency domain by means of an extended infomax method.
- One of the original signals is a voice saying “one, two, three” and the other is music.
- the spectrograms of the upper row are subjected to inverse Fourier transformation in order to obtain signals in the time domain, waveforms of a mixture of the two signals as shown in the lower row appears in the both channels.
- a signal separation process is conducted for each frequency bin, a result similar to that of FIG. 7 can inevitably appear depending on the type of observation signal and the initial value of separation matrix W( ⁇ ).
- a switching method that is adapted to be used as post-processing is known as a method for dissolving the problem of permutation.
- spectrograms as shown in FIG. 7 is obtained by separation for each frequency bin and spectrograms that are free from permutation are obtained by switching the isolated signals between the channels according to a certain criterion or another.
- Criteria that can be used for the switching method include (a) the use of similarity of envelopes (see Non-Patent Document 1: Noboru Murata, “Independent Component Analysis for Beginners”, Tokyo Denki University Press), (b) the use of the direction of an estimated audio source (see “Description of the Related Art” in Patent Document 1: Jpn. Pat. Appln. Laid-Open Publication No. 2004-145172) and (c) a combination of (a) and (b) (see Patent Document 1).
- Non-Patent Documents 2 (Mike Davies, “Audio Source Separation”, Oxford University Press, 2002 http://www.elec.qmul.ac.uk/staffinfo/miked/publications/IMA.ps) and Non-Patent Document 3 (Nikolaos Mitianoudis and Mike Davies, A fixed point solution for convolved audio source separation”, IEEE WASPAA01, 2001 (http://egnatia.ee.auth.gr/ ⁇ mitia/pdf/waspaa01.pdf) propose a frequency coupling method for reflecting the relationship among frequency bins to an updated expression of a separation matrix W.
- a probability density function as expressed by formula (10) below and an updated expression of a separation matrix W as expressed by formula (11) below are used (note that the symbols same as those of this specification are used for the variables of the formulas).
- ⁇ k(t) represents the average of the absolute values of the components of Yk( ⁇ , t) and ⁇ (t) represents the diagonal matrix having ⁇ 1, . . . , ⁇ n(t) as diagonal elements. Due to the introduction of ⁇ k(t), it is possible to reflect the relationship among frequency bins is reflected to ⁇ W( ⁇ ).
- FIG. 8 illustrates the results obtained by an operation of signal separation conducted in the initial 32,000 samples of the above-cited file “X_rms2.wav”. Like FIG. 7 , the separation in each frequency bin is successful but permutation is still present, although the problem of permutation is made less remarkable in FIG. 8 if compared with FIG. 7 .
- the present invention has been made in view of the above-identified problems of the prior art, and it is desirable to provide an apparatus and a method for separating audio signals that can dissolve the problem of permutation without conducting a post processing operation after the signal separation when separating the plurality of mixed signals by independent component analysis.
- an audio signal separation apparatus for separating observation signals in the time domain of a mixture of a plurality of signals including audio signals into individual signals by means of independent component analysis to produce isolated signals
- the apparatus including first conversion means for converting the observation signals in the time domain into observation signals in the time-frequency domain, separation means for producing isolated signals in the time-frequency domain from the observation signals in the time-frequency domain, and second conversion means for converting the isolated signals in the time-frequency domain into isolated signals in the time domain
- the separation means being adapted to produce isolated signals in the time-frequency domain from the observation signals in the time-frequency domain and a separation matrix substituted by initial values, compute the modified value of the separation matrix by using a score function using the isolated signals in the time-frequency domain and a multidimensional probability density function and the separation matrix, modify the separation matrix until the separation matrix substantially converges by using the modified value and produce isolated signals in the time-frequency domain by using the substantially converging separation matrix.
- an audio signal separation method of separating observation signals in the time domain of a mixture of a plurality of signals including audio signals into individual signals by means of independent component analysis to produce isolated signals including a step of converting the observation signals in the time domain into observation signals in the time-frequency domain, a step of producing isolated signals in the time-frequency domain from the observation signals in the time-frequency domain and a separation matrix substituted by initial values, a step of computing the modified value of the separation matrix by using a score function using the isolated signals in the time-frequency domain and a multidimensional probability density function and the separation matrix, a step of modifying the separation matrix until the separation matrix substantially converges by using the modified value, and a step of converting the isolated signals in the time-frequency domain produced by using the substantially converging separation matrix into isolated signals in the time domain.
- an apparatus and a method for separating audio signals when separating observation signals in the time domain of a mixture of a plurality of signals including audio signals into individual signals by means of independent component analysis to produce isolated signals, it is possible to dissolve the problem of permutation without performing any post-processing operation after the separation of the audio signals by producing isolated signals in the time-frequency domain from a separation matrix substituted by initial values, computing the modified value of the separation matrix by using a score function using the isolated signals in the time-frequency domain and a multidimensional probability density function and the separation matrix, modifying the separation matrix until the separation matrix substantially converges by using the modified value and converting the isolated signals in the time-frequency domain produced by using the substantially converging separation matrix into isolated signals in the time domain.
- FIG. 1 is a schematic illustration of a situation where the original signals output from N audio sources are observed by means of n microphones;
- FIG. 2 is a schematic illustration of the prior art independent component analysis in the time-frequency domain
- FIGS. 3A through 3D are schematic illustrations of observation signals, their spectrograms, isolated signals and their spectrograms;
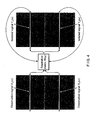
- FIG. 4 is a schematic illustration of observation signals and isolated signals obtained by paying attention to a frequency bin
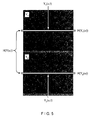
- FIG. 5 is a schematic illustration of entropy and simultaneous entropy of the prior art
- FIG. 6 is a flowchart of the prior art separation process
- FIG. 7 is a schematic illustration of the outcome of signal separation using a one-dimensional probability density function
- FIG. 8 is a schematic illustration of the outcome of signal separating using frequency coupling and a one-dimensional probability density function
- FIG. 9 is a schematic illustration of the logical basis for the theory of dissolving the problem of permutation by using a multidimensional probability density function
- FIGS. 10A and 10B are schematic illustrations of the difference in the KL information quantity between appearance and non-occurrence of permutation according to the present invention as compared with the prior art;
- FIG. 11 is a schematic illustration of entropy and simultaneous entropy of an embodiment of the present invention.
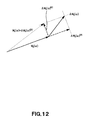
- FIG. 12 is a schematic illustration of the decomposition of the row vector ⁇ W k ( ⁇ ) of a modified value ⁇ W( ⁇ ) of a separation matrix W( ⁇ ) into a component ⁇ W k ( ⁇ )[C] perpendicular to the row vector W k ( ⁇ ) and a component ⁇ W k ( ⁇ )[P] parallel to the row vector W k ( ⁇ ) of the separation matrix;
- FIG. 13 is a schematic block diagram of an embodiment of audio signal separation apparatus according to the invention.
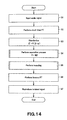
- FIG. 14 is a flowchart of the processing operation of the embodiment of audio signal separation apparatus, summarily illustrating the operation
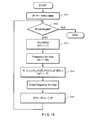
- FIG. 15 is a flowchart of the processing operation of the embodiment of audio signal separation apparatus, illustrating in detail the operation when it is conducted for a batch process;
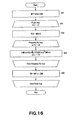
- FIG. 16 is a flowchart of the processing operation of the embodiment of audio signal separation apparatus, illustrating in detail the operation when it is conducted for an online process;
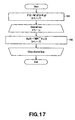
- FIG. 17 is a flowchart of the processing operation of the embodiment of audio signal separation apparatus, illustrating in detail the operation when it is conducted for a resealing process
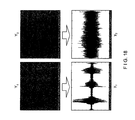
- FIG. 18 is a schematic illustration of the outcome of a signal separation process, using a multidimensional probability density function based on a spherical distribution
- FIGS. 19A and 19B are schematic illustrations of the outcome of a signal separation process, using a score function based on an L norm
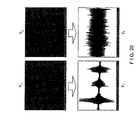
- FIG. 20 is a schematic illustration of the outcome of a signal separation process, using a multidimensional probability density function based on a Copula model
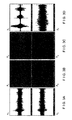
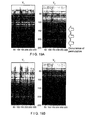
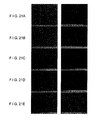
- FIGS. 21A through 21E are schematic illustrations of the changes in the spectrogram that are observed when a permutation is artificially generated for obtained separation signals.
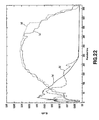
- FIG. 22 is a graph illustrating the changes in the KL information quantity that are observed when a permutation is artificially generated for obtained separation signals.
- the illustrated embodiment is an audio signal separation apparatus for separating the component signals of an audio signal, which is a mixture of a plurality of component signals, by means of independent component analysis.
- this embodiment of audio signal separation apparatus can dissolve the problem of permutation without the necessity of post-processing by computationally determining the entropy of a spectrogram by means of a multidimensional probability density function instead of computationally determining the entropy of each frequency bin by means of a one-dimensional probability density function as in the case of the prior art.
- the logical basis for the theory of dissolving the problem of permutation by using a multidimensional probability density function and specific formulas to be used for the embodiment will be described first and then the specific configuration of the audio signal separation apparatus of this embodiment will be described.
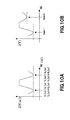
- Case 1 the case where frequency bins are successfully separated and no permutation takes place is referred to as Case 1
- FIG. 10A schematically illustrates the relationship between the KL information quantity I(Y( ⁇ )) and the separation matrix W( ⁇ ) (although it is not possible to express W( ⁇ ) by means of a single axis) of the prior art. Since a minimized KL information quantity is used for both Case 1 and that of Case 2, it is not possible to discriminate the two cases. Here lies the intrinsic cause of the occurrence of permutation when the prior art is used.
- the entropy of each channel is computed by means of a multidimensional probability density function and then a single KL information quantity is computationally determined for all the channels (the formulas to be used for the computations will be described in greater detail hereinafter). Since a single KL information quantity is computationally determined for all the channels with this embodiment, the KL information quantity is different between Case 1 and Case 2. It is possible to make the KL information quantity of Case 1 smaller than that of Case 2 by using an appropriate multidimensional probability density function.
- FIG. 10B schematically illustrates the relationship between the KL information quantity I(Y) and the separation matrix W( ⁇ ) of this embodiment so that it is possible to discriminate the two cases. Therefore, unlike the prior art, it is possible with this embodiment to separate signals and, at the same time, prevent permutation from taking place simply by minimizing the KL information quantity without requiring a switching operation as post-processing.
- the formula (4) for defining the relationship between the observation signal X and the isolated signal Y is used to produce expressions of the relationship for all values of ⁇ (1 ⁇ M), which expressions are then put into a single formula of (12) or (15) (but the formula (12) is selected and used hereinafter).
- Formula (13) below is an expression using a single variable for the vectors and the matrices of the formula (12).
- Formula (14) below is an expression using a single variable for the vectors and the matrices of the formula (12) that is derived from the same channel.
- Y k (t) expresses a column vector formed by cutting out a frame from the spectrogram and W expresses a diagonal matrix having elements w ij (1), . . . , w ij (M).
- the KL information quantity I(Y) is defined by formula (16) below, using Yk(t) and Y(t) in the formulas (12) through (14).
- H(Yk) represents the entropy of a spectrogram of each channel and H(Y) represents the joint entropy of a spectrogram of all the channels.
- H(Yk) is rewritten so as to read as the first term of formula (17) below due to the definition of entropy. Due to the formula (13) above, H(Y) can be developed so as to read as the second and third terms in the formula (17) below.
- PYk( ⁇ ) represents the M-dimensional probability density function of Yk(1, t), . . . , Yk(M, t) and H(x) represents the simultaneous entropy of the observation signals X.
- ⁇ ( ⁇ ) represents the score function that corresponds to the multidimensional probability density function and formula (24) below can be obtained by way of formula (23) below. In other words, it can be obtained by partially differentiating the logarithm of the multidimensional probability density function by the ⁇ -th argument.
- Y is a signal of a complex number and hence a formula that matches complex numbers will actually be used instead of the above formula (22).
- the values of the elements may overflow depending on the type of the multidimensional probability density function to be used.
- Equation of ⁇ W in the formula (22) may be altered as shown below in order to prevent the values of the elements of the separation matrix W from overflowing.
- ⁇ W k ( ⁇ )[C] When ⁇ W k ( ⁇ ) is decomposed into component ⁇ W k ( ⁇ )[C] that is perpendicular to W k ( ⁇ ) and component ⁇ W k ( ⁇ )[P] that is parallel to W k ( ⁇ ) as shown in FIG. 12 , ⁇ W k ( ⁇ )[C] contributes to the isolation of the signal but ⁇ W k ( ⁇ )[P] only makes W k ( ⁇ ) larger and does not contribute to the isolation of the signal. As pointed out earlier, the problem of overflow can take place when W k ( ⁇ ) becomes too large.
- ⁇ W k ( ⁇ )[C] is computationally determined by means of formula (27) below and W( ⁇ ) is updated by using matrix ⁇ W( ⁇ )[C] that is formed by ⁇ W k ( ⁇ )[C] as shown in formula (28) below.
- W may be updated by using component ⁇ W[C] that is perpendicular to W as shown in formula (29) below.
- W may be updated without totally disregarding component ⁇ W[P] that is parallel to W and by multiplying ⁇ W[C] and ⁇ W [P] by respective coefficients ⁇ 1 and ⁇ 12 ( ⁇ 1 > ⁇ 2 >0) that are different from each other.
- formula (31) cannot be applied to a method using a multidimensional probability density function. Therefore, in this embodiment, formula (32) shown below is devised and the separation matrix W is updated on the basis of the formula (32). Note that while ⁇ k ⁇ ( ⁇ ) is expressed as a function that takes M arguments in formula (33) shown below, it is equivalent with ⁇ k ⁇ (Y k (t)) (a function that takes M-dimensional vectors as arguments) of the above-described formula (24).
- a multidimensional (multivariate) normal distribution expressed by formula (34) below is well known as multidimensional probability density function.
- x represents column vectors of x 1 , . . . , X d and ⁇ represents the average value vector of x and ⁇ represents the variance/covariance matrix of x.
- a multidimensional probability density function is devised on the basis of (i) spherical distribution, (ii) L N norm, (iii) elliptical distribution and (iv) copula model.
- a spherical distribution refers to a probability density function that is made multidimensional by substituting an arbitrarily selected non-negative function f(x) (where x is a scalar) with the L2 norm of vector.
- An L2 norm refers to the square root of the total sum of the squares of the absolute values of elements.
- a one-dimensional probability density function (such as an exponential distribution, 1/cos h (x) or the like) is mainly used as f(x). Therefore, a probability density function that is based on a spherical distribution is expressed by formula (35) below.
- h represents a constant for adjusting the outcome of the definite integration of all the arguments in the interval between ⁇ and + ⁇ .
- the score function that corresponds to the probability density function with the expression (35) above can be determined by way of the process as described below.
- score function ⁇ k ⁇ (Y k (t)) is obtained by extracting the elements of the ⁇ -th row from g(Y k (t)) as expressed by formula (37) below Note that it is not necessary to transform the above formula (33) because it can cope with inputs of complex numbers from the beginning because the absolute values of the elements are employed in the spherical distribution.
- (x) of f(x) will be replaced by a specific formula.
- a probability density function as expressed by formula (39) below is obtained by making the formula (38) multidimensional by means of a spherical distribution. Then, the corresponding g(Y k (t)) is expressed by formula (40) below
- a multidimensional probability density function can be established on the basis of an L N norm by substituting an arbitrarily selected non-negative function f(x) (where x is a scalar) with the L N norm.
- An L N norm refers to the N-th power root of the total sum of the N-th powers of the absolute values of elements.
- a multidimensional probability density function such as formula (44) below is obtained by substituting the non-negative function f(x) with the L N norm ⁇ Y k (t) ⁇ N of Y k (t) and making it multidimensional.
- h represents a constant for adjusting the outcome of the definite integration of all the arguments in the interval between ⁇ and + ⁇ .
- Formula (45) shown below can be drawn out from the above formula (44) as a score function that can cope with complex numbers.
- f(x) is expressed by formula (46) below that shows a one-dimensional exponential distribution
- a score function as expressed by formula (47) below is drawn out from the above formula (45).
- f(x) is expressed by formula (48) below
- a score function as expressed by formula (49) below is drawn out from the above formula (45).
- K represents a positive real number and d, m respectively represent natural numbers.
- the expression of the score function ⁇ k ⁇ (Y k (t) is modified in this embodiment so as to meet the requirements that the return value represents a dimensionless number and that the phase of the return value is inverse to that of the ⁇ -th argument.
- the return value of the score function ⁇ k ⁇ (Y k (t) represents a dimensionless number [x]
- the unit of Y k ( ⁇ , t) is [x]
- [x] is offset between the numerator and the denominator of the score function and the return value of the score function does not include the dimension of [x] (the unit that is described as [x n ] where n is a non-zero value).
- ⁇ W( ⁇ ) ⁇ In+Et[ . . . ] ⁇ W( ⁇ ) as shown in the above-described formulas (22) and (32) in this embodiment, the requirement to be met by the score function is that the phase of the return value is “inverse” relative to the ⁇ -th phase.
- ⁇ W( ⁇ ) ⁇ In ⁇ Et[ . . . ] ⁇ W( ⁇ )
- the sign of the score function is inverted so that the requirement to be met by the score function is that the phase of the return value is “same” as the ⁇ -th phase. In either case, it is only necessary that the phase of the return value of the score function solely depends on the ⁇ -th phase.
- the above-described requirement is a generalized expression of the above formula (33) that the return value of the score function represents a dimensionless number and that its phase is inverse to the ⁇ -th phase. Therefore, the measure to be taken for the above formula (33) for complex numbers is not necessary when the score function meets these requirements.
- the above formulas (47) and (49) express score functions that are derived from a multidimensional probability density function that is established on the basis of an L N norm. These score functions meet the requirements that the return value represents a dimensionless number and that its phase is inverse to the ⁇ -th phase. Therefore, it is possible to separate observation signals without giving rise to any permutation when N ⁇ m.
- a is a non-negative constant for preventing division by nil from taking place.
- the unit of Y k ( ⁇ , t) is [x] in the above formulas (50) and (51)
- the quantity of [x] appears for the same number of times (L+1 times) in the numerator and the denominator so that they are offset by each other to make the score functions represent a dimensionless number as a whole (tan h is regarded as a dimensionless number).
- the phase of the return value of each of these formulas is equal to the phase of ⁇ Y k ( ⁇ , t)
- the phase of the return value is inverse relative to the phase of Y k ( ⁇ , t).
- the score functions expressed by the above formulas (50) and (51) meet the requirements that the return value represents a dimensionless number and that its phase is inverse to the ⁇ -th phase.
- the L N norm may be computed only by using the components of top x percent in terms of absolute value instead of using all the components of Y k (t).
- the higher order x % can be determined in advance from the spectrograms of the observation signals.
- An elliptical distribution refers to a multidimensional probability density function that is produced by substituting an arbitrarily selected non-negative function f(x) (where x is a scalar) with the Mahalanobis distance sqrt(x T ⁇ ⁇ 1 x) of the column vector x as shown by formula (58) below
- a multidimensional probability density function as expressed by formula (59) below is obtained by substituting the non-negative function f(x) with Y k (t) and making it multidimensional.
- ⁇ k represents the variance/covariance matrix of Y k (t).
- Formula (60) as shown below is obtained when a score function is derived from the above formula (59).
- ( ⁇ ) ⁇ indicates extraction of the vector and the ⁇ -th row of the matrix in the parenthesis.
- the Mahalanobis distance takes only a non-negative real number if the elements of Y k (t) include a complex number and hence the measure to be taken for the above formula (33) for complex numbers is not necessary.
- the expression of the score function ⁇ k ⁇ (Y k (t)) is modified so as to meet the requirements that the return value represents a dimensionless number and that its phase is inverse to the ⁇ -th phase.
- the score function expressed by the formula (62) above does not meet the requirements that the return value represents a dimensionless number and that its phase is inverse to the ⁇ -th phase.
- the unit of Y k (w, t) is [x]
- the unit of the variance/covariance matrix ⁇ k is [x 2 ] so that the score function has dimensions of [1/x] as a whole.
- the components other than Y k ( ⁇ , t) in Y k (t) are added so that the phase of the return value will be different from ⁇ Y k ( ⁇ , t).
- diag( ⁇ k ) (a matrix formed by the diagonal elements of ⁇ k ) may be used in place of ⁇ k and a general inverse matrix (e.g., a Moore-Penrose type general inverse matrix) may be used in place of the inverse matrix ⁇ k ⁇ 1 .
- an arbitrarily selected multidimensional cumulative distribution function F(x 1 , . . . , x d ) is transformed to the right side of formula (65) shown below by using a d argument function C(x 1 , . . . , x d ) having certain properties and marginal distribution functions F x (x k ) of each argument.
- the C(x 1 , . . . , x d ) is referred to as copula.
- it is possible to establish various multidimensional cumulative distribution functions by combining the copula C(x 1 , . . . , x d ) and the marginal distribution functions F k (x k ).
- Copulas are described, inter alia, in documents such as [“COPULAS” (http://gompertz.math.ualberta.ca/copula.pdf)”], [“The Shape of Neural Dependence” (http://wavelet.psych.wisc.edu/Jenison_Reale_Copula.pdf)] and [“Estimation and Model Selection of Semiparametric Copula-Based Multivariate Dynamic Models Under Copula Misspecification” (http://www.nd.edu/ ⁇ meg/MEG2004/Chen-Xiaohong.pdf)].
- F ( x 1 , . . . , x d ) C ( F 1 ( x 1 ), . . . , F d ( x d )) (65) [Formula 33]
- a probability density function as expressed by formula (66) below is obtained by partially differentiating the above formula (65) of cumulative distribution function (CDF) by means of all the arguments.
- P j (x j ) represents a probability density function of argument x j
- c′ represents the outcome of partial differentiations of the copula by means of all the arguments.
- a score function as expressed by formula (67) below is obtained by partially differentiating the logarithm of the probability density function by means of the ⁇ -th argument. It is a general expression for multidimensional score functions, using a copula.
- F Yk ( ⁇ )( ⁇ ) represents the cumulative distribution function of Y k ( ⁇ , t) and P Yk ( ⁇ )( ⁇ ) represents the probability density function of Y k ( ⁇ , t).
- Various multidimensional score functions can be established by substituting c′( ⁇ ) F Yk ( ⁇ )( ⁇ ) and P Yk ( ⁇ )( ⁇ ) in the formula (67) by specific formulas.
- formula (68) below which is Clayton's copula
- ⁇ is a parameter that shows the dependency among arguments.
- Formula (69) shown below is obtained by partially differentiating the formula (68) by means of all the arguments and formula (70) shown below, which is a score function, is obtained by substituting the above-described formula (67) with it.
- a score function that can cope with complex numbers is obtained by applying the above-described formula (33).
- a probability density function can be expressed by formula (71) below.
- the cumulative distribution function of an exponential distribution can be expressed by formula (72) below. Because of the measure taken by the above-described formula (33) to deal with complex numbers, the argument of the formula (72) may be defined to be non-negative.
- Formula (73) below which is a score function, is obtained by substituting related elements of the above formula (70) with the formulas (71) and (72).
- an L N norm or an elliptical distribution it is possible to apply different distributions to different frequency bins in a score function using a copula.
- a probability density function and a cumulative distribution function in a switched manner depending on if the signal distribution in a frequency bin is super-gaussian or sub-gaussian. This corresponds to using ⁇ [Y k ( ⁇ , t)+tan h ⁇ Y k ( ⁇ , t) ⁇ ] and ⁇ [Y k ( ⁇ , t) ⁇ tan h ⁇ Y k ( ⁇ , t) ⁇ ] in a switched manner for a score function with the above-described extended infomax method.
- formula (74) shown below is provided as probability density function and formula (75) shown below is provided as cumulative distribution function for super-gaussian distributions.
- formula (76) shown below is provided as probability density function and formula (77) shown below, which is referred to as Williams approximation, is provided as cumulative distribution function for sub-gaussian distributions.
- the formulas (74) and (76) are used when the distribution of a frequency bin is super-gaussian, whereas the formulas (75) and (77) are used when the distribution of a frequency bin is sub-gaussian.
- Formula (78) shown below expresses a score function that is established in this way.
- g(x) is a function that meets the requirements i) through iv) listed below.
- g(x) is a constant, a monotone increasing function or a monotone decreasing function for x ⁇ 0.
- g(x) converges to a position value for x ⁇ when g(x) is a monotone increasing function or a monotone decreasing function.
- g(x) is a dimensionless number for x.
- Formulas (79) through (83) are examples of g(x) that can successfully be used for separation of observation signals.
- the constant terms are defined so as to meet the above requirements of i) through iii).
- Formula (84) below expresses a more generalized score function.
- the score function is a function expressed as a product of multiplication of function f(Y k (t)) where vector Y k (t) represents arguments, function g (Y k ( ⁇ , t)) where scalar Y k ( ⁇ , t) represents arguments and term ⁇ Y k ( ⁇ , t) for determining the phase of the return value.
- f(Y k (t)) and g (Y k ( ⁇ , t)) are so defined that the their product of multiplication meets the requirements of v) and vi) listed below for any Y k (t) and Y k ( ⁇ , t).
- the phase of the score function is same with ⁇ Y k ( ⁇ , t) so that the requirement that the phase of the return value of the score function is inverse relative to the ⁇ -th phase. Additionally, the dimensions are offset by Y k ( ⁇ , t) due to the requirement of vi) so that the requirement that the score function represents a dimensionless number is satisfied.
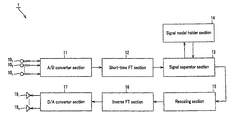
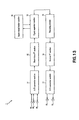
- FIG. 13 is a schematic block diagram of the embodiment of audio signal separation apparatus according to the invention.
- n microphones 10 1 through 10 n are adapted to observe the independent sounds emitted from n audio sources and an A/D (analog/digital) converter section 11 performs A/D conversions on the signals of the independent sounds to obtain observation signals.
- a short-time Fourier transformation section 12 performs a short-time Fourier transformation on the observation signals to generate spectrograms of the observation signals.
- a signal separator section 13 separates the spectrograms of the observation signal into spectrograms that are based on independent signals by utilizing signal models held in a signal model holder section 14 .
- a signal model refers to a multidimensional probability density function as described above and is used to computationally determine the entropy of each isolated signal in the separation process. Note, however, that it is not necessary for the signal model holder section 14 to hold multidimensional probability density functions and it is sufficient for it to hold score functions obtained by partially differentiating the logarithms of the probability density function by means of arguments.
- a rescaling section 15 operates to provide a unified scale to each frequency bin of the spectrograms of the isolated signals. If a normalization process (averaging and/or variance adjusting process) has been executed on the observation signals before the separation process, it operates to undo the process.
- An inverse Fourier transformation section 16 transforms the spectrograms of the isolated signals into isolated signals in the time domain by means of inverse Fourier transformation.
- a D/A converter section 17 performs D/A conversions on the isolated signals in the time domain and n speakers 18 1 through 18 n reproduce sounds independently.
- the audio signal separation apparatus 1 is adapted to reproduce sounds by means of n speakers 18 1 through 18 n it is also possible to output the isolated signals so as to be used for speech recognition or for some other purpose. Then, if appropriate, the inverse Fourier transformation may be omitted.
- Step S 1 the apparatus observes the audio signals by way of the microphones and, in Step S 2 , performs a short-time Fourier transformation on the observation signals to obtain spectrograms.
- Step S 3 the apparatus standardizes the spectrograms of the observation signals for the frequency bins of each channel.
- the normalization is an operation of making the average and the standard deviation of the frequency bins respectively equal to 0 and 1.
- the average can be made equal to 0 by subtraction of the average value of each frequency bin and the standard deviation can be made equal to 1 by division of the average value by the standard deviation.
- a spherical distribution is used as multidimensional probability density function
- it is also possible to use some other technique for the purpose of standardization. More specifically, after making the average of each frequency bin equal to 0, the standard deviation is determined in 1 ⁇ t ⁇ T of the vector norm ⁇ Y k (t) ⁇ and Y k , is divided by the determined value for standardization. If the observation signals after normalization are expressed by X′, all the standardizations can be expressed by X′ P(X ⁇ ), where P represents the diagonal matrix of the reciprocals of the standard deviations and ⁇ represents the vector of the average value of each frequency bin.
- Step S 4 a separation process is executed on the standardized observation signals. More specifically, a separation matrix W and isolated signals Y are determined.
- the processing operation of Step S 4 will be described in greater detail hereinafter. While the isolated signals Y obtained in Step S 4 are free from permutation, they show different scales for frequency bins. Therefore, a rescaling operation is conducted in Step S 5 to unify the scales to provide a unified scale to each frequency bin. The operation of restoring the average and the standard deviation that are modified in the normalization process is also conducted here. The processing operation of Step S 5 will also be described in greater detail hereinafter. Then, subsequent to the rescaling operation, the isolated signals are transformed into isolated signal in the time domain by means of inverse Fourier transformation in Step S 6 and reproduced from the speakers in Step S 7 .
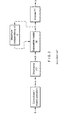
- FIG. 15 shows a flowchart for a batch process
- FIG. 16 shows a flowchart for an online process. All the signals are collectively processed in a batch process, whereas each sample (a frame in the independent component analysis in the time-frequency domain) is processed when it is input on a sequential basis. Note that X(t) in FIGS. 15 and 16 represents standardized signals and corresponds to X′(t) in FIG. 14 .
- Step S 11 the separation matrix W is substituted by an initial value. It may be substituted by a unit matrix or all the W( ⁇ ) of the above-described formula (21) may be substituted by a common matrix.
- Step S 12 it is determined if W converges or not and the process is terminated if it converges but made to proceed to Step S 13 if it does not converge.
- Step S 13 the isolated signals Y at the current time are computationally determined and, in Step S 14 , ⁇ W is computationally determined according to the above-described formula (32). Since ⁇ W is computed for each frequency bin, the loop of ⁇ to is followed and the above formula (32) is applied to each ⁇ . After determining ⁇ W, W is updated in Step S 15 and the processing operation returns to Step S 12 .
- Steps S 13 and S 15 in FIG. 15 While the outside of the frequency bin loop is assumed in Steps S 13 and S 15 in FIG. 15 , the processing operations in these steps may be moved to the inside of the frequency bin loop and the computational operations of Steps S 103 and S 105 in FIG. 6 , which is described earlier, may alternatively be used. While the processing operation of updating W is conducted until W converges in FIG. 15 , it may alternatively be repeated for a predetermined number of times that is sufficiently large.
- Step S 21 the separation matrix W is substituted by an initial value.
- Step S 22 it is determined if W converges or not and the process is terminated if it converges but made to proceed to Step S 23 if it does not converge.
- Step S 23 the isolated signals Y at the current time are computationally determined and, in Step S 24 , ⁇ W is computationally determined.
- the averaging operation Et[ ⁇ ] is eliminated from the formula for updating ⁇ W.
- W is updated in Step S 25 .
- the processing operations from Step S 22 to Step S 25 are repeated for all the frames, following the loop of ⁇ for each frame.
- ⁇ in Step S 24 may have a fixed value (e.g., 0.1). Alternatively, it may be so adjusted as to become smaller as the frame number t increases. If it is adjusted to become smaller with the increase of the frame number, preferably the rate of convergence of W is raised by selecting a large value (e.g., 1) for ⁇ for smaller frame numbers but a small value is selected for ⁇ for larger frame numbers in order to prevent abrupt fluctuations in the isolated signals.
- a large value e.g., 1
- Step S 5 ( FIG. 14 ) will be described further by referring to FIG. 17 .
- the rescaling process is conducted for each frequency bin.
- a rescaling operation is conducted for all the frequency bins by using W, X, Y and the like in the above-described formula (13).
- the separation matrix W is determined at the time when the separation process of Step S 4 ( FIG. 14 ) is completed. Therefore, in Step S 31 , W is multiplied by the observation signals X′(t) to obtain isolated signals Y′(t).
- P in Step S 31 represents a variance normalization matrix.
- P ⁇ is added to X′(t) in order to restore the original observation signals, of which the average is made equal to 0 in Step S 3 ( FIG. 14 ). The scaling problem is not dissolved at this stage.
- Step S 32 the scaling problem is dissolved by estimating the observation signal of each audio source from the isolated signals. Now, the principle of the operation will be described below.
- observation signal of each audio source is obtained by convoluting the transfer function relative to the signal of the audio source k down to each microphone.
- the observation signal of each audio source is free from indefiniteness of scaling for the reason as described below.
- signals Y′ are expressed by using vectors Y 1 (t) through Y n (t) of each channel as shown at the left side of the above-described formula (14).
- vectors are prepared by replacing all the elements other than Y k (t) in Y′ with 0 vectors. They are expressed by Y Yk (t).
- Y Yk (t) corresponds to a situation where only the audio source k is sounding in FIG. 1 .
- X Yk (t) includes the observation signals of all the microphones like the second term of the right side of the above-described formula (14).
- X Yk (t) may be used or only the observation signal of a specific microphone (e.g., the first microphone) may be extracted.
- the signal power of each microphone may be computationally determined and the signal with the largest power may be extracted. All these operations subsequently correspond to the use of a signal observed at the microphone that is located closest to the audio source.
- the audio signal separation apparatus 1 of this embodiment it is possible to dissolve the problem of permutation without conducting a post processing operation after the signal separation by computing the entropy of a single spectrogram by means of a multidimensional probability density function instead of computing the entropy of each and every frequency bin by means of a one-dimensional probability density function.
- the observation signals are the initial 32,000 samples of the file “X_rms2.wav” and the sampling frequency is 16 kHz.
- the observation signals are the initial 40,000 samples of the file “X_rms2.wav” and the sampling frequency is 16 kHz.
- a Hanning window with a length of 512 is used with a shifting width of 128 in the short-time Fourier transformation. While permutation appears in the outcome of the separation process as indicated by arrows in FIG.
- the observation signals, the sampling frequency and other factors are the same as those of FIG. 18 . In this case again, practically no permutation is observable in the outcome of the separation process although no post-processing operation is involved.
- the verification process proceeds in the following way. Firstly, spectrograms as shown in FIG. 18 are prepared and the KL information quantity of each of the states in FIG. 18 is computationally determined by using the above formula (17).
- the second and third terms of the formula (17) can be regarded as so many constants and hence are not influenced by the presence or absence of permutation so that they may be reduced to nil in the experiment.
- a frequency bin is arbitrarily selected and the data of the frequency bin are exchanged among the channels. In other words, permutation is artificially produced.
- the KL information quantity is computationally determined by using the above formula (17).
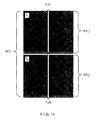
- FIGS. 21A through 21E illustrate the process in five different steps.
- FIGS. 21A through 21E show states where the data of the frequency bins are switched by 0%, 25%, 50%, 75% and 100% respectively.
- a graph as shown in FIG. 22 is obtained by plotting the KL information quantity for each number of times of operation (which is the number of switched frequency bins) after the processing operation.
- the descending order of the size of the signal components of (a) refers to the order of the magnitude of the value of D( ⁇ ) that is computed for each frequency bin (each ⁇ ) by means of formula (85) shown below. Also note that FIG. 21 is obtained by following this order.
- a frequency bin where practically no signal exists (and hence only components that are close to nil exist) throughout all the channels does not practically influence signal separation in the time domain regardless if the separation succeeds or not. Therefore, such frequency bins can be omitted to reduce the magnitude of data of the spectrogram and hence the computational complexity and raise the speed of progress of the separation process.
- the absolute value of each signal of each frequency bin may be determined to be greater than a predetermined threshold value or not and a frequency bin, if any, where the absolute values of the signals are smaller than the threshold value for all the frames and all the channels is judged to be free from any signal and eliminated from the spectrogram.
- each and every frequency bin that is eliminated needs to be recorded in terms of the order of arrangement so that it may be restored whenever necessary.
- the spectrogram that are produced after eliminating the frequency bins has M-m frequency bins.
- the intensity of signal is computationally determined for each frequency bin typically by means of the above formula (59) and the M-m strongest frequency bins are adopted (and the m weaker frequency bins are eliminated.
- the resultant spectrogram is subjected to a normalization process, a separation process and a resealing process. Then, the eliminated frequency bins are put back. Vectors having components that are all equal to 0 may be used instead of putting back the eliminated signals. Then, isolated signals can be obtained in the time domain by subjecting the signals to inverse Fourier transformation.
- the present invention is applicable to situations where the number of microphones is greater than that of audio sources.
- the number of microphones can be reduced to the number of audio sources typically by using the technique of, for example, principal component analysis (PCA).
- PCA principal component analysis
- ⁇ W( ⁇ ) may alternatively be determined by means of a non-holonomic algorithm for the purpose of the present invention.
- Formula (86) below is an updating formula for ⁇ W( ⁇ ) that is based on an non-holonomic algorithm. It is possible to prevent any overflow from taking place during the operation of computing W because W is made to vary only in an orthogonal direction.
- ⁇ W ( ⁇ ) ⁇ E 1 [ ⁇ ⁇ ( Y ( t )) Y ( ⁇ , t ) H ⁇ diag( ⁇ ⁇ ( Y ( t )) Y ( ⁇ , t ) H )] ⁇ W ( ⁇ ) (86)
Landscapes
- Engineering & Computer Science (AREA)
- Acoustics & Sound (AREA)
- Health & Medical Sciences (AREA)
- General Health & Medical Sciences (AREA)
- Otolaryngology (AREA)
- Physics & Mathematics (AREA)
- Architecture (AREA)
- Signal Processing (AREA)
- Mechanical Engineering (AREA)
- Civil Engineering (AREA)
- Structural Engineering (AREA)
- Circuit For Audible Band Transducer (AREA)
- Complex Calculations (AREA)
- Measurement Of Mechanical Vibrations Or Ultrasonic Waves (AREA)
Applications Claiming Priority (4)
| Application Number | Priority Date | Filing Date | Title |
|---|---|---|---|
| JP2005018822 | 2005-01-26 | ||
| JP2005-018822 | 2005-01-26 | ||
| JP2005-269128 | 2005-09-15 | ||
| JP2005269128A JP4449871B2 (ja) | 2005-01-26 | 2005-09-15 | 音声信号分離装置及び方法 |
Publications (2)
| Publication Number | Publication Date |
|---|---|
| US20060206315A1 US20060206315A1 (en) | 2006-09-14 |
| US8139788B2 true US8139788B2 (en) | 2012-03-20 |
Family
ID=36218181
Family Applications (1)
| Application Number | Title | Priority Date | Filing Date |
|---|---|---|---|
| US11/338,267 Expired - Fee Related US8139788B2 (en) | 2005-01-26 | 2006-01-24 | Apparatus and method for separating audio signals |
Country Status (5)
| Country | Link |
|---|---|
| US (1) | US8139788B2 (ko) |
| EP (1) | EP1686831A3 (ko) |
| JP (1) | JP4449871B2 (ko) |
| KR (1) | KR101197407B1 (ko) |
| CN (1) | CN1855227B (ko) |
Cited By (6)
| Publication number | Priority date | Publication date | Assignee | Title |
|---|---|---|---|---|
| US20130121506A1 (en) * | 2011-09-23 | 2013-05-16 | Gautham J. Mysore | Online Source Separation |
| US20140328487A1 (en) * | 2013-05-02 | 2014-11-06 | Sony Corporation | Sound signal processing apparatus, sound signal processing method, and program |
| US20150086038A1 (en) * | 2013-09-24 | 2015-03-26 | Analog Devices, Inc. | Time-frequency directional processing of audio signals |
| US9460732B2 (en) | 2013-02-13 | 2016-10-04 | Analog Devices, Inc. | Signal source separation |
| CN107894965A (zh) * | 2017-11-30 | 2018-04-10 | 陕西师范大学 | 一种用于两组不同类型信号的耦合处理方法 |
| US11373672B2 (en) | 2016-06-14 | 2022-06-28 | The Trustees Of Columbia University In The City Of New York | Systems and methods for speech separation and neural decoding of attentional selection in multi-speaker environments |
Families Citing this family (30)
| Publication number | Priority date | Publication date | Assignee | Title |
|---|---|---|---|---|
| US7558765B2 (en) | 2005-01-14 | 2009-07-07 | Ultra-Scan Corporation | Multimodal fusion decision logic system using copula model |
| US8190540B2 (en) * | 2005-01-14 | 2012-05-29 | Ultra-Scan Corporation | Multimodal fusion decision logic system for determining whether to accept a specimen |
| JP4556875B2 (ja) * | 2006-01-18 | 2010-10-06 | ソニー株式会社 | 音声信号分離装置及び方法 |
| WO2007100330A1 (en) * | 2006-03-01 | 2007-09-07 | The Regents Of The University Of California | Systems and methods for blind source signal separation |
| WO2007108492A1 (ja) * | 2006-03-21 | 2007-09-27 | Advantest Corporation | 確率密度関数分離装置、確率密度関数分離方法、ノイズ分離装置、ノイズ分離方法、試験装置、試験方法、算出装置、算出方法、プログラム、及び記録媒体 |
| JP4946330B2 (ja) * | 2006-10-03 | 2012-06-06 | ソニー株式会社 | 信号分離装置及び方法 |
| JP5070860B2 (ja) | 2007-01-31 | 2012-11-14 | ソニー株式会社 | 情報処理装置、および情報処理方法、並びにコンピュータ・プログラム |
| JP4403436B2 (ja) * | 2007-02-21 | 2010-01-27 | ソニー株式会社 | 信号分離装置、および信号分離方法、並びにコンピュータ・プログラム |
| US20080228470A1 (en) * | 2007-02-21 | 2008-09-18 | Atsuo Hiroe | Signal separating device, signal separating method, and computer program |
| WO2009032020A1 (en) * | 2007-09-07 | 2009-03-12 | Ultra-Scan Corporation | Multimodal fusion decision logic system using copula model |
| GB0720473D0 (en) * | 2007-10-19 | 2007-11-28 | Univ Surrey | Accoustic source separation |
| JP5195652B2 (ja) | 2008-06-11 | 2013-05-08 | ソニー株式会社 | 信号処理装置、および信号処理方法、並びにプログラム |
| US8392185B2 (en) * | 2008-08-20 | 2013-03-05 | Honda Motor Co., Ltd. | Speech recognition system and method for generating a mask of the system |
| JP5229053B2 (ja) | 2009-03-30 | 2013-07-03 | ソニー株式会社 | 信号処理装置、および信号処理方法、並びにプログラム |
| JP5129794B2 (ja) * | 2009-08-11 | 2013-01-30 | 日本電信電話株式会社 | 目的信号強調装置とその方法と、プログラム |
| JP2011107603A (ja) * | 2009-11-20 | 2011-06-02 | Sony Corp | 音声認識装置、および音声認識方法、並びにプログラム |
| JP5299233B2 (ja) | 2009-11-20 | 2013-09-25 | ソニー株式会社 | 信号処理装置、および信号処理方法、並びにプログラム |
| JP2012234150A (ja) * | 2011-04-18 | 2012-11-29 | Sony Corp | 音信号処理装置、および音信号処理方法、並びにプログラム |
| PT105880B (pt) * | 2011-09-06 | 2014-04-17 | Univ Do Algarve | Cancelamento controlado de ruído predominantemente multiplicativo em sinais no espaço tempo-frequência |
| KR101474321B1 (ko) * | 2012-06-29 | 2014-12-30 | 한국과학기술원 | 암묵신호 분리에서의 순열/비례 문제 해결장치 및 그 방법 |
| JP6005443B2 (ja) | 2012-08-23 | 2016-10-12 | 株式会社東芝 | 信号処理装置、方法及びプログラム |
| CN104021797A (zh) * | 2014-06-19 | 2014-09-03 | 南昌大学 | 一种基于频域稀疏约束的语音信号增强方法 |
| CN105989851B (zh) * | 2015-02-15 | 2021-05-07 | 杜比实验室特许公司 | 音频源分离 |
| CN106297820A (zh) | 2015-05-14 | 2017-01-04 | 杜比实验室特许公司 | 具有基于迭代加权的源方向确定的音频源分离 |
| EP3293733A1 (en) * | 2016-09-09 | 2018-03-14 | Thomson Licensing | Method for encoding signals, method for separating signals in a mixture, corresponding computer program products, devices and bitstream |
| JP6472823B2 (ja) * | 2017-03-21 | 2019-02-20 | 株式会社東芝 | 信号処理装置、信号処理方法および属性付与装置 |
| KR101940548B1 (ko) | 2018-04-03 | 2019-01-21 | (주)성림산업 | 컨테이너 백 |
| CN110059757B (zh) * | 2019-04-23 | 2021-04-09 | 北京邮电大学 | 混合信号的分类方法、装置及电子设备 |
| CN111009256B (zh) | 2019-12-17 | 2022-12-27 | 北京小米智能科技有限公司 | 一种音频信号处理方法、装置、终端及存储介质 |
| CN112697270B (zh) * | 2020-12-07 | 2023-07-18 | 广州极飞科技股份有限公司 | 故障检测方法、装置、无人设备及存储介质 |
Citations (4)
| Publication number | Priority date | Publication date | Assignee | Title |
|---|---|---|---|---|
| US5706402A (en) * | 1994-11-29 | 1998-01-06 | The Salk Institute For Biological Studies | Blind signal processing system employing information maximization to recover unknown signals through unsupervised minimization of output redundancy |
| US5959966A (en) * | 1997-06-02 | 1999-09-28 | Motorola, Inc. | Methods and apparatus for blind separation of radio signals |
| US6185309B1 (en) * | 1997-07-11 | 2001-02-06 | The Regents Of The University Of California | Method and apparatus for blind separation of mixed and convolved sources |
| US7315816B2 (en) * | 2002-05-10 | 2008-01-01 | Zaidanhouzin Kitakyushu Sangyou Gakujutsu Suishin Kikou | Recovering method of target speech based on split spectra using sound sources' locational information |
Family Cites Families (6)
| Publication number | Priority date | Publication date | Assignee | Title |
|---|---|---|---|---|
| US6691073B1 (en) * | 1998-06-18 | 2004-02-10 | Clarity Technologies Inc. | Adaptive state space signal separation, discrimination and recovery |
| JP3887192B2 (ja) | 2001-09-14 | 2007-02-28 | 日本電信電話株式会社 | 独立成分分析方法及び装置並びに独立成分分析プログラム及びそのプログラムを記録した記録媒体 |
| JP3975153B2 (ja) | 2002-10-28 | 2007-09-12 | 日本電信電話株式会社 | ブラインド信号分離方法及び装置、ブラインド信号分離プログラム並びにそのプログラムを記録した記録媒体 |
| JP3949074B2 (ja) | 2003-03-31 | 2007-07-25 | 日本電信電話株式会社 | 目的信号抽出方法及びその装置、目的信号抽出プログラム及びその記録媒体 |
| JP4496379B2 (ja) | 2003-09-17 | 2010-07-07 | 財団法人北九州産業学術推進機構 | 分割スペクトル系列の振幅頻度分布の形状に基づく目的音声の復元方法 |
| JP4556875B2 (ja) | 2006-01-18 | 2010-10-06 | ソニー株式会社 | 音声信号分離装置及び方法 |
-
2005
- 2005-09-15 JP JP2005269128A patent/JP4449871B2/ja not_active Expired - Fee Related
-
2006
- 2006-01-24 US US11/338,267 patent/US8139788B2/en not_active Expired - Fee Related
- 2006-01-25 KR KR1020060007616A patent/KR101197407B1/ko not_active IP Right Cessation
- 2006-01-25 EP EP06250401A patent/EP1686831A3/en not_active Withdrawn
- 2006-01-26 CN CN2006100711988A patent/CN1855227B/zh not_active Expired - Fee Related
Patent Citations (4)
| Publication number | Priority date | Publication date | Assignee | Title |
|---|---|---|---|---|
| US5706402A (en) * | 1994-11-29 | 1998-01-06 | The Salk Institute For Biological Studies | Blind signal processing system employing information maximization to recover unknown signals through unsupervised minimization of output redundancy |
| US5959966A (en) * | 1997-06-02 | 1999-09-28 | Motorola, Inc. | Methods and apparatus for blind separation of radio signals |
| US6185309B1 (en) * | 1997-07-11 | 2001-02-06 | The Regents Of The University Of California | Method and apparatus for blind separation of mixed and convolved sources |
| US7315816B2 (en) * | 2002-05-10 | 2008-01-01 | Zaidanhouzin Kitakyushu Sangyou Gakujutsu Suishin Kikou | Recovering method of target speech based on split spectra using sound sources' locational information |
Non-Patent Citations (4)
| Title |
|---|
| Hiroshi Saruwatari, Toshiya Kawamura, and Kiyohiro Shikano Fast-Convergence Algorithm for ICA-Based Blind Source Separation Using Array Signal Processing Oct. 21-24, 2001, IEEE Workshop on Application of Signal Processing to Audio and Acoustics 2001. * |
| Mitianoudis et al, "Audio Source Separation of Convolutive Mixtures", IEEE Transactions on Speech and Audio Processing, vol. 11, No. 5, Sep. 2003. * |
| Saruwatari et al "Fast-Convergence Algorithm for ICA-Based Blind Source Separation Using Array Signal Processing", IEEE Workshop on Applications of Signal Processing to Audio and Acoustics, Oct. 21-24, 2001, p. 91-94. * |
| Zibulevsky et al "Blind Source Separation by Sparse Decomposition", Nov. 21, 2001, pp. 1-22, University of New Mexico. * |
Cited By (10)
| Publication number | Priority date | Publication date | Assignee | Title |
|---|---|---|---|---|
| US20130121506A1 (en) * | 2011-09-23 | 2013-05-16 | Gautham J. Mysore | Online Source Separation |
| US9966088B2 (en) * | 2011-09-23 | 2018-05-08 | Adobe Systems Incorporated | Online source separation |
| US9460732B2 (en) | 2013-02-13 | 2016-10-04 | Analog Devices, Inc. | Signal source separation |
| US20140328487A1 (en) * | 2013-05-02 | 2014-11-06 | Sony Corporation | Sound signal processing apparatus, sound signal processing method, and program |
| US9357298B2 (en) * | 2013-05-02 | 2016-05-31 | Sony Corporation | Sound signal processing apparatus, sound signal processing method, and program |
| US20150086038A1 (en) * | 2013-09-24 | 2015-03-26 | Analog Devices, Inc. | Time-frequency directional processing of audio signals |
| US9420368B2 (en) * | 2013-09-24 | 2016-08-16 | Analog Devices, Inc. | Time-frequency directional processing of audio signals |
| US11373672B2 (en) | 2016-06-14 | 2022-06-28 | The Trustees Of Columbia University In The City Of New York | Systems and methods for speech separation and neural decoding of attentional selection in multi-speaker environments |
| US11961533B2 (en) | 2016-06-14 | 2024-04-16 | The Trustees Of Columbia University In The City Of New York | Systems and methods for speech separation and neural decoding of attentional selection in multi-speaker environments |
| CN107894965A (zh) * | 2017-11-30 | 2018-04-10 | 陕西师范大学 | 一种用于两组不同类型信号的耦合处理方法 |
Also Published As
| Publication number | Publication date |
|---|---|
| EP1686831A2 (en) | 2006-08-02 |
| EP1686831A3 (en) | 2012-10-31 |
| KR20060086303A (ko) | 2006-07-31 |
| JP2006238409A (ja) | 2006-09-07 |
| JP4449871B2 (ja) | 2010-04-14 |
| KR101197407B1 (ko) | 2012-11-05 |
| CN1855227A (zh) | 2006-11-01 |
| US20060206315A1 (en) | 2006-09-14 |
| CN1855227B (zh) | 2010-08-11 |
Similar Documents
| Publication | Publication Date | Title |
|---|---|---|
| US8139788B2 (en) | Apparatus and method for separating audio signals | |
| JP4556875B2 (ja) | 音声信号分離装置及び方法 | |
| Kim et al. | Independent vector analysis: Definition and algorithms | |
| US8751227B2 (en) | Acoustic model learning device and speech recognition device | |
| Sekiguchi et al. | Bayesian multichannel speech enhancement with a deep speech prior | |
| US20060277035A1 (en) | Audio signal separation device and method thereof | |
| WO2017094862A1 (ja) | 空間相関行列推定装置、空間相関行列推定方法および空間相関行列推定プログラム | |
| WO2006085537A1 (ja) | 信号分離装置、信号分離方法、信号分離プログラム及び記録媒体 | |
| US10373628B2 (en) | Signal processing system, signal processing method, and computer program product | |
| US10878832B2 (en) | Mask estimation apparatus, mask estimation method, and mask estimation program | |
| JP2011215317A (ja) | 信号処理装置、および信号処理方法、並びにプログラム | |
| Huang et al. | An energy-constrained signal subspace method for speech enhancement and recognition in white and colored noises | |
| US11423924B2 (en) | Signal analysis device for modeling spatial characteristics of source signals, signal analysis method, and recording medium | |
| Yoshii et al. | Independent low-rank tensor analysis for audio source separation | |
| Ito et al. | FastFCA: Joint diagonalization based acceleration of audio source separation using a full-rank spatial covariance model | |
| Kubo et al. | Efficient full-rank spatial covariance estimation using independent low-rank matrix analysis for blind source separation | |
| Nesta et al. | Robust Automatic Speech Recognition through On-line Semi Blind Signal Extraction | |
| KR20110012946A (ko) | 소리의 복원 방법, 소리의 복원 방법을 기록한 기록매체 및 소리의 복원 방법을 수행하는 장치 | |
| JP6448567B2 (ja) | 音響信号解析装置、音響信号解析方法、及びプログラム | |
| JP4946330B2 (ja) | 信号分離装置及び方法 | |
| Nakashima et al. | Faster independent low-rank matrix analysis with pairwise updates of demixing vectors | |
| Arberet et al. | A tractable framework for estimating and combining spectral source models for audio source separation | |
| US10839823B2 (en) | Sound source separating device, sound source separating method, and program | |
| CN113241090A (zh) | 一种基于最小体积约束的多通道盲声源分离方法 | |
| Tanji et al. | A generalization of Laplace nonnegative matrix factorization and its multichannel extension |
Legal Events
| Date | Code | Title | Description |
|---|---|---|---|
| AS | Assignment |
Owner name: SONY CORPORATION, JAPAN Free format text: ASSIGNMENT OF ASSIGNORS INTEREST;ASSIGNORS:HIROE, ATSUO;YAMADA, KEIICHI;LUCKE, HELMUT;SIGNING DATES FROM 20060313 TO 20060421;REEL/FRAME:017893/0043 Owner name: SONY CORPORATION, JAPAN Free format text: ASSIGNMENT OF ASSIGNORS INTEREST;ASSIGNORS:HIROE, ATSUO;YAMADA, KEIICHI;LUCKE, HELMUT;REEL/FRAME:017893/0043;SIGNING DATES FROM 20060313 TO 20060421 |
|
| FEPP | Fee payment procedure |
Free format text: PAYOR NUMBER ASSIGNED (ORIGINAL EVENT CODE: ASPN); ENTITY STATUS OF PATENT OWNER: LARGE ENTITY |
|
| REMI | Maintenance fee reminder mailed | ||
| LAPS | Lapse for failure to pay maintenance fees | ||
| STCH | Information on status: patent discontinuation |
Free format text: PATENT EXPIRED DUE TO NONPAYMENT OF MAINTENANCE FEES UNDER 37 CFR 1.362 |
|
| FP | Lapsed due to failure to pay maintenance fee |
Effective date: 20160320 |