US7854488B2 - Dot measurement method and apparatus - Google Patents
Dot measurement method and apparatus Download PDFInfo
- Publication number
- US7854488B2 US7854488B2 US12/138,211 US13821108A US7854488B2 US 7854488 B2 US7854488 B2 US 7854488B2 US 13821108 A US13821108 A US 13821108A US 7854488 B2 US7854488 B2 US 7854488B2
- Authority
- US
- United States
- Prior art keywords
- line
- positions
- line patterns
- patterns
- edge
- Prior art date
- Legal status (The legal status is an assumption and is not a legal conclusion. Google has not performed a legal analysis and makes no representation as to the accuracy of the status listed.)
- Expired - Fee Related, expires
Links
Images


Classifications
-
- B—PERFORMING OPERATIONS; TRANSPORTING
- B41—PRINTING; LINING MACHINES; TYPEWRITERS; STAMPS
- B41J—TYPEWRITERS; SELECTIVE PRINTING MECHANISMS, i.e. MECHANISMS PRINTING OTHERWISE THAN FROM A FORME; CORRECTION OF TYPOGRAPHICAL ERRORS
- B41J29/00—Details of, or accessories for, typewriters or selective printing mechanisms not otherwise provided for
- B41J29/38—Drives, motors, controls or automatic cut-off devices for the entire printing mechanism
- B41J29/393—Devices for controlling or analysing the entire machine ; Controlling or analysing mechanical parameters involving printing of test patterns
Definitions
- the present invention relates to a dot measurement method and apparatus, and more particularly to technology for measuring positions and diameters of deposited dots formed by droplets ejected from a liquid ejection head, typically, an inkjet head, or for measuring the volume of the ejected liquid droplets.
- Japanese Patent Application Publication No. 2006-284406 proposes technology for determining deposition position displacement of dots formed by droplets ejected from a liquid ejection head. According to Japanese Patent Application Publication No. 2006-284406, the positions of isolated dots are measured by ejecting droplets to form isolated dots from the nozzles of a head, capturing an image of the droplet ejection result, calculating the straight line (path) traced by the respective dots, and then comparing with a reference straight line.
- Japanese Patent Application Publication No. 10-230593 discloses technology for determining the ejection volume from nozzles, by forming a line pattern by means of ink and reading in the whole of the line pattern by means of an imaging element, and consequently calculating the density (integrated density) on a certain surface area and determining the ejection volume of the ink used in the line pattern on the basis of the density thus calculated.
- Japanese Patent Application Publication No. 2006-284406 is aimed at measuring the positions of isolated dots that are formed by droplets ejected from respective nozzles and are not connected with the other dots, and therefore the imaging apparatus (image reading apparatus) which reads in the isolated dots is required to have extremely high resolution corresponding to the dot diameter. More specifically, an imaging resolution which is approximately the same as the measurement accuracy of the isolated dots (for example, an accuracy of the order of 1 ⁇ m or less) is required, or alternatively, imaging has to be carried out at a high resolution which allows the edge of one dot to be captured clearly. Furthermore, the technology described in Japanese Patent Application Publication No. 2006-284406 principally calculates the dot deposition positions (dot positions), and cannot simultaneously calculate the dot diameter.
- Japanese Patent Application Publication No. 10-230593 is aimed at measuring the ink ejection volume, and cannot simultaneously measure the deposition positions of the dots formed by droplets ejected from the nozzles.
- the present invention has been contrived in view of these circumstances, an object thereof being to provide a dot measurement method and apparatus, and a computer readable medium used in same, whereby dot positions and dot diameters can be measured simultaneously with an accuracy (for example, an accuracy of the order of 1 ⁇ m) which is approximately the same as the accuracy of measuring isolated dots, even when using an imaging apparatus having a resolution (for example, approximately 5 ⁇ m per pixel) which is lower than the high resolution required for the imaging of isolated dots (for example, 1 ⁇ m per pixel).
- an accuracy for example, an accuracy of the order of 1 ⁇ m
- an imaging apparatus having a resolution (for example, approximately 5 ⁇ m per pixel) which is lower than the high resolution required for the imaging of isolated dots (for example, 1 ⁇ m per pixel).
- the present invention is directed to a dot measurement method of measuring at least one of a diameter of dots and an ejection volume of droplets of liquid ejected through nozzles arranged in a liquid ejection head, the ejected droplets being deposited on an ejection receiving medium to form the dots on the ejection receiving medium, the method comprising: a line pattern forming step of forming line patterns on the ejection receiving medium by ejecting and depositing the droplets on the ejection receiving medium through the nozzles while the liquid ejection head and the ejection receiving medium are being moved relatively to each other, each of the line patterns being parallel with a line direction and constituted of a row of the dots corresponding to one of the nozzles; a pattern reading step of capturing an image of the line patterns by means of an imaging apparatus including photoreceptors to acquire electronic image data representing the image of the line patterns, the photoreceptors of the imaging apparatus being aligned in a row that oblique
- the present invention is also directed to a dot measurement apparatus which measures at least one of a diameter of dots and an ejection volume of droplets of liquid ejected through nozzles arranged in a liquid ejection head, the ejected droplets being deposited on an ejection receiving medium to form the dots on the ejection receiving medium
- the dot measurement apparatus comprising: a pattern reading device which includes an imaging apparatus capturing an image of line patterns on the ejection receiving medium to acquire electronic image data representing the image of the line patterns, the line patterns being formed by ejecting and depositing the droplets on the ejection receiving medium through the nozzles while the liquid ejection head and the ejection receiving medium are being moved relatively to each other, each of the line patterns being parallel with a line direction and constituted of a row of the dots corresponding to one of the nozzles, the imaging apparatus including photoreceptors that are aligned in a row that obliquely intersects with the line direction of the line patterns at
- the present invention is also directed to a computer readable medium storing instructions causing a computer to function as the profile graph acquiring device, the characteristic position calculating device, the approximation line calculating device, the deposition position calculating device, the line width calculating device, the correlation information storing device, and the measurement value calculating device in the above-described dot measurement apparatus.
- the present invention it is possible to determine the dot deposition positions and the dot diameter simultaneously (from the same captured image). Therefore, it is possible to minimize (reduce to one time) the formation of line patterns (a sample chart) for measurement and the imaging of same. Furthermore, in comparison with a method used in the related art, it is possible to achieve measurement of higher accuracy with an imaging apparatus of low resolution, and therefore the data size of the captured image can be reduced, the processing time can be shortened, and the reading time can also be shortened.
- FIG. 1 is a general schematic drawing of an inkjet recording apparatus
- FIGS. 2A and 2B are plan view perspective diagrams showing an example of the composition of a print head
- FIG. 3 is a plan view perspective diagram showing a further example of the composition of a full line head
- FIG. 4 is a cross-sectional view along line 4 - 4 in FIGS. 2A and 2B ;
- FIG. 5 is an enlarged diagram showing an example of the arrangement of nozzles in a head
- FIG. 6 is a block diagram showing the system composition of the inkjet recording apparatus
- FIG. 7 is a schematic drawing showing irregularities in line patterns caused by nozzle characteristics
- FIG. 8 is a diagram showing a first example of a measurement sample chart
- FIG. 9 is a diagram showing the relationship between a line sensor and a line pattern
- FIG. 10 is a diagram showing the positional relationship between a sample chart and the pixel pattern of a captured image
- FIG. 11 is an illustrative diagram of the relationship between a profile graph and a one-dimensional pixel row which traverses the line pattern;
- FIG. 12 is a diagram showing an example of a profile graph
- FIG. 13 is a diagram illustrating a processing step of image analysis
- FIG. 14 is a diagram showing an example of a profile graph that displays variation in the signal value along the scanning direction in which the image is scanned as indicated by the arrow in FIG. 13 ;
- FIG. 15 is a diagram showing another example of a profile graph that displays variation in the signal value along the scanning direction in which the image is scanned as indicated by the arrow in FIG. 13 ;
- FIG. 16 is an illustrative diagram of a processing step of image analysis
- FIG. 17 is an illustrative diagram of a processing step of image analysis
- FIG. 18 is an illustrative diagram of a case which includes the effects of satellite dots or dust
- FIGS. 19A and 19B are illustrative diagrams of the shape of a profile graph
- FIG. 20 is an illustrative diagram of the shape of a profile graph affected by satellite dots
- FIG. 21 is an illustrative diagram of a line width calculation method
- FIG. 22 is an illustrative diagram of a nozzle position calculation method
- FIG. 23 is an illustrative diagram of a nozzle position calculation method
- FIG. 24 is a diagram showing a second example of a measurement sample chart
- FIG. 25 is a diagram showing a third example of a measurement sample chart
- FIG. 26 is a diagram showing a fourth example of a measurement sample chart
- FIG. 27 is an illustrative diagram of positional alignment processing between blocks
- FIG. 28 is a flowchart showing an example of a sequence of dot measurement processing (first example).
- FIG. 29 is a flowchart showing the contents of dirt/dust determination processing
- FIG. 30 is a flowchart showing an example of a sequence of dot measurement processing (second example).
- FIG. 31 is a flowchart showing the contents of block processing 1 in FIG. 30 ;
- FIG. 32 is a flowchart showing the contents of defective nozzle judgment processing
- FIG. 33 is a flowchart showing the contents of block processing 2 in FIG. 30 ;
- FIG. 34 is a flowchart showing an example of a sequence of dot measurement processing (third example).
- FIG. 35 is a flowchart showing the contents of block processing 3 in FIG. 34 ;
- FIG. 36 is an illustrative diagram of conversion function F i ;
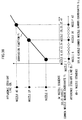
- FIG. 37 is a graph showing the relationship between the reading angle and the measurement accuracy for respective resolutions
- FIG. 38 is a block diagram showing an example of the composition of a dot measurement apparatus.
- FIG. 39 is an illustrative diagram of an example where a line pattern is read in by means of an area sensor.
- FIG. 1 is a general schematic drawing of an inkjet recording apparatus.
- the inkjet recording apparatus 10 comprises: a print unit 12 having a plurality of inkjet recording heads (corresponding to “liquid ejection heads”, hereinafter, called “heads”) 12 K, 12 C, 12 M and 12 Y provided for ink colors of black (K), cyan (C), magenta (M), and yellow (Y), respectively; an ink storing and loading unit 14 for storing inks to be supplied to the heads 12 K, 12 C, 12 M and 12 Y; a paper supply unit 18 for supplying recording paper 16 forming a recording medium; a decurling unit 20 for removing curl in the recording paper 16 ; a belt conveyance unit 22 , disposed facing the nozzle face (ink ejection face) of the print unit 12 , for conveying the recording paper 16 while keeping the recording paper 16 flat; a print determination unit 24 for reading the printed result produced by the print unit 12 ; and a paper output unit 26 for outputting recorded
- the ink storing and loading unit 14 has ink tanks for storing the inks of each color to be supplied to the heads 12 K, 12 C, 12 M, and 12 Y respectively, and the tanks are connected to the heads 12 K, 12 C, 12 M, and 12 Y by means of prescribed channels.
- the ink storing and loading unit 14 has a warning device (for example, a display device or an alarm sound generator) for warning when the remaining amount of any ink is low, and has a mechanism for preventing loading errors among the colors.
- a magazine for rolled paper (continuous paper) is shown as an example of the paper supply unit 18 ; however, a plurality of magazines with paper differences such as paper width and quality may be jointly provided. Moreover, papers may be supplied with cassettes that contain cut papers loaded in layers and that are used jointly or in lieu of the magazine for rolled paper.
- a medium such as a bar code and a wireless tag containing information about the type of medium is attached to the magazine, and by reading the information contained in the information recording medium with a predetermined reading device, the type of recording medium to be used (type of medium) is automatically determined, and ink-droplet ejection is controlled so that the ink-droplets are ejected in an appropriate manner in accordance with the type of medium.
- the recording paper 16 delivered from the paper supply unit 18 retains curl due to having been loaded in the magazine.
- heat is applied to the recording paper 16 in the decurling unit 20 by a heating drum 30 in the direction opposite from the curl direction in the magazine.
- the heating temperature at this time is preferably controlled so that the recording paper 16 has a curl in which the surface on which the print is to be made is slightly round outward.
- a cutter (first cutter) 28 is provided as shown in FIG. 1 , and the continuous paper is cut into a desired size by the cutter 28 .
- the decurled and cut recording paper 16 is delivered to the belt conveyance unit 22 .
- the belt conveyance unit 22 has a configuration in which an endless belt 33 is set around rollers 31 and 32 so that the portion of the endless belt 33 facing at least the nozzle face of the print unit 12 and the sensor face of the print determination unit 24 forms a horizontal plane (flat plane).
- the belt 33 has a width that is greater than the width of the recording paper 16 , and a plurality of suction apertures (not shown) are formed on the belt surface.
- a suction chamber 34 is disposed in a position facing the sensor surface of the print determination unit 24 and the nozzle surface of the print unit 12 on the interior side of the belt 33 , which is set around the rollers 31 and 32 , as shown in FIG. 1 .
- the suction chamber 34 provides suction with a fan 35 to generate a negative pressure, and the recording paper 16 is held on the belt 33 by suction. It is also possible to use an electrostatic attraction method, instead of a suction-based attraction method.
- the belt 33 is driven in the clockwise direction in FIG. 1 by the motive force of a motor 88 (shown in FIG. 6 ) being transmitted to at least one of the rollers 31 and 32 , which the belt 33 is set around, and the recording paper 16 held on the belt 33 is conveyed from left to right in FIG. 1 .
- a motor 88 shown in FIG. 6
- a belt-cleaning unit 36 is disposed in a predetermined position (a suitable position outside the printing area) on the exterior side of the belt 33 .
- a predetermined position a suitable position outside the printing area
- examples thereof include a configuration of nipping with a brush roller and a water absorbent roller or the like, an air blow configuration of blowing clean air, or a combination of these.
- the belt conveyance unit 22 it is also possible to adopt a mode which uses a roller nip conveyance mechanism, but when the print region is conveyed by a roller nip mechanism, the printed surface of the paper makes contact with the roller directly after printing, and hence there is a problem in that the image is liable to be blurred. Therefore, a suction belt conveyance mechanism which does not make contact with the image surface in the print region is desirable, as in the present example.
- a heating fan 40 is disposed on the upstream side of the print unit 12 in the conveyance pathway formed by the belt conveyance unit 22 .
- the heating fan 40 blows heated air onto the recording paper 16 to heat the recording paper 16 immediately before printing so that the ink deposited on the recording paper 16 dries more easily.
- the heads 12 K, 12 C, 12 M and 12 Y of the print unit 12 are full line heads having a length corresponding to the maximum width of the recording paper 16 used with the inkjet recording apparatus 10 , and comprising a plurality of nozzles for ejecting ink arranged on a nozzle face through a length exceeding at least one edge of the maximum-size recording medium (namely, the full width of the printable range) (see FIGS. 2A and 2B ).
- the print heads 12 K, 12 C, 12 M and 12 Y are arranged in color order (black (K), cyan (C), magenta (M), yellow (Y)) from the upstream side in the feed direction of the recording paper 16 , and these respective heads 12 K, 12 C, 12 M and 12 Y are fixed extending in a direction substantially perpendicular to the conveyance direction of the recording paper 16 .
- a color image can be formed on the recording paper 16 by ejecting inks of different colors from the heads 12 K, 12 C, 12 M and 12 Y, respectively, onto the recording paper 16 while the recording paper 16 is conveyed by the belt conveyance unit 22 .
- ink colors and the number of colors are not limited to those.
- Light inks, dark inks or special color inks can be added as required.
- inkjet heads for ejecting light-colored inks such as light cyan and light magenta are added.
- sequence in which the heads of respective colors are arranged there are no particular restrictions of the sequence in which the heads of respective colors are arranged.
- a post-drying unit 42 is disposed following the print unit 12 .
- the post-drying unit 42 is a device to dry the printed image surface, and includes a heating fan, for example. It is preferable to avoid contact with the printed surface until the printed ink dries, and a device that blows heated air onto the printed surface is preferable.
- a heating/pressurizing unit 44 is disposed following the post-drying unit 42 .
- the heating/pressurizing unit 44 is a device to control the glossiness of the image surface, and the image surface is pressed with a pressure roller 45 having a predetermined uneven surface shape while the image surface is heated, and the uneven shape is transferred to the image surface.
- the printed matter generated in this manner is outputted from the paper output unit 26 .
- the target print i.e., the result of printing the target image
- the test print are preferably outputted separately.
- a sorting device (not shown) is provided for switching the outputting pathways in order to sort the printed matter with the target print and the printed matter with the test print, and to send them to paper output units 26 A and 26 B, respectively.
- the test print portion is cut and separated by a cutter (second cutter) 48 .
- the paper output unit 26 A for the target prints is provided with a sorter for collecting prints according to print orders.
- the heads 12 K, 12 C, 12 M and 12 Y of the respective ink colors have the same structure, and a reference numeral 50 is hereinafter designated to any of the heads.
- FIG. 2A is a plan view perspective diagram showing an example of the structure of a head 50
- FIG. 2B is an enlarged diagram of a portion of same.
- FIG. 3 is a plan view perspective diagram (a cross-sectional view along the line 4 - 4 in FIGS. 2A and 2B ) showing another example of the structure of the head 50
- FIG. 4 is a cross-sectional diagram showing the three-dimensional composition of the liquid droplet ejection element corresponding to one channel which forms a unit recording element (namely, an ink chamber unit corresponding to one nozzle 51 ).
- the head 50 has a structure in which a plurality of ink chamber units (droplet ejection elements) 53 , each comprising a nozzle 51 forming an ink ejection port, a pressure chamber 52 corresponding to the nozzle 51 , and the like, are disposed two-dimensionally in the form of a staggered matrix, and hence the effective nozzle interval (the projected nozzle pitch) as projected (orthogonal projection) in the lengthwise direction of the head (the direction perpendicular to the paper conveyance direction) is reduced and high nozzle density is achieved.
- ink chamber units droplet ejection elements
- the mode of forming nozzle rows with a length not less than a length corresponding to the entire width Wm of the recording paper 16 in a direction (the direction of arrow M; main-scanning direction) substantially perpendicular to the conveyance direction (the direction of arrow S; sub-scanning direction) of the recording paper 16 is not limited to the example described above.
- a line head having nozzle rows of a length corresponding to the entire width of the recording paper 16 can be formed by arranging and combining, in a staggered matrix, short head modules 50 ′ having a plurality of nozzles 51 arrayed in a two-dimensional fashion.
- the planar shape of the pressure chamber 51 provided corresponding to each nozzle 52 is substantially a square shape, and an outlet port to the nozzle 51 is provided at one of the ends of a diagonal line of the planar shape, while an inlet port (supply port) 54 for supplying ink is provided at the other end thereof.
- the shape of the pressure chamber 52 is not limited to that of the present example and various modes are possible in which the planar shape is a quadrilateral shape (diamond shape, rectangular shape, or the like), a pentagonal shape, a hexagonal shape, or other polygonal shape, or a circular shape, elliptical shape, or the like.
- each pressure chamber 52 is connected to a common channel 55 through the supply port 54 .
- the common channel 55 is connected to an ink tank (not shown in Figures), which is a base tank that supplies ink, and the ink supplied from the ink tank is delivered through the common flow channel 55 to the pressure chambers 52 .
- An actuator 58 provided with an individual electrode 57 is bonded to a pressure plate (a diaphragm that also serves as a common electrode) 56 which forms the surface of one portion (in FIG. 4 , the ceiling) of the pressure chambers 52 .
- a drive voltage is applied to the individual electrode 57 and the common electrode, the actuator 58 deforms, thereby changing the volume of the pressure chamber 52 .
- This causes a pressure change which results in ink being ejected from the nozzle 51 .
- a piezoelectric element using a piezoelectric body, such as lead zirconate titanate, barium titanate, or the like.
- the high-density nozzle head according to the present embodiment is achieved by arranging obliquely a plurality of ink chamber units 53 having the above-described structure in a lattice fashion based on a fixed arrangement pattern, in a row direction which coincides with the main scanning direction, and a column direction which is inclined at a fixed angle of ⁇ with respect to the main scanning direction, rather than being perpendicular to the main scanning direction.
- the pitch PN of the nozzles projected so as to align in the main scanning direction is d ⁇ cos ⁇ , and hence the nozzles 51 can be regarded to be substantially equivalent to those arranged linearly at a fixed pitch P along the main scanning direction.
- Such configuration results in a nozzle structure in which the nozzle row projected in the main scanning direction has a high nozzle density of up to 2,400 nozzles per inch.
- the “main scanning” is defined as printing one line (a line formed of a row of dots, or a line formed of a plurality of rows of dots) in the width direction of the recording paper (the direction perpendicular to the conveyance direction of the recording paper) by driving the nozzles in, for example, following ways: (1) simultaneously driving all the nozzles; (2) sequentially driving the nozzles from one side toward the other; and (3) dividing the nozzles into blocks and sequentially driving the nozzles from one side toward the other in each of the blocks.
- the main scanning according to the above-described (3) is preferred. More specifically, the nozzles 51 - 11 , 51 - 12 , 51 - 13 , 51 - 14 , 51 - 15 and 51 - 16 are treated as a block (additionally; the nozzles 51 - 21 , 51 - 22 , . . . , 51 - 26 are treated as another block; the nozzles 51 - 31 , 51 - 32 , . . . , 51 - 36 are treated as another block; . . . ); and one line is printed in the width direction of the recording paper 16 by sequentially driving the nozzles 51 - 11 , 51 - 12 , . . . , 51 - 16 in accordance with the conveyance velocity of the recording paper 16 .
- “sub-scanning” is defined as to repeatedly perform printing of one line (a line formed of a row of dots, or a line formed of a plurality of rows of dots) formed by the main scanning, while moving the full-line head and the recording paper relatively to each other.
- the direction indicated by one line (or the lengthwise direction of a band-shaped region) recorded by main scanning as described above is called the “main scanning direction”, and the direction in which sub-scanning is performed, is called the “sub-scanning direction”.
- the conveyance direction of the recording paper 16 is called the sub-scanning direction and the direction perpendicular to same is called the main scanning direction.
- the arrangement of the nozzles is not limited to that of the example illustrated.
- a method is employed in the present embodiment where an ink droplet is ejected by means of the deformation of the actuator 58 , which is typically a piezoelectric element; however, in implementing the present invention, the method used for discharging ink is not limited in particular, and instead of the piezo jet method, it is also possible to apply various types of methods, such as a thermal jet method where the ink is heated and bubbles are caused to form therein by means of a heat generating body such as a heater, ink droplets being ejected by means of the pressure applied by these bubbles.
- FIG. 6 is a block diagram showing the system configuration of the inkjet recording apparatus 10 .
- the inkjet recording apparatus 10 comprises a communication interface 70 , a system controller 72 , an image memory 74 , a ROM 75 , a motor driver 76 , a heater driver 78 , a print controller 80 , an image buffer memory 82 , a head driver 84 , and the like.
- the communication interface 70 is an interface unit (image input unit) for receiving image data sent from a host computer 86 .
- a serial interface such as USB (Universal Serial Bus), IEEE1394, Ethernet (registered trademark), wireless network, or a parallel interface such as a Centronics interface may be used as the communication interface 70 .
- a buffer memory (not shown) may be mounted in this portion in order to increase the communication speed.
- the image data sent from the host computer 86 is received by the inkjet recording apparatus 10 through the communication interface 70 , and is stored temporarily in the image memory 74 .
- the image memory 74 is a storage device for storing images inputted through the communication interface 70 , and data is written and read to and from the image memory 74 through the system controller 72 .
- the image memory 74 is not limited to a memory composed of semiconductor elements, and a hard disk drive or another magnetic medium may be used.
- the system controller 72 is constituted by a central processing unit (CPU) and peripheral circuits thereof, and the like, and it functions as a control device for controlling the whole of the inkjet recording apparatus 10 in accordance with a prescribed program, as well as a calculation device for performing various calculations. More specifically, the system controller 72 controls the various sections, such as the communication interface 70 , image memory 74 , motor driver 76 , heater driver 78 , and the like, as well as controlling communications with the host computer 86 and writing and reading to and from the image memory 74 and ROM 75 , and it also generates control signals for controlling the motor 88 and heater 89 of the conveyance system.
- CPU central processing unit
- the program executed by the CPU of the system controller 72 and the various types of data which are required for control procedures are stored in the ROM 75 .
- the ROM 75 may be a non-writeable storage device, or it may be a rewriteable storage device, such as an EEPROM.
- the image memory 74 is used as a temporary storage region for the image data, and it is also used as a program development region and a calculation work region for the CPU.
- the motor driver (drive circuit) 76 drives the motor 88 of the conveyance system in accordance with commands from the system controller 72 .
- the heater driver (drive circuit) 78 drives the heater 89 of the post-drying unit 42 or the like in accordance with commands from the system controller 72 .
- the print controller 80 has a signal processing function for performing various tasks, compensations, and other types of processing for generating print control signals from the image data (original image data) stored in the image memory 74 in accordance with commands from the system controller 72 so as to supply the generated print data (dot data) to the head driver 84 .
- the print controller 80 is provided with the image buffer memory 82 ; and image data, parameters, and other data are temporarily stored in the image buffer memory 82 when image data is processed in the print controller 80 .
- the aspect shown in FIG. 6 is one in which the image buffer memory 82 accompanies the print controller 80 ; however, the image memory 74 may also serve as the image buffer memory 82 . Also possible is an aspect in which the print controller 80 and the system controller 72 are integrated to form a single processor.
- image data to be printed (original image data) is input from an external source via a communications interface 70 , and is accumulated in the image memory 74 .
- RGB image data is stored in the image memory 74 , for example.
- the print controller 80 performs processing for converting the input RGB image data into dot data for the four colors of K, C, M and Y.
- the dot data generated by the print controller 180 in this way is stored in the image buffer memory 82 .
- the head driver 84 outputs a drive signal for driving the actuators 58 corresponding to the nozzles 51 of the head 50 , on the basis of print data (in other words, dot data stored in the image buffer memory 182 ) supplied by the print controller 80 .
- a feedback control system for maintaining constant drive conditions in the head may be included in the head driver 84 .
- ink is ejected from the corresponding nozzles 51 .
- ink ejection from the print heads 50 in synchronization with the conveyance speed of the recording paper 16 , an image is formed on the recording paper 16 .
- the ejection volume and the ejection timing of the ink droplets from the respective nozzles are controlled via the head driver 84 , on the basis of the dot data generated by implementing prescribed signal processing in the print controller 80 , and the drive signal waveform.
- the head driver 84 controls the ejection volume and the ejection timing of the ink droplets from the respective nozzles, on the basis of the dot data generated by implementing prescribed signal processing in the print controller 80 , and the drive signal waveform.
- the print controller 80 carries out various corrections with respect to the head 50 , on the basis of information on the dot deposition positions and dot diameters (ink volume) acquired by the dot measurement method described below, and information on the determination of satellites and dirt and dust, and furthermore, it implements control for carrying out cleaning operations (nozzle restoration operations), such as preliminary ejection or suctioning, or wiping, according to requirements.
- cleaning operations nozzle restoration operations
- the dot measurement method according to the present embodiment is carried out by means of the procedure described below (steps 1 to 8).
- Step 1 Droplets of ink which are to form the measurement object are ejected and deposited on a recording paper from the nozzles of an inkjet head, while moving the head and the recording paper relatively with respect to each other, and a line pattern created by a row of dots corresponding to respective nozzles is formed on the recording paper by the ink droplets ejected from the nozzles.
- a sample chart (measurement chart) is formed of the line patterns created by droplets of an ink for which the measurements are carried out.
- this measurement chart is formed at a variety of timings, such as when the head is installed, whenever there is a change in the droplet deposition positions which cannot be restored by a maintenance operation, when a prescribed time period has elapsed, or upon inspection at the start of operation, depending on assembling combinations of the head and the maintenance unit.
- Step 2 An image of the line pattern is captured in such a manner that the direction of the lattice of pixels in the captured image forms a prescribed angle (and desirably, an angle between 1° and 30°) with respect to the line direction of the line pattern formed in step 1 (this line direction corresponds to the sub-scanning direction when using a page-wide full-line head, and here is taken to be “direction S”), and electronic image data for the captured image (the image obtained by reading in the line pattern) is acquired.
- a prescribed angle and desirably, an angle between 1° and 30°
- Step 3 The captured image (electronic image data) acquired by reading in the line pattern at step 2 is taken and the acquired image data is scanned in the pixel lattice direction of the captured image, which traverses (intersects with) the line patterns corresponding to the respective nozzles, thereby acquiring a plurality of profile graphs, each representing the variation in the image signal value of the one-dimensional pixel arrangement in this scanning direction, in respect of one line pattern.
- Step 4 In each of the plurality of profile graphs which correspond to one line pattern obtained at step 3, the peak position which corresponds to the density center of the line pattern in that profile (which is equivalent to the “extreme value position”; in a case where white corresponds to the maximum value, then this corresponds to the “trough position”, but in order to simplify the description, this is referred to simply as “peak position” in all cases), and the left and right-hand edge positions of the line pattern (which is equivalent to the “first edge position” and the “second edge position”), are calculated accordingly. There are two edges of the line pattern in the breadthways direction, on the left and right-hand sides, and in the profile graph, the positions at which the signal value assumes a prescribed graduated tone value corresponding to an edge are judged to be edge positions.
- the edge positions and the peak position are calculated by using a commonly known interpolation technique on the basis of the one-dimensional pixel lattice positions and the signal values (graduated tone values), and hence the edge positions and the peak positions are calculated with greater accuracy than the interval between positions (pixel pitch) in the one-dimensional pixel lattice in the profile graph.
- a peak position and two edge positions are calculated for each of the profile graphs corresponding to one line pattern.
- Step 5 The data on the peak positions and the edge positions obtained respectively from the plurality of profile graphs corresponding to the one line pattern in step 4 is gathered, and an approximation line corresponding to the peak positions of the one line pattern, and an approximation line corresponding to the edge positions (left- and right-hand positions) are calculated, by using a least-square method.
- Step 6 Using the two approximation lines corresponding to the left and right-hand edge positions relating to the one line pattern, the perpendicular distance between these two straight lines is calculated and this perpendicular distance is taken as the line width of the line pattern in question. Furthermore, using the approximation lines corresponding to the peak positions of the respective line patterns, the interval between line patterns (the distance between mutually adjacent line patterns) is calculated from the perpendicular distance between the approximation lines corresponding to the peak positions of mutually adjacent line patterns.
- Step 7 On the other hand, the relationship (correlation) between the dot diameter and the line width is previously determined in accordance with the combination of the prescribed ink and the recording paper, and furthermore, the relationship between the ejected droplet volume and the dot diameter is also determined previously, and this correlation data is beforehand stored (in the form of a correspondence table, or the like) in a storage device, such as a memory.
- Step 8) The corresponding dot diameter (ink volume) is calculated from the line width of the line pattern calculated in step 6, on the basis of the relationship between the line width and the dot diameter (ink volume) previously determined in step 7. Furthermore, the relative droplet deposition positions of the respective nozzles are calculated from the line pattern interval calculated at step 6.
- the dot diameter (ink volume) and the dot deposition positions can be calculated simultaneously on the basis of one captured image of a sample chart containing line patterns, then a beneficial effect is obtained in reducing the number of images to be captured. Furthermore, since the dot diameter is calculated on the basis of the line patterns, it is not necessary to calculate the surface areas of isolated dots by capturing distinct images of the isolated dots, as in the related art, and therefore it is possible to use an imaging apparatus having relatively low resolution.
- FIG. 7 is a schematic drawing showing an example of the line patterns formed on the recording paper by means of an inkjet head.
- the vertical direction (sub-scanning direction) indicated by the arrow S represents the conveyance direction of the recording paper
- the lateral direction (the main scanning direction) indicated by the arrow M which is perpendicular to the direction S, represents the longitudinal direction of the head 50 .
- a head having a plurality of nozzles aligned in one row is shown as an example, but as described in FIG. 3 , it is also possible to employ a matrix head in which a plurality of nozzles are arranged two-dimensionally.
- a group of nozzles arranged in a two-dimensional configuration can be treated as being substantially equivalent to a nozzle configuration in a single row, by considering the effective nozzle row formed by projecting the nozzles normally to a straight line in the main scanning direction.
- dot rows (line patterns 92 ) are formed which include dots 90 formed by the ink droplets deposited from the nozzles 51 , arranged in the form of lines.
- FIG. 7 shows an example of line patterns formed on a sheet of recording paper 16 when there is fluctuation in the deposition positions and ink volume of the actually ejected ink droplets, in relation to the regular nozzle arrangement in the head 50 .
- Each of the line patterns 92 is formed by droplets ejected from corresponding one of the nozzles.
- the dots created by mutually adjacent nozzles overlap partially with each other, and therefore single dot lines are not formed.
- FIG. 7 shows an example in which a space of three nozzles is left.
- the respective line patterns reflect the characteristics of the corresponding nozzles, and due to the characteristics of the individual nozzles, variation occurs in the deposition position (dot position) or the dot diameter, giving rise to irregularity in the line pattern.
- a sample chart such as that shown in FIG. 8 is formed.
- a block in which a plurality of line patterns are formed in a direction perpendicular to the conveyance direction by means of the nozzles having nozzle numbers corresponding to multiples of four plus 3 (i.e., i 7, 11, . . . ).
- the respective line patterns are formed by shifting the droplet ejection timings respectively for each group (block) of nozzle numbers, 4 n , 4 n +1, 4 n +2, 4 n +3, for example.
- FIG. 8 it is possible to form independent lines (which do not overlap with other lines), for all of the nozzles, without any mutual overlapping between the line patterns of the respective blocks, or between the lines within the same block.
- FIGS. 24 to 26 Another example of a sample chart devised in order to raise the determination accuracy of the positions between different blocks, in comparison with the positional accuracy of the image reading apparatus, will be described later ( FIGS. 24 to 26 ).
- the photoreceptor element row of the imaging apparatus When reading in the sample chart “A” comprising a plurality of line patterns formed as described above, by means of an image reading apparatus, the photoreceptor element row of the imaging apparatus reads in the image in an oblique direction which forms a prescribed angle (an angle of 0° ⁇ 90°; and desirably an angle in the range of 1° to 30°), with respect to the line pattern.
- a prescribed angle an angle of 0° ⁇ 90°; and desirably an angle in the range of 1° to 30°
- FIG. 9 is a diagram showing an example where a line sensor (linear image sensor) 100 is used as an imaging apparatus.
- the photoreceptor elements (photoelectric transducing elements) 101 are aligned in one row, but in actual practice, a three-line sensor having respective photoreceptor element rows for red (R), green (G) and blue (B) which are equipped with filters of the respective colors, (a so-called RGB line sensor) may be used.
- the photoreceptor surface of this line sensor 100 is disposed in parallel with the reading surface of the object of which an image is being captured (the surface of the recording paper on which the sample chart 92 has been recorded), and the photoreceptor element row is disposed at a prescribed non-perpendicular oblique angle with respect to the line patterns 92 on the recording paper.
- FIG. 10 is a schematic drawing showing an example of the positional relationship between the pixel positions (image reading lattice positions) and the position of the sample chart, in the image data which is acquired as described above.
- the ratio of the size of the pixels (cells) of the image data to the size of the dots does not necessarily reflect the actual size ratio, and in order to simplify the description, the pixel units are depicted at a larger size than their actual size (the same applies to other drawings).
- the pixels of the image data are arranged in a square lattice configuration and the line patterns 92 on the recording paper 16 are captured in images so that they obliquely traverse the lattice of pixels.
- the lateral direction in FIG. 10 is the X axis and the vertical direction which is perpendicular to the X axis is the Y axis.
- the pixel lattice positions in the image data are expressed by the position (X, Y) in the X-Y coordinate.
- the respective pixels in the electronic image data obtained in the imaging step have signal values (graduated tone values) which reflect the optical density of the measurement object (in this case, the density of the line patterns).
- the sample chart of the line patterns formed on the recording paper 16 is read in by the imaging apparatus of the image reading apparatus, and converted into electronic image data.
- the image resolution in this case is 1200 dpi (dots per inch) or above.
- the image data thus read in is analyzed in accordance with the colors corresponding to the types of ink.
- a color (processing channel) for which the greatest contrast is obtained is selected from the channels RGB for each respective ink.
- analysis is carried out by using the R signal in the case of cyan ink, the G signal in the case of magenta ink, the B signal in the case of yellow ink, and the G signal in the case of black ink.
- Channels for other special colors should be selected from ROB, depending on the channel which produces the greatest contrast.
- FIG. 11 is a schematic drawing of the relationship between a one-dimensional pixel row for which a profile graph is obtained, and the line patterns on the sample chart.
- the shaded regions of the pixel row indicate those portions of the j-th one-dimensional pixel row traversing the line patterns which have a high image signal value due to the presence of an ink dot in a line pattern.
- FIG. 12 is a diagram showing an example of a profile graph.
- the horizontal axis in FIG. 12 represents the pixel position in the Y direction, and the vertical axis represents the image signal value (in other words, a value reflecting the density).
- the plurality of curves (graphs) in FIG. 12 relate respectively to different pixel positions in the X direction.
- a plurality of profile graphs are obtained in respect of the X-direction pixel positions.
- the profile graph represents variation in brightness, and in this case, the greater the density of the ink dots, the greater the image signal value in the image data; portions where no dot is present (the regions of the blank recording paper, in other words, white regions) have a low image signal value.
- the peak position in a profile graph corresponds generally to the center of the line width of a line pattern, and a pixel position where the image signal value becomes a prescribed value (for example, a graduated tone value indicated as a density of “70” in FIG. 12 ) is specified as an edge position of a line pattern (namely, a boundary position in the breadthways direction).
- a prescribed value for example, a graduated tone value indicated as a density of “70” in FIG. 12
- the graduated tone value corresponding to an edge position and the pixel positions (on the left and right-hand sides) at which the stated graduated tone value is obtained, or at which it is deduced that the graduated tone value is obtained by interpolation from a position where the value has changed beyond the graduated tone value, are calculated.
- the peak position which corresponds to the position where the greatest optical density is obtained in the line pattern (a trough position having the lowest signal value in the case of a density signal, luminosity signal or brightness signal) is also calculated.
- the extreme value position of the change in the signal value is calculated by interpolation from signal values to either side of the peak position.
- the edge positions (left and right-hand side) and the peak positions are calculated respectively from the corresponding plurality of profile graphs, and this data is gathered up and the positional information is converted into physical distances on the recording paper. For example, if the resolution in the horizontal direction of the captured image is Rx, and the resolution in the vertical direction is Ry (mm/pixel), then each position (X, Y) is converted respectively to a physical position of (Rx ⁇ X mm, Ry ⁇ Y mm). Thereupon, approximation lines are calculated respectively for the left and right-hand edge positions and the peak position corresponding to each of the respective line patterns, by using a least-square method.
- the approximation lines may be derived as three independent straight lines, or alternatively, the approximation lines may be derived by applying restrictions in such a manner that the straight lines have the same gradient.
- a line width is determined for each line pattern by calculating the perpendicular distance between the approximation line corresponding to the left-hand edge of the line pattern and the approximation line corresponding to the right-hand edge of the line pattern.
- the method described above can be used without any problems. If, on the other hand, the three straight lines are derived independently, then the following method can be used. Firstly, the central point of the left-hand edge positions of the corresponding line pattern are determined (for example, by simply specifying the average position of the edge position coordinates as the central point), Y coordinate corresponding to the X coordinate of this central point of the left-hand edge positions is calculated by means of the approximation line of the left-hand edge, and the distance between this coordinate (X, Y) thus calculated and the approximation line of the right-hand edge is determined.
- the central point of the right-hand edge positions of the corresponding line pattern are determined, Y coordinate corresponding to the X coordinate of this central point of the right-hand edge positions is calculated by means of the approximation line of the right-hand edge, and the distance between this coordinate (X, Y) thus calculated and the approximation line of the right-hand edge is determined. The average value of these two distances is taken to be the line width.
- the peak positions can also be found by determining the distance between the line patterns, by using a method similar to that described above. More specifically, if the approximation lines corresponding to the peak positions of the respective line patterns are calculated so that they have the same gradient and are therefore parallel to each other, then the distance between the approximation lines which correspond to mutually adjacent peak positions will be equivalent to the distance between the deposition positions of the dots formed by the respective nozzles.
- the central points of the peak positions corresponding to these line patterns are determined. For example, the average value of the X coordinates of the peak positions corresponding to the respective line patterns is determined, and the Y coordinate corresponding to the X coordinate is calculated by means of the approximation line. The distance between the position (X, Y) thus obtained, and the approximation line corresponding to the peak positions for the mutually adjacent line pattern, is then determined. Thereupon, the central point of the peak positions for the adjacent line pattern described above is determined and the distance between this and the approximation line corresponding to the other line pattern is found. The average value of these two distances is taken to be the interval between the deposition positions of the dots formed by the nozzles.
- the dot diameter is calculated by the following method, on the basis of the line width information.
- an isolated dot (and desirably, a plurality of isolated dots) followed by a line pattern are formed by ink ejected from one nozzle onto the recording paper, in accordance with the prescribed combination of the type of recording paper and the ink, and the result is captured by means of a high-resolution camera having a microscope attached to the imaging apparatus, and the dot diameter of the isolated dot and the line width of the line pattern are measured on the basis of the image data thus obtained.
- the sample chart “B” based on groups of isolated dots and line patterns in this way is measured, and the conversion function which represents the relationship between the isolated dot diameter and the line width of the line pattern (the “dot diameter—line width correlation function” which represents the correlation between the dot diameter and the line width) is determined.
- the dot diameter of isolated dots and the line width of a dot row formed by ejecting and depositing droplets continuously in a line shape have mutually different spreading rates, and therefore they do not have the same value.
- the sample chart “B” is based on the same combination (the same recording conditions) of recording paper and ink (the same types) as the measurement sample chart “A” described above.
- the line widths of the portions of the line patterns in the sample chart “B” are calculated by means of the technique (hereinafter, called the method according to the present embodiment) as that used in “2. Reading in sample chart” and “3. Analysis of captured image data” described above.
- the conversion function representing the relationship between the line width measured by the microscopic camera and the line width of the line pattern measured by the method of the present embodiment namely, the “measurement results correlation function” which represents the correlation between the measurement results from the microscopic camera and the measurement results based on the method of the present embodiment
- the conversion function representing the relationship between the line width measured by the microscopic camera and the line width of the line pattern measured by the method of the present embodiment (namely, the “measurement results correlation function” which represents the correlation between the measurement results from the microscopic camera and the measurement results based on the method of the present embodiment) is beforehand determined.
- the two conversion functions described above namely, the “dot diameter/line width correlation function” and the “measurement result correlation function”
- the relationship between the isolated dot diameter and the line width obtained by the method of the present embodiment may be determined as a direct conversion function.
- the ink volume can be determined from the information on the line width, by previously measuring, with a microscopic camera, the ink volume projected from a nozzle by means of a commonly known method and measuring the dot diameter formed by a dot of that ink volume, determining the relationship between the ink volume and the dot diameter as a conversion function (a “volume/dot diameter correlation function” which indicates the correlation between the ink volume and the dot diameter), and combining this conversion function (the “volume/dot diameter correlation function”) with the two conversion functions described above (the “dot diameter/line width correlation function” and the “measurement result correlation function”).
- a conversion function a “volume/dot diameter correlation function” which indicates the correlation between the ink volume and the dot diameter
- a plurality of isolated dots are measured and the average value of these measurements is used.
- the “measurement result correlation function”, the “volume/dot diameter correlation function” and the “dot diameter/line width correlation function” described above can be used as a polynomial expression by representing the relationship between two variables which represent the measurement results as a polynomial function, by means of a polynomial curve fitting method.
- the conversion functions described above can be used by means of a commonly known spline function or linear interpolation method, if the relationship between the two variables which represent the measurement results is subjected to a commonly known noise shaping process or smoothing process, and the two processed variables are then determined in a table format.
- the volume of an ink droplet in fight which has been ejected from a specific nozzle is determined a plurality of times by means of a commonly known method, the average value thereof is calculated, the ink droplet in flight that has been ejected from the specific nozzle is deposited onto recording paper (of the same type) in a pattern same as the sample chart A used for measurement, the diameter of a dot formed by the ink droplet is measured a plurality of times by means of a microscopic camera, the average value of the dot diameter is calculated, and the relationship between the ink volume and the dot diameter can then be determined as a conversion function (a “volume/dot diameter correlation function” which indicates the correlation between the ink volume and the dot diameter).
- the commonly known method used for measuring the volume of ink droplets in flight that have been ejected from a nozzle may be a method which captures an image of the ejected ink droplets in flight by means of a high-speed camera, or a method which receives a plurality of ejected droplets in a container, determines the differential between the weight of the container before droplet ejection and the weight of the container after droplet ejection, and hence finds the weight of one ejected droplet on the basis of the number of droplet ejections, and then determines the volume of an ink droplet on the basis of the ink density.
- Step 1 images of the respective line pattern blocks of captured image data obtained by reading in the measurement sample chart “A” described in FIG. 8 are scanned in the direction of the arrows, at coarse intervals (for example, central part and both ends as indicated by arrows in FIG. 13 ), following a quadrilateral shape (in FIG. 13 , the rectangular shape indicated by the dotted line) which traverses the respective line pattern blocks, and profile graphs indicating the variation in the signal value in this scanning direction are obtained.
- coarse intervals for example, central part and both ends as indicated by arrows in FIG. 13
- a quadrilateral shape in FIG. 13 , the rectangular shape indicated by the dotted line
- FIGS. 14 and 15 are diagrams showing examples of these profile graphs.
- the horizontal axis in FIGS. 14 and 15 represents the pixel position, and the vertical axis represents the signal value of the image.
- the signal value becomes smaller, the greater the density of the dot formed by the ink, and in regions where no dot is present (the portions of the blank recording paper, in other words, white regions), the signal value assumes a large value. Therefore, the signal value has a different meaning to that of the graph shown in FIG. 12 (in other words, the relationship between the magnitudes of the density and the signal value is the opposite).
- Step 2 Thereupon, the coordinates at which the profile graph obtained at step 1 is cut horizontally at the prescribed signal value are determined.
- the coordinates are then classified according to the direction of change of the signal (from white to black or from black to white) and their sequential position, and are gathered for each coordinate which corresponds to the same sequential position and the same direction of signal change. In so doing, the left-hand edge and the right-hand edge which correspond to the same line pattern can be distinguished within each image scan.
- Step 3 The straight line forming the right-hand edge is determined by using a least-square method, or the like, on the basis of the group of coordinates obtained for the right-hand edge for each line pattern.
- the straight line forming the left-hand edge is also determined by a similar method.
- Step 4 The quadrilateral shapes containing the respective line patterns (see FIG. 16 ) and the quadrilateral shapes which are positioned between the line patterns and do not contain a line pattern (see FIG. 17 ) are specified by the straight lines corresponding to the left and right-hand edges determined for each line pattern, and the upper edge and the lower edge of the first quadrilateral shape (see FIG. 13 ).
- the quadrilateral shape shown in FIG. 13 is divided into a first group of quadrilateral shapes shown in FIG. 16 and a second group of quadrilateral shapes shown in FIG. 17 .
- An image reading apparatus has non-uniformity in the read signal, which is known as shading, and as shown in FIGS. 14 and 15 , this appears in the profile graphs as variations in the white and black levels between the graphs corresponding to the respective line patterns.
- This variation in the white and black levels has an adverse effect on the accuracy of calculating the edge positions (the positional accuracy) based on the signal values (graduated tone values). Therefore, shading correction of the following kind is implemented with a view to improving the positional accuracy.
- the aforementioned shading correction for the X direction and shading correction for the Y direction is carried out as described below, respectively, with regard to each of the quadrilateral shapes (indicated by the quadrilateral shapes marked by thick lines in FIG. 16 ) containing a line patterns.
- the signal value corresponding to black is determined inside the quadrilateral shapes containing the line patterns as shown in FIG. 16 . This is done by determining the signal corresponding to black as the minimum value or maximum value (in the X direction within the quadrilateral shape), and then averaging this value in the Y direction, and thereby determining the signal value corresponding to black. This signal value is set as “BK i ”.
- the image of the quadrilateral shape is passed through a low-pass filter in the X direction, the signal value corresponding to white in this filtered image is determined as the minimum value or the maximum value in the X direction, and this signal value is associated with the Y coordinate for each Y direction, in the form of a table.
- This table is taken as “WH_TBL i (Y)”.
- a signal value which is averaged in the Y direction “WH i ” is also calculated.
- the aforementioned values (BK i , WH i ) are determined for all of the quadrilateral shapes (the quadrilateral shapes containing line patterns and the quadrilateral shapes not containing line patterns).
- a correction value which corrects the shading in the X direction is determined as described below.
- a linear conversion is defined whereby if the input value is BK i , then the output value is BK ave , and if the input value is WH 0 i , ten the output value is WH ave .
- output signal gain1 ⁇ input signal+offset 1, whereby when the X coordinate is X 1 i i, then if the input value is BK i , the output value will be BK ave , and if the input value is (WH 0 i +WH 2 i )/2, then the output value will be WH ave .
- output signal gain2 ⁇ input signal+offset2, whereby, when the X coordinate is X 2 i , then if the input value is BK i , the output value will be BK ave , and if the input value is WH 2 i , then the output value will be WH ave .
- the correction values used to correct shading in the Y direction are determined as follows for the quadrilateral shapes containing line patterns shown in FIG. 16 .
- Scalek(Y) for correcting the signal values corresponding to white to a uniform value in the Y direction is then determined.
- Scale k ( Y ) ⁇ Scale0( Y )+Scale1( Y ) ⁇ /2
- Step 5 The quadrilateral shapes which completely contain a line pattern as described in step 4 are image-scanned in the X direction or the Y direction as shown by the thick arrowed lines in FIG. 16 , thereby acquiring profile graphs which indicate the variation in the signal value in a one-dimensional pixel row in the scanning direction.
- the profile graphs are subjected to the shading correction described above, in accordance with the scanning coordinates (X,Y).
- the profile graph obtained from the quadrilateral shape containing the k-th line pattern in FIG. 16 is represented as shown below.
- Step 6 In the profile graphs obtained in step 5 described above, if the magnitude relationship of the signal values is white signal > black signal, then the position of the trough of the profile graph is set as the peak position (corresponding to the nozzle droplet ejection position). It on the other hand, the signal relationship is white signal ⁇ black signal, then the crest position of the profile graph is set as the peak position.
- a peak position set on the basis of the trough position is determined as follows.
- the X coordinate ⁇ b/(2a) producing the minimum value is set as the coordinate of the peak position.
- the Y coordinate is set as the Y coordinate of the reference scanning point.
- S is the signal value on the profile graph after the correction processing described above, and the suffix represents scanning in one pixel units in the prescribed direction (the X direction or the Y direction), (where continuous suffixes represent mutually adjacent pixels in the prescribed direction).
- the quadratic function (ax 2 +bx+c) passing through three points (x, S) (x i ⁇ 1 , S i ⁇ ), (x i , S i ) and (x i+1 , S i+1 ) which satisfy (S i ⁇ 1 ⁇ S i and S i >S i+1 ) or (S i ⁇ 1 ⁇ S i and S i ⁇ S i+1 ) is determined, the X coordinate ⁇ b/Y (2a) producing the maximum value is set as the coordinate of the peak position, and the Y coordinate is set to the Y coordinate of the reference scanning point.
- the quadratic function (ay 2 +by+c) passing through three points (Y, S) (y i ⁇ 1 , S i ⁇ 1 ), (yi, Si) and (y i+1 , S i+1 ) which satisfy the conditions (S i ⁇ ⁇ S i and S i >S i+1 ) or (S i ⁇ 1 ⁇ S i and S i ⁇ S i+1 ) is determined, the Y coordinate ⁇ b/(2a) producing the maximum value is set as the coordinate of the peak position, and the X coordinate is set to the X coordinate of the reference scanning point.
- Step 7 processing for specifying the edge positions from the profile graph obtained at step 5 above will be described.
- the position of one edge of the left and right-hand edges (in this case, the left-hand edge “edge L”) is determined as described below, taking the prescribed graduated tone value which is used as a reference for judging the edge of the line width to be T.
- the X coordinate is set as the X coordinate of the reference scanning point.
- the coordinate of the edge position (edge L) is set as the coordinate of the point of intersection between the straight line of the graduated tone value T and the straight line which passes through the two points corresponding to S i and S i+1 (in the case of scanning in the X direction, the corresponding points are (x i , S i ) and (x i+1 , S i+1 ), and in the case of scanning in the Y direction, the corresponding points are (y i , S i ) and (y i+1 , S i+1 )), of the three points which satisfy the conditions, S i ⁇ 1 ⁇ S i and S i ⁇ S i+1 , and S i ⁇ T and T ⁇ S i+1 .
- the coordinate of the edge position is set by the X coordinate of the point of intersection between the straight line of the graduated tone value T and the straight line passing through the two points (x i , S i ) and (x i+1 , S i+1 ) corresponding to S i and S i+1 , of the three points (x, S) (x i ⁇ 1 , S i ⁇ 1 ), (x i , S i ) and (x i+1 , S i+1 ).
- the Y coordinate is set by the Y coordinate of the scanning reference point.
- the X coordinate is set by the X coordinate of the scanning reference point.
- the coordinate of the edge position is set by the coordinate of the point of intersection between the straight line of the graduated tone value T and the straight line passing through the two points corresponding to S i and S i+1 of the three points which satisfy the conditions S i ⁇ 1 ⁇ S i and S i ⁇ S i+1 , and S i ⁇ T and T ⁇ S i+1 , (in the case of scanning in the X direction, these two corresponding points are (x i , S i ) and (x i+1 , S i+1 ), and in the case of scanning in the Y direction, they are (y i , S i ) and (y i+1 , S i+1 )).
- the coordinates of the edge positions can be calculated from the points of intersection between the straight line corresponding to the prescribed graduated tone value T which serves as the reference judgment value and the straight line which passes through two points which are on either side of this prescribed graduated tone value T.
- Subsidiary droplets which separate from the main droplet during ink ejection may occur in particular nozzles, for various reasons, such as nozzle defects or the like.
- a satellite droplet of this kind deposits at a position different from the deposition position of the main droplet on the recording paper, then it forms a satellite dot.
- an additional dot row 116 constituted of satellite dots 114 caused by the deposition of subsidiary droplets is added alongside the dot row 112 formed by the main dots 110 created by the deposition of main droplets.
- FIG. 19A is a diagram showing a profile graph which traverses a normal line pattern that does not contain satellite dots (here, the horizontal axis represents the pixel position in the Y direction).
- FIG. 19B is a diagram showing a profile graph which traverses a line pattern that does contain satellite dots 114 .
- the profile graph shown in FIG. 19A has a substantially symmetrical shape centered on the peak position.
- the profile graph shown in FIG. 19B contains signal components corresponding to the satellite dots, and hence it has an asymmetrical shape.
- the presence or absence of satellite dots is judged on the basis of the asymmetry of the profile graph corresponding to the line pattern, or the presence of sub-peaks (peaks caused by satellite dots), and the edge positions are recalculated by determining the amount of displacement from the estimated edge positions.
- the profile graph of a line pattern containing satellite dots is as shown in FIG. 19C .
- the graph contains satellite dots, then the symmetrical shape is disturbed, and the value of R diverges from 0.5 and approaches a value of 0 or 1.
- the prescribed value is set to an optimal value on the basis of experimental research, but in general terms, it can be set to 0.07 or above.
- this information is stored and can be used, for instance, to control the implementation of head maintenance (namely, cleaning operations for restoring the nozzle ejection performance, such as nozzle suctioning, preliminary ejection, wiping of the nozzle surface, and so on).
- dirt or dust may adhere to the sample chart, for any particular reason, and it can be envisaged that this dirt or dust (hereinafter, referred to simply as “dirt”) may have an adverse effect on the reading of the line patterns and the analysis of the resulting images.
- the reference numeral 120 in FIG. 18 indicates the aspect of dirt adhering to the sample chart when it has been captured as an image. The following countermeasures are implemented in order to deal with dirt and dust of this kind.
- the RGB signals all display the same variation in response to the presence of dirt. Therefore, the presence or absence of dirt is judged from data at a read wavelength which is separate from the absorption wavelength of the ink under measurement, and processing is carried out in order to exclude the profile data containing the effects of this dirt, from the calculation.
- the G signal (or B signal) is used to distinguish the dirt from the cyan ink (which displays greatest variation in the R signal), and hence a position producing a large variation in the G signal is judged to be affected by dirt.
- This position is excluded from the profile graph used to calculate the peak position and edge positions, and therefore the effects of the dirt on the calculation process can be minimized.
- the signal value in the dirt/dust determination channel shows a deviation of ⁇ 3 ⁇ or above from the average value (i.e., the signal value is not less than (average value +3 ⁇ ), or not greater than (average value ⁇ 3 ⁇ ))
- the signal value is considered to be affected by dirt, and the data for that position is removed (deleted).
- the coordinates are not integers, then integer positions that can be obtained by rounding up or down to the nearest whole number are used.
- the statistical values are calculated for the perpendicular distance between the straight line calculated by the least-square method described below, and the coordinate positions used in this least-square method. If the distance diverges by ⁇ 3 ⁇ or above, then this positional data is deleted and the straight line based on the least-square method is recalculated.
- this information can be stored and used to control the implementation of head maintenance (namely, cleaning operations for restoring the nozzle ejection performance, such as nozzle suctioning, preliminary ejection, wiping of the nozzle surface, and the like).
- the straight line corresponding to the peak positions is referred to as “P k ”
- the straight line corresponding to the edge L is referred to as “L k ”
- R k the straight line corresponding to the edge R
- Step 9 The nozzle positions (dot deposition positions) and the line width are determined as described below, on the basis of the straight line P k , the straight line L k and the straight line R k determined in Step 8 by using the least-square method described above in respect of the quadrilateral shape k containing the line patterns;
- the line width D is calculated as the average of the values D 0 and D 1 , which can be obtained as follows. More specifically, the point of intersection C 0 between the straight line L k and the straight line R Vk is determined and the perpendicular distance D 0 between this point of intersection C 0 and the straight line R k is determined (see FIG. 21 ).
- the straight line R Vk is a line which is perpendicular to the straight line R k and passes through the central coordinates of the quadrilateral shape k containing the line patterns.
- the X coordinates and Y coordinates can be converted into actual distances by multiplying X and Y respectively by the actual unit distance corresponding to one pixel.
- the straight line L Vk is a line which is perpendicular to the straight line L k and passes through the central coordinates of the quadrilateral shape k containing the line patterns.
- the dot deposition position (in other words, the effective nozzle position) is found by firstly calculating the average value ⁇ of the gradient of the straight line P k , and determining the gradient ⁇ V which is perpendicular to this gradient ⁇ .
- the straight line, “Base Line”, which has the gradient ⁇ V and passes through the central position of the whole line pattern block (this may be the average value of the central positions of the respective quadrilateral shapes k) is determined, and the points of intersection C Pk between this straight line, “Base Line”, and the respective straight lines P k , are determined.
- Distances between two points C Pk aligned along the straight line, “BaseLine”, represent the effective nozzle spacings (in other words, the distance between two points C Pk for adjacent two of the straight lines P k represents the effective nozzle spacing between two nozzles corresponding to the adjacent two of the straight lines P k ). Furthermore, the position of each point C Pk corresponds to an effective nozzle position (the deposition position of a dot created by a droplet ejected from the corresponding nozzle).
- the common reference line “Common Base Line” (gradient ⁇ V ) which passes through the central position AC of all of the blocks is determined, and as shown in FIG. 23 , the point of intersection BCC k determined by the perpendicular line drawn down to BBC k from the central position BC k of each of the straight lines (Base Line) is found, and a parameter (Move_X k , Move_Y k ) for the parallel movement from BC k to BCC k is calculated accordingly.
- the points CP k are then moved in parallel by using this parameter (Move_X k , Move_Y k ). This is equivalent to mapping the “Base Lines” onto the common reference line, “Common Base Line”.
- Move_X k represents parallel movement in the X direction
- Move_Y k represents parallel movement in the Y direction.
- One desirable example of a means of resolving problems of this kind is to increase the determination accuracy of the positions between different blocks, compared to the positional accuracy of the reading apparatus, by adopting sample charts having a composition as shown in FIGS. 24 to 26 , for example.
- FIG. 24 is a diagram showing a sample chart in which a line derived from ink droplets ejected from a reference nozzle (nozzle number 0 in FIG. 24 ) is formed in all of the line pattern blocks.
- the sample chart in FIG. 24 contains a line pattern (indicated by reference numeral 130 ) formed by a common reference nozzle which is present in all of the line pattern blocks.
- FIG. 25 is a diagram showing an example of a further measurement pattern which takes account of the correction of positional error between blocks.
- a line pattern block created by nozzles having a nozzle number 5 m (where m is an integer equal to or greater than 0) is formed below (after) the line pattern block formed by nozzles having a nozzle number of 4 n +3.
- the nozzles belonging to the group 5 m include nozzles having the nozzle numbers 4 n , 4 n +1, 4 n +2, 4 n +3, evenly.
- the nozzle positions belonging to the block corresponding to the nozzle numbers 5 m are taken to be correct positions, and these positions are used when correcting the nozzle positions of the other blocks so as to match the nozzle positions belonging to the block 5 m.
- the line pattern block 5 m shown at the bottom of FIG. 25 includes the nozzles numbered 0 , 5 , 10 , 15 , 20 . . . .
- this nozzle “ 21 ” belongs to the block ( 4 n +1).
- the nozzles numbered 5 and 25 which belong to both block 5 m and block ( 4 n +1) and which are disposed on either side of “ 21 ” are identified, and a parallel movement parameter is determined so as to match the nozzle 5 position in the 4 n +1 block is determined, as well as a parameter for extending the distance between the nozzle 5 position and the nozzle 25 position so as to match the nozzle 25 position in the 4 n +1 block.
- the nozzle 5 position and the nozzle 25 position in block 4 n +1 are made to match the positions of nozzle 5 and nozzle 25 in the block 5 m .
- the position of the nozzle number 21 is corrected by using the parallel movement parameter and the extending parameter.
- correction is carried out using the same correction parameters as the nearest position which belongs to common blocks. For example, correction is performed for nozzle number 1 (which belongs to the 4 n +1 block) in the same fashion as if it were positioned between the nozzle numbers 5 and 25 , which are the closest nozzles belonging to common blocks.
- FIG. 26 is an example of a further measurement pattern which takes account of the correction of positional error between blocks.
- FIG. 26 shows an example where the nozzle positions belonging to blocks which are disposed between reference blocks (in FIG. 26 , 4 n blocks) are corrected on the basis of variation in the reference blocks.
- the same block as the block ( 4 n ) at one end of the sample chart is formed at the other end (the bottommost part of the FIG. 26 ).
- this composition it is possible to identify the variation in the positional relationship of the same nozzle, between the upper and lower versions of the same block ( 4 n ), and the variation in the positional relationship thus identified can be reflected in the blocks ( 4 n +1, 4 n +2, 4 n +3) which are disposed between the two blocks ( 4 n ).
- the nozzle number 0 and the nozzle number 4 belonging block 4 n which are disposed on either side of the nozzle number 1 , are converted from upper 4 n block to lower 4 n block in the following manner from the positions PU 0 and PU 1 in the upper end block, to the positions PL 0 , PL 1 in the lower end block, via the block 4 n +1 to which the nozzle number 1 belongs.
- FIG. 28 is a flowchart showing a first example of the dot measurement processing. As shown in FIG. 28 , firstly, the sample chart is read in at a prescribed oblique angle and electronic image data for the captured image is acquired (step S 110 ).
- the white regions and the line regions are identified from this captured image, and the white level and the black level in the respective regions are determined (step S 112 in FIG. 28 ).
- a shading correction table corresponding to the respective line regions is created on the basis of the white level and black level information thus obtained (step S 114 ).
- the method for carrying out shading correction for the X direction and the Y direction has been described already above.
- the edge positions (left and right-hand edges) and the peak position (which may also be the trough position; the same applies below) are identified on the basis of the profile graph (step S 116 ).
- a sub-routine for dust/dirt determination processing is carried out (step S 120 ).
- FIG. 29 is a diagram showing a flowchart of dust/dirt determination processing.
- the average value and the standard deviation of the graduated tone values corresponding to the edge positions obtained from the profile graph in the dirt/dust determination channel are calculated, upper and lower limits corresponding to a value of (average value ⁇ standard deviation ⁇ 3) are established, and any edge positions (in other words, edge positions obtained from the measurement channel) corresponding to graduated tone values which are outside the range between the upper and lower limits (graduated tone values in the dirt/dust determination channel) are excluded.
- step S 214 the average value and the standard deviation of the graduated tone values corresponding to the peak position obtained from the profile graph in the dirt/dust determination channel are calculated, upper and lower limits corresponding to a value of (average value ⁇ standard deviation ⁇ 3) are established, and any peak positions (in other words, peak positions obtained from the measurement channel) corresponding to graduated tone values which are outside the range between the upper and lower limits (graduated tone values in the dirt/dust determination channel) are excluded.
- step S 210 if the dirt/dust determination channel has not been set (NO verdict), then the procedure advances to step S 222 .
- the least-square straight line is calculated from the respective edge positions calculated from the plurality of profile graphs in the same line region, and the perpendicular distances from the straight line thus obtained to the respective edge positions are calculated, and the average value and standard deviation of these perpendicular distances are found.
- An upper limit and a lower limit are set at a value of (average value ⁇ standard deviation ⁇ 3), and any edge positions (obtained from the measurement channel) corresponding to a perpendicular distance outside the range between the upper limit and the lower limit are excluded.
- step S 224 the least-square straight line is calculated from the respective peak positions calculated from the plurality of profile graphs in the same line region, the perpendicular distances from the straight line thus obtained to the respective peaks positions are calculated, and the average value and standard deviation of these perpendicular distances are found.
- An upper limit and a lower limit are set at a value of (average value +standard deviation ⁇ 3), and peak positions (obtained from the measurement channel) corresponding to a perpendicular distance outside the range between the upper limit and the lower limit are excluded.
- step S 214 or S 224 After the processing in step S 214 or S 224 , the procedure leaves the sub-routine in FIG. 29 and returns to the sequence in FIG. 28 (step S 120 ).
- step S 120 in FIG. 28 least-square straight lines are calculated respectively on the basis of the remaining edge positions and peak positions which have not been excluded in the dirt/dust determination processing in step S 118 (step S 120 ).
- the average value of the gradients of the respective least-square straight lines is determined, and a straight line “Base Line” (hereinafter, referred to as “straight line BL”), which is perpendicular to the average value of the gradient and which passes through the central coordinates of the line pattern block, is determined (step S 122 ).
- Base Line hereinafter, referred to as “straight line BL”
- step S 124 the distance between the straight line BL and the two edge approximation lines which belong to one line pattern are calculated, and the distance thus obtained is taken as the “line width”. Furthermore, the distances between the respective points of intersection between the straight line BL and the peak approximation lines of the line patterns are calculated, and the distances thus obtained are taken as the “line interval”.
- the “line interval” obtained in this way indicates the dot deposition positions created by the respective nozzles.
- processing is carried out for converting the information about the line width into dot diameter information or ink volume information, or both, on the basis of a previously established relationship between the line width and the dot diameter (or ink volume) (step S 126 ).
- the information on the dot deposition positions (line intervals) and dot diameters (ink volume) obtained by the steps described above is input to the inkjet recording apparatus, and is used for correcting droplet ejection and controlling head maintenance, and the like.
- FIG. 30 is a flowchart showing a second example of the measurement processing. As shown in FIG. 30 , firstly, the sample chart is read in at a prescribed oblique angle and electronic image data is acquired (step S 110 ).
- step S 312 the procedure advances to step S 312 , and it is judged whether or not block processing 1 (the sub-routine processing shown in FIG. 31 ) has been completed in respect of all of the line pattern blocks in the sample chart. If the verdict is NO at step S 312 , then the procedure advances to step S 314 , and the block processing 1 is carried out in respect of the blocks that have not been processed.
- block processing 1 the sub-routine processing shown in FIG. 31
- FIG. 31 is a flowchart showing the contents of the sub-routine of the block processing 1 .
- the sub-routine of the block processing 1 shown in FIG. 31 is started, firstly, the white region and the line region are identified, and the white level and the black level of the respective regions are determined (step S 410 ). Thereupon, a shading correction table corresponding to the respective line regions is created (step S 414 ).
- the edge positions (left and right-hand edges) and the peak position (which may also be the trough position; the same applies below) are identified on the basis of the profile graph (step S 416 ).
- step S 418 a sub-routine (see FIG. 29 ) for dust/dirt determination processing is carried out.
- the least-square straight line is calculated on the basis of the established edge positions and peak positions (step S 422 ).
- the central coordinates P i of the block in question are determined, and the average value ⁇ i of the gradients of the respective least-square straight lines for the block is determined (step S 424 ).
- step S 426 the procedure advances to step S 426 and the nozzle numbers corresponding to the block and the straight lines are mutually associated.
- a process for judging defective nozzles described hereinafter (shown by the flowchart in FIG. 32 ) is carried out, and defective nozzles are identified (step S 426 in FIG. 31 ).
- step S 426 the procedure leaves the sub-routine in FIG. 31 and returns to the sequence in FIG. 30 (step S 312 ).
- FIG. 32 is a flowchart showing the sub-routine of the defective nozzle judgment processing.
- the defective nozzle judgment processing firstly the interval between line patterns which are mutually adjacent in the block in question is divided by the expected value of the interval between mutually adjacent line patterns in that block, and the result is set as q (step S 440 ). Thereupon, if the integer value Q obtained by rounding the value of q thus determined up or down to the nearest integer is equal to or greater than 1, then the number of defective nozzles is taken to be Q ⁇ 1, and the nozzle number is incremented by an amount corresponding to the number of defective nozzles (step S 442 ). When this processing for identifying defective nozzles has terminated, the procedure returns to step S 312 in FIG. 30 .
- step S 316 the average value ⁇ ave , over all of the blocks, of the average value ⁇ i of the gradient of the least-square straight line of each block, is determined, and similarly, the average value P ave , over all of the blocks, of the central coordinates P i of each block is also determined (step S 316 ).
- the straight line BL i forming the reference for the block is determined as a straight line which is perpendicular to the average gradient value ⁇ ave and which passes through the central coordinates P i of the line pattern block, and furthermore, a common reference straight line, “Common Base Line” (hereinafter, also referred to as “straight line CBL”) forming a reference for all of the blocks is determined as a straight line which is perpendicular to the average gradient value ⁇ ave and which passes through the central coordinates P ave of all of the line pattern blocks (step S 318 ).
- straight line CBL Common Base Line
- a parameter MOVE i is determined for each BL i , in order to move a point on BL i , in parallel, to a point on CBL, so as to correspond to a perpendicular line descending from the point on BL i to CBL (step S 320 ).
- step S 322 it is judged whether or not block processing 2 (the sub-routine processing shown in FIG. 33 ) has been completed in respect of all of the line pattern blocks in the sample chart. If the verdict is NO at step S 322 , then the procedure advances to step S 324 , and the block processing 2 is carried out in respect of the blocks that have not been processed.
- FIG. 33 is a flowchart showing the contents of the sub-routine of the block processing 2 .
- the processing shown in FIG. 33 is started, firstly, the coordinates of the points of intersection between the two edge approximation lines belonging to the same line pattern and the reference straight line BL i for the block in question are calculated, and furthermore, the coordinates of the point of intersection between the peak approximation line of the line pattern and the reference straight line BL i of the block are calculated (step S 450 ).
- the points of intersection thus obtained are then converted to coordinates on the reference straight line CBL of all the blocks, by using the parallel movement parameter MOVES which moves the points of intersection onto the line CBL (step S 452 ).
- the procedure leaves the sub-routine in FIG. 33 and returns to the sequence in FIG. 30 (step S 322 ).
- step S 326 the calculated coordinates on the reference straight line CBL of all of the blocks of the nozzles are rearranged in nozzle order. Thereupon, for each of the rearranged nozzles, the distance between the two edge approximation lines and the coordinates on the straight line CBL are calculated, and the distances thus found are taken to be the line width (step S 326 ).
- processing is carried out for converting the information about the line width into dot diameter information or ink volume information, or both, on the basis of a previously established relationship between the line width and the dot diameter (or ink volume) (step S 328 ).
- FIG. 34 is a flowchart showing a third example of the dot measurement processing. As shown in FIG. 34 , firstly, the sample chart is read in at a prescribed oblique angle and electronic image data is acquired (step S 510 ).
- step S 512 the procedure advances to step S 512 , and it is judged whether or not block processing 1 (the sub-routine processing shown in FIG. 31 ) has been completed in respect of all of the line pattern blocks in the sample chart. If the verdict is NO at step S 512 , then the procedure advances to step S 514 , and the block processing 1 is carried out in respect of the blocks that have not been processed.
- block processing 1 the sub-routine processing shown in FIG. 31
- step S 512 When the block processing has been completed for all of the blocks in the sample chart, then a YES verdict is obtained at step S 512 and the procedure then advances to step S 516 .
- the straight line CBL which serves as a reference for all of the blocks is determined, as the straight line which is perpendicular to the average gradient value ⁇ 0 of the gradients of the respective least-square straight lines of the reference block ( 5 m nozzles), and which passes through the central coordinates P 0 of the reference block ( 5 m nozzles).
- step S 518 the procedure advances to step S 518 , and the coordinates of the points of intersection between the reference straight line CBL of the block and the two edge approximation lines (i.e., a right edge approximation line and left edge approximation line) for each of the line patterns of the reference block ( 5 m nozzles) are calculated. Furthermore, the coordinates of the respective points of intersection between the reference straight line CBL of the block and the peak approximation line for each of the line patterns belonging to the reference block ( 5 m nozzles) are calculated (step S 518 ).
- step S 518 the coordinates of the points of intersection obtained by the calculation in step S 518 are converted into one-dimensional coordinates on the reference straight line CBL (step S 520 ).
- step S 522 it is judged whether or not block processing 3 (the sub-routine processing shown in FIG. 35 ) has been completed in respect of all of the line pattern blocks in the sample chart. If the verdict is NO at step S 522 , then the procedure advances to step S 524 , and the block processing 3 is carried out in respect of the blocks that have not been processed.
- FIG. 35 is a flowchart showing the contents of the sub-routine of the block processing 3 .
- the straight line BL i serving as a reference for the respective blocks is determined as a straight line which is perpendicular to the average gradient value ⁇ i and which passes through the central coordinates P i of the respective line pattern block (step S 610 ).
- step S 612 the procedure advances to step S 612 , and the coordinates of the points of intersection between the reference straight line BL i of the block and the two edge approximation lines for each of the line patterns are calculated. Furthermore, the coordinates of the respective points of intersection between the peak approximation lines of the line patterns and the reference straight line BL i of the block in question are calculated (step S 612 ).
- the coordinates of the points of intersection calculated by this process are converted into one-dimensional coordinates on the reference straight line BL i (step S 614 ).
- a conversion function F 1 satisfying the input data sequence X ij and the output data sequence Y i is determined for the one-dimensional coordinates sequence X ij on the reference straight line BL i of the block, and the one-dimensional coordinates Y j on the reference straight line CBL of the reference block ( 5 m nozzles) (step S 616 ).
- the one-dimensional coordinates on the reference straight line BL i determined previously for the line patterns belonging to the block in question are converted by means of the conversion function F 1 into one-dimensional coordinates on the reference straight line CBL of the reference block ( 5 m nozzles) (step S 618 ).
- FIG. 36 is a diagram showing the conversion function F 1 for the block i.
- the nozzles 5 , 25 and 45 belonging to the block ( 4 N+1 nozzles) are in common with the reference block ( 5 m nozzles).
- the conversion function F 1 has conversion characteristics whereby the one-dimensional coordinates of these common nozzles on the reference straight line BL i are taken as an input, and one-dimensional coordinates Y j on the reference straight line CBL of all of the blocks are output accordingly.
- the coordinates i.e., the coordinates of the nozzles 5 , 9 , 13 , . . .
- the straight line BL i are converted into coordinates on the reference straight line CBL which is common to all of the blocks.
- the interpolation processing uses linear interpolation, then the coordinates of the nozzle 1 on the reference straight line BL i are converted into coordinates on the reference straight line CBL which is common to all of the blocks, using interpolation characteristics similar to the most proximate interpolation processing.
- step S 618 in FIG. 35 the procedure leaves the sub-routine in FIG. 35 and returns to the procedure in FIG. 34 (step S 522 ).
- step S 522 the procedure then advances to step S 526 .
- step S 526 the calculated coordinates on the reference straight line CBL of the reference blocks of the nozzles are rearranged in nozzle order.
- the distance between the two edge approximation lines and the coordinates on the straight line CBL is calculated, in respective of each of the rearranged nozzles, and this distance is set as the line width.
- the distance between the peak approximation line of the line pattern and the coordinates on the straight line CBL is calculated, in respect of each of the rearranged nozzles, and this distance is set as the line width.
- processing is carried out for converting the information about the line width into dot diameter information or ink volume information, or both, on the basis of a previously established relationship between the line width and the dot diameter (and/or ink volume) (step S 528 ).
- the reading action is performed by applying an oblique angle as shown in FIG. 9 , then the plurality of photoreceptor elements traverse the line patterns, and therefore the peak position and the edge positions of the line patterns are captured by a plurality of photoreceptor elements. Consequently, the difference in the characteristics of the photoreceptor elements are averaged out, and hence the effects of the characteristics of the photoreceptor elements on the dot positions and the dot diameters calculated as a result are reduced.
- FIG. 37 is a diagram showing the results of measuring line patterns at different resolutions (4800 dpi, 2400 dpi, 1200 dpi) and different reading angles.
- the Y axis in FIG. 37 indicates the average of the absolute value of the difference between a reference measurement value and the line pitch measurement value under the respective conditions. It can be seen that the measurement accuracy is best when the reading angle is approximately 8 degrees.
- a program (dot measurement processing program) which causes a computer to execute the image analysis processing algorithm used in the dot measurement according to the present embodiment, and by running a computer on the basis of this program, it is possible to cause the computer to function as a calculating apparatus for the dot measurement apparatus.
- FIG. 38 is a block diagram showing an example of the composition of a dot measurement apparatus.
- the dot measurement apparatus 200 shown in FIG. 38 comprises a flat head scanner, which serves as an image reading apparatus 202 , and a computer 210 which performs calculations, and other operations, for image analysis.
- the image reading apparatus 202 is provided with an RGB line sensor which reads in the line patterns on the sample chart in an oblique direction, as shown in FIG. 9 , and also comprises a scanning mechanism (a movement mechanism) which moves this line sensor in the reading scanning direction (the Y direction in FIG. 9 ), a drive circuit of the line sensor, and a signal processing circuit, or the like, which converts the output signal from the sensor (image capture signal), from analog to digital, to obtain a digital image data of a prescribed format.
- the computer 210 comprises a main body 212 , a display (display device) 214 , and input apparatuses, such as a keyboard and mouse (input devices for inputting various commands) 216 .
- the main body 212 houses a central processing unit (CPU) 220 , a RAM 222 , a ROM 224 , an input control unit 226 which controls the input of signals from the input apparatuses 216 , a display control unit 228 which outputs display signals to the display 214 , a hard disk apparatus 230 , a communications interface 232 , a media interface 234 , and the like, and these respective circuits are mutually connected by means of a bus 236 .
- CPU central processing unit
- RAM 222 random access memory
- ROM 224 read-only memory
- an input control unit 226 which controls the input of signals from the input apparatuses 216
- a display control unit 228 which outputs display signals to the display 214
- a hard disk apparatus 230 a communications
- the CPU 220 functions as a general control apparatus and computing apparatus (computing device).
- the RAM 222 is used as a temporary data storage region, and as a work area during execution of the program by the CPU 220 .
- the ROM 224 is a rewriteable non-volatile storage device which stores a boot program for operating the CPU 220 , various settings values and network connection information, and the like.
- An operating system (OS) and various applicational software programs and data, and the like, are stored in the hard disk apparatus 230 .
- the communications interface 232 is a device for connecting to an external device or communications network, on the basis of a prescribed communications system, such as USB (Universal Serial Bus), LAN, Bluetooth (registered trademark), or the like.
- the media interface 234 is a device which controls the reading and writing of the external storage apparatus 238 , which is typically a memory card, a magnetic disk, a magneto-optical disk, or an optical disk.
- the image reading apparatus 202 and the computer 210 are connected via a communications interface 232 , and the data of a captured image which is read in by the image reading apparatus 202 is input to the computer 210 .
- a composition can be adopted in which the data of the captured image acquired by the image reading apparatus 202 is stored temporarily in the external storage apparatus 238 , and the captured image data is input to the computer 210 via this external storage apparatus 238 .
- the image analysis processing program for the dot measurement method according to the present embodiment of the present invention is stored in the hard disk apparatus 230 or the external storage apparatus 238 , and the program is read out, developed in the RAM 222 and executed, according to requirements.
- the operator is able to input various initial values, by operating the input apparatus 216 while observing the application window (not shown) displayed on the display monitor 214 , as well as being able to confirm the calculation results on the monitor 214 .
- the data resulting from the calculation operations can be stored in the external storage apparatus 238 or output externally via the communications interface 232 .
- the information resulting from the measurement process is input to the inkjet recording apparatus via the communications interface 232 or the external storage apparatus 238 .
- a line sensor is used as the imaging apparatus of the image reading apparatus, but instead of the line sensor, it is also possible to use an area sensor (surface imaging device). It is also possible to adopt a composition in which the whole of the sample chart can be imaged by means of one area sensor, or a composition in which the imaging area is divided up into separate regions, imaging is carried out for each region, and the data for the whole of the sample chart is acquired by joining together the respective regions.
- FIG. 39 is a diagram showing an example in which the imaging area is divided up into a plurality of regions, and images of each of the regions are captured by means of an area sensor. More specifically, a plurality of area sensors are arranged in the paper width direction, and the direction of arrangement of the photoreceptor elements of the respective area sensors has an oblique angle with respect to the line patterns. The boundary regions of the imaging regions corresponding to the respective area sensors are made to overlap with each other by a prescribed number of pixels, and by joining together the captured image data obtained from the respective area sensors, it is possible to obtain captured image data which includes all of the line patterns of the sample chart.
- the calculation processing may be carried out for each divided region, respectively and independently, or it may be carried out on the basis of the whole image data after it has been joined together.
- an inkjet recording apparatus using a page-wide full line type head having a nozzle row of a length corresponding to the entire width of the recording medium was described, but the scope of application of the present invention is not limited to this, and the present invention may also be applied to an inkjet recording apparatus which performs image recording by means of a plurality of head scanning actions which move a short recording head, such as a serial head (shuttle scanning head), or the like.
- a serial head shuttle scanning head
- an inkjet recording apparatus was described as one example of an image forming apparatus, but the scope of the present invention is not limited to this, and it may also be applied to various types of apparatuses which spray various types of liquids such as functional liquids, onto an ejection receiving medium, by means of a liquid ejection head (for instance, an application apparatus, a coating apparatus, a wiring printing apparatus, a very fine structure forming apparatus, or the like).
- a liquid ejection head for instance, an application apparatus, a coating apparatus, a wiring printing apparatus, a very fine structure forming apparatus, or the like.
- the present invention can be applied widely as measurement technology for measuring dot deposition positions and dot diameters (droplet volumes) in various types of liquid ejection apparatuses which eject (spray) liquid, such as commercial fine application apparatuses, resist printing apparatuses, wiring printing apparatuses for electronic circuit boards, dye processing apparatuses, coating apparatuses, and the like.
- the present invention is directed to a dot measurement method of measuring at least one of a diameter of dots and an ejection volume of droplets of liquid ejected through nozzles arranged in a liquid ejection head, the ejected droplets being deposited on an ejection receiving medium to form the dots on the ejection receiving medium, the method comprising: a line pattern forming step of forming line patterns on the ejection receiving medium by ejecting and depositing the droplets on the ejection receiving medium through the nozzles while the liquid ejection head and the ejection receiving medium are being moved relatively to each other, each of the line patterns being parallel with a line direction and constituted of a row of the dots corresponding to one of the nozzles; a pattern reading step of capturing an image of the line patterns by means of an imaging apparatus including photoreceptors to acquire electronic image data representing the image of the line patterns, the photoreceptors of the imaging apparatus being aligned in a row that obliquely intersects with the line direction of the
- the shape of the profile graph of the image signal value of the captured image varies depending on what value is plotted on the vertical axis. If the optical density of the line pattern is plotted on the vertical axis, then the signal value of the line pattern section is high and the signal value of the non-line pattern section is low. Therefore, the “extreme value position corresponding to the density center of the line pattern” is the position of the maximum value in the profile graph. On the other hand, if the luminosity signal or the brightness signal of the image data is plotted on the vertical axis, then the signal value in the line pattern section is low and the signal value in the non-line pattern section is high. Therefore, the “extreme value position corresponding to the density center of the line pattern” is the position of the minimum value in the profile graph.
- an interpolation method based on a quadratic function, or the like is used for calculating the extreme value position. Furthermore, in calculating the first edge position and the second edge position, it is desirable to use linear interpolation in order to specify the positions with a greater degree of accuracy than the reading resolution.
- the correspondence between the positional information of a pixel in the electronic image data and the physical distance on the actual ejection receiving medium can be calculated on the basis of the reading resolution. Since the conversion from the coordinates system of the pixels in the image data to the coordinates system on the actual ejection receiving medium is defined by a conversion formula, then it is an arbitrary decision which coordinates system is to be used for developing the calculation, and at which stage of the calculation the coordinates are to be converted.
- One compositional example of a liquid ejection head according to the present invention is a full line type head in which a plurality of nozzles are arranged through a length corresponding to the full width of the ejection receiving medium.
- a mode may be adopted in which a plurality of relatively short recording head modules having nozzle rows which do not reach a length corresponding to the full width of the ejection receiving medium are combined and joined together, thereby forming nozzle rows of a length that corresponds to the full width of the ejection receiving medium.
- a full line type head is usually disposed in a direction that is perpendicular to the feed direction (conveyance direction) of the ejection receiving medium, but a mode may also be adopted in which the head is disposed following an oblique direction that forms a prescribed angle with respect to the direction perpendicular to the conveyance direction.
- the “ejection receiving medium” is a medium which receives the deposition of liquid droplets ejected from the nozzles (ejection ports) of a liquid ejection head, and this term includes a print medium, image forming medium, recording medium, image receiving medium, ejection receiving medium, intermediate transfer body, or the like, in an inkjet printer.
- a print medium image forming medium, recording medium, image receiving medium, ejection receiving medium, intermediate transfer body, or the like, in an inkjet printer.
- the shape or material of the medium which may be various types of media, irrespective of material and size, such as continuous paper, cut paper, sealed paper, resin sheets, such as OHP sheets, film, cloth, a printed circuit substrate on which a wiring pattern, or the like, is formed, a rubber sheet, a metal sheet, or the like.
- the conveyance device for causing the ejection receiving medium and the liquid ejection head to move relatively to each other may includes a mode where the ejection receiving medium is conveyed with respect to a stationary (fixed) head, or a mode where a head is moved with respect to a stationary ejection receiving medium, or a mode where both the head and the ejection receiving medium are moved.
- a mode where the ejection receiving medium is conveyed with respect to a stationary (fixed) head or a mode where a head is moved with respect to a stationary ejection receiving medium, or a mode where both the head and the ejection receiving medium are moved.
- the imaging apparatus used in the present invention it is possible to employ a line sensor (linear image sensor), or to employ an area sensor.
- the reading resolution varies with the size of the dots under measurement, but for example, a resolution of 12000 dpi or above is desirable for measuring the dots in an inkjet printer which achieves photo-quality image recording.
- a color image of the line patterns is captured by means of the imaging apparatus including a color image sensor, and the electronic image data are acquired for a plurality of wavelength regions in accordance with spectral sensitivity characteristics of the color image sensor.
- the liquids subject to measurement are liquids of a plurality of types having different absorption characteristics, for instance, in the case of measuring dots formed by inks of a plurality of colors, it is desirable to use a color image sensor which is capable of separating the different colors, as the imaging apparatus.
- a color image sensor which is capable of separating the different colors, as the imaging apparatus.
- an imaging device equipped with RGB primary color filters, or an imaging device equipped with CMY secondary color filters is used.
- profile graphs are obtained by taking account of the absorption spectrum of the liquid under measurement and using the signal of the color channel which produces the greatest contrast.
- the above-described dot measurement method further includes: a dust judgment processing step of judging whether there are effects of dust in the captured image in accordance with profile graphs obtained from the electronic image data acquired for one of the plurality of wavelength regions that is not most sensitive to an absorption peak wavelength of the liquid; and a dust-affected data exclusion step of excluding data affected by the dust from an calculation object for which at least one of the characteristic position calculating step and the approximation line calculating step is implemented, when it is judged that there are the effects of the dust in the dust judgment processing step.
- the above-described dot measurement method further includes: a symmetry judgment processing step of judging symmetry of the profile graphs with respect to the extreme value positions of the profile graphs; and an asymmetrical data exclusion processing step of excluding data corresponding to an asymmetrical profile graph of the profile graphs, from an calculation object for which at least one of the characteristic position calculating step and the approximation line calculating step is implemented, when the asymmetrical profile graph of the profile graphs is not judged to have the symmetry in the symmetry judgment processing step.
- a plurality of line pattern blocks are formed on a sheet of the ejection receiving medium to be arranged in the line direction of the line patterns, each of the line pattern blocks being composed of the line patterns, the plurality of line pattern blocks commonly including a reference line pattern that is formed of the dots of the droplets ejected through a common nozzle of the nozzles.
- the above-described dot measurement method further includes a block position alignment processing step of adjusting positions of the line pattern blocks in accordance with a relationship of positions of the reference line pattern at the line pattern blocks.
- a plurality of line pattern blocks are formed on a sheet of the ejection receiving medium to be arranged in the line direction of the line patterns, each of the line pattern blocks being composed of the line patterns, at least two of the line pattern blocks commonly including a reference line pattern that is formed of the dots of the droplets ejected through a common nozzle of the nozzles.
- the above-described dot measurement method further includes a block position alignment processing step of adjusting positions of the line pattern blocks in accordance with a relationship of positions of the reference line pattern at the at least two of line pattern blocks
- the imaging apparatus includes a line sensor composed of the photoreceptors, and the image of the line patterns is captured by moving the line sensor and the ejection receiving medium on which the line patterns have been formed, relatively to each other.
- the present invention is also directed to a dot measurement apparatus which measures at least one of a diameter of dots and an ejection volume of droplets of liquid ejected through nozzles arranged in a liquid ejection head, the ejected droplets being deposited on an ejection receiving medium to form the dots on the ejection receiving medium
- the dot measurement apparatus including: a pattern reading device which includes an imaging apparatus capturing an image of line patterns on the ejection receiving medium to acquire electronic image data representing the image of the line patterns, the line patterns being formed by ejecting and depositing the droplets on the ejection receiving medium through the nozzles while the liquid ejection head and the ejection receiving medium are being moved relatively to each other, each of the line patterns being parallel with a line direction and constituted of a row of the dots corresponding to one of the nozzles, the imaging apparatus including photoreceptors that are aligned in a row that obliquely intersects with the line direction of the line patterns at a prescribed angle, the electronic image data
- the dot measurement apparatus of the present invention may be provided separately to the liquid droplet ejection apparatus which ejects liquid droplets (the inkjet recording apparatus, wiring printing apparatus, or the like), or the dot measurement apparatus may be incorporated into the liquid droplet ejection apparatus.
- the present invention is also directed to a computer readable medium storing instructions causing a computer to function as the profile graph acquiring device, the characteristic position calculating device, the approximation line calculating device, the deposition position calculating device, the line width calculating device, the correlation information storing device, and the measurement value calculating device in the above-described dot measurement apparatus.
- the above-described dot measurement apparatus can be achieved by combining an image reading apparatus having the above-described imaging apparatus, and a computer which is installed with the computer readable medium according to this aspect of the present invention.
Abstract
Description
output signal=gain0×input signal+offset0;
gain0=(WH ave −BK ave)/(WH0i −BK i); and
offset0=−gain0×BK i +BK ave.
output signal=gain1×input signal+offset 1,
whereby when the X coordinate is X1 i i, then if the input value is BKi, the output value will be BKave, and if the input value is (WH0 i+WH2 i)/2, then the output value will be WHave.
output signal=gain2×input signal+offset2,
whereby, when the X coordinate is X2 i, then if the input value is BKi, the output value will be BKave, and if the input value is WH2 i, then the output value will be WHave.
output value=gain(x)×input value+offset(x).
In this case, when the X coordinate is in the range between X0 i and X1 i(X0 i<x<X1 i), the following equations are used:
gain(x)=s×gain0+t×gain1, and
offset(x)=s×offset0+t×offset1,
where s=(X1i −x)/(X1i −X0i), and
t=(x−X0i)/(X1i −X0i).
On the other hand, when the X coordinate is in the range between X1 i and X2 i (X1 i<x<X2 i), the following equations are used:
gain(x)=s×gain1+t×gain2, and
offset(x)=s×offset1+t×offset2
where s=(X2i−x)/(X2i−X1i), and
t=(x−X1i)/(X2i−X1i).
Y Direction Shading Correction Method
Scale0(Y)=WhPeak0/WH — TBL0i(Y).
Scale1(Y)=WhPeak1/WH — TBL1i(Y).
Scalek(Y)={Scale0(Y)+Scale1(Y)}/2
S′(X,Y)=gain(X)×S(X,Y)+Offset(X);
S″(X,Y)Scalek(Y)×S′(X,Y).
In this case, Scalek(Y) varies depending on the corresponding quadrilateral shape (k) containing a line pattern.
Acquiring Profile Graphs Corresponding to the Line Patterns
(output)=COEFA×{(input value)−P5@(4n+1)}+COEFB
COEFA=(P25@5n−P5@5n)/(P25@(4n+1)−P5@(4n+1))
COEFB=P5@5n.
(output value)=COEFS×{(input value)−PU0}+COEFT
COEFS=(PL1−PL0)/(PU1−PU0), and
COEFT=PL0
(output value)=COEFS×{(input value)−PU0)}+COEFT
COEFS=(PS1−PS0)/(PU1−PU0)
COEFT=PL0
PS0=PL0+(PU0−PL0)×3/4
PS1=PL1+(PU1−PL1)×3/4
Claims (11)
Applications Claiming Priority (2)
| Application Number | Priority Date | Filing Date | Title |
|---|---|---|---|
| JP2007-157689 | 2007-06-14 | ||
| JP2007157689 | 2007-06-14 |
Publications (2)
| Publication Number | Publication Date |
|---|---|
| US20080309703A1 US20080309703A1 (en) | 2008-12-18 |
| US7854488B2 true US7854488B2 (en) | 2010-12-21 |
Family
ID=40131866
Family Applications (1)
| Application Number | Title | Priority Date | Filing Date |
|---|---|---|---|
| US12/138,211 Expired - Fee Related US7854488B2 (en) | 2007-06-14 | 2008-06-12 | Dot measurement method and apparatus |
Country Status (2)
| Country | Link |
|---|---|
| US (1) | US7854488B2 (en) |
| JP (1) | JP5152981B2 (en) |
Cited By (2)
| Publication number | Priority date | Publication date | Assignee | Title |
|---|---|---|---|---|
| US20130003091A1 (en) * | 2011-06-30 | 2013-01-03 | Canon Kabushiki Kaisha | Image processing apparatus, image processing method, and program executing image processing method |
| US11623237B2 (en) * | 2017-03-07 | 2023-04-11 | Tokyo Electron Limited | Droplet ejecting apparatus having correctable movement mechanism for workpiece table and droplet ejecting method |
Families Citing this family (16)
| Publication number | Priority date | Publication date | Assignee | Title |
|---|---|---|---|---|
| JP5037469B2 (en) * | 2008-09-30 | 2012-09-26 | 富士フイルム株式会社 | Dot position measuring method, apparatus and program |
| CN102307676B (en) * | 2009-02-04 | 2014-10-29 | 世联株式会社 | Method for inspecting jetting state of inkjet head and apparatus for inspecting jetting state of inkjet head |
| JP5160485B2 (en) * | 2009-03-18 | 2013-03-13 | 富士フイルム株式会社 | Dot position measuring method, apparatus and program |
| JP5160488B2 (en) * | 2009-03-23 | 2013-03-13 | 富士フイルム株式会社 | Dot position measuring method, apparatus and program |
| WO2010137152A1 (en) * | 2009-05-28 | 2010-12-02 | 大日本スクリーン製造株式会社 | Image recording device and method for matching color at image recording device |
| JP5313102B2 (en) * | 2009-10-08 | 2013-10-09 | 富士フイルム株式会社 | Dot position measuring method and dot position measuring apparatus |
| JP5725597B2 (en) * | 2010-03-19 | 2015-05-27 | 富士フイルム株式会社 | Fine pattern position detection method and apparatus, defective nozzle detection method and apparatus, and liquid ejection method and apparatus |
| JP5811516B2 (en) * | 2010-04-07 | 2015-11-11 | セイコーエプソン株式会社 | Correction value acquisition method, correction value acquisition program, and printing apparatus. |
| JP5734584B2 (en) * | 2010-06-23 | 2015-06-17 | 株式会社ミマキエンジニアリング | How to determine dot size |
| JP2012170002A (en) * | 2011-02-16 | 2012-09-06 | Canon Inc | Image processing apparatus, image processing method, and image processing program therefor |
| JP5296825B2 (en) * | 2011-03-29 | 2013-09-25 | 富士フイルム株式会社 | Recording position error measuring apparatus and method, image forming apparatus and method, and program |
| JP5361085B2 (en) * | 2011-03-29 | 2013-12-04 | 富士フイルム株式会社 | Defect recording element detection apparatus and method, image forming apparatus and method, and program |
| JP6019691B2 (en) * | 2011-09-08 | 2016-11-02 | 株式会社リコー | Image forming apparatus, image correction program, and image correction method |
| JP6005103B2 (en) * | 2013-07-18 | 2016-10-12 | キヤノン株式会社 | Recording apparatus and recording method |
| DE102018202027B3 (en) * | 2018-02-09 | 2018-11-22 | Heidelberger Druckmaschinen Ag | Method for detecting defective printing nozzles in an inkjet printing machine |
| JP7169825B2 (en) * | 2018-09-21 | 2022-11-11 | 株式会社Screenホールディングス | Correction method and inkjet printing device |
Citations (4)
| Publication number | Priority date | Publication date | Assignee | Title |
|---|---|---|---|---|
| JPH10230593A (en) | 1996-12-19 | 1998-09-02 | Canon Inc | Method and apparatus for measuring ink jetting amount, printer, and measuring method for ink jet amount of the printer |
| US6270178B1 (en) | 1995-05-30 | 2001-08-07 | Canon Kabushiki Kaisha | Method and apparatus for measuring the amount of discharged ink, printing apparatus, and method of measuring the amount of ink discharged in the printing apparatus |
| JP2006284406A (en) | 2005-04-01 | 2006-10-19 | Seiko Epson Corp | Dot displacement detection method, dot displacement detection program, reference line acquisition method, dot displacement detection device, and droplet discharge device |
| US7645010B2 (en) * | 2006-09-28 | 2010-01-12 | Fujifilm Corporation | Ink ejection amount measurement method and ink ejection amount measurement system |
Family Cites Families (13)
| Publication number | Priority date | Publication date | Assignee | Title |
|---|---|---|---|---|
| DE69307590T2 (en) * | 1992-05-11 | 1997-05-15 | Hewlett Packard Co | Method and device for printing density control in an inkjet printer |
| JPH0674742A (en) * | 1992-08-31 | 1994-03-18 | Mitsubishi Electric Corp | Electron beam dimension measuring apparatus |
| JP3435578B2 (en) * | 1993-03-20 | 2003-08-11 | 日本アビオニクス株式会社 | Pattern inspection method |
| JP3332468B2 (en) * | 1993-04-13 | 2002-10-07 | コニカ株式会社 | Scanning line pitch measurement method |
| JPH11179939A (en) * | 1997-12-18 | 1999-07-06 | Canon Inc | Image-processing apparatus and method for controlling recording of the same |
| JP2003170645A (en) * | 2001-12-06 | 2003-06-17 | Olympus Optical Co Ltd | Recording sheet and image recorder |
| JP4270799B2 (en) * | 2002-03-22 | 2009-06-03 | オリンパス株式会社 | Image recording device |
| JP2005131960A (en) * | 2003-10-30 | 2005-05-26 | Canon Inc | Striking position detection method for liquid droplet, manufacturing method for inkjet recording apparatus, and inkjet recording apparatus |
| JP2005246650A (en) * | 2004-03-01 | 2005-09-15 | Sony Corp | Printer, image processor, printing control method, program, test pattern data, and recording medium |
| JP2006130383A (en) * | 2004-11-02 | 2006-05-25 | Seiko Epson Corp | Method and device for detection of dot shift |
| JP4691965B2 (en) * | 2004-11-17 | 2011-06-01 | セイコーエプソン株式会社 | Dot position detection apparatus and program for causing computer to execute dot position detection method |
| JP2006264194A (en) * | 2005-03-24 | 2006-10-05 | Canon Inc | Image forming device |
| JP4946515B2 (en) * | 2007-03-01 | 2012-06-06 | 富士ゼロックス株式会社 | Printing control apparatus, printing control program, printing system, and recording medium |
-
2008
- 2008-06-12 US US12/138,211 patent/US7854488B2/en not_active Expired - Fee Related
- 2008-06-16 JP JP2008157070A patent/JP5152981B2/en not_active Expired - Fee Related
Patent Citations (4)
| Publication number | Priority date | Publication date | Assignee | Title |
|---|---|---|---|---|
| US6270178B1 (en) | 1995-05-30 | 2001-08-07 | Canon Kabushiki Kaisha | Method and apparatus for measuring the amount of discharged ink, printing apparatus, and method of measuring the amount of ink discharged in the printing apparatus |
| JPH10230593A (en) | 1996-12-19 | 1998-09-02 | Canon Inc | Method and apparatus for measuring ink jetting amount, printer, and measuring method for ink jet amount of the printer |
| JP2006284406A (en) | 2005-04-01 | 2006-10-19 | Seiko Epson Corp | Dot displacement detection method, dot displacement detection program, reference line acquisition method, dot displacement detection device, and droplet discharge device |
| US7645010B2 (en) * | 2006-09-28 | 2010-01-12 | Fujifilm Corporation | Ink ejection amount measurement method and ink ejection amount measurement system |
Cited By (3)
| Publication number | Priority date | Publication date | Assignee | Title |
|---|---|---|---|---|
| US20130003091A1 (en) * | 2011-06-30 | 2013-01-03 | Canon Kabushiki Kaisha | Image processing apparatus, image processing method, and program executing image processing method |
| US9100624B2 (en) * | 2011-06-30 | 2015-08-04 | Canon Kabushiki Kaisha | Information processing apparatus, method and medium for generating color correction data with reference to measured color values from a number of sensors |
| US11623237B2 (en) * | 2017-03-07 | 2023-04-11 | Tokyo Electron Limited | Droplet ejecting apparatus having correctable movement mechanism for workpiece table and droplet ejecting method |
Also Published As
| Publication number | Publication date |
|---|---|
| JP2009018580A (en) | 2009-01-29 |
| US20080309703A1 (en) | 2008-12-18 |
| JP5152981B2 (en) | 2013-02-27 |
Similar Documents
| Publication | Publication Date | Title |
|---|---|---|
| US7854488B2 (en) | Dot measurement method and apparatus | |
| US8462381B2 (en) | Dot position measurement method, dot position measurement apparatus, and computer readable medium | |
| US8472069B2 (en) | Dot position measurement method and apparatus, and computer readable medium | |
| JP4883702B2 (en) | Dot measuring method and apparatus, program, and image forming apparatus | |
| US8167412B2 (en) | Dot position measurement method, dot position measurement apparatus, and computer readable medium | |
| US7616340B2 (en) | Image processing method and apparatus, threshold value matrix creating method, image forming apparatus, sub-matrix creating method and program | |
| US7530660B2 (en) | Droplet deposition position error measurement method, droplet deposition position error adjustment method, droplet ejection control method, and image forming apparatus | |
| EP2042324B1 (en) | Test chart, test chart measurement method, and test chart measurement apparatus | |
| EP1798037B1 (en) | Image recording apparatus and image recording method | |
| US7907307B2 (en) | Image processing method and apparatus, and image forming method and apparatus | |
| US7484824B2 (en) | Image recording apparatus and method, and method of specifying density correction coefficients | |
| US20110227988A1 (en) | Fine pattern position detection method and apparatus, defective nozzle detection method and apparatus, and liquid ejection method and apparatus | |
| US8157345B2 (en) | Image recording apparatus, image processing apparatus, image processing method and computer-readable medium | |
| US8256870B2 (en) | Image recording apparatus, image processing apparatus and image processing method and computer-readable medium | |
| US7275801B2 (en) | Image forming apparatus | |
| US7422306B2 (en) | Image processing method, image processing apparatus, and image recording apparatus | |
| US8911055B2 (en) | Dot position measurement method and dot position measurement apparatus | |
| US8164791B2 (en) | Image recording apparatus and method | |
| US8057007B2 (en) | Image recording apparatus and method, and method of determining density correction coefficients | |
| US8388088B2 (en) | Dot position measurement method and apparatus, and computer readable medium | |
| US20090244578A1 (en) | Image recording apparatus and method | |
| US20070002382A1 (en) | Image processing method and apparatus, image forming apparatus, and method and program of creating dot pattern adjacency table | |
| JP5078179B2 (en) | Method for adjusting droplet ejection position error, droplet ejection control method, and image forming apparatus |
Legal Events
| Date | Code | Title | Description |
|---|---|---|---|
| AS | Assignment |
Owner name: FUJIFILM CORPORATION, JAPAN Free format text: ASSIGNMENT OF ASSIGNORS INTEREST;ASSIGNOR:YAMAZAKI, YOSHIROU;REEL/FRAME:021116/0281 Effective date: 20080520 |
|
| FEPP | Fee payment procedure |
Free format text: PAYOR NUMBER ASSIGNED (ORIGINAL EVENT CODE: ASPN); ENTITY STATUS OF PATENT OWNER: LARGE ENTITY |
|
| FPAY | Fee payment |
Year of fee payment: 4 |
|
| FEPP | Fee payment procedure |
Free format text: MAINTENANCE FEE REMINDER MAILED (ORIGINAL EVENT CODE: REM.) |
|
| LAPS | Lapse for failure to pay maintenance fees |
Free format text: PATENT EXPIRED FOR FAILURE TO PAY MAINTENANCE FEES (ORIGINAL EVENT CODE: EXP.); ENTITY STATUS OF PATENT OWNER: LARGE ENTITY |
|
| STCH | Information on status: patent discontinuation |
Free format text: PATENT EXPIRED DUE TO NONPAYMENT OF MAINTENANCE FEES UNDER 37 CFR 1.362 |
|
| FP | Lapsed due to failure to pay maintenance fee |
Effective date: 20181221 |